Evaluation of Fiber-Reinforced Asphalt Mixtures Using ... Biligiri, Zeiada, Rodezno, and Reed 1...
38
Kaloush, Biligiri, Zeiada, Rodezno, and Reed 1 Evaluation of Fiber-Reinforced Asphalt Mixtures Using Advanced Material Characterization Tests Kamil Elias Kaloush 1 , Krishna Prapoorna Biligiri 2 , Waleed Abdelaziz Zeiada 3 , Maria Carolina Rodezno 3 , Jordan Xavier Reed 3 ABSTRACT: The objective of this study was to evaluate the material properties of a conventional (control) and fiber reinforced asphalt mixtures using advanced material characterization tests. The laboratory experimental program included: triaxial shear strength, dynamic (complex) modulus, repeated load permanent deformation, fatigue, crack propagation, and indirect tensile strength tests. The data was used to compare the performance of the fiber modified mixture to the control. The results showed that the fibers improved the mixture’s performance in several unique ways against the anticipated major pavement distresses: permanent deformation, fatigue cracking, and thermal cracking. KEYWORDS: Asphalt mixture, Polypropylene Fibers, Aramid Fibers, Dynamic Modulus, Permanent Deformation, Flow Number, Fatigue Cracking, Thermal Cracking, Crack Propagation. ______________________________________________________________________________ 1 Associate Professor, Arizona State University, Department of Civil, Environmental and Sustainable Engineering, PO Box 875306, Tempe, AZ 85287-5306, Telephone: (480)-965-5509 E-mail: [email protected] 2 Post-Doctoral Researcher, Arizona State University, Department of Civil, Environmental and Sustainable Engineering, PO Box 875306, Tempe, AZ 85287-5306, Telephone: (480)-965-2262 E-mail: [email protected] 3 Graduate Research Associate, Arizona State University, Department of Civil, Environmental and Sustainable Engineering, PO Box 875306, Tempe, AZ 85287-5306, E-mail: [email protected] ; [email protected] ; [email protected] Paper # 200903AT102
-
Upload
phungkhanh -
Category
Documents
-
view
218 -
download
1
Transcript of Evaluation of Fiber-Reinforced Asphalt Mixtures Using ... Biligiri, Zeiada, Rodezno, and Reed 1...

Kaloush, Biligiri, Zeiada, Rodezno, and Reed 1
Evaluation of Fiber-Reinforced Asphalt Mixtures Using Advanced Material
Characterization Tests
Kamil Elias Kaloush1, Krishna Prapoorna Biligiri2,
Waleed Abdelaziz Zeiada3, Maria Carolina Rodezno3, Jordan Xavier Reed3
ABSTRACT: The objective of this study was to evaluate the material properties of a
conventional (control) and fiber reinforced asphalt mixtures using advanced material
characterization tests. The laboratory experimental program included: triaxial shear strength,
dynamic (complex) modulus, repeated load permanent deformation, fatigue, crack propagation,
and indirect tensile strength tests. The data was used to compare the performance of the fiber
modified mixture to the control. The results showed that the fibers improved the mixture’s
performance in several unique ways against the anticipated major pavement distresses:
permanent deformation, fatigue cracking, and thermal cracking.
KEYWORDS: Asphalt mixture, Polypropylene Fibers, Aramid Fibers, Dynamic Modulus, Permanent Deformation, Flow Number, Fatigue Cracking, Thermal Cracking, Crack Propagation. ______________________________________________________________________________ 1Associate Professor, Arizona State University, Department of Civil, Environmental and Sustainable Engineering, PO Box 875306, Tempe, AZ 85287-5306, Telephone: (480)-965-5509 E-mail: [email protected] 2Post-Doctoral Researcher, Arizona State University, Department of Civil, Environmental and Sustainable Engineering, PO Box 875306, Tempe, AZ 85287-5306, Telephone: (480)-965-2262 E-mail: [email protected] 3Graduate Research Associate, Arizona State University, Department of Civil, Environmental and Sustainable Engineering, PO Box 875306, Tempe, AZ 85287-5306, E-mail: [email protected]; [email protected]; [email protected]
Paper # 200903AT102

Kaloush, Biligiri, Zeiada, Rodezno, and Reed 2
Introduction
Fibers have been used to improve the performance of asphalt mixtures against permanent
deformation and fatigue cracking [1, 2]. Recent development in materials characterization
laboratory tests in the pavement community was the motivation for this study to re-evaluate the
performance of synthetic fibers in asphalt mixtures. The fibers consisted of a blend of
polypropylene and aramid fibers. Of particular interest were laboratory tests that were included
as part of the National Cooperative Highway Research Program (NCHRP) 9-19 Project and the
Mechanistic-Empirical Pavement Design Guide [3, 4].
Few research studies reporting on experiments using synthetic fibers in asphalt concrete
have been found in the literature. Bueno et al studied the addition of randomly distributed
synthetic fibers on the mechanical response of a cold-mixed, densely graded asphalt mixture
using the Marshall test, as well as static and cyclic triaxial tests [1]. The results showed that the
addition of fibers caused small variations in the mixture’s triaxial shear strength parameters. Lee
et al evaluated the influence of recycled carpet fibers on the fatigue cracking resistance of asphalt
concrete using fracture energy [2]. It was found that the increase in fracture energy represents a
potential for improving the asphalt mixture’s fatigue life.
A research study by Fitzgerald reported that the addition of carbon fibers to an asphalt
mixture may have beneficial properties ranging from improved mechanical properties to reduced
electrical resistance using the electric resistivity testing methodology [5]. However, the study did
not involve extensive laboratory mechanical testing on the carbon-fiber-modified mixtures.
Cleven subjected carbon fiber-reinforced asphalt mixtures to mechanical testing, which included
diametral resilient modulus, repeated load permanent deformation, flexural beam fatigue tests
and indirect tensile strength tests [6]. The modified asphalt mixtures were observed to be stiffer,

Kaloush, Biligiri, Zeiada, Rodezno, and Reed 3
more resistant to permanent deformation, and had higher tensile strength at low temperatures.
However, the carbon fiber modified samples showed no improvement in fatigue behavior as
measured by the four-point beam test or cold temperature creep compliance test. Jahromi and
Khodai also investigated the characteristics and properties of the carbon fiber-reinforced asphalt
mixtures through laboratory tests such as Marshall stability, indirect tension, creep, and repeated
load indirect tensile test to characterize the fatigue resistance [7]. They reported that the addition
of carbon fibers showed an increase in the mix’s stability, decrease in flow value, and an increase
in voids in the mix. They also found that the addition of fibers improved the fatigue life and
permanent deformation of the mixtures.
Mahrez and Karim utilized glass fibers in a Stone Mastic Asphalt (SMA) mixture. They
found that the use of glass fiber in asphalt mixtures showed variable Marshall stability results,
and that the addition of glass fibers actually decreased the mixtures’ stability and stiffness [8]. In
a different study by Mahrez and Karim in 2007, they used the wheel-tracking test to characterize
the creep and rutting resistance of glass fiber reinforced asphalt mixtures [9]. They reported that
the inclusion of glass fibers resulted in higher resilient modulus, higher resistance to permanent
strain and rutting. Putman and Amirkhanian studied the feasibility of utilizing waste tire and
carpet fibers in SMA mixtures [10]. The study compared the performance of SMA mixtures
containing waste tire and carpet fibers with mixes made with commonly used cellulose and other
polyester fibers. No significant difference in permanent deformation or moisture susceptibility
was found in mixtures containing waste fibers compared to cellulose or polyester. However, they
reported that the tire, carpet, and polyester fibers significantly improved the toughness of the
mixtures compared to the cellulose fibers.

Kaloush, Biligiri, Zeiada, Rodezno, and Reed 4
Chowdhury et al evaluated two types of recycled tire fibers to determine whether they
can be used in different types of asphalt mixtures as a replacement of the currently used cellulose
or mineral fibers [11]. The researchers tested three different types of mixtures: SMA, Permeable
Friction Course (PFC), and Coarse Mix High Binder (CMHB) mixtures with two different types
of recycled tire fibers, one cellulose fiber, and a control mix with no fibers. The laboratory tests
used to evaluate the mixtures were: drain-down, dynamic modulus, indirect tensile strength, and
Hamburg wheel tracking tests. Mixtures containing tire fibers, in most cases, outperformed the
mixtures containing cellulose fiber and mixtures with no fiber. The drain-down test results
clearly revealed that the recycled tire fiber can be used in SMA and PFC mixtures as a
replacement for cellulose fibers to prevent asphalt drain-down during construction.
Wu et al examined the dynamic characteristics of three fiber-modified asphalt mixtures:
cellulose, polyester and mineral fibers at dosages of 0.3%, 0.3%, 0.4% respectively [12]. The
experimental results showed that fiber-modified asphalt mixtures had higher dynamic modulus
compared with the control mixture.
Study Background
In this study, a small pavement rehabilitation project was identified and coordinated with
the City of Tempe, Arizona. The rehabilitation involved constructing experimental sections of a
control asphalt mixture overlay as well as a mixture reinforced with synthetic fibers. A
conventional dense graded asphalt concrete mixture was selected for paving on Evergreen Drive
located east of the Loop 101 and north of University Drive in Tempe, Arizona. The designated
road section had two asphalt mixtures: a control mix with no fibers, and a mixture that contained
one pound of fibers per one ton of mix. The fibers were a propriety blend of polypropylene and

Kaloush, Biligiri, Zeiada, Rodezno, and Reed 5
aramid provided by the manufacturer in Pennsylvania. The addition of fibers was done at a batch
asphalt plant in Phoenix. Fig. 1 shows the road section condition before it was overlaid.
Basically, no repair work was done and the 2-inch overlay was placed on a much deteriorated
section of Evergreen Drive. Only the edge of the pavement was milled off to match the final
overlay grade with the curb. Test sections with and without fibers were staggered on the road to
allow for direct field performance comparisons considering traffic flow and loading types (e.g.,
buses). About 1500 lbs of each mixture were brought back to the Arizona State University
(ASU) laboratories. Sample preparation included compaction of 150 mm diameter gyratory
specimens for triaxial testing. In addition, beam specimens were prepared and compacted
according to AASHTO TP8 test protocols [13-15]. The performance of both mixtures was
assessed using the advanced material characterization tests that included: triaxial shear strength,
dynamic modulus, repeated load for permanent deformation characterization, flexural beam tests
for fatigue, C* line integral for fracture energy and crack propagation, and indirect diametral
tensile test for thermal cracking evaluation.
Study Objective
The objective of this study was to evaluate the material properties of the conventional (control)
and polypropylene /aramid fibers reinforced asphalt mixtures using the most current laboratory
tests adopted in the pavement community [4]. The goal was to assess how the material properties
for the fiber reinforced mixture differs in stiffness, permanent deformation, and cracking
characteristics.

Kaloush, Biligiri, Zeiada, Rodezno, and Reed 6
Materials
Fibers Characteristics
As mentioned earlier, the fibers used in this study were a blend of synthetic fibers designed for
use in Hot Mix Asphalt (HMA) applications. Fig. 2 (a) shows typical fibers contained in one-lb
bag (approximately 445.0 g), a blend of the aramid and the polypropylene. Table 1 shows the
physical properties of both fibers. The fibers are designed to reinforce the HMA in three-
dimensions.
Mixture characteristics
A City of Phoenix designated asphalt mixture specification (PHX C-3/4) with nominal maximum
aggregate size of ¾-in was used. The asphalt binder used in the mix was a PG 70-10. The
theoretical maximum specific gravity of the control and fiber-reinforced mixtures were 2.428
and 2.458, respectively. The design asphalt cement content was 5.0% for the control mixture,
and it was kept the same for the fiber reinforced asphalt mixture. The reference air voids for both
the control and fiber-reinforced asphalt mixtures was 7.0%. Figure 2 (b) shows a close up of a
loose asphalt mixture that was spread on the table for preparation of the Rice gravity test. Fibers
were seen by the naked eye with good distribution throughout the mix. The mixes were re-heated
and re-compacted into 150 x 170 mm Gyratory specimens. Cylindrical samples were cored from
each gyratory plug, and the ends were sawed to get final specimens of 100 mm in diameter and
150 mm in height for triaxial testing. In addition, beam specimens were prepared for fatigue
cracking evaluation. For thermal cracking evaluation, disc specimens were prepared according to
the “Test Method for Indirect Tensile Creep Testing of Asphalt Mixtures for Thermal Cracking”

Kaloush, Biligiri, Zeiada, Rodezno, and Reed 7
reported in NCHRP Report 465 [4]. Similar disc specimens were prepared for the C* crack
propagation tests.
Laboratory Tests, Results and Analyses
Triaxial Shear Strength Tests
The triaxial shear strength test has been recognized as the standard test for determining the
strength of materials for over 50 years. The results from these tests provide a fundamental basis
which can be used in analyzing the stability of asphalt mixtures. This is because the stresses
acting on the laboratory specimen during the test simulate the state of stresses existing in the
pavement, given certain specimen boundary and geometry conditions are met.
Three triaxial strength stress states, one unconfined and two confined, were conducted for
the control and fiber-reinforced asphalt concrete mixtures. Tests were carried out on cylindrical
specimens, 4 inches (100 mm) in diameter and 6 inches (150 mm) in height. The tests were
conducted at 130 °F (54.4 °C). The confining pressures used were 20 psi (138 kPa) and 40 psi
(276 kPa). Two replicates were used at each confinement level. The specimens were loaded
axially to failure at a strain rate of 1.27 mm/mm/min.
Fig. 3 (a) shows a plot of the Mohr-Coulomb failure envelope represented by the
cohesion “c” and angle of internal friction “φ” for the tested mixtures. Classically, the parameters
“c” and “φ” are the strength indicators of the mixtures. The larger the “c” value, the larger the
mix resistance to shearing stresses. In addition, the larger the “φ”value, the larger the capacity of
the asphalt mixture to develop strength from the applied loads, and hence, the smaller the
potential for permanent deformation. The “c” value of the fiber-reinforced mix was higher
(34.3 psi) than that of the control mixture (27.4 psi). The effect of fibers on the “φ” value was

Kaloush, Biligiri, Zeiada, Rodezno, and Reed 8
less, 48° for the fiber-reinforced mix versus 47° for the control mixture. Since the “φ” value is an
aggregate property, therefore no significant variation was expected since both mixtures had the
same aggregate gradations.
Fig. 3 (b) presents a comparison example of the tests conducted for both mixtures at the
20 psi (138 kPa) confinement level. The plots represent before and after peak stress development
during the test. For the fiber-reinforced mixture, it is observed that the peak stress developed and
the time of its occurrence are higher when compared to those of the control mixture, a behavior
that was attributed to the influence of the fibers in the mix. The fibers provide this additional
reinforcement to the asphalt mix in resisting permanent deformation and retard the occurrence of
shear failure. In addition, cumulative areas under the curve for the tested mixtures were
calculated; the value of these areas can be interpreted as indicators of the mixes’ residual energy
in resisting crack propagation post peak stress. In all tests, the fiber reinforced mixture showed
higher residual energy than the control mixture.
Repeated load permanent deformation test
The repeated load or Flow Number (FN) test is a dynamic creep test used to determine the
permanent deformation characteristics of paving materials. It has been thoroughly documented in
the NCHRP Report 465 study [4]. In this test, a repeated dynamic load is applied for several
thousand repetitions, and the cumulative permanent deformation, including the beginning of the
tertiary stage (FN) as a function of the number of loading cycles over the test period is recorded.
Tests were carried out on cylindrical specimens, 4 inches (100 mm) in diameter and 6 inches
(150 mm) in height. A haversine pulse load of 0.1 sec and 0.9 sec dwell (rest time) is applied.

Kaloush, Biligiri, Zeiada, Rodezno, and Reed 9
Table 2 presents a master summary of the FN test results conducted at 130 °F. The FN
values of fiber-reinforced mixtures were found to be 15 times higher than the control mixture.
The average permanent axial strain values were 0.78% and 0.51% for the control and fiber-
reinforced mixtures, respectively. Two characteristics were observed for the fiber-reinforced
mixture in these tests: an extended endurance period in the secondary stage, and the gradual
(less) accumulation of permanent strain beyond tertiary flow. Fig. 4 presents the values of strain
slope for both mixtures during the tertiary stage. It can be observed that the control mix has
higher strain slopes compared to the fiber-reinforced mixture. Lower values of strain slope
during the tertiary stage means more energy is stored in the sample, and that the mix has higher
potential to resist shear failure and further development of permanent deformation.
E* Dynamic Modulus Test
The stress-to-strain relationship for an asphalt mixture under a continuous sinusoidal loading is
defined by its complex dynamic modulus (E*). In the Mechanistic Empirical Pavement Design
Guide (MEPDG), the E* Dynamic Modulus of an asphalt mixture is determined per AASHTO
TP 62-03. For each mix, three specimens, 4 inches (100 mm) in diameter and 6 inches (150 mm)
in height, were tested at 14, 40, 70, 100, and 130 °F (-10, 4.4, 21, 37.8 and 54.4 °C) and 25, 10,
5, 1, 0.5, and 0.1 Hz loading frequencies. The E* tests were done using a controlled sinusoidal
stress that produced strains smaller than 150 micro-strain. A master curve was constructed at a
reference temperature of 70 ºF (21 °C).
Fig. 5 (a) shows the average E* master curves for both the control and fiber-reinforced
asphalt concrete mixtures. The figure can be used for general comparison of the mixtures, but
specific comparison of temperature-frequency combination values need to be evaluated

Kaloush, Biligiri, Zeiada, Rodezno, and Reed 10
separately. That is, one can not compare direct values on the vertical axis for a specific log
reduced time values. As shown in the figure, the fiber-reinforced mixture had higher moduli
values than the control mixture at all test temperatures and frequencies. The difference is less at
the lowest temperature due to dominant effect of the binder. At higher temperatures, the binder
becomes softer and the aggregates dominate the elastic behavior of the asphalt mixtures, and the
reinforcement effect of the fibers can enhance the modulus values at higher temperatures. In
addition, the aramid fibers have a unique negative thermal coefficient value, in that they contract
at higher temperatures and therefore play a positive role in resisting deformation. Fig. 5 (b)
shows direct comparisons for selected values of test temperatures, 40, 100, and 130 °F (4.4, 37.8
and 54.4 °C) and loading frequency of 10 Hz. It is observed that the modulus values for the
fiber-reinforced mixture are higher than the control mixture. Especially at high temperature
conditions, the potential field performance to resist rutting would be better for the fiber-
reinforced mix compared to the control mixture.
Fatigue Cracking Test
Load-associated fatigue cracking is one of the major distress types occurring in flexible
pavement systems. The action of repeated loading, caused by traffic induced tensile and shear
stresses in the bound layers, will eventually lead to a loss in the structural integrity of a stabilized
layer material. Fatigue will induce cracks at points where critical tensile strains and stresses
occur. The most common model form used to predict the number of load repetitions to fatigue
cracking is a function of the tensile strain and mix stiffness (modulus) as follows [13]:
32 kk
t1f E
11KN
ε
= 32 kkt1 )E()(K −−ε=

Kaloush, Biligiri, Zeiada, Rodezno, and Reed 11
Where:
Nf = number of repetitions to fatigue cracking
εt = tensile strain at the critical location
E = stiffness of the material
K1, K2, K3 = laboratory calibration parameters
In this study, beam specimens were prepared for the four point bending fatigue tests. The
beams were compacted in the laboratory to the required density (7% air voids). They were saw
cut to the required dimensions of 2.5 inches (63.5 mm) wide, 2.0 inches (50.8 mm) high, and 15
inches (381 mm) long. A full testing factorial was used for each mixture: constant strain, 6 to 8
levels, and one replicate for each test temperature. Three temperature levels, 40, 70, 100 ºF, (4.4,
21, and 38.8 ºC) were used. Initial flexural stiffness was measured at the 50th load cycle. Fatigue
life or failure under control strain was defined as the number of cycles corresponding to a 50%
reduction in the initial stiffness as required by AASHTO TP8 and SHRP M-009 [14, 15].
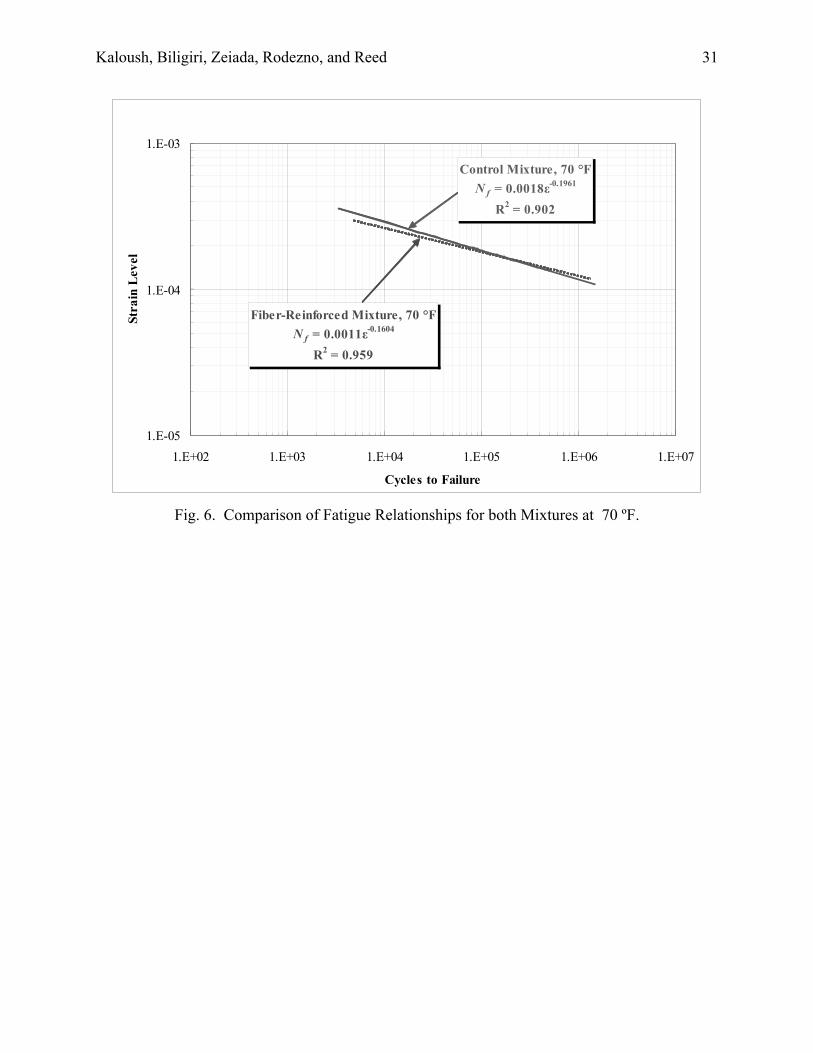
Fatigue relationships for both mixtures were developed. The regression equations for
each temperature ( ) were also computed along with the coefficient of determination
(R
2.1K
f KN ε=
2) for each relationship. Fig. 6 shows a comparison of fatigue relationships for the control and
fiber-reinforced asphalt concrete mixtures at 70 ºF. It is observed that the fatigue life is higher for
the control mixture at high strain values while the fiber-reinforced mixture has higher fatigue life
at lower strain values.
Table 3 summarizes the K1, K2, and K3 Coefficients of the generalized fatigue model for
both mixtures (at 50% reduction of the initial stiffness). The initial stiffness was measured at N =

Kaloush, Biligiri, Zeiada, Rodezno, and Reed 12
50 cycles. These generalized fatigue relationships show excellent measures of accuracy for both
mixtures.
An example comparing the fatigue life for both mixtures was calculated using the
regression coefficients K1, K2, and K3 at 40, 70, and 100 ºF and for two different strain levels.
The results are shown in Fig. 7 (a, b). At 150 micro-strains level (Figure 7 (a)), the fiber-
reinforced mixture shows approximately 1.5 to 2.5 times higher fatigue life compared to the
control mixture at different test temperatures; while at 200 micro-strains level (Figure 7 (b)), the
control mixture shows approximately 1.5 to 2.5 times higher fatigue life compared to the fiber-
reinforced mixture. The shift in predicted fatigue life suggests that the fiber-reinforced mix will
perform better in roads where traffic speeds are higher. In addition, this type of constant strain
fatigue testing may be a disadvantage for a stiffer material like the fiber-reinforced mixture.
Thermal Cracking Test
Standard test method for determining the creep compliance and strength of HMA using the
indirect tensile test device per AASHTO TP9-02 was utilized to evaluate the low temperature
thermal cracking performance of the control and the fiber-reinforced asphalt concrete mixtures
[16, 17]. Fig. 8 shows the tensile strength test results for both mixtures. The fiber-reinforced
asphalt mixture has 1.5 times higher strength than the control mixture. Higher thermal cracking
would be expected for mixtures with lower tensile strength values [4]. In essence, the fibers in
the mix are believed to play a vital role in resisting thermal cracking in the HMA mixture.
The consideration of the total fracture energy is another useful comparison from this test.
The results are shown in Fig. 9. The fracture energy increased with increasing temperature for
both mixtures. At all test temperatures, the fiber-reinforced asphalt mixture had consistently
Kaloush, Biligiri, Zeiada, Rodezno, and Reed 13
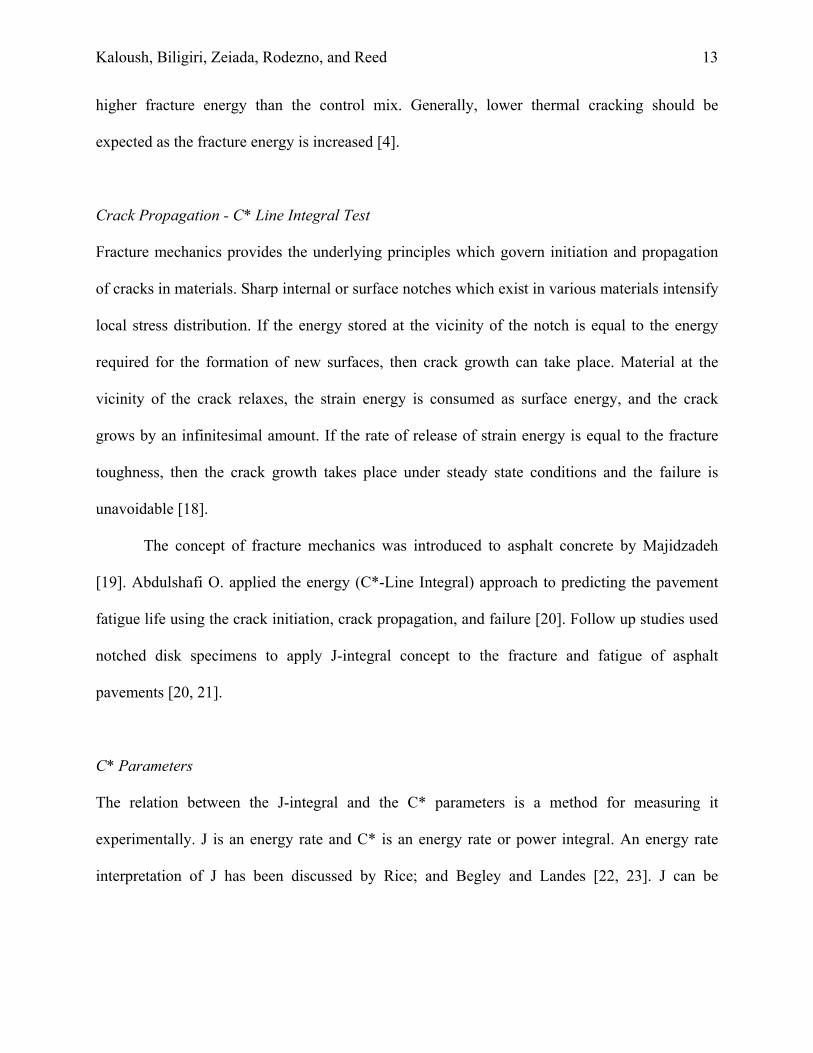
higher fracture energy than the control mix. Generally, lower thermal cracking should be
expected as the fracture energy is increased [4].
Crack Propagation - C* Line Integral Test
Fracture mechanics provides the underlying principles which govern initiation and propagation
of cracks in materials. Sharp internal or surface notches which exist in various materials intensify
local stress distribution. If the energy stored at the vicinity of the notch is equal to the energy
required for the formation of new surfaces, then crack growth can take place. Material at the
vicinity of the crack relaxes, the strain energy is consumed as surface energy, and the crack
grows by an infinitesimal amount. If the rate of release of strain energy is equal to the fracture
toughness, then the crack growth takes place under steady state conditions and the failure is
unavoidable [18].
The concept of fracture mechanics was introduced to asphalt concrete by Majidzadeh
[19]. Abdulshafi O. applied the energy (C*-Line Integral) approach to predicting the pavement
fatigue life using the crack initiation, crack propagation, and failure [20]. Follow up studies used
notched disk specimens to apply J-integral concept to the fracture and fatigue of asphalt
pavements [20, 21].
C* Parameters
The relation between the J-integral and the C* parameters is a method for measuring it
experimentally. J is an energy rate and C* is an energy rate or power integral. An energy rate
interpretation of J has been discussed by Rice; and Begley and Landes [22, 23]. J can be

Kaloush, Biligiri, Zeiada, Rodezno, and Reed 14
interpreted as the energy difference between the two identically loaded bodies having
incrementally differing crack lengths.
dadU - =J
Where,
U = Potential Energy
a = Crack Length
C* can be calculated in a similar manner using a power rate interpretation. Using this
approach C* is the power difference between two identically loaded buddies having
incrementally differing crack lengths.
a*U - *
∂∂
=C
Where U* is the power or energy rate defined for a load p and displacement u by:
U pdu * u0∫=
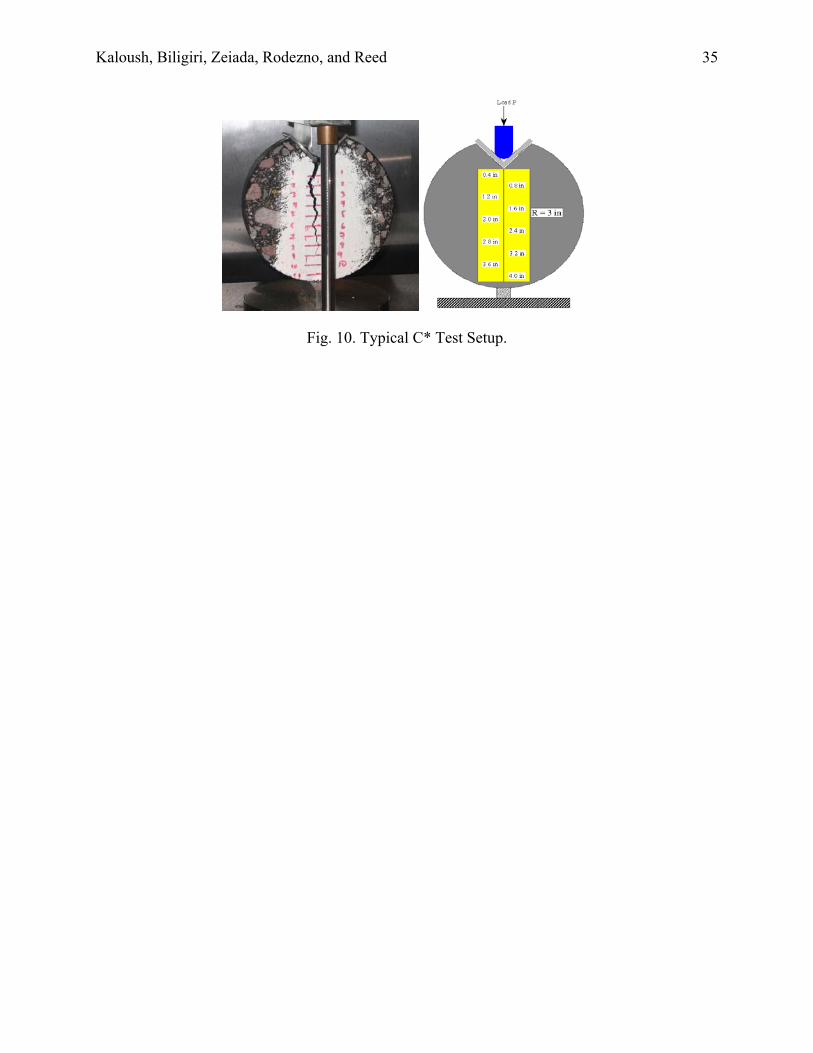
Method for C* Determination
Disc samples were prepared from gyratory plugs similar to the IDT specimen preparation
process. For each disc, a right-angle wedge was cut into the specimen to accommodate the
loading device as shown in Fig. 10. Tests were conducted at 70 oF (21 °C).
The load applied at a constant displacement rate and the crack length over time was
measured for each test specimen. The displacement rates used were 0.005, 0.01, 0.015, 0.02, and
0.025 in/min for both the control and fiber-reinforced mixtures. The data was used to determine
the load as a function of displacement rate for various crack lengths. The power of energy rate
input, U*, was measured as the area under the load displacement rate curve. The energy rate, U*,
was then plotted versus crack length for different displacement rates and the slopes of these
Kaloush, Biligiri, Zeiada, Rodezno, and Reed 15
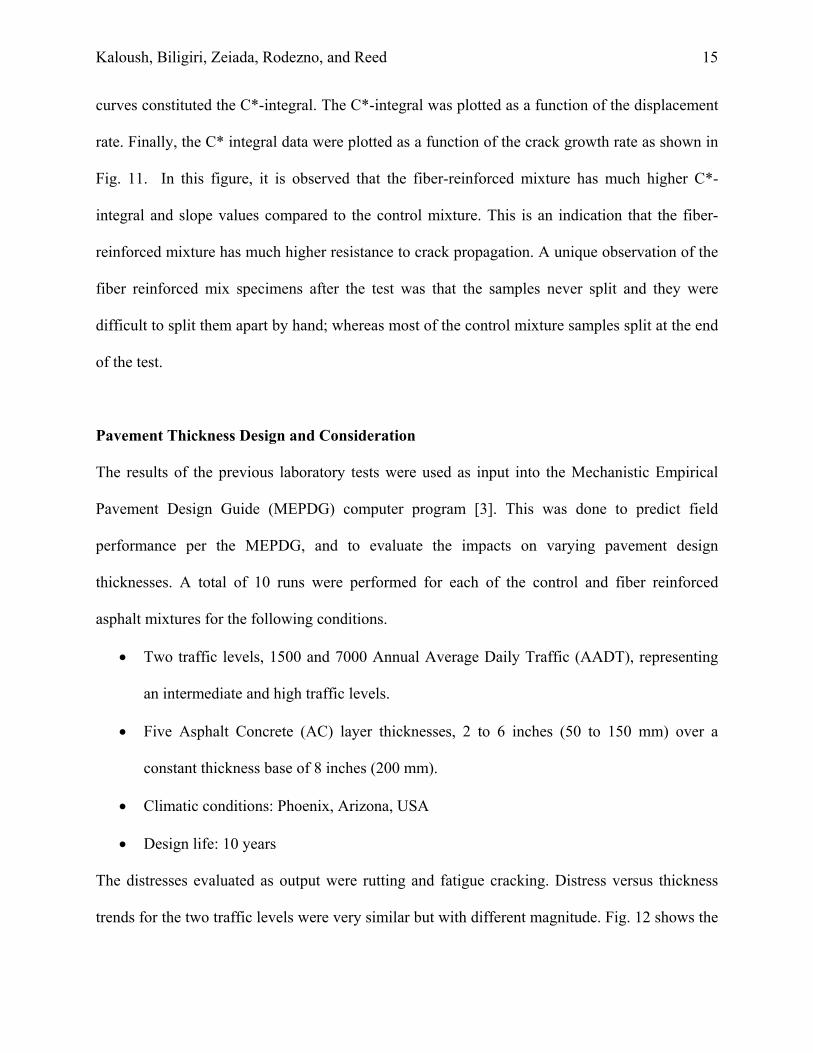
curves constituted the C*-integral. The C*-integral was plotted as a function of the displacement
rate. Finally, the C* integral data were plotted as a function of the crack growth rate as shown in
Fig. 11. In this figure, it is observed that the fiber-reinforced mixture has much higher C*-
integral and slope values compared to the control mixture. This is an indication that the fiber-
reinforced mixture has much higher resistance to crack propagation. A unique observation of the
fiber reinforced mix specimens after the test was that the samples never split and they were
difficult to split them apart by hand; whereas most of the control mixture samples split at the end
of the test.
Pavement Thickness Design and Consideration
The results of the previous laboratory tests were used as input into the Mechanistic Empirical
Pavement Design Guide (MEPDG) computer program [3]. This was done to predict field
performance per the MEPDG, and to evaluate the impacts on varying pavement design
thicknesses. A total of 10 runs were performed for each of the control and fiber reinforced
asphalt mixtures for the following conditions.
• Two traffic levels, 1500 and 7000 Annual Average Daily Traffic (AADT), representing
an intermediate and high traffic levels.
• Five Asphalt Concrete (AC) layer thicknesses, 2 to 6 inches (50 to 150 mm) over a
constant thickness base of 8 inches (200 mm).
• Climatic conditions: Phoenix, Arizona, USA
• Design life: 10 years
The distresses evaluated as output were rutting and fatigue cracking. Distress versus thickness
trends for the two traffic levels were very similar but with different magnitude. Fig. 12 shows the

Kaloush, Biligiri, Zeiada, Rodezno, and Reed 16
relationship between total rutting and thickness for both mixtures at the 7000 AADT (~ 50
million ESALs). It can be observed that for a rutting criterion not to exceed 0.4 inches during the
design period of 10 years, the control mixture AC pavement thickness needed is 5.5 inches;
whereas the fiber reinforced mixture AC layer thickness needed would be 3.5 inches; a saving of
2 inches in the total AC layer thickness. This saving was 1.5 inches for the lower traffic level of
1500 AADT. Figure 13 shows the fatigue cracking predicted by the MEPDG. The results show
similar trends, in that lower fatigue cracking is predicted for the fiber-reinforced mixture.
However, the results are also dependent on the AC layer thickness. As the AC layer thickness
increases beyond the 2-inch, the fatigue cracking increases to a maximum value between 3 and 4
inches. The fatigue cracking is reduced beyond the 4-inch thickness because of the reduced
tensile strains anticipated at the bottom of the AC layer. The plot agrees with observations in the
MEPDG manual, where for very thin AC layer pavement system, fatigue cracking may not be of
a concern due to the compressive nature of strains throughout the AC layer [3].
Conclusions
The laboratory test results in this study showed that the use of polypropylene and aramid fibers
blend in the asphalt mixture improves the mixture’s performance in several unique ways as
summerized below:
• The fiber reinforced asphalt mixture showed better resistance to shear deformation as
shown by the triaxial shear strength test results. Notably, post peak failure for the fiber
reinforced asphalt mixture showed higher residual energy and gradual drop in strength,
an effect that was attributed to the influence of the fibers in the mix.

Kaloush, Biligiri, Zeiada, Rodezno, and Reed 17
• Permanent deformation tests for the fiber reinforced mixture showed lower permanent
strain accumulation compared to the control mix. The flow number results, or the
beginning of tertiary stage, were 15 times higher than the control mixture. Two
characteristics were observed for the fiber-reinforced mixture in these tests: an extended
endurance period in the secondary stage of the permanent deformation curve, and the
gradual (less) accumulation of permanent strain beyond tertiary flow. Both of these
characteristics were attributed to the presence and mobilization of the fibers distributed in
the mix.
• The measured Dynamic Modulus E* values were higher for the fiber reinforced mix. The
difference between the two mixtures was less at the lowest temperature (20% increase),
due to dominant effect of the binder and less contribution of the role of fibers. The largest
difference was observed at 100°F (80% higher), where the reinforcement effect of the
fibers is observed to be the highest. At 130°F, the increase in modulus was also
substantial at about 50%.
• The fatigue cracking test was different in that, unlike the other tests, the strain level was
held constant. The fatigue life was higher for the control mixture at high strain values
while the fiber-reinforced mixture had higher fatigue life at lower strain values. The shift
in predicted fatigue life suggests that the fiber-reinforced mix will perform better in roads
where traffic speeds are higher. This result was confirmed by running the Mechanistic
Empirical Pavement Design Guide (MEPDG) computer program.
• The tensile strength and fracture energy measured from the IDT test showed that at all
test temperatures, the fiber-reinforced mix exhibited the highest values; an increase of 25
Kaloush, Biligiri, Zeiada, Rodezno, and Reed 18
to 50% for the tensile strength, and 50 to 75% for the fracture energy. Lower thermal
cracking would be expected as the tensile strength and fracture energy are increased.
• The relationships between crack growth rates and C* line integral values showed that the
fiber-reinforced mix had about 40 times higher resistance to crack propagation than the
control mix.
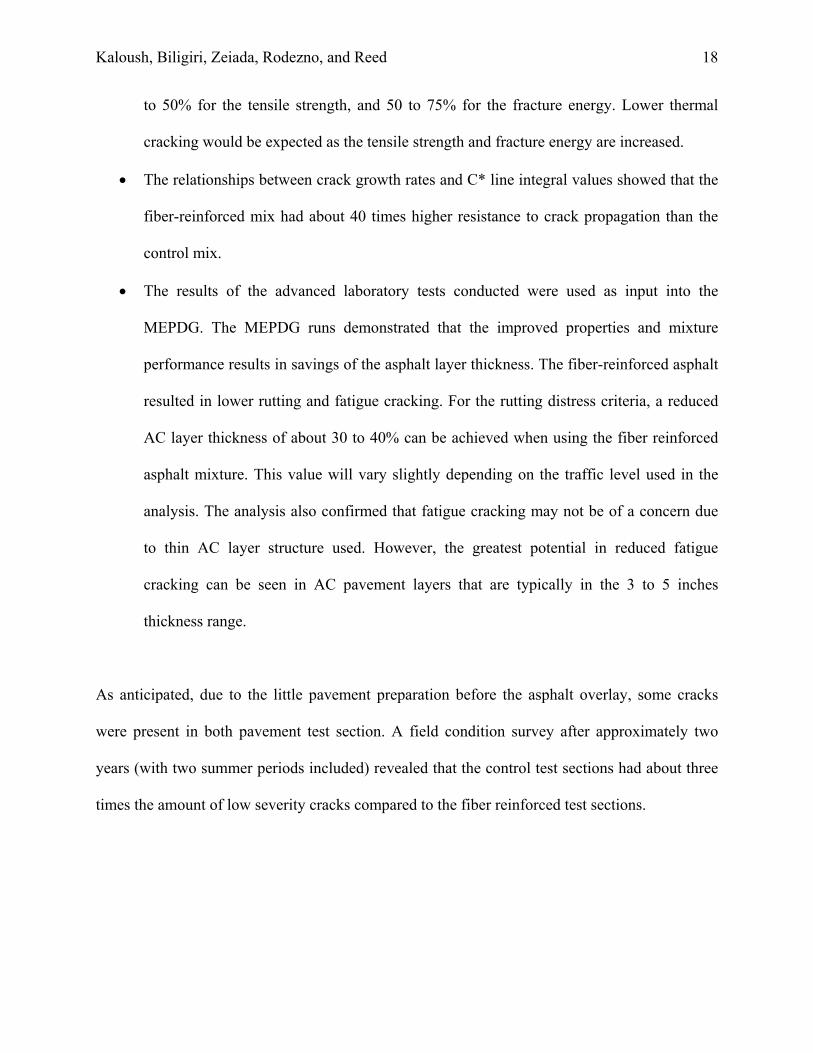
• The results of the advanced laboratory tests conducted were used as input into the
MEPDG. The MEPDG runs demonstrated that the improved properties and mixture
performance results in savings of the asphalt layer thickness. The fiber-reinforced asphalt
resulted in lower rutting and fatigue cracking. For the rutting distress criteria, a reduced
AC layer thickness of about 30 to 40% can be achieved when using the fiber reinforced
asphalt mixture. This value will vary slightly depending on the traffic level used in the
analysis. The analysis also confirmed that fatigue cracking may not be of a concern due
to thin AC layer structure used. However, the greatest potential in reduced fatigue
cracking can be seen in AC pavement layers that are typically in the 3 to 5 inches
thickness range.
As anticipated, due to the little pavement preparation before the asphalt overlay, some cracks
were present in both pavement test section. A field condition survey after approximately two
years (with two summer periods included) revealed that the control test sections had about three
times the amount of low severity cracks compared to the fiber reinforced test sections.

Kaloush, Biligiri, Zeiada, Rodezno, and Reed 19
Acknowledgements
The authors would like to acknowledge FORTA Corporation and Teijin Aramid BV for their
financial support and providing the fibers. Acknowledgements are also due to CEMEX (formally
Rinker West, Central Region) for their assistance in the production and construction of the test
section. City of Tempe engineering department and personnel for their invaluable assistance in
providing the field test section at Evergreen Drive and for their help in coordinating the
construction activities. Special thanks are also due to Mr. Kenny Witczak, Supervisor of the
Advanced Pavement Laboratory at ASU for the production and preparation of the laboratory test
specimens.

Kaloush, Biligiri, Zeiada, Rodezno, and Reed 20
References
1. Bueno, B. S., Silva, W. R., Lima, D. C., Minete, E. (2003). Engineering Properties of
Fiber Reinforced Cold Asphalt Mixes. Technical Note, Journal of Environmental
Engineering, ASCE, Vol. 129, N. 10.
2. Lee, S. J., Rust, J. P., Hamouda, H., Kim, Y. R., Borden, R. H. (2005). Fatigue Cracking
Resistance of Fiber-Reinforced Asphalt Concrete. Textile Research Journal, Vol. 75, N.
2, pp. 123-128.
3. Guide for Mechanistic-Empirical Design of New and Rehabilitated Pavement Structures.
Final Report. NCHRP, National Research Council, Washington, D. C., March 2004.
4. Witczak, M. W., Kaloush, K. E., Pellinen, T., El-Basyouny, M., & Von Quintus, H.
(2002). Simple Performance Test for Superpave Mix Design. NCHRP Report 465.
Transportation Research Board. National Research Council. Washington D.C.
5. Fitzgerald, R. L. (2000) Novel Applications of Carbon Fiber for Hot Mix Asphalt
Reinforcement and Carbon-Carbon Pre-forms, M. S. Thesis, Department of Chemical
Engineering, Michigan Technological University, 2000.
6. Cleven, M. A. (2000) Investigation of the Properties of Carbon Fiber Modified Asphalt
Mixtures M. S. Thesis, Department of Chemical Engineering, Michigan Technological
University, 2000.
7. Jahromi, S. G., and Khodai, A. (2008) Carbon Fiber Reinforced Asphalt Concrete, The
Arabian Journal for Science and Engineering, Volume 33, Number 2B, October 2008, pp.
355-364.

Kaloush, Biligiri, Zeiada, Rodezno, and Reed 21
8. Mahrez, A., Karim, M. R., and Katman, H. A. (2003) Prospect of Using Glass Fiber
Reinforced Bituminous Mixes, Journal of the Eastern Asia Society for Transportation
Studies, Vol.5, October, 2003
9. Mahrez, A., and Karim, M. R., (2007) Rutting Characteristics of Bituminous Mixes
Reinforced with Glass Fiber, Proceedings of the Eastern Asia Society for Transportation
Studies, Vol.6, 2007.
10. Putman, B. J., and Amirkhanian, S. N. (2004) Utilization of Waste Fibers in Stone Matrix
Asphalt Mixtures, Journal of Resources, Conservation and Recycling, Recycled Materials
in Highway Infrastructure, Volume 42, Issue 3, October 2004, pp. 265-274.
11. Chowdhury, A., Button, J. W., and Bhasin, A. (2006) Fibers from Recycled Tire as
Reinforcement in Hot Mix Asphalt, Texas Transportation Institute, Texas A&M
University System, Report No. SWUTC/06/167453-1, April 2006.
12. W. Shaopeng., Y. Qunshan., L. Ning., and Y. Hongbo. (2007) Effects of Fibers on the
Dynamic Properties of Asphalt Mixtures, Journal of Wuhan University of Technology-
Materials Science Edition, China, December 2007.
13. AASHTO Designation: T321-03. Determining the Fatigue Life of Compacted Hot-Mix
Asphalt (HMA) Subjected to Repeated Flexural Bending.
14. SHRP Designation: M-009. Standard Method of Test for Determining the Fatigue Life of
Compacted Bituminous Mixtures Subjected to Repeated Flexural Bending.
15. SHRP-A-404. Fatigue Response of Asphalt-Aggregate Mixes. Asphalt Research
Program, Institute Of Transportation Studies, University Of California, Berkeley.
Strategic Highway Research Program, National Research Council, Washington, D.C.,
1994.

Kaloush, Biligiri, Zeiada, Rodezno, and Reed 22
16. Witczak, M.W., “Harmonized Test Methods for Laboratory Determination of Resilient
Modulus for Flexible Pavement Design, Volume II - Asphalt Concrete Material”, Final
Project Report, NCHRP Project No. 1-28A, May 2003.
17. Roque et al, “Standard Test Method for Determining the Creep Compliance and Strength
of Hot Mix Asphalt (HMA) Using the Indirect Tensile Test Device”, Draft Test Protocol,
AASHTO TP9-02, 2002.
18. Mamlouk, M. S. and Mobasher, B. (2004). “Cracking Resistance of Asphalt Rubber Mix
versus Hot-Mix Asphalt”, International Journal of Road Materials and Pavement Design.
V.5., 4, pp. 435-452.
19. Majidzadeh, K. (1976). “Application of Fracture Mechanics for Improved Design of
Bituminous Concrete,” Volumes 1 and 2, Report FHWA-RD-76-91, Federal Highway
Administration, Washington, D.C.
20. Abdulshafi, O., (1983). “Rational Material Characterization of Asphaltic Concrete
Pavements,” Ph.D. Dissertation, the Ohio State University, Columbus, OH, 1983.
21. Abdulshafi, A. and K.E. Kaloush. "Modifiers for Asphalt Concrete." ESL-TR-88-29, Air
Force Engineering and Services Center, Tyndall Air Force Base, Florida, 1988.
22. Rice. J. R., (1968). Journal of Applied Mechanics, American Society of Mechanical
Engineers, Volume 35, pp. 379-386.
23. Begley, J. W. and Landes, J. D., (1972). Fracture Toughness, Processing of the 1971
National Symposium on Fracture Mechanics. Part II, ASTM STP 514, American Society
for Testing Materials pp. 1-20.

Kaloush, Biligiri, Zeiada, Rodezno, and Reed 23
Table 1. Physical Characteristics of the Fibers.
Materials Polypropylene Aramid
Form Twisted Fibrillated Fiber Multifilament Fiber
Specific Gravity 0.91 1.45
Tensile Strength (MPa) 483 3000
Length (mm) 19.05 19.05
Color
Acid/Alkali Resistance inert good
Decomposition Temperature (°C) 157 >450

Kaloush, Biligiri, Zeiada, Rodezno, and Reed 24
Table 2. Master Summary of the Repeated Load Permanent Deformation Test Results
Mix Type σd (psi) Flow Number (Cycles) Axial Permanent Strain εp [%] at Failure
15 436 0.84 15 241 0.56 15 166 0.95
Average 281 0.78 Standard Deviation 139 0.20
Control
% Coefficient of Variation 49.6 25.8
15 3336 0.47 15 3466 0.60 15 5916 0.46
Average 4,239 0.51 Standard Deviation 1,453 0.08
Fiber-Reinforced
% Coefficient of Variation 34 15.3

Kaloush, Biligiri, Zeiada, Rodezno, and Reed 25
Table 3. Summary of the Regression Coefficients for the Generalized Fatigue Equation
50% of Initial Stiffness, Eo @ N=50 Cycles Mixture Type
K1 K2 K3 R2
Control 2.3496 2.3601 1.3853 0.914
Fiber-Reinforced 6.48E-22 7.8357 1.0839 0.988 * Nf = K1 * (1/εt) K2
* (1/Eo) K3

Kaloush, Biligiri, Zeiada, Rodezno, and Reed 26
Fig. 1. (a) Pavement Condition Before the Overlay; (b) Surface Preparation by Milling off the
Edge of the Pavement.

Kaloush, Biligiri, Zeiada, Rodezno, and Reed 27
Fig. 2. (a) Close up of Reinforced Fibers: Polypropylene and Aramid (b) A Close-Up of the
Fiber-Reinforced Asphalt Mixture.

Kaloush, Biligiri, Zeiada, Rodezno, and Reed 28
Control Mixturey = 1.0726x + 27.392
R2 = 0.9974C= 27.39 psiФ= 47.01˚
Fiber-Reinforced Mixturey = 1.112x + 34.298
R2 = 0.9998C= 34.30 psiФ= 48.04˚
0
20
40
60
80
100
120
140
160
180
0 10 20 30 40 50 60 70 80 90 1
σN, Normal Stress (psi)
τ, S
hear
Str
ess (
psi)
00
0
50
100
150
200
250
300
350
0 200 400 600 800 1000 1200
Time (sec)
Str
ess (
psi)
Fiber-Reinforced Mixture at σ3 = 20 psi
Control Mixture at σ3 = 20 psi
Fig. 3. Comparison of (a) Mohr-Coulomb Envelopes (b) Stress-Time Plots at 20 psi Confinement
Level.

Kaloush, Biligiri, Zeiada, Rodezno, and Reed 29
0.0000
0.0020
0.0040
0.0060
0.0080
0.0100
0.0120
0 2000 4000 6000 8000 10000 12000 14000
Number of Cycles during the Tertiary Stage
Axi
al S
trai
n Sl
ope
Control
Fiber-Reinforced
Fig. 4. Axial Strain Slope during the Tertiary Stage for Control and Fiber-Reinforced Mixtures.

Kaloush, Biligiri, Zeiada, Rodezno, and Reed 30
1.E+04
1.E+05
1.E+06
1.E+07
-6 -5 -4 -3 -2 -1 0 1 2 3 4 5Log Reduced Time, s
E*
psi
Fiber-Reinforced Mixture
Control Mixture
294,000
4,027,000
818,000
5,132,000
1,500,000
466,000
0.0E+00
1.0E+06
2.0E+06
3.0E+06
4.0E+06
5.0E+06
6.0E+06
40 ºF 100 ºF 130 ºF
E*,
psi
Control MixtureFiber-Reinforced Mixture
Fig. 5. (a) Unconfined Dynamic Modulus Master Curves; (b) Comparison of Measured
Dynamic Modulus Values at 10 Hz.
Kaloush, Biligiri, Zeiada, Rodezno, and Reed 31
Control Mixture, 70 °FN f = 0.0018ε-0.1961
R2 = 0.902
Fiber-Reinforced Mixture, 70 °FN f = 0.0011ε-0.1604
R2 = 0.959
1.E-05
1.E-04
1.E-03
1.E+02 1.E+03 1.E+04 1.E+05 1.E+06 1.E+07
Cycles to Failure
Stra
in L
evel
Fig. 6. Comparison of Fatigue Relationships for both Mixtures at 70 ºF.

Kaloush, Biligiri, Zeiada, Rodezno, and Reed 32
168,727
1,828,015
1,185,485
66,244142,736
316,663
0
500000
1000000
1500000
2000000
2500000
40 ºF 70 ºF 100 ºF
Nf U
ntil
Failu
re
Control Fiber-Reinforced
103,703
33,595
208,967
37,179
131,467
20,967
0
50000
100000
150000
200000
250000
300000
40 ºF 70 ºF 100 ºF
Nf U
ntil
Failu
re
Control Fiber-Reinforced
Fig. 7. Number of Cycles to Failure Predicted for Both Mixtures All Test Temperature, (a) 150
micro-strains and (b) 200 micro-strains.

Kaloush, Biligiri, Zeiada, Rodezno, and Reed 33
410408
371
610 571
468
300
350
400
450
500
550
600
650
700
0 10 20 30 40 50 6
Tens
ile St
reng
th (p
si)
Temperature (oF)0
Control Mixture
Fiber-Reinforced Mixture
Fig. 8. Comparison of the Tensile Strength Results.

Kaloush, Biligiri, Zeiada, Rodezno, and Reed 34
113.0 163.2
279.3
198.0
284.5
430.4
0
100
200
300
400
500
600
0 10 20 30 40 50 6
Tota
l Fra
ctur
e Ene
rgy
(lbs-p
si)
Temperature (oF)0
Control Mixture
Fiber-Reinforced Mixture
Fig. 9. Comparison of the Total Fracture Energy Results.
Kaloush, Biligiri, Zeiada, Rodezno, and Reed 35
Fig. 10. Typical C* Test Setup.

Kaloush, Biligiri, Zeiada, Rodezno, and Reed 36
Controly = 0.0455x + 0.122
R2 = 0.8131
Fiber Reinforcedy = 1.9304x + 0.4076
R2 = 0.9497
0.0
0.2
0.4
0.6
0.8
1.0
1.2
1.4
0.0 0.5 1.0 1.5 2.0 2.5
Crack Growth Rate, a* (in/min)
C*,
(lb*
in/in
2 *min
)
Fig. 11. C* Line Integral versus Crack Growth Rate.

Kaloush, Biligiri, Zeiada, Rodezno, and Reed 37
0
0.1
0.2
0.3
0.4
0.5
0.6
0.7
0.8
0 1 2 3 4 5 6 7
Tota
l Rut
ting
(in
)
Thickness (in)
Control Mix Fiber Reinforced Mix
Fig. 12. Pavement Rutting Evaluation using the Mechanistic-Empirical Pavement Design Guide.

Kaloush, Biligiri, Zeiada, Rodezno, and Reed 38
0
1
2
3
4
5
6
7
0 1 2 3 4 5 6 7
Fatig
ue (%
)
Thickness (in)Control Mix Fiber Reinforced Mix
Fig. 13. Pavement Fatigue Cracking Evaluation using the Mechanistic-Empirical Pavement
Design Guide.