Evaluation of emissions -...
18
0 WG2 Agenda: Overview Best Practice Evaluation of emissions Best Practice Benchmarking • Mapping (survey) • Opportunities • Challenges • Training • Benchmarking Conclusions • Feedback on the Tool • Benefits • Requirements • Outcomes ∆ Emission tool Composite Emission Map
Transcript of Evaluation of emissions -...

0
WG2 Agenda: Overview
Best Practice
Evaluation of emissions
Best Practice
Benchmarking
• Mapping (survey)
• Opportunities
• Challenges
• Training
• Benchmarking Conclusions
• Feedback on the Tool
• Benefits
• Requirements
• Outcomes
∆ Emission tool Composite Emission Map
1
Good practice guidelines on urban traffic emission compilation
Marc Guevara1, Susana López Aparicio2, Matthias Vogt2,
Leonor Tarrasón2
1 Barcelona Supercomputing Center - Centro Nacional de Supercomputación, Earth SciencesDepartment, Barcelona, Spain.
2 NILU - Norwegian Institute for Air Research, Urban Environment and Industry, Kjeller, Norway.
FAIRMODE Technical Meeting
27-29 June 2016, Zagreb, Croatia

2
Urban traffic emissions
Road traffic is the emission source that
contributes most to air pollution in urban areas
Daily PM10 LV
Annual NO2 LV
3
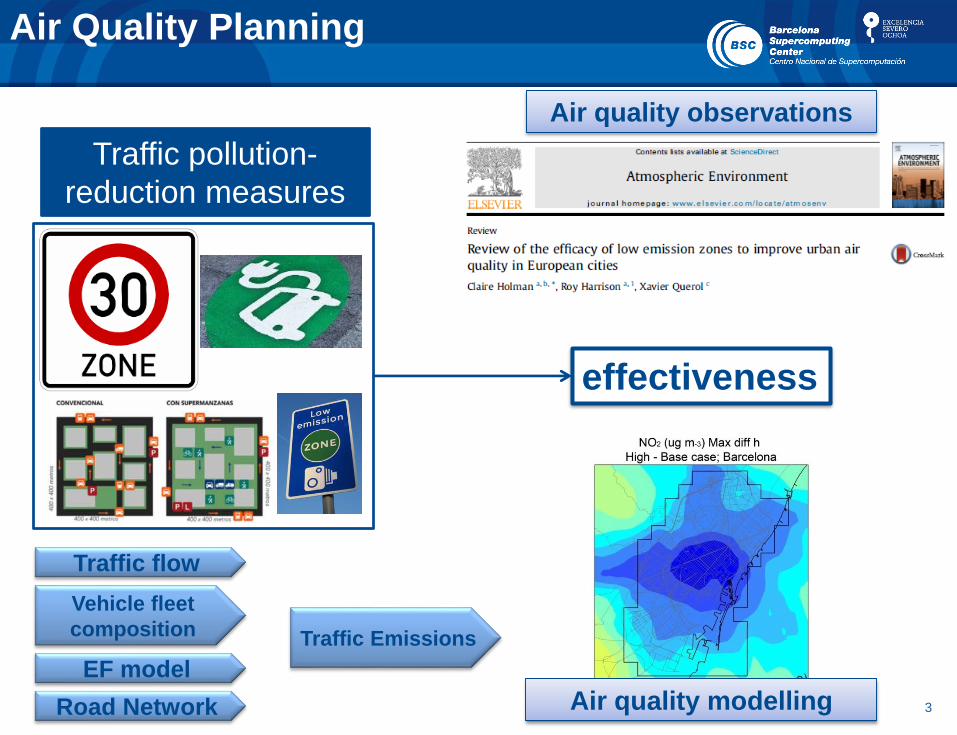
Air Quality Planning
effectiveness
Air quality observations
Air quality modelling
Traffic flow
Vehicle fleet
composition
EF model
Traffic Emissions
Traffic pollution-
reduction measures
Road Network
4
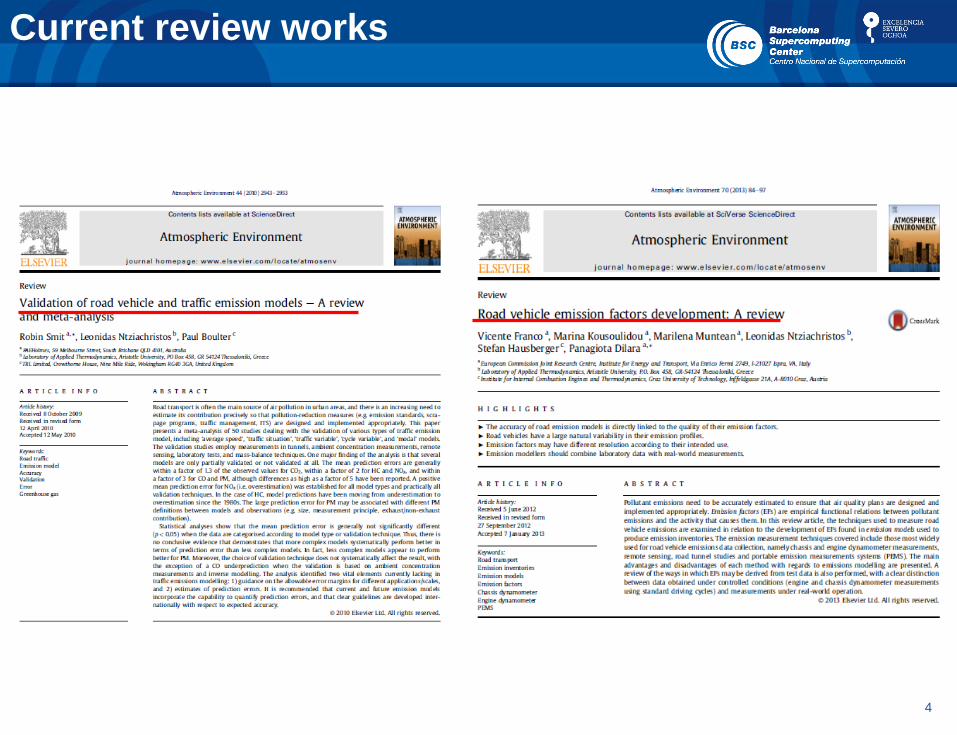
Current review works

5
Mapping the best practices for
urban traffic emissions
Brower (2014)
Adapted from Ejik (2012) and Bedogni (2014)
Floating Car DataAutomatic Number Plate
Recognition systems
Extended Floating Car
Data
Traffic models and
wireless traffic sensors
https://envirocar.org/
6
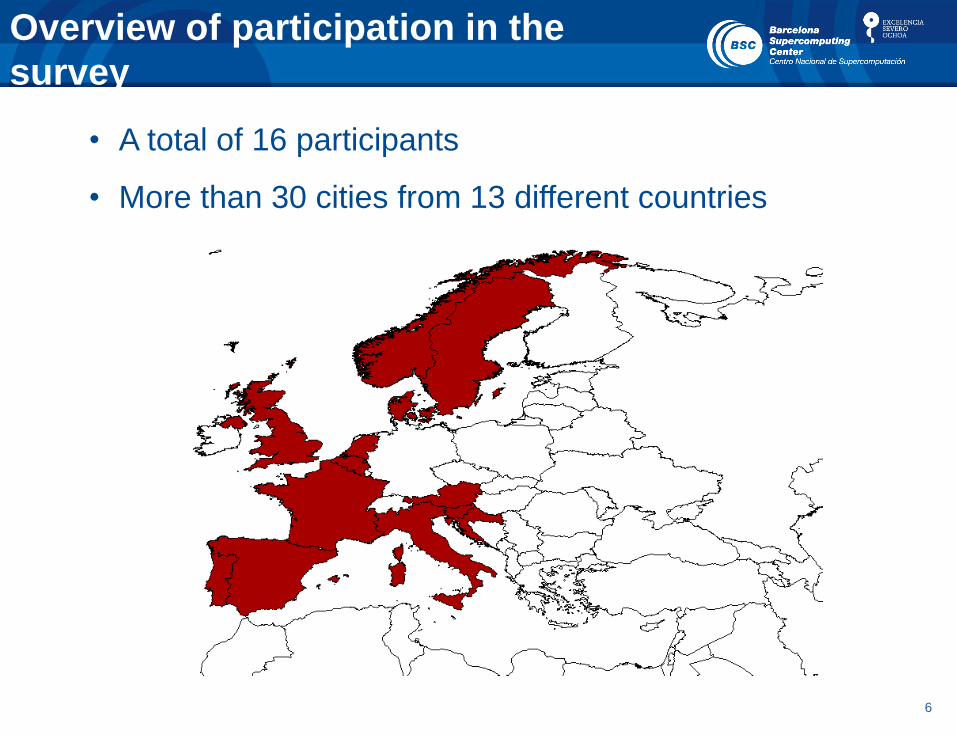
Overview of participation in the
survey
• A total of 16 participants
• More than 30 cities from 13 different countries
7
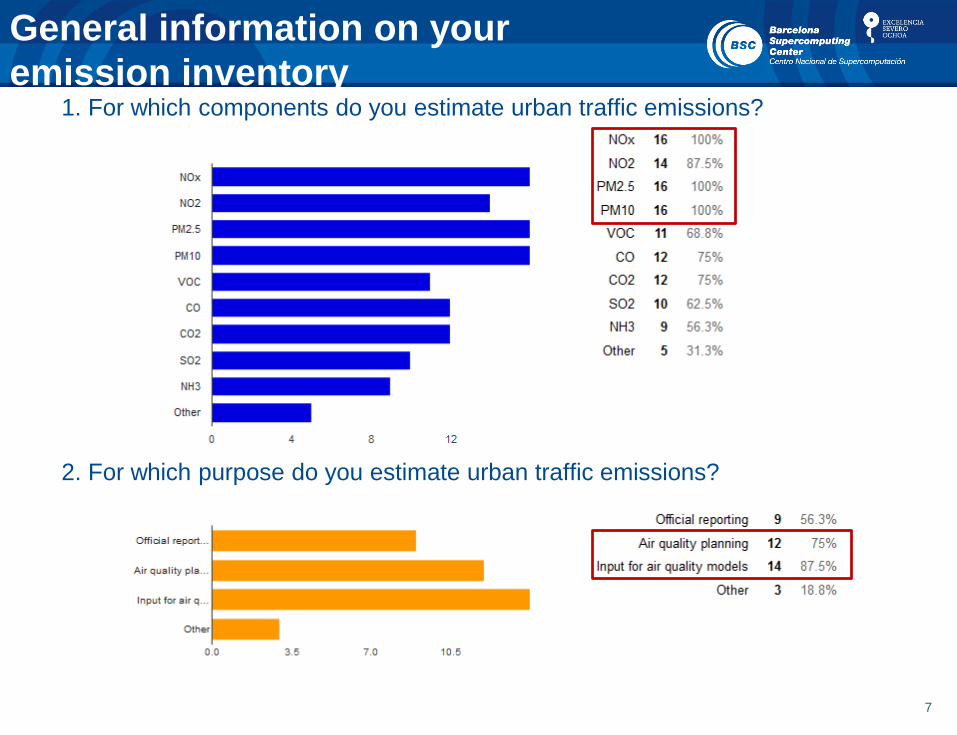
General information on your
emission inventory1. For which components do you estimate urban traffic emissions?
2. For which purpose do you estimate urban traffic emissions?
8
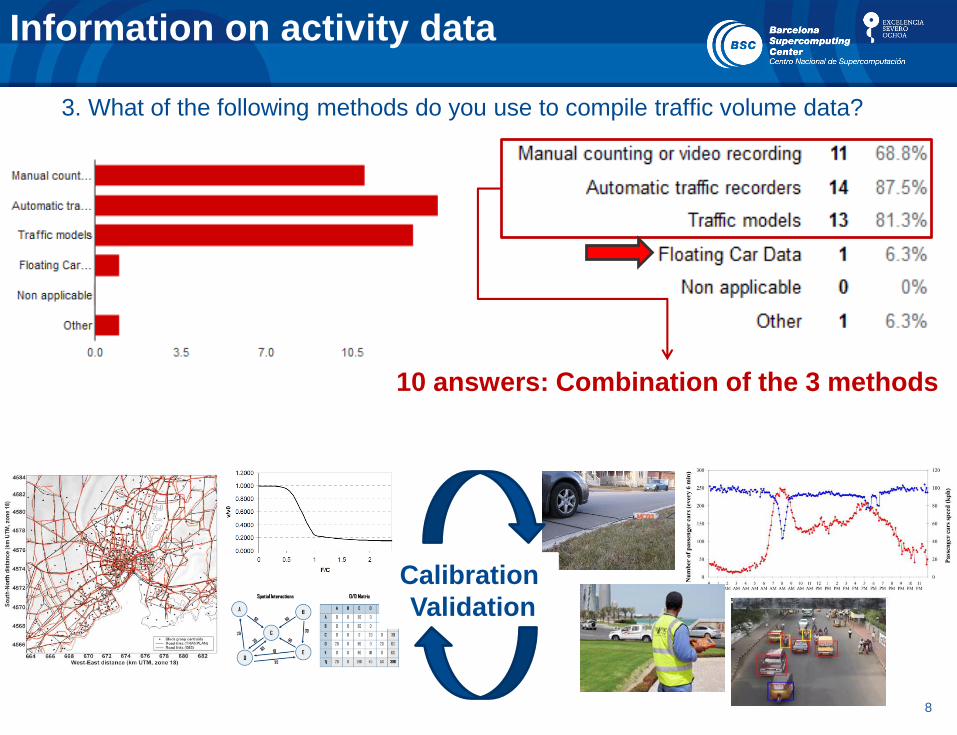
Information on activity data
3. What of the following methods do you use to compile traffic volume data?
10 answers: Combination of the 3 methods
Calibration
Validation

9
Information on activity data
4. What of the following methods do you use to compile speed data?
7 answers: Combination of the 3 methods
Calibration
Validation
10
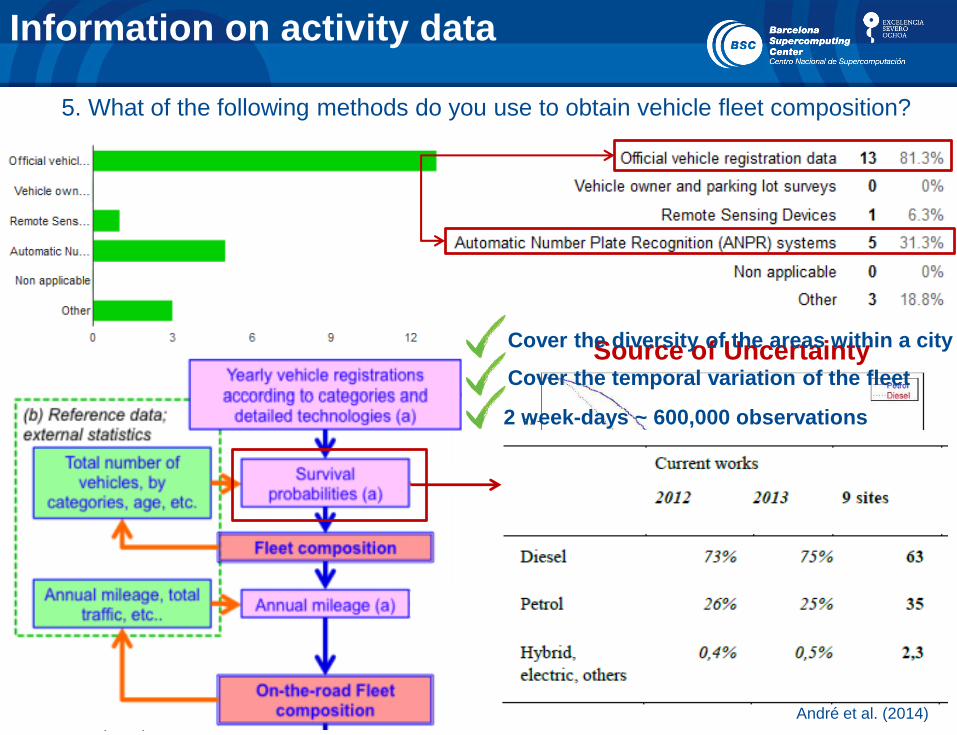
Information on activity data
5. What of the following methods do you use to obtain vehicle fleet composition?
Kolli et al. (2011)
André et al. (2014)
Source of Uncertainty
André et al. (2014)
Cover the diversity of the areas within a city
Cover the temporal variation of the fleet
2 week-days ~ 600,000 observations

11
Emission factor models
6. What of the following emission factor models do you use?
In-house EF datasets (based
on real-driving tests)
Even though the approaches behind COPERT
and HBEFA are somewhat different, they are
largerly underpinned by the same
experimental data (Franco et al., 2012)
12
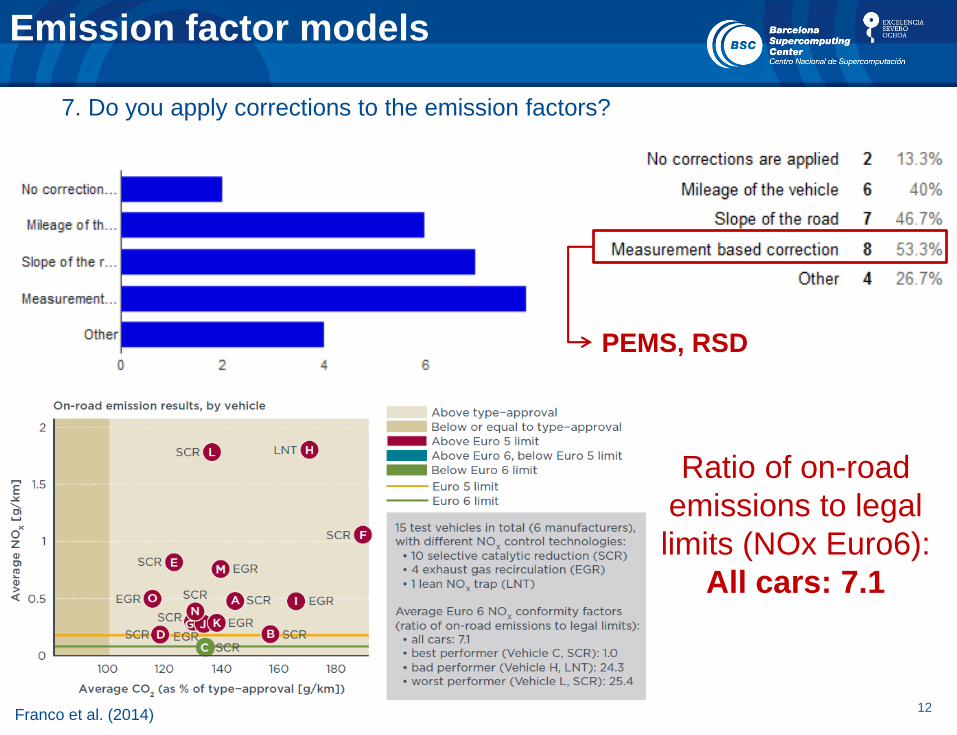
Emission factor models
7. Do you apply corrections to the emission factors?
Franco et al. (2014)
Ratio of on-road
emissions to legal
limits (NOx Euro6):
All cars: 7.1
PEMS, RSD
13
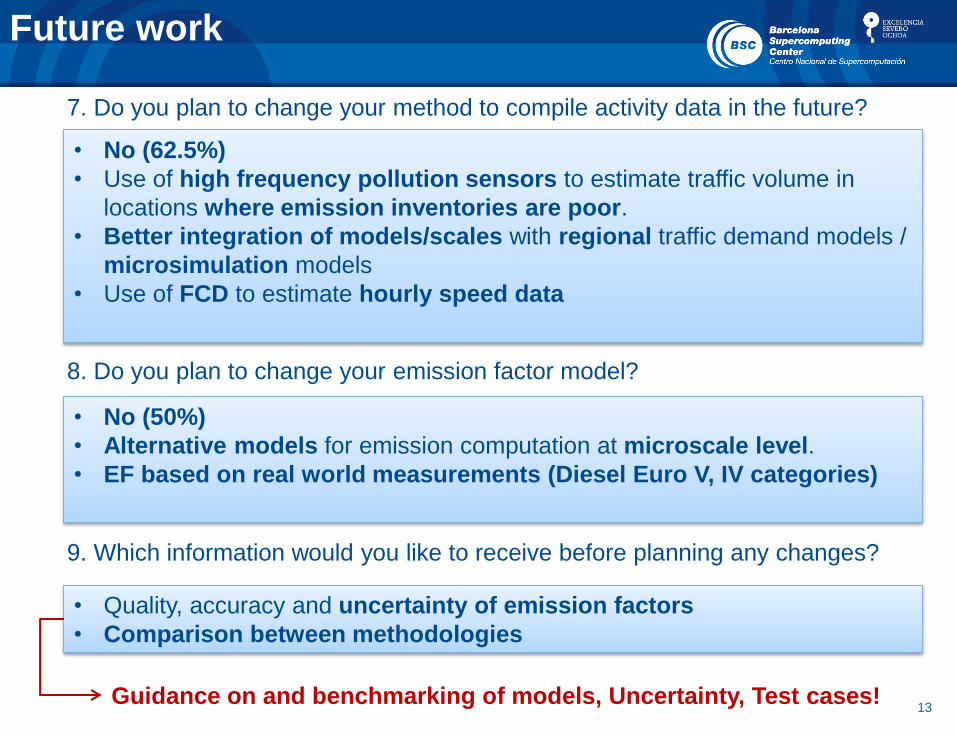
Future work
7. Do you plan to change your method to compile activity data in the future?
8. Do you plan to change your emission factor model?
• No (62.5%)
• Use of high frequency pollution sensors to estimate traffic volume in
locations where emission inventories are poor.
• Better integration of models/scales with regional traffic demand models /
microsimulation models
• Use of FCD to estimate hourly speed data
• No (50%)
• Alternative models for emission computation at microscale level.
• EF based on real world measurements (Diesel Euro V, IV categories)
9. Which information would you like to receive before planning any changes?
• Quality, accuracy and uncertainty of emission factors
• Comparison between methodologies
Guidance on and benchmarking of models, Uncertainty, Test cases!
14
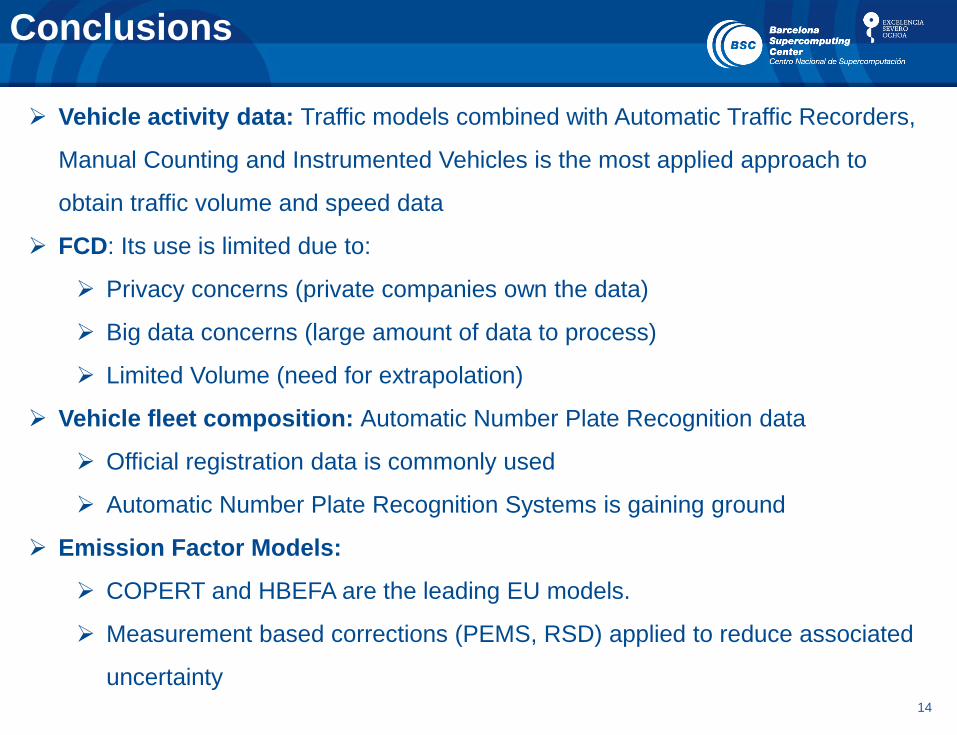
Conclusions
Vehicle activity data: Traffic models combined with Automatic Traffic Recorders,
Manual Counting and Instrumented Vehicles is the most applied approach to
obtain traffic volume and speed data
FCD: Its use is limited due to:
Privacy concerns (private companies own the data)
Big data concerns (large amount of data to process)
Limited Volume (need for extrapolation)
Vehicle fleet composition: Automatic Number Plate Recognition data
Official registration data is commonly used
Automatic Number Plate Recognition Systems is gaining ground
Emission Factor Models:
COPERT and HBEFA are the leading EU models.
Measurement based corrections (PEMS, RSD) applied to reduce associated
uncertainty

www.bsc.es
For further information please contact
Thank you!
Masterplan for Masdar City, Abu Dhabi, which keeps cars out of the centre
16
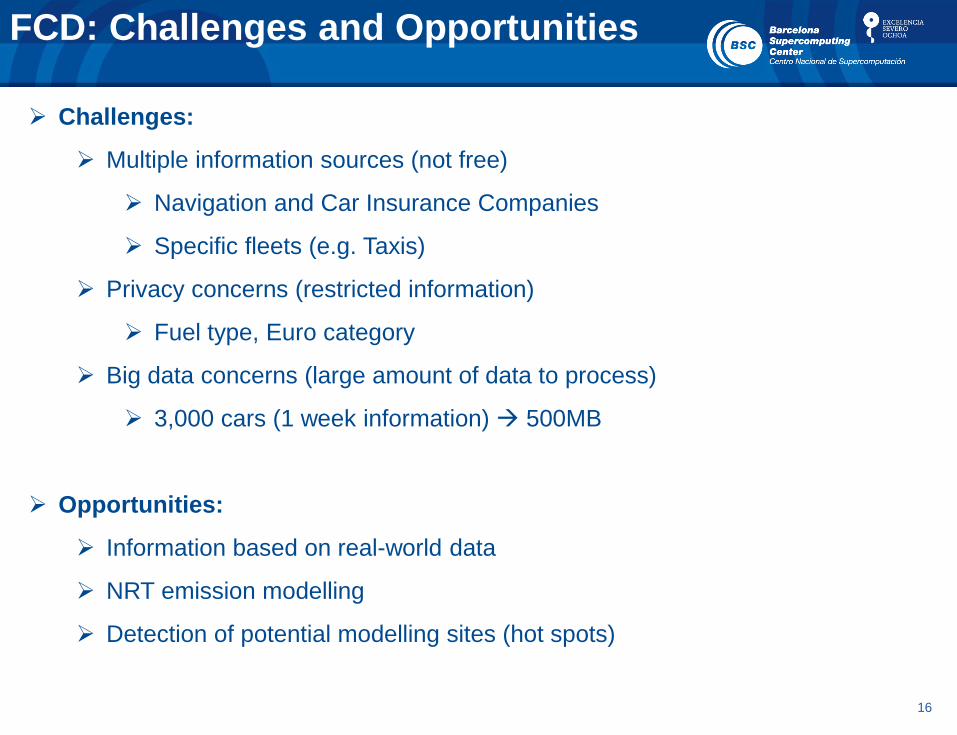
FCD: Challenges and Opportunities
Challenges:
Multiple information sources (not free)
Navigation and Car Insurance Companies
Specific fleets (e.g. Taxis)
Privacy concerns (restricted information)
Fuel type, Euro category
Big data concerns (large amount of data to process)
3,000 cars (1 week information) 500MB
Opportunities:
Information based on real-world data
NRT emission modelling
Detection of potential modelling sites (hot spots)
17
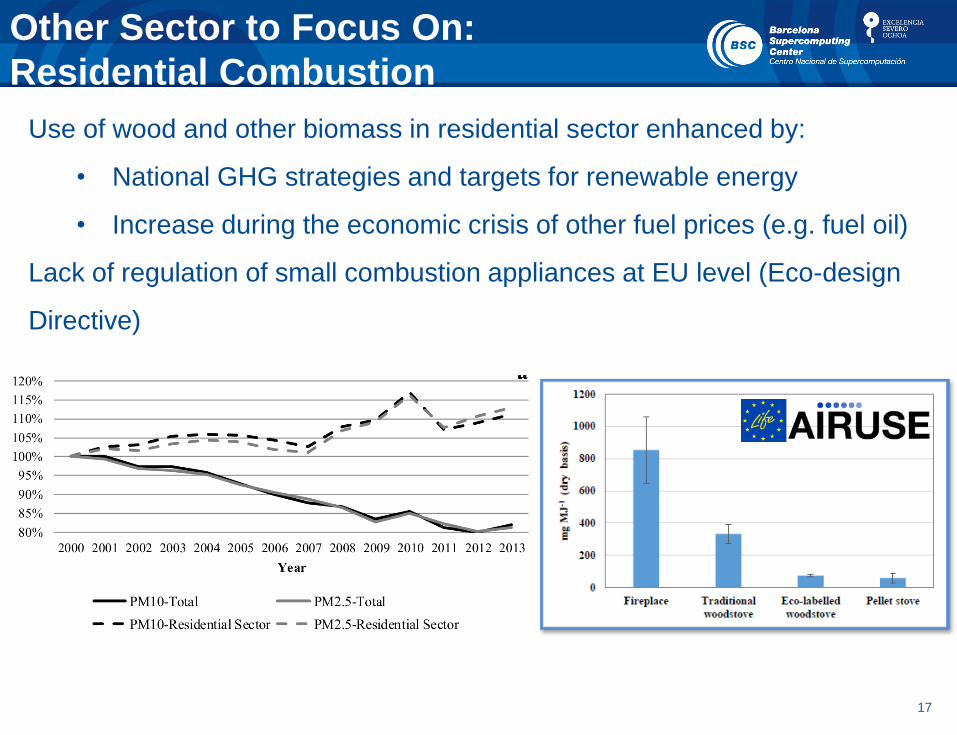
Other Sector to Focus On:
Residential Combustion
Use of wood and other biomass in residential sector enhanced by:
• National GHG strategies and targets for renewable energy
• Increase during the economic crisis of other fuel prices (e.g. fuel oil)
Lack of regulation of small combustion appliances at EU level (Eco-design
Directive)