Evaluation of Earth Pressure Acting on Embedded …Evaluation of Earth Pressure Acting on Embedded...
8
Evaluation of Earth Pressure Acting on Embedded Pile-cap Based on Liquefaction Test Using Large-scale Shaking Table by Shuji TAMURA 1) , Chikahiro MINOWA 2) , Kohji TOKIMATSU 3) , Shunji FUJII 4) , Kaeko YAHATA 5) and Tomio TSUCHIYA 6) ABSTRACT Shaking table tests are conducted using a large- scale laminar shear box to investigate the effects of non-liquefied crust overlying liquefied soils on an embedded footing. It is shown that (1) The total earth pressure before liquefaction is in- duced mainly by the inertial force of the build- ing. The shear force at the pile heads corre- sponds to the difference between the total earth pressure and the inertial force; (2) The total earth pressure after liquefaction is induced mainly by the soil deformation. The shear force at the pile heads corresponds to the sum of the total earth pressure and the inertial force of the building; (3) The relation between the relative displace- ment and the total earth pressure is linear before liquefaction. It becomes nonlinear with the de- velopment of pore water pressure and the total earth pressure decreases with cyclic loading af- ter liquefaction; (4) The peak value of the total earth pressure for the super-structure with a low natural frequency is larger than that with a high natural frequency. This is probably because the inertial force of the super-structure with a low natural frequency may interrupt the response of the footing that tends to move with the ground. KEY WORDS: Seismic Earth Pressure Liquefaction Pile Shaking Table Test 1. INTRODUCTION During the 1995 Hyogoken-Nambu earthquake, extensive soil liquefaction occurred on the re- claimed land areas of Kobe. Many damaged piles in such liquefied soil have been reported. It indicates that the effects of liquefaction on piles should be taken into account in foundation de- sign. Soil-pile-structure interaction during liquefac- tion has been studied by field investigations (Oh-Oka et al, 1998), numerical analyses (Fujii et al., 1998, Tokimatsu et al., 1998), centrifuge tests (Sato et al., 1995) and large-scale shaking table tests (Tamura et al., 2000). Most research efforts of these studies have focused on the evaluation of soil-pile interaction including p-y relations during soil liquefaction. Thus, knowl- edge of the effects of non-liquefied crust over- lying liquefied soil on an embedded footing re- mains limited. The evaluation of the kinematic force acting on an embedded footing is an im- portant consideration in the seismic design method using p-y curve for pile foundations. This paper investigated earth pressure acting on 1) Associate Professor, Shinshu University, 4- 17-1 Wasasato, Nagano-shi, Japan, 380- 8553 2) Scientific Research Advisor, National Research Institute for Earth Science and Disaster Prevention, 3-1 Ten-nodai, Tsu- kuba-shi, Japan, 305-0006 3) Professor, Tokyo Institute of Technology, 2-12-1 O-okayama, Meguro-ku, Tokyo, Ja- pan, 152-8552 4) Chief Research Engineer, Kajima Technical Research Institute, 2-19-1, Tobitakyu, Chofu-shi, Japan, 182-0036 5) General Manager, Taisei Corporation, 344- 1 Nase-cho, Totsuka-ku, Yokohama-shi, Japan, 245-0051 6) Chief Researcher, Takenaka Research & Development Institute, 1-5-1 Inzai-shi, Chiba, Japan, 270-1395
Transcript of Evaluation of Earth Pressure Acting on Embedded …Evaluation of Earth Pressure Acting on Embedded...
Evaluation of Earth Pressure Acting on Embedded Pile-cap Based on Liquefaction Test Using Large-scale Shaking Table
by
Shuji TAMURA1), Chikahiro MINOWA2), Kohji TOKIMATSU3), Shunji FUJII4),
Kaeko YAHATA5) and Tomio TSUCHIYA6)
ABSTRACT Shaking table tests are conducted using a large-scale laminar shear box to investigate the effects of non-liquefied crust overlying liquefied soils on an embedded footing. It is shown that (1) The total earth pressure before liquefaction is in-duced mainly by the inertial force of the build-ing. The shear force at the pile heads corre-sponds to the difference between the total earth pressure and the inertial force; (2) The total earth pressure after liquefaction is induced mainly by the soil deformation. The shear force at the pile heads corresponds to the sum of the total earth pressure and the inertial force of the building; (3) The relation between the relative displace-ment and the total earth pressure is linear before liquefaction. It becomes nonlinear with the de-velopment of pore water pressure and the total earth pressure decreases with cyclic loading af-ter liquefaction; (4) The peak value of the total earth pressure for the super-structure with a low natural frequency is larger than that with a high natural frequency. This is probably because the inertial force of the super-structure with a low natural frequency may interrupt the response of the footing that tends to move with the ground. KEY WORDS: Seismic Earth Pressure Liquefaction Pile Shaking Table Test
1. INTRODUCTION During the 1995 Hyogoken-Nambu earthquake, extensive soil liquefaction occurred on the re-claimed land areas of Kobe. Many damaged piles in such liquefied soil have been reported. It indicates that the effects of liquefaction on piles
should be taken into account in foundation de-sign. Soil-pile-structure interaction during liquefac-tion has been studied by field investigations (Oh-Oka et al, 1998), numerical analyses (Fujii et al., 1998, Tokimatsu et al., 1998), centrifuge tests (Sato et al., 1995) and large-scale shaking table tests (Tamura et al., 2000). Most research efforts of these studies have focused on the evaluation of soil-pile interaction including p-y relations during soil liquefaction. Thus, knowl-edge of the effects of non-liquefied crust over-lying liquefied soil on an embedded footing re-mains limited. The evaluation of the kinematic force acting on an embedded footing is an im-portant consideration in the seismic design method using p-y curve for pile foundations. This paper investigated earth pressure acting on
1) Associate Professor, Shinshu University, 4-
17-1 Wasasato, Nagano-shi, Japan, 380-8553
2) Scientific Research Advisor, National Research Institute for Earth Science and Disaster Prevention, 3-1 Ten-nodai, Tsu-kuba-shi, Japan, 305-0006
3) Professor, Tokyo Institute of Technology, 2-12-1 O-okayama, Meguro-ku, Tokyo, Ja-pan, 152-8552
4) Chief Research Engineer, Kajima Technical Research Institute, 2-19-1, Tobitakyu, Chofu-shi, Japan, 182-0036
5) General Manager, Taisei Corporation, 344-1 Nase-cho, Totsuka-ku, Yokohama-shi, Japan, 245-0051
6) Chief Researcher, Takenaka Research & Development Institute, 1-5-1 Inzai-shi, Chiba, Japan, 270-1395
an embedded footing of a building during soil liquefaction, using a large-scale laminar shear box. The objects of this paper are; 1) to study major factor affecting earth pressure; 2) to study the relation between the relative displacement and earth pressure; 3) to study phase difference between the inertial force of the building and earth pressure, and 4) to study the effects of a natural frequency of the super-structure on earth pressure.
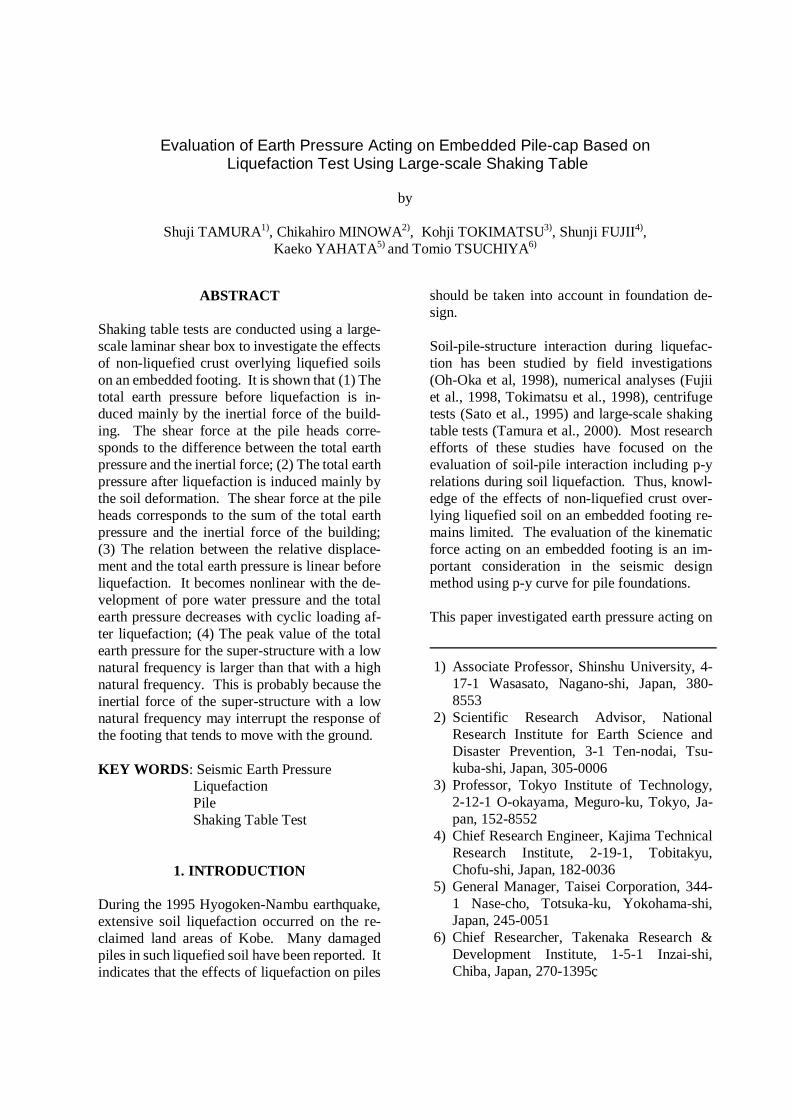
2. MODEL PREPARATION Shaking table tests were performed at NIED (National Research Institute for Earth Science and Disaster Prevention) in Tsukuba, Japan. A large-scale laminar shear box 6 m high, 3.5 m wide and 12 m long (shaking direction) was mounted on the shaking table. A sketch of a large-scale laminar shear box including a soil-pile-structure system for Model B-S is presented in Fig. 1. Four steel piles with a diameter of 16.5 cm, a length of 5.3 m, a thickness of 3.7 mm and EI=1259 kNm2 were installed in a three-layer soil profile with a thickness of 6m. This profile included a 4.5 m layer of Kasumigaura sand (emax=0.96, emin=0.57, D50=0.31 mm, Fc=5.4%)
with a shear wave velocity of 90 m/s, placed on top of a 1.5 m layer of gravel with VS = 230 m/s. The water level was about GL-0.5 m, that is, 0.5 m dry sand overlying 4 m saturated sand. The predominant frequency of the ground was about 5 Hz. The super-structure model with a mass of 14200 kg was supported by 4 vibration isolation rubbers, 4 laminated rubber bearings and 2 vis-cous dampers fixed on a steel footing (2.5m long, 1.8m wide and 1.6m high). The footing with a mass of 2100 kg was embedded 0.5 m in the dry sand. A mass of the super-structure is about 6 times that of the footing. The super-structure had a natural frequency of about 5.4 Hz, which was larger than the predominant fre-quency of the ground. The pile heads were rig-idly linked to the footing, while their tips were connected to the laminar shear box by hinges. The test set up of Model B-L is similar to that of Model B-S, except that the super-structure was supported by 4 laminar rubber bearings and 2 viscous dampers only. The natural frequency of this super-structure was about 1.3 Hz, which was lower than the predominant frequency of the ground. Both models, B-S and B-L, were excited by
2,500
1,80
0
3,50
0
Pile C
Pile D
Pile BPile A
1,00
0
6,00
0
1,00
01,
000
1,00
01,
000
1,00
05,800
2,9002,000 9002,900 2,000900
5,800
8
6
4
2
7
9
5
3
ACL 1-14
ACPA-1ACPC-1ACL 2-1
ACL 3-7
PWL 1-1
PWL 2-1
PWL 3-5
PWPB-1
PWPD-1
F
Dry sand
Saturatedsand
GravelACL 3-1PWL 3-1
ACL 3-6ACL 1-13
PWL 1-10
2,500
1,80
0
3,50
0
Pile C
Pile D
Pile BPile A
2,500
1,80
0
3,50
0
Pile C
Pile D
Pile BPile A
1,00
0
6,00
0
1,00
01,
000
1,00
01,
000
1,00
01,
000
6,00
0
1,00
01,
000
1,00
01,
000
1,00
05,800
2,9002,000 9002,900 2,000900 2,9002,000 9002,900 2,000900
5,800
8
6
4
2
7
9
5
3
ACL 1-14
ACPA-1ACPC-1ACL 2-1
ACL 3-7
PWL 1-1
PWL 2-1
PWL 3-5
PWPB-1
PWPD-1
F
Dry sand
Saturatedsand
GravelACL 3-1PWL 3-1
ACL 3-6ACL 1-13
PWL 1-10
(Unit: mm)
D-20
D-15
D-10
D-5
D-0
18@
250
2@2
30A-20
A-15
A-10
A-5
A-0
18@
250
2@2
30
(Unit: mm)
D-20
D-15
D-10
D-5
D-0
18@
250
2@2
30A-20
A-15
A-10
A-5
A-0
18@
250
2@2
30 D-20
D-15
D-10
D-5
D-0
18@
250
2@2
30A-20
A-15
A-10
A-5
A-0
18@
250
2@2
30
accelerometer (Horizontal)
accelerometer (Cross)
accelerometer (Vertical)
pore pressure
strain gage
horizontal displacement
vertical displacement
rotary encoder
accelerometer (Horizontal)
accelerometer (Cross)
accelerometer (Vertical)
pore pressure
strain gage
horizontal displacement
vertical displacement
horizontal displacement
vertical displacement
rotary encoder
Fig. 1. Test setup(Model B-S)
RINKAI92, which is a synthesized ground mo-tion for the Tokyo Bay area expecting the re-occurrence of the 1923 Kanto earthquake. The amplitude of the motion was scaled as 240 cm/s2. Acceleration, displacement, excess pore wa-ter pressure and strain of the piles were recorded during the tests.
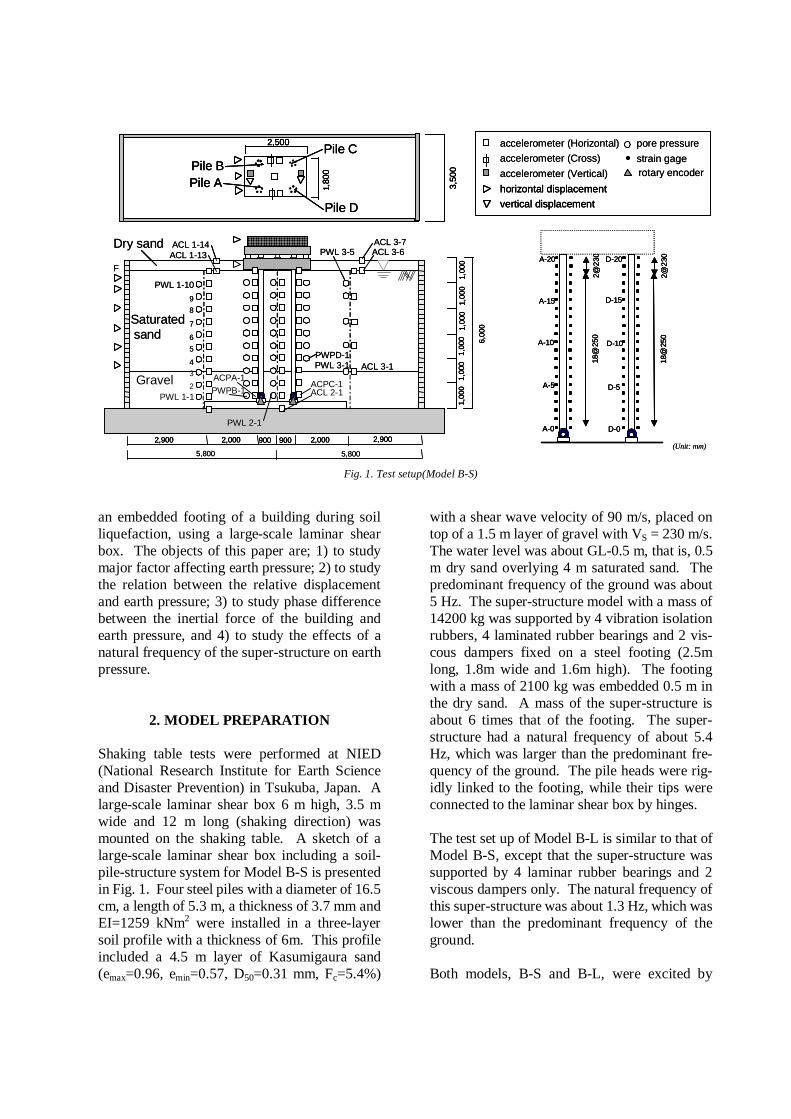
3. TEST RESULTS AND DISCUSSION (1) Dynamic Response of Soil-Pile-Structure System Figure 2 shows the acceleration time histories of the super-structure, the ground surface and the shaking table for Models B-S and B-L. Figure 3 shows the time histories of bending moment at the pile heads for both models. The bending moment begins to increase rapidly at 8 seconds in both models. The acceleration of the super-structure, in contrast, begins to increase at 2 seconds as shown in Fig. 2. Figure 4 shows the time histories and the vertical distribution of the excess pore water pressure. The excess pore water pressure begins to increase rapidly at 8 seconds in both models. This corresponds to the time when the bending moment at the pile heads begins to increase rapidly. This suggests that the bending moment is apparently influenced by soil liquefaction. Soil liquefaction progressed from the upper layer to the bottom. The lower part of the satu-rated sand layer almost liquefied at about 20 seconds. The ground acceleration and the de-velopment of the excess pore water for Model B-S are roughly the same as that of Model B-L. This indicates that the soil response for Model B-S is similar to that of Model B-L. The accel-eration of the super-structure, however, contains higher frequency components in Model B-S than in Model B-L until 8 seconds. The predominant frequency of Model B-S becomes smaller and is similar to that of Model B-L after 8 seconds. Figure 5 shows the time histories of the footing and the ground surface displacements and Fig. 6 shows those of relative displacements between the footing and the ground surface for both
models. The displacements were calculated by the double integration of accelerometer re-cordings. The relative displacement, ∆D can be defined by
t=6s
t=8s
t=10s
t=12st=16s
t=20st=24s
�»� ��£
�Ϻ¼ÊÊ §Æɼ ®¸Ë¼É §É¼ÊÊÌɼ�§¸�
�������������
�¼À¾¿Ë�Ä�
�Ϻ¼ÊÊ §Æɼ ®¸Ë¼É §É¼ÊÊÌɼ�§¸�
�
�
�
�
�
�
���
t=6s
t=8s
t=10s
t=12st=16s
t=20st=24s
�º� ��ª
�����������
t=6s
t=8s
t=10s
t=12st=16s
t=20st=24s
�»� ��£
�Ϻ¼ÊÊ §Æɼ ®¸Ë¼É §É¼ÊÊÌɼ�§¸�
�������������
�¼À¾¿Ë�Ä�
�Ϻ¼ÊÊ §Æɼ ®¸Ë¼É §É¼ÊÊÌɼ�§¸�
�
�
�
�
�
�
���
t=6s
t=8s
t=10s
t=12st=16s
t=20st=24s
�º� ��ª
�����������
-30
-15
0
15
30
0 5 10 15 20 25 30
Mt(kNm)Mt(kNm)
Time(s)
Moment(kNm) B-S
B-L
Pile Head
Fig.4.Time histories and vertical distribution of excess pore water pressure
Fig. 3. Time history of bending moment at pile head
Fig. 2. Time histories of acceleration
-200
-100
0
100
200
Acc.(cm/s2)
B-L
B-S
(a)Super-structure
-200
-100
0
100
200ACL1-14ACL1-14
Acc.(cm/s2) B-S
B-L
(b)Ground surface
-400
-200
0
200
400
0 5 10 15 20 25 30
ATB1SATB1
Time(s)
Acc.(cm/s2)
(c)Input Acceleration
B-SB-L
Fig. 2. Time histories of acceleration
-200
-100
0
100
200
Acc.(cm/s2)
B-L
B-S
(a)Super-structure
-200
-100
0
100
200ACL1-14ACL1-14
Acc.(cm/s2) B-S
B-L
(b)Ground surface
-400
-200
0
200
400
0 5 10 15 20 25 30
ATB1SATB1
Time(s)
Acc.(cm/s2)
(c)Input Acceleration
B-SB-L
PWL1-10PWL1-10
��§�®�§��§¸�
0
10
30
20 B-SB-L
(a) G.L.-1.8m
PWL1-4PWL1-4
0 5 10 15 20 25 30
��§�®�§��§¸�
Time(s)
0
50
B-SB-L
(b) G.L.-4m
SBD ∆−∆=∆ (1)
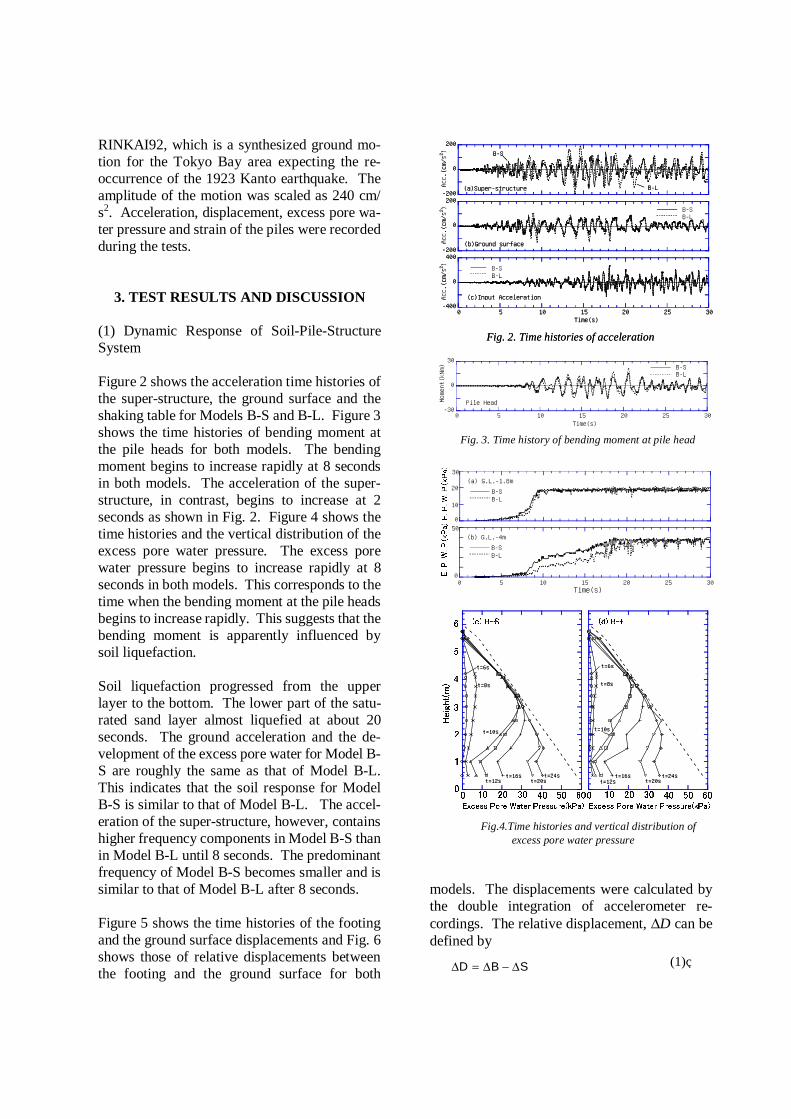
in which ∆B = displacement of the footing and ∆S = displacement of the ground surface. The footing displacement is almost the same as the ground surface displacement at first. A small phase difference occurs between the ground surface displacements and the footing after 8 seconds. This produces the relative displace-ment as shown in Fig. 6. The phase difference of Model B-L is larger than that of Model B-S. Thus, the relative displacement of Model B-L is larger than that of Model B-S as shown in Fig. 6. (2) Evaluation of Earth Pressure on Embedded Foundation Figure 7 is a schematic figure showing the seis-mic earth pressure acting on an embedded foot-ing. The total earth pressure acting on the foot-ing, P can be expressed by
in which Pp = earth pressure at passive side, Pa = earth pressure at active side, Q = the sum of shear forces at the pile heads and F = the inertial force of the building, that is, the sum of the in-ertial forces of the super-structure and the foot-ing. Q can be calculated by the differentiation of the measured strain at the pile head. In order to evaluate the accuracy of the shear force at the pile heads, the shear force and the inertial force of the building for Model A-L are compared in Fig. 8. The test set up of Model A-L is similar to that of Model B-L except that the footing was not embedded. The earth pressure therefore does not act on the footing in Model A-L. The shear force at the pile heads and the in-ertial force show a fairly good agreement, indi-cating that the total earth pressure can be evalu-ated by Eq. (2). Figure 9 shows the time histories of the total earth pressure on the footing for both models. The total earth pressure recording contains higher frequency components in Model B-S than in Model B-L until 8 seconds. The tendency is similar to the acceleration of the super-structure as shown in Fig. 2(a). From 8 to 20 seconds when soil liquefaction is developing, the total earth pressure is large and contains low fre-quency components for both models despite the difference in the natural frequency of the super-
FQPPP ap −=−= (2)
-20
-10
0
10
20
0 5 10 15 20 25 30
Ka(kN)PF(kN)
Time(s)
Force(kN)
żÉËÀ¸Ãw�Æɺ¼wƽw�ÌÀûÀž
ª¿¼¸Éw�Æɺ¼w¸Ëw§Àüw�¼¸»w
��£
-40
-20
0
20
40
�¸ÉË¿w§
ɼÊÊÌɼ�Â¥�
-40
-20
0
20
40
0 5 10 15 20 25 30
�¸ÉË¿w§
ɼÊÊÌɼ�Â¥�
Time(s)
�¸� ��ª
�¹� ��£
-40
-20
0
20
40
�¸ÉË¿w§
ɼÊÊÌɼ�Â¥�
-40
-20
0
20
40
0 5 10 15 20 25 30
�¸ÉË¿w§
ɼÊÊÌɼ�Â¥�
Time(s)
-40
-20
0
20
40
�¸ÉË¿w§
ɼÊÊÌɼ�Â¥�
-40
-20
0
20
40
0 5 10 15 20 25 30
�¸ÉË¿w§
ɼÊÊÌɼ�Â¥�
Time(s)
�¸� ��ª
�¹� ��£
Fig. 9. Time histories of total earth pressure acting on footing
Fig.8. Time history of inertial force of building and shear force at pile head
-40
-20
0
20
40
0 5 10 15 20 25 30
Re. Dis.(mm)
Time(s)
-40
-20
0
20
40
0 5 10 15 20 25 30
Re. Dis.(mm)
Time(s)
-40
-20
0
20
40
0 5 10 15 20 25 30
Re. Dis.(mm)
Time(s)
Fig. 6. Time histories of relative displacement between footing and ground surface
�¸� ��ª
�¹� ��£
Fig. 7. Schematic figure showing seismic earth pressure acting on footing
�ºËÀͼ ªÀ»¼
żÉËÀ¸Ã �Æɺ¼ ƽ �ÌÀûÀž��
§¸ÊÊÀͼ ªÀ»¼
ª¿¼¸É �Æɺ¼ ¸Ë §Àü �¼¸»�¨
PpPa
Fig. 7. Schematic figure showing seismic earth pressure acting on footing
�ºËÀͼ ªÀ»¼
żÉËÀ¸Ã �Æɺ¼ ƽ �ÌÀûÀž��
§¸ÊÊÀͼ ªÀ»¼
ª¿¼¸É �Æɺ¼ ¸Ë §Àü �¼¸»�¨
PpPa
-100
-50
0
50
100
Dis.(mm)
-100
-50
0
50
100
0 5 10 15 20 25 30
Dis.(mm)
Time(s)
�¸� ��ª
�¹� ��£ �ÉÆÌÅ» ªÌɽ¸º¼
�ÆÆËÀž
Fig. 5. Time histories of footing and ground displacement

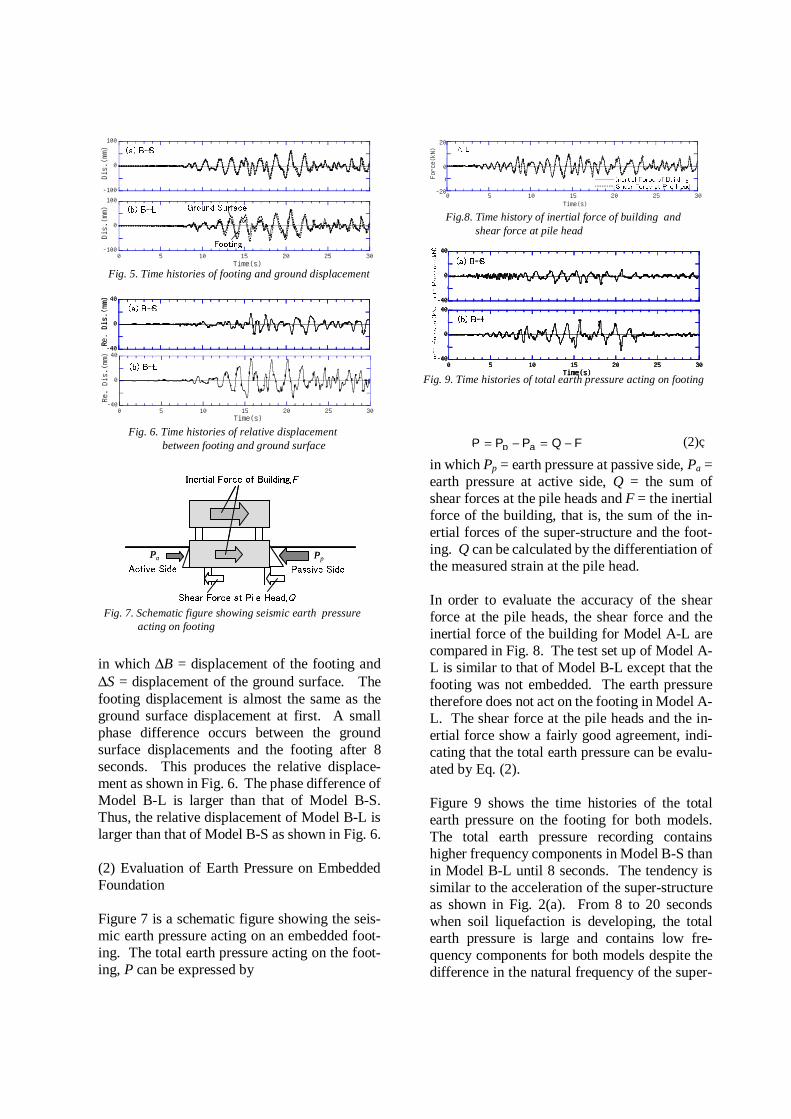
structure. The total earth pressure gets small after 20 seconds when the saturated sand lique-fies completely. To examine the effects of the inertial force and the soil deformation on the total earth pressure, fourier spectra of the total earth pressure, the inertial force of the building and the ground dis-placement are shown in Fig. 10. The predomi-nant frequencies of the total earth pressure are 3.6 Hz and 1.2 Hz for Models B-S and B-L, re-spectively until 8 seconds. The frequency agrees with the predominant frequency of the inertial force. This indicates that the total earth pressure is strongly correlated to the response of the su-per-structure before soil liquefaction. The pre-dominant frequency of the total earth pressure for both models is 0.6 Hz, which corresponds to the predominant frequency of the soil displace-ment from 12 to 28 seconds. This suggests that the total earth pressure is induced mainly by the soil deformation after liquefaction. (3) Relation between Earth Pressure and Rela-tive Displacement
To clarify the mechanism of the total earth pres-sure acting on the footing, the relation between the total earth pressure and the relative dis-placement (∆D) for Models B-S and B-L is shown in Fig. 11. The relation between the relative displacement and the total earth pressure is linear for both models until about 8 seconds. It becomes nonlinear with the development of the pore water pressure from 8 to 20 seconds. The nonlinearity in behavior is significant in Model B-L. The total earth pressure is seen to degrade with cyclic loading from 20 to 30 sec-onds. (4) Relation between Earth Pressure and Inertial Force of Building In general, the phase difference between inertial and kinematic forces can be classified into the following two types in which Fb and Fg are natural frequencies of the building and the ground, respectively (Nishimura et al, 1997):
Fig. 11. Relation between relative displacement and total earth pressure
-10
0
10
-0.5 0 0.5
(a)t=0-8s (B-S)
Earth Pressure(kN)
Relative Displacement(cm)
-30
0
30(b)t=8-20s (B-S)
Earth Pressure(kN)
-30
0
30
-5 0 5
(c)t=20-30s (B-S)
Earth Pressure(kN)
Relative Displacement(cm)
-10
0
10
-0.5 0 0.5
(d)t=0-8s (B-L)
Earth Pressure(kN)
Relative Displacement(cm)
-30
0
30(e)t=8-20s (B-L)
Earth Pressure(kN)
-30
0
30
-5 0 5
(f)t=20-30s (B-L)
Earth Pressure(kN)
Relative Displacement(cm)
Fig. 10. Fourier spectra of earth pressure, inertial force and soil displacement
0
0.5
1
�ÆÌÉÀ¼ÉwÊǼºËÉÌÄw�Â¥wʼº�
t=0-8s
t=12-20s
t=20-28s
�¸�w�¸ÉË¿w§É¼ÊÊÌɼw���ª�
0
1
2
3
4
0 1 2 3 4 5 6
�ÆÌÉÀ¼ÉwÊǼºËÉÌÄw�ÄÄwʼº�
�ɼÈ̼źÐw��Ñ�
t=0-8s
t=12-20s
t=20-28s
�º�w�ÉÆÌÅ»w»ÀÊÇøº¼Ä¼ÅËw���ª�
0
0.5
1
�ÆÌÉÀ¼ÉwÊǼºËÉÌÄw�Â¥wʼº�
t=0-8s
t=12-20s
t=20-28s
�¹�w żÉËÀ¸Ãw�Æɺ¼w���ª�
0
1
2
3
4
0 1 2 3 4 5 6�ɼÈ̼źÐw��Ñ�
t=0-8s
t=12-20s
t=20-28s
�½�w�ÉÆÌÅ»w»ÀÊÇøº¼Ä¼ÅËw���£�
0
0.5
1
1.5
t=0-8s
t=12-20s
t=20-28s
�»�w�¸ÉË¿w§É¼ÊÊÌɼw���£�
0
0.5
1
1.5
t=0-8s
t=12-20s
t=20-28s
�¼�w żÉËÀ¸Ãw�Æɺ¼w���£�

1) If Fb > Fg, inertial and kinematic forces tend to be in phase. 2) If Fb < Fg, inertial and kinematic forces tend to be out of phase by 180 degrees. The phase differences above are based on an assumption that the total earth pressure and the ground displacement should be in phase. The total earth pressure acting on the footing, how-ever, depends on the relative displacement. Taking into account the displacement of the soil and the footing, the phase can be classified into four types as shown in Fig. 12. (a) If Fb > Fg and ∆S > ∆B, the total earth pres-sure tends to be in phase with the inertial force. Thus, the shear force at the pile heads corre-sponds to the sum of the total earth pressure and the inertial force of the building. (b) If Fb < Fg and ∆S > ∆B, the total earth pres-sure tends to be out of phase by 180 degrees with the inertial force. Thus, the shear force at the pile heads corresponds to the difference between the total earth pressure and the inertial force of the building. (c) If Fb > Fg and ∆S < ∆B, the total earth pres-sure tends to be out of phase by 180 degrees with the inertial force. Thus, the shear force at the pile heads corresponds to the difference between the total earth pressure and the inertial force of the building. (d) If Fb < Fg and ∆S < ∆B, the total earth pres-sure tends to be in phase with the inertial force. Thus, the shear force at the pile heads corre-sponds to the sum of the total earth pressure and the inertial force of the building. To investigate the phase difference during soil liquefaction, the relation between the total earth pressure and the inertial force of the building for the two tests is shown in Fig. 13. The data fallen in the first and third quadrants show that the total earth pressure tends to be in phase with the in-ertial force, while those in the second and forth quadrants show that the total earth pressure tends to be out of phase by 180 degrees with the inertial force. A gray (blue) line in the figure shows that ∆S is smaller than ∆B, while a black line shows that ∆S is larger than ∆B. Most of the data for both models fall in the sec-
ond and forth quadrants until 8 seconds. This indicates that the total earth pressure tends to be out of phase by 180 degrees with the inertial force. In case of Model B-S, a gray (blue) line is dominant, indicating that ∆S is smaller than ∆B when the total earth pressure reaches its peak. Considering that Fb is higher than Fg in this pe-
1ª 1ª1�
�ÉÆÌÅ» »ÀÊÇøº¼Ä¼ÅË�ÆÆËÀž »ÀÊÇøº¼Ä¼ÅË
żÉËÀ¸Ã ½Æɺ¼ ƽ ¹ÌÀûÀž�
§
�¸� �¹w� �¾ww} ∆ª � ∆�
�¸ÉË¿ §É¼ÊÊÌɼ
1ª 1ª1�
�
§
�¹� �¹ � �¾ww} ∆ª � ∆�
1ª 1ª1�
�
§
�º� �¹ � �¾ww} ∆ª � ∆�
1ª 1ª1�
�
§
�»� �¹ � �¾ww} ∆ª � ∆�
Fig. 12. Schematic figure showing relation between inertial force and total earth pressure
1ª 1ª1�
�ÉÆÌÅ» »ÀÊÇøº¼Ä¼ÅË�ÆÆËÀž »ÀÊÇøº¼Ä¼ÅË
żÉËÀ¸Ã ½Æɺ¼ ƽ ¹ÌÀûÀž�
§
�¸� �¹w� �¾ww} ∆ª � ∆�
�¸ÉË¿ §É¼ÊÊÌɼ
1ª 1ª1�
�
§
�¹� �¹ � �¾ww} ∆ª � ∆�
1ª 1ª1�
�
§
�º� �¹ � �¾ww} ∆ª � ∆�
1ª 1ª1�
�
§
�»� �¹ � �¾ww} ∆ª � ∆�
Fig. 12. Schematic figure showing relation between inertial force and total earth pressure
F
P
-30
0
30(a)t=0-8s (B-S)
Earth Pressure(kN)
-30
0
30(b)t=8-20s (B-S)
Earth Pressure(kN)
-30
0
30
-30 0 30
(c)t=20-30s (B-S)
Earth Pressure(kN)
Inertial Force of Structure(kN)
-30
0
30(a)t=0-8s (B-L)
Earth Pressure(kN)
-30
0
30(e)t=8-20s (B-L)
Earth Pressure(kN)
-30
0
30
-30 0 30
(f)t=20-30s (B-L)
Earth Pressure(kN)
Inertial Force of Structure(kN)
(d)
Fig. 13. Relation between inertial force and total earth pressure
F
P
F
P
F
P
-30
0
30(a)t=0-8s (B-S)
Earth Pressure(kN)
-30
0
30(b)t=8-20s (B-S)
Earth Pressure(kN)
-30
0
30
-30 0 30
(c)t=20-30s (B-S)
Earth Pressure(kN)
Inertial Force of Structure(kN)
-30
0
30(a)t=0-8s (B-L)
Earth Pressure(kN)
-30
0
30(e)t=8-20s (B-L)
Earth Pressure(kN)
-30
0
30
-30 0 30
(f)t=20-30s (B-L)
Earth Pressure(kN)
Inertial Force of Structure(kN)
(d)
-30
0
30(a)t=0-8s (B-S)
Earth Pressure(kN)
-30
0
30(b)t=8-20s (B-S)
Earth Pressure(kN)
-30
0
30
-30 0 30
(c)t=20-30s (B-S)
Earth Pressure(kN)
Inertial Force of Structure(kN)
-30
0
30(a)t=0-8s (B-L)
Earth Pressure(kN)
-30
0
30(e)t=8-20s (B-L)
Earth Pressure(kN)
-30
0
30
-30 0 30
(f)t=20-30s (B-L)
Earth Pressure(kN)
Inertial Force of Structure(kN)
(d)
Fig. 13. Relation between inertial force and total earth pressure

riod, the total earth pressure tends to be out of phase with the inertial force as shown in Fig. 12(c). In case of Model B-L, on the contrary, a black line is dominant, indicating that ∆S tends to be larger than ∆B. Fb is smaller than Fg in this period. Thus, the inertial force and the total earth pressure tend to be out of phase as shown in Fig. 12(b). The value of the total earth pres-sure in this period is about 60-70 percent of the inertial force for both models. This indicates that the non-liquefied crust tends to counteract the inertial force transmitted from the building to the pile heads. Therefore, the bending moment at the pile heads is very small until 8 seconds as shown in Fig. 3. Most data for both models fall in the first and third quadrants from 8 to 20 seconds, indicating that the total earth pressure tends to be in phase with the inertial force. A black line is dominant, indicating that ∆S tends to be larger than ∆B when the total earth pressure reaches its peak. Considering that Fb is higher than Fg due to liq-uefaction in both models, the total earth pressure tends to be in phase with the inertial force as shown in Fig. 12(a). This indicates that the shear force at the pile heads corresponds to the sum of the total earth pressure and the inertial force of the building. Therefore, the bending moment at the pile heads increase rapidly at 8 seconds as shown in Fig. 3. The tendency above is signifi-cant in Model B-L and is ambiguous in both models from 20 to 30 seconds. (5) Effects of Natural Frequency of Building on Earth Pressure The peak value of the total earth pressure in
Model B-L is larger than that in Model B-S from 8 to 20 seconds as shown in Fig. 13. Taking into account the similar soil response for both models (Fig. 2,4), the difference may be caused by the natural frequency of the super-structure. To clarify the effects of the natural frequency of the super-structure on the total earth pressure, the relation between the acceleration of the footing and the super-structure for the two tests is shown in Fig. 14. The acceleration of the footing and the super-structure tend to be in phase in Model B-S. This indicates that the inertial force of the super-structure does not interrupt the response of the footing. The footing can move with the ground and the relative displacement tends to be small. In case of Model B-L, in contrast, the acceleration of the super-structure tends to be out of phase with that of the footing. This indi-cates that the inertial force of the building may interrupt the response of the footing that tends to move with the ground. As a result, the relative displacement is large. This is the reason that, the peak value of the total earth pressure for Model B-L is larger than that of Model B-S.
4. CONCLUSION Shaking table tests are conducted using a large-scale laminar shear box to investigate the effects of non-liquefied crust overlying liquefied soil on an embedded footing. The following conclu-sions are drawn: (1) The total earth pressure before liquefaction is induced mainly by the inertial force of the building, because the total earth pressure acting on the footing tends to be out of phase by 180 degrees with the inertial force of the building. The shear force at the pile heads corresponds to the difference between the total earth pressure and the inertial force. (2) The total earth pressure after liquefaction is induced mainly by the soil deformation, because the total earth pressure acting on the footing tends to be in phase with the inertial force of the building. The shear force at the pile heads cor-responds to the sum of the total earth pressure and the inertial force. (3) The relation between the relative displace-ment and the total earth pressure is linear before
Fig. 14. Relation between acceleration of footing and super-structure
-500
0
500
-500 0 500
�ºº�ƽªËÉ̺ËÌɼ�ºÄ�Ê��
(a)B-S, t=8-20s
�ºº� ƽ �ÆÆËÀž �ºÄ�Ê��
-500
0
500
-500 0 500
�ºº�ƽªËÉ̺ËÌɼ�ºÄ�Ê��
�ºº� ƽ �ÆÆËÀž �ºÄ�Ê��
(b)B-L, t=8-20s

liquefaction. It becomes nonlinear with the de-velopment of the pore water pressure and the total earth pressure decreases with cyclic loading after liquefaction. (4) The peak value of the total earth pressure for the super-structure with a low natural frequency is larger than that with a high natural frequency. This is probably because that the inertial force of the super-structure with a low natural frequency may interrupt the response of the footing that tends to move with the ground. ACKNOWLEDGMENTS This test was jointly conducted by NIED, STA, Tokyo Institute of Technology, Kajima Corp., Taisei Corp., Takenaka Corp., Nippon Steel Corp. and Tokyo Soil Research Corp. The con-tribution and support of the members for this work are appreciated. REFERENCES
Fujii, S., Isemoto, N., Satou, Y., Kaneko, O., Funahara, H., Arai, T. and Tokimatsu, K. [1998]. Investigation and analysis of a pile foundation damaged by liquefaction during the 1995 Hyogoken-Nambu earthquake, Soils and Foundations, Special Issue on Geotechnical As-pects of the 1995 Hyogoken Nambu Earthquake, No. 2, pp. 179-192. Nishimura, A., Murono, Y. and Nagatsuma, S. [1997]. Experimental study on the seismic de-sign method for pile foundation in the soft ground (Part 1-3), Pros., 32nd Japan National Conf. on Geotech. Engrg., Vol. 1, pp. 961-966, (in Japanese) Oh-Oka, H., Fukui, M., Hatanaka, M., Ohara, J. and Honda, S. [1998]. Permanent deformation of steel pipe piles penetraiting compacted fill at wharf on port Island, Soils and Foundations, Special Issue on Geotechnical Aspects of the 1995 Hyogoken Nambu Earthquake, No. 2, pp. 147-162. Sato, M., Shamoto, Y. and Zhang, J. -M. [1995].
Soil pile-structure during liquefaction on centri-fuge, Proc., 3rd Inter. Conf. on Rec. Adv. in Geotech. Earthq. Engrg & Soil Dyn., 1, pp. 135-142. Tamura, S., Suzuki Y., Tsuchiya T., Fujii S. and Kagawa T.[2000]. Dynamic response and failure mechanisms of a pile foundation during soil liq-uefaction by shaking table test with a large-scale laminar shear box, Proc., of 12th World Conf. on Earthq. Engrg., Reference No. 903. Tokimatsu, K. and Asaka, Y. [1998]. Effects of liquefaction-induced ground displacements on pile performance in the 1995 Hyogoken-Nambu Earthquake, Soils and Foundations, Special Is-sue of Geotechnical Aspects on the 1995 Hyogoken Nambu Earthquake, No. 2, pp. 163-177.