EVALUATION OF DEVELOPMENT PLANS … OF DEVELOPMENT PLANS TOWARDS SUSTAINABLE URBAN TRANSPORTATION: A...
18
EVALUATION OF DEVELOPMENT PLANS TOWARDS SUSTAINABLE URBAN TRANSPORTATION: A CASE STUDY OF PUNE METROPOLITAN REGION Krishna Rao Chetan Kumar Bhargav Venil Conference CODATU XV The role of urban mobility in (re)shaping cities 22 to 25 October 2012- Addis Ababa (Ethiopia)
Transcript of EVALUATION OF DEVELOPMENT PLANS … OF DEVELOPMENT PLANS TOWARDS SUSTAINABLE URBAN TRANSPORTATION: A...

EVALUATION OF
DEVELOPMENT
PLANS TOWARDS
SUSTAINABLE URBAN
TRANSPORTATION: A
CASE STUDY OF PUNE
METROPOLITAN
REGION
Krishna Rao
Chetan Kumar
Bhargav Venil
Conference CODATU XV The role of urban mobility in (re)shaping cities
22 to 25 October 2012- Addis Ababa (Ethiopia)

CODATU XV - Le rôle de la mobilité urbaine pour (re)modeler les villes 1

CODATU XV - Le rôle de la mobilité urbaine pour (re)modeler les villes 2
Conference CODATU XV
« The role of urban mobility in (re)shaping cities »
22 to 25 October 2012- Addis Ababa (Ethiopia)
Evaluation of Development Plans towards Sustainable Urban Transportation: A case study of
Pune Metropolitan Region
Krishna Rao K , Chetan Kumar , Bhargav Venil
Department of Civil Engineering, Indian Institute of Technology Bombay, Mumbai, India
Abstract
Pune, the second largest city of Maharashtra state, India has been experiencing continuous growth and
change over the last decade. The total number of trips is drastically increasing due to rapid growth in
population and employment. In the recent past, affordability and convenience have driven most of the
working group of Pune towards two wheeler usage. The comfort and extra mileage provided by these
vehicles had triggered a revolution in this area. But, if the situation is viewed from the transportation
planning angle, it is not sustainable. The introduction of shared autos and the hike in public transport
fares added further impetus to the unsustainable growth of private vehicles. The observed modal
shares during the study indicate that the share of trips by public transport (bus) is only 13% whereas
the share of private transport and intermediate public transport (IPT) respectively is 44.9% and 8.3%
(Walk and Non-motorized transport – 33.8%). With increase in private vehicle ownership the situation
is becoming worse and hence there is an urgent need to augment the current transportation system with
modern high capacity transit systems like the Metro, BRTS/Light Rail systems with access being
promoted by walk, bicycle, bus and Intermediate Public Transport (in that order). Considering the
accelerated growth in population that has been observed in the recent past and the potential of future
growth of Pune Metropolitan Region as evident from the population projections, implementation of
land use and transport policies for moving towards a more sustainable modal share is of paramount
importance. In this regard, Pune Municipal Corporation has proposed development plans for the
implementation of high capacity transit systems in a phased manner with appropriate last mile
connections (preferably with walk, bicycle, bus and IPT, in that order) and appropriate transit oriented
development schemes considering the concept of sustainable urban transportation. The concept of
mixed land use minimizing commuter trips in the large IT and ITES employment centers and other
employment and growth centers which are being currently implemented and the ones planned in the
future is considered in the present study. The study analyses the impacts of mixed land use and transit
oriented development scenarios like increased FSI along the metro corridors for future years using the
transportation planning model developed by IIT Bombay.
Keywords: sustainable urban transportation, high capacity mass transit systems, development plans,
transit oriented development scenarios

CODATU XV - Le rôle de la mobilité urbaine pour (re)modeler les villes 3
1. Introduction
Transport in India is an important part of nation’s economy. Over the last decade, development of
infrastructure within the country has progressed at a rapid pace with a variety of modes of transport by
land, water and air. As cities grow exponentially, an effective and sustainable urban transport system
for people and goods is a prerequisite for sustainable economic growth. Motor vehicle ownership is
growing faster than population and the rapid growth of cities is putting tremendous pressure on urban
infrastructure — including housing, transportation, power supply, water supply, and sewerage
systems. Transport, which is demand-driven, plays a very important role in the overall growth of the
economy. Planning for sustainable urban development focuses on improvements in all of these
characteristics of the functioning of cities.
2. Sustainable Planning and Transportation
As per the definition given by World Commission on Economic Development, sustainable
development is defined as ‘‘development which meets present needs without compromising the ability
of future generations to meet their own needs’’. According to the literature (Camagni et al., 1998;
Masser et al., 1992; Finco et al., 1999), there are five main factors that influence the development of
transportation: Spatial and land use planning, government policy, economic forces, technology and
social and behavioral trends. Each of these factors evolve over time, and affects both the others and the
transportation system. Thus, these factors will determine whether the progress in transportation will be
sustainable. Planning for a sustainable transportation system is a complicated task that involves a high
degree of uncertainty due to several reasons: (a) the large number of alternative potential policy
packages, (b) the way of implementation and (c) the travelers’ response to each of these policy
packages. In addition, it depends upon how planners and policy makers define and interpret the
concept of sustainable development. Transportation planning usually uses a cost-benefit approach or a
multi-criteria analysis. In both cases, to evaluate the benefits and the cost of different scenarios,
transportation planning usually applies statistical and behavioral models to analyze the performance of
the transportation system under these scenarios. These tools, that have initially been developed to
analyze the effects of new transportation infrastructure or public transport services, have been
expanded to evaluate the environmental impact of transportation projects, as well as to analyze the
sustainability of transportation alternatives. This approach, however, cannot be used as a systematic
tool for developing a sustainable transportation system because of several reasons. First, it is not a
planning tool; rather it is an evaluation tool, where the suggestion of alternatives is left to the planner.
Second, with all the advances in this approach, it still lacks the capability to analyze the effects of
many policies and is limited in the sustainable indicators it can predict (Shiftan et al., 2003). Third,
this approach is based on extracting existing behavior and trends, making it difficult to account for
significant changes in behavior, values or unexpected events.
Some authors have attempted to suggest approaches for sustainable development planning in the
general (non-transportation) literature. However, even the most recent planning tools that make use of
advanced methodologies and technologies fall short of developing an agreed strategy for sustainable
transportation systems. Scenario planning focuses upon map representations developed through the
employment of analytical ‘what-if’ functions and spatial modeling usually undertaken in a GIS. It is
closely connected to the view that planning should offer inspired visions of the future, based upon
likely or preferred scenarios which are either founded upon existing planning policy or used to
formulate planning policy. As stated by Stillwell et al., (1999). According to Zegras et al., (2004)
scenarios are not new to planning. Indeed, the use of the term scenario is quite common across a range
of planning disciplines, from business-strategic planning to urban-transportation planning. For
example, in travel-demand forecasting, it is common to develop scenarios of land uses that have a
certain probability of developing in the future. Transportation projects can then be evaluated in the
context of these different land-use scenarios. Similarly, different scenarios of economic growth, or fuel
efficiency improvements, or price changes are often used to develop ranges of future possibilities i.e.,
the high-growth scenario and the low-efficiency scenario. In these cases, scenarios are simply
alternative point estimates of potential futures. In scenario planning, however, the term scenario

CODATU XV - Le rôle de la mobilité urbaine pour (re)modeler les villes 4
adheres more closely to its literal definition of an imagined sequence of future events. Using what are
sometimes called decision scenarios, scenario planning is a tool designed to help an organization judge
how effective decisions made today will be in the uncertain future. Scenario planning is not a
replacement for traditional planning techniques such as forecasting; instead it aims to help
organizations better prepare for the unexpected. In short, scenario planning helps to make robust
strategic choices. In this paper, the scenario approach was used as a framework for sustainable
transportation planning.
3. Study Area
The study area is considered as Pune Metropolitan Region (PMR), with a population of 5.6 million
(2011) and spread across an area of 444 km2. The study area consists of Pune Municipal Corporation
(PMC) area, Pimri-Chinchwad Municipal Corporation (PCMC) area, Hinjewadi area, Pune and
Khadki cantonments. The study area adopted in this study is similar to the one adopted during Pune
Metro Project (2009). Figure 1 shows the study area marked in the Pune district map.
Figure 1 Study Area
The zoning system considered for the Pune Metro Project (2009) comprises of only 91 internal zones
and 13 external zones. In the present study, it is proposed to redefine these traffic analysis zones
(TAZ) to the extent possible as per the administrative units like election wards. Accordingly, the
zoning system comprises of 144 zones in the PMC area, 105 zones in the PCMC area and 16 zones in
the Hinjewadi area. Pune and Khadki cantonments have been considered as two zones. In total, 267
internal zones and in addition 13 external zones to capture the external travel have been considered.
Two screen lines, the first one along the Mula-Mutha river and the second along the existing railway
line is adopted for the present study. Most of the past studies have adopted the same two standard
screen lines and the boundary of the study area is considered as the outer cordon line. Figure 2 shows
the zones, location of two screen lines and outer cordon traffic volume count stations.

CODATU XV - Le rôle de la mobilité urbaine pour (re)modeler les villes 5
4. Data Set
The data set available from the Pune Metro Project (2009) is made use of for the present study. The
available data set comprises of:
• Home interview survey • O-D surveys
• Traffic volume counts • Speed and delay survey
• Occupancy counts • Stated preference survey
Figure 2 Internal Zones, Screen Lines and Outer Cordon Stations in the Study Area
Home Interview Survey
Home interview survey was done during the Pune Metro Project (2009) and the same survey data has
been used for the present study. This home interview survey was carried out in the year 2008. Home
Interview Survey was conducted on a sample basis in 3000 households which included collection of
information regarding the Household, Persons and Trips.
From the HIS data it was observed that the share of Public Transit (bus) was as low as 13%. Figure 3
shows the obtained Modal Split from HIS data.
PMC (144 ZONES)
PCMC (105 ZONES)
HINJEWADI
(16 ZONES) Outer Cordon
Stations
Screen Line 2
Screen Line 1

CODATU XV - Le rôle de la mobilité urbaine pour (re)modeler les villes 6
Figure 3 Modal Split from HIS (Internal Travel)
(Source: Pune Metro Project, 2009)
5. Plan Period and Planning Variables
For the present study, 2008 is taken as the base year since Pune Metro Study was carried out in this
year. Two horizon years, 2021 and 2031 are considered for the present study.
The planning variables considered are discussed in the following sections:
Population
The total population of study area in 2001 was 35.6 lakh (more than thrice the 1971 population of 10.7
lakh). The population growth in the study area from 1961 to 2001 is shown in Table 1.
Table 1 Population growth in Study Area
(Source: Census of India, 2001)
The projected population for the PMR is shown in Table 2. The population growth from 1961 to
2031(projected) is shown in Figure 4.
Table 2 Projected Population of Pune Metropolitan Region
Region 2008 2021 2031
PMC 3394948 5239886 6197016
PCMC 1473210 2273805 2689144
Pune Cantonment 82988 128086 151483
Khadki Cantonment 80296 123931 146569
Hinjewadi 42810 66075 78144
Total 5074254 7831785 9232356
Region 1961 1971 1981 1991 2001
PMC 595762 856105 1203351 1566651 2328349
PCMC 46031 83542 220966 517083 1083967
Pune Cantonment 65838 69451 85986 82139 80191
Khadki Cantonment 58496 65497 80835 78323 77473
Total 766127 1074595 1591138 2244196 3569980
TRAIN
0.5%BUS
12.5%
TW
38.6%
CAR
6.3%
IPT
8.3%
WALK
25.0%
BICYCLE
8.8%

CODATU XV - Le rôle de la mobilité urbaine pour (re)modeler les villes 7
Figure 4 Population growth from 1961 to 2031(projected) for PMR
Employment
The projected employment for the PMR is shown in Table 3.
Table 3 Projected Employment for Pune Metropolitan Region
Region Employment (Million)
2008 2021 2031
PMC 1.11 1.78 2.36
PCMC 0.54 1.26 1.89
Pune Cantonment 0.04 0.05 0.05
Khadki Cantonment 0.04 0.05 0.05
Hinjewadi 0.25 0.39 0.5
Total 1.98 3.52 4.85
Student Enrolment
The student enrolment in 1996 observed from census data is 6.62 lakhs. The base year aggregate
student enrolment is obtained from HIS and it is forecasted to the future and the same has been divided
into all the zones depending on the zonal proportions.
6. Travel Demand Modeling
To address equity issues population has been divided into the following 3 segments for the present
study:
Car owning Group (High Income Group-HIG)
Two wheeler owning group (Middle Income Group-MIG)
No vehicle group (Low Income Group-LIG)
Initially, the development process of transport network systems is discussed. Then, the four stages of
the travel demand model consisting of trip generation, trip distribution, modal split and trip assignment
are discussed in detail.
6.1 Transport Network Systems Development Process
Transport network developed comprises of two components:
Highway Network for private vehicles
Transit Network for public transport systems i.e. buses, rail and any new public transportation
system.

CODATU XV - Le rôle de la mobilité urbaine pour (re)modeler les villes 8
Highway Network
Initially, the shape file (with only line features) for whole India was obtained from OpenStreetMap (a
collaborative project to create a free editable map of the world by using GPS devices, aerial
photographs, etc.) data server. The shape file contained almost the entire road network of all major
cities in India. From this shape file, the study area (PMR) road network is separated out using ArcGIS
software. Then, the network is converted to required .NET format using CUBE software.
The network built contained a very large number of links (about 31,000) and nodes (to retain the true
shape) which makes the work of adding the road attributes/characteristics to all the links very
cumbersome. The large number of links and nodes even adds to increasing the time required to run the
travel demand model in an enormous way. Hence, the entire network was drawn manually connecting
only the nodes at junctions and optimizing the number of nodes and links to the maximum possible
extent.
After this exercise, attributes like number of lanes, divided/undivided, one way/two way, flyover,
bridge are required to be added to define the link types. For doing this, the network in .NET format is
converted into .KMZ format and is super imposed on Google Earth. Two monitors connected to a
single CPU were used in which one monitor was used for Google Earth display and the other for
adding the attributes (in CUBE) to make the process quicker and easier. The edited links were
distinguished from unedited links by using a temporary attribute ‘Edited=0/1’ (0 for unedited and 1 for
edited). The total length of network developed is 3596 km and consists of 20,594 links (excluding
zone centroid connectors).
Once the links are added with all the necessary attributes, different link types are defined which in turn
define the capacity (PCU/hr), free flow speed (km/hr), speed at capacity (km/hr). 13 different link
types as per the Pune Metro Study and 9 new link types are adopted for the present study. Figure 5
shows the network with typical link attributes.
Public Transit Network
Once the highway network is developed, the public transport routes are coded on the network using
PUBLIC TRANSPORT program in CUBE Voyager. The coded public transport routes consist of:
Figure 5 Highway network with typical link attributes

CODATU XV - Le rôle de la mobilité urbaine pour (re)modeler les villes 9
PMPML (Pune Mahanagar Parivahan Mahamandal Limited) bus routes
Intermediate Public Transport-IPT (Auto) routes
Suburban rail routes
BRTS (Bus Rapid Transit System) routes
Shared liner routes (6 passenger autorickshaws)
Out station bus routes
Proposed metro routes
Proposed mono rail routes
The PMPML bus routes were obtained from Pune Bus Guide data server. In total, 363 bus routes were
coded along with their frequencies in 10AM to 11AM which is considered as the design hour (peak
hour) for modeling. The horizon year (2021 & 2031) network with all proposed BRTS, metro and
monorail routes is shown in Figure 6.
Figure 6 Horizon year (2021 & 2031) network with all proposed transit systems
The travel demand model development process is shown in Figure 7.
Proposed BRTS
Proposed Monorail
Proposed Metro

CODATU XV - Le rôle de la mobilité urbaine pour (re)modeler les villes 10
Figure 7 Travel Demand Model Development Process
6.2 Establishing Base Year Travel Pattern
The base year travel pattern in PMR is obtained using the data from home interview survey, outer
cordon OD survey, screen line traffic volume counts. The mode wise OD matrices obtained from these
primary sources were then used for validation by assigning them on to the respective networks and
comparing the observed and estimated flows from the model.
6.3 Trip Assignment
The trip assignment stage consists of two stages:
Public Transport Assignment
Peak hour public transport passenger matrix, which includes trips made by bus, Intermediate Public
Transport (IPT), shared liners and train was assigned onto the public transport network. The public
transport assignment is done based on generalized time. The components of generalized time are in-
vehicle travel time (IVTT), waiting time (WT), transfer penalty, fare and discomfort in time units.
Accordingly, the generalized time, GT is worked out as:
GT = IVTT + WTFAC*WT +TRFAC*NTR + FARE / VOT + DF
Where,
GT = Generalized time in minutes
IVTT = In vehicle travel time
WTFAC = Wait time factor
WT = Waiting time
TRFAC = Transfer penalty factor
NTR = Number of transfers
VOT = Value of travel time, in Rs per minute
Assignment of PT trips onto the public transport network
Assignment of highway trips onto road network taking PT
flows as preloads
Validated base year OD Matrices from Home Interview Survey
Trip Assignment - Assignment of PT trips
- Assignment of highway trips
with PT flows as preloads
Congested
PT time/cost skims
Highway time/cost skims
Modal Split
Trip Generation Modeling
Trip Productions
Trip Attractions
Planning Variables
Population
Employment
Student Enrollment Trip Distribution Calibration of Gravity
Trip Distribution Model

CODATU XV - Le rôle de la mobilité urbaine pour (re)modeler les villes 11
FARE = Fare paid for journey between origin and destination in Rs.
DF = Discomfort Factor (worked out from SP Survey)
The values of the above parameters used in public transport assignment are worked out from the
choice models developed using the Stated Preference and Revealed Preference (Home Interview
Survey) data obtained from primary surveys.
There are two important steps in public transport assignment viz., path building and loading trips on to
these paths. The purpose of path building is to identify all reasonable paths between zones and provide
associated travel information in generalized time so that the proportion of trips using each path may be
calculated at the loading stage. Between any pair of zones maximum number of trips are loaded on to
the best path and other paths with longer generalized times will be loaded with fewer trips. The
proportion of trips to be loaded is calculated on the basis of a logistic choice function based on
generalized time.
The public transport (PT) assignment is also required to assign the trips as per the observed modal
shares. In order to achieve this, the parameters of the generalized time were fixed based on the values
obtained from the analysis of stated preference and revealed preference surveys. However, these
values were slightly modified to get the assigned flows close to the observed ones. Several skim
matrices for PT were obtained at the end of assignment which can be used for calibration of other
demand models. The calibrated parameters of PT assignment Model are shown in Table 4.
Table 4 Calibrated parameters of Trip
Assignment
Table 5 Crowding Table for
PT Modes
Parameter Value Percent Standees DF(Min)
WTFAC 1.2 0 3
TRFAC 3 50 5
VOT Rs 0.53/ min 75 20
DF As per Table 5 95 45
100 300
Highway Assignment
Highway assignment has been carried out for peak hour, preloading the highway network with peak
hour public transport flows. The peak hour public transport passenger trips were converted into PCUs
by using appropriate PCU-passenger ratios. These peak-hour public transport (bus and IPT) flows in
terms of PCUs were preloaded on to the highway network before loading the two-wheeler and car O-D
matrices. The passenger matrices of car and two-wheeler were converted into peak hour PCU units by
using appropriate K factors (proportion of daily flow occurring during peak hour) and passenger-PCU
conversion factors based on observed occupancies. An equilibrium procedure based on generalized
cost was used in loading these car and two-wheeler matrices. The Commercial Vehicle (CV) trips
were taken as preloads on highway network. The generalized cost, GC, used in highway assignment
has the following form
GC = VOT * TT + TC
Where,
VOT = Value of travel time TT = Travel time TC = Travel cost
Travel cost for car/two-wheeler is the perceived operating cost which was taken as the cost of fuel and
oil. Two skims namely the highway time and highway travel cost were obtained from the loaded
network. The parameters of generalized cost used in Highway assignment are given in Table 6.
CODATU XV - Le rôle de la mobilité urbaine pour (re)modeler les villes 12
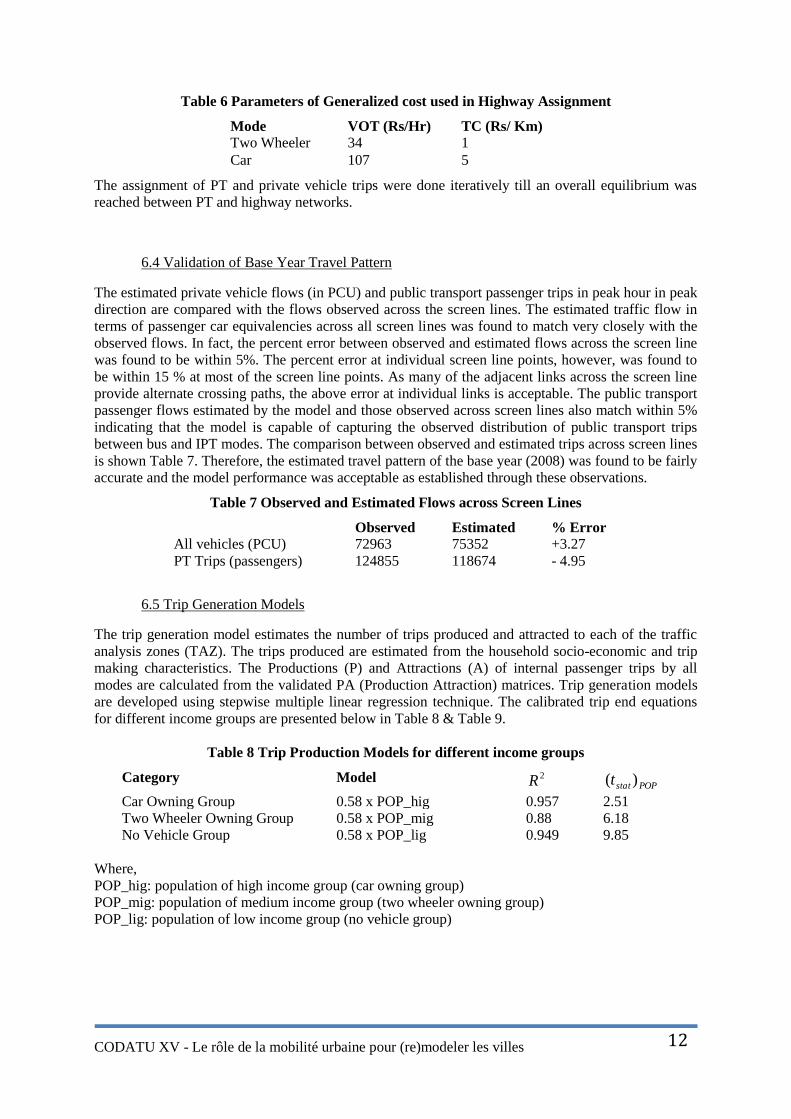
Table 6 Parameters of Generalized cost used in Highway Assignment
Mode VOT (Rs/Hr) TC (Rs/ Km)
Two Wheeler 34 1
Car 107 5
The assignment of PT and private vehicle trips were done iteratively till an overall equilibrium was
reached between PT and highway networks.
6.4 Validation of Base Year Travel Pattern
The estimated private vehicle flows (in PCU) and public transport passenger trips in peak hour in peak
direction are compared with the flows observed across the screen lines. The estimated traffic flow in
terms of passenger car equivalencies across all screen lines was found to match very closely with the
observed flows. In fact, the percent error between observed and estimated flows across the screen line
was found to be within 5%. The percent error at individual screen line points, however, was found to
be within 15 % at most of the screen line points. As many of the adjacent links across the screen line
provide alternate crossing paths, the above error at individual links is acceptable. The public transport
passenger flows estimated by the model and those observed across screen lines also match within 5%
indicating that the model is capable of capturing the observed distribution of public transport trips
between bus and IPT modes. The comparison between observed and estimated trips across screen lines
is shown Table 7. Therefore, the estimated travel pattern of the base year (2008) was found to be fairly
accurate and the model performance was acceptable as established through these observations.
Table 7 Observed and Estimated Flows across Screen Lines
Observed Estimated % Error
All vehicles (PCU) 72963 75352 +3.27
PT Trips (passengers) 124855 118674 - 4.95
6.5 Trip Generation Models
The trip generation model estimates the number of trips produced and attracted to each of the traffic
analysis zones (TAZ). The trips produced are estimated from the household socio-economic and trip
making characteristics. The Productions (P) and Attractions (A) of internal passenger trips by all
modes are calculated from the validated PA (Production Attraction) matrices. Trip generation models
are developed using stepwise multiple linear regression technique. The calibrated trip end equations
for different income groups are presented below in Table 8 & Table 9.
Table 8 Trip Production Models for different income groups
Category Model 2R POPstatt )(
Car Owning Group 0.58 x POP_hig 0.957 2.51
Two Wheeler Owning Group 0.58 x POP_mig 0.88 6.18
No Vehicle Group 0.58 x POP_lig 0.949 9.85
Where,
POP_hig: population of high income group (car owning group)
POP_mig: population of medium income group (two wheeler owning group)
POP_lig: population of low income group (no vehicle group)

CODATU XV - Le rôle de la mobilité urbaine pour (re)modeler les villes 13
Table 9 Trip Attraction Models for different income groups
Category Model 2R EMPstatt )( STENstatt )(
Car Owning Group 1.45 x EMP+0.12 x STEN 0.695 19.28 2.72
Two Wheeler Owning Group 1.28 x EMP+0.1 x STEN 0.80 18.69 1.87
No Vehicle Group 1.18 x EMP 0.639 8.58 -
Where,
EMP: Employment; STEN: student enrollment
6.6 Trip Distribution Models
A Gravity Trip Distribution model of the following form is calibrated for distributing the total internal
passenger trips. The calibrated Gravity Model parameters are shown in Table 10.
ijjjiiij FDBOAT
Where,
j
ijjj
iFDB
A1
i
ijii
jFOA
B1
ijF = the deterrence function
ijij CC
exp
ijC = Highway travel time from i to j
ijT = Number of trips between zones i and j.
α = Calibration parameter – power function
β = Calibration parameter – exponential function
Table 10 Gravity Model parameters for different income groups
S.No Class α β
1 Car owning Group -2.09557 -0.0001819
2 Two Wheeler Group -1.07986 -0.0236587
3 No vehicle Group -0.897392 -0.0255572
6.7 Modal Split Model
A multi-nomial logit model of mode choice for different income groups is developed for the entire
study area of PMR which is as shown in Figure 8. The following multinomial mode choice model was
calibrated for this purpose.
l
V
V
jl
j
e
eP
Where,
Pj = probability of choosing mode j, (Car, Two wheeler, PT)
Vj = deterministic component of utility for mode j and
j and l are indices for modes
The utility functions of the following specifications are calibrated.
Vcar = TTcar + TCcar + Constcar
V2w = TT2w + TC2w + Const2w
Vpt = TTpt + TCpt + WTpt
Where,

CODATU XV - Le rôle de la mobilité urbaine pour (re)modeler les villes 14
TT = Travel Time, TC = Travel Cost, WT = Waiting Time
Figure 8 Multi-nomial logit model for different income groups
The modal split equations calibrated are shown in Table 11.
Table 11 Modal split equations for different income groups
S. No Category square Equation
01 Car Owning Group 0.1664 a) carU -0.0004147*TT-0.001059*TC+0.5425
b) WU 2 -0.0004147*TT-0.001059*TC+0.3125
c) PTU -0.0004147*TT-0.001059*TC-0.03141*WT
02 Two Wheeler
Owning group
0.1732 a) wU 2 -0.003475*TT-0.07817*TC+1.312
b) PTU -0.003475*TT-0.07817*TC-0.00687*WT
7. Development Scenarios
Various development scenarios can be evaluated taking into consideration the sustainability concept.
Since for evaluation of any development scenario it is necessary to have a four stage travel demand
model the same was developed as explained in the earlier sections. Using the travel demand model
developed, the following two scenarios have been evaluated for the horizon years 2021 and 2031:
1) Usual Land Use Scenario (Scenario 1): With the prevailing land use pattern (base year is taken as
2008) traffic is forecasted for the horizon years 2021 and 2031 with different transportation network
systems. The different transportation systems considered for the horizon years in both the scenario1
and scenario 2 include metro, monorail and BRT corridors (Figure 11).
2) Increasing Floor Space Index (FSI) along Metro corridor (Scenario 2): Increasing the FSI to 4
along the Metro corridors (for 500m on both sides) for the years 2021 and 2031, the traffic is
forecasted and compared with the usual land use scenario (Scenario 1).
The zonal map is superimposed on the road network for identifying the zones which fall under the
influence of metro. ArcGIS software was used to calculate the metro influence area for 500m both
sides along the metro corridors. Among FSI of 4, FSI 2 is provided for commercial activity
(employment) and FSI 2 is provided for residential (population).
The basic assumption made to calculate the population along metro corridor is as follows:
The size of each dwelling house is considered as 80 sq m.
Household size is taken as 4.
The population under influence of metro corridor for each zone is found out as follows:
Population= (Area under influence of metro) *FSI * 4 / size of each dwelling house
= (Area under influence of metro) * 2 * 4/ 80
The population of the zones under the influence of metro is calculated as above and the population of
all other zones has been calculated as per the prevailing condition of land use pattern and also the total
population is maintained as per the usual forecast.
CODATU XV - Le rôle de la mobilité urbaine pour (re)modeler les villes 15
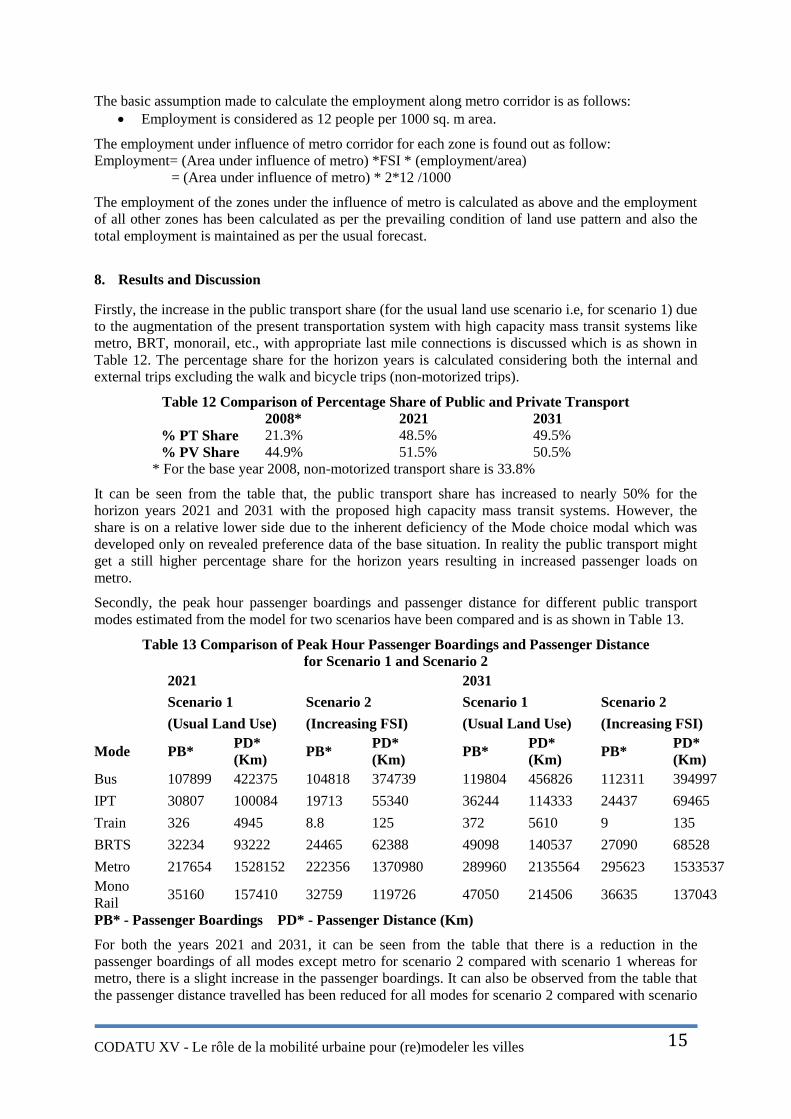
The basic assumption made to calculate the employment along metro corridor is as follows:
Employment is considered as 12 people per 1000 sq. m area.
The employment under influence of metro corridor for each zone is found out as follow:
Employment= (Area under influence of metro) *FSI * (employment/area)
= (Area under influence of metro) * 2*12 /1000
The employment of the zones under the influence of metro is calculated as above and the employment
of all other zones has been calculated as per the prevailing condition of land use pattern and also the
total employment is maintained as per the usual forecast.
8. Results and Discussion
Firstly, the increase in the public transport share (for the usual land use scenario i.e, for scenario 1) due
to the augmentation of the present transportation system with high capacity mass transit systems like
metro, BRT, monorail, etc., with appropriate last mile connections is discussed which is as shown in
Table 12. The percentage share for the horizon years is calculated considering both the internal and
external trips excluding the walk and bicycle trips (non-motorized trips).
Table 12 Comparison of Percentage Share of Public and Private Transport 2008* 2021 2031
% PT Share 21.3% 48.5% 49.5%
% PV Share 44.9% 51.5% 50.5%
* For the base year 2008, non-motorized transport share is 33.8%
It can be seen from the table that, the public transport share has increased to nearly 50% for the
horizon years 2021 and 2031 with the proposed high capacity mass transit systems. However, the
share is on a relative lower side due to the inherent deficiency of the Mode choice modal which was
developed only on revealed preference data of the base situation. In reality the public transport might
get a still higher percentage share for the horizon years resulting in increased passenger loads on
metro.
Secondly, the peak hour passenger boardings and passenger distance for different public transport
modes estimated from the model for two scenarios have been compared and is as shown in Table 13.
Table 13 Comparison of Peak Hour Passenger Boardings and Passenger Distance
for Scenario 1 and Scenario 2
2021
2031
Scenario 1 Scenario 2
Scenario 1 Scenario 2
(Usual Land Use) (Increasing FSI) (Usual Land Use) (Increasing FSI)
Mode PB* PD*
(Km) PB*
PD*
(Km) PB*
PD*
(Km) PB*
PD*
(Km)
Bus 107899 422375 104818 374739
119804 456826 112311 394997
IPT 30807 100084 19713 55340
36244 114333 24437 69465
Train 326 4945 8.8 125
372 5610 9 135
BRTS 32234 93222 24465 62388
49098 140537 27090 68528
Metro 217654 1528152 222356 1370980
289960 2135564 295623 1533537
Mono
Rail 35160 157410 32759 119726
47050 214506 36635 137043
PB* - Passenger Boardings PD* - Passenger Distance (Km)
For both the years 2021 and 2031, it can be seen from the table that there is a reduction in the
passenger boardings of all modes except metro for scenario 2 compared with scenario 1 whereas for
metro, there is a slight increase in the passenger boardings. It can also be observed from the table that
the passenger distance travelled has been reduced for all modes for scenario 2 compared with scenario

CODATU XV - Le rôle de la mobilité urbaine pour (re)modeler les villes 16
1. This is due to the fact that the increase in FSI along the metro corridors has reduced the average trip
lengths and the same is discussed in the following sections.
Lastly, the average trip lengths for two scenarios have been compared as shown in Table 14.
Table 14 Comparison of Average Trip Lengths for Scenario 1 and Scenario 2
2021
2031
Scenario 1 Scenario 2
Scenario 1 Scenario 2
(Usual
Land Use)
(Increasing
FSI)
(Usual Land
Use)
(Increasing
FSI)
Average Trip Length in terms of travel time (in minutes)
No vehicle group 33.8 25.7
34.6 26.6
TW owning group 35.7 26.5
36.5 27.3
Car owning group 34.4 25.5
35.2 25.7
It can be observed from the table that there is an overall 25% reduction of trip lengths for scenario 2
compared with scenario 1 for both the years 2021 and 2031. This is again due to the increase in FSI
along the metro corridors and thereby reducing the average travel times.
The trip length frequency distribution graphs showing the reduction in the average trip lengths for
different income groups for the horizon year 2021 are as shown in Figure 9. For the year 2031 also,
similar behavior is observed.
Figure 9 Trip length frequency distribution graphs for different income groups (2021)

CODATU XV - Le rôle de la mobilité urbaine pour (re)modeler les villes 17
9. Summary and Conclusions
The observed modal shares in the base year (2008) indicate that the share of trips by public transport
(bus) is only 13% and whereas the share of private transport and intermediate public transport
respectively is 45% and 8.3%. Considering the accelerated growth in population that has been
observed in the recent past and the potential of future growth of Pune Metropolitan Region as evident
from the population projections, implementation of land use and transport policies for moving towards
a more sustainable modal share is of paramount importance. Considering the concept of sustainable
urban transportation, implementing high capacity transit systems in a phased manner with appropriate
last mile connections (preferably with walk, bicycle, bus and IPT, in that order) and appropriate transit
oriented development schemes becomes the need of the hour. The concept of mixed land use
minimizing commuter trips should be adopted in the large IT and ITES employment centres and other
employment and growth centres that are being currently implemented and the ones planned in the
future. A scenario based approach was used to evaluate the development plans considered for the
future years with the help a travel demand model.
The travel demand model was developed for PMR using the data available from the Pune Metro Study
to test the land use and transport scenarios arrived at based on the above concepts.
In Scenario 1, the impact of the base land use scenario with the prevailing controls has been evaluated
on the proposed transport system improvements. The share of public transport has increased to nearly
50% for the horizon years. This increase seems to be still on a lower side due to the inherent
deficiency of the Mode choice modal which was developed only on revealed preference data of the
base situation. In reality the public transport might get a still higher percentage share for the horizon
years resulting in increased passenger loads on metro.
In Scenario 2, wherein densification has been done along the metro corridor, it has been observed that
there is a reduction of 25% in the average trip length and also the boardings in the Metro has
increased. It can be said that, increasing FSI along metro corridor will surely help rather than
developing the city outwards. Therefore transit oriented development, i.e., densification along with
new public transportation infrastructure like metro can lead to a sustainable development.
References
Camagni, R., Capello, R., & Nijkamp, P. (1998). “Towards sustainable city policy: an economy-
environment technology nexus”, Ecological Economies, Vol. 24, pp.103-128.
Finco, Adele, Nijkamp, & Peter. (1999). "Planning for sustainable spatial development: principles and
application," Serie Research Memoranda 0030, VU University, Amsterdam.
Masser, I., Sviden, O., & Wegener, M. (1992). “From growth to equity and sustainability: Paradigm
shift in transport planning?”, Futures, Vol.24(6), pp.539-558.
Pune Metro Project (2009), Detailed Project Report, Delhi Metro Rail Corporation, New Delhi.
Shiftan, Y., Kaplan, S., & Hakkert, S. (2003). “Scenario Building as a tool for planning a sustainable
transportation system”, Transportation Research PartD: Transport and Environment, Vol. 8(5),
pp.323-342.
Stillwell, J., Geertman, S., & Openshaw, S. (1999). "Developments in Geographical Information and
Planning", Chapter in: Geographical Information and Planning, Berlin, pp. 3-23.
Zegras, C., Sussman, J., & Conklin, C. (2004). “Scenario Planning for Strategic Regional
Transportational Planning”, Journal of Urban Planning and Development, Vol.130(1).