EVALUATION OF CRACKING OF THE US 331 … Report for ALDOT Project 930-645 EVALUATION OF CRACKING OF...
163
Research Report for ALDOT Project 930-645 EVALUATION OF CRACKING OF THE US 331 BRIDGE DECK Submitted to The Alabama Department of Transportation Prepared by Anton K. Schindler, Mary L. Hughes, Robert W. Barnes, and Benjamin E. Byard AUGUST 2010
Transcript of EVALUATION OF CRACKING OF THE US 331 … Report for ALDOT Project 930-645 EVALUATION OF CRACKING OF...
Research Report for ALDOT Project 930-645
EVALUATION OF CRACKING OF THE US 331 BRIDGE DECK
Submitted to
The Alabama Department of Transportation
Prepared by
Anton K. Schindler, Mary L. Hughes,
Robert W. Barnes, and Benjamin E. Byard
AUGUST 2010

1. Report No. FHWA/ALDOT 930-645
2. Government Accession No. 3. Recipient Catalog No.
5. Report Date August 2010
4. Title and Subtitle Evaluation of cracking of the US 331 bridge deck
6. Performing Organization Code
7. Author(s) Anton K. Schindler, Mary L. Hughes, Robert W. Barnes, and
Benjamin E. Byard
8. Performing Organization Report No.
FHWA/ALDOT 930-645
10. Work Unit No. (TRAIS)
9. Performing Organization Name and Address Highway Research Center
238 Harbert Engineering Center Auburn University, AL 36830
11. Contract or Grant No.
13. Type of Report and Period Covered Technical Report
12. Sponsoring Agency Name and Address Alabama Department of Transportation
1409 Coliseum Boulevard Montgomery, Alabama 36130-3050 14. Sponsoring Agency
Code
15. Supplementary Notes Project performed in cooperation with the Alabama Department of Transportation.
16. Abstract The focus of this report is a three-span, continuous, skewed bridge that was constructed in the summer of 2003 as the northbound roadway bridge on US 331 in Montgomery County, Alabama. This bridge deck exhibited extensive transverse and horizontal cracking and was replaced in 2005 before being opened to traffic. The primary objective of this study was to evaluate the mechanisms that may have contributed to horizontal cracking in this bridge deck. The concrete satisfied all standard slump, total air content, and compressive strength requirements. Core results revealed adequate in-place compressive and splitting tensile strengths. Finite-element analyses were used to rule out excessive skew and differential support settlement as causes of the cracking. Horizontal cracking in this deck was most likely caused by excessive early-age temperature gradients combined with drying shrinkage gradients that produced large shear and normal stresses at the top reinforcement mat location in a concrete with a high coefficient of thermal expansion and high modulus of elasticity. The effect of supplementary cementing materials, water-cement ratio, and placement temperature conditions on the early-age cracking tendency of bridge deck concrete was evaluated by rigid cracking frame testing techniques. Use of either fly ash or ground-granulated blast-furnace slag was found to significantly reduce thermal stresses at early ages. Coefficient of thermal expansion values were determined for concretes made with aggregates found in Alabama.
17. Key Words Concrete bridge deck, cracking, thermal effects, cracking tendency, coefficient of thermal expansion.
18. Distribution Statement No restrictions.
19. Security Classification (of this report) Unclassified
20. Security Classification (of this page)
Unclassified
21. No. of pages 150
22. Price
Form DOT F 1700.7 (8-72)
Research Report
ALDOT Research Project 930-645
EVALUATION OF CRACKING
OF THE US 331 BRIDGE DECK
Prepared by:
Anton K. Schindler
Mary L. Hughes
Robert W. Barnes
Benjamin E. Byard
Highway Research Center
and
Department of Civil Engineering
at
Auburn University
August 2010
i
DISCLAIMERS
The contents of this report reflect the views of the authors, who are responsible for the facts and
the accuracy of the data presented herein. The contents do not necessarily reflect the official
views or policies of Auburn University or the Alabama Department of Transportation. This report
does not constitute a standard, specification, or regulation.
NOT INTENDED FOR CONSTRUCTION, BIDDING, OR PERMIT PURPOSES
Anton K. Schindler, Ph.D., P.E.
Mary L. Hughes, Ph.D.
Robert W. Barnes, Ph.D., P.E.
Research Supervisors
ACKNOWLEDGEMENTS
Material contained herein was obtained in connection with a research project “Evaluation of
delamination cracking in bridge decks,” ALDOT Project 930-645, conducted by the Auburn
University Highway Research Center. Funding for the project was provided by the Alabama
Department of Transportation. The funding, cooperation, and assistance of many individuals
from each of these organizations are gratefully acknowledged. The contribution of Akash Rao,
Kwame Sakyi-Bekoe, and Xin Li during their thesis work is appreciated. The authors would like
to acknowledge the contributions of the following individuals:
Larry Lockett ALDOT, Chief of Materials and Test Bureau, Montgomery
Lyndi Blackburn ALDOT, Assistant Materials and Test Engineer, Montgomery
Sergio Rodriguez ALDOT, Special Projects Engineer, Montgomery
Robert King FHWA, Alabama Division, Bridge Engineer

ii
ABSTRACT
The focus of this report is a three-span, continuous, skewed bridge that was constructed in the
summer of 2003 as the northbound roadway bridge on US 331 in Montgomery County, Alabama.
This bridge deck exhibited extensive transverse and horizontal cracking and was replaced in
2005 before being opened to traffic. The primary objective of this study was to evaluate the
mechanisms that may have contributed to horizontal cracking in this bridge deck.
The concrete satisfied all standard slump, total air content, and compressive strength
requirements. Core results revealed adequate in-place compressive and splitting tensile
strengths. Finite-element analyses were used to rule out excessive skew and differential support
settlement as causes of the cracking. Horizontal cracking in this deck was most likely caused by
excessive early-age temperature gradients combined with drying shrinkage gradients that
produced large shear and normal stresses at the top reinforcement mat location in a concrete
with a high coefficient of thermal expansion and high modulus of elasticity.
The effect of supplementary cementing materials, water-cement ratio, and placement
temperature conditions on the early-age cracking tendency of bridge deck concrete was
evaluated by rigid cracking frame testing techniques. Use of either fly ash or ground-granulated
blast-furnace slag was found to significantly reduce thermal stresses at early ages. Coefficient of
thermal expansion values were determined for concretes made with aggregates found in
Alabama.
iii
TABLE OF CONTENTS
LIST OF TABLES ...........................................................................................................................vi
LIST OF FIGURES .........................................................................................................................vii
Chapter 1: Introduction ................................................................................................................ 1
1.1 Background ....................................................................................................................... 1
1.2 Project Objectives ............................................................................................................. 5
1.4 Report Outline ................................................................................................................... 5
Chapter 2: Literature Review ....................................................................................................... 7
2.1 Hydration of Cementitious Materials ................................................................................. 7
2.1.1 Cement Type ........................................................................................................... 7
2.1.2 Mixture Proportions ................................................................................................. 9
2.1.3 Replacement of Cement with Supplementary Cementing Materials........................ 9
2.1.4 Curing Temperature .............................................................................................. 11
2.2 Setting of Concrete ......................................................................................................... 11
2.3 Development of Mechanical Properties .......................................................................... 11
2.4 Factors that Produce Early-Age Volume Change ........................................................... 15
2.4.1 Thermal Effects ..................................................................................................... 15
2.4.2 Early-Age Shrinkage ............................................................................................. 20
2.5 Development of Early-Age Stresses ............................................................................... 21
2.5.1 Restraint Conditions .............................................................................................. 21
2.5.2 Early-Age Creep Behavior ..................................................................................... 22
2.6 Methods to Determine Early-Age Stresses ..................................................................... 23
2.7 Concluding Remarks ....................................................................................................... 24
Chapter 3: Review of the US 331 Bridge Deck and Other Bridge Decks in Alabama .......... 25
3.1 The US 331 Bridge ......................................................................................................... 25
3.1.1 Description of the US 331 Bridge .......................................................................... 25
3.1.2 Cracking of the US 331 Bridge Deck .................................................................... 29
3.1.3 Data Collected for the US 331 Bridge ................................................................... 34
3.2 Discussion of Cracking Mechanisms for the US 331 Bridge Deck ................................. 39
3.2.1 Likely Causes of Cracking ..................................................................................... 41
3.3 Extent of Horizontal Cracking in other Bridge Decks in Alabama .................................. 45
3.3.1 SR 49 over SCL RR in Lineville, Clay County ....................................................... 46
3.3.2 Courtland Bypass over Norfolk Southern Railroad, Lawrence Co. ....................... 47

iv
3.3.3 SR 216 over L&N RR (Tuscaloosa to Brookwood), Tuscaloosa Co. .................... 49
3.3.4 SR 21 over CSXT Railway at Tunnel Springs, Monroe County . ........................... 50
3.3.5 US 98 over ICG RR West of Wilmer, Mobile County ............................................ 52
Chapter 4: Cracking Tendency of Bridge Deck Concrete ....................................................... 54
4.1 Introduction ..................................................................................................................... 54
4.1.1 Chapter Objectives and Research Methodology ................................................... 55
4.2 Experimental Work .......................................................................................................... 55
4.2.1 Experimental Plan and Concrete Mixtures ............................................................ 55
4.2.2 Testing to Quantify the Early-Age Cracking Potential of Concrete ....................... 55
4.2.3 Testing to Quantify the Early-Age Unrestrained Shrinkage of Concrete .............. 58
4.2.4 Concrete Mechanical Properties ........................................................................... 58
4.2.5 Modeling of Bridge Deck Temperatures ................................................................ 59
4.2.6 Temperature Conditions and Material Conditioning .............................................. 60
4.2.7 Materials ................................................................................................................ 60
4.3 Results and Discussion .................................................................................................. 61
4.3.1 Influence of Temperature ...................................................................................... 61
4.3.2 Influence of Fly Ash and Slag Cement .................................................................. 63
4.3.3 Influence of Water-to-Cement Ratio ...................................................................... 66
4.4 Conclusions .................................................................................................................... 66
Chapter 5: Coefficient of Thermal Expansion of Bridge Deck Concrete ............................... 68
5.1 Introduction ..................................................................................................................... 68
5.2 Experimental Testing Program ....................................................................................... 68
5.3 Sample Identification ...................................................................................................... 69
5.4 Coefficient of Thermal Expansion Equipment ................................................................ 70
5.4.1 Circulator ............................................................................................................... 70
5.4.2 Linear Variable Differential Transformer Readout ................................................ 71
5.4.3 Linear Variable Differential Transformer ............................................................... 71
5.4.4 External Water Tank .............................................................................................. 73
5.4.5 Thermistor Reader ................................................................................................ 73
5.4.6 Thermistor Probes ................................................................................................. 74
5.4.7 Frames .................................................................................................................. 74
5.4.8 Assembly of the Components for the AASHTO TP 60 (2004) Test ...................... 75
5.5 Laboratory Procedures ................................................................................................... 76
5.5.1 Batching and Mixing .............................................................................................. 76
5.5.2 Assessment of Fresh Concrete Properties ........................................................... 77
5.5.3 Sample Preparation ............................................................................................... 77
5.5.4 Assessment of Hardened Concrete Properties ..................................................... 78

v
5.6 Raw Materials Used ....................................................................................................... 80
5.6.1 Aggregates ............................................................................................................ 80
5.6.2 Chemical Admixtures ............................................................................................ 82
5.6.3 Cementitious Materials .......................................................................................... 82
5.7 Presentation and Discussion of Results ......................................................................... 83
5.7.1 Coefficient of Thermal Expansion Results ............................................................ 83
5.7.2 Statistical Analysis and Inferences from CTE test results ..................................... 85
5.7.3 Comparison of Results with those Published in Literature .................................... 85
5.8 Chapter Conclusions ...................................................................................................... 86
Chapter 6: Analytical Evaluation of Bridge Deck Cracking .................................................... 88
6.1 Introduction ..................................................................................................................... 88
6.1.1 Chapter Objectives and Research Methodology ................................................... 88
6.2 Development of Finite-Element Model ........................................................................... 89
6.2.1 Review of the US 331 Bridge ................................................................................ 89
6.2.2 Model Characteristics ............................................................................................ 90
6.2.3 Results and Analysis of Results ............................................................................ 98
6.3 Parametric Study .......................................................................................................... 108
6.3.1 Effect of Skew ..................................................................................................... 108
6.3.2 Effect of Differential Support Settlement ............................................................. 117
6.4 Smeared crack concrete model .................................................................................... 134
6.4.1 Smeared Crack Description ................................................................................ 134
6.4.2 Concrete Material Modeling ................................................................................ 135
6.4.3 Results and Analysis of Results for Smeared Crack Bridge Model .................... 136
6.5 Summary and Conclusions .......................................................................................... 142
6.5.1 Summary ............................................................................................................. 142
6.5.2 Conclusions ......................................................................................................... 142
Chapter 7: Conclusions and Recommendations ................................................................... 144
7.1 Summary of Work ......................................................................................................... 144
7.2 Conclusions .................................................................................................................. 145
7.3 Recommendations ....................................................................................................... 146
References .............................................................................................................................. 148

vi
LIST OF TABLES
Table 2-1 Heat evolution of Bogue compounds .......................................................................... 9
Table 3-1 Concrete mixture proportions and properties of the US 331 deck ............................ 28
Table 3-2 Concrete fresh properties and placement information for each of the five pours ...... 34
Table 3-3 Concrete compressive strength from molded cylinders for each of the five
pours ...................................................................................................................... 35
Table 3-4 Concrete core compressive strength for each of the five pours ................................ 35
Table 4-1 Concrete mixture proportions and properties ............................................................ 56
Table 4-2 Properties of cementitious materials ......................................................................... 56
Table 4-3 Summary of important values obtained from RCF tests ........................................... 61
Table 5-1 Experimental testing program ................................................................................... 69
Table 5-2 Specifications of an AC-LVDT operated model ......................................................... 72
Table 5-3 Aggregate properties .................................................................................................. 80
Table 5-4 Chemical analysis results from Wyoming Analytical Laboratories............................. 83
Table 5-5 CTE and compressive strength test results at a concrete age of 28 days................. 84
Table 5-6 Average CTE for concretes made with the different coarse aggregates ................... 84
Table 5-7 Summary of p-values and correlation coefficients .................................................... 85
Table 5-8 Coefficient of thermal expansion values for concretes made of common
aggregate types used in the Alabama Concrete Industry....................................... 87
Table 6-1 Finite elements selected for the main bridge components ........................................ 90
Table 6-2 Material properties of the US 331 bridge model ........................................................ 93
Table 6-3 Validation results for concrete deck stresses ............................................................ 97
Table 6-4 Combinations of support settlement conditions for parametric study ..................... 118
Table 6-5 Concrete material properties ................................................................................... 136

vii
LIST OF FIGURES
Figure 1-1 Core holes through cracks in the US 331 bridge deck ............................................. 1
Figure 1-2 Surveyed crack pattern on northbound lanes of the US 331 bridge deck ............... 2
Figure 1-3 View of the northbound lanes of the US 331 bridge deck ........................................ 2
Figure 1-4 Cores from the US 331 deck with vertical and horizontal cracks ............................. 3
Figure 1-5 Core from deck on US 331 opened along a horizontal crack .................................. 3
Figure 1-6 Core from CRC pavement in Texas with vertical and horizontal cracks .................. 4
Figure 2-1 Heat evolution of hydrating cement .......................................................................... 8
Figure 2-2 Total temperature rise and rate of temperature rise for Class C fly ash ................ 10
Figure 2-3 Total temperature rise and rate of temperature rise for Class F fly ash ................ 10
Figure 2-4 Total temperature rise and rate of temperature rise using slag cement ................ 11
Figure 2-5 Typical plot of penetration resistance versus time for concrete at various
temperatures .......................................................................................................... 12
Figure 2-6 Effect of cement type on concrete strength ........................................................... 13
Figure 2-7 Effect of curing temperature on concrete strength ................................................. 13
Figure 2-8 Effect of aggregates on modulus of elasticity ........................................................ 15
Figure 2-9 Development of early-age thermal stresses .......................................................... 17
Figure 2-10 Influence of aggregate on the coefficient of thermal expansion of the
hardened concrete ................................................................................................. 18
Figure 2-11 Schematic of CTE measuring frame (AASHTO TP 60 2004) ................................. 19
Figure 2-12 Volume reduction due to autogenous shrinkage .................................................... 21
Figure 2-13 Evolution of temperature and thermal stresses for different restraint
conditions ............................................................................................................... 22
Figure 2-14 Generalized creep behavior of hardening concrete ............................................... 23
Figure 3-1 View of the northbound roadway bridge over the CSXT railroad on US 331.......... 25
Figure 3-2 Plan view and section of the US 331 bridge ........................................................... 26
Figure 3-3 Typical intermediate crossframe diaphragm detail ................................................ 27
Figure 3-4 Partial section of the bridge at intermediate crossframe location .......................... 28
Figure 3-5 Bridge deck placement schedule during the summer of 2003 ............................... 29
Figure 3-6 Cores from the US 331 deck with vertical and horizontal cracks ........................... 30
Figure 3-7 Cores from the US 331 deck with vertical and horizontal cracks ........................... 30
Figure 3-8 Cores from the US 331 deck with vertical and horizontal cracks ........................... 31
Figure 3-9 Core from deck on US 331 opened along a horizontal crack ................................ 32
Figure 3-10 Surveyed crack pattern in all pours of the US 331 bridge deck ............................. 32
Figure 3-11 Hypothesized impact of inadequate curing on the tensile strength profile ............. 36
Figure 3-12 : Group of nine cores removed for splitting tensile testing ..................................... 37

viii
Figure 3-13 Splitting tensile strength distribution of Pour C and D of the US 331 deck ............ 38
Figure 3-14 Core from CRC pavement in Texas with vertical and horizontal cracks ................ 41
Figure 3-15 Contribution of nonlinear temperature and drying shrinkage stresses to
produce horizontal cracking ................................................................................... 42
Figure 3-16 Concrete and air temperatures recorded at South College Street Bridge
crossing over I-85 ................................................................................................... 43
Figure 3-17 Configuration of temperature sensors used to measure the gradients after
concrete placement................................................................................................. 44
Figure 3-18 Contribution of temperature distributions to produce horizontal cracking............... 44
Figure 3-19 View of the bridge deck on SR 49 over SCL RR in Lineville .................................. 46
Figure 3-20 Pictures of the bridge deck on SR 49 over SCL RR in Lineville ............................ 47
Figure 3-21 View of the bridge deck on the Courtland Bypass over Norfolk Southern RR ....... 48
Figure 3-22 Picture of the wide surface cracks on the bridge deck on the Courtland
Bypass .................................................................................................................... 48
Figure 3-23 Pictures of the core hole on the bridge deck on the Courtland Bypass ................. 49
Figure 3-24 View of the bridge deck on SR 216 over L&N RR ................................................. 50
Figure 3-25 Picture of some surface cracks on the bridge deck on SR 216 over L&N RR ....... 50
Figure 3-26 View of the bridge deck on SR 21 over CSXT Railroad at Tunnel Springs ........... 51
Figure 3-27 Picture of a wide surface crack on the SR 21 bridge deck at Tunnel Springs ....... 51
Figure 3-28 Pictures of the core hole on the bridge deck on SR 21 at Tunnel Springs ............ 52
Figure 3-29 View of the bridge deck on US 98 over ICG RR West of Wilmer .......................... 52
Figure 3-30 Picture of the surface cracking on the US 98 bridge deck ..................................... 53
Figure 4-1 Rigid cracking frame test setup .............................................................................. 57
Figure 4-2 Free shrinkage frame test setup ............................................................................. 59
Figure 4-3 Measured results for the control mixture placed under summer, fall and
winter placement conditions ................................................................................... 62
Figure 4-4 Measured results for the control and SCM mixtures placed under summer
conditions ............................................................................................................... 64
Figure 4-5 Measured results for the control and SCM mixtures .............................................. 65
Figure 4-6 Measured results for Control and 0.36 Mixtures placed under summer and
fall conditions ......................................................................................................... 67
Figure 5-1 Coefficient of thermal expansion test setup ........................................................... 68
Figure 5-2 Circulator used for temperature control .................................................................. 71
Figure 5-3 Thermistor display and MP2000 Readout .............................................................. 72
Figure 5-4 Typical linear variable differential transformer ....................................................... 72
Figure 5-5 LVDT connected to a micrometer screw gage ....................................................... 73
Figure 5-6 External water tank ................................................................................................. 73
Figure 5-7 Thermistor probe .................................................................................................... 74
Figure 5-8 Manufactured Invar frame ...................................................................................... 75

ix
Figure 5-9 AASHTO TP 60 (2004) test setup .......................................................................... 75
Figure 5-10 External water bath for the two Invar frames containing concrete samples .......... 76
Figure 5-11 Concrete mixing room ............................................................................................ 77
Figure 5-12 Typical tested samples ready to be discarded ....................................................... 78
Figure 5-13 Stainless steel samples used in determining the correction factor ........................ 79
Figure 5-14a Gradation test results for Martin Marietta No. 67 Siliceous River Gravel .............. 80
Figure 5-14b Gradation test results for Vulcan Materials No. 67 Dolomitic Limestone ............... 81
Figure 5-14c Gradation test test results for Florida Rock Industry No. 67 Granite ..................... 81
Figure 5-14d Gradation test results for Martin Marietta, Shorter Siliceous Sand ........................ 82
Figure 5-15 Comparison of results from Auburn University with those of FHWA ..................... 86
Figure 6-1 Three-dimensional finite-element model of US 331 bridge .................................... 91
Figure 6-2 Close-up view of bridge model with element types indicated ................................ 91
Figure 6-3 Boundary conditions for the US 331 bridge model ................................................ 94
Figure 6-4 Interaction modeling at the piers ............................................................................ 95
Figure 6-5 Cross section of composite beam validation model ............................................... 96
Figure 6-6 Longitudinal stresses from the top and bottom deck surfaces ............................... 97
Figure 6-7 Deformed shape of the US 331 bridge deck under external loading ..................... 98
Figure 6-8: Detail view of maximum principal stress distribution at the top of the deck for
US 331 bridge, α = 61° (psi) ................................................................................ 100
Figure 6-9: Detail view of maximum principal stress distribution at the bottom of the deck
for US 331 bridge, α = 61° (psi) ........................................................................... 101
Figure 6-10: Full view of maximum principal stress distribution at the top of the deck for
US 331 bridge, α = 61° (psi) ................................................................................ 102
Figure 6-11: Full view of maximum principal stress distribution at the bottom of the deck
for US 331 bridge, α = 61° (psi) ........................................................................... 103
Figure 6-12: Cracked zone at the top of the deck for the US 331 bridge, α = 61° ................... 105
Figure 6-13: Cracked zone at the bottom of the deck for the US 331 bridge, α = 61° ............. 106
Figure 6-14: Normal direction of cracks (black lines) at top of deck, US 331 bridge, α =
61° ........................................................................................................................ 107
Figure 6-15: Maximum principal stress distribution at top of 0°-skewed deck (psi) ................. 109
Figure 6-16: Cracking zone at top of 0°-skewed deck .............................................................. 110
Figure 6-17: Maximum principal stress distribution at top of 30°-skewed deck (psi) ............... 111
Figure 6-18: Cracking zone at top of 30°-skewed deck ............................................................ 112
Figure 6-19: Normal direction of cracking (black lines) at top of 30°-skewed deck .................. 113
Figure 6-20: Maximum principal stress distribution at top of 45°-skewed deck (psi) ............... 114
Figure 6-21: Cracking zone at top of 45°-skewed deck ............................................................ 115
Figure 6-22: Normal direction of cracking (black lines) at top of 45°-skewed deck .................. 116
Figure 6-23: Deck cracking information at the southern-most intermediate support for
various skew angles ............................................................................................. 117

x
Figure 6-24: Locations of supports A, B, C, and D ................................................................... 118
Figure 6-25: Deformed shape for Case 1 ................................................................................. 118
Figure 6-26: Maximum principal stress distribution at top of deck for Case 1 (psi), α = 61° .... 119
Figure 6-27: Cracking zone at top of deck for Case 1, α = 61° ................................................ 120
Figure 6-28: Normal direction of cracking (black lines) at top of deck for Case 1, α = 61° ...... 121
Figure 6-29: Deformed shape for Case 2 ................................................................................. 122
Figure 6-30: Maximum principal stress distribution at top of deck for Case 2 (psi), α = 61° .... 123
Figure 6-31: Cracking zone at top of deck for Case 2, α = 61° ................................................ 124
Figure 6-32: Normal direction of cracking (black lines) at top deck for Case 2, α = 61° .......... 125
Figure 6-33: Deformed shape for Case3 .................................................................................. 126
Figure 6-34: Maximum principal stress distribution at top of deck for Case 3 (psi), α = 61° .... 127
Figure 6-35: Cracking zone at top of deck for Case 3, α = 61° ................................................ 128
Figure 6-36: Normal direction of cracking (black lines) at top deck for Case 3, α = 61° .......... 129
Figure 6-37: Deformed shape for Case 4 ................................................................................. 130
Figure 6-38: Maximum principal stress distribution at top of deck for Case 4 (psi), α = 61° .... 131
Figure 6-39: Cracking zone at top of deck for Case 4, α = 61° ................................................ 132
Figure 6-40: Normal direction of cracking (black lines) at top deck for Case 4, α = 61° .......... 133
Figure 6-41: Tensile stress-strain relationship for concrete in ABAQUS (adapted from
ABAQUS ............................................................................................................. 135
Figure 6-42: Maximum principal stress distribution at top of deck for smeared crack
concrete model of US 331 bridge, α = 61° ........................................................... 137
Figure 6-43: Maximum principal strain distribution at top of deck for smeared crack
concrete model of US 331 bridge, α = 61° ........................................................... 138
Figure 6-44: Configuration of section points ............................................................................. 140
Figure 6-45: Cracking zone at top of deck for smeared crack concrete model of US 331 ....... 141
1
Chapter 1
Introduction
1.1 BACKGROUND
The focus of this investigation was a three-span, continuous, skewed bridge that was constructed
in the summer of 2003 as the northbound roadway bridge over the CSXT railroad on US 331
between Legrand and Montgomery at Station 946 + 40.7085 in Montgomery County, Alabama.
This bridge deck exhibited extensive transverse and horizontal cracking and was replaced in May
2005 before being opened to traffic. Examples of the cored locations at some crack locations are
shown in Figure 1-1 and the severe extent of cracking on the surface of the deck is shown in
Figure 1-2. A picture of the bridge deck is shown in Figure 1-3. Mechanisms that contribute to
both transverse and longitudinal cracking in bridge decks have been widely documented (Krauss
and Rogalla 1996; Issa 1999). Excessive amounts of wide surface cracks were initially observed;
however, horizontal cracks were discovered when cores were extracted from the deck. The
horizontal cracks were generally present at the level of the top reinforcement mat; however, in
some cases these cracks developed between the top reinforcement mat and the top concrete
surface. Typical cores that contained both vertical and horizontal cracks are shown in Figure 1-4.
The extent of the horizontal cracking remains unknown; however, of the 26 cores extracted from
the deck, 11 contained horizontal cracks.
Figure 1-1: Core holes through cracks in the US 331 bridge deck

Figure 1-2: Surveyed crack pattern on northbound lanes of the US 331 bridge deck
Figure 1-3: View of the northbound lanes of the US 331 bridge deck
2

3
Figure 1-4: Cores from the US 331 deck with vertical and horizontal cracks
The crack surfaces for one of the horizontal cracks in the bridge on US 331 are shown in Figure
1-5. The majority of the cracks occurred around (rather than through) the aggregates, which may
be an indication that the horizontal cracks could be due to early-age mechanisms. Even if the
horizontal cracks were not caused at an early age the residual stresses induced by large thermal
and drying shrinkage gradients may contribute to cracking at a later age.
Figure 1-5: Core from deck on US 331 opened along a horizontal crack
Bon
d fa
ilure
Agg
rega
te fa
ilure
4
Only one published document by Kim and Won (2004) was found that directly discusses
mechanisms that may cause horizontal cracking in concrete slabs. Many sources (e.g. ACI
201.1R 1997) document the occurrence of horizontal cracking at the reinforcement mat when
corrosion of reinforcement occurs; however, no corrosion was present on the reinforcement of the
US 331 bridge. ALDOT personnel were also unfamiliar with these horizontal cracks and were
interested in determining the possible cause(s) for the observed distresses.
Kim and Won (2004) explain a possible mechanism for the development of horizontal
cracking in continuously reinforced concrete (CRC) pavements. The nature of the horizontal
cracking experienced in a CRC pavement in Texas is shown in Figure 1-6. Some similarities
between the cores obtained from the bridge on US 331 and the CRC pavement from Texas are
evident. The pavements in Texas also revealed that the horizontal cracks occurred around the
coarse aggregate, which is an indication of early-age cracking.
Figure 1-6: Core from CRC pavement in Texas with vertical and horizontal cracks
(Courtesy of Dr. Moon Won)
Kim and Won (2004) provide a mechanism where horizontal cracking is caused by
excessive early-age temperature variations that lead to large shear and normal stresses at the
reinforcement location in highly crack-prone concretes that tend to have a high coefficient of
thermal expansion and high modulus of elasticity. Kim and Won (2004) conclude that the
occurrence of horizontal cracking can be minimized by the following means:
Not placing concrete when the daily temperature differential is significantly large,
Effectively curing the concrete to avoid high early-age drying shrinkage, and
Selecting a coarse aggregate type to avoid a high concrete thermal expansion
coefficient and a high elastic modulus of concrete.

5
The bridge deck on US 331 was constructed during June and July of 2003 (months when
large temperature gradients would be expected) and contained river gravel coarse aggregate.
Cores were tested from the US 331 bridge and the average compressive strength was 6,095 psi
and the average modulus of elasticity was 4,500 ksi. The specified design strength for the bridge
deck was 4,000 psi. Based on the commonly used ACI 318 relationship, the design modulus of
elasticity for the concrete could be expected to be approximately 000,457 = 3600 ksi. It is thus
clear that the characteristics of the concrete mixture used for the bridge deck did not conform to
most of the criteria highlighted by Kim and Won (2004) to minimize the likely formation of
horizontal cracks. Based on the forensic evidence collected on the US 331 bridge, the primary
failure mechanisms appear to be related to a mixture that is sensitive to cracking, the presence of
large thermal gradients, and a high degree of restraint in the continuous bridge deck; however,
additional mechanisms will be further evaluated in the report.
1.2 PROJECT OBJECTIVES
The main objectives of this project are as follows:
Evaluate the mechanism that has caused horizontal cracking in the US 331 bridge deck,
Determine the extent of horizontal cracking in other bridge decks in Alabama,
Evaluate the early-age cracking sensitivity of bridge deck mixtures,
Evaluate the coefficient of thermal expansion of various bridge deck concrete mixtures,
Analytically evaluate the stress development in bridge decks with geometry similar to the
US 331 bridge, and
Develop recommendations for ALDOT to mitigate the occurrence of horizontal cracking in
bridge decks.
1.3 REPORT OUTLINE
Early-age concrete behavior and the mechanisms that contribute to early-age cracking
causes are reviewed in Chapter 2. The discussion includes a description of the hydration of
cementitious materials, the development of mechanical properties, factors that produce early-age
volume change, the coefficient of thermal expansion, early-age creep behavior, and methods to
determine early-age stresses.
A review of the US 331 bridge deck, its cracking, all data collected for the bridge, and the
mechanisms that more likely contributed to the observed distress are presented in Chapter 3.
Additional bridge decks in Alabama were visited to investigate the extent of horizontal cracking in
other bridge decks in the state and the findings from these visits are presented at the end of
Chapter 3.

6
The cracking tendency of Alabama concretes made with various supplementary
cementing materials and water-cement ratios (w/c) placed under different conditions is assessed
in Chapter 4. This was accomplished by testing five concrete mixtures under various, controlled
temperature conditions, while measuring the stress development from concrete placement until
onset of cracking in rigid cracking frames.
The coefficient of thermal expansion values of Alabama concretes made with various
coarse aggregate types and volumes, water-cement ratios, and sand-aggregate ratios are
assessed in Chapter 5. All testing was done in accordance with AASHTO TP60 (2004), which
was the only available AASHTO or ASTM test available to determine the CTE at the time that this
study was completed.
The work document Chapter 6 focuses on using finite-element analysis techniques to
gain an understanding of the mechanisms by which excessive cracks might have formed on the
US 331 bridge deck. A finite-element model of the US 331 bridge was created and used to
numerically predict the stress distribution and cracking behavior of the deck. A parametric study
is presented to evaluate the effect of bridge skew angle and differential support settlement on the
predicted crack patterns.
Conclusions and recommendations resulting from the work documented in this report are
presented in Chapter 7.

7
Chapter 2
Literature Review
Early-age cracking in bridge deck concrete is a severe problem that can reduce its functional life.
Cracking originates from stresses induced by volume change because of thermal, drying,
autogenous, and chemical shrinkage, coupled with restraint conditions that prevent movement of
the concrete. These stresses develop due to strains induced by early-age volume change as the
concrete stiffness increases. Over time, these stresses may exceed the tensile strength of the
concrete, which will result in cracking. Early-age concrete behavior and the mechanisms that
contribute to early-age cracking causes are reviewed in this chapter. The discussion includes a
description of the hydration of cementitious materials, the development of mechanical properties,
factors that produce early-age volume change, the coefficient of thermal expansion, early-age
creep behavior, and methods to determine early-age stresses.
2.1 HYDRATION OF CEMENTITIOUS MATERIALS
The hydration of portland cement is a chemical reaction during which heat is liberated. Many
variables affect the heat generated during this hydration process. Factors such as cement
composition, cement fineness, mixture proportions, replacement of cement by supplementary
cementing materials (SCMs), and curing temperature can increase or decrease the rate of heat
generated during hydration (Mehta and Monteiro 2006). Excessive heat generated, coupled with
non-uniform cooling, results in thermal gradients in the concrete elements. This uneven
distribution of heat can lead to thermal deformations which, when restrained, can introduce
cracking long before the structure is exposed to externally applied loads.
2.1.1 Cement Type
The composition of cement is a major contributor to heat of hydration. Variables such as
chemical composition and fineness affect the temperature rise of concrete. Some of these
factors can be varied as a technique for controlling temperature, while others must be accepted
as given conditions.

8
2.1.1.1 Cement Composition
The chemical composition of the clinker compounds consists primarily of tricalcium silicate (C3S),
dicalcium silicate (C2S), tricalcium aluminate (C3A), and tetracalcium aluminoferrite (C4AF), which
are commonly referred to as Bogue compounds. The relative proportions of these chemical
compounds and their fineness determine the different types of cement, as well as the amount of
heat they generate during hydration (Bjøntegaard 1999; Mehta and Monteiro 2006).
The hydration of cement is a mixture of simultaneous and consecutive reactions
(Bjøntegaard 1999). When the cement is dispersed in water, C3A, the high-temperature
compound of calcium, begins to go into solution and the liquid phase is rapidly saturated with
various ionic species. Needle-shaped crystals of Ettringite (calcium trisulfoaluminate hydrate), is
the first hydration product to be formed by the reaction of C3A with water. The reaction of C3A is
followed by the hydration of C3S. Finally, C3A and C4AF react simultaneously after C3S (Mindess,
Young, and Darwin 2002).
The heat evolution of cement as it hydrates is shown in Figure 2-1. The initial reaction
(Phase I) is caused by the reaction of C3A forming ettringite. This process is very fast and a
dormant period follows. After the dormant period, the second heat peak (II) is exhibited by the
hydration of C3S. The last heat peak (III) is produced by the transformation of ettringite to
monosulfate (Bjøntegaard 1999).
Figure 2-1: Heat evolution of hydrating cement (Bjøntegaard 1999)
Typical heat evolution values and rate of reactions for four primary chemical compounds
in a Type I cement are shown in Table 2-1. Type I cement is the standard cement and is most
commonly used in general construction applications in the United States (ACI 116R 1997). Type
II and IV cements are low-heat generating cements during early ages, due to relatively low C3A
and high C4AF content (Townsend 1965). Type III cement is high early-age strength cement, due
to high C3A content and fineness, which generates much more heat during hydration than Type I,
II, or IV cements.

9
Table 2-1: Heat evolution of Bogue compounds (Bogue 1929)
Compound Heat evolution after complete hydration (J/g)
Rate of reaction with water
C3S 500 "medium"
C2S 260 "slow"
C3A 866 "fast"
C4AF 125 "medium"
2.1.1.2 Fineness
Cement fineness affects the rate of heat generation rather than the magnitude of heat generation
(ACI 207.2R 1997). The greater the fineness, the more surface area the cement is exposed to
react with the water, and higher is the rate of hydration.
2.1.2 Mixture Proportions
The rate and magnitude of heat generation are affected by the quantity of cement used (ACI
207.2R 1997). This is due to the quantity of reactive products that are available to hydrate and
liberate heat. The higher the cementitious materials content, the greater the temperature rise
potential.
2.1.3 Replacement of Cement with Supplementary Cementing Materials
To reduce the amount of heat liberated during the hydration of cement, some SCMs can be used
as a replacement for portland cement. SCMs such as fly ash and slag cement (a.k.a. ground
granulated blast furnace slag) have been found to be effective means of reducing the quantity of
cement, therefore reducing the heat due to hydration (ACI 207.2R 1997). Springenschmid and
Breitenbücher (1998) stated that it is current practice to reduce the cement content as much as
possible in order to reduce heat development.
2.1.3.1 Fly Ash
Fly ash comes from many different sources. The calcium oxide (CaO) content of the fly ash can
be used as an indicator of its cementitious nature (Schindler and Folliard 2005). Class C fly ash
is classified as fly ash containing more than 20% of CaO. Class F fly ash contains less than 15%
CaO (ACI 232.2R 1997). Class F fly ash is generally more pozzolanic in nature as compared to
Class C fly ash, which is more cementitious. Therefore, Class F fly ash reduces the total heat of
hydration more than Class C (Mehta and Monteiro 2006). The reduction in heat liberation due to

10
0
10
20
30
40
50
1 10 100Concrete age (hours)
Ad
iaba
tic T
empe
ratu
re R
ise
(°C
) Type I Cement
15% Class C fly ash
25% Class C fly ash
35% Class C fly ash
0
10
20
30
40
50
1 10 100Concrete age (hours)
Adi
ab
atic
Te
mp
era
ture
Ris
e (
°C) Type I Cement
15% Class F fly ash
25% Class F fly ash
35% Class F fly ash
hydration of cementitious systems containing fly ash and cement-only systems are shown in
Figures 2-2 and 2-3.
0
1
2
3
4
5
0 6 12 18 24Concrete age (hours)
Ra
te o
f Ad
iab
atic
Te
mpe
ratu
re R
ise
(°C
/hr) Type I Cement
15% Class C fly ash
25% C fly ash
35% C fly ash
Figure 2-2: Total temperature rise and rate of temperature rise using Class C fly ash as a
replacement for portland cement (Schindler and Folliard 2005)
0
1
2
3
4
5
0 6 12 18 24Concrete age (hours)
Rat
e of
Adi
abat
ic T
empe
ratu
re R
ise
(°C
/hr)
Type I Cement
15% Class F fly ash
25% F fly ash
35% F fly ash
Figure 2-3: Total temperature rise and rate of temperature rise using Class F fly ash as a
replacement for portland cement (Schindler and Folliard 2005)
2.1.3.2 Slag Cement
The reduction of early-age heat generation is directly proportional to the slag cement quantity
used (ACI 233R 1997). The peak rate of temperature rise is delayed due to the inclusion of slag
cement (Sioulas and Sanjayan 2000; Schindler and Folliard 2005), as seen in Figure 2-4.
11
0
10
20
30
40
50
1 10 100Concrete age (hours)
Adi
abat
ic T
empe
ratu
re R
ise
(°C
)
Type I Cement
30% GGBF Slag
50% GGBF Slag
0
1
2
3
4
5
0 6 12 18 24Concrete age (hours)
Rat
e of
Adi
abat
ic T
empe
ratu
re R
ise
(°C
/hr)
Type I Cement
30% GGBF Slag
50% GGBF Slag
Figure 2-4: Total temperature rise and rate of temperature rise using slag cement as a
replacement for portland cement (Schindler and Folliard 2005)
2.1.4 Curing Temperature
The curing temperature has a direct influence on the rate of hydration. If the curing temperature
is increased, then the rate of hydration is increased. As the placement temperatures increases,
the rate of temperature development rises faster due to the acceleration of hydration.
2.2 SETTING OF CONCRETE
Setting is the change in the concrete from a fluid to a rigid state. It is caused by the sufficient
formation of hydration products, which is accompanied by a sudden change in temperature rise in
the concrete (Mehta and Monteiro 2006). According to ASTM C 403, initial set is achieved when
the concrete paste has reached a penetration resistance of 500 psi. Final set is achieved when
the concrete paste has reached a penetration resistance of 4,000 psi. Plots of penetration
resistance over time, like the one shown in Figure 2-5, is used to determine initial and final set.
2.3 DEVELOPMENT OF MECHANICAL PROPERTIES
Cracking in early-age concrete is not just a function of stress development. Cracking is also a
function of mechanical properties such as tensile strength and elastic modulus. These properties
are time- and temperature-dependent. The modulus of elasticity relates strains to stresses, and
will be discussed in Section 2.3.3. The tensile strength of the concrete resists the stresses from
restrained contraction of the concrete and will be discussed in Section 2.3.2.

12
Figure 2-5: Typical plot of penetration resistance versus time for concrete at various
temperatures (Dobson 1994)
2.3.1 Compressive Strength
The development of compressive strength in concrete has been widely studied for many years.
Factors such as amount and type of cement and admixtures, temperature, curing conditions, and
water-to-cementitious materials ratio affect the development of concrete strength (Mehta and
Monteiro 2006).
As discussed in Section 2.1, cement type and amount may affect the amount of heat
developed in the concrete member. Temperature affects the rate at which the cement hydrates.
Therefore, early-age and long-term strength can be affected due to changes in these mixture
proportions. Variables such as water-to-cementitious ratio (w/cm), air entrainment, and cement
type can be varied to increase or decrease strength. As the w/cm is increased, the compressive
strength is decreased (Kosmatka et al. 2002). The decrease in the compressive strength will
occur as the total air content of the mixture increases (Kosmatka et al. 2002). The effect of
cement type on concrete strength is shown in Figure 2-6. As discussed in Section 2.1.1.1, Types
II and IV have low early-age strength due to lower C3A content. However, Type III cement has
high early-age strength due to higher C3A content.
The curing temperature also affects the rate at which the cement hydrates as discussed
in Section 2.1.4. As the curing temperature is increased, the cement hydrates more rapidly. As a
result, the concrete develops mechanical properties at a faster pace; however, the long-term
strengths are reduced as shown in Figure 2-7.

13
Figure 2-6: Effect of cement type on concrete strength (Kosmatka et al. 2002)
Figure 2-7: Effect of curing temperature on concrete strength (Kosmatka et al. 2002)

14
2.3.2 Tensile Strength
Tensile strength of concrete develops due to the same factors as compressive strength;
however, concrete’s tensile strength is much lower than its compressive strength, due to ease of
crack propagation under tensile loads (Mindess, Young, and Darwin 2002). The rate of
development and magnitude of the tensile strength play an important role in early-age cracking.
Microcracking originates in the interfacial transition zone (ITZ), and cracking develops as
load is applied. The ITZ develops from a water film that forms around large aggregate particles
as bleeding occurs. As hydration progresses, calcium silicate hydrate (C-S-H) forms to fill the
empty voids left behind from the water film. This helps to improve the strength and density of the
ITZ (Mehta and Monteiro 2006).
The ITZ is the strength-limiting phase in concrete (Mehta and Monteiro 2006). This is
primarily due to the microcracking that can be present in the ITZ before the structure is loaded. It
is also the reason why concrete displays inelastic behavior, while its constituents exhibit elastic
behavior until fracture.
Aggregate characteristics influence the tensile strength of concrete (Mehta and Monteiro
2006). Aggregate texture has a substantial impact on the tensile strength of concrete. Rough
textured or crushed aggregates have shown higher tensile strengths, especially at early ages,
than smoother aggregates (Mehta and Monteiro 2006).
2.3.3 Modulus of Elasticity
The development of the elastic modulus of concrete varies in proportion to the square root of the
compressive strength gain in concrete (ACI 318 2005). The same factors that alter the
development of strength affect the development of the elastic modulus, with some exceptions.
The modulus of elasticity is affected primarily by the aggregate type and quantity used in the
concrete mixture (Mindess, Young, and Darwin 2002). As the stiffness and amount of the
aggregate fraction in concrete increases, the stiffness of the concrete increases, as shown in
Figure 2-8.
The modulus of elasticity is also a function of the porosity of the paste fraction of the
concrete. As the water-to-cementitious materials ratio is increased, the porosity of the paste
fraction is increased. If the porosity is increased, the elastic modulus will decrease (Mindess,
Young, and Darwin 2002).

15
Figure 2-8: Effect of aggregates on modulus of elasticity (Mindess, Young, and Darwin 2002)
2.4 FACTORS THAT PRODUCE EARLY-AGE VOLUME CHANGE
Early-age volume change in concrete is a well-known phenomenon that has been studied for
many years. Factors such as thermal changes, drying shrinkage, and autogenous shrinkage are
known to produce early-age volume change. If the concrete is restrained from movement, the
volume changes will induce compressive or tensile stresses. If these stresses are greater than
the corresponding strength of the concrete, then cracking may occur as was the case in the US
331 bridge deck. In this section, the various factors that contribute to early-age volume changes
are discussed.
2.4.1 Thermal Effects
Thermal stresses have been a major cause of early-age cracking of bridge deck concrete (Lange
and Altoubat 2002). Many factors such as heat of hydration (as discussed previously),
environmental conditions (weather and time of placement) and thermal conductivity affect the rate
of temperature rise. Concrete, like many other materials, expands when it is heated and
contracts when it is cooled. If the concrete is restrained from movement, the change in
temperature will induce stresses.

16
The development of thermal stresses (T) can be calculated by the expression presented in
Equation 2-1. For an accurate estimate of the thermal stress, creep effects during early ages and
over the structure’s life should be accounted for in Equation 2-1 (Schindler and McCullough
2002).
Thermal Stress = T = T CTE·Ec·Kr Equation 2-1
Where, T = Temperature Change = Tzero-stress - Tmin (F),
CTE = Coefficient of Thermal Expansion (strain/F),
Ec = Creep adjusted Modulus of Elasticity (psi),
Kr = Degree of restraint factor,
Tzero-stress = Concrete zero-stress temperature (F), and
Tmin = Minimum concrete temperature (F).
An illustration of the development of concrete temperatures and thermal stresses over
time under summer placement conditions for freshly placed concrete is presented in Figure 2-9.
In terms of stress development, the final-set temperature is the temperature at which the concrete
begins to resist stresses induced by restraint of external volume changes. In Figure 2-9, it can be
seen that due to hydration the concrete temperature increases beyond the setting temperature,
line (A). As the expansion of the concrete caused by the temperature rise is restrained, the
concrete will be in compression when the temperature peaks, line (B), is reached. The
phenomenon of gradual decrease in stress over time is called stress relaxation (Mehta and
Monteiro 2006). When the peak temperature is reached the hydrating paste is still developing
structure, its strength is low, and high amounts of early-age relaxation may occur when the
concrete is subjected to high compression loads (6). When the concrete temperature decreases,
the compressive stress is gradually relieved until the stress condition changes from compression
to tension, line (C). The temperature at which this transient stress-free condition occurs is
denoted the “zero-stress temperature”. Note that due to the effects of relaxation, the zero-stress
temperature may be significantly higher than the final-set temperature (6). If tensile stresses
caused by a further temperature decrease exceed the tensile strength of the concrete, cracking
will occur, line (D). Because the thermal stress is proportional to the difference between the zero-
stress temperature and the cracking temperature, thermal cracking can be minimized by
decreasing the zero-stress temperature. This in turn can be accomplished by (1) minimizing the
final-set temperature, (2) minimizing the peak temperature achieved during the high-relaxation
phase, or (3) delaying the attainment of the peak temperature. The test setup employed in
Chapter 4 of this study restrains concrete specimens to assess the development of thermal
stresses (and autogenous effects) in typical bridge deck curing conditions.

17
Tcrack
TimeT
empe
ratu
re
Stre
ss o
r St
reng
th
Ten
sion
Com
p.
Time
Tzero-stress
tfs
Tfinal-set
tzs
Tensile Strength
Concrete
Air
Pla
cem
ent B CA D
Stress
Cra
ckin
g
Tcrack
TimeT
empe
ratu
re
Stre
ss o
r St
reng
th
Ten
sion
Com
p.
Time
Tzero-stress
tfs
Tfinal-set
tzs
Tensile Strength
Concrete
Air
Pla
cem
ent B CA D
Stress
Cra
ckin
g
Figure 2-9: Development of early-age thermal stresses (Schindler and McCullough 2002)
However, it is to be noted that there is a significant difference between calculated stress
due to the given temperature change, and the actual measured stress. This is due to the
viscoelastic nature of the concrete at early ages, which allows much of the compressive stresses
to be relaxed. However, due to the relaxation, concrete experiences tensile stresses much earlier
than the calculated, and hence a higher risk of cracking at an earlier age than predicted.
2.4.1.1 Coefficient of Thermal Expansion
The coefficient of thermal expansion (CTE) is a key parameter that relates temperature change in
the concrete to strain. As indicated in Equation 2-2, the magnitude of strain developed in an
unrestrained specimen, is directly proportional to the temperature change and the CTE.
CTETThermal Equation 2-2
where,
∆εThermal = change in concrete strain due to temperature change (in./in.), and
∆T = change in temperature (°F).
The CTE varies as a function of the individual constituents of the concrete (Emanuel and Hulsey
1977). Variables such as aggregate type, water-to-cementitious materials ratio, and age affect
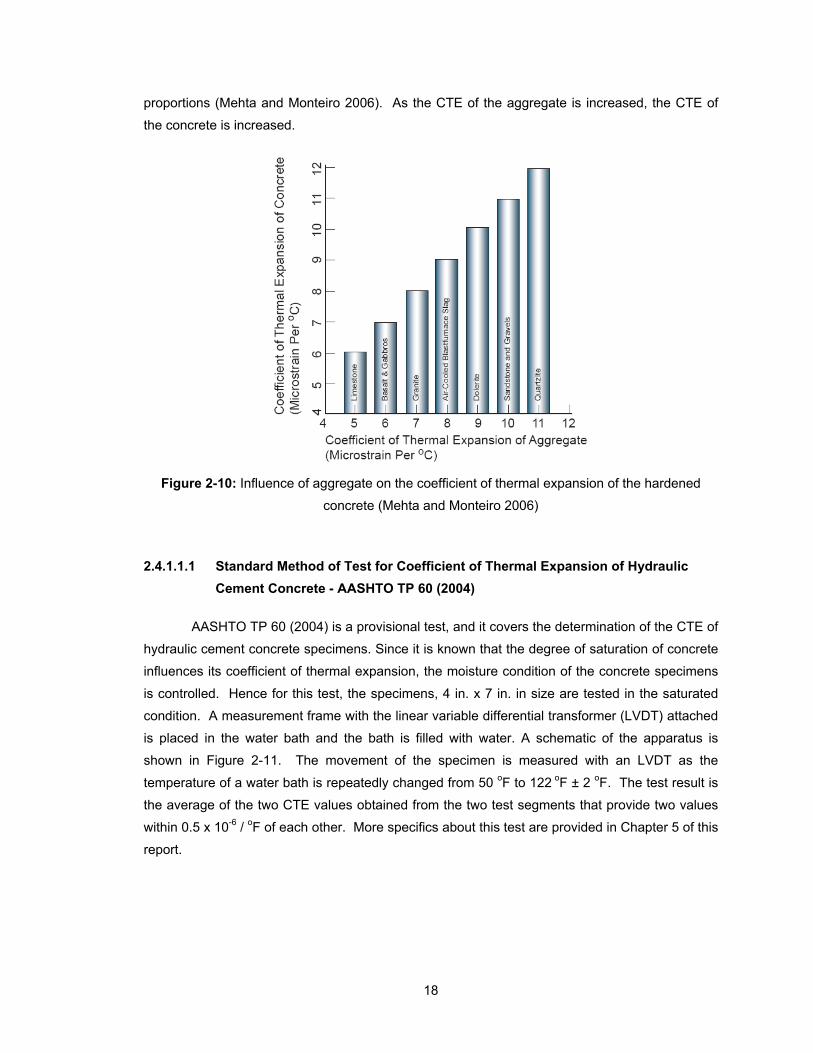
concrete’s CTE. Changes in concrete’s CTE due to the use of different aggregates can be seen
in Figure 2-10. Concrete’s CTE is directly related to the CTE of the aggregate used in the mixture
18
proportions (Mehta and Monteiro 2006). As the CTE of the aggregate is increased, the CTE of
the concrete is increased.
Figure 2-10: Influence of aggregate on the coefficient of thermal expansion of the hardened
concrete (Mehta and Monteiro 2006)
2.4.1.1.1 Standard Method of Test for Coefficient of Thermal Expansion of Hydraulic
Cement Concrete - AASHTO TP 60 (2004)
AASHTO TP 60 (2004) is a provisional test, and it covers the determination of the CTE of
hydraulic cement concrete specimens. Since it is known that the degree of saturation of concrete
influences its coefficient of thermal expansion, the moisture condition of the concrete specimens
is controlled. Hence for this test, the specimens, 4 in. x 7 in. in size are tested in the saturated
condition. A measurement frame with the linear variable differential transformer (LVDT) attached
is placed in the water bath and the bath is filled with water. A schematic of the apparatus is
shown in Figure 2-11. The movement of the specimen is measured with an LVDT as the
temperature of a water bath is repeatedly changed from 50 oF to 122 oF ± 2 oF. The test result is
the average of the two CTE values obtained from the two test segments that provide two values
within 0.5 x 10⁻⁶ / oF of each other. More specifics about this test are provided in Chapter 5 of this
report.

19
Figure 2-11: Schematic of CTE measuring frame (AASHTO TP 60 2004)
2.4.1.2 Environmental Conditions
Bridges are continuously subjected to changing temperatures, therefore, a significant factor in the
behavior and performance is thermal loading due to environmental factors. Thermal stresses
induced from seasonal temperatures changes, are linearly proportional (not accounting for
relaxation effects) to the differences between material thermal expansion coefficients and
differences between concrete stiffness of various elements in the bridge. Through the study
conducted by NCHRP Report 380 (Krauss and Rogalla 1996), it is now known that the diurnal
temperature changes affect the bridge deck more than the supporting girders and the resulting
thermal stresses are proportional to the coefficient of thermal expansion. However, usually,
temperature changes are not taken into consideration during design because temperature steel is
considered sufficient to control widths after cracking.
When a deck is cast monolithically with the girders, thermal stresses caused by hydration
are generally reduced because both the deck and girders generate heat and then cool at the
same time. However, thermal stresses are worse in steel-girder bridges (Krauss and Rogalla
1996). Bridge decks in moderate or extreme climates often experience high stresses due to
temperature changes. The upper surface of the deck typically heats and cools more quickly,

20
because it is exposed to direct solar radiation, wind, and humidity. Hence, these factors have to
be taken into account when determining the thermal effects on early-age cracking.
2.4.2 Early-Age Shrinkage
Concrete shrinkage is a result of the migration or loss of water from the hydrated cement paste
phase. Holt (2001) states that “as water is lost to evaporation (drying shrinkage) or internal
reactions (autogenous shrinkage), tensile stresses are generated.” As a result of a slow elastic
modulus development, large strains may only create small stresses at early ages. However,
these stresses at early-ages are more critical because the concrete has not developed much
strength. Even if the resulting stresses are small, microscopic cracks may still form. If early
cracks are internal and microscopic, long-term shrinkage may cause the cracks to widen and
spread. A discussion of drying shrinkage, autogenous shrinkage, and chemical shrinkage can be
found in Sections 2.4.2.1, 2.4.2.2, and 2.4.2.3, respectively.
2.4.2.1 Drying Shrinkage
Drying shrinkage occurs when water held by hydrostatic tension in small capillary pores (< 50
nm) of the hydrated cement paste is lost to the atmosphere due to differences in relativity
humidity (Mehta and Monteiro 2006). When the voids empty, capillary stresses are generated
that result in volumetric shrinkage of the concrete. It is common practice to delay the onset of
drying shrinkage by curing bridge decks with cotton mats for 7 days or more after placement.
The experimental work in this study was focused on the early-age cracking mechanisms that
occur within the first 7 days after placement. Therefore, the effects of drying shrinkage lie outside
the scope of this report. Nonetheless, drying shrinkage effects will eventually add to thermal and
autogenous shrinkage effects once the deck is exposed to drying.
2.4.2.2 Autogenous Shrinkage
The reaction products formed from cement hydration are smaller that the initial components. The
reduction of the absolute volume of the reactants due to hydration is chemical shrinkage. Before
setting this phenomenon results in a volumetric change but generates no stress due to the
viscoelastic nature of fresh concrete. After setting, chemical shrinkage leads to the creation of
internal water filled voids. As water is consumed by the ongoing hydration process the voids
empty, and capillary stresses are generated resulting in a volumetric shrinkage. Autogenous
shrinkage is the concrete volume change occurring with out moisture transfer to the environment
(JCI 1998). Before setting chemical shrinkage and autogenous shrinkage are equal (Holt 2001).
When the w/c is above 0.42, enough water is provided in the void spaces for hydration, and
stresses associated with autogenous shrinkage do not develop (Mindess, Young, and Darwin
2002). Decreasing the w/c below 0.42 will thus cause to stresses due to autogenous shrinkage.
21
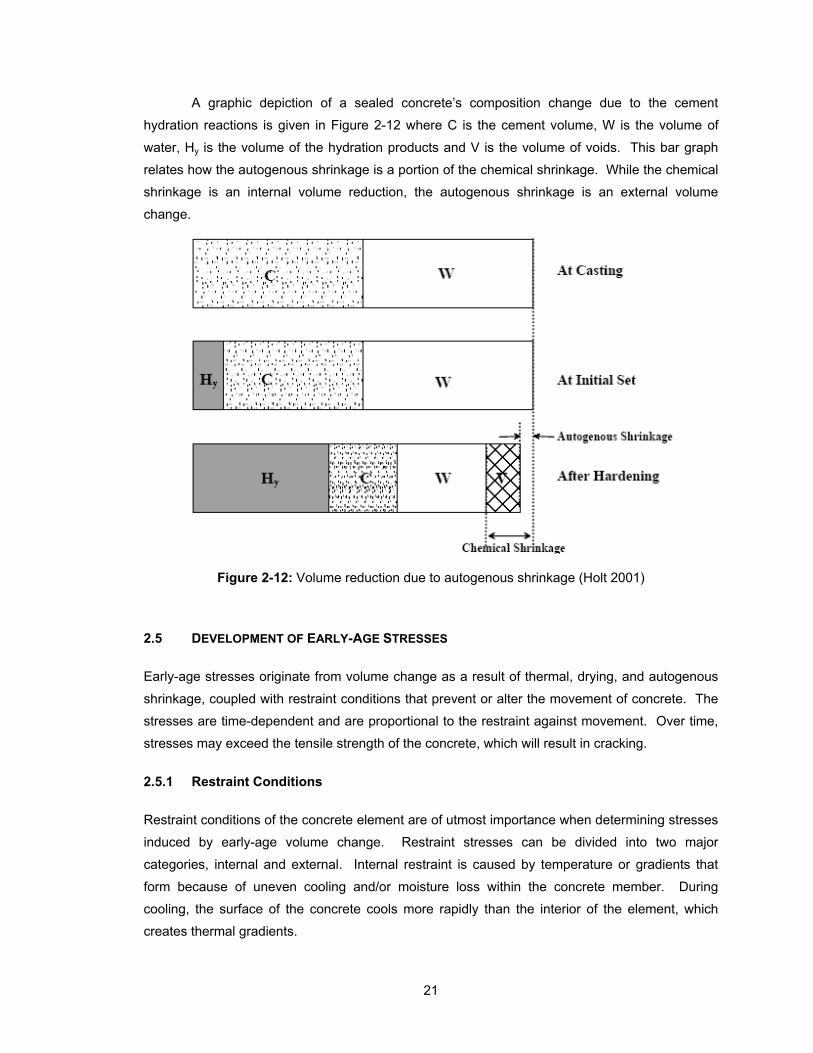
A graphic depiction of a sealed concrete’s composition change due to the cement
hydration reactions is given in Figure 2-12 where C is the cement volume, W is the volume of
water, Hy is the volume of the hydration products and V is the volume of voids. This bar graph
relates how the autogenous shrinkage is a portion of the chemical shrinkage. While the chemical
shrinkage is an internal volume reduction, the autogenous shrinkage is an external volume
change.
Figure 2-12: Volume reduction due to autogenous shrinkage (Holt 2001)
2.5 DEVELOPMENT OF EARLY-AGE STRESSES
Early-age stresses originate from volume change as a result of thermal, drying, and autogenous
shrinkage, coupled with restraint conditions that prevent or alter the movement of concrete. The
stresses are time-dependent and are proportional to the restraint against movement. Over time,
stresses may exceed the tensile strength of the concrete, which will result in cracking.
2.5.1 Restraint Conditions
Restraint conditions of the concrete element are of utmost importance when determining stresses
induced by early-age volume change. Restraint stresses can be divided into two major
categories, internal and external. Internal restraint is caused by temperature or gradients that
form because of uneven cooling and/or moisture loss within the concrete member. During
cooling, the surface of the concrete cools more rapidly than the interior of the element, which
creates thermal gradients.

22
External restraint is caused by the conditions surrounding or supporting the concrete
element that prevents free movement. External restraints associated with bridge decks could
include, but are not limited to deck form type, deck-girder systems, girder type, girder end
constraints, relative stiffness of the girder and the deck. The reduction of the overall restraint of
the concrete member can significantly decrease the cracking tendency. Figure 2-13
demonstrates the temperature, stress, and strength development of a concrete element that is
fully restrained (100%) from movement. As shown, reducing the restraint factor diminishes the
risk of cracking due to the reduction in stresses.
Tem
pera
ture
Time
Time
Str
engt
h/S
tres
s Tensile Strength
Stress at 100% Restraint
Stress at Partial Restraint
Possible Crack
TAVERAGE
a)
b)
Tem
pera
ture
Time
Time
Str
engt
h/S
tres
s Tensile Strength
Stress at 100% Restraint
Stress at Partial Restraint
Possible Crack
TAVERAGE
a)
b)
Figure 2-13: Evolution of temperature and thermal stresses for different restraint conditions
(Nilsson 2003)
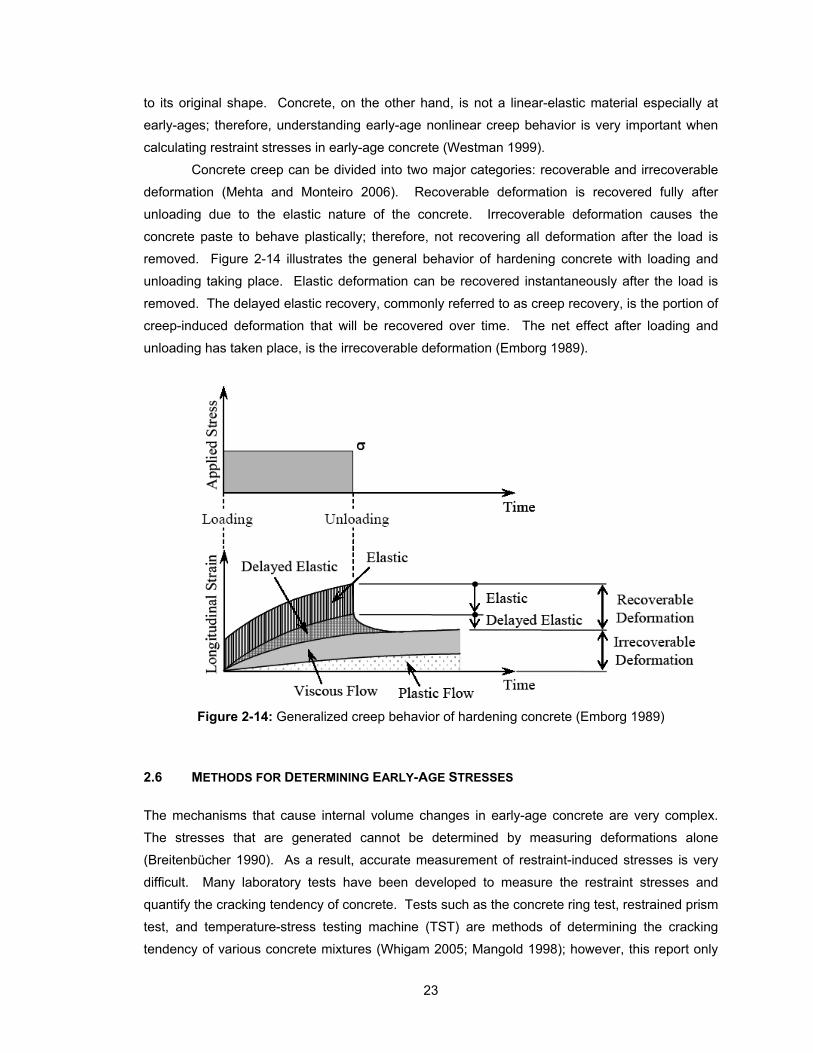
2.5.2 Early-Age Creep Behavior
Early-age concrete undergoes deformations due to volume change as discussed previously.
Restraint of these deformations creates stresses in the concrete. Creep and associated
relaxation occur due to the viscoelastic response of early-age concrete; therefore, these
properties must be considered when assessing the cracking risk of concrete during the first few
days after placement.
Creep is the increase in strain with respect to time under a constant load. If a linear-
elastic material is subjected to a constant load, then it will respond instantaneously with a
deformation that remains constant. However, if the load is removed, then the material will return
23
to its original shape. Concrete, on the other hand, is not a linear-elastic material especially at
early-ages; therefore, understanding early-age nonlinear creep behavior is very important when
calculating restraint stresses in early-age concrete (Westman 1999).
Concrete creep can be divided into two major categories: recoverable and irrecoverable
deformation (Mehta and Monteiro 2006). Recoverable deformation is recovered fully after
unloading due to the elastic nature of the concrete. Irrecoverable deformation causes the
concrete paste to behave plastically; therefore, not recovering all deformation after the load is
removed. Figure 2-14 illustrates the general behavior of hardening concrete with loading and
unloading taking place. Elastic deformation can be recovered instantaneously after the load is
removed. The delayed elastic recovery, commonly referred to as creep recovery, is the portion of
creep-induced deformation that will be recovered over time. The net effect after loading and
unloading has taken place, is the irrecoverable deformation (Emborg 1989).
Figure 2-14: Generalized creep behavior of hardening concrete (Emborg 1989)
2.6 METHODS FOR DETERMINING EARLY-AGE STRESSES
The mechanisms that cause internal volume changes in early-age concrete are very complex.
The stresses that are generated cannot be determined by measuring deformations alone
(Breitenbücher 1990). As a result, accurate measurement of restraint-induced stresses is very
difficult. Many laboratory tests have been developed to measure the restraint stresses and
quantify the cracking tendency of concrete. Tests such as the concrete ring test, restrained prism
test, and temperature-stress testing machine (TST) are methods of determining the cracking
tendency of various concrete mixtures (Whigam 2005; Mangold 1998); however, this report only
24
involves the use of the rigid cracking frame as a testing method, as used by Meadows (2007).
Since many of the mechanisms that affect cracking at early ages are quite complicated at
early ages, it is proposed to evaluate the effect of these mechanisms by using cracking frame
testing techniques.
2.7 CONCLUDING REMARKS
Cracking in concrete due to early-age volume change is a complex phenomenon and is caused
by many variables. Effects such as thermal, drying, and autogenous shrinkage, coupled with
restraint conditions, create stresses that can exceed the tensile strength of the concrete. In order
to understand the mechanisms driving early-age cracking, the effect of various variables should
be should be studied. Quantification of these variables can be an extremely hard task,
particularly at early ages, therefore making prediction of cracking tendencies very difficult. A
practical way to assess the effect of these variables is to perform restrained cracking tests such
as those performed with the rigid cracking frame used in Chapter 4 of this report.
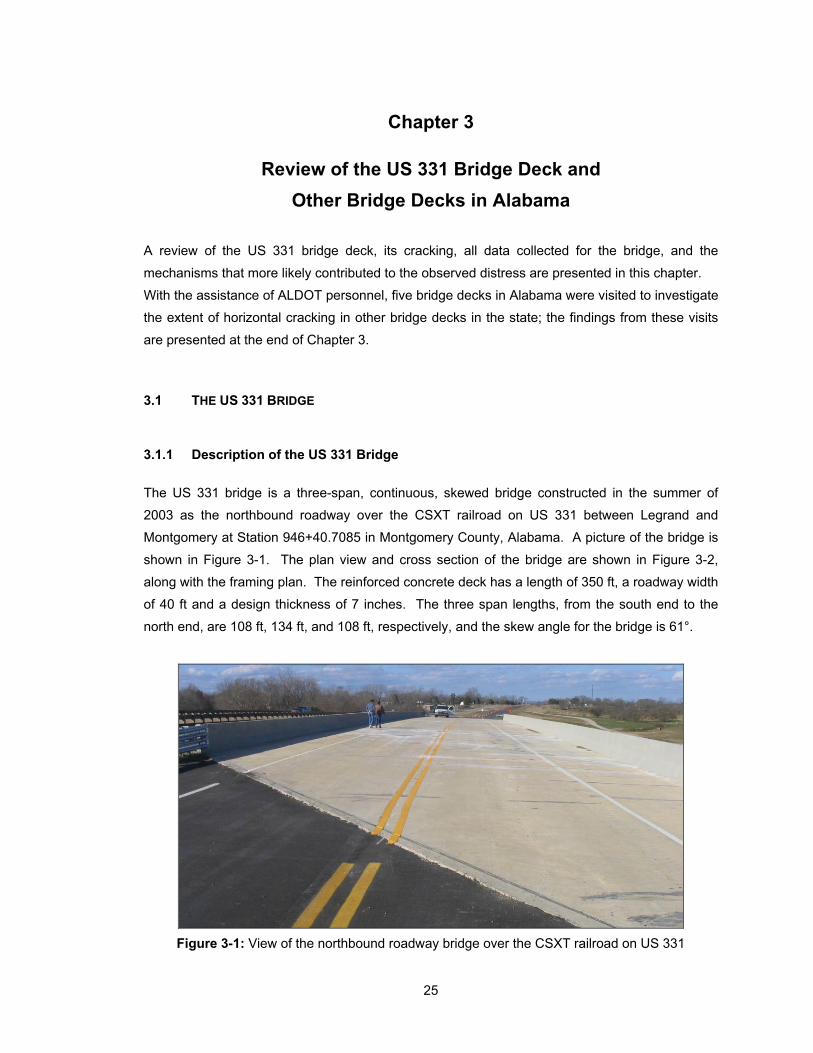
25
Chapter 3
Review of the US 331 Bridge Deck and
Other Bridge Decks in Alabama
A review of the US 331 bridge deck, its cracking, all data collected for the bridge, and the
mechanisms that more likely contributed to the observed distress are presented in this chapter.
With the assistance of ALDOT personnel, five bridge decks in Alabama were visited to investigate
the extent of horizontal cracking in other bridge decks in the state; the findings from these visits
are presented at the end of Chapter 3.
3.1 THE US 331 BRIDGE
3.1.1 Description of the US 331 Bridge
The US 331 bridge is a three-span, continuous, skewed bridge constructed in the summer of
2003 as the northbound roadway over the CSXT railroad on US 331 between Legrand and
Montgomery at Station 946+40.7085 in Montgomery County, Alabama. A picture of the bridge is
shown in Figure 3-1. The plan view and cross section of the bridge are shown in Figure 3-2,
along with the framing plan. The reinforced concrete deck has a length of 350 ft, a roadway width
of 40 ft and a design thickness of 7 inches. The three span lengths, from the south end to the
north end, are 108 ft, 134 ft, and 108 ft, respectively, and the skew angle for the bridge is 61°.
Figure 3-1: View of the northbound roadway bridge over the CSXT railroad on US 331
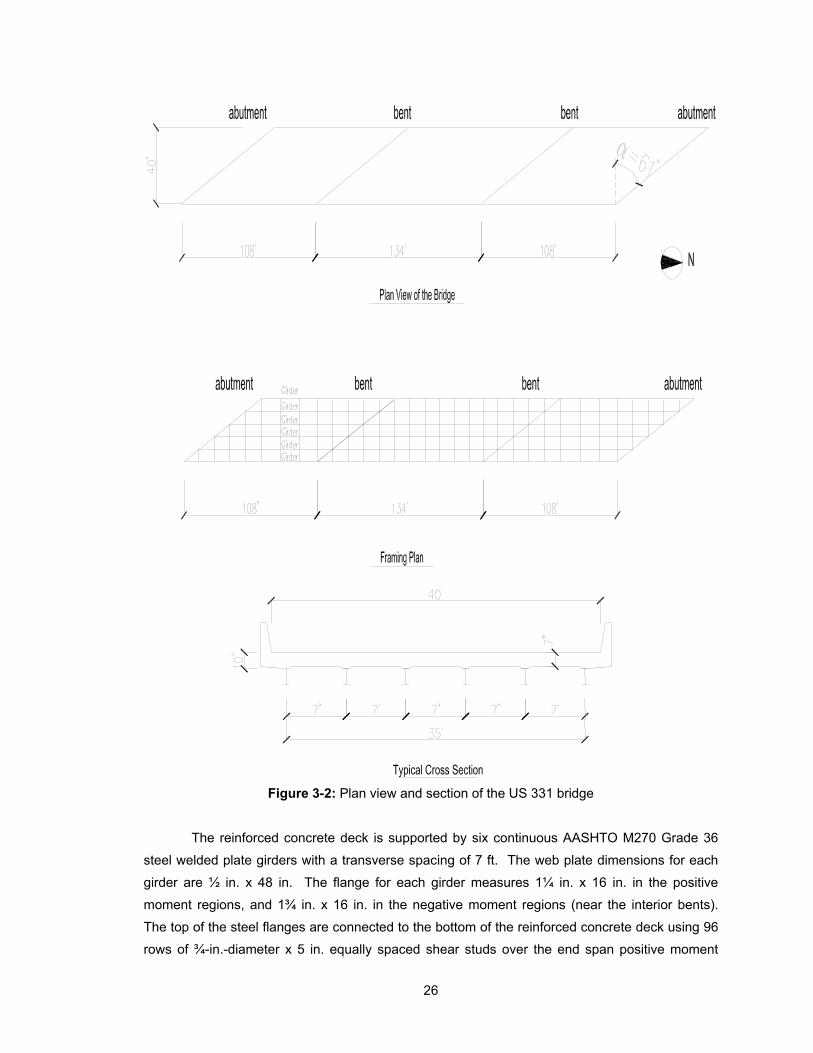
26
Figure 3-2: Plan view and section of the US 331 bridge
The reinforced concrete deck is supported by six continuous AASHTO M270 Grade 36
steel welded plate girders with a transverse spacing of 7 ft. The web plate dimensions for each
girder are ½ in. x 48 in. The flange for each girder measures 1¼ in. x 16 in. in the positive
moment regions, and 1¾ in. x 16 in. in the negative moment regions (near the interior bents).
The top of the steel flanges are connected to the bottom of the reinforced concrete deck using 96
rows of ¾-in.-diameter x 5 in. equally spaced shear studs over the end span positive moment
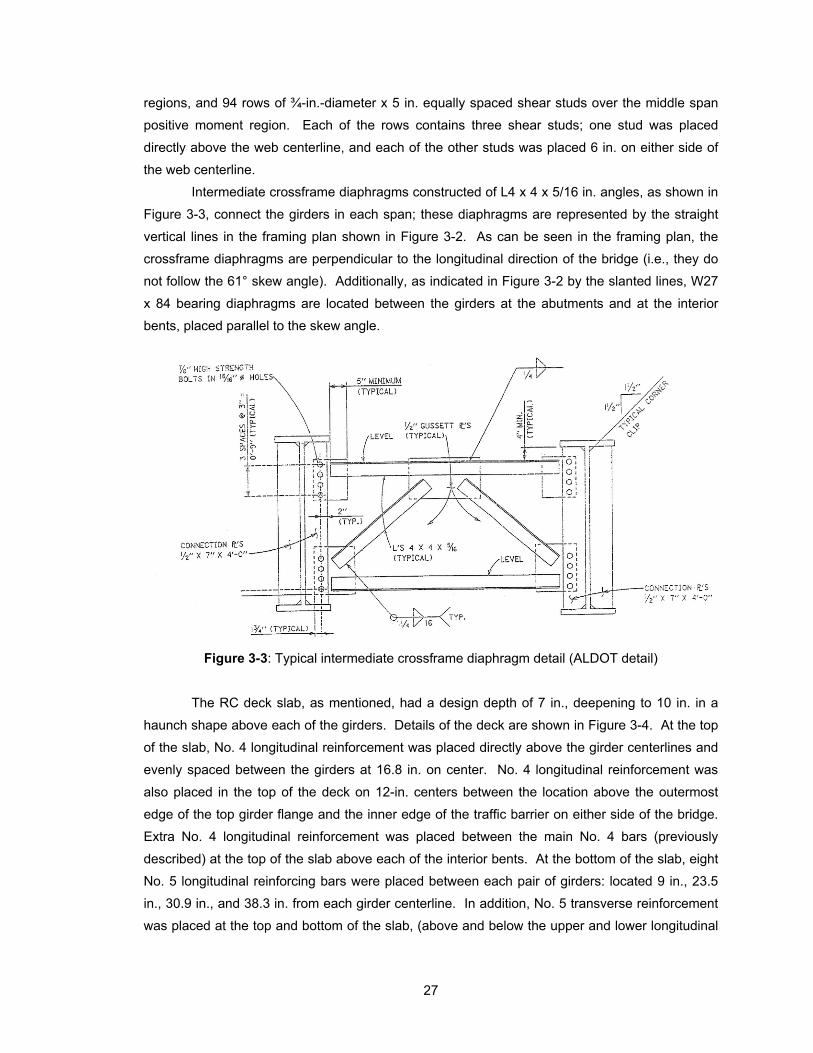
27
regions, and 94 rows of ¾-in.-diameter x 5 in. equally spaced shear studs over the middle span
positive moment region. Each of the rows contains three shear studs; one stud was placed
directly above the web centerline, and each of the other studs was placed 6 in. on either side of
the web centerline.
Intermediate crossframe diaphragms constructed of L4 x 4 x 5/16 in. angles, as shown in
Figure 3-3, connect the girders in each span; these diaphragms are represented by the straight
vertical lines in the framing plan shown in Figure 3-2. As can be seen in the framing plan, the
crossframe diaphragms are perpendicular to the longitudinal direction of the bridge (i.e., they do
not follow the 61° skew angle). Additionally, as indicated in Figure 3-2 by the slanted lines, W27
x 84 bearing diaphragms are located between the girders at the abutments and at the interior
bents, placed parallel to the skew angle.
Figure 3-3: Typical intermediate crossframe diaphragm detail (ALDOT detail)
The RC deck slab, as mentioned, had a design depth of 7 in., deepening to 10 in. in a
haunch shape above each of the girders. Details of the deck are shown in Figure 3-4. At the top
of the slab, No. 4 longitudinal reinforcement was placed directly above the girder centerlines and
evenly spaced between the girders at 16.8 in. on center. No. 4 longitudinal reinforcement was
also placed in the top of the deck on 12-in. centers between the location above the outermost
edge of the top girder flange and the inner edge of the traffic barrier on either side of the bridge.
Extra No. 4 longitudinal reinforcement was placed between the main No. 4 bars (previously
described) at the top of the slab above each of the interior bents. At the bottom of the slab, eight
No. 5 longitudinal reinforcing bars were placed between each pair of girders: located 9 in., 23.5
in., 30.9 in., and 38.3 in. from each girder centerline. In addition, No. 5 transverse reinforcement
was placed at the top and bottom of the slab, (above and below the upper and lower longitudinal
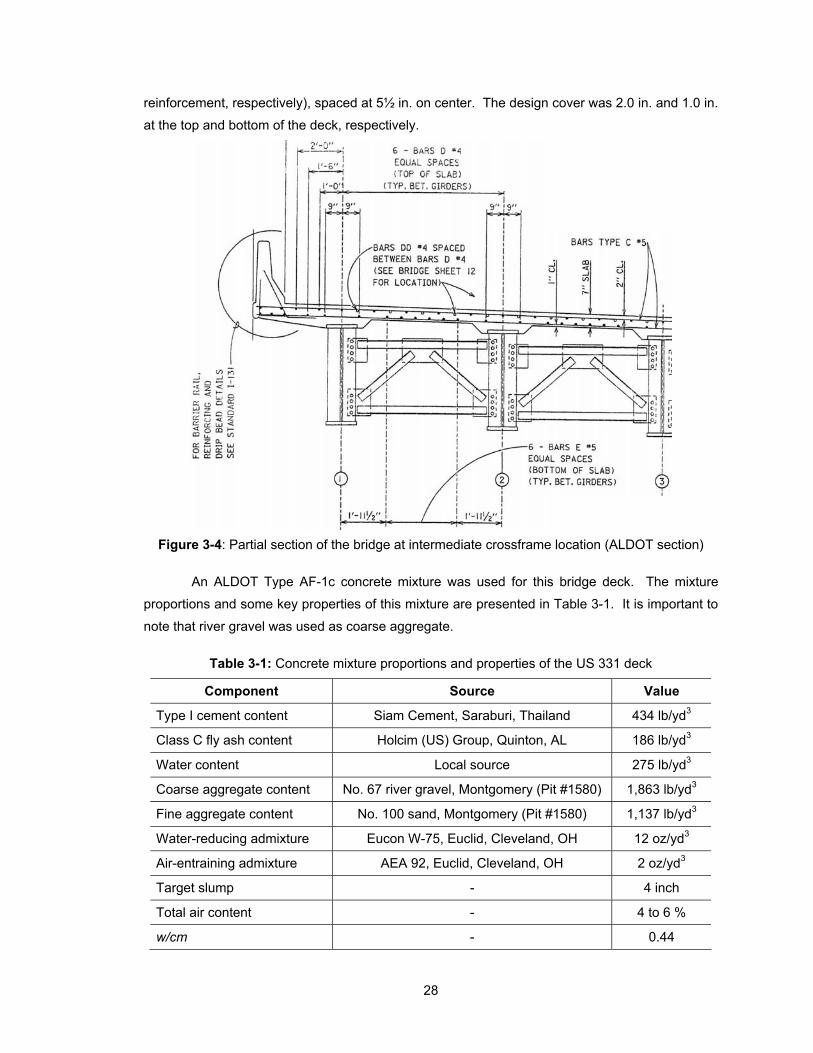
28
reinforcement, respectively), spaced at 5½ in. on center. The design cover was 2.0 in. and 1.0 in.
at the top and bottom of the deck, respectively.
Figure 3-4: Partial section of the bridge at intermediate crossframe location (ALDOT section)
An ALDOT Type AF-1c concrete mixture was used for this bridge deck. The mixture
proportions and some key properties of this mixture are presented in Table 3-1. It is important to
note that river gravel was used as coarse aggregate.
Table 3-1: Concrete mixture proportions and properties of the US 331 deck
Component Source Value
Type I cement content Siam Cement, Saraburi, Thailand 434 lb/yd3
Class C fly ash content Holcim (US) Group, Quinton, AL 186 lb/yd3
Water content Local source 275 lb/yd3
Coarse aggregate content No. 67 river gravel, Montgomery (Pit #1580) 1,863 lb/yd3
Fine aggregate content No. 100 sand, Montgomery (Pit #1580) 1,137 lb/yd3
Water-reducing admixture Eucon W-75, Euclid, Cleveland, OH 12 oz/yd3
Air-entraining admixture AEA 92, Euclid, Cleveland, OH 2 oz/yd3
Target slump - 4 inch
Total air content - 4 to 6 %
w/cm - 0.44

29
The bridge deck was cast in five placements in 2003 as shown in Figure 3-5. First, 80 ft
of the end spans were cast on the south side and the north side of the bridge (Pours A and B).
Next, an 80-ft portion was cast in the middle of the bridge (Pour C). Finally, the two remaining
54-ft sections above the interior bents were placed (Pours D and E). The girders were unshored
during construction.
108 ft 108 ft134 ft
40
ft
rao
dw
ay
June 25 July 18 July 16 July 10July 22
N.B.R
Figure 3-5: Bridge deck placement schedule during the summer of 2003
3.1.2 Cracking of the US 331 Bridge Deck
This bridge deck was placed from June to July 2003; however, since it was part of a roadway still
under construction, it was not open to traffic. In the fall of 2004, it was noticed that the surface of
this deck exhibited extensive cracking. Some of the cracks in Pour A were repaired with epoxy
injection; however, because of the extent of the cracking further investigations were begun.
ALDOT’s Materials and Test Bureau investigated the cracking and discovered the
presence of various horizontal cracks when coring the bridge deck. The horizontal cracks were
generally present at the level of the top reinforcement mat; however, in some cores these cracks
also occurred between the top reinforcement mat and the deck surface. Typical cores that
contained both vertical and horizontal cracks are shown in Figures 3-6 to 3-8. Some of the
apparent severe distress at horizontal crack locations was caused by the coring operation, as the
cores had a tendency to spin at the location of a horizontal crack, e.g. bottom of both cores in
Figure 3-8. The services of a consultant to perform ground penetrating radar surveys were
considered, but were not used due to resource limitations. The extent of the horizontal cracking
remains unknown; however, of the 26 cores extracted from the deck, 11 contained horizontal
cracks. The number of cores found in each concrete placement section with horizontal cracks
was as follows:
Pour A: two cores,
Pour D: two cores,
Pour C: one core,
Pour E: two cores, and
Pour B: four cores.

30
Figure 3-6: Cores from the US 331 deck with vertical and horizontal cracks
Figure 3-7: Cores from the US 331 deck with vertical and horizontal cracks
The nature of the concrete surface at a horizontal crack is shown in Figure 3-9. In this
figure, it is clear that bond and aggregate failures occurred at this crack surface.
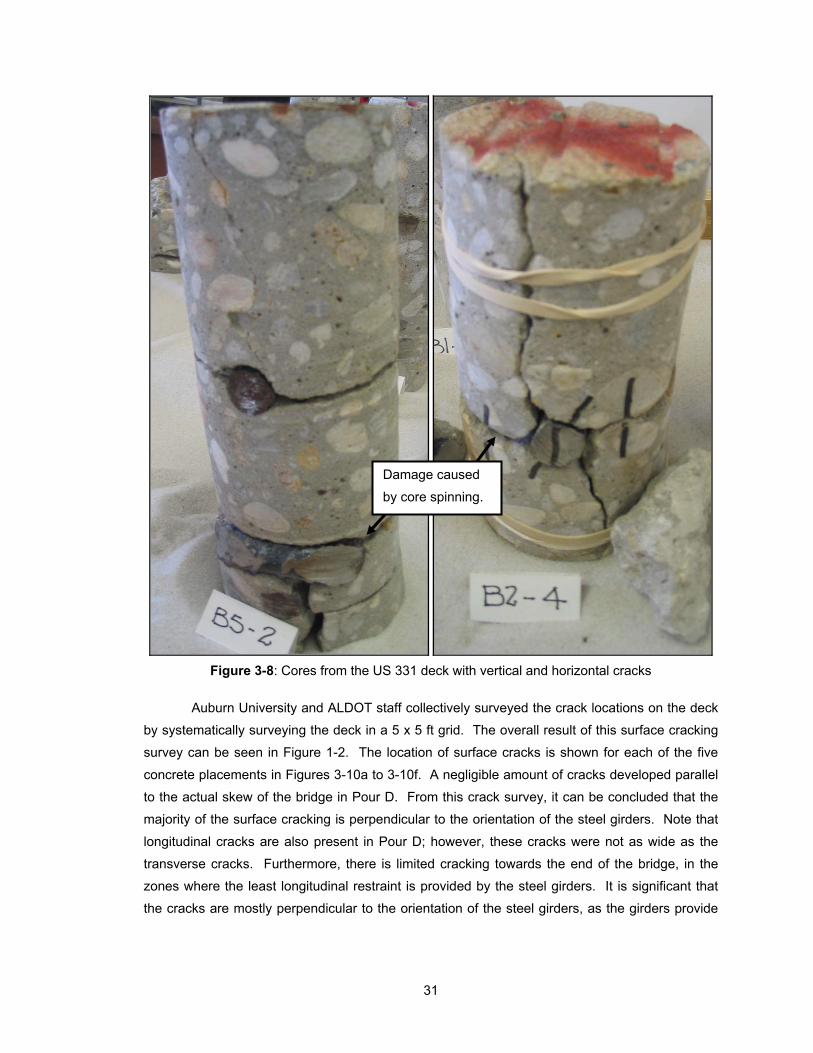
31
Figure 3-8: Cores from the US 331 deck with vertical and horizontal cracks
Auburn University and ALDOT staff collectively surveyed the crack locations on the deck
by systematically surveying the deck in a 5 x 5 ft grid. The overall result of this surface cracking
survey can be seen in Figure 1-2. The location of surface cracks is shown for each of the five
concrete placements in Figures 3-10a to 3-10f. A negligible amount of cracks developed parallel
to the actual skew of the bridge in Pour D. From this crack survey, it can be concluded that the
majority of the surface cracking is perpendicular to the orientation of the steel girders. Note that
longitudinal cracks are also present in Pour D; however, these cracks were not as wide as the
transverse cracks. Furthermore, there is limited cracking towards the end of the bridge, in the
zones where the least longitudinal restraint is provided by the steel girders. It is significant that
the cracks are mostly perpendicular to the orientation of the steel girders, as the girders provide
Damage caused
by core spinning.
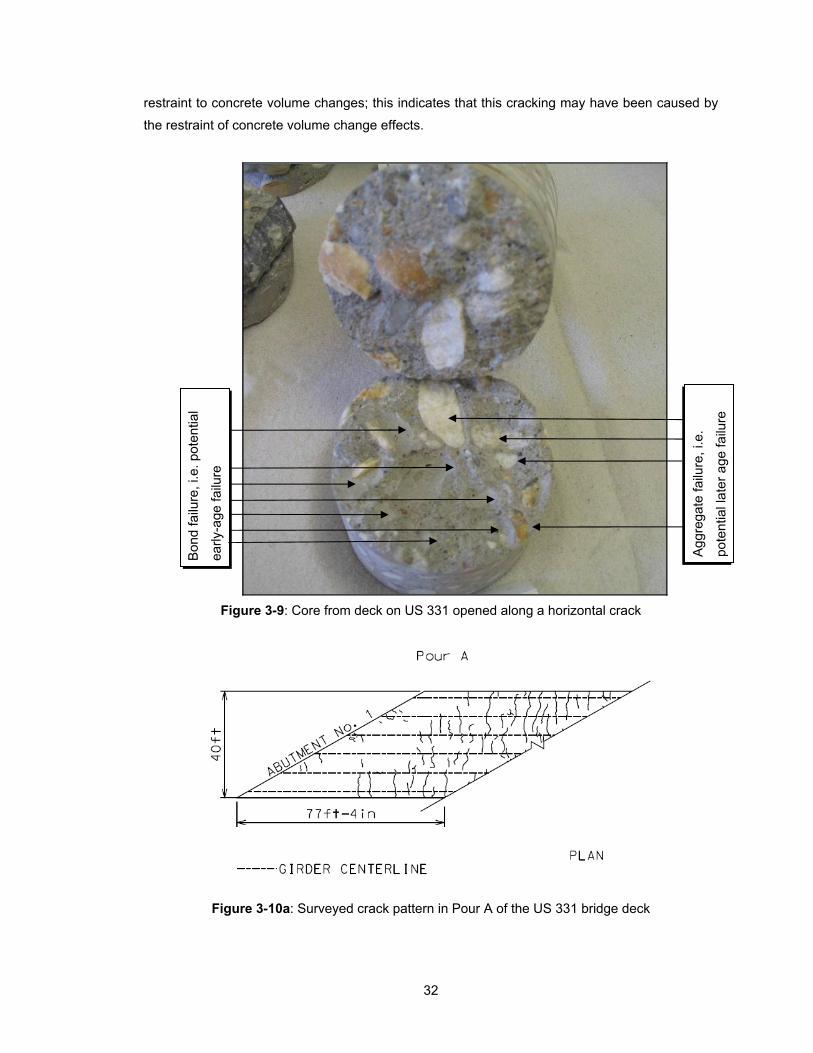
32
restraint to concrete volume changes; this indicates that this cracking may have been caused by
the restraint of concrete volume change effects.
Figure 3-9: Core from deck on US 331 opened along a horizontal crack
Figure 3-10a: Surveyed crack pattern in Pour A of the US 331 bridge deck
Bon
d fa
ilure
, i.e
. pot
entia
l
early
-age
failu
re
Agg
rega
te fa
ilure
, i.e
.
pote
ntia
l lat
er a
ge fa
ilure
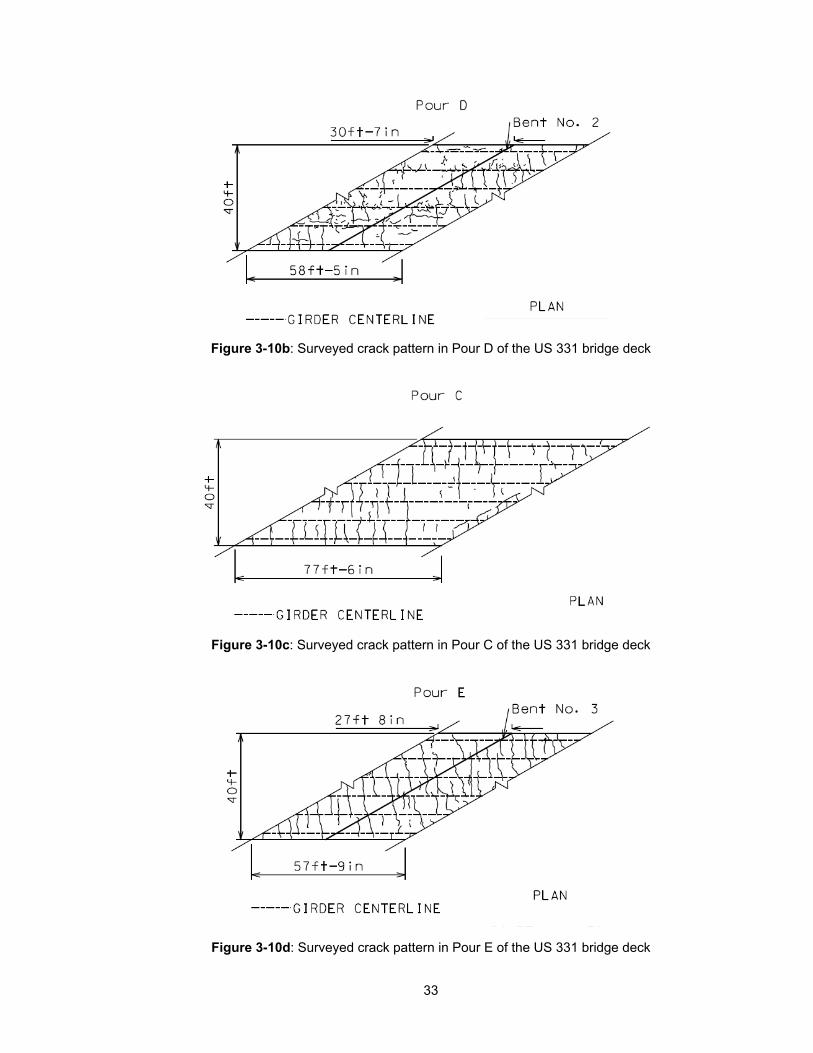
33
Figure 3-10b: Surveyed crack pattern in Pour D of the US 331 bridge deck
Figure 3-10c: Surveyed crack pattern in Pour C of the US 331 bridge deck
Figure 3-10d: Surveyed crack pattern in Pour E of the US 331 bridge deck
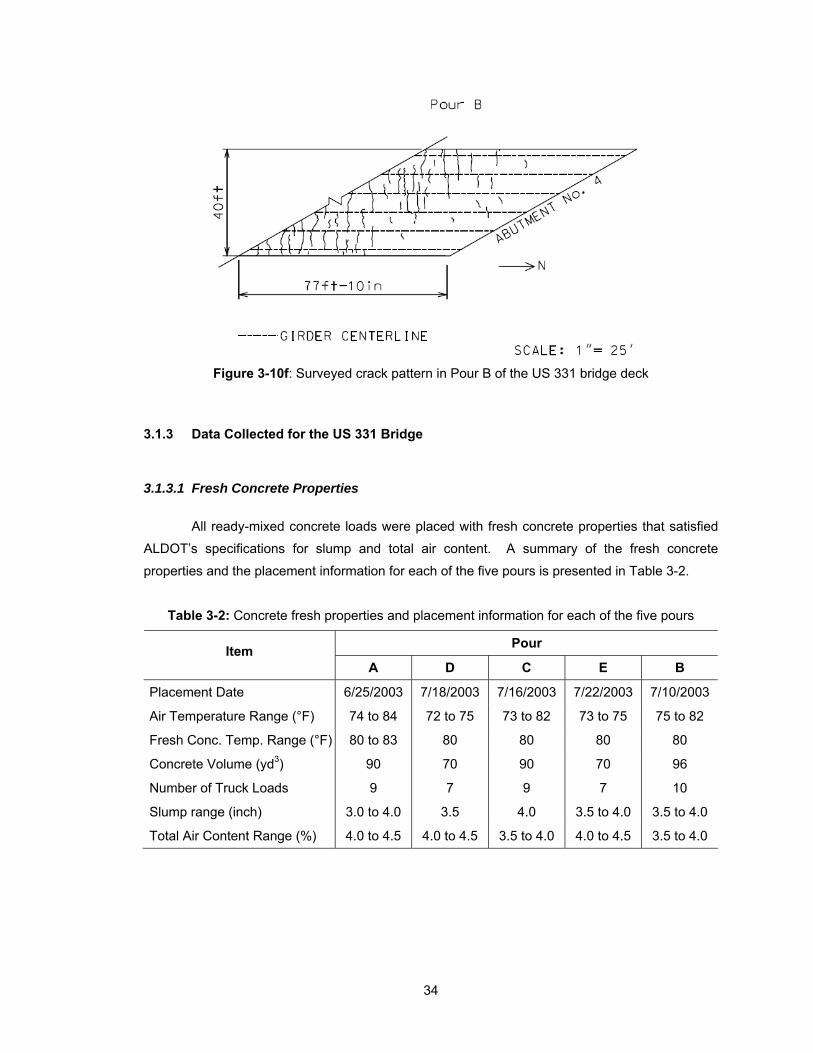
34
Figure 3-10f: Surveyed crack pattern in Pour B of the US 331 bridge deck
3.1.3 Data Collected for the US 331 Bridge
3.1.3.1 Fresh Concrete Properties
All ready-mixed concrete loads were placed with fresh concrete properties that satisfied
ALDOT’s specifications for slump and total air content. A summary of the fresh concrete
properties and the placement information for each of the five pours is presented in Table 3-2.
Table 3-2: Concrete fresh properties and placement information for each of the five pours
Pour Item
A D C E B
Placement Date 6/25/2003 7/18/2003 7/16/2003 7/22/2003 7/10/2003
Air Temperature Range (°F) 74 to 84 72 to 75 73 to 82 73 to 75 75 to 82
Fresh Conc. Temp. Range (°F) 80 to 83 80 80 80 80
Concrete Volume (yd3) 90 70 90 70 96
Number of Truck Loads 9 7 9 7 10
Slump range (inch) 3.0 to 4.0 3.5 4.0 3.5 to 4.0 3.5 to 4.0
Total Air Content Range (%) 4.0 to 4.5 4.0 to 4.5 3.5 to 4.0 4.0 to 4.5 3.5 to 4.0

35
3.1.3.2 Hardened Concrete Properties
3.1.3.2.1 Molded Cylinder Compressive Strengths
The specified design strength for the bridge deck was 4,000 psi at 28 days. ALDOT technicians
sampled concrete of some of the ready-mix trucks to make compressive strength cylinders. All
sampled concrete satisfied ALDOT’s strength requirements, as the average 28-day compressive
strength for all loads was 5,150 psi. A summary of the compressive strength results obtained
from the molded cylinders for each of the five pours is shown in Table 3-3.
Table 3-3: Concrete compressive strength from molded cylinders for each of the five pours
Pour Item
A D C E B
Placement Date 6/25/2003 7/18/2003 7/16/2003 7/22/2003 7/10/2003
Average Comp. Strength (psi) 4,930 5,340 5,470 5,170 4,830
3.1.3.2.2 Compressive Strengths of Cores
In November 2004, three 3-in. diameter cores were recovered from each pour by ALDOT’s
Materials and Test personnel. The strength of all individual cores, except one, exceeded the
specified design strength of 4,000 psi. The one core (P3-1) that fell below 4,000 psi came from
the center of Pour C; however, two other cores within 26 ft from this core in Pour C produced
strengths of 5,070 psi and 5,400 psi. The in-place strength of Pour C’s concrete was thus
deemed acceptable. The average compressive strength (fc) of the 3-in. diameter cores sampled
in November 2004 was 5,050 psi. A summary of the compressive strength results obtained from
the 3-in. diameter cores for each of the five pours is shown in Table 3-4.
Table 3-4: Concrete core compressive strength for each of the five pours
Pour Item
A D C E B
Placement Date 6/25/2003 7/18/2003 7/16/2003 7/22/2003 7/10/2003
Minimum Core fc (psi) 4,370 4,770 3,340 5,200 4,060
Average Core fc (psi) 4,610 5,850 4,600 5,730 4,480
In December 2004, additional 4-in. diameter cores were recovered from each pour by ALDOT’s
Materials and Test personnel. The strength of all individual cores exceeded the specified design
strength of 4,000 psi. The average compressive strength (fc) of the 4-in. diameter cores sampled
in December 2004 was 6,095 psi.

36
3.1.3.2.3 Modulus of Elasticity of Cores
The 4-in. diameter cores that were recovered in December 2004 were also tested in accordance
with ASTM C 469 to determine the concrete’s modulus of elasticity. The average compressive
strength (fc) of the 4-in. diameter cores sampled in December 2004 was 4,500 ksi. The specified
design strength for the bridge deck was 4,000 psi. Based on the commonly used ACI 318
relationship, the design modulus of elasticity for the concrete was expected to be approximately
1000/000,457 = 3,600 ksi. If the ACI 318 relationship is used with the in-place strength of 6,095
psi, the estimated in-place modulus of elasticity is approximately 1000/095,657 = 4,450 ksi,
which is close to the measured value of 4,500 ksi. The in-place modulus of elasticity is relatively
high as it is 24% greater than the design value obtained for a 4,000-psi concrete.
3.1.3.2.4 Splitting Tensile Strength of Cores
The ALDOT inspector’s diary did not clearly document the curing method used by the contractor.
Baźant and Najjar (1972) presented a fourth-order relationship to define the effect of relative
humidity on the strength development. The relationship proposed by Baźant and Najjar (1972)
indicates that at a relative humidity of 90% and 80% the concrete strength would be 76% and
16%, respectively when compared to concrete cured at a 100% relative humidity condition. If
inadequate curing was applied to the US 331 deck, it was hypothesized that a reduced splitting
tensile strength would have been present at the top of the deck as compared to the bottom of the
deck. This hypothesis is schematically illustrated in Figure 3-11.
Tensile Strength Profile
60 (%)
0 100 (%)
Water loss due toevaporation
70-90% Relative Humidity at Surface
100% Relative Humidity at Bottom
Figure 3-11: Hypothesized impact of inadequate curing on the tensile strength profile
Additional 4-in. diameter cores were recovered in December 2004 to evaluate the
hypothesis shown in Figure 3-10. Ground penetrating radar equipment was used to avoid coring
through reinforcement. Two groups of nine cores were recovered from both Pours C and D. An
example of a group of nine core holes is shown in Figure 3-12. From a group of nine cores, at
least 3-in.-thick disks were recovered at the top, middle, and bottom of at least three cores as
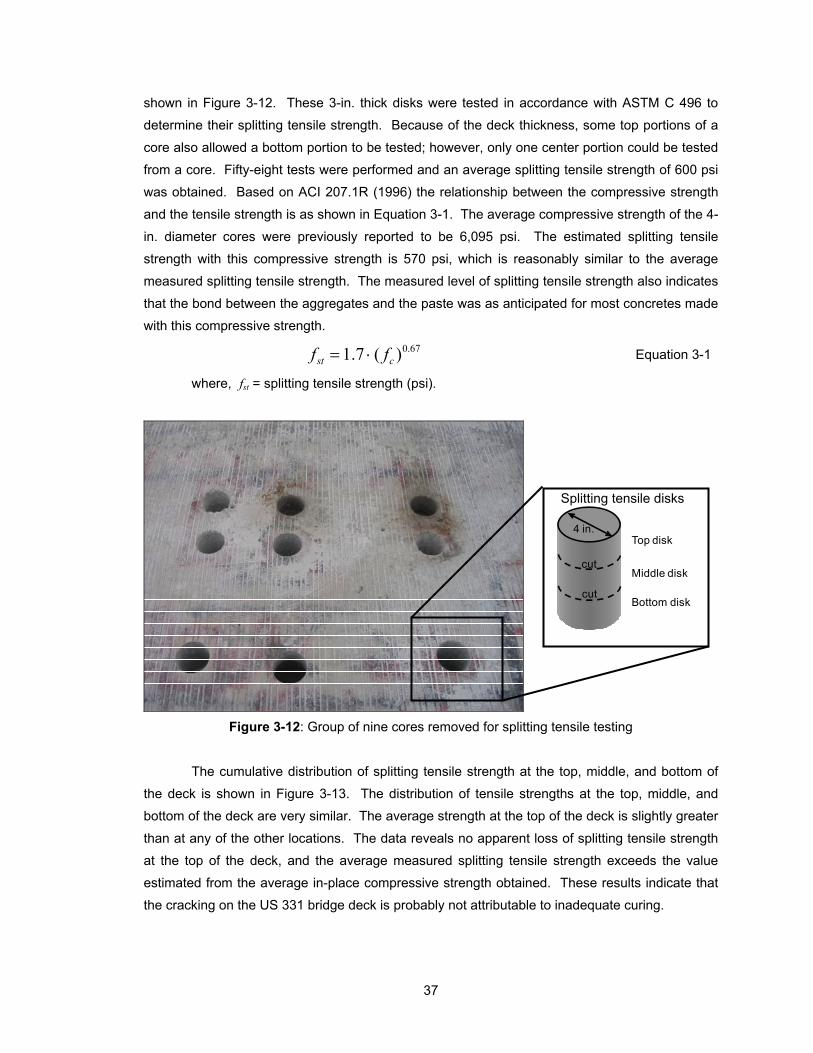
37
shown in Figure 3-12. These 3-in. thick disks were tested in accordance with ASTM C 496 to
determine their splitting tensile strength. Because of the deck thickness, some top portions of a
core also allowed a bottom portion to be tested; however, only one center portion could be tested
from a core. Fifty-eight tests were performed and an average splitting tensile strength of 600 psi
was obtained. Based on ACI 207.1R (1996) the relationship between the compressive strength
and the tensile strength is as shown in Equation 3-1. The average compressive strength of the 4-
in. diameter cores were previously reported to be 6,095 psi. The estimated splitting tensile
strength with this compressive strength is 570 psi, which is reasonably similar to the average
measured splitting tensile strength. The measured level of splitting tensile strength also indicates
that the bond between the aggregates and the paste was as anticipated for most concretes made
with this compressive strength.
67.0)(7.1 cst ff Equation 3-1
where, fst = splitting tensile strength (psi).
Figure 3-12: Group of nine cores removed for splitting tensile testing
The cumulative distribution of splitting tensile strength at the top, middle, and bottom of
the deck is shown in Figure 3-13. The distribution of tensile strengths at the top, middle, and
bottom of the deck are very similar. The average strength at the top of the deck is slightly greater
than at any of the other locations. The data reveals no apparent loss of splitting tensile strength
at the top of the deck, and the average measured splitting tensile strength exceeds the value
estimated from the average in-place compressive strength obtained. These results indicate that
the cracking on the US 331 bridge deck is probably not attributable to inadequate curing.
4 in.Top disk
Middle disk
Bottom disk
cut
cut
Splitting tensile disks

38
0
25
50
75
100
400 450 500 550 600 650 700 750 800
Splitting Tensile Strength (psi)
Cu
mu
lati
ve D
istr
ibu
tio
n (
%)
Top of Deck
Middle of Deck
Bottom of Deck
Figure 3-13: Splitting tensile strength distribution of Pour C and D of the US 331 deck
3.1.3.2.5 Concrete Coefficient of Thermal Expansion
Three additional 4-in. diameter cores were recovered from the deck and sent to FHWA’s Turner-
Fairbank Highway Research Center in McLean, Virginia. The coefficient of thermal expansion
(CTE) of the cores was determined in accordance with AASHTO TP 60 (2004) to be 6.83 x 10⁻⁶
/°F. For reference, Neville and Brooks (1987) report CTE concrete values of 6.8 to 7.3 x 10⁻⁶ /°F
for concrete made with gravel, 5.6 to 6.5 x 10⁻⁶ /°F for concrete made with sandstone, and 3.4 to
4.1 x 10⁻⁶ /°F for concrete made with limestone. The CTE obtained from the US 331 bridge is
thus typical for concrete made with river gravel; however, it should be noted that this CTE is high
as compared to concretes made with limestone.
3.1.3.3 Petrographic Results
A petrographic evaluation was performed on three 3-in. diameter core samples by MACTEC
Engineering and Consulting from Atlanta, Georgia. The concrete appeared normal and the most
significant statements from this report include the following (Jenkins and Lane 2004):
“The paste to aggregate bond was poor with mostly pull out around the aggregate when
fractured.”
“The aggregates were evenly distributed in the concrete. There were no indications of
adverse cement aggregate reactions in the concrete. The concrete was well
39
consolidated and contained approximately 2 percent air. The porosity of the concrete
was higher near the top surface than deeper in the concrete. This may be due to drying
of the concrete surface and incomplete hydration of the cement near the top of the slab.”
3.1.3.4 Deck Thickness and Cover to Reinforcing Bars
The reinforced concrete deck was designed to have a thickness of 7 inches and a cover of 2.0 in.
and 1.0 in. at the top and bottom of the deck, respectively, as shown in Figure 3-4. Ground
penetrating radar (GPR) was used to determine the as-built average deck thickness and the
location of the steel reinforcement. The GPR results were calibrated to the measured deck
thickness and reinforcement mat locations visible at open core holes. The GPR results indicated
that the average deck thickness between the steel girders was 8.25 in., the average top cover
was 3.25 in., and the average bottom cover was 1.0 in. The deck thickness and the top cover
depth thus exceeded the design values by 1.25 in.
3.2 DISCUSSION OF CRACKING MECHANISMS FOR THE US 331 BRIDGE DECK
Very limited literature acknowledges the presence of horizontal cracks in bridge decks. Previous
research findings were consulted to develop a list of all mechanisms that could have contributed
to this type of cracking. Based on the data available, the following mechanisms are all believed
to be unlikely causes for the severe cracking observed on the US 331 bridge:
Poor concrete quality—Poor quality concrete was not used in the bridge, which is
evident from the quality control data presented in Section 3.1.3 and the core
strengths. The concrete satisfied all ALDOT’s standard slump, total air content,
and compressive strength requirements. Core results revealed an average in-
place concrete compressive strength of 6,050 psi and splitting tensile strength of
600 psi, which indicates that concrete with sufficient strength was constructed.
Excessive reinforcement cover—Although the cover to the top reinforcement was
3.25 in. instead of 2.0 in. it is unlikely that this could have contributed to the severe
cracking seen in the bridge. Dakhil et al. (1975) concluded that the cracking
tendency should decrease with an increase in cover. NCHRP Report 380 (Krauss
and Rogalla 1996) recommended a cover from 1.5 in. to 3.0 in., which is very
similar to the as-built condition of the deck.
Inappropriate deck construction sequence—The deck construction sequence is in
accordance with the optimal sequence recommended by Issa (1991) for bridges
with a continuous reinforced concrete deck. Based on Issa’s recommendation and
the fact ALDOT routinely uses this construction sequence without problems, the

40
deck construction sequence used for this deck should not have caused this type of
cracking.
Inadequate curing—The type of cracking could have been cause by inadequate
curing as this will increase drying shrinkage, reduce the strength, and increase the
permeability of the surface concrete. Core test results did not reveal a reduction in
splitting tensile strength at the top of the deck relative to the middle or bottom
regions. This level of splitting tensile strength also indicates that the bond between
the aggregates and the paste was as anticipated for most concretes made with this
compressive strength. These results indicate that the cracking is probably not
attributable to inadequate curing.
Plastic shrinkage cracking—The type of cracking encountered on the US 331
bridge deck is also not typical of plastic shrinkage cracking as the cracks were
through the deck and not just limited to a depth of a few inches.
Overloading and excessive vibration—It is unlikely that the observed crack pattern
was caused by overloading at early ages or vibrations due to the passing of a train
underneath the bridge. Any overloading of the deck itself would mainly produce
cracking parallel to the girders, which was not observed. Any localized overloading
of the girders would produce transverse cracks that are concentrated in the region
where the maximum negative moments occur (i.e. over the girder support), which
was not observed.
Excessive bond stresses—High bond stresses around the reinforcement probably
did not lead to the observed cracking as the reinforcing bars were adequately
spaced and cracking was not limited to locations of maximum steel stress.
Lack of concrete durability—The observed cracking was not caused by concrete
durability mechanisms such as alkali-silica reaction, sulfate attack, or the corrosion
of the steel because cracking was observed within a year of construction and there
were no indications of products produced by known concrete deterioration
mechanisms. Results from the petrographic evaluation (Jenkins and Lane 2004)
concluded that there “were no indications of adverse cement aggregate reactions
in the concrete”.
In the remainder of this section the more likely causes of cracking will be discussed and
reviewed based on the data collected for the US 331 bridge.
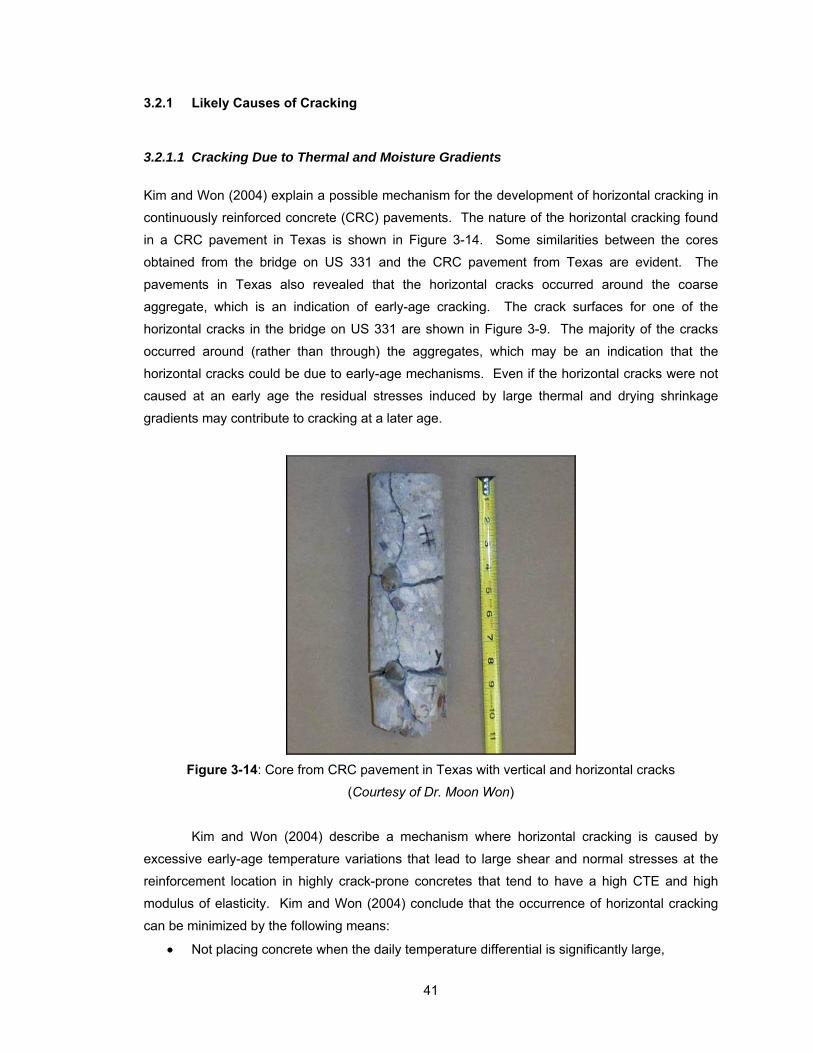
41
3.2.1 Likely Causes of Cracking
3.2.1.1 Cracking Due to Thermal and Moisture Gradients
Kim and Won (2004) explain a possible mechanism for the development of horizontal cracking in
continuously reinforced concrete (CRC) pavements. The nature of the horizontal cracking found
in a CRC pavement in Texas is shown in Figure 3-14. Some similarities between the cores
obtained from the bridge on US 331 and the CRC pavement from Texas are evident. The
pavements in Texas also revealed that the horizontal cracks occurred around the coarse
aggregate, which is an indication of early-age cracking. The crack surfaces for one of the
horizontal cracks in the bridge on US 331 are shown in Figure 3-9. The majority of the cracks
occurred around (rather than through) the aggregates, which may be an indication that the
horizontal cracks could be due to early-age mechanisms. Even if the horizontal cracks were not
caused at an early age the residual stresses induced by large thermal and drying shrinkage
gradients may contribute to cracking at a later age.
Figure 3-14: Core from CRC pavement in Texas with vertical and horizontal cracks
(Courtesy of Dr. Moon Won)
Kim and Won (2004) describe a mechanism where horizontal cracking is caused by
excessive early-age temperature variations that lead to large shear and normal stresses at the
reinforcement location in highly crack-prone concretes that tend to have a high CTE and high
modulus of elasticity. Kim and Won (2004) conclude that the occurrence of horizontal cracking
can be minimized by the following means:
Not placing concrete when the daily temperature differential is significantly large,

42
Effectively curing the concrete to avoid high early-age drying shrinkage, and
Selecting a coarse aggregate type to avoid a high concrete thermal expansion
coefficient and a high elastic modulus of concrete.
Based on the data collected for the US 331 it was found that the deck was constructed
with a high coefficient of thermal expansion of 6.83 x 10⁻⁶ /°F and a high modulus of elasticity of
4,500 ksi. The bridge was constructed during the summer months, which would produce the
highest early-age temperatures and thus the greatest thermal stresses as outlined in Section
2.4.1. The bridge deck is also supported by steel girders and is continuous over three spans,
which is a condition that generates a high degree of restraint to any volume change effects.
Krauss and Rogalla (1996) conclude in NCHRP Report 380 that “continuous-span structures are
more susceptible to cracking than simple-span structures,” and that “girder restraint and studs
cause significant stresses.” The majority of the surface cracking on the US 331 bridge deck is
perpendicular to the orientation of the steel girders, which supports the conclusion that these
cracks are related to the restraint provided by the steel girders. It is thus clear that the
characteristics of the concrete mixture used for the bridge deck did not conform to most of the
criteria highlighted by Kim and Won (2004) to minimize the likely formation of horizontal cracks.
The contribution of nonlinear temperature and drying shrinkage stress distributions to
produce horizontal cracking is schematically shown in Figure 3-15. Significant stresses develop
when a concrete with a high coefficient of thermal expansion and high modulus of elasticity is
subjected to large temperature gradients. Related to these variables, Krauss and Rogalla (1996)
conclude in NCHRP Report 380 that “Thermal stresses and transverse cracking can be reduced
by using concretes with lower coefficients of thermal expansion.” Krauss and Rogalla (1996)
further conclude that “the concrete modulus of elasticity, adjusted for creep, affects both thermal
and shrinkage stresses more than any other physical concrete property.”
Bottom
Top
Stresses due to Thermal Gradients
Drying ShrinkageStresses
+ =
CumulativeStresses
Tension
Potential ShearFailure Plane
Figure 3-15: Contribution of nonlinear temperature and drying shrinkage stresses to produce
horizontal cracking
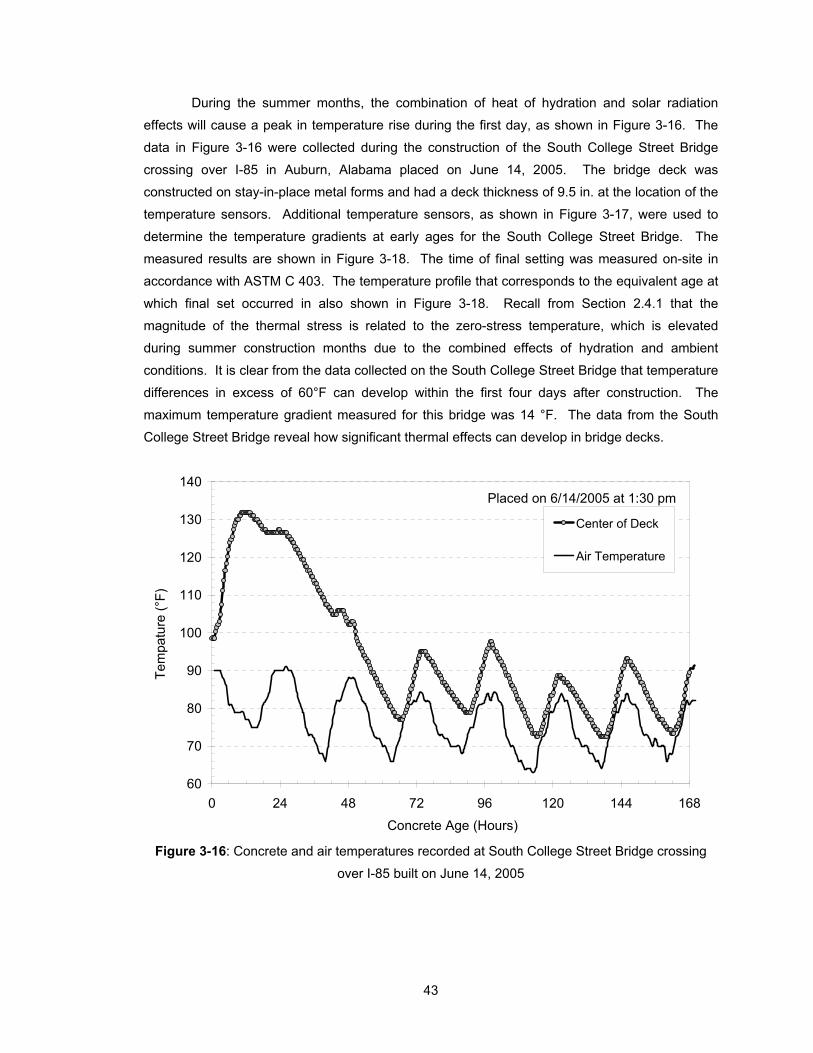
43
During the summer months, the combination of heat of hydration and solar radiation
effects will cause a peak in temperature rise during the first day, as shown in Figure 3-16. The
data in Figure 3-16 were collected during the construction of the South College Street Bridge
crossing over I-85 in Auburn, Alabama placed on June 14, 2005. The bridge deck was
constructed on stay-in-place metal forms and had a deck thickness of 9.5 in. at the location of the
temperature sensors. Additional temperature sensors, as shown in Figure 3-17, were used to
determine the temperature gradients at early ages for the South College Street Bridge. The
measured results are shown in Figure 3-18. The time of final setting was measured on-site in
accordance with ASTM C 403. The temperature profile that corresponds to the equivalent age at
which final set occurred in also shown in Figure 3-18. Recall from Section 2.4.1 that the
magnitude of the thermal stress is related to the zero-stress temperature, which is elevated
during summer construction months due to the combined effects of hydration and ambient
conditions. It is clear from the data collected on the South College Street Bridge that temperature
differences in excess of 60°F can develop within the first four days after construction. The
maximum temperature gradient measured for this bridge was 14 °F. The data from the South
College Street Bridge reveal how significant thermal effects can develop in bridge decks.
60
70
80
90
100
110
120
130
140
0 24 48 72 96 120 144 168
Concrete Age (Hours)
Te
mpa
ture
(°F
)
Center of Deck
Air Temperature
Figure 3-16: Concrete and air temperatures recorded at South College Street Bridge crossing
over I-85 built on June 14, 2005
Placed on 6/14/2005 at 1:30 pm
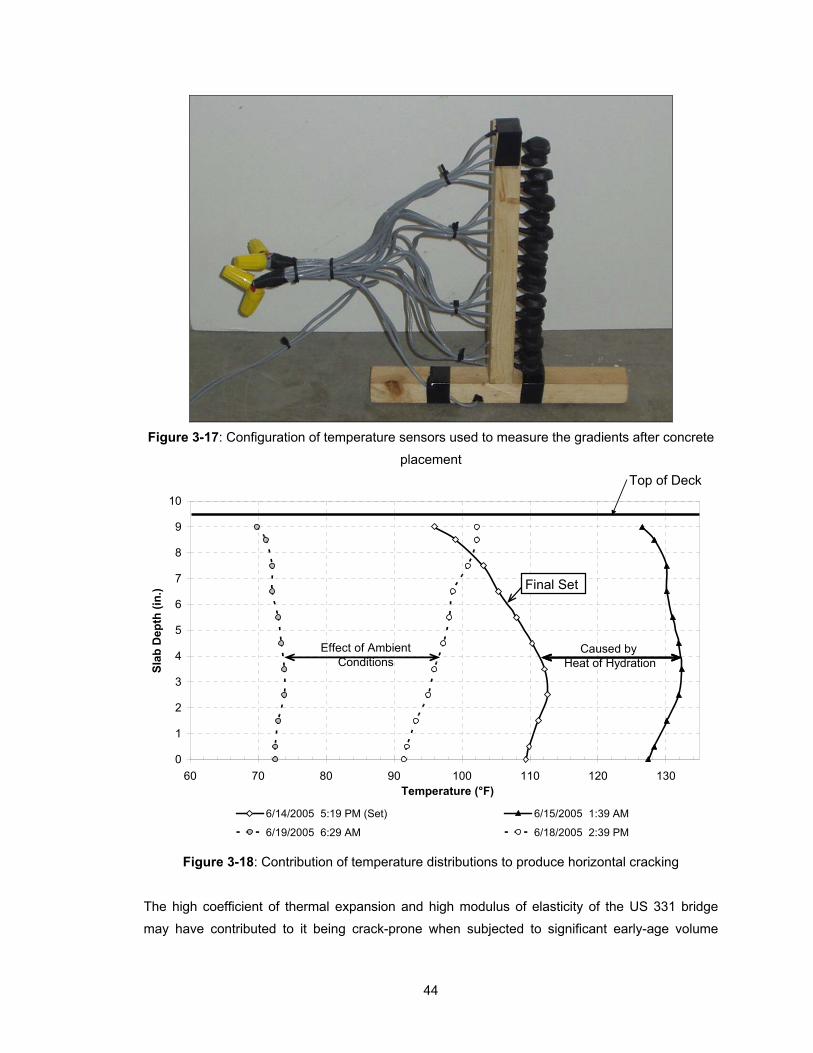
44
Figure 3-17: Configuration of temperature sensors used to measure the gradients after concrete
placement
0
1
2
3
4
5
6
7
8
9
10
60 70 80 90 100 110 120 130Temperature (°F)
Sla
b D
epth
(in
.)
6/14/2005 5:19 PM (Set) 6/15/2005 1:39 AM
6/19/2005 6:29 AM 6/18/2005 2:39 PM
Top of Deck
Effect of AmbientConditions
Caused by Heat of Hydration
Final Set
Figure 3-18: Contribution of temperature distributions to produce horizontal cracking
The high coefficient of thermal expansion and high modulus of elasticity of the US 331 bridge
may have contributed to it being crack-prone when subjected to significant early-age volume

45
change effects and a high degree of restraint. Experimental evaluation of the effects of
constituent materials on the cracking tendency and early-age behavior of bridge deck concretes
made with Alabama materials is described in Chapter 4 of this report. Coefficient of thermal
expansion tests will be performed on concretes made with aggregates found in Alabama; this
effort is described in Chapter 5. These results will help to provide further evidence to identify the
primary cause of the cracking on the US 331 bridge.
3.2.1.2 Effect of Bridge Skew
The US 331 bridge had a skew angle of 61°, which is a significant amount of skew. NCHRP
Report 380 (Krauss and Rogalla 1996) concluded that skew “does not significantly affect
transverse cracking, but slightly higher stresses occur near the corners.” The skew of the bridge
may affect the transverse load distribution pattern and it is thus possible that the large skew
contributed to the observed distress in this bridge. It is difficult to visualize what effect the skew
can have on the distribution of stresses. The effect of various skew angles on the development of
stress in the deck was evaluated by finite-element modeling techniques as described in Chapter 6
of this report.
3.2.1.3 Differential Settlement of Bridge Foundation
Differential movement of the bridge foundations could lead to significant deck cracking. The
bridge is located south Montgomery in an area were swelling clays are present. No elevations of
the bridge were available before the cracking was observed; therefore, no data are available to
evaluate this as a potential cause for the observed cracking. Differential settlement of the
foundations of this 3-span continuous bridge will tend to cause severe localized cracking at the
negative moment regions of the continuous girders. The effect of differential settlement of the
bridge foundations was evaluated by finite-element modeling techniques as described in Chapter
6 of this report.
3.3 EXTENT OF HORIZONTAL CRACKING IN OTHER BRIDGE DECKS IN ALABAMA
If the primary failure mechanism involves a cracking-sensitive mixture, large thermal and moisture
gradients, and a high degree of restraint in the deck, then this type of cracking may be present in
other bridge decks in Alabama. Since the horizontal cracks are not visible on the surface of the
deck, it is possible that they are present in other bridges in Alabama, but have gone undetected.
The research team worked with ALDOT to identify bridges that may also have horizontal
cracking. The criteria used to identify some bridges were as follows:
continuous bridge deck,
bridge decks constructed between May and September (warm months), and
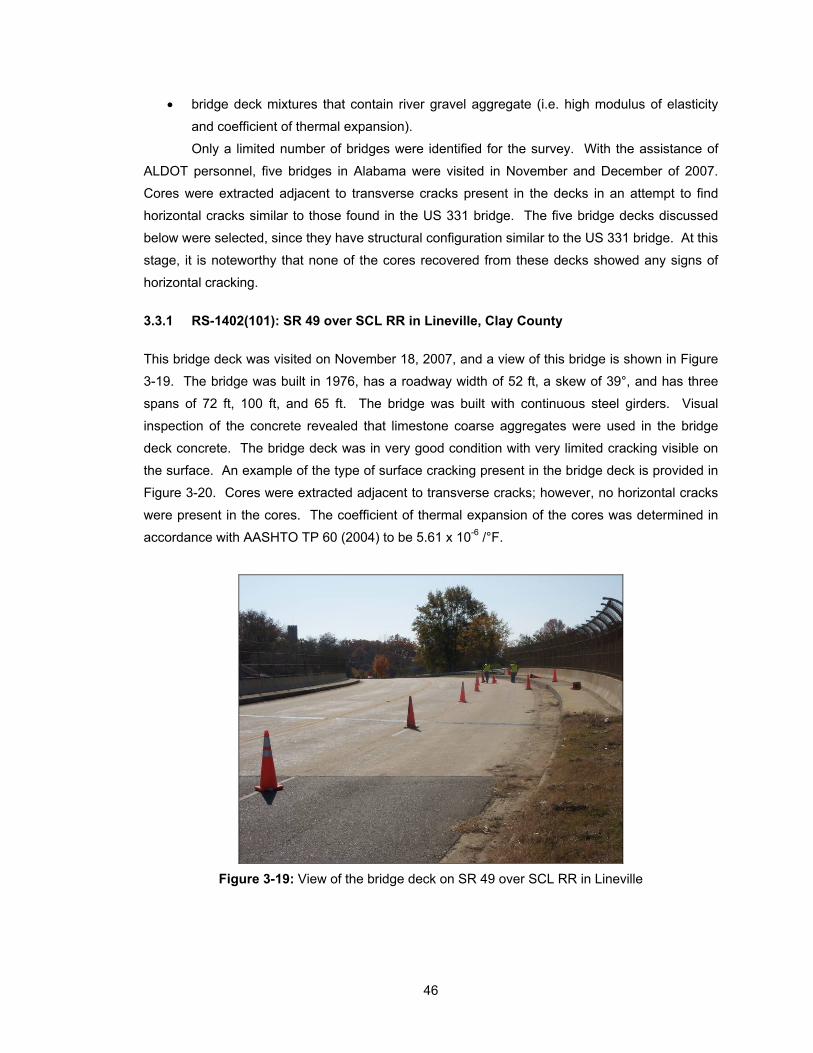
46
bridge deck mixtures that contain river gravel aggregate (i.e. high modulus of elasticity
and coefficient of thermal expansion).
Only a limited number of bridges were identified for the survey. With the assistance of
ALDOT personnel, five bridges in Alabama were visited in November and December of 2007.
Cores were extracted adjacent to transverse cracks present in the decks in an attempt to find
horizontal cracks similar to those found in the US 331 bridge. The five bridge decks discussed
below were selected, since they have structural configuration similar to the US 331 bridge. At this
stage, it is noteworthy that none of the cores recovered from these decks showed any signs of
horizontal cracking.
3.3.1 RS-1402(101): SR 49 over SCL RR in Lineville, Clay County
This bridge deck was visited on November 18, 2007, and a view of this bridge is shown in Figure
3-19. The bridge was built in 1976, has a roadway width of 52 ft, a skew of 39°, and has three
spans of 72 ft, 100 ft, and 65 ft. The bridge was built with continuous steel girders. Visual
inspection of the concrete revealed that limestone coarse aggregates were used in the bridge
deck concrete. The bridge deck was in very good condition with very limited cracking visible on
the surface. An example of the type of surface cracking present in the bridge deck is provided in
Figure 3-20. Cores were extracted adjacent to transverse cracks; however, no horizontal cracks
were present in the cores. The coefficient of thermal expansion of the cores was determined in
accordance with AASHTO TP 60 (2004) to be 5.61 x 10⁻⁶ /°F.
Figure 3-19: View of the bridge deck on SR 49 over SCL RR in Lineville

47
Figure 3-20: Pictures of the bridge deck on SR 49 over SCL RR in Lineville
3.3.2 APD-237(9): Courtland Bypass over Norfolk Southern Railroad, Lawrence Co.
This bridge deck was visited on November 19, 2007, and a view of this bridge is shown in Figure
3-21. The bridge was built in 1983, has a roadway width of 40 ft, a skew of 49°, and has three
spans of 55 ft, 85 ft, and 55 ft. The bridge was built with continuous steel girders. Visual
inspection of the concrete revealed that limestone coarse aggregates were used in the bridge
deck concrete. Many transverse cracks were visible on the deck, and some of these appeared
wide and spalled at the surface. An example of the type of surface cracking present in the bridge
deck is provided in Figure 3-22. Cores were extracted adjacent to transverse cracks; however,
no horizontal cracks were present in the cores. An inspection of the cores recovered from the
cracks also revealed that the transverse cracks were only wide at the surface, as shown in Figure
3-23. The coefficient of thermal expansion of the cores was determined in accordance with
AASHTO TP 60 (2004) to be 5.32 x 10⁻⁶ /°F.
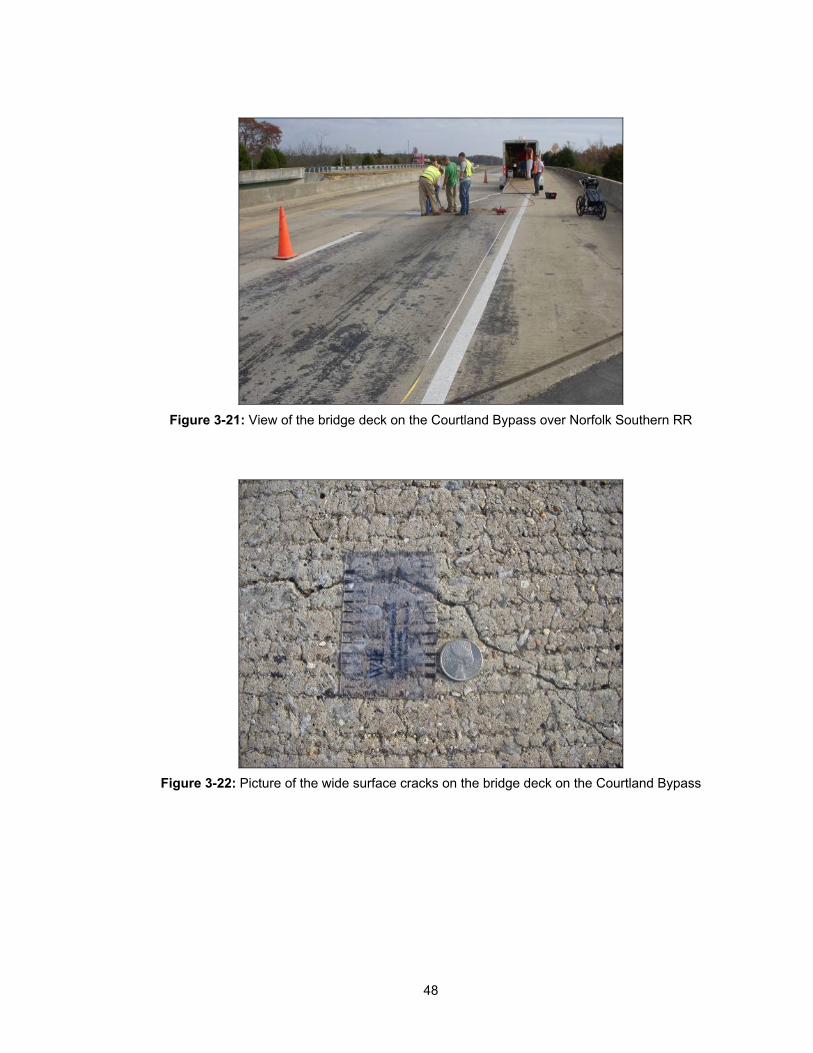
48
Figure 3-21: View of the bridge deck on the Courtland Bypass over Norfolk Southern RR
Figure 3-22: Picture of the wide surface cracks on the bridge deck on the Courtland Bypass

49
Figure 3-23: Pictures of the core hole on the bridge deck on the Courtland Bypass
3.3.3 RS-6309(101): SR 216 over L&N RR (Tuscaloosa to Brookwood), Tuscaloosa Co.
This bridge deck was visited on November 20, 2007, and a view of this bridge is shown in Figure
3-24. The bridge was built in 1983, has a roadway width of 44 ft, a skew of 60°, and has three
spans of 83.5 ft, 100 ft, and 83.5 ft. The bridge was built with continuous steel girders. Visual
inspection of the concrete revealed that river gravel coarse aggregates were used in the bridge
deck concrete. The bridge deck was in good condition with some transverse cracks present. An
example of the type of surface cracking present in the bridge deck is provided in Figure 3-25.
Cores were extracted adjacent to transverse cracks; however, no horizontal cracks were present
in the cores. The coefficient of thermal expansion of the cores was determined in accordance
with AASHTO TP 60 (2004) to be 7.05 x 10⁻⁶ /°F.
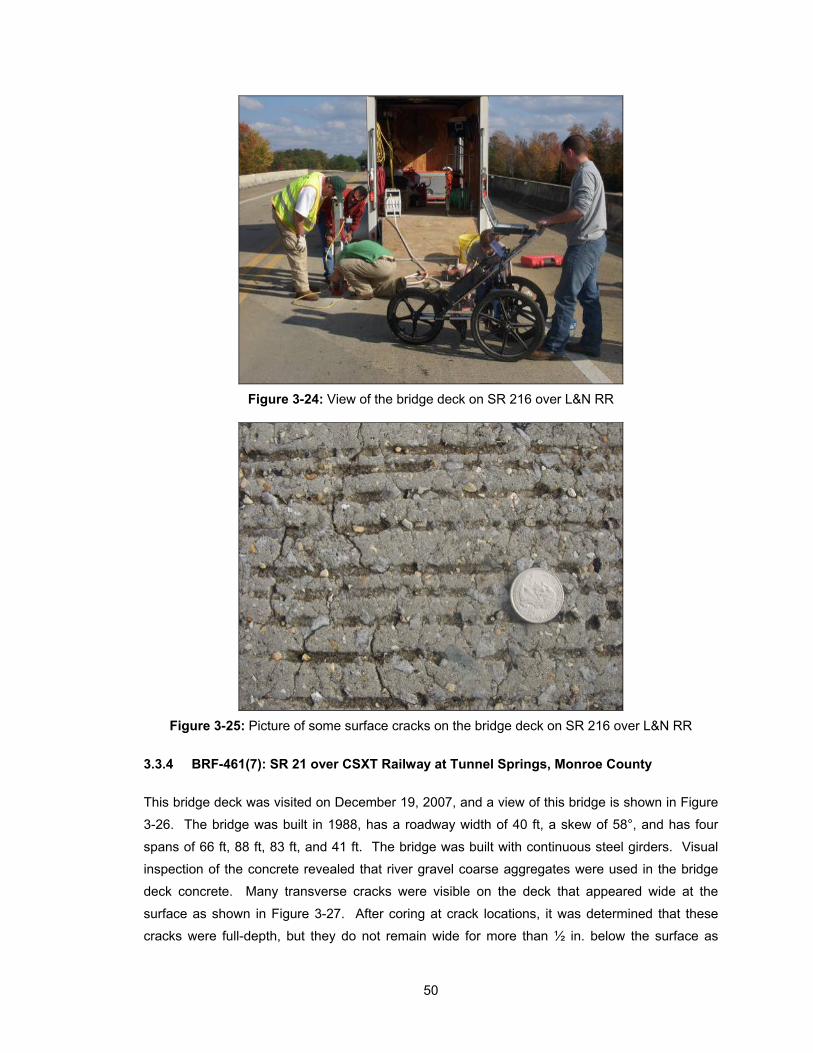
50
Figure 3-24: View of the bridge deck on SR 216 over L&N RR
Figure 3-25: Picture of some surface cracks on the bridge deck on SR 216 over L&N RR
3.3.4 BRF-461(7): SR 21 over CSXT Railway at Tunnel Springs, Monroe County
This bridge deck was visited on December 19, 2007, and a view of this bridge is shown in Figure
3-26. The bridge was built in 1988, has a roadway width of 40 ft, a skew of 58°, and has four
spans of 66 ft, 88 ft, 83 ft, and 41 ft. The bridge was built with continuous steel girders. Visual
inspection of the concrete revealed that river gravel coarse aggregates were used in the bridge
deck concrete. Many transverse cracks were visible on the deck that appeared wide at the
surface as shown in Figure 3-27. After coring at crack locations, it was determined that these
cracks were full-depth, but they do not remain wide for more than ½ in. below the surface as
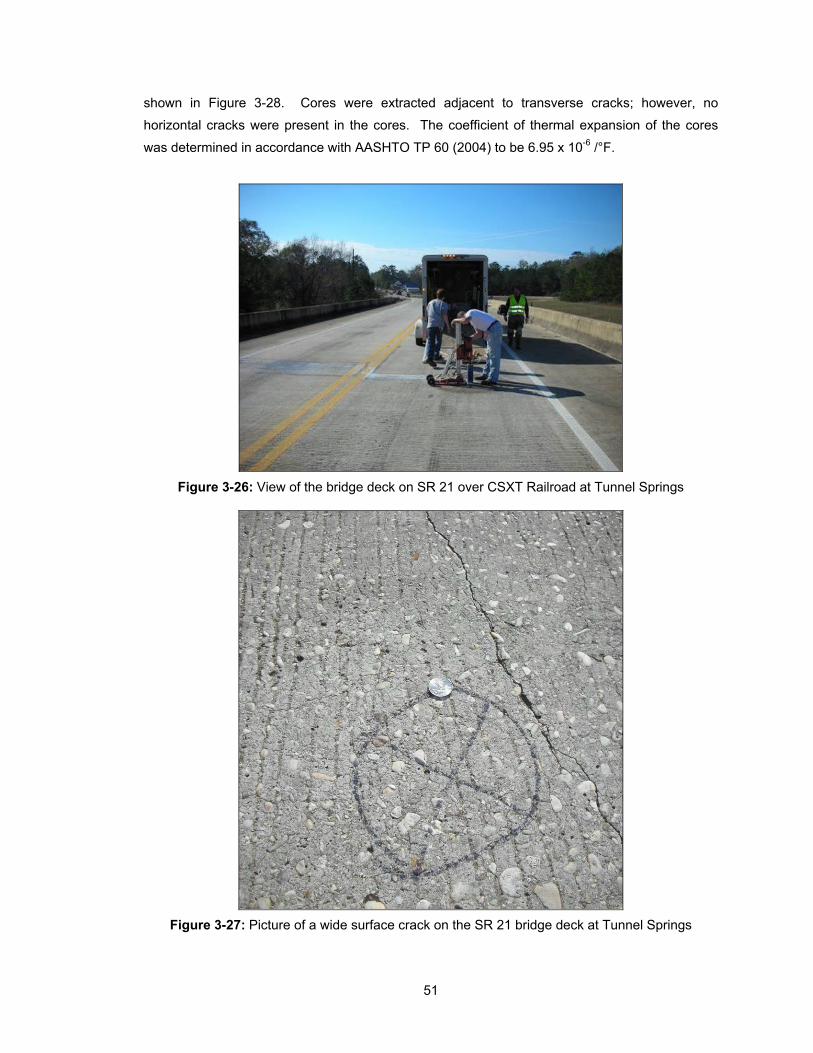
51
shown in Figure 3-28. Cores were extracted adjacent to transverse cracks; however, no
horizontal cracks were present in the cores. The coefficient of thermal expansion of the cores
was determined in accordance with AASHTO TP 60 (2004) to be 6.95 x 10⁻⁶ /°F.
Figure 3-26: View of the bridge deck on SR 21 over CSXT Railroad at Tunnel Springs
Figure 3-27: Picture of a wide surface crack on the SR 21 bridge deck at Tunnel Springs
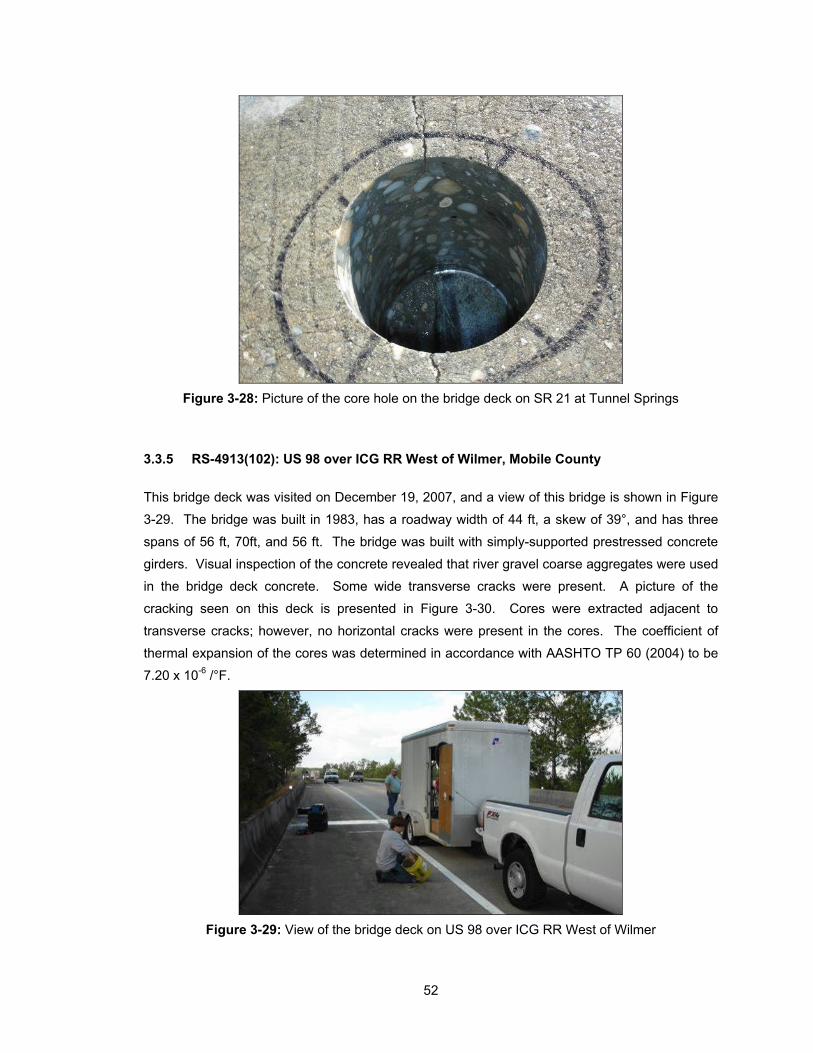
52
Figure 3-28: Picture of the core hole on the bridge deck on SR 21 at Tunnel Springs
3.3.5 RS-4913(102): US 98 over ICG RR West of Wilmer, Mobile County
This bridge deck was visited on December 19, 2007, and a view of this bridge is shown in Figure
3-29. The bridge was built in 1983, has a roadway width of 44 ft, a skew of 39°, and has three
spans of 56 ft, 70ft, and 56 ft. The bridge was built with simply-supported prestressed concrete
girders. Visual inspection of the concrete revealed that river gravel coarse aggregates were used
in the bridge deck concrete. Some wide transverse cracks were present. A picture of the
cracking seen on this deck is presented in Figure 3-30. Cores were extracted adjacent to
transverse cracks; however, no horizontal cracks were present in the cores. The coefficient of
thermal expansion of the cores was determined in accordance with AASHTO TP 60 (2004) to be
7.20 x 10⁻⁶ /°F.
Figure 3-29: View of the bridge deck on US 98 over ICG RR West of Wilmer
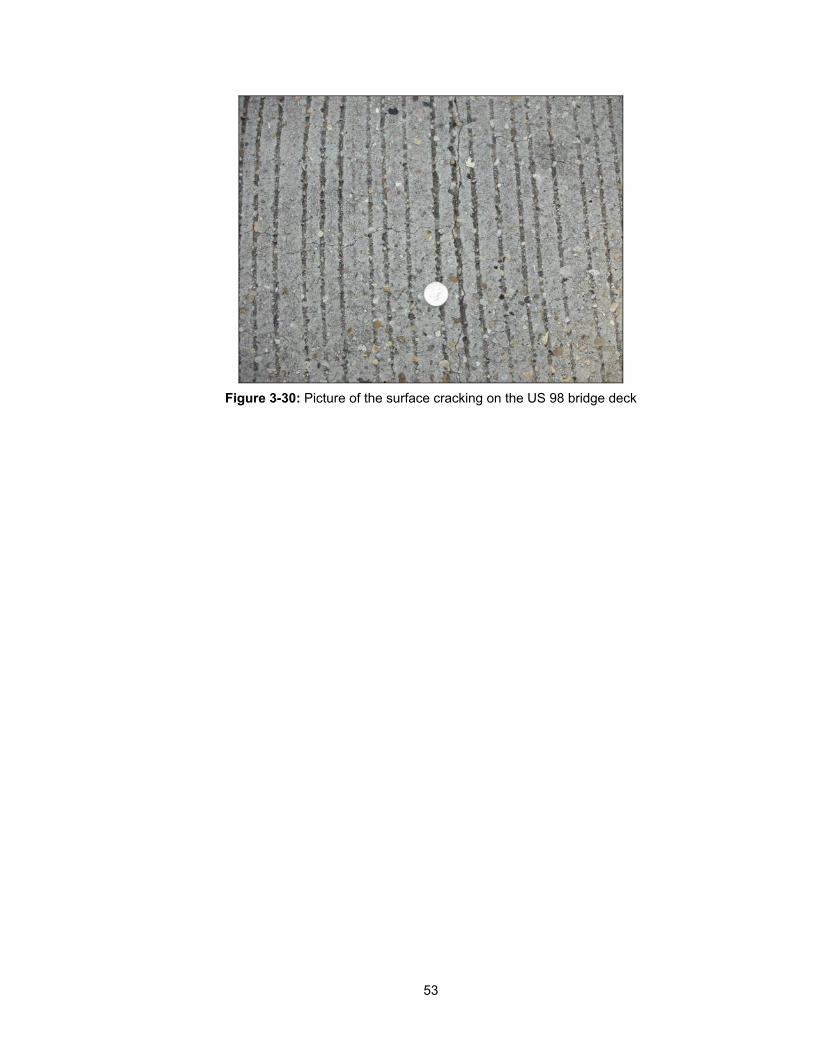
53
Figure 3-30: Picture of the surface cracking on the US 98 bridge deck
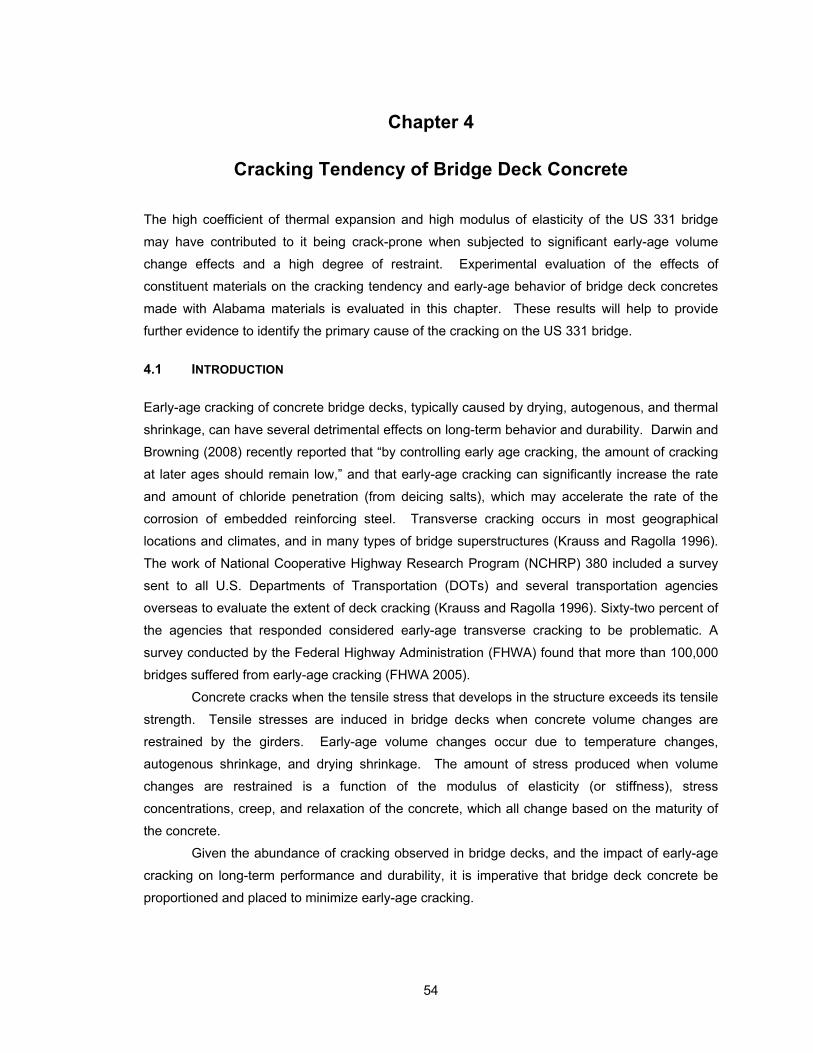
54
Chapter 4
Cracking Tendency of Bridge Deck Concrete
The high coefficient of thermal expansion and high modulus of elasticity of the US 331 bridge
may have contributed to it being crack-prone when subjected to significant early-age volume
change effects and a high degree of restraint. Experimental evaluation of the effects of
constituent materials on the cracking tendency and early-age behavior of bridge deck concretes
made with Alabama materials is evaluated in this chapter. These results will help to provide
further evidence to identify the primary cause of the cracking on the US 331 bridge.
4.1 INTRODUCTION
Early-age cracking of concrete bridge decks, typically caused by drying, autogenous, and thermal
shrinkage, can have several detrimental effects on long-term behavior and durability. Darwin and
Browning (2008) recently reported that “by controlling early age cracking, the amount of cracking
at later ages should remain low,” and that early-age cracking can significantly increase the rate
and amount of chloride penetration (from deicing salts), which may accelerate the rate of the
corrosion of embedded reinforcing steel. Transverse cracking occurs in most geographical
locations and climates, and in many types of bridge superstructures (Krauss and Ragolla 1996).
The work of National Cooperative Highway Research Program (NCHRP) 380 included a survey
sent to all U.S. Departments of Transportation (DOTs) and several transportation agencies
overseas to evaluate the extent of deck cracking (Krauss and Ragolla 1996). Sixty-two percent of
the agencies that responded considered early-age transverse cracking to be problematic. A
survey conducted by the Federal Highway Administration (FHWA) found that more than 100,000
bridges suffered from early-age cracking (FHWA 2005).
Concrete cracks when the tensile stress that develops in the structure exceeds its tensile
strength. Tensile stresses are induced in bridge decks when concrete volume changes are
restrained by the girders. Early-age volume changes occur due to temperature changes,
autogenous shrinkage, and drying shrinkage. The amount of stress produced when volume
changes are restrained is a function of the modulus of elasticity (or stiffness), stress
concentrations, creep, and relaxation of the concrete, which all change based on the maturity of
the concrete.
Given the abundance of cracking observed in bridge decks, and the impact of early-age
cracking on long-term performance and durability, it is imperative that bridge deck concrete be
proportioned and placed to minimize early-age cracking.

55
4.1.1 Chapter Objectives and Research Methodology
The primary objective of the work documented in this chapter is to evaluate the influence of
supplementary cementing materials (SCMs), water-cement ratio (w/c), and placement and curing
temperatures on the development of stresses and occurrence of cracking at early ages. Due to
the effect of temperature on the development of stresses, cracking in bridge decks is more severe
when they are constructed under summer conditions (Krauss and Rogalla 1996). Therefore, the
effectiveness of using SCMs under summer placement conditions was determined. This was
accomplished by testing five concrete mixtures under various, controlled temperature conditions,
while measuring the stress development from concrete placement until onset of cracking.
4.2 EXPERIMENTAL WORK
4.2.1 Experimental Plan and Concrete Mixtures
A control mixture with only portland cement and three mixtures with a SCM used as a partial
cement replacement, all having a water-cementitious materials ratio (w/cm) of 0.44, were tested.
The mixture proportions are shown in Table 4-1. Since cracking in bridge decks is more severe
when placed under summer conditions (Krauss and Rogalla 1996), the influence of using SCMs
on early cracking tendency was only evaluated under summer placement conditions. The SCM
mixtures had 20, 30, and 50 percent replacement of cement by mass of Class F fly ash, Class C
fly ash, and slag cement, respectively. The chemical compositions of the SCMs are presented in
Table 4-2. A mixture with only portland cement and a w/c of 0.36 was also tested at two
placement temperatures to evaluate the effect of w/c on the cracking tendency. The control
mixture was tested at three different temperatures to evaluate the effect of placement and curing
temperature on the stress intensity and occurrence of cracking at early ages.
4.2.2 Testing to Quantify the Early-Age Cracking Potential of Concrete
The rigid cracking frame (RCF), shown in Figure 4-1, comprises of two mild steel crossheads and
two 4-inch diameter Invar side bars. The test setup was adapted from the configuration
developed by Dr. Rupert Springenschmid as documented by RILEM Technical Committee 119
(1998).
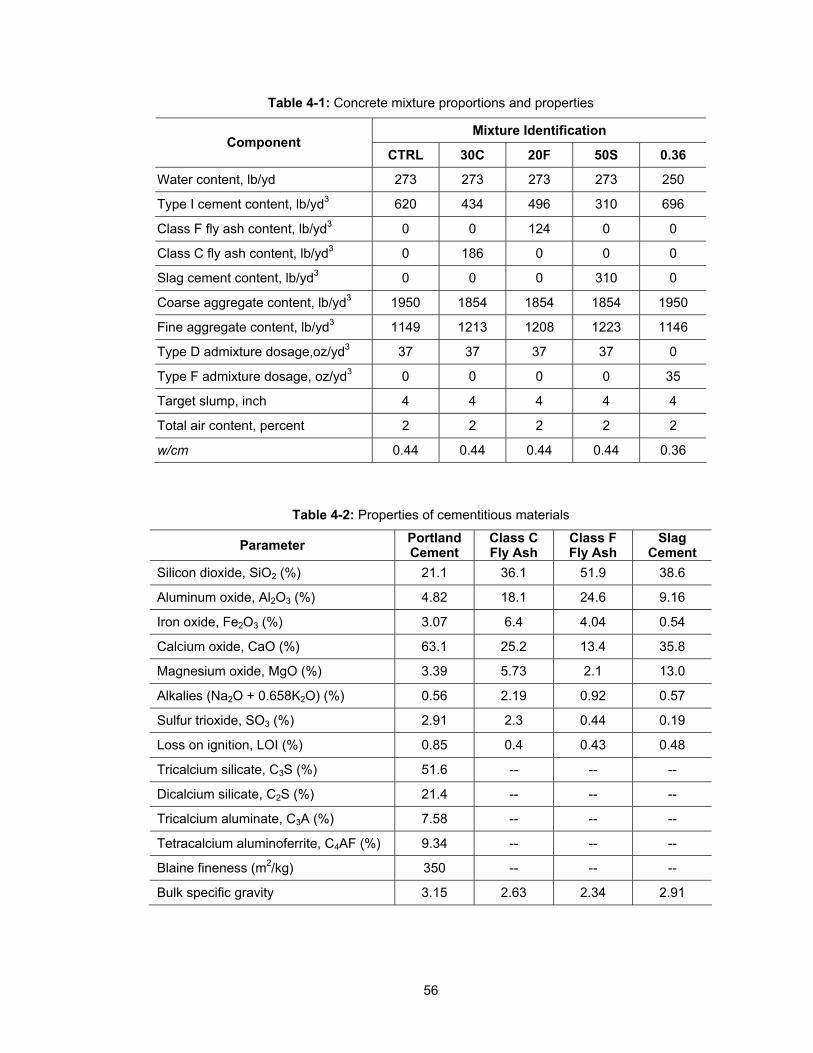
56
Table 4-1: Concrete mixture proportions and properties
Mixture Identification Component
CTRL 30C 20F 50S 0.36
Water content, lb/yd 273 273 273 273 250
Type I cement content, lb/yd3 620 434 496 310 696
Class F fly ash content, lb/yd3 0 0 124 0 0
Class C fly ash content, lb/yd3 0 186 0 0 0
Slag cement content, lb/yd3 0 0 0 310 0
Coarse aggregate content, lb/yd3 1950 1854 1854 1854 1950
Fine aggregate content, lb/yd3 1149 1213 1208 1223 1146
Type D admixture dosage,oz/yd3 37 37 37 37 0
Type F admixture dosage, oz/yd3 0 0 0 0 35
Target slump, inch 4 4 4 4 4
Total air content, percent 2 2 2 2 2
w/cm 0.44 0.44 0.44 0.44 0.36
Table 4-2: Properties of cementitious materials
Parameter Portland Cement
Class C Fly Ash
Class F Fly Ash
Slag Cement
Silicon dioxide, SiO2 (%) 21.1 36.1 51.9 38.6
Aluminum oxide, Al2O3 (%) 4.82 18.1 24.6 9.16
Iron oxide, Fe2O3 (%) 3.07 6.4 4.04 0.54
Calcium oxide, CaO (%) 63.1 25.2 13.4 35.8
Magnesium oxide, MgO (%) 3.39 5.73 2.1 13.0
Alkalies (Na2O + 0.658K2O) (%) 0.56 2.19 0.92 0.57
Sulfur trioxide, SO3 (%) 2.91 2.3 0.44 0.19
Loss on ignition, LOI (%) 0.85 0.4 0.43 0.48
Tricalcium silicate, C3S (%) 51.6 -- -- --
Dicalcium silicate, C2S (%) 21.4 -- -- --
Tricalcium aluminate, C3A (%) 7.58 -- -- --
Tetracalcium aluminoferrite, C4AF (%) 9.34 -- -- --
Blaine fineness (m2/kg) 350 -- -- --
Bulk specific gravity 3.15 2.63 2.34 2.91
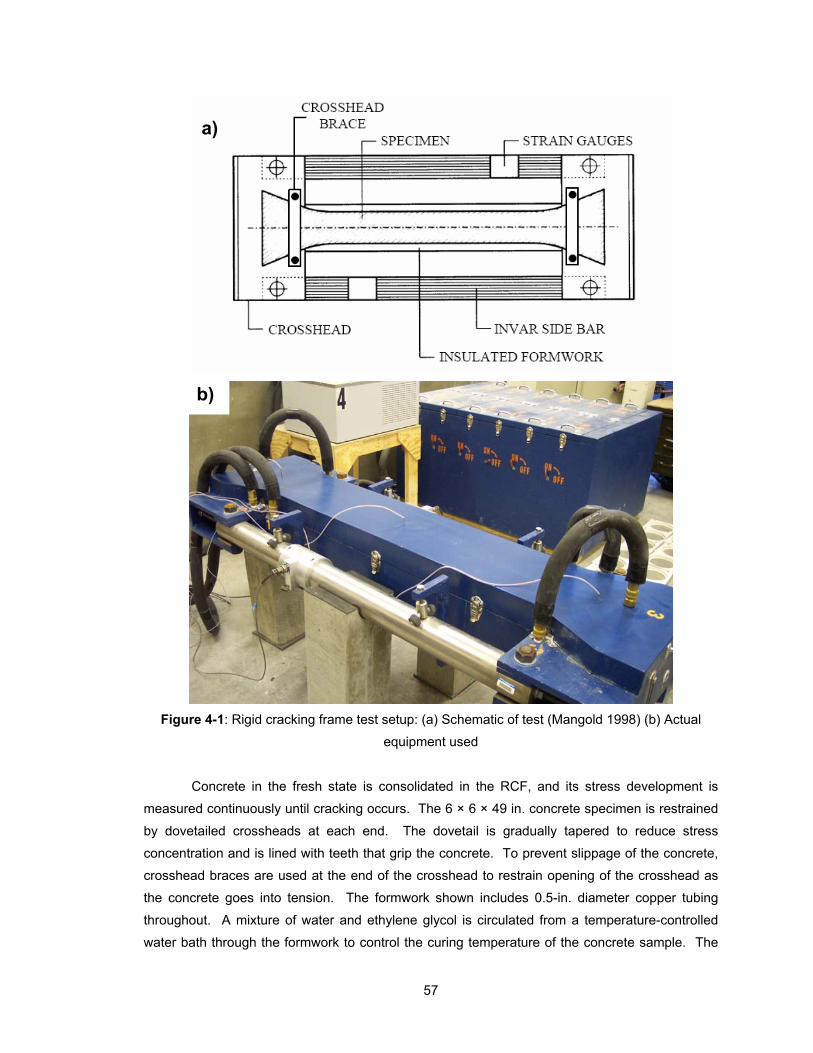
57
Figure 4-1: Rigid cracking frame test setup: (a) Schematic of test (Mangold 1998) (b) Actual
equipment used
Concrete in the fresh state is consolidated in the RCF, and its stress development is
measured continuously until cracking occurs. The 6 × 6 × 49 in. concrete specimen is restrained
by dovetailed crossheads at each end. The dovetail is gradually tapered to reduce stress
concentration and is lined with teeth that grip the concrete. To prevent slippage of the concrete,
crosshead braces are used at the end of the crosshead to restrain opening of the crosshead as
the concrete goes into tension. The formwork shown includes 0.5-in. diameter copper tubing
throughout. A mixture of water and ethylene glycol is circulated from a temperature-controlled
water bath through the formwork to control the curing temperature of the concrete sample. The
a)
b)
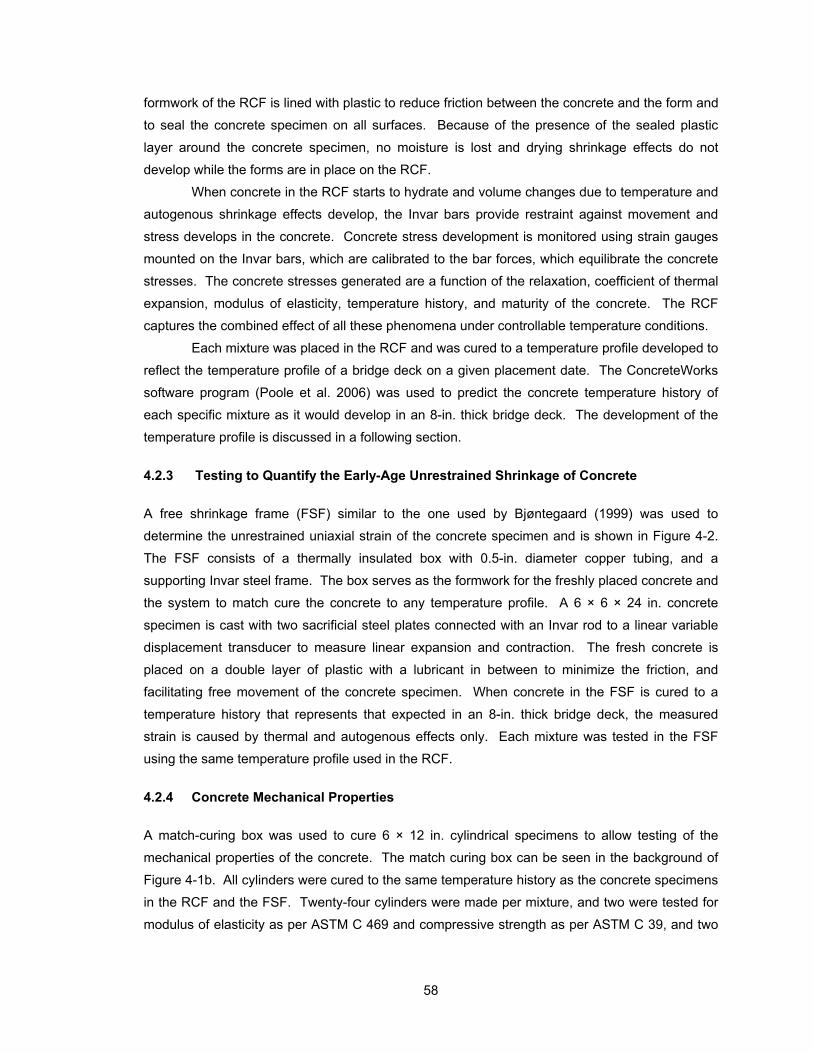
58
formwork of the RCF is lined with plastic to reduce friction between the concrete and the form and
to seal the concrete specimen on all surfaces. Because of the presence of the sealed plastic
layer around the concrete specimen, no moisture is lost and drying shrinkage effects do not
develop while the forms are in place on the RCF.
When concrete in the RCF starts to hydrate and volume changes due to temperature and
autogenous shrinkage effects develop, the Invar bars provide restraint against movement and
stress develops in the concrete. Concrete stress development is monitored using strain gauges
mounted on the Invar bars, which are calibrated to the bar forces, which equilibrate the concrete
stresses. The concrete stresses generated are a function of the relaxation, coefficient of thermal
expansion, modulus of elasticity, temperature history, and maturity of the concrete. The RCF
captures the combined effect of all these phenomena under controllable temperature conditions.
Each mixture was placed in the RCF and was cured to a temperature profile developed to
reflect the temperature profile of a bridge deck on a given placement date. The ConcreteWorks
software program (Poole et al. 2006) was used to predict the concrete temperature history of
each specific mixture as it would develop in an 8-in. thick bridge deck. The development of the
temperature profile is discussed in a following section.
4.2.3 Testing to Quantify the Early-Age Unrestrained Shrinkage of Concrete
A free shrinkage frame (FSF) similar to the one used by Bjøntegaard (1999) was used to
determine the unrestrained uniaxial strain of the concrete specimen and is shown in Figure 4-2.
The FSF consists of a thermally insulated box with 0.5-in. diameter copper tubing, and a
supporting Invar steel frame. The box serves as the formwork for the freshly placed concrete and
the system to match cure the concrete to any temperature profile. A 6 × 6 × 24 in. concrete
specimen is cast with two sacrificial steel plates connected with an Invar rod to a linear variable
displacement transducer to measure linear expansion and contraction. The fresh concrete is
placed on a double layer of plastic with a lubricant in between to minimize the friction, and
facilitating free movement of the concrete specimen. When concrete in the FSF is cured to a
temperature history that represents that expected in an 8-in. thick bridge deck, the measured
strain is caused by thermal and autogenous effects only. Each mixture was tested in the FSF
using the same temperature profile used in the RCF.
4.2.4 Concrete Mechanical Properties
A match-curing box was used to cure 6 × 12 in. cylindrical specimens to allow testing of the
mechanical properties of the concrete. The match curing box can be seen in the background of
Figure 4-1b. All cylinders were cured to the same temperature history as the concrete specimens
in the RCF and the FSF. Twenty-four cylinders were made per mixture, and two were tested for
modulus of elasticity as per ASTM C 469 and compressive strength as per ASTM C 39, and two
59
were tested for splitting tensile strength as per ASTM C 496 at concrete ages of ½, 1, 2, 3, 7, and
28 days.
Formwork Insulation
Bolts to “free” specimen after
final set
Steel end plate Movable steel plate
20” “effective” specimen length
1/8” Invar rod
Concrete specimen
Anchorage disk
Plastic sheeting
½” Copper tubing
Sleeve for Invar rod removal
Figure 4-2: Free shrinkage frame test setup: a) Schematic of test (Meadows 2007) b) Actual
equipment used
4.2.5 Modeling of Bridge Deck Temperatures
The temperature profile that an in-place concrete element experiences is a function of the
geometry of the element, the concrete mixture proportions, the chemical composition of the
cementing materials, the hydration parameters of the cementing materials, the placement
b)
a)
60
temperature, the thermal conductivity of the aggregate, and environmental effects such as
ambient temperature, wind speed, and incoming solar radiation.
To assess the effect of placement and curing temperature, the concrete modeling
software ConcreteWorks (Poole et al. 2006) was used to determine the temperature profile that
an 8-in. thick bridge deck constructed on stay-in-place metal forms would to experience. In the
model it is assumed that external curing is provided by a curing blanket with R-value of 2.9 hr·ft2
°F/BTU. Three placement situations were investigated: summer, fall, and winter conditions.
Bridge deck temperatures for summer, fall, and winter placements were determined for
Montgomery, Alabama on construction dates of August 15, October 15, and January 15,
respectively. The average daily temperatures for this location and these summer, fall, and winter
placement dates are about 95°F, 73°F, and 50 °F, respectively. Semi-adiabatic calorimetry was
used to determine the hydration parameters of each mixture (Schindler and Folliard 2005). Using
the hydration parameters, as well as the placement date, city, bridge geometry, aggregate type
and thermal conductivity, mixture proportions, placement temperature, wind speed, ambient
relative humidity, and percent cloud cover, a temperature profile was generated.
4.2.6 Temperature Conditions and Material Conditioning
The control mixture was tested at each of the three temperature conditions to evaluate the effect
of placement and curing temperature on time to initial cracking. When mixtures were tested at a
temperature other than fall conditions (73 °F placement temperature), the raw materials were
placed in an environmental chamber and conditioned to obtain fresh concrete temperatures of
approximately 95 °F and 50°F for summer and winter placement conditions, respectively. As
discussed previously, the mixtures with SCM replacements were tested only under summer
placement conditions. The no-SCM 0.36 mixture was tested at summer and fall placement
conditions.
4.2.7 Materials
4.2.7.1 Cementitious Materials
Type I portland cement, manufactured by Lafarge North America in Calera, Alabama was used in
all the concrete mixtures. The result of the chemical analysis and fineness for the cement is
shown in Table 4-2. The following SCMs were used:
Class C fly ash—distributed by Holcim Ltd. (Quinton, Alabama),
Class F fly ash—distributed by Boral Materials (Cartersville, Alabama), and
Grade 120 slag cement—distributed by Buzzi Unicem (New Orleans, Louisiana).
The properties of the SCMs as tested by an external lab are shown in Table 4-2. Note that this
Class C fly ash is from the same source used during the construction of the US 331 bridge deck.

61
4.2.7.2 Aggregate
The coarse aggregate for the project was an ASTM C 33 No. 67 gradation, siliceous river gravel.
The fine aggregate used throughout the project was siliceous river sand. Both aggregate types
were obtained from Martin Marietta Materials’ quarry located in Shorter, Alabama.
4.3 RESULTS AND DISCUSSION
The zero-stress time and temperature and the cracking time and temperature for all tests are
summarized in Table 4-3. For placement under the same temperature conditions, the later the
time to cracking and the lower the cracking temperature, the better the resistance to early-age
cracking of a mixture.
Table 4-3: Summary of important values obtained from RCF tests
RCF Test Results
Zero Stress Cracking Mixture Placement Temperature(Condition)
Time, hrs Temp., °F Time, hrs Temp., °F
50 °F (Winter) 20.5 58.2 76.3 51.5
73 °F (Fall) 12.3 103.2 47.1 71.3 CTRL
95 °F (Summer) 11.2 134.3 42.7 88.7
73 °F (Fall) 16.8 109.2 41.7 76.3 0.36
95 °F (Summer) 14.5 131.4 39.5 92.1
30C 17.9 117.6 122.5 83.8
20F 13.7 125.9 73.8 83.8
50S
95 °F (Summer)
33.6 108.9 173.4 69.3
4.3.1 Influence of Temperature
The temperature profile data and the RCF and FSF results for the control mixture at all three
placement conditions are presented in Figure 4-3. Decreasing the placement and curing
temperatures delays and decreased the temperature peak shown in Figure 4-3a, which
decreased the zero stress temperature and increased the zero stress time as shown in Table 4-3.

62
Figure 4-3: Measured results for the control mixture placed under summer, fall and winter
placement conditions a) Temperature profiles b) Stresses from RCF, and c) FSF strains
-100
0
100
200
300
400
0 24 48 72 96 120
Concrete Age (hrs)
Co
ncr
ete
Str
ess
(psi
)
-0.7
0.0
0.7
1.4
2.1
2.8
Co
ncr
ete
Str
ess
(MP
a)CTRL (50F)
CTRL (95F)
CTRL (73F)
Tension
Compression
b)
40
60
80
100
120
140
160
0 24 48 72 96 120
Concrete Age (hrs)
Co
ncr
ete
Tem
per
atu
re (
°F)
4
16
27
38
49
60
71
Co
ncr
ete
Tem
per
atu
re (
°C)CTRL (73F)
CTRL (95F)
CTRL (50F)
a)
-400
-300
-200
-100
0
100
0 24 48 72 96 120
Concrete Age (hrs)Fre
e S
hri
nka
ge
Str
ain
(x
10-6
in./i
n.)
CTRL (50F)
CTRL (73F)
CTRL (95F)
c)

63
Decreasing the placement and curing temperature reduced stresses and delayed
cracking as shown in Figure 4-3b. The free shrinkage data, shown in Figure 4-3c, reveal that a
decrease in placement and curing temperature causes a decrease in thermal strain, which in turn
leads to reduced stresses. Breitenbücher and Mangold (1994) also found that decreasing the
temperature of the fresh concrete significantly increased the time to cracking. These results
confirm that the thermal stresses that develop during summer placements are much higher than
those that develop during winter placements.
4.3.2 Influence of Fly Ash and Slag Cement
The temperature profile data and the RCF and FSF results for the control mixture and the SCM
mixtures for the summer placement condition are presented in Figure 4-4. The splitting tensile
strength and modulus of elasticity development for the control and SCM mixtures are shown in
Figure 4-5.
Increasing the replacement of cement with an SCM decreased the rate of hydration and
maximum temperature reached, as shown in Figure 4-4a. The reduction in rate of hydration
delayed the rate of splitting tensile strength and modulus of elasticity development, as shown in
Figure 4-5. The reduced rate of temperature development and stiffness development that
accompanied the use of SCMs increased the time to zero stress, decreased the zero-stress
temperature, and increased the time to cracking show in Table 4-3.
The 30% Class C ash mixture had not cracked at 120 hours. Inspection of Figure 4-4b
indicates that this mixture had undergone more than two complete days of approximately identical
temperature cycles at that point and was unlikely to crack under continued application of the
intended temperature profile. In an effort to determine the cracking temperature and stress, it
was artificially cooled at a rate of 1.8 °F/hr to induce cracking, which occurred 2.5 hours later.
Similarly, the 50% slag cement mixture did not crack under the summer temperature profile.
However, similar artificial cooling of this specimen was unintentionally delayed until 168 hours. It
cracked after about 5 hours of artificial cooling. The control mixture and the 20% Class F fly ash
mixture each cracked under the effects of the summer placement temperature profile without
artificial cooling. Considering that the true cracking times for the 30% Class C ash mixtures and
50% slag cement mixtures would have been even greater than the values reported in Table 4-3, it
is evident that the cracking times for the SCM mixtures were significantly greater than the
cracking time for the control mixture when placed under summer conditions.

64
Figure 4-4: Measured results for the control and SCM mixtures placed under summer conditions
a) Temperature profiles b) Stresses from RCF, and c) FSF strains
-100
0
100
200
300
400
0 24 48 72 96 120 144 168 192
Concrete Age (hrs)
Co
ncr
ete
Str
ess
(psi
)
-0.7
0.0
0.7
1.4
2.1
2.8
Co
ncr
ete
Str
ess
(MP
a)
30C (95F)20F (95F)50S (95F)CTRL (95F)
b)
Tension
Compression
40
60
80
100
120
140
160
0 24 48 72 96 120 144 168 192Concrete Age (hrs)
Co
nc
rete
Te
mp
era
ture
(°F
)
4
16
27
38
49
60
71
Co
ncr
ete
Tem
per
atu
re (
°C)
CTRL (95F)20F (95F)50S (95F)30C (95F)
a)
-400
-300
-200
-100
0
100
0 24 48 72 96 120 144 168 192
Concrete Age (hrs)
Fre
e S
hri
nka
ge
Str
ain
(x
10-6
in./
in.) CTRL (95F)
30C (95F)20F (95F)50S (95F)
c)

65
The use of SCMs caused a significant reduction of the free shrinkage in the first 24 hours
relative to the control mixture as shown in Figure 4-4c. This reduction in free shrinkage strain and
the reduced rate of modulus of elasticity development resulted in a reduced stress development
when SCMs were used. The 50% slag cement and 30% Class C fly ash mixtures increased the
time of cracking by more than 100 percent over the control mixture placed under summer
conditions. Although the 20% Class F fly ash mixture was not as effective in reducing the
cracking tendency of the concrete, it too reduced the cracking tendency of the control mixture.
These findings are significant the results shown in Figure 4-5a indicate that the use of SCMs
reduces early-age splitting tensile strength; however, the combined effect of reduced rate of heat
generation and modulus of elasticity development results in an overall improvement in cracking
resistance.
Figure 4-5: Measured results for the control and SCM mixtures a) Splitting tensile strength
development, and b) Modulus of elasticity development
Springenschmid and Breitenbücher (1998) found fly ash to reduce the cracking
temperature. In the present study, it was found that the use of fly ash or slag cement caused a
0
100
200
300
400
500
600
0 24 48 72 96 120 144 168 192
Concrete Age (hrs)
Sp
litin
g T
ensi
le S
tren
gth
(p
si)
0.0
0.7
1.4
2.1
2.8
3.5
4.1
Sp
litin
g T
ensi
le S
tren
gth
(M
Pa)
30C (95F)20F (95F)50S (95F)CTRL (95F)
a)
0
1000
2000
3000
4000
5000
6000
7000
0 24 48 72 96 120 144 168 192Concrete Age (hrs)
Mo
du
lus
of
Ela
stic
ity
(ksi
)
0
7
14
21
28
35
41
48
Mo
du
lus
of
Ela
stic
ity
(GP
a)
30C (95F)
20F (95F)
50S (95F)
CTRL (95F)
b)
66
reduction in the cracking temperature. In their study, Breitenbücher and Mangold (1998)
concluded that slag cement reduces temperature rises and tensile stresses. These findings are
also valid for the slag cement mixtures evaluated in this study. From the results of this study, it
may be concluded that the use of SCMs under hot weather conditions can substantially reduce
the development of tensile stresses due to thermal and autogenous shrinkage effects.
4.3.3 Influence of Water-to-Cement Ratio
The temperature profile data and the RCF and FSF results for the control and w/c of 0.36
mixtures placed under summer and fall conditions are presented in Figure 4-6. As shown in
Table 4-1, the w/c was decreased by increasing the cement content and decreasing the water
content to maintain a constant paste volume. The increase in cement caused an increase in
peak temperatures as shown in Figure 4-6a. The increased peak temperature decreased the
time to cracking.
4.4 CONCLUSIONS
Early-age cracking in bridge decks is a severe problem that may reduce its functional life. Testing
of restrained and unrestrained specimens was done under temperature conditions that match
those in an 8-in. bridge deck to explore early-age cracking mechanisms of bridge deck concretes.
The influence of supplementary cementing materials (SCMs), water-cement ratio (w/c), and
placement and curing temperature was evaluated. Five concrete mixtures were made under
various controlled temperature conditions, while measuring the stress development from concrete
placement until cracking. The results of this study support the following conclusions:
Higher placement and curing temperatures result in higher thermal stresses. Decreasing
the placement and curing temperature can reduce stresses and delay cracking.
The use of SCMs can be very effective in delaying cracking under summer placement
conditions. Increasing the replacement of cement with an SCM decreases the rate of
hydration and maximum temperature. The resulting reduction and delay in the
development of tensile stresses more than compensates for the slower development of
early-age tensile strength associated with cement replacement by SCM. The combined
effect of reduced rate of heat generation and modulus of elasticity development results in
an overall improvement in cracking resistance.
The mixtures with 30% Class C Fly ash and the 50% slag cement replacements were
most effective in delaying cracking under summer placement conditions, when thermal
stresses are most severe.
Decreasing the w/c while maintaining a constant paste content leads to an increase in
cement content, an increase in peak temperature, and a decrease in time to cracking.
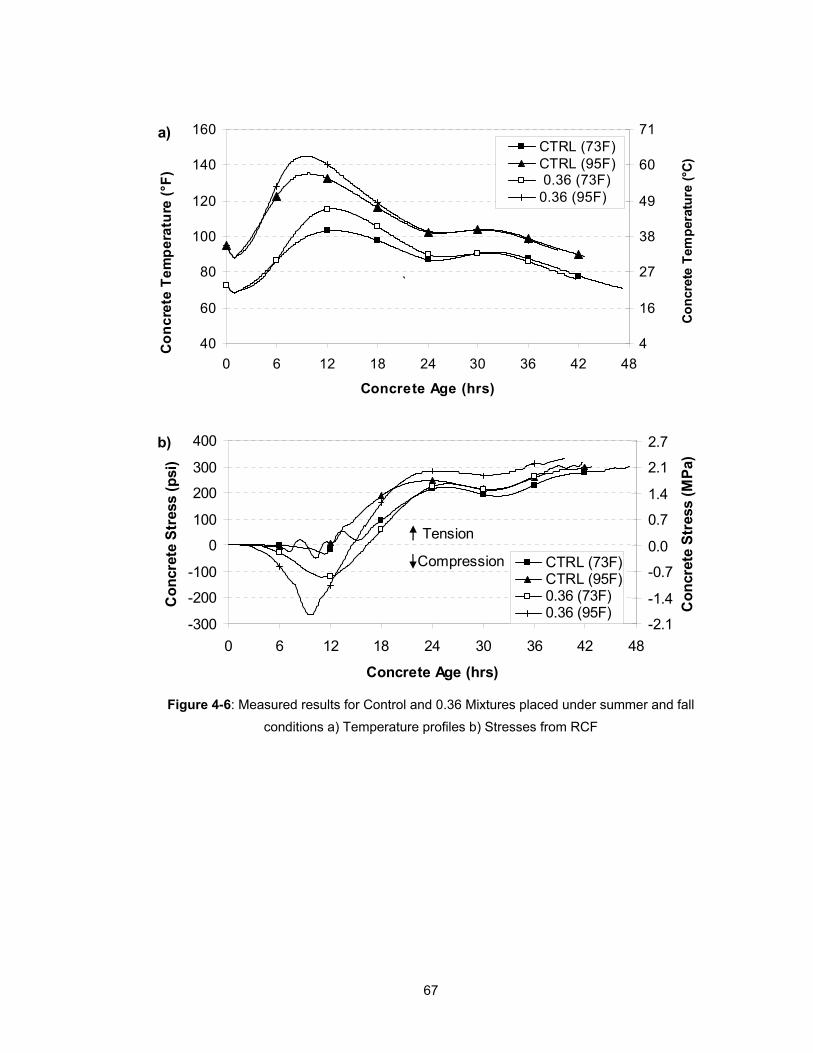
67
Figure 4-6: Measured results for Control and 0.36 Mixtures placed under summer and fall
conditions a) Temperature profiles b) Stresses from RCF
-300
-200
-100
0
100
200
300
400
0 6 12 18 24 30 36 42 48
Concrete Age (hrs)
Co
ncr
ete
Str
ess
(psi
)
-2.1
-1.4
-0.7
0.0
0.7
1.4
2.1
2.7
Co
ncr
ete
Str
ess
(MP
a)
CTRL (73F)CTRL (95F)0.36 (73F)0.36 (95F)
Tension
Compression
b)
40
60
80
100
120
140
160
0 6 12 18 24 30 36 42 48
Concrete Age (hrs)
Co
nc
rete
Te
mp
era
ture
(°F
)
4
16
27
38
49
60
71
Co
ncr
ete
Tem
per
atu
re (
°C)
CTRL (73F)CTRL (95F) 0.36 (73F)0.36 (95F)
a)
`

68
Chapter 5
Coefficient of Thermal Expansion of Bridge Deck Concrete
5.1 INTRODUCTION
In this section, the work performed to determine the coefficient of thermal expansion (CTE) of
various concretes made with Alabama materials is discussed. The set configuration used
complied with AASHTO TP60 (2004), which was the only available AASHTO or ASTM test
available to determine the CTE at the time that this study was completed. The setup used for the
AASHTO TP 60 test is shown in Figure 5-1.
Figure 5-1: Coefficient of thermal expansion test setup (AASHTO TP 60 2004)
5.2 EXPERIMENTAL TESTING PROGRAM
The testing program was developed to evaluate the effects of coarse aggregate type and volume,
water-cement ratio, and sand-aggregate ratio on the concrete CTE. Fifty-four concrete samples
were tested at the concrete age of 28 days for their CTE. The experimental testing program used
is defined in Table 5-1.
Siliceous river gravel, dolomitic limestone, and granite are the coarse aggregates and
siliceous sand is the only fine aggregate used. The sand-aggregate ratios used in this study were
0.40, 0.45, and 0.50, with the water-cement ratios being 0.32, 0.38, and 0.44. These ranges of
sand-aggregate ratio and water-cement ratio capture those typically used in the Alabama

69
concrete industry. For each coarse aggregate type, nine concrete mixtures were made and
tested. Type I portland cement was used and all samples were tested in the saturated state as
required by AASHTO TP 60 (2004).
Table 5-1: Experimental testing program
Coarse Aggregate Type
Fine Aggregate
Type
Sand - Aggregate Ratio
(By Volume)
Water - Cement Ratio
Concrete Sample
Identification
0.32 RG-40-32
0.38 RG-40-38 0.40
0.44 RG-40-44
0.32 RG-45-32
0.38 RG-45-38 0.45
0.44 RG-45-44
0.32 RG-50-32
0.38 RG-50-38
Siliceous River Gravel
Siliceous Sand
0.50
0.44 RG-50-44
0.32 DL-40-32
0.38 DL-40-38 0.40
0.44 DL-40-44
0.32 DL-45-32
0.38 DL-45-38 0.45
0.44 DL-45-44
0.32 DL-50-32
0.38 DL-50-38
Dolomitic Limestone
Siliceous Sand
0.50
0.44 DL-50-44
0.32 GR-40-32
0.38 GR-40-38 0.40
0.44 GR-40-44
0.32 GR-45-32
0.38 GR-45-38 0.45
0.44 GR-45-44
0.32 GR-50-32
0.38 GR-50-38
Granite
0.50
0.44 GR-50-44
5.3 SAMPLE IDENTIFICATION
The methodology adopted to identify the laboratory-prepared concrete samples is shown below in
this section. The sample identification method was developed with consideration of the type of

70
coarse aggregates used, the sand-aggregate ratio, and the water-cement ratio. The concrete
sample identification for all the mixtures tested as part of this study is shown in Table 5-1.
Coarse Aggregate Type - Sand-Aggregate Ratio - Water-Cement Ratio
RG 40 32
DL 45 38
GR 50 44
Identification Code:
Coarse Aggregate Type - Sand-Aggregate Ratio - Water-Cement Ratio
RG = Siliceous River Gravel 40 = 0.40 32 = 0.32
DL = Dolomitic Limestone 45 = 0.45 38 = 0.38
GR = Granite 50 = 0.50 44 = 0.44
Example:
RG-40-32 = Concrete made with siliceous river gravel, with a sand-aggregate ratio of
0.40, and a water-cement ratio of 0.32.
5.4 COEFFICIENT OF THERMAL EXPANSION EQUIPMENT
The equipment and procedure used for the concrete CTE test in accordance with AASHTO TP 60
(2004) is described in this section. This test method determines the CTE of concrete sample
maintained in a saturated condition, by measuring the length change of the sample due to a
specified temperature change. The measured length change is corrected for any change in
length of the measuring apparatus (previously determined), and the CTE is then calculated by
dividing the corrected length change by the temperature change and then the sample length.
5.4.1 Circulator
The Polyscience circulator model 9612 shown in Figure 5-2 was used. It provides precise
temperature control of fluids for open- or closed-loop circulation to attached external equipment.
This model features a 28-liter reservoir with a maximum fill level of about 1 in. below the top of
the reservoir. For optimum cooling efficiency, the fluid level in the reservoir is kept above the
coils at all times. All parts exposed to moisture are corrosion-resistant 300-series stainless steel.
The operational temperature range is from -13 ºF to 302 ºF with a temperature stability of ± 0.018
ºF. The read out accuracy is ± 0.45 ºF. The circulator has a duplex pump that permits circulation
to and from an attached external open bath.
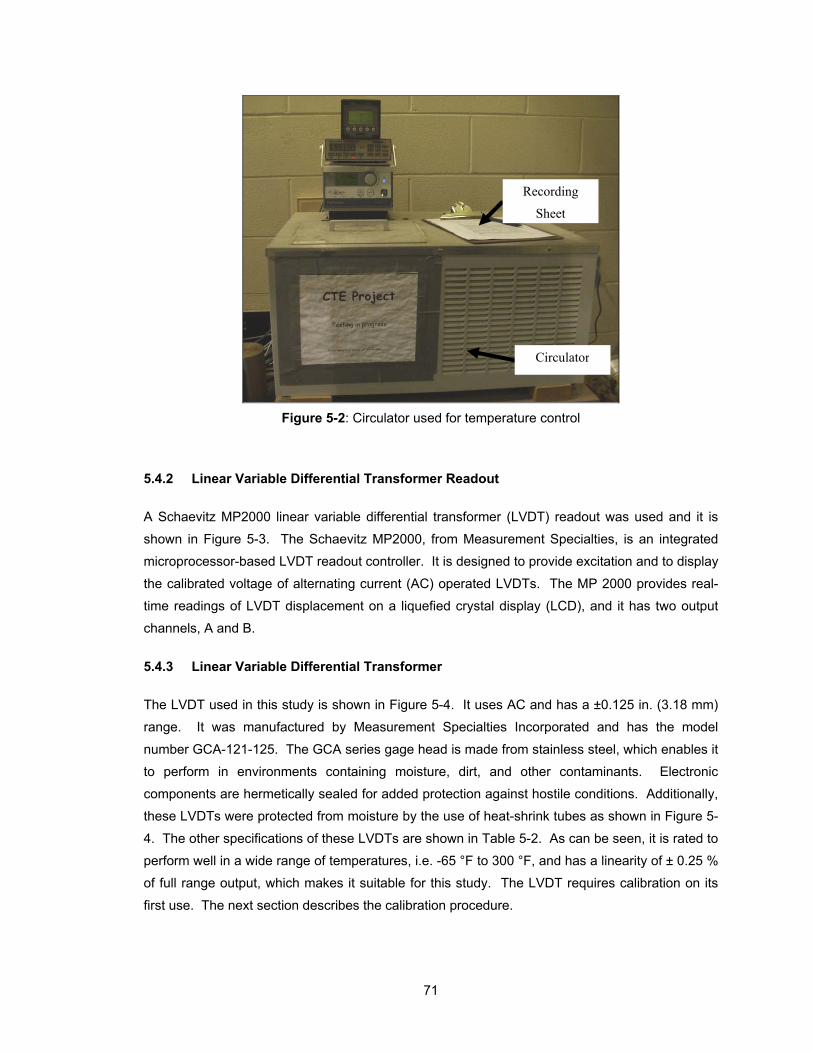
71
Figure 5-2: Circulator used for temperature control
5.4.2 Linear Variable Differential Transformer Readout
A Schaevitz MP2000 linear variable differential transformer (LVDT) readout was used and it is
shown in Figure 5-3. The Schaevitz MP2000, from Measurement Specialties, is an integrated
microprocessor-based LVDT readout controller. It is designed to provide excitation and to display
the calibrated voltage of alternating current (AC) operated LVDTs. The MP 2000 provides real-
time readings of LVDT displacement on a liquefied crystal display (LCD), and it has two output
channels, A and B.
5.4.3 Linear Variable Differential Transformer
The LVDT used in this study is shown in Figure 5-4. It uses AC and has a ±0.125 in. (3.18 mm)
range. It was manufactured by Measurement Specialties Incorporated and has the model
number GCA-121-125. The GCA series gage head is made from stainless steel, which enables it
to perform in environments containing moisture, dirt, and other contaminants. Electronic
components are hermetically sealed for added protection against hostile conditions. Additionally,
these LVDTs were protected from moisture by the use of heat-shrink tubes as shown in Figure 5-
4. The other specifications of these LVDTs are shown in Table 5-2. As can be seen, it is rated to
perform well in a wide range of temperatures, i.e. -65 °F to 300 °F, and has a linearity of ± 0.25 %
of full range output, which makes it suitable for this study. The LVDT requires calibration on its
first use. The next section describes the calibration procedure.
Circulator
Recording
Sheet
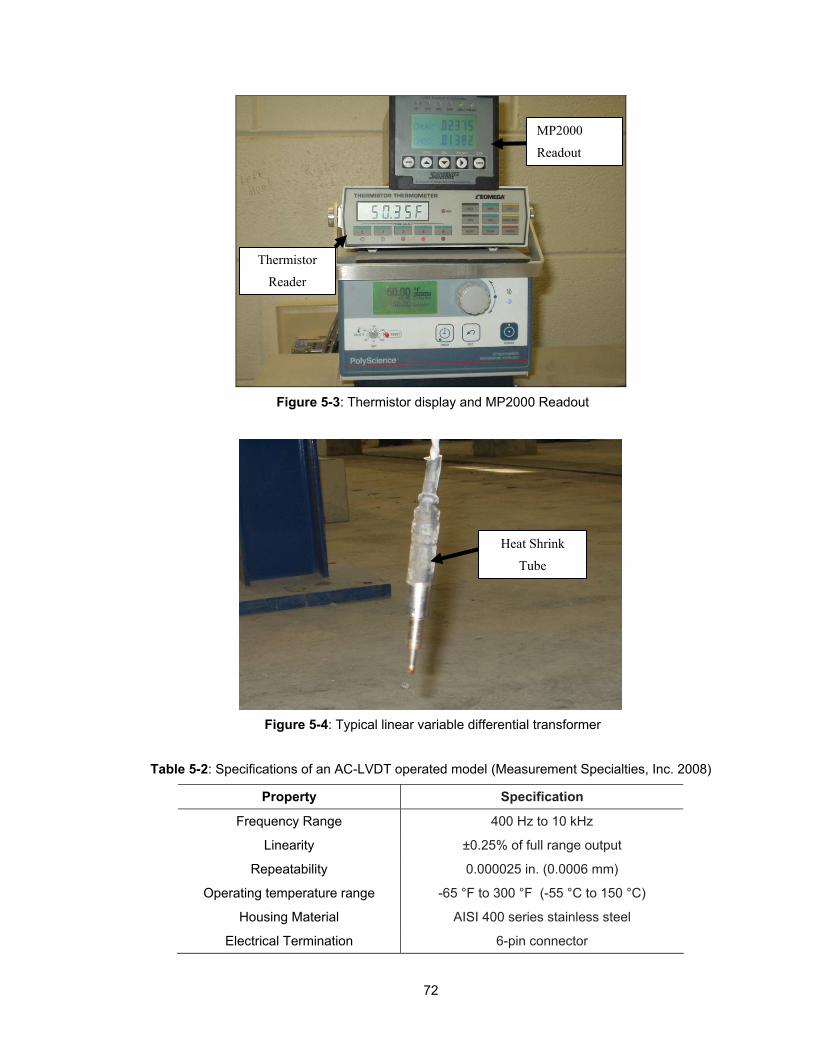
72
Figure 5-3: Thermistor display and MP2000 Readout
Figure 5-4: Typical linear variable differential transformer
Table 5-2: Specifications of an AC-LVDT operated model (Measurement Specialties, Inc. 2008)
Property Specification
Frequency Range 400 Hz to 10 kHz
Linearity ±0.25% of full range output
Repeatability 0.000025 in. (0.0006 mm)
Operating temperature range -65 °F to 300 °F (-55 °C to 150 °C)
Housing Material AISI 400 series stainless steel
Electrical Termination 6-pin connector
MP2000
Readout
Thermistor
Reader
Heat Shrink
Tube

73
5.4.3.1 LVDT Calibration Procedure
A micrometer screw gage was used to induce a controlled displacement of 0.100 in. in known
increment to the LVDT as shown in Figure 5-5. The amount of displacement exceeds the largest
displacement anticipated during a CTE test.
Figure 5-5: LVDT connected to a micrometer screw gage
5.4.4 External Water Tank
A rectangular stainless steel tank was used as shown in Figure 5-6. It has dimensions of 23 in.
(length) x 21 in. (width) x 20 in. (height) with an insulated-wall thickness of 1 in. Each wall of the
tank is insulated to minimize temperature loss during the test.
Figure 5-6: External water tank
5.4.5 Thermistor Reader
A thermistor is a temperature-sensing element composed of sintered semiconductor material,
which exhibits a change in resistance proportional to a small change in temperature (Omega
Restricting
Valve
Flexible
tube
LVDT
Micrometer

74
Engineering, Inc. 2008). The thermistor reader used is shown in Figure 5-3. It was manufactured
by Omega Engineering, Inc. and has the model number 5830. It is a portable instrument, which
measures and displays the temperature of up to five different readings from -22 °F to 212 °F.
The thermistor reader reads thermistor probes and displays the readings on a five digit LCD on
the front panel.
5.4.6 Thermistor Probes
The thermistor probes with model number ON-403-PP, manufactured by Omega Engineering,
Inc., were used as shown in Figure 5-7. The probes were made of stainless steel with a diameter
of 1/8 in. and a length of 4 ½ in.
Figure 5-7: Thermistor probe
5.4.6.1 Calibration of the Thermistor Reader
The Omega thermistor reader required calibration before use. Five resistors, 106.2K Ohm
0.05%, each wired across a separate standard 1/4” phone plug and hence marked “Hi Cal” and
Five resistors, 407.1 Ohm 0.05 %, each wired across a separate standard ¼ in. phone plug and
hence marked “Lo Cal” were required for the calibration.
5.4.7 Frames
The frame used in this study is shown in Figure 5-8. The frame is made of Invar and has a total
height of 13.75 in. The supporting vertical bars have a diameter of 0.75 in. The base plate has
dimensions of 10.25 in. (length) x 10.25 in. (width) x 0.75 in. (thickness). The cross bar with
dimensions of 9.75 in. (length) x 2.0 in. (width) x 0.75 in. (thickness) is positioned by nuts at a
height of about 8.0 in. above the top of the base plate.

75
Figure 5-8: Manufactured Invar frame
5.4.8 Assembly of the Components for the AASHTO TP 60 (2004) Test
The complete setup for the AASHTO TP 60 (2004) is shown in Figure 5-9. The circulator was
connected to the external water tank by means of suction and pressure flexible tubing. A flow-
restriction valve (shown in Figure 5-6) was installed on the pressure (outlet) tubing and adjusted
to match the return suction (inlet) flow rate.
Figure 5-9: AASHTO TP 60 (2004) test setup
The circulator’s water reservoir was filled to a level of 1 in. below its top, while the water
level in the external water tank was filled such that the level matched that of the water level in the
circulator’s reservoir. The cables of the thermistor probes were plugged into the rear of the
thermistor reader with the temperature probes positioned using Plexiglas sheets in the external

76
water bath (see Figure 5-10) specifically prepared to hold these probes. The LVDTs were then
connected by cables to the MP2000 reader. The LVDT was held in position on the Invar cross
bar by a nut. The cross bar was then fixed onto the Invar frames by nuts. Two frames were
used, and they were made to sit side by side in the external water tank.
Figure 5-10: External water bath for the two Invar frames containing concrete samples
5.5 LABORATORY PROCEDURES
This section briefly describes the procedures for the laboratory work undertaken. All concrete
mixing was conducted in an enclosed, air-conditioned concrete laboratory. Portland cement was
received and stored in standard 94-lb sacks. The coarse and fine aggregates were stored in
sealed 55-gallon drums. The aggregates were replenished from large stockpiles stored outdoors
at Sherman Industries ready-mixed concrete plant in Auburn, Alabama.
5.5.1 Batching and Mixing
Prior to batching, moisture corrections were performed on both the fine and coarse aggregates.
Once the moisture corrections were performed, all materials were batched using weight batching
into 5-gallon buckets. In an attempt to prevent moisture gain or loss, the buckets were sealed
with lids. The total batch size made was three cubic feet, usually with about 50 % being waste.
The mixing room where all the concrete was mixed is shown in Figure 5-11. The procedure used
to mix concrete was in accordance with AASHTO T 126 (2001).
Plexiglass Plate to hold
thermistor probes

77
Figure 5-11: Concrete mixing room
5.5.2 Assessment of Fresh Concrete Properties
On completion of mixing, the following tests were performed to assess fresh concrete properties
according to the standards indicated:
slump in accordance with ASTM C 143 (2003),
unit weight in accordance with ASTM C 138 (2001),
total air content in accordance with ASTM C 231 (2004), and
fresh concrete temperature in accordance with ASTM C 1064 (2004).
5.5.3 Sample Preparation
The AASHTO TP 60 (2004) procedure requires that tests should be carried out on 4 in. diameter
x 7 in. high concrete samples. Therefore, before mixing, the 4 in. x 8 in. plastic cylinder molds
were trimmed to 7 in. in height using an electric-powered saw blade.
All test specimens were made in accordance with ASTM C 192 (2002). Nine cylinders
were made for each concrete batch. This comprised of six 4 in. x 7 in. cylinders and three 6 in. x
12 in. cylinders. Each 6 in. x 12 in. cylinder was made in three equal lifts of concrete, and each
layer was rodded 25 times with a 5/8-in. tamping rod. For the 4 in. x 7 in. (100 mm x 175 mm)
cylinders, each was made in two equal lifts of concrete, and each layer rodded 25 times with a
3/8-in. tamping rod. The sides of the molds were slightly tapped with a rubber mallet each time a
layer was rodded. A wooden trowel was then used to strike off the surface of the concrete
sample. Next, the cylinders were covered with plastic caps to prevent any loss of moisture.
Typical concrete samples in the hardened state with their identification numbers are shown in
Figure 5-12.
Using the ASTM C 192 (2002) test method, the concrete samples were stripped after a
concrete age of 24 hours and transferred to the moist curing room, where they were kept until a
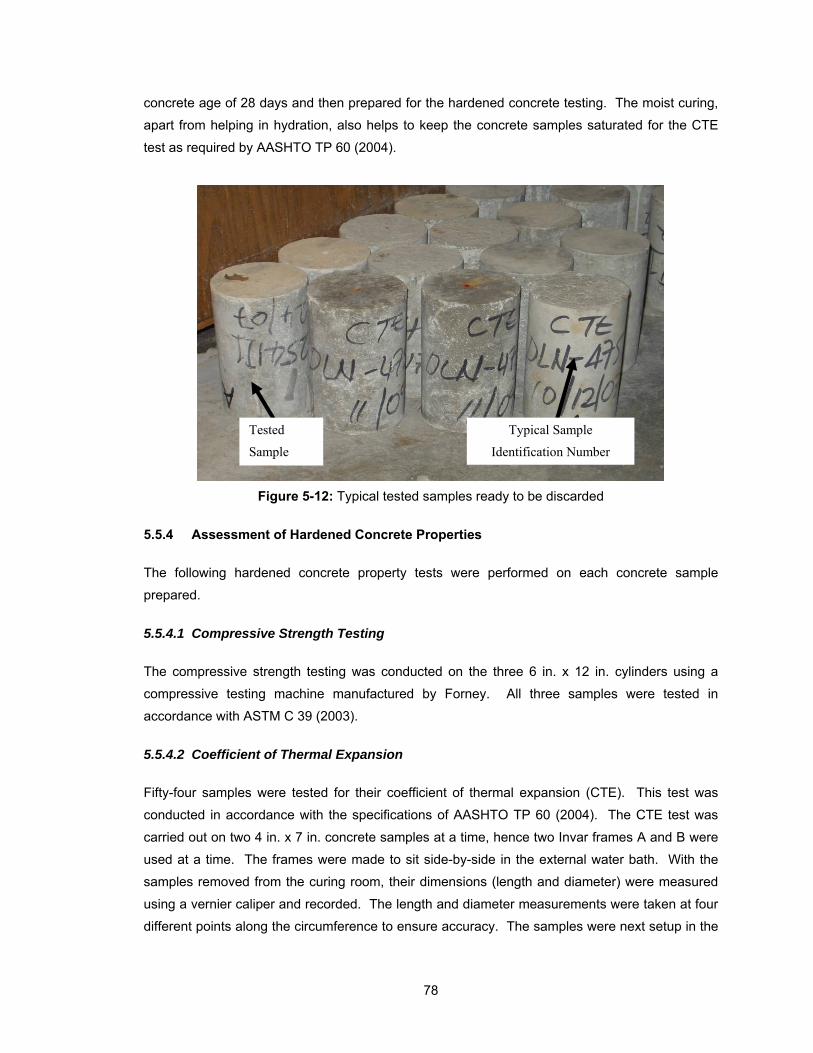
78
concrete age of 28 days and then prepared for the hardened concrete testing. The moist curing,
apart from helping in hydration, also helps to keep the concrete samples saturated for the CTE
test as required by AASHTO TP 60 (2004).
Figure 5-12: Typical tested samples ready to be discarded
5.5.4 Assessment of Hardened Concrete Properties
The following hardened concrete property tests were performed on each concrete sample
prepared.
5.5.4.1 Compressive Strength Testing
The compressive strength testing was conducted on the three 6 in. x 12 in. cylinders using a
compressive testing machine manufactured by Forney. All three samples were tested in
accordance with ASTM C 39 (2003).
5.5.4.2 Coefficient of Thermal Expansion
Fifty-four samples were tested for their coefficient of thermal expansion (CTE). This test was
conducted in accordance with the specifications of AASHTO TP 60 (2004). The CTE test was
carried out on two 4 in. x 7 in. concrete samples at a time, hence two Invar frames A and B were
used at a time. The frames were made to sit side-by-side in the external water bath. With the
samples removed from the curing room, their dimensions (length and diameter) were measured
using a vernier caliper and recorded. The length and diameter measurements were taken at four
different points along the circumference to ensure accuracy. The samples were next setup in the
Tested
Sample
Typical Sample
Identification Number

79
frames, making sure that the lower end of the sample was firmly seated against the support
buttons, and that the LVDT tip was seated against the upper end of the sample.
The temperature of the water bath was set to 50 °F on the circulator. It was allowed to
remain at this temperature until thermal equilibrium of the concrete samples was reached as was
indicated by consistent readings of the LVDT to the nearest 0.00001 in. taken over a one-half
hour period at 10-minute intervals.
The temperature readings were then recorded to the nearest 0.2 °F, and the LVDT
readings were recorded to the nearest 0.00001 in. These were the initial readings. Next, the
temperature of the water bath was set to 122 °F (50 °C). When the bath reached this
temperature, it was allowed to remain at this temperature until thermal equilibrium of the concrete
samples was reached, as explained earlier.
The temperature readings from each of the four sensors and LVDT readings were then
recorded. These formed the second set of readings. The temperature of the water bath was next
set to 50 °F (10 °C) on the circulator. The bath was allowed to remain at this temperature until
thermal equilibrium of the sample was reached. The temperature readings of the four sensors
and LVDT readings were again recorded as stated previously. These were the final readings for
a complete cycle. The whole process was repeated two more times and the average CTE
computed from the test data.
5.5.4.2.1 Correction for Frame Movement
Since the Invar frames expand and contract simultaneously with the concrete sample, a
correction factor for the Invar frames had to be determined and applied in accordance with
AASHTO TP 60 (2004). To determine the correction factor, the AASHTO TP 60 (2004) test was
run on stainless steel calibration samples (shown in Figure 5-13). This calibration test was
performed for each frame.
Figure 5-13: Stainless steel samples used in determining the correction factor
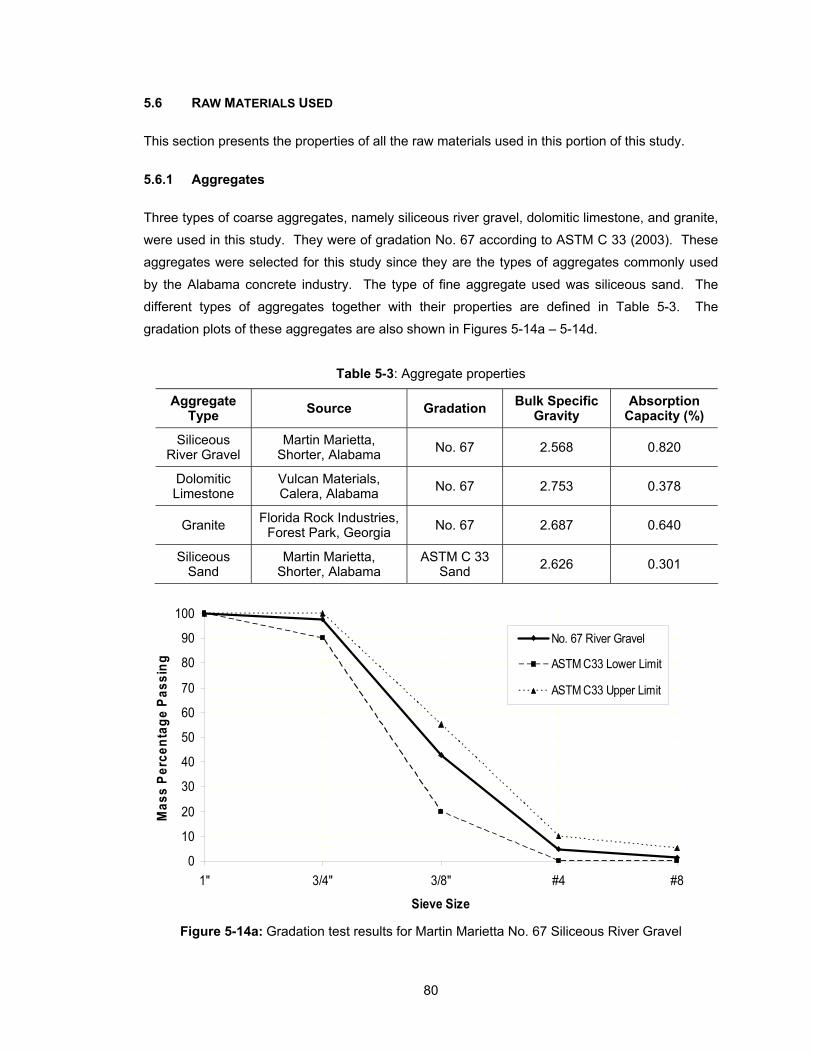
80
5.6 RAW MATERIALS USED
This section presents the properties of all the raw materials used in this portion of this study.
5.6.1 Aggregates
Three types of coarse aggregates, namely siliceous river gravel, dolomitic limestone, and granite,
were used in this study. They were of gradation No. 67 according to ASTM C 33 (2003). These
aggregates were selected for this study since they are the types of aggregates commonly used
by the Alabama concrete industry. The type of fine aggregate used was siliceous sand. The
different types of aggregates together with their properties are defined in Table 5-3. The
gradation plots of these aggregates are also shown in Figures 5-14a – 5-14d.
Table 5-3: Aggregate properties
Aggregate Type Source Gradation Bulk Specific
Gravity Absorption
Capacity (%)
Siliceous River Gravel
Martin Marietta, Shorter, Alabama No. 67 2.568 0.820
Dolomitic Limestone
Vulcan Materials, Calera, Alabama No. 67 2.753 0.378
Granite Florida Rock Industries, Forest Park, Georgia No. 67 2.687 0.640
Siliceous Sand
Martin Marietta, Shorter, Alabama
ASTM C 33 Sand 2.626 0.301
0
10
20
30
40
50
60
70
80
90
100
1" 3/4" 3/8" #4 #8
Sieve Size
Ma
ss
Pe
rce
nta
ge
Pa
ss
ing
No. 67 River Gravel
ASTM C33 Lower Limit
ASTM C33 Upper Limit
Figure 5-14a: Gradation test results for Martin Marietta No. 67 Siliceous River Gravel

81
0
10
20
30
40
50
60
70
80
90
100
1" 3/4" 3/8" #4 #8
Sieve Size
Mas
s P
erce
nta
ge
Pas
sin
g
No. 67 Dolomitic Limestone
ASTM C33 Lower Limit
ASTM C33 Upper Limit
Figure 5-14b: Gradation test results for Vulcan Materials No. 67 Dolomitic Limestone
0
10
20
30
40
50
60
70
80
90
100
1" 3/4" 3/8" #4 #8
Sieve Size
Ma
ss
Pe
rce
nta
ge
Pa
ss
ing
No. 67 Granite
ASTM C33 Lower Limit
ASTM C33 Upper Limit
Figure 5-14c: Gradation test results for Florida Rock Industry No. 67 Granite
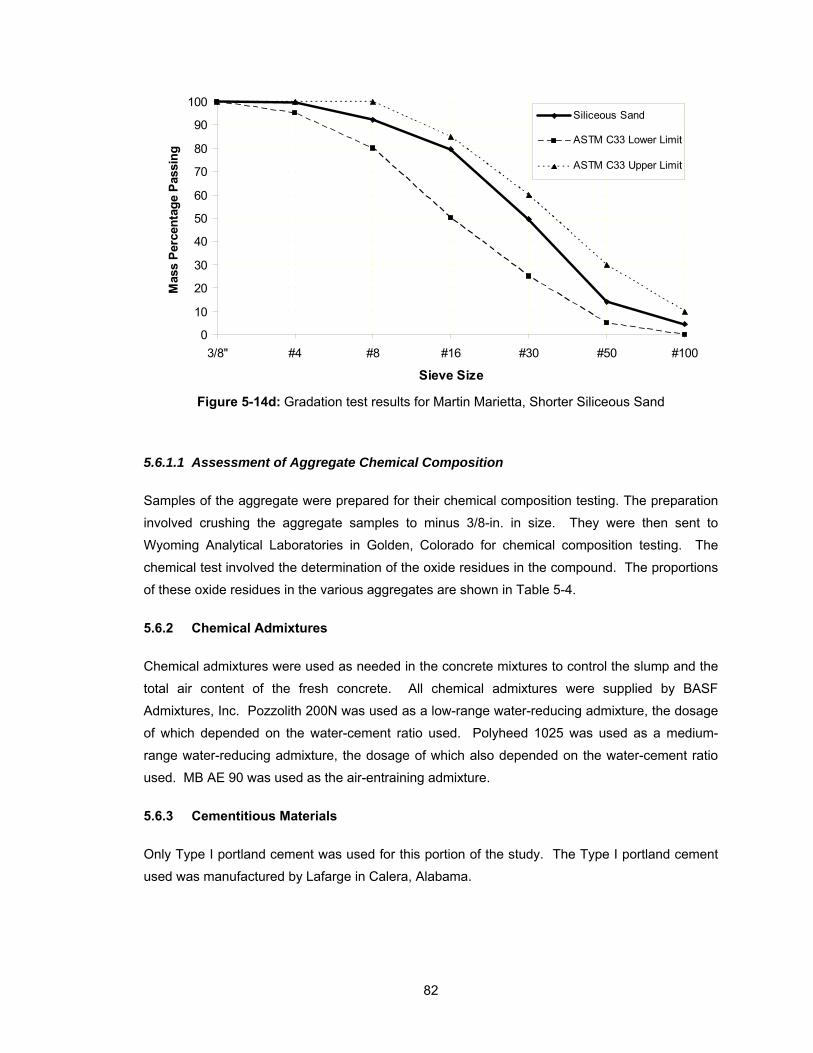
82
0
10
20
30
40
50
60
70
80
90
100
3/8" #4 #8 #16 #30 #50 #100
Sieve Size
Mas
s P
erce
nta
ge
Pas
sin
g
Siliceous Sand
ASTM C33 Lower Limit
ASTM C33 Upper Limit
Figure 5-14d: Gradation test results for Martin Marietta, Shorter Siliceous Sand
5.6.1.1 Assessment of Aggregate Chemical Composition
Samples of the aggregate were prepared for their chemical composition testing. The preparation
involved crushing the aggregate samples to minus 3/8-in. in size. They were then sent to
Wyoming Analytical Laboratories in Golden, Colorado for chemical composition testing. The
chemical test involved the determination of the oxide residues in the compound. The proportions
of these oxide residues in the various aggregates are shown in Table 5-4.
5.6.2 Chemical Admixtures
Chemical admixtures were used as needed in the concrete mixtures to control the slump and the
total air content of the fresh concrete. All chemical admixtures were supplied by BASF
Admixtures, Inc. Pozzolith 200N was used as a low-range water-reducing admixture, the dosage
of which depended on the water-cement ratio used. Polyheed 1025 was used as a medium-
range water-reducing admixture, the dosage of which also depended on the water-cement ratio
used. MB AE 90 was used as the air-entraining admixture.
5.6.3 Cementitious Materials
Only Type I portland cement was used for this portion of the study. The Type I portland cement
used was manufactured by Lafarge in Calera, Alabama.

83
Table 5-4: Chemical analysis results from Wyoming Analytical Laboratories
Percent by Weight Oxide Residue
River Gravel Dolomitic Limestone Granite Siliceous Sand
SiO2 99.20 3.12 65.87 97.42
AL2O3 0.21 0.23 13.99 1.12
Fe2O3 0.24 0.11 3.26 0.48
CaO 0.03 40.16 5.68 0.08
MgO 0.05 11.82 1.69 0.07
Na2O 0.05 0.01 3.90 0.03
K2O 0.02 0.07 2.16 0.37
TiO2 0.03 0.00 0.42 0.14
MnO 0.01 0.01 0.10 0.01
CO2 0.07 44.31 2.62 0.17
Others 0.09 0.18 0.31 0.11
5.7 PRESENTATION AND DISCUSSION OF RESULTS
The results obtained from the laboratory testing program are presented and discussed in this
section. The effect of the coarse aggregate type and volume, water-cement ratio, and sand-
aggregate ratio on concrete CTE are statistically analyzed and discussed. At the end of the
chapter, results from this experimental work are compared with those of the FHWA.
5.7.1 Coefficient of Thermal Expansion Results
The two main hardened concrete properties tested were the compressive strength and coefficient
of thermal expansion (CTE) of concrete at a concrete age of 28 days. A summary of the test
results is shown in Table 5-5.
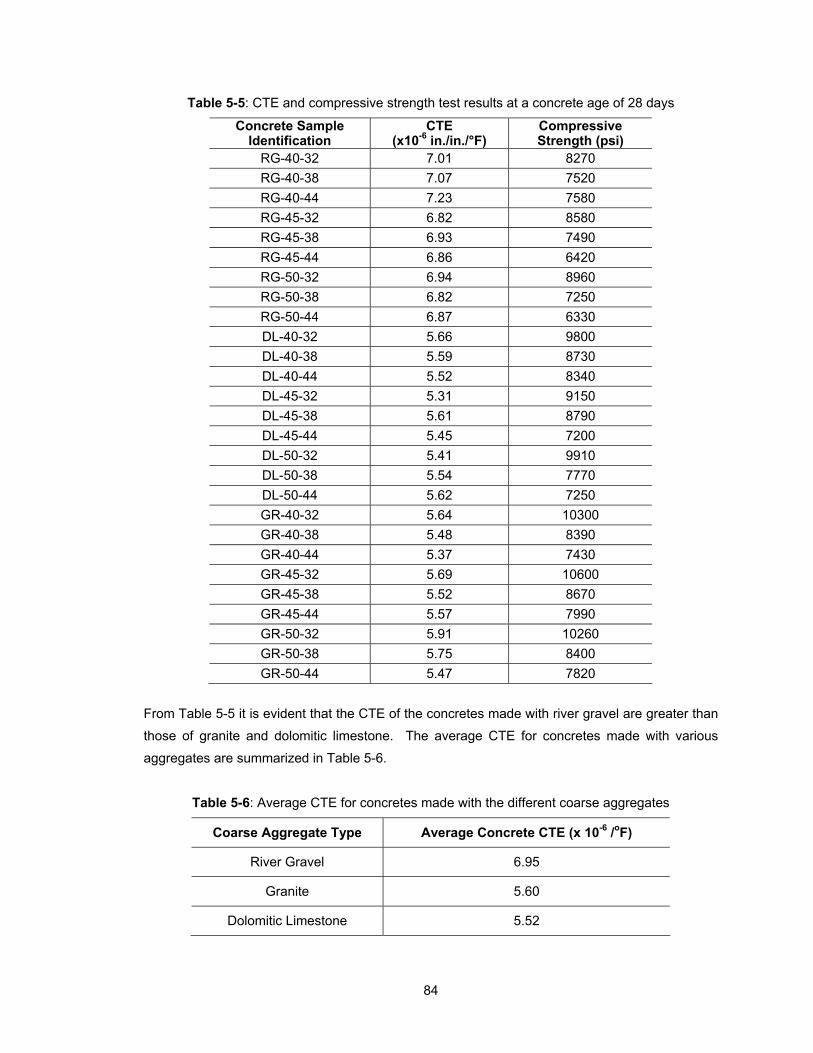
84
Table 5-5: CTE and compressive strength test results at a concrete age of 28 days
Concrete Sample Identification
CTE (x10-6 in./in./°F)
Compressive Strength (psi)
RG-40-32 7.01 8270
RG-40-38 7.07 7520
RG-40-44 7.23 7580
RG-45-32 6.82 8580
RG-45-38 6.93 7490
RG-45-44 6.86 6420
RG-50-32 6.94 8960
RG-50-38 6.82 7250
RG-50-44 6.87 6330
DL-40-32 5.66 9800
DL-40-38 5.59 8730
DL-40-44 5.52 8340
DL-45-32 5.31 9150
DL-45-38 5.61 8790
DL-45-44 5.45 7200
DL-50-32 5.41 9910
DL-50-38 5.54 7770
DL-50-44 5.62 7250
GR-40-32 5.64 10300
GR-40-38 5.48 8390
GR-40-44 5.37 7430
GR-45-32 5.69 10600
GR-45-38 5.52 8670
GR-45-44 5.57 7990
GR-50-32 5.91 10260
GR-50-38 5.75 8400
GR-50-44 5.47 7820
From Table 5-5 it is evident that the CTE of the concretes made with river gravel are greater than
those of granite and dolomitic limestone. The average CTE for concretes made with various
aggregates are summarized in Table 5-6.
Table 5-6: Average CTE for concretes made with the different coarse aggregates
Coarse Aggregate Type Average Concrete CTE (x 10-6 /oF)
River Gravel 6.95
Granite 5.60
Dolomitic Limestone 5.52
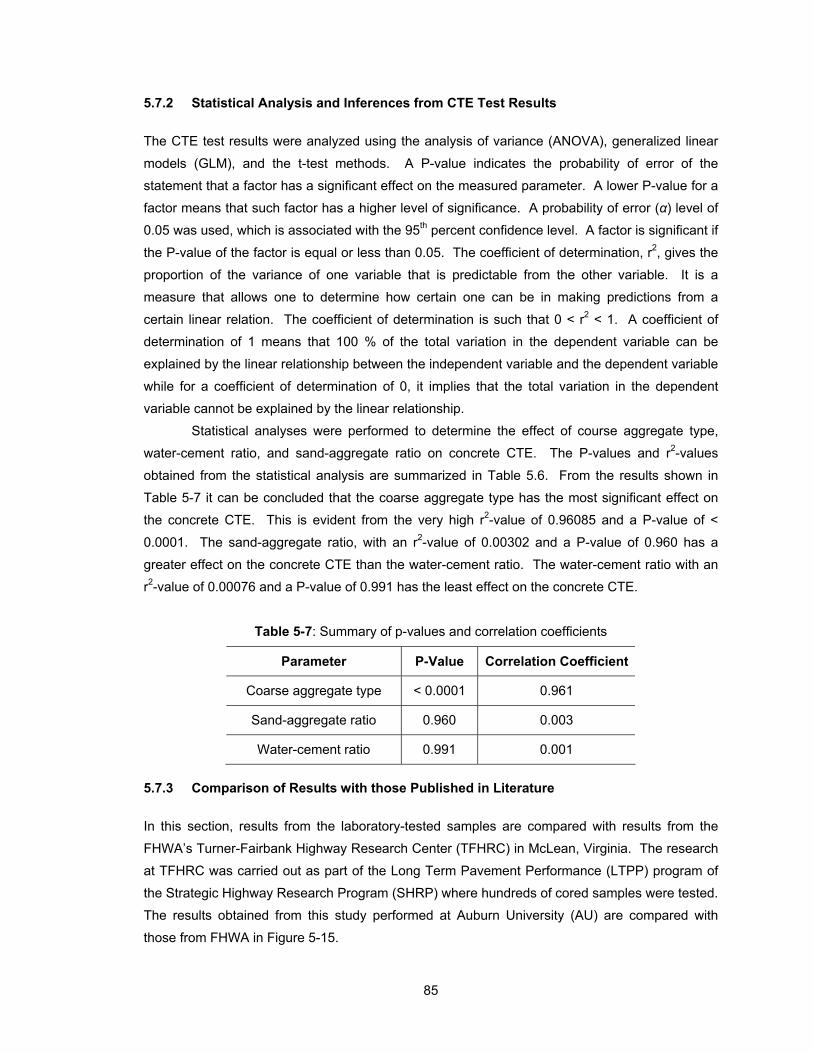
85
5.7.2 Statistical Analysis and Inferences from CTE Test Results
The CTE test results were analyzed using the analysis of variance (ANOVA), generalized linear
models (GLM), and the t-test methods. A P-value indicates the probability of error of the
statement that a factor has a significant effect on the measured parameter. A lower P-value for a
factor means that such factor has a higher level of significance. A probability of error (α) level of
0.05 was used, which is associated with the 95th percent confidence level. A factor is significant if
the P-value of the factor is equal or less than 0.05. The coefficient of determination, r2, gives the
proportion of the variance of one variable that is predictable from the other variable. It is a
measure that allows one to determine how certain one can be in making predictions from a
certain linear relation. The coefficient of determination is such that 0 < r2 < 1. A coefficient of
determination of 1 means that 100 % of the total variation in the dependent variable can be
explained by the linear relationship between the independent variable and the dependent variable
while for a coefficient of determination of 0, it implies that the total variation in the dependent
variable cannot be explained by the linear relationship.
Statistical analyses were performed to determine the effect of course aggregate type,
water-cement ratio, and sand-aggregate ratio on concrete CTE. The P-values and r2-values
obtained from the statistical analysis are summarized in Table 5.6. From the results shown in
Table 5-7 it can be concluded that the coarse aggregate type has the most significant effect on
the concrete CTE. This is evident from the very high r2-value of 0.96085 and a P-value of <
0.0001. The sand-aggregate ratio, with an r2-value of 0.00302 and a P-value of 0.960 has a
greater effect on the concrete CTE than the water-cement ratio. The water-cement ratio with an
r2-value of 0.00076 and a P-value of 0.991 has the least effect on the concrete CTE.
Table 5-7: Summary of p-values and correlation coefficients
Parameter P-Value Correlation Coefficient
Coarse aggregate type < 0.0001 0.961
Sand-aggregate ratio 0.960 0.003
Water-cement ratio 0.991 0.001
5.7.3 Comparison of Results with those Published in Literature
In this section, results from the laboratory-tested samples are compared with results from the
FHWA’s Turner-Fairbank Highway Research Center (TFHRC) in McLean, Virginia. The research
at TFHRC was carried out as part of the Long Term Pavement Performance (LTPP) program of
the Strategic Highway Research Program (SHRP) where hundreds of cored samples were tested.
The results obtained from this study performed at Auburn University (AU) are compared with
those from FHWA in Figure 5-15.
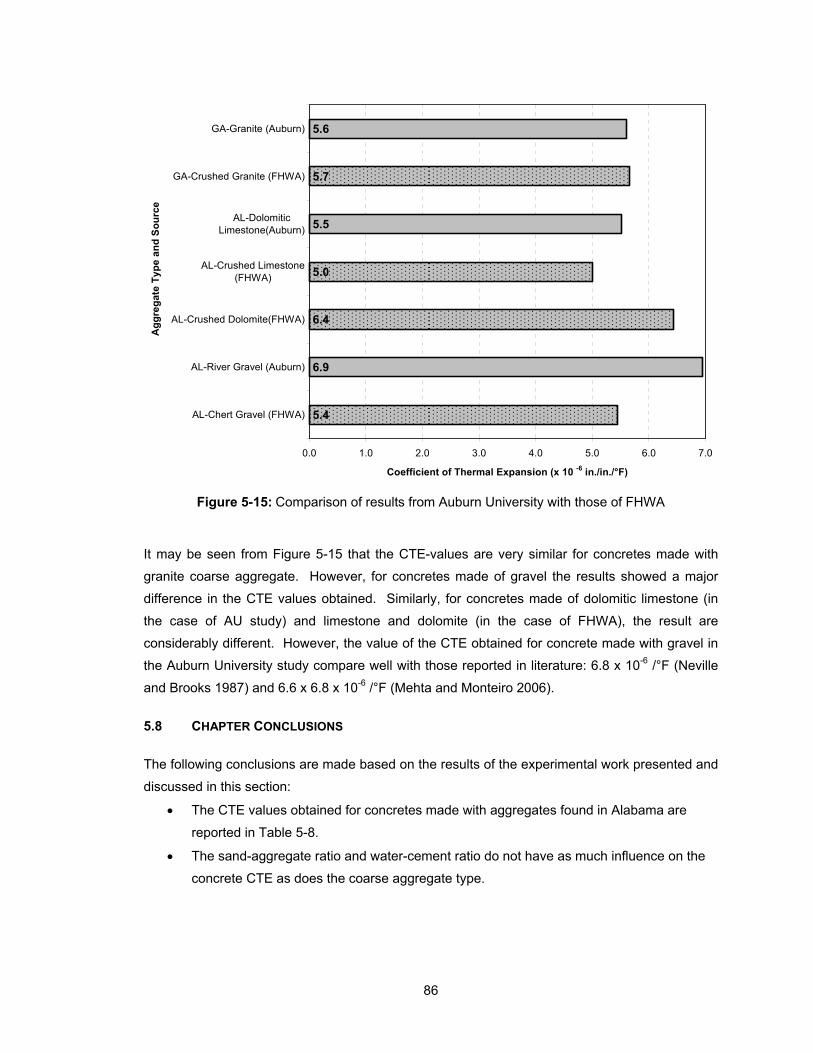
86
5.4
6.9
6.4
5.0
5.5
5.7
5.6
0.0 1.0 2.0 3.0 4.0 5.0 6.0 7.0
AL-Chert Gravel (FHWA)
AL-River Gravel (Auburn)
AL-Crushed Dolomite(FHWA)
AL-Crushed Limestone(FHWA)
AL-DolomiticLimestone(Auburn)
GA-Crushed Granite (FHWA)
GA-Granite (Auburn)
Ag
gre
gat
e T
ype
an
d S
ou
rce
Coefficient of Thermal Expansion (x 10 -6 in./in./°F)
Figure 5-15: Comparison of results from Auburn University with those of FHWA
It may be seen from Figure 5-15 that the CTE-values are very similar for concretes made with
granite coarse aggregate. However, for concretes made of gravel the results showed a major
difference in the CTE values obtained. Similarly, for concretes made of dolomitic limestone (in
the case of AU study) and limestone and dolomite (in the case of FHWA), the result are
considerably different. However, the value of the CTE obtained for concrete made with gravel in
the Auburn University study compare well with those reported in literature: 6.8 x 10⁻⁶ /°F (Neville
and Brooks 1987) and 6.6 x 6.8 x 10-6 /°F (Mehta and Monteiro 2006).
5.8 CHAPTER CONCLUSIONS
The following conclusions are made based on the results of the experimental work presented and
discussed in this section:
The CTE values obtained for concretes made with aggregates found in Alabama are
reported in Table 5-8.
The sand-aggregate ratio and water-cement ratio do not have as much influence on the
concrete CTE as does the coarse aggregate type.
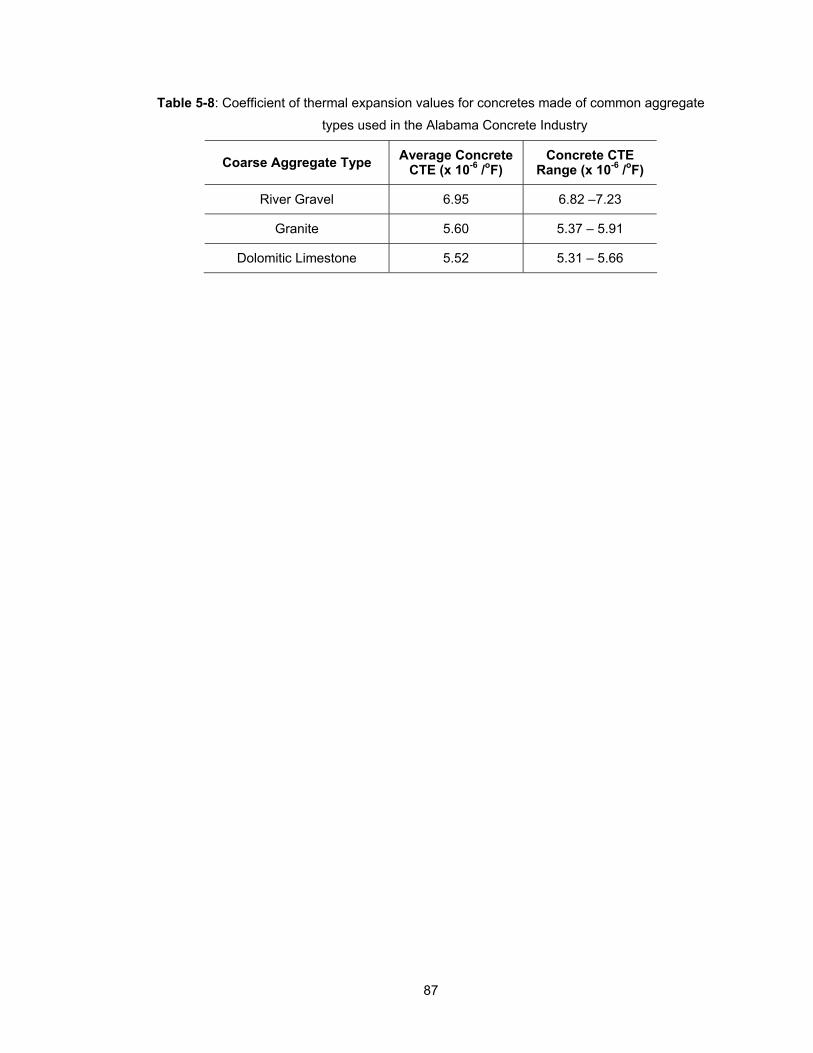
87
Table 5-8: Coefficient of thermal expansion values for concretes made of common aggregate
types used in the Alabama Concrete Industry
Coarse Aggregate Type Average Concrete CTE (x 10-6 /oF)
Concrete CTE Range (x 10-6 /oF)
River Gravel 6.95 6.82 –7.23
Granite 5.60 5.37 – 5.91
Dolomitic Limestone 5.52 5.31 – 5.66
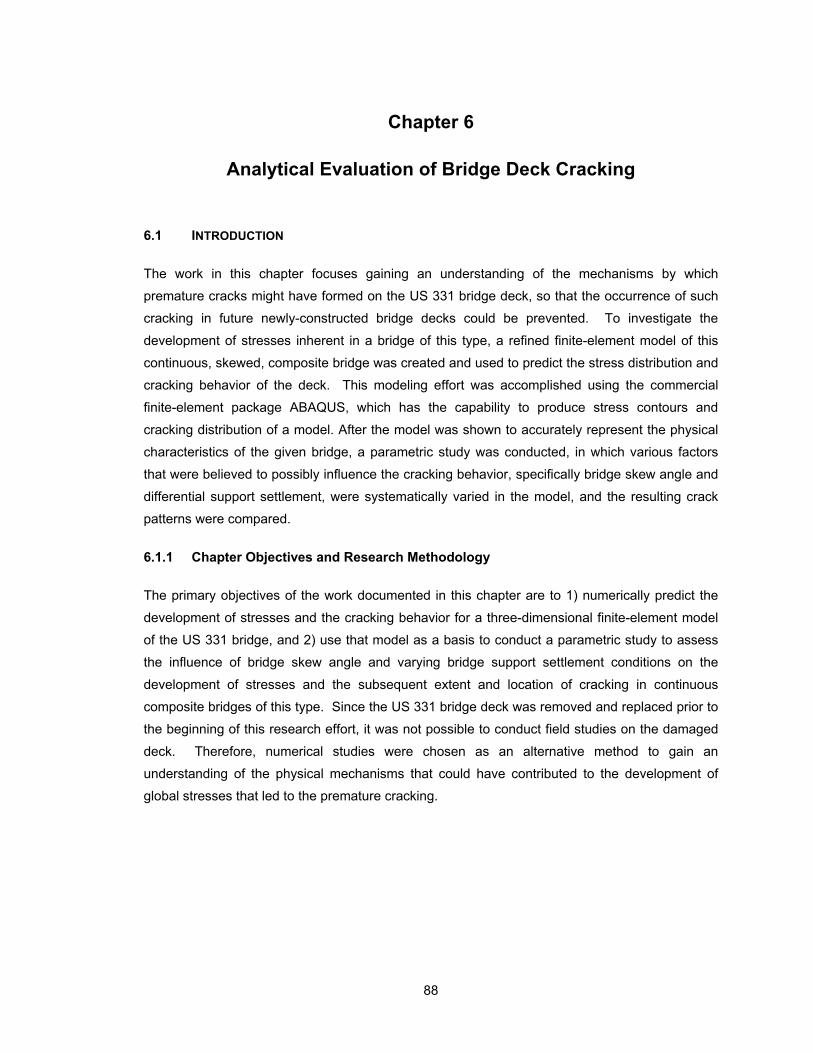
88
Chapter 6
Analytical Evaluation of Bridge Deck Cracking
6.1 INTRODUCTION
The work in this chapter focuses gaining an understanding of the mechanisms by which
premature cracks might have formed on the US 331 bridge deck, so that the occurrence of such
cracking in future newly-constructed bridge decks could be prevented. To investigate the
development of stresses inherent in a bridge of this type, a refined finite-element model of this
continuous, skewed, composite bridge was created and used to predict the stress distribution and
cracking behavior of the deck. This modeling effort was accomplished using the commercial
finite-element package ABAQUS, which has the capability to produce stress contours and
cracking distribution of a model. After the model was shown to accurately represent the physical
characteristics of the given bridge, a parametric study was conducted, in which various factors
that were believed to possibly influence the cracking behavior, specifically bridge skew angle and
differential support settlement, were systematically varied in the model, and the resulting crack
patterns were compared.
6.1.1 Chapter Objectives and Research Methodology
The primary objectives of the work documented in this chapter are to 1) numerically predict the
development of stresses and the cracking behavior for a three-dimensional finite-element model
of the US 331 bridge, and 2) use that model as a basis to conduct a parametric study to assess
the influence of bridge skew angle and varying bridge support settlement conditions on the
development of stresses and the subsequent extent and location of cracking in continuous
composite bridges of this type. Since the US 331 bridge deck was removed and replaced prior to
the beginning of this research effort, it was not possible to conduct field studies on the damaged
deck. Therefore, numerical studies were chosen as an alternative method to gain an
understanding of the physical mechanisms that could have contributed to the development of
global stresses that led to the premature cracking.
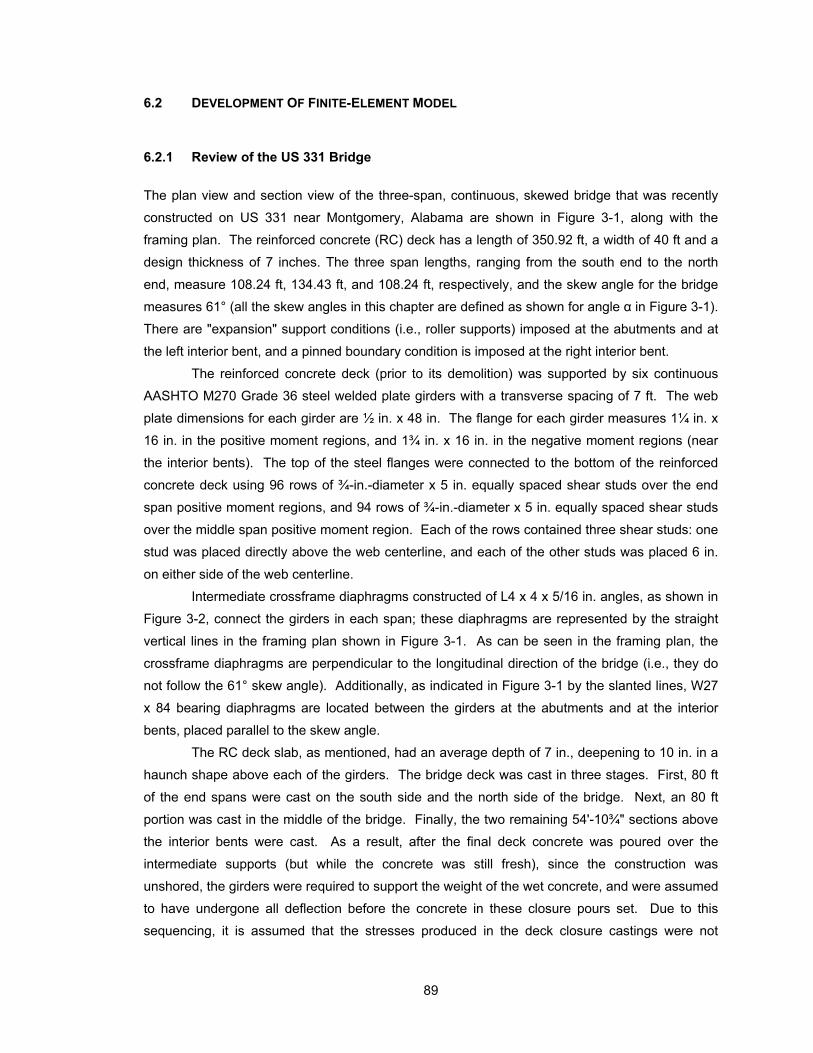
89
6.2 DEVELOPMENT OF FINITE-ELEMENT MODEL
6.2.1 Review of the US 331 Bridge
The plan view and section view of the three-span, continuous, skewed bridge that was recently
constructed on US 331 near Montgomery, Alabama are shown in Figure 3-1, along with the
framing plan. The reinforced concrete (RC) deck has a length of 350.92 ft, a width of 40 ft and a
design thickness of 7 inches. The three span lengths, ranging from the south end to the north
end, measure 108.24 ft, 134.43 ft, and 108.24 ft, respectively, and the skew angle for the bridge
measures 61° (all the skew angles in this chapter are defined as shown for angle α in Figure 3-1).
There are "expansion" support conditions (i.e., roller supports) imposed at the abutments and at
the left interior bent, and a pinned boundary condition is imposed at the right interior bent.
The reinforced concrete deck (prior to its demolition) was supported by six continuous
AASHTO M270 Grade 36 steel welded plate girders with a transverse spacing of 7 ft. The web
plate dimensions for each girder are ½ in. x 48 in. The flange for each girder measures 1¼ in. x
16 in. in the positive moment regions, and 1¾ in. x 16 in. in the negative moment regions (near
the interior bents). The top of the steel flanges were connected to the bottom of the reinforced
concrete deck using 96 rows of ¾-in.-diameter x 5 in. equally spaced shear studs over the end
span positive moment regions, and 94 rows of ¾-in.-diameter x 5 in. equally spaced shear studs
over the middle span positive moment region. Each of the rows contained three shear studs: one
stud was placed directly above the web centerline, and each of the other studs was placed 6 in.
on either side of the web centerline.
Intermediate crossframe diaphragms constructed of L4 x 4 x 5/16 in. angles, as shown in
Figure 3-2, connect the girders in each span; these diaphragms are represented by the straight
vertical lines in the framing plan shown in Figure 3-1. As can be seen in the framing plan, the
crossframe diaphragms are perpendicular to the longitudinal direction of the bridge (i.e., they do
not follow the 61° skew angle). Additionally, as indicated in Figure 3-1 by the slanted lines, W27
x 84 bearing diaphragms are located between the girders at the abutments and at the interior
bents, placed parallel to the skew angle.
The RC deck slab, as mentioned, had an average depth of 7 in., deepening to 10 in. in a
haunch shape above each of the girders. The bridge deck was cast in three stages. First, 80 ft
of the end spans were cast on the south side and the north side of the bridge. Next, an 80 ft
portion was cast in the middle of the bridge. Finally, the two remaining 54'-10¾" sections above
the interior bents were cast. As a result, after the final deck concrete was poured over the
intermediate supports (but while the concrete was still fresh), since the construction was
unshored, the girders were required to support the weight of the wet concrete, and were assumed
to have undergone all deflection before the concrete in these closure pours set. Due to this
sequencing, it is assumed that the stresses produced in the deck closure castings were not

90
affected by dead loads, since the deck’s own weight was supported solely by the steel girders,
but were affected only by any additional live load to which they were subjected. Test data
collected from core samples taken from the deck exhibited an average concrete compressive
strength of approximately 5,300 psi.
6.2.2 Model Characteristics
6.2.2.1 Model Assumptions
To study the behavior of the bridge deck, a refined 3D finite-element model of the bridge was
developed using the commercial finite-element software package ABAQUS. Several general
assumptions were made to simplify the development of the model without loss of accuracy in the
representation. First, material properties were held constant for all concrete components and for
all steel components of the bridge. Secondly, it was decided that the deck haunches located
directly above the girders would not be explicitly modeled, so that the deck was modeled using a
constant thickness. Thirdly, the crossframe diaphragms placed between the girders were
simplified as equivalent steel beams in the model. Details of the equivalency calculation will be
provided in the following section.
6.2.2.2 Deck and Girders
Based on the bridge information and modeling assumptions described above, the main
components of the bridge were modeled using the ABAQUS elements shown in Table 6-1 below.
The overall model and a close-up view are presented in Figures 6-1 and 6-2.
Table 6-1: Finite elements selected for the main bridge components
Component Element Type
RC Deck Shell Elements
Steel Girders Beam Elements
Diaphragms Beam Elements
Reinforcement Rebar Elements
Interaction between deck and girders TIE Function
Parapet Ignored
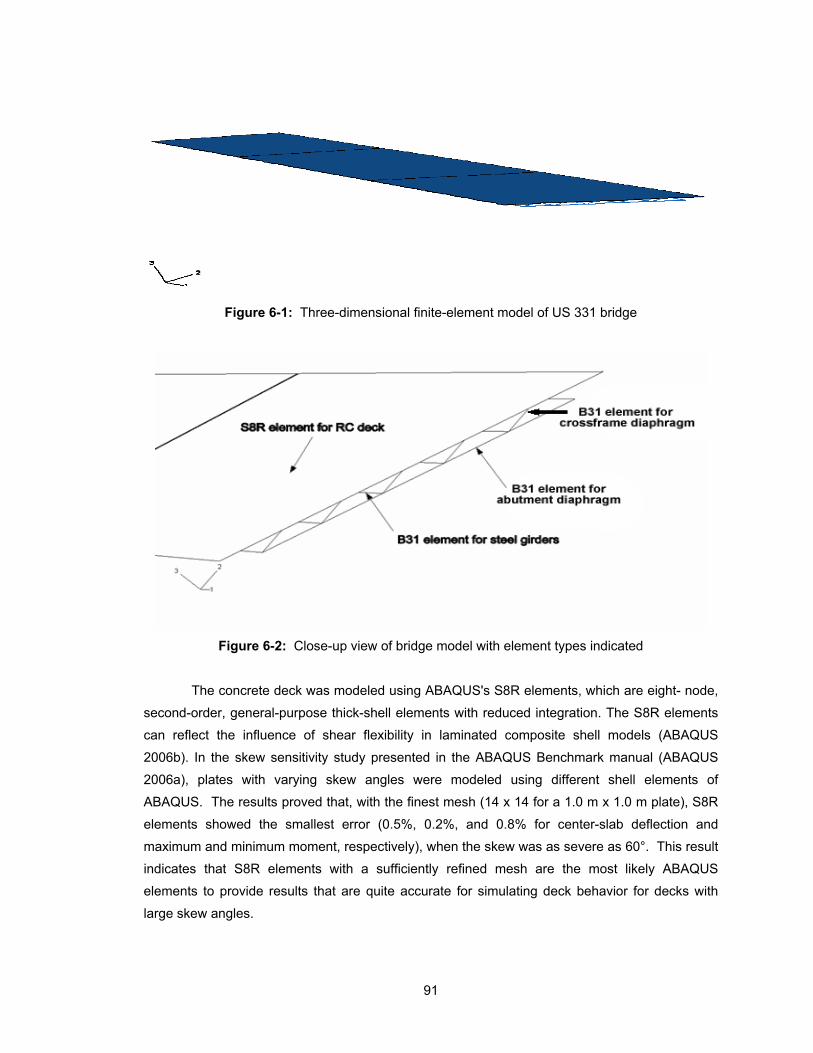
91
Figure 6-1: Three-dimensional finite-element model of US 331 bridge
Figure 6-2: Close-up view of bridge model with element types indicated
The concrete deck was modeled using ABAQUS's S8R elements, which are eight- node,
second-order, general-purpose thick-shell elements with reduced integration. The S8R elements
can reflect the influence of shear flexibility in laminated composite shell models (ABAQUS
2006b). In the skew sensitivity study presented in the ABAQUS Benchmark manual (ABAQUS
2006a), plates with varying skew angles were modeled using different shell elements of
ABAQUS. The results proved that, with the finest mesh (14 x 14 for a 1.0 m x 1.0 m plate), S8R
elements showed the smallest error (0.5%, 0.2%, and 0.8% for center-slab deflection and
maximum and minimum moment, respectively), when the skew was as severe as 60°. This result
indicates that S8R elements with a sufficiently refined mesh are the most likely ABAQUS
elements to provide results that are quite accurate for simulating deck behavior for decks with
large skew angles.

92
The top and bottom reinforcement in the concrete deck was represented using the
"Rebar layer" option of ABAQUS. With this function, layers of reinforcement can be defined as a
part of the reinforced concrete section properties. These layers are superimposed on the shell
elements of the concrete deck and are treated as a smeared layer with a constant thickness
equal to the area of each reinforcing bar divided by the reinforcing bar spacing (ABAQUS 2006b).
Bar diameters and spacings corresponding to the No. 4 and No. 5 longitudinal rebar and No. 5
transverse rebar described above were provided as input for ABAQUS to define the rebar layers.
The steel girders and diaphragms were modeled with B31 elements, which are three-
dimensional, two-node Timoshenko linear beam elements. B31 elements allow transverse shear
strain to be represented, and can be subjected to large axial strains. The ABAQUS Analysis
manual stated that these shear-deformable beam elements (B31) should be used in any
simulation that includes contact (ABAQUS 2006b). That was one of the primary reasons that this
type of element was selected, since deck and girder contact was considered important in this
model. These elements are displayed as a line in ABAQUS, though the cross-sectional
dimensions for each beam element are directly defined by the user, so that the effects of the
cross-sectional properties can be represented. Nominal dimensions for the steel plate girders,
and for the W27 x 84 shapes used for the abutment and bent diaphragms, were specified directly
to ABAQUS.
As mentioned previously, dimensions for an equivalent wide-flange shape were used to
represent the crossframe diaphragms. This technique was used because, to span between the
plate girders, in the finite-element model, a specific node had to be identified for attachment of the
diaphragms to the beams. Since the girders were being represented by linear beam elements,
there was only one node available for attachment to the girders (located at the centroid of the
beam's profile). Therefore, attachment nodes could not be identified near the top and bottom of
the girder, where the actual location of the attachment of the L4 x 4 x 5/16 crossframe diaphragm
members occurs (via a gusset plate connection).
The method of virtual work was used to establish equivalent shear and bending
stiffnesses for the bridge's actual crossframe dimensions. From the bending stiffness analysis, it
was determined that only the top and bottom chords of the crossframes carry "bending" stresses,
so it was deemed that the equivalent beam used to represent the crossframe diaphragm should
have top and bottom flanges with cross-sectional areas equal to the cross-sectional area for the
L4 x 4 x 5/16 angle (2.40 in.2) used for the top and bottom chords of the actual diaphragm. It was
decided that the equivalent beam should have a web height of 36" (the approximate distance
between the centroids of the top and bottom L4 x 4 x 5/16 crossframe shapes). An appropriate
web thickness was then determined based on the shear stiffness associated with the shearing
deformation of a beam of rectangular cross section. The final cross-sectional dimensions chosen
for the equivalent beam, then, were 0.24" x 10" for the top and bottom flanges, and 0.0583" x 36"
for the web. The equivalent beams were rigidly attached in the model to the girder node on either
end.

93
The selection of the element size and mesh density was very critical for obtaining
accurate results, because most finite-element modeling results are sensitive to these parameters.
A group of previous researchers found that selection of relatively small elements will eliminate
unrealistically low predicted strengths due to the effects of stress concentrations (Barth and Wu
2006). It is also warned in the ABAQUS manual that a coarse mesh will cause S8R elements to
have a great loss of accuracy if they are used to model a skewed plate. Therefore, a reasonably
fine mesh was selected in this model. The length of the deck was divided into 400 transverse
strips, giving a length of approximately 10.5 in. for each element in the longitudinal direction.
Each transverse strip of the deck, then, was divided into 64 elements, giving a width of
approximately 8.6 inches in the transverse direction for each element. The deck has only one
shell element through the thickness, but information regarding stresses, strains, etc. are available
from ABAQUS at any point in the thickness of that element using the section point definition
feature of ABAQUS. The steel girders had the same number of elements in the longitudinal
direction as the deck. This relatively fine mesh spacing was shown to provide accurate results
when compared to theoretical values (as will be described later), while allowing the cost (in terms
of model run time) of the computer simulation to remain affordable.
6.2.2.3 Material Modeling
Both the concrete and steel were defined as linear elastic materials in this model. (A simulation
incorporating nonlinear material properties for the concrete deck will be described in a following
section.) Table 6-2 lists the specific material properties that were input to ABAQUS for both
materials. The average splitting tensile strength was defined as 600 psi, according to data
obtained from early field testing of the deck material.
Table 6-2: Material properties of the US 331 bridge model
Material Modulus of Elasticity, E Poisson’s Ratio, Density, ρ
Concrete 4.42 x 10⁶ psi 0.15 0.086 lb/in3
Steel 29 x 106 psi 0.32 0.286 lb/in3
6.2.2.4 Load and Boundary Conditions
The applied load for this finite-element (FE) model consisted of a light traffic load equal to
approximately 87 psf. A "normal", AASHTO-specified service live load was not applied in the
model because the deck studied here was newly constructed, and regular vehicular traffic had not
yet been allowed on the bridge.
Gravity effects for the bridge were not included, per se, since they were believed not to
affect the cracking behavior of the deck, due to the sequential casting sequence described

94
earlier. In addition, temperature effects were not incorporated. Pin and roller boundary
conditions were considered to reflect the abutment and bent restraints; these conditions were
used in the model for both the RC deck and girders, as shown in Figure 6-3.
Figure 6-3: Boundary conditions for the US 331 bridge model
6.2.2.5 Interaction between the Deck and Girders
The “Tie” function of ABAQUS was used to simulate the interaction between the concrete deck
and the steel girders. Full composite action was assumed between these two very different
materials and no slip was allowed at the interface. Tie is a relatively new surface-based
connection, which can be used to tie two surfaces together (the connection is a surface-to-
surface connection, rather than a node-to-node connection). The essence of the Tie function is
similar to that for a node-to-node connection, in which a rigid beam element is used to connect
two nodes, but its surface-based property makes it more efficient to implement than traditional
node-to-node rigid beam connections.
When connected with a surface-to-surface Tie constraint, the translational degrees of
freedom of the slave surface are eliminated (elimination of the rotational degrees of freedom is
optional) and each node of the slave surface will have the same motion as the point on the
master surface to which it is closest (ABAQUS 2006b). For the present model, a Tie connection
was created between two surfaces: the bottom surface of the deck and the top surface of girder
top flange. The deck bottom surface was defined as the master surface, and the top flange
surface was designated as the slave surface so that a load applied to the deck could be
transferred from the deck to the girders. However, in reality, at the location of the piers, the
girders are not able to deflect with their corresponding deck master, due to the boundary
condition supports that are applied to the piers. Therefore, the master-slave relationship had to
be reversed at the pier locations to allow for a realistic deflected shape for the continuous bridge.
Figure 6-4 gives the modeling details of the tie connections and boundary conditions surrounding
the pier locations.

95
Figure 6-4: Interaction modeling at the piers (elevation view)
As can be seen from the figure, a somewhat complex model was created at the pier
locations. In these areas, the master-slave relationship was reversed from the relationship that
was used for every other location along the length of the bridge, and the nodes of the girder
centerline (nodes D and F) became the master of the Tie connection. Without this complex
modeling strategy, node B of the girder (which would have been modeled as part of the slave
surface without the master-slave reversal) was controlled by two contrary boundary conditions:
(1) its master element was located in the deck, which forced node B to deflect downward under
the effect of gravity; (2) the roller support underneath node B, which resisted the downward
deflection of node B. This phenomenon is called “overclosure” in ABAQUS and causes failure of
the model. The model in Figure 6-4 (wherein node-to-node contact having a girder master and
deck slave was established for nodes D-C and F-E, but not for nodes B-A, and having a pin or
roller boundary condition applied to node B) not only eliminated the “overclosure” problem, but
also released the vertical degree of freedom of node A, which was a much more realistic
condition for the continuous deck.
The shortcoming of this support model is that the response in these locations was
distorted, due to such a complex simulation. However, since the area involved with this
advanced interaction scheme was very small (8 in. in length) compared with the width of the
whole deck (350 ft), it was deemed acceptable.
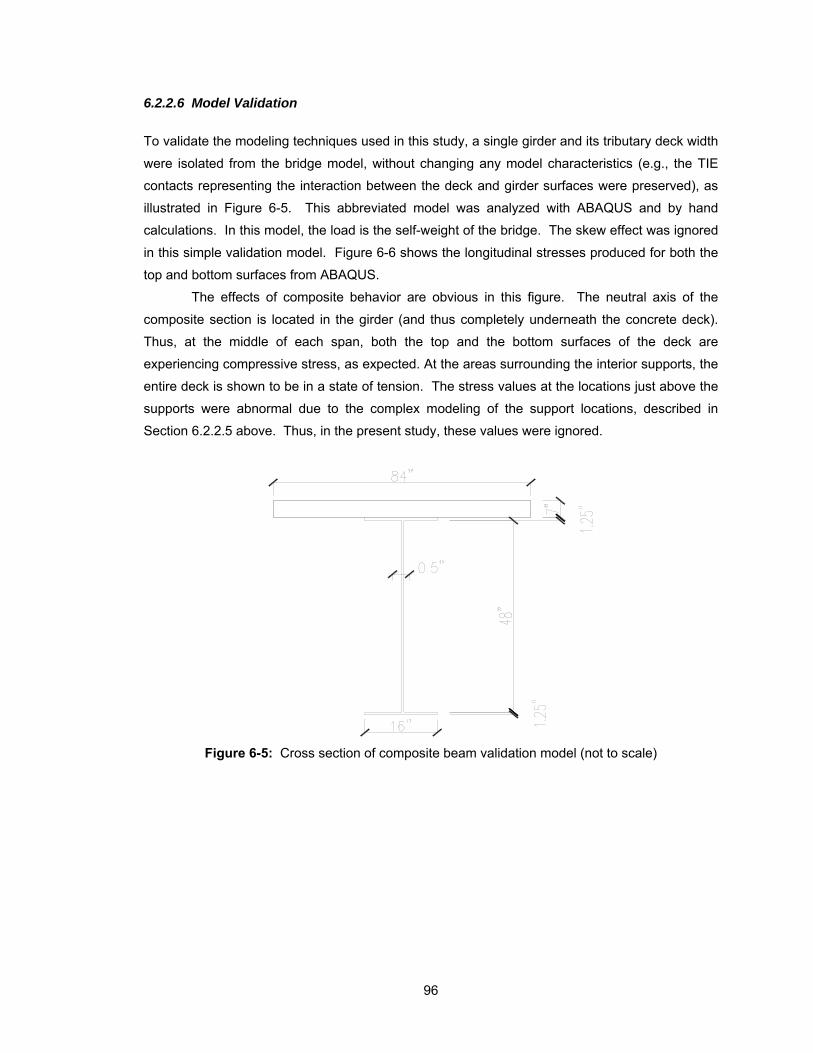
96
6.2.2.6 Model Validation
To validate the modeling techniques used in this study, a single girder and its tributary deck width
were isolated from the bridge model, without changing any model characteristics (e.g., the TIE
contacts representing the interaction between the deck and girder surfaces were preserved), as
illustrated in Figure 6-5. This abbreviated model was analyzed with ABAQUS and by hand
calculations. In this model, the load is the self-weight of the bridge. The skew effect was ignored
in this simple validation model. Figure 6-6 shows the longitudinal stresses produced for both the
top and bottom surfaces from ABAQUS.
The effects of composite behavior are obvious in this figure. The neutral axis of the
composite section is located in the girder (and thus completely underneath the concrete deck).
Thus, at the middle of each span, both the top and the bottom surfaces of the deck are
experiencing compressive stress, as expected. At the areas surrounding the interior supports, the
entire deck is shown to be in a state of tension. The stress values at the locations just above the
supports were abnormal due to the complex modeling of the support locations, described in
Section 6.2.2.5 above. Thus, in the present study, these values were ignored.
Figure 6-5: Cross section of composite beam validation model (not to scale)

97
Figure 6-6: Longitudinal stresses from the top and bottom deck surfaces
The results of a hand calculation of the predicted stresses were compared with the FE results; the
values are shown for comparison in Table 6-3. The stress was calculated at six locations,
considering the symmetry. The maximum compressive stress at the middle of each span was
computed for the top and bottom surfaces, as well as the maximum tensile stress at the location
of the interior support for both surfaces.
Table 6-3: Validation results for concrete deck stresses
Stress (psi) Surface Location
Hand Calculation FE Model Percent
Difference
Interior Span (Midspan) -291.6 -293.2 0.55%
End Span (Midspan) -310.5 -311.7 0.38% Top
Support 567.8 564.2 0.63%
Interior Span (Midspan) -163.2 -153.8 5.76%
End Span (Midspan) -173.8 -163.0 6.21% Bottom
Support 317.8 253.8 20.1%
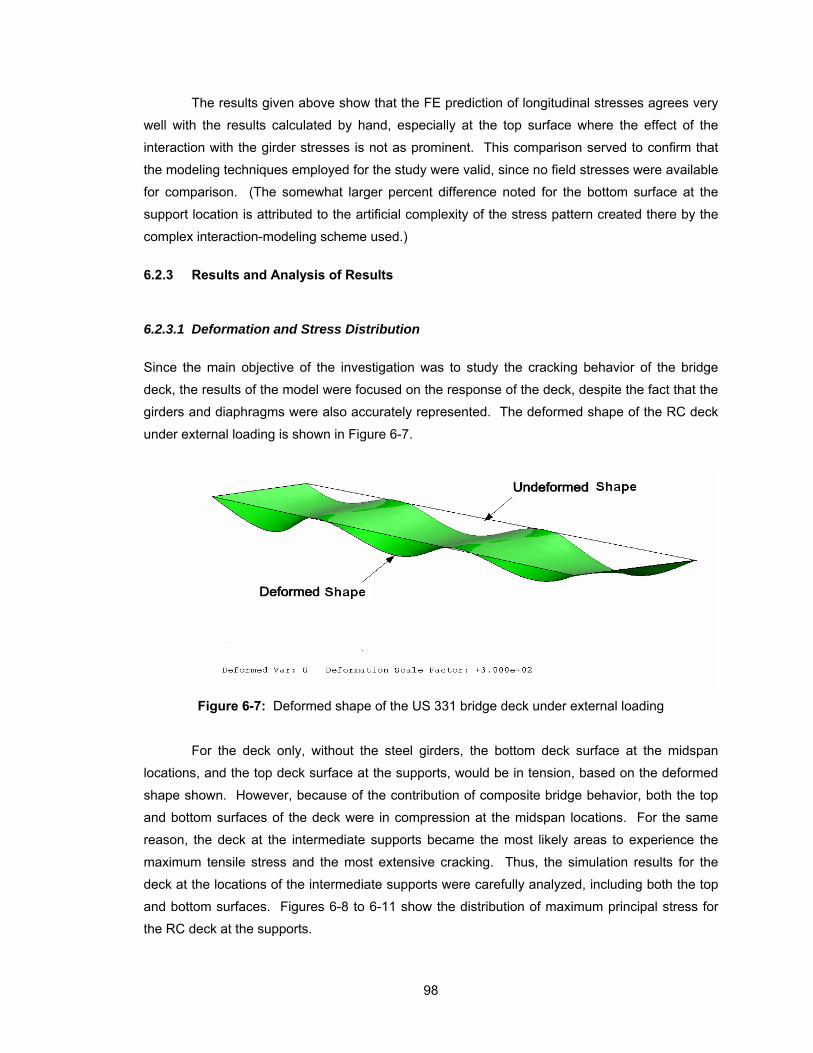
98
The results given above show that the FE prediction of longitudinal stresses agrees very
well with the results calculated by hand, especially at the top surface where the effect of the
interaction with the girder stresses is not as prominent. This comparison served to confirm that
the modeling techniques employed for the study were valid, since no field stresses were available
for comparison. (The somewhat larger percent difference noted for the bottom surface at the
support location is attributed to the artificial complexity of the stress pattern created there by the
complex interaction-modeling scheme used.)
6.2.3 Results and Analysis of Results
6.2.3.1 Deformation and Stress Distribution
Since the main objective of the investigation was to study the cracking behavior of the bridge
deck, the results of the model were focused on the response of the deck, despite the fact that the
girders and diaphragms were also accurately represented. The deformed shape of the RC deck
under external loading is shown in Figure 6-7.
Figure 6-7: Deformed shape of the US 331 bridge deck under external loading
For the deck only, without the steel girders, the bottom deck surface at the midspan
locations, and the top deck surface at the supports, would be in tension, based on the deformed
shape shown. However, because of the contribution of composite bridge behavior, both the top
and bottom surfaces of the deck were in compression at the midspan locations. For the same
reason, the deck at the intermediate supports became the most likely areas to experience the
maximum tensile stress and the most extensive cracking. Thus, the simulation results for the
deck at the locations of the intermediate supports were carefully analyzed, including both the top
and bottom surfaces. Figures 6-8 to 6-11 show the distribution of maximum principal stress for
the RC deck at the supports.
99
Because the complex interaction model at the intermediate supports (shown previously in
Figure 6-4) caused some unrealistic stresses, these unusually high stresses were ignored during
the analysis of the results, and they are not displayed in Figures 6-8 to 6-11 (for the two narrow-
width strips just above the interior supports).
As expected, both the top and the bottom of the deck at the intermediate supports are
shown to be in tension, and the top surface experiences the largest tensile stress. From the
figures, one can see that the tensile stress decreases from the support area towards the midspan
area, finally becoming compressive in the midspan area. This behavior fundamentally matches
the theoretical moment diagram for a continuous, one-way slab, as expected. As can be seen,
this phenomenon is more obvious at the top surface of the deck than at the bottom surface. That
is because the bottom of the deck is closer to the neutral axis of bending. The skew effect is also
obvious; in Figure 6-8, one can observe that the edge of the contour has a skew angle similar to
that for the bridge deck.

100
Figure 6-8: Detail view of maximum principal stress distribution at the top of the deck for US 331
bridge, α = 61° (psi)

101
Figure 6-9: Detail view of maximum principal stress distribution at the bottom of the deck for US
331 bridge, α = 61° (psi)

102
Figure 6-10: Full view of maximum principal stress distribution at the top of the deck for US 331
bridge, α = 61° (psi)
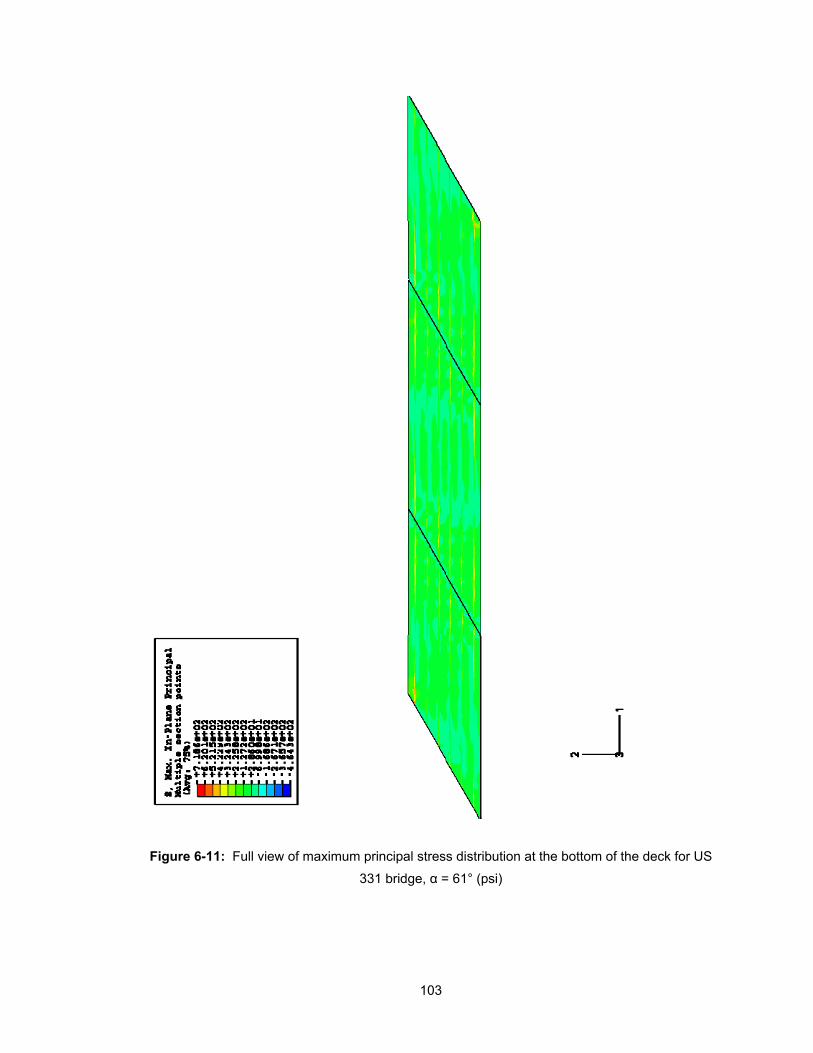
103
Figure 6-11: Full view of maximum principal stress distribution at the bottom of the deck for US
331 bridge, α = 61° (psi)
104
6.2.3.2 Detection of Cracking
For this study, in which a linear elastic material model was used to characterize the concrete
deck, cracking was assumed to occur when the maximum principal tensile stress of the concrete
reached its tensile strength. The tensile strength was defined as 600 psi, based on early field
testing results of the concrete deck material. By studying the contours of the maximum principal
stress (Figures 6-8 and 6-9), one can identify the cracked area of the model according to the
stress level of the elements. Figures 6-12 and 6-13 highlight the cracking zone of the bridge
deck. For these figures, and for similar figures in the remaining sections of this chapter, the red-
colored elements are those identified by ABAQUS as possessing maximum principal stresses
greater than the cracking stress.
As can be seen, at the top surface, cracking primarily occurs at the areas surrounding the
intermediate supports. Additionally, the crack distribution exhibits the same degree of skew as the
deck. Several strip areas in the longitudinal direction are cracked at the top surface. It is
believed that this cracking is due to the contribution of the girder stiffness, which increases the
bending stress relative to areas that are further removed from the girders.
At the bottom of the deck, the tensile stress produced was not very large, because this
surface is much nearer to the neutral axis of the composite section than is the top surface. The
remaining deck area that is not shown in these figures (surrounding the midpoint of each span)
only exhibited a few minor cracks in the model results, and was therefore not presented in the
figures here. These areas experienced either compressive stress, or very small amounts of
tensile stress.
The direction of the maximum principal tensile stress can indicate the orientation of the
crack for each cracked element. Using the SYMBOLS function of ABAQUS, symbols (headless
arrows here) can be plotted that display the relative magnitude of the stress through varying
symbol lengths (the greater the length of the headless arrow, the greater the magnitude of
stress), while the orientation of the symbol corresponds to the axis normal to the crack. In Figure
6-14, these symbols are shown as the black lines for the top deck surface.
From these results, it can be observed that cracking is somewhat extensive on the top
surface of the deck near the intermediate supports. Additionally, almost all of the cracks are
oriented parallel to the bent, which possessed the same degree of skew as the bridge deck. The
remaining few cracks are located near the edge of the deck at the support.
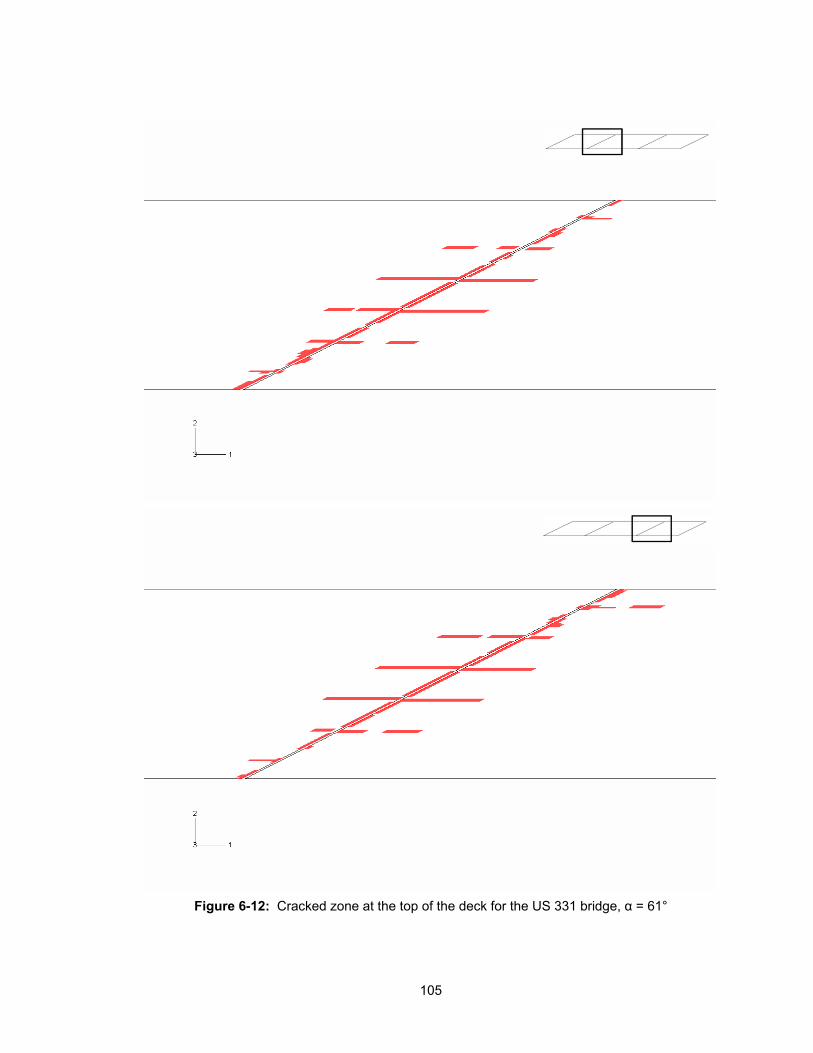
105
Figure 6-12: Cracked zone at the top of the deck for the US 331 bridge, α = 61°
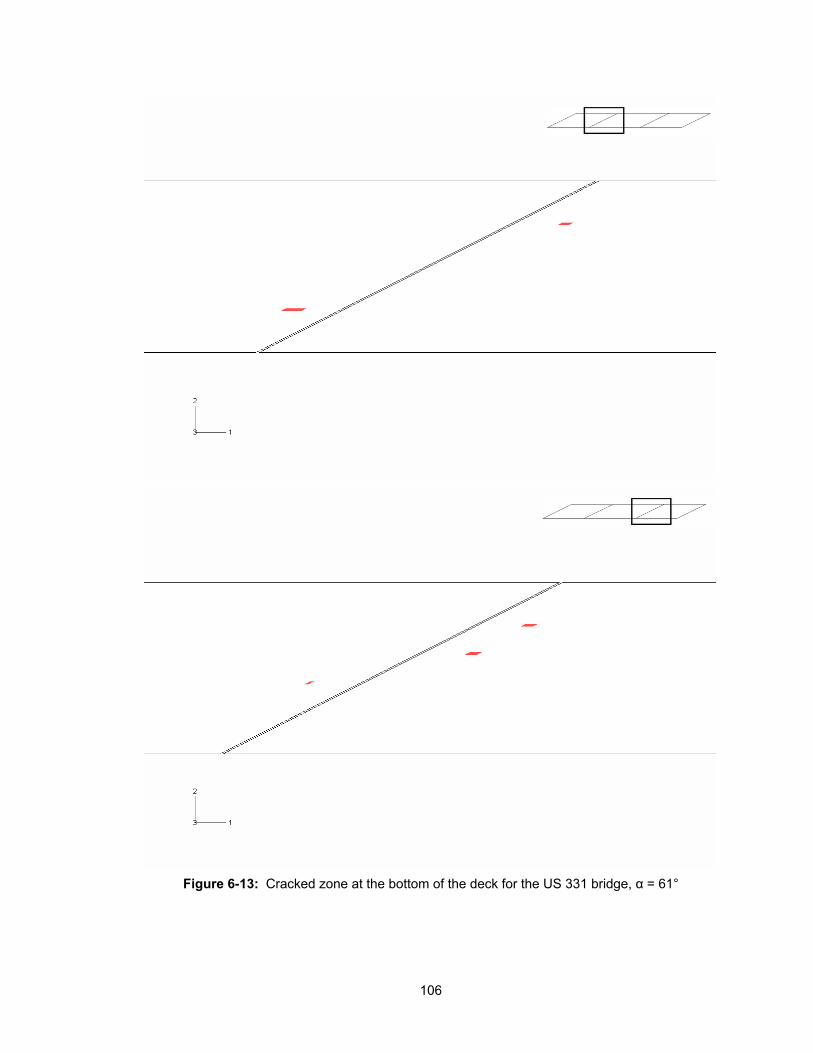
106
Figure 6-13: Cracked zone at the bottom of the deck for the US 331 bridge, α = 61°

107
Figure 6-14: Normal direction of cracks (black lines) at top of deck, US 331 bridge, α = 61°

108
At the bottom surface of the deck, despite the fact that a very small number of cracked
elements were observed, as shown in Figure 6-13, no black lines were indicated by ABAQUS.
This is because the black lines represent the stress level at the finite-element integration points,
while the highlighted cracked zone is determined by the element nodal values of stress. There is
a difference between these two values because ABAQUS employs an algorithm to interpolate
nodal values from calculated values at the integration points. Due to this difference, at the bottom
surface of the deck, the stress at the integration points has not reached the cracking stress, so
there are no black lines, but one or more interpolated nodal values have reached the cracking
stress, so elements with those nodes have been highlighted as cracked elements.
The crack illustration sequence employed above (plot of maximum principal stress,
followed by a plot of cracked elements, followed by a display of the normals to the crack direction)
will be utilized again in the next section, in which a parametric study of bridge deck behavior is
described.
6.3 PARAMETRIC STUDY
6.3.1 Effect of Skew
Skewed bridges like the bridge on US 331 are often necessary because of the alignment of the
roadway and the obstruction that needs to be crossed. However, when the skew angle is larger
than 30 degrees, it is quite possible that the effect of the skew becomes significant to the
behavior of the bridge. Previous researchers have found that skewed bridges are at risk of
experiencing greater vertical defections and bending moments than similar, non-skewed bridges
(Choo et al. 2005).
Figures 6-15 to 6-22 show the results obtained from the finite-element model of the US
331 bridge, modified to include 0°-, 30°-, and 45°-skew angles, instead of the actual skew angle
of 61°. Each of these models possessed the same characteristics, and the same load, as the
base model discussed in Section 6.2; only the skew angle was changed. From the results
presented in the previous section, it was evident that most cracking occurred at the top surface of
the deck near the intermediate supports, where large tensile stresses were experienced.
Therefore, for the parametric study, only the results for the top surface of the deck were
monitored. The deck areas which are not shown in the following figures (far removed from the
interior bents) only exhibited a very few cracked elements.
Again, because of the nature of the complex modeling utilized for the very narrow areas
just over the intermediate supports (detailed in Figure 6-4), some unrealistic stresses were
produced at these locations. As was the case for the model with the actual bridge skew angle,
these abnormal stress results were ignored during the analysis of the results of the parametric
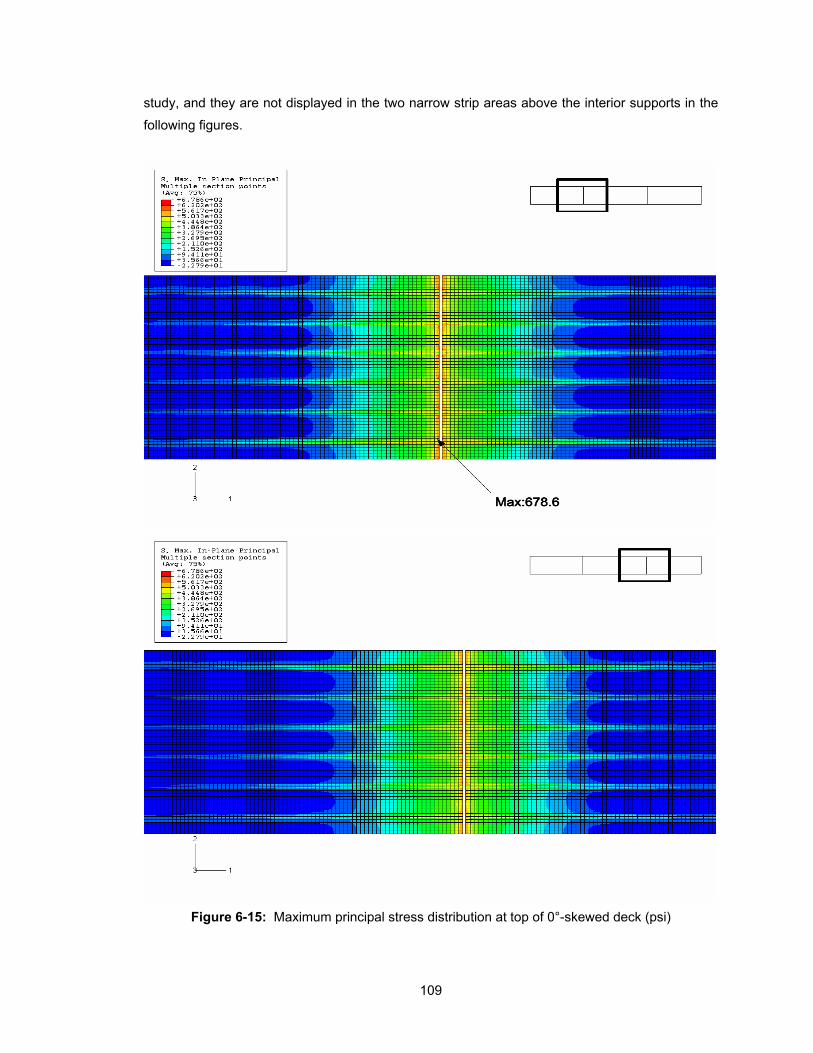
109
study, and they are not displayed in the two narrow strip areas above the interior supports in the
following figures.
Figure 6-15: Maximum principal stress distribution at top of 0°-skewed deck (psi)
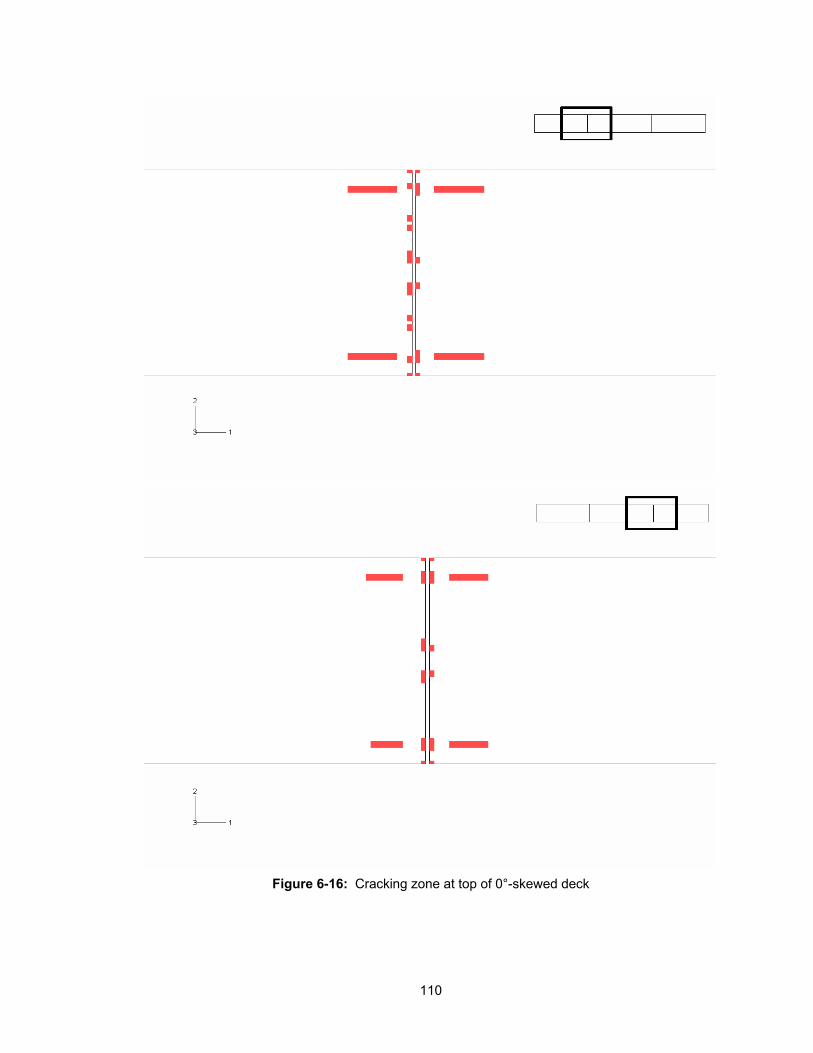
110
Figure 6-16: Cracking zone at top of 0°-skewed deck
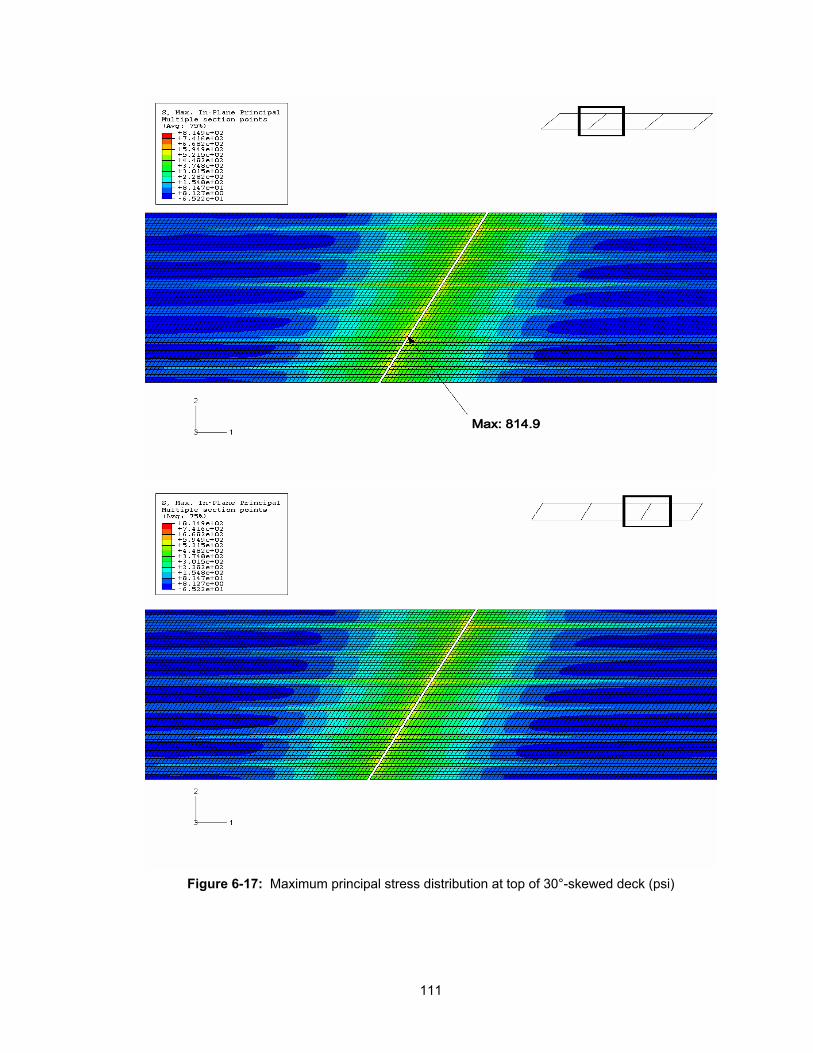
111
Figure 6-17: Maximum principal stress distribution at top of 30°-skewed deck (psi)
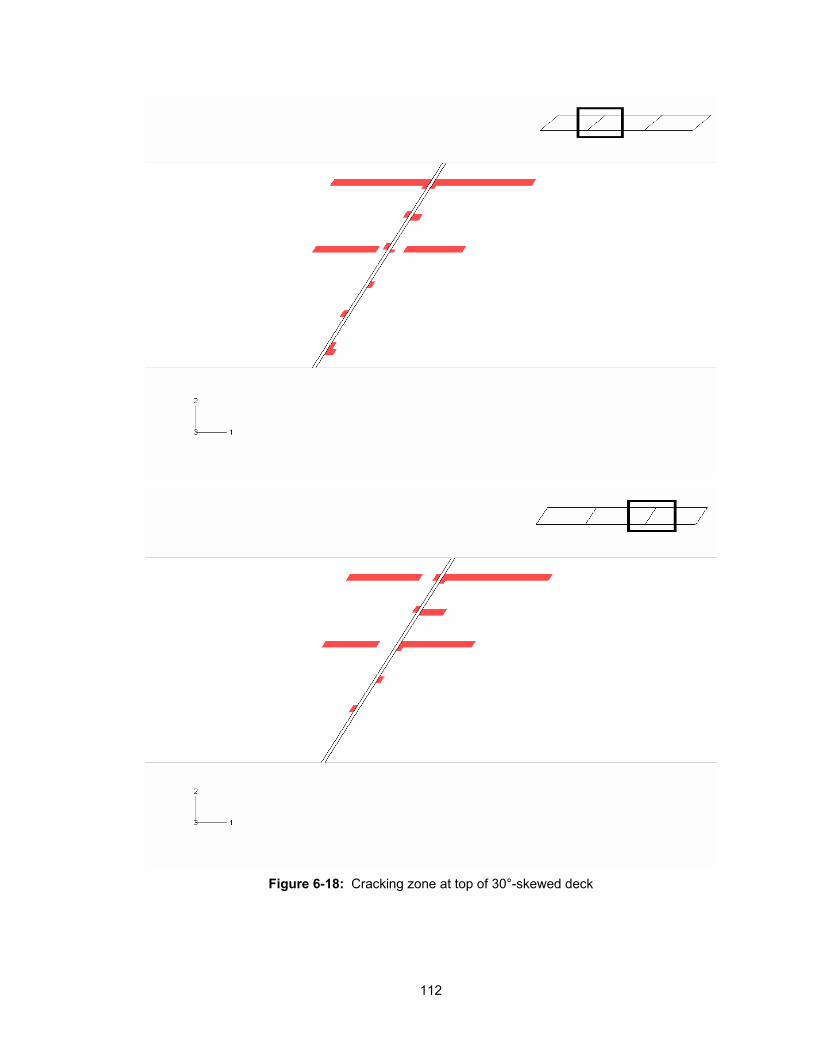
112
Figure 6-18: Cracking zone at top of 30°-skewed deck

113
Figure 6-19: Normal direction of cracking (black lines) at top of 30°-skewed deck
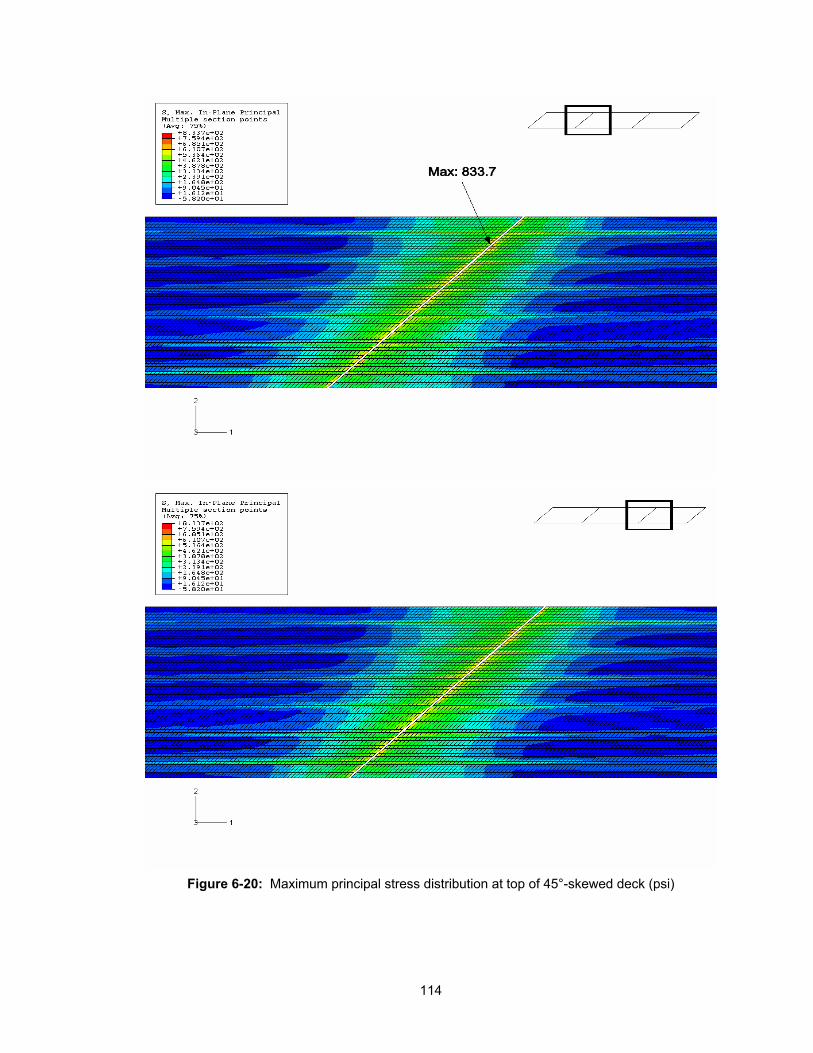
114
Figure 6-20: Maximum principal stress distribution at top of 45°-skewed deck (psi)
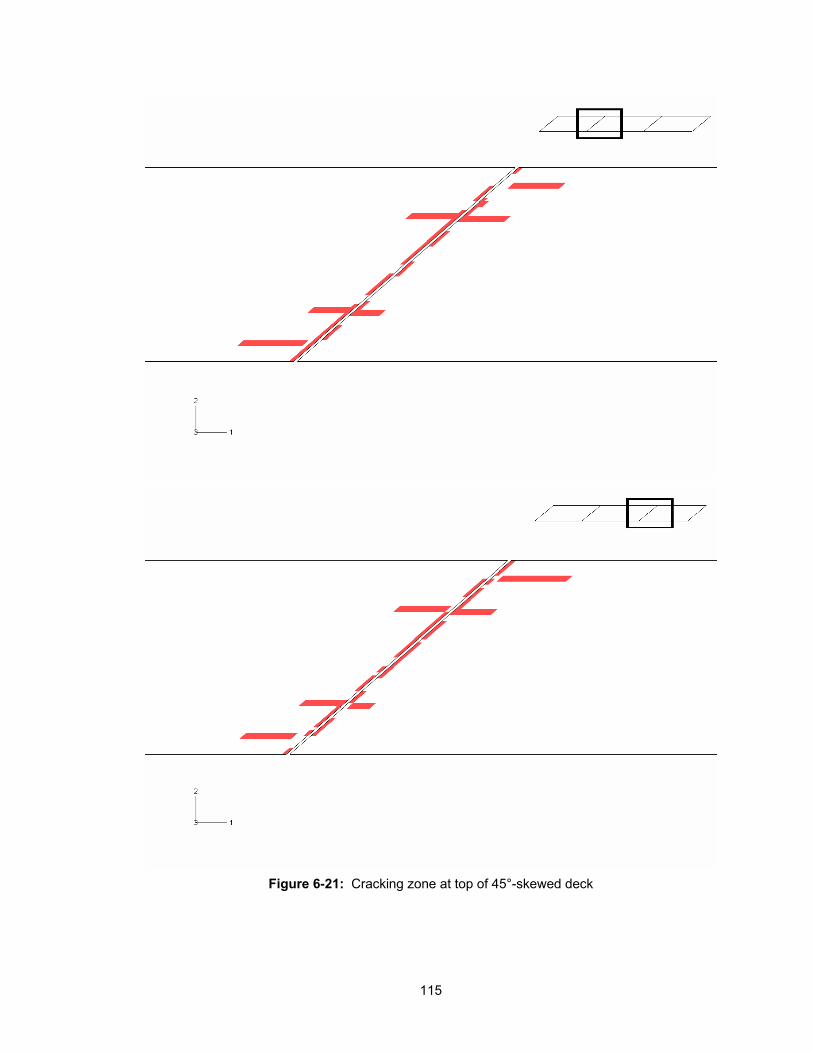
115
Figure 6-21: Cracking zone at top of 45°-skewed deck
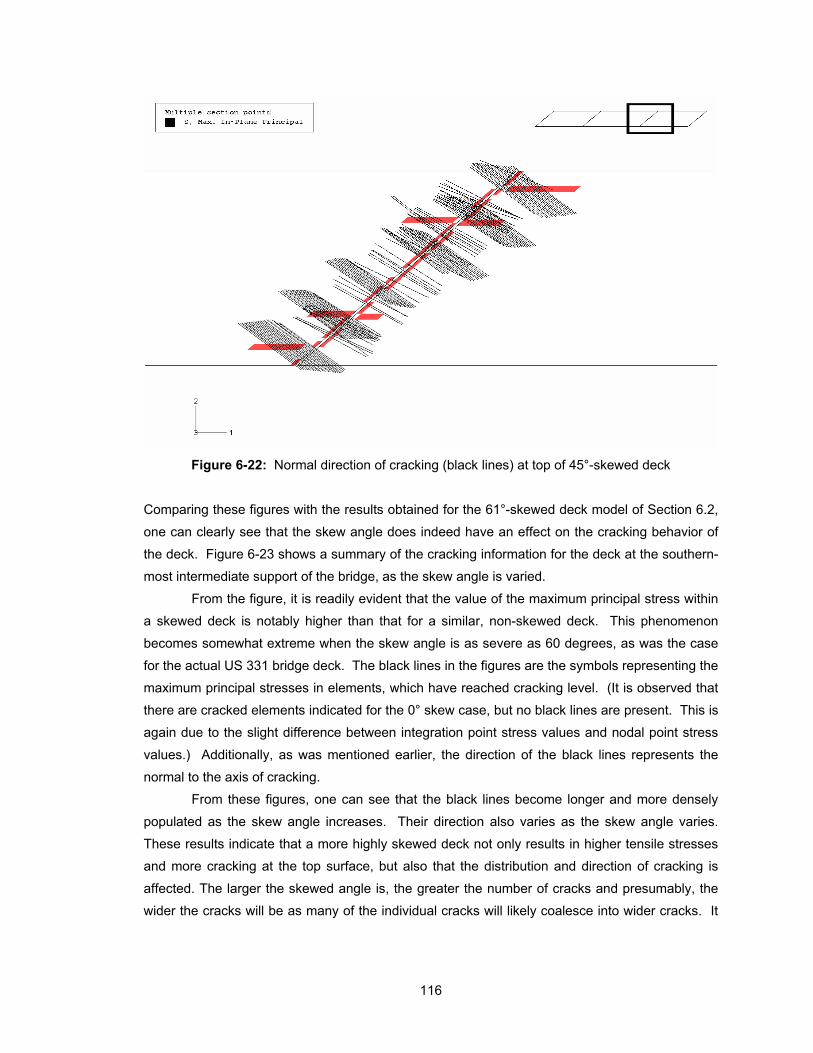
116
Figure 6-22: Normal direction of cracking (black lines) at top of 45°-skewed deck
Comparing these figures with the results obtained for the 61°-skewed deck model of Section 6.2,
one can clearly see that the skew angle does indeed have an effect on the cracking behavior of
the deck. Figure 6-23 shows a summary of the cracking information for the deck at the southern-
most intermediate support of the bridge, as the skew angle is varied.
From the figure, it is readily evident that the value of the maximum principal stress within
a skewed deck is notably higher than that for a similar, non-skewed deck. This phenomenon
becomes somewhat extreme when the skew angle is as severe as 60 degrees, as was the case
for the actual US 331 bridge deck. The black lines in the figures are the symbols representing the
maximum principal stresses in elements, which have reached cracking level. (It is observed that
there are cracked elements indicated for the 0° skew case, but no black lines are present. This is
again due to the slight difference between integration point stress values and nodal point stress
values.) Additionally, as was mentioned earlier, the direction of the black lines represents the
normal to the axis of cracking.
From these figures, one can see that the black lines become longer and more densely
populated as the skew angle increases. Their direction also varies as the skew angle varies.
These results indicate that a more highly skewed deck not only results in higher tensile stresses
and more cracking at the top surface, but also that the distribution and direction of cracking is
affected. The larger the skewed angle is, the greater the number of cracks and presumably, the
wider the cracks will be as many of the individual cracks will likely coalesce into wider cracks. It
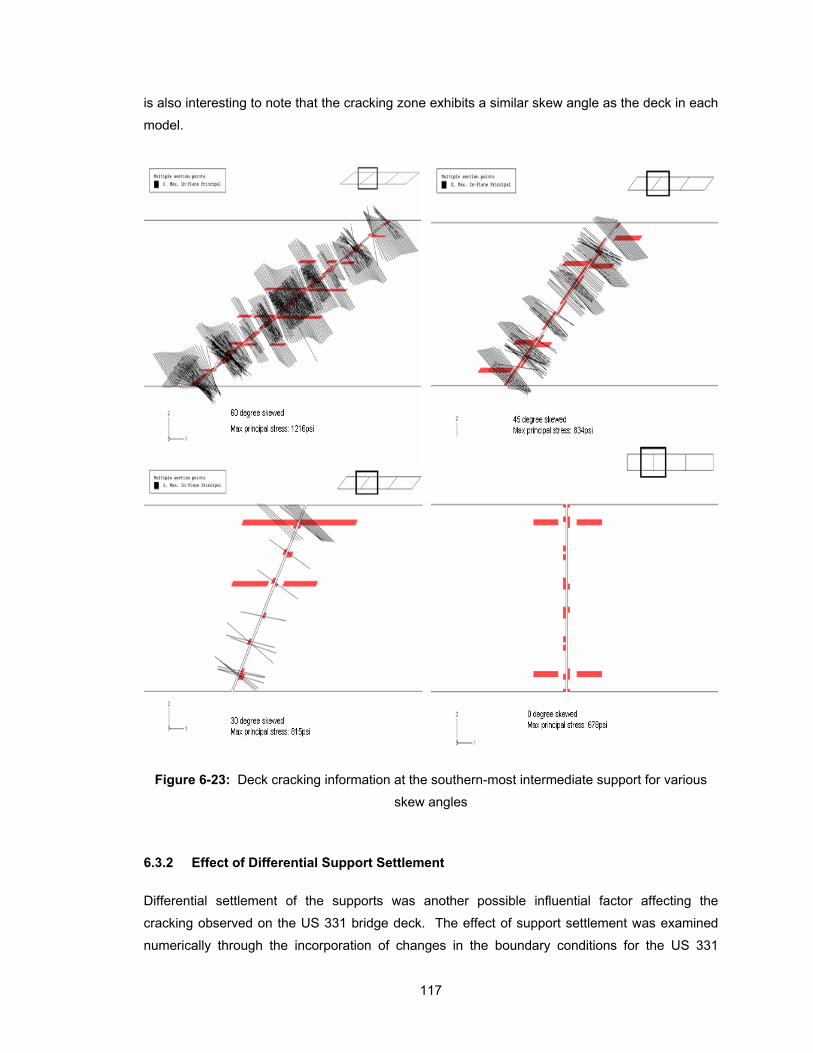
117
is also interesting to note that the cracking zone exhibits a similar skew angle as the deck in each
model.
Figure 6-23: Deck cracking information at the southern-most intermediate support for various
skew angles
6.3.2 Effect of Differential Support Settlement
Differential settlement of the supports was another possible influential factor affecting the
cracking observed on the US 331 bridge deck. The effect of support settlement was examined
numerically through the incorporation of changes in the boundary conditions for the US 331

118
bridge model (discussed in Section 6.2). As shown in Table 6-4 below, four combinations of the
settlement of supports A, B, C and D (see Figure 6-24 for their locations) were imposed on the
model to study their effect. A unit settlement (1 inch) was used in each of the four cases. Rrsults
for the deformation, stress distribution, and cracking information at the top of the deck for all
settlement combinations are shown in Figures 6-25 to 6-40. These models possessed the same
characteristics, and the same load, as the base model discussed in Section 6.2.
Table 6-4: Combinations of support settlement conditions for parametric study
Case Support A Support B Support C Support D
Case 1 0 0 0 ↓
Case 2 0 0 ↓ 0
Case 3 ↓ 0 0 ↓
Case 4 0 ↓ ↓ 0
Figure 6-24: Locations of supports A, B, C, and D
Figure 6-25: Deformed shape for Case 1
(Green: Deformed shape and Gray: Undeformed shape)
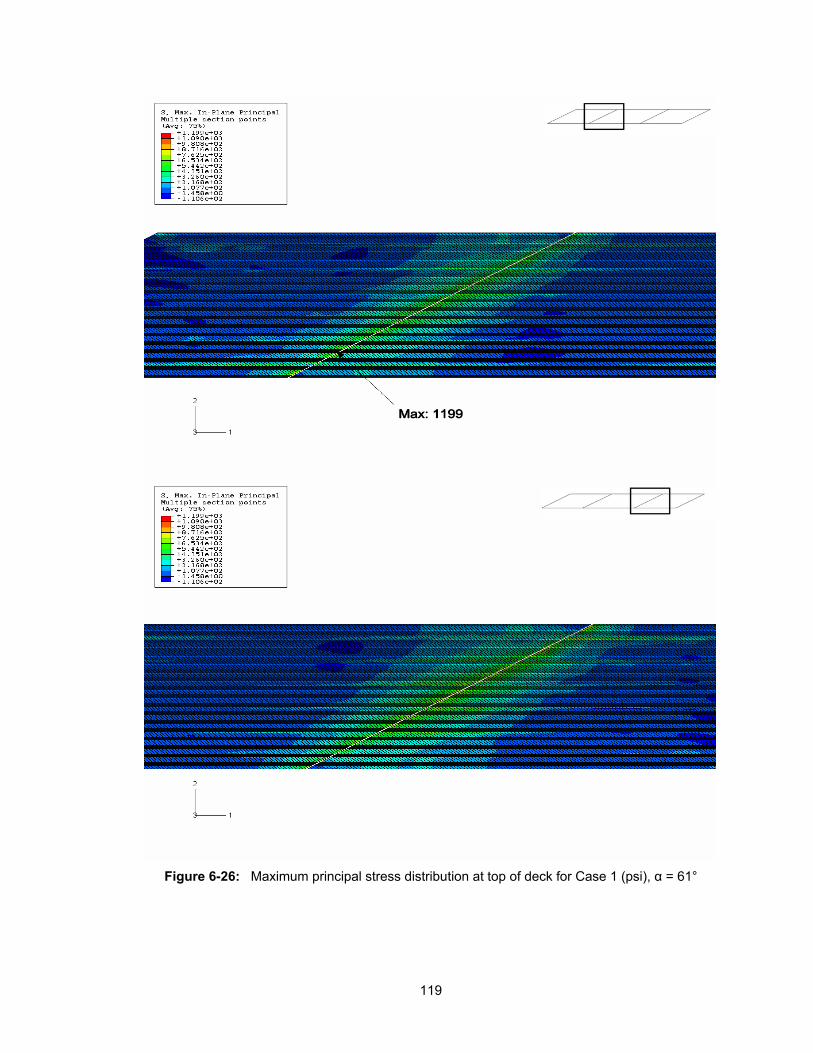
119
Figure 6-26: Maximum principal stress distribution at top of deck for Case 1 (psi), α = 61°
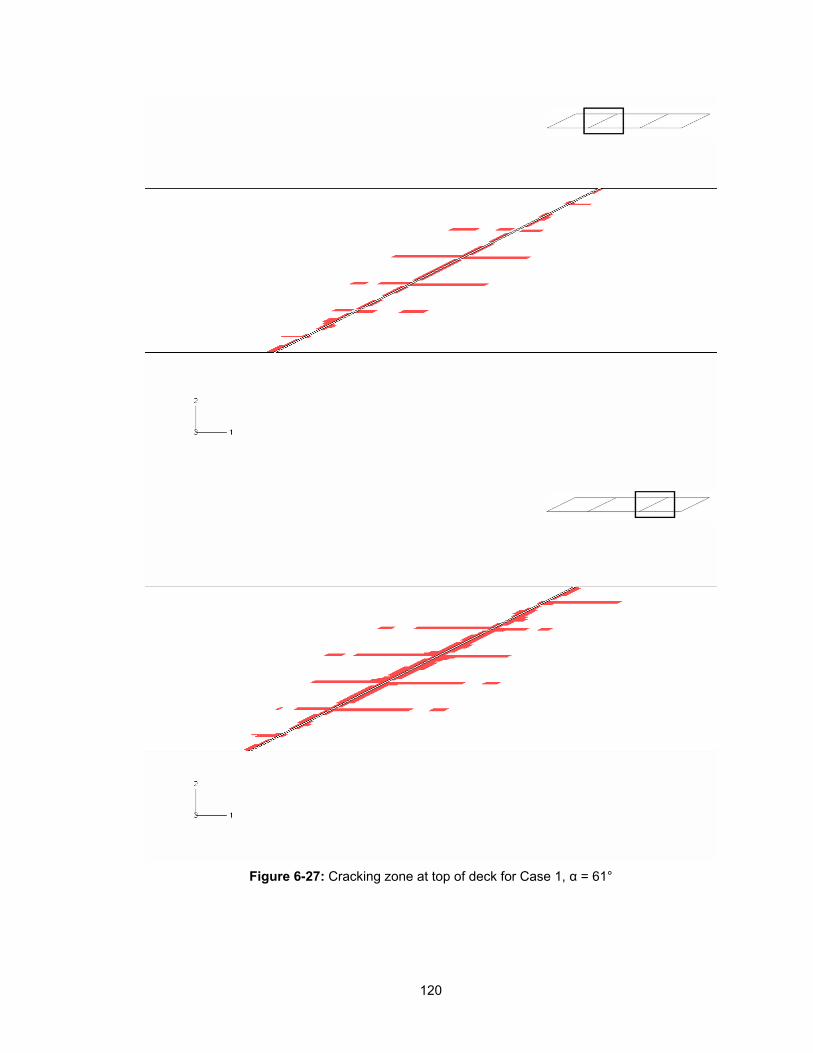
120
Figure 6-27: Cracking zone at top of deck for Case 1, α = 61°
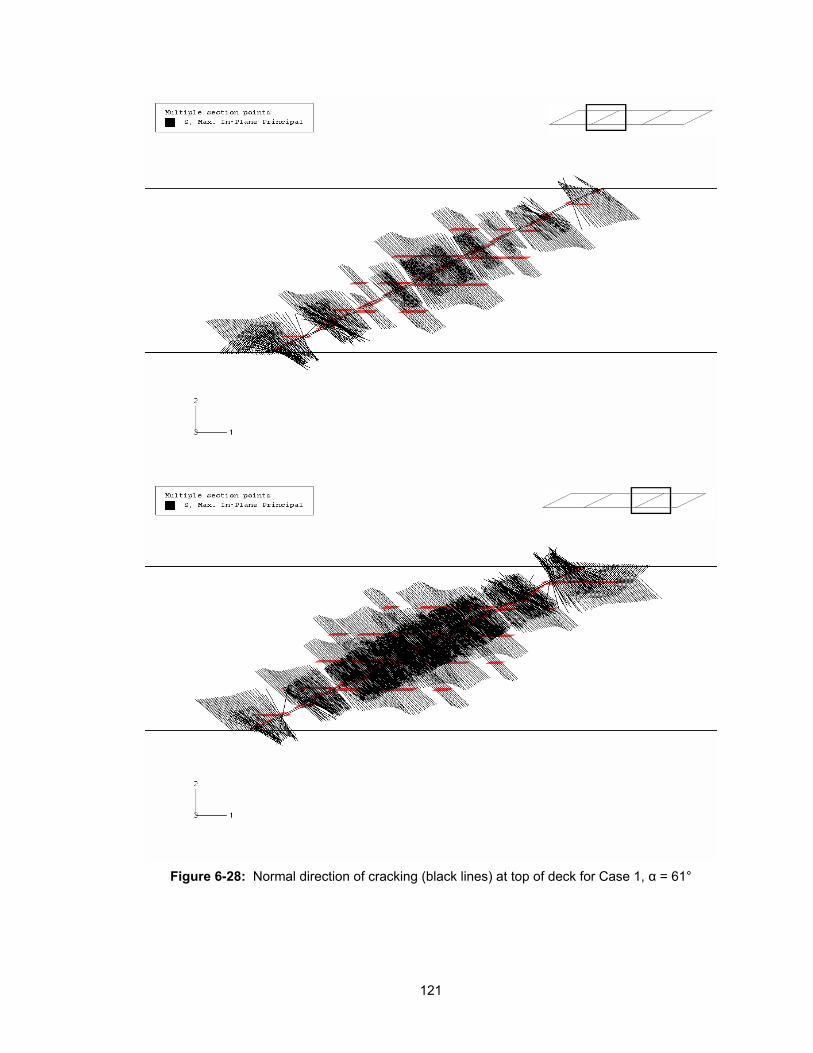
121
Figure 6-28: Normal direction of cracking (black lines) at top of deck for Case 1, α = 61°
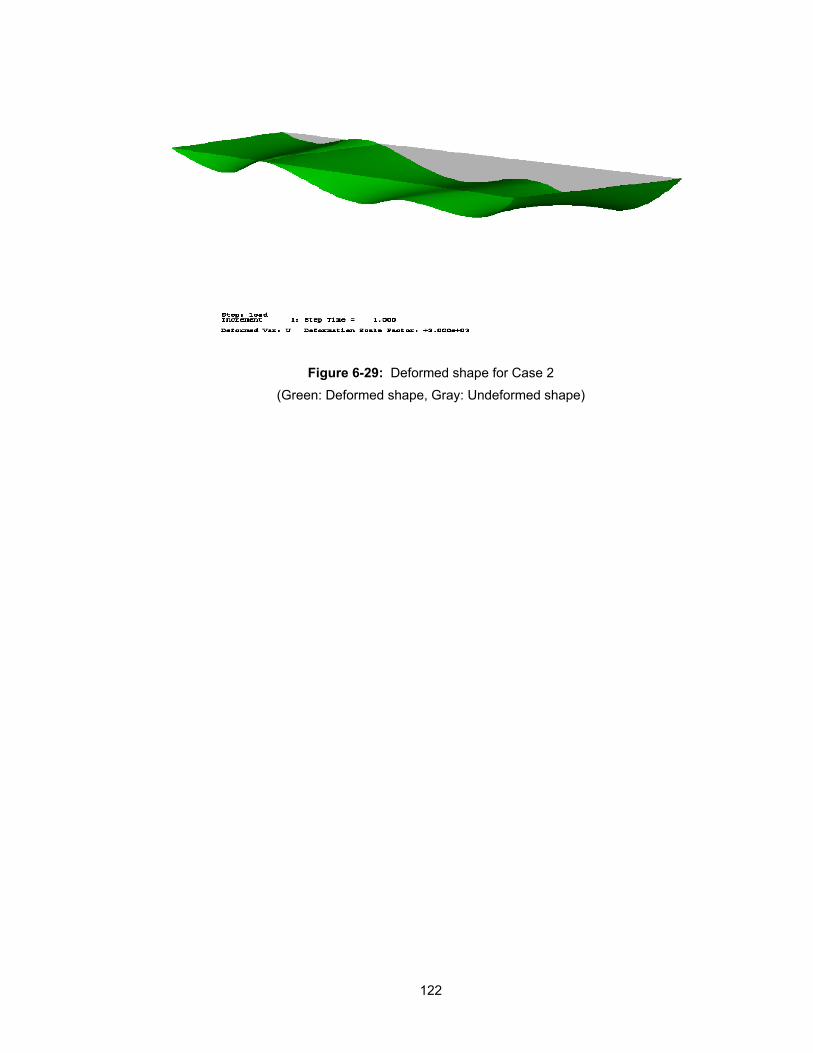
122
Figure 6-29: Deformed shape for Case 2
(Green: Deformed shape, Gray: Undeformed shape)
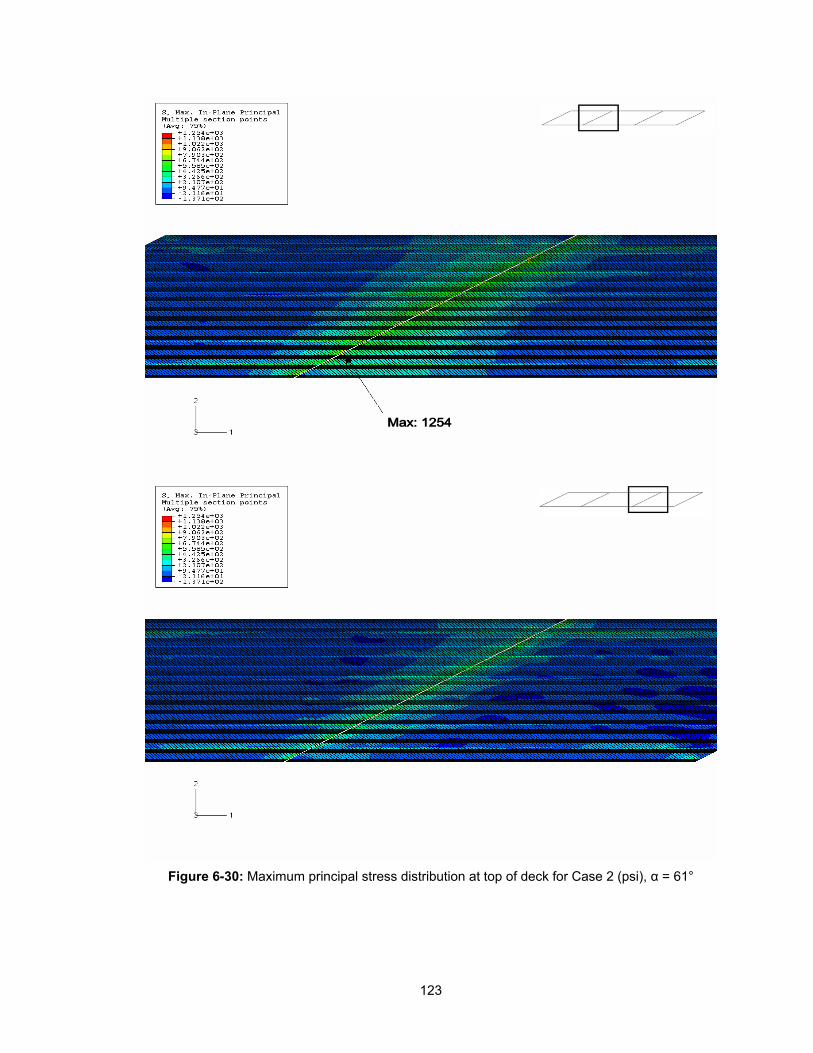
123
Figure 6-30: Maximum principal stress distribution at top of deck for Case 2 (psi), α = 61°

124
Figure 6-31: Cracking zone at top of deck for Case 2, α = 61°

125
Figure 6-32: Normal direction of cracking (black lines) at top deck for Case 2, α = 61°

126
Figure 6-33: Deformed shape for Case3
(Green: Deformed shape, Gray: Undeformed shape)
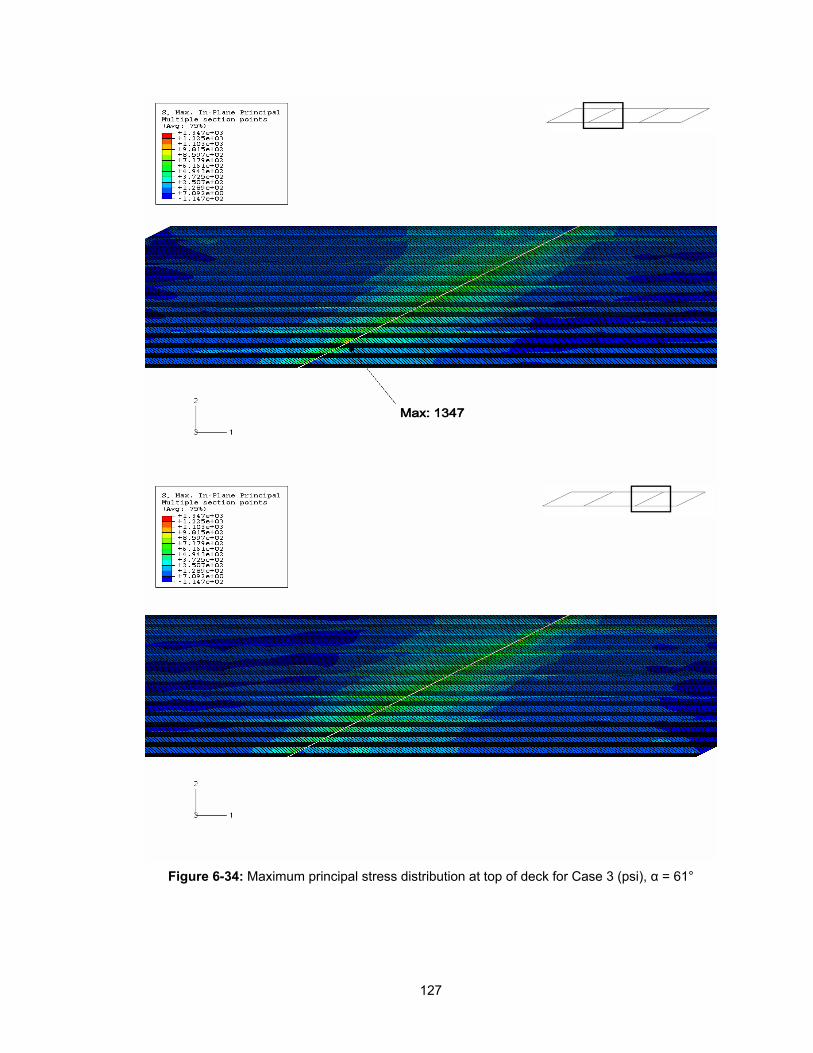
127
Figure 6-34: Maximum principal stress distribution at top of deck for Case 3 (psi), α = 61°
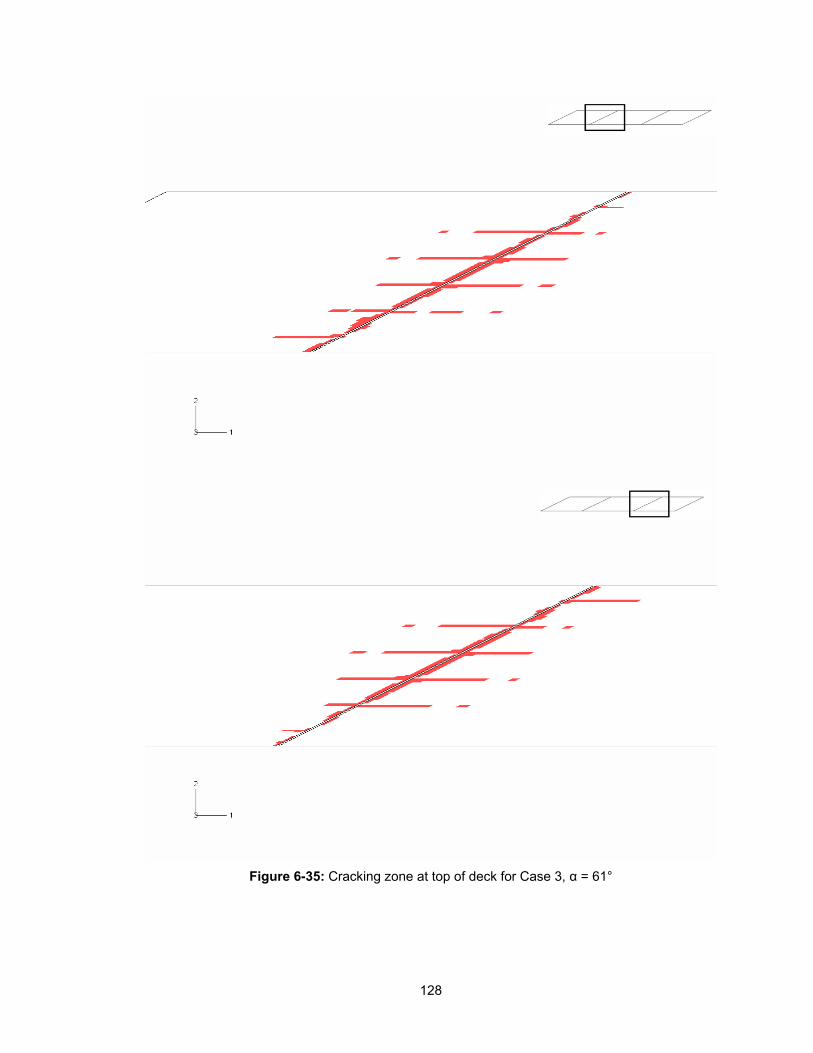
128
Figure 6-35: Cracking zone at top of deck for Case 3, α = 61°

129
Figure 6-36: Normal direction of cracking (black lines) at top deck for Case 3, α = 61°

130
Figure 6-37: Deformed shape for Case 4
(Green: Deformed shape, Gray: Undeformed shape)
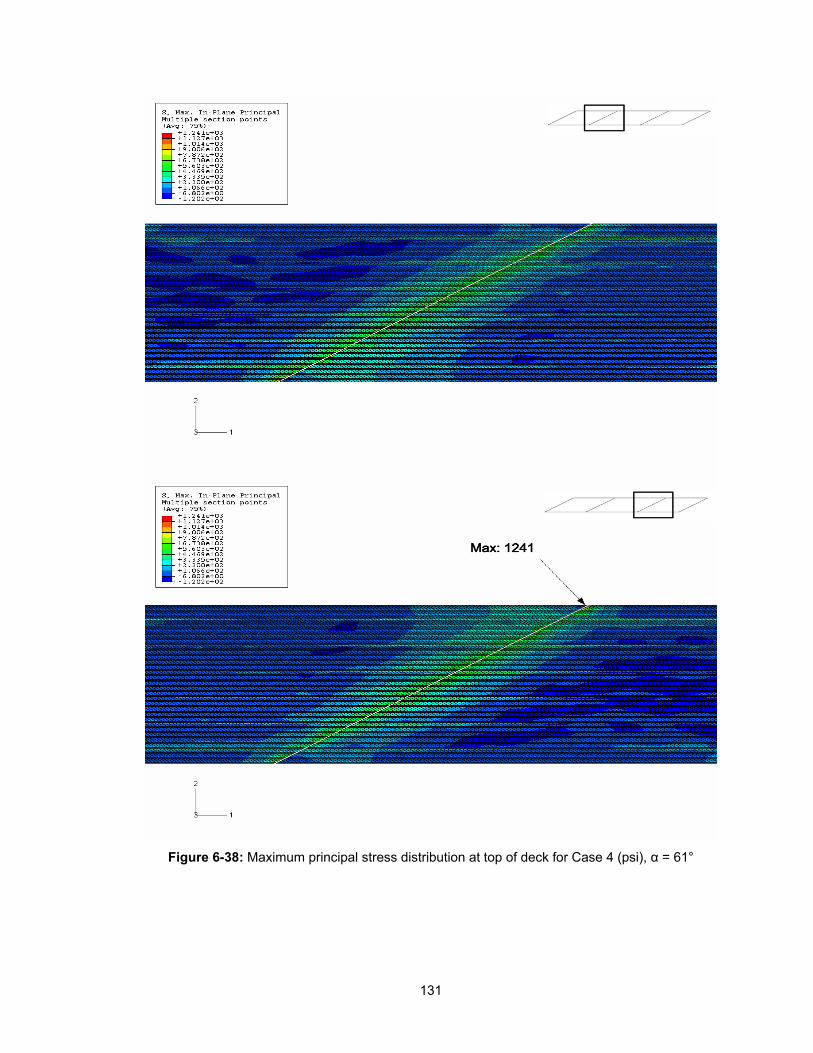
131
Figure 6-38: Maximum principal stress distribution at top of deck for Case 4 (psi), α = 61°
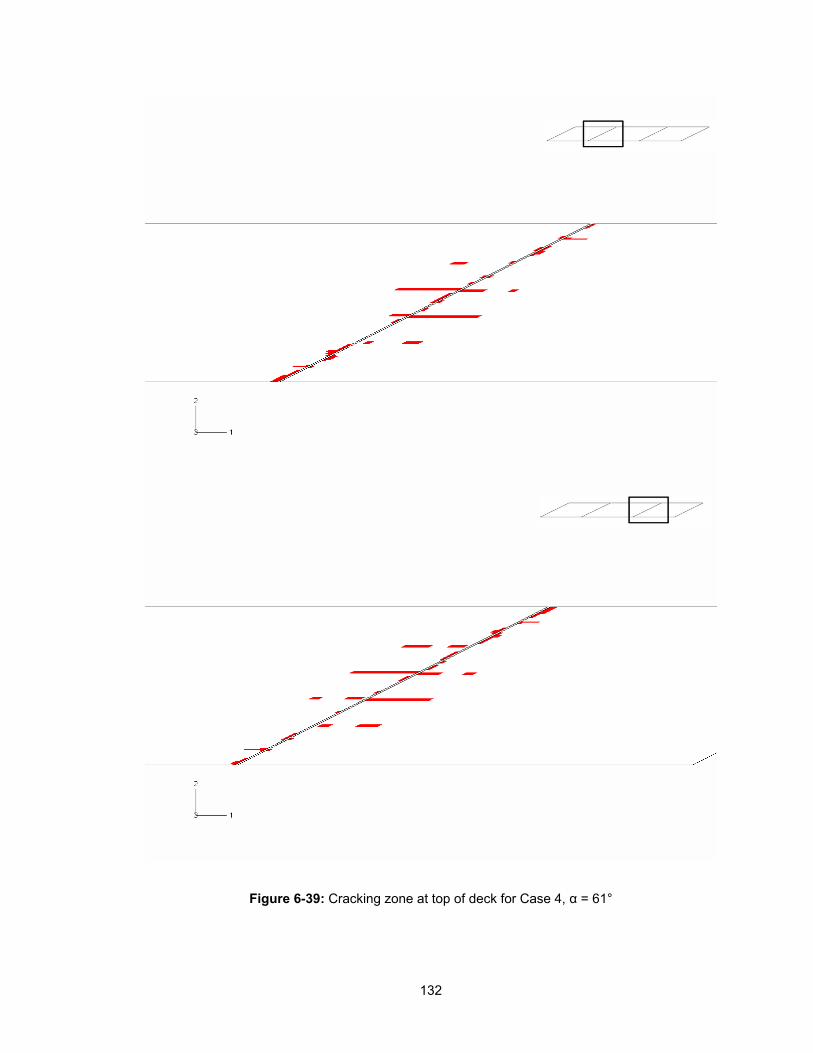
132
Figure 6-39: Cracking zone at top of deck for Case 4, α = 61°

133
Figure 6-40: Normal direction of cracking (black lines) at top deck for Case 4, α = 61°

134
Analysis of the figures above shows that the unit support settlement combinations did
have some effect on the level of stress and cracking behavior of the deck, but did not seem to
produce a very considerable variation in the magnitude of tensile stress. Increasing the
settlement's magnitude would certainly increase the magnitudes of the stress levels on the deck.
One can also observe that the stress contours and the cracking distribution did not change very
much with the different settlements imposed in Cases 1 and 3. However, in Cases 2 and 4, the
crack distribution was more noticeably different from the other cases. This is because, in Case 2,
the deck did not undergo equal deformations at two intermediate supports, producing the
"uneven" nature of the settlement (shown graphically in Figure 6-29). As a result, the deck
portion experiencing less deformation carried less tensile stress, and exhibited less cracking.
As for Case 4, it is noticed that the number of cracks produced was much less than that
for Cases 1 and 3. That is because, for Case 4, both intermediate supports experienced less
deformation than in Cases 1 and 3, and consequently carried less tensile stress under this
settlement combination, as shown in Figure 6-38.
These phenomena seem to indicate that if differential settlement occurred at critical areas
of the deck, such as at the intermediate support locations, where the deck is in tension under
gravity loading, the tensile stress distribution on the deck would be altered (from the results for
the case with no differential settlement) and would result in a modified cracking behavior. For this
particular type of multi-span, continuous deck bridge, the settlement at the intermediate supports
appears to be helpful in reducing the cracking of the deck. Furthermore, the results indicate that
single intermediate support settlement (Case 2) is good, and double support settlement (Case 4)
is better. However, it is not suggested to use different intermediate supports settlement to avoid
cracking because it may cause other effects in the bridge that could adversely affect the service
quality of the bridge.
6.4 SMEARED CRACK CONCRETE MODEL
A further advancement was made to the baseline US 331 bridge model detailed earlier in this
chapter. The concrete material properties were modified, to utilize the smeared crack concrete
model of ABAQUS. Use of this material model includes the capability not only of incorporating
nonlinear material properties for a nonlinear numerical analysis, but also of predicting the crack
distribution and crack directions automatically.
6.4.1 Smeared Crack Description
The following is the description of the smeared crack concrete model provided in the ABAQUS
Manual:
"The smeared crack concrete model in ABAQUS provides a general capability for
modeling concrete in all types of structures. As a ‘smeared’ model, it does not track
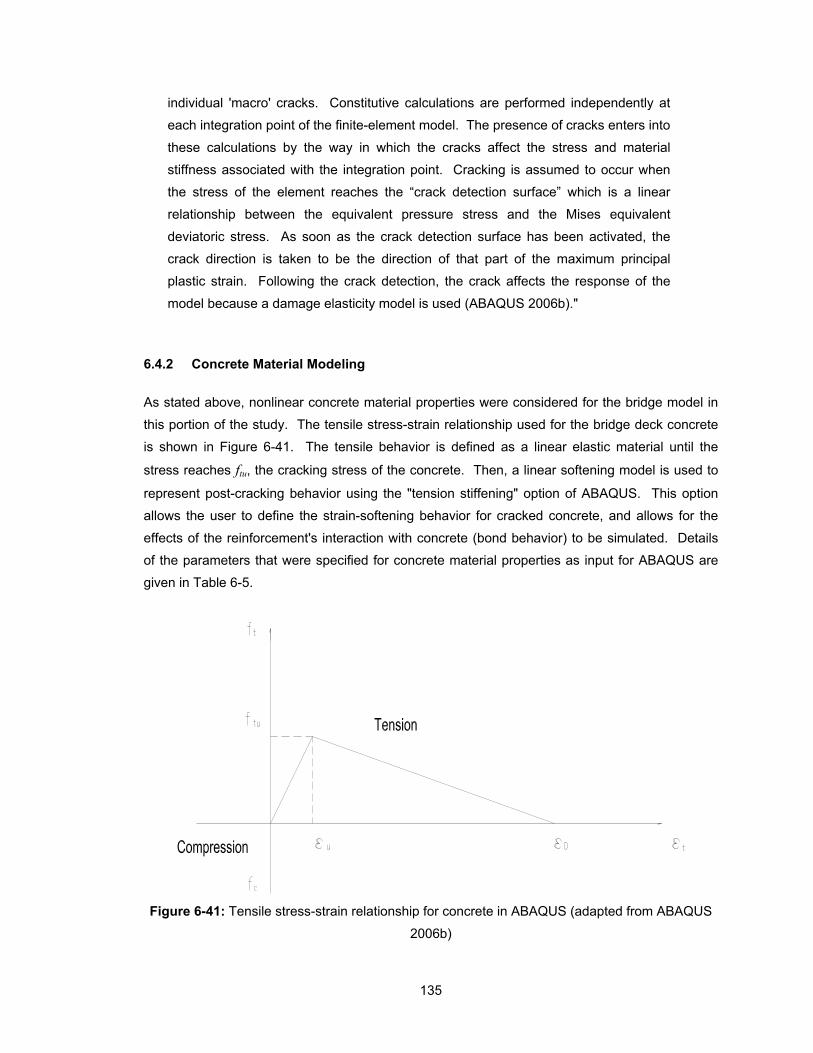
135
individual 'macro' cracks. Constitutive calculations are performed independently at
each integration point of the finite-element model. The presence of cracks enters into
these calculations by the way in which the cracks affect the stress and material
stiffness associated with the integration point. Cracking is assumed to occur when
the stress of the element reaches the “crack detection surface” which is a linear
relationship between the equivalent pressure stress and the Mises equivalent
deviatoric stress. As soon as the crack detection surface has been activated, the
crack direction is taken to be the direction of that part of the maximum principal
plastic strain. Following the crack detection, the crack affects the response of the
model because a damage elasticity model is used (ABAQUS 2006b)."
6.4.2 Concrete Material Modeling
As stated above, nonlinear concrete material properties were considered for the bridge model in
this portion of the study. The tensile stress-strain relationship used for the bridge deck concrete
is shown in Figure 6-41. The tensile behavior is defined as a linear elastic material until the
stress reaches ftu, the cracking stress of the concrete. Then, a linear softening model is used to
represent post-cracking behavior using the "tension stiffening" option of ABAQUS. This option
allows the user to define the strain-softening behavior for cracked concrete, and allows for the
effects of the reinforcement's interaction with concrete (bond behavior) to be simulated. Details
of the parameters that were specified for concrete material properties as input for ABAQUS are
given in Table 6-5.
Figure 6-41: Tensile stress-strain relationship for concrete in ABAQUS (adapted from ABAQUS
2006b)

136
Table 6-5: Concrete material properties
Property Value
Young's modulus 4.42 x 10⁶ psi
Density 0.086 lb/in3
Poisson's ratio 0.15
Yield stress (compression) 3000 lb/in2
Failure stress (compression) 6000 lb/in2
Plastic strain at failure (compression) 1.5 × 10⁻³ in./in.
ABAQUS uses a Rankine criterion to detect crack initiation and to define a crack
detection surface, and then computes the value of ftu in Figure 6-43 above from that crack
detection surface. Based on that value of ftu, and the modulus of elasticity, the value for u is
determined. A value is also supplied to ABAQUS to specify the amount of strain between u and
0; for the model herein, this "span" of strain for the descending portion of the curve was defined
to be 0.002. Finally, a user-defined value of the ratio of remaining stress to current cracking
stress is provided to ABAQUS as input for the point at the apex of the triangle in Figure 6-41, and
at the point where the descending branch of the curve meets the horizontal axis. For the present
model, that ratio was defined as 1 for the apex, and 0 for the rightmost point of the triangle.
6.4.3 Results and Analysis of Results for Smeared Crack Bridge Model
As stated above, the smeared crack material model was used to replace the previous linear
elastic concrete material utilized for the bridge model detailed in Section 6.2, for the same
loading. The resulting maximum principal stress distribution is presented in Figure 6-42, and the
maximum principal strain contour is presented in Figure 6-43. The maximum principal strain
contour was plotted for this model because for the smeared crack model, a certain value of stress
could occur either in the pre-cracking or post-cracking stage, and there is no way to distinguish
which is reported in the stress contour at each location. Therefore, strain was deemed more
indicative of the deck behavior for this model. (However, maximum principal stress values are
provided for "completeness," so that the same information is provided for this model as was
provided for the previous models.)
A relatively coarse mesh was used for this model to avoid the mesh sensitivity mentioned
in the ABAQUS manual associated with smeared cracking concrete models that utilize very fine
meshes. The manual states that the finite-element predictions have difficulty converging to a
unique solution because increasing mesh refinement leads to narrower crack bands, which
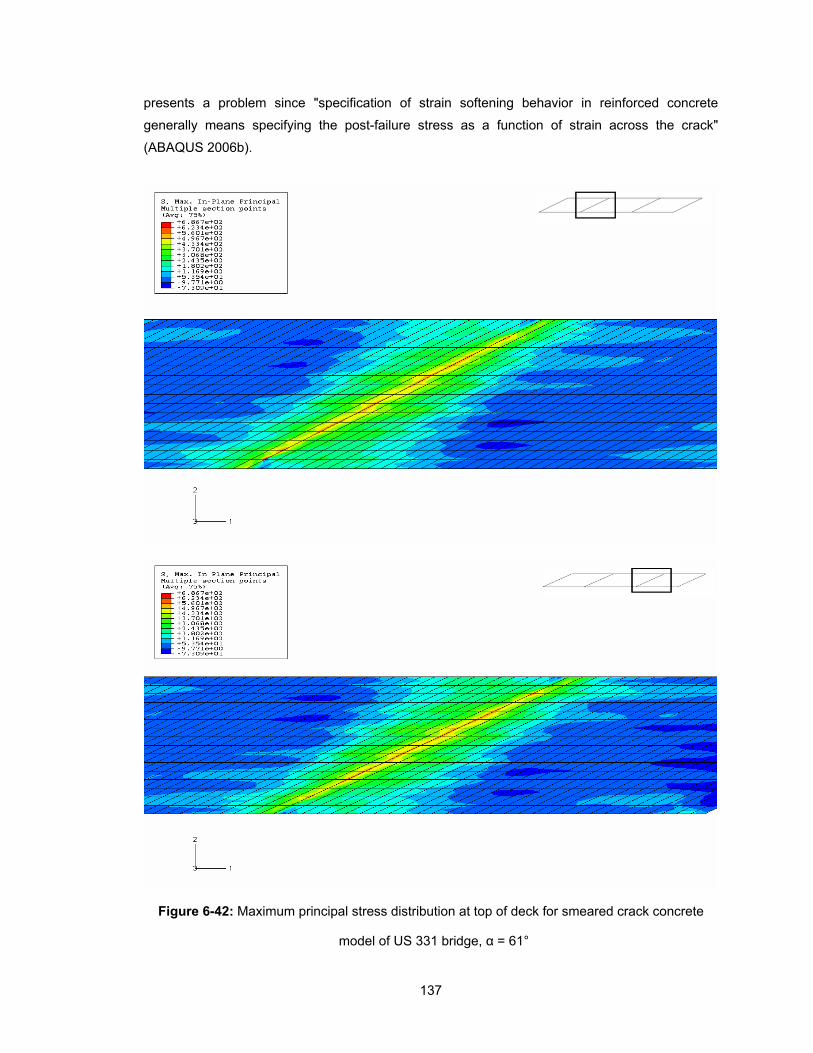
137
presents a problem since "specification of strain softening behavior in reinforced concrete
generally means specifying the post-failure stress as a function of strain across the crack"
(ABAQUS 2006b).
Figure 6-42: Maximum principal stress distribution at top of deck for smeared crack concrete
model of US 331 bridge, α = 61°
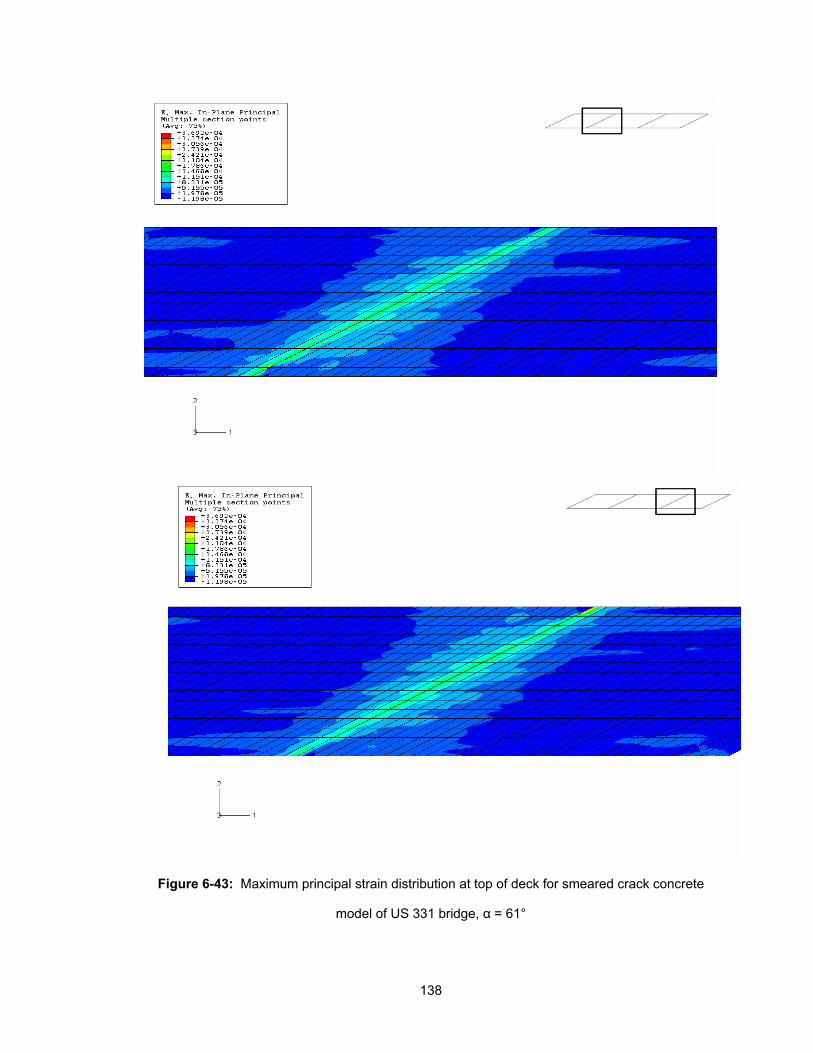
138
Figure 6-43: Maximum principal strain distribution at top of deck for smeared crack concrete
model of US 331 bridge, α = 61°
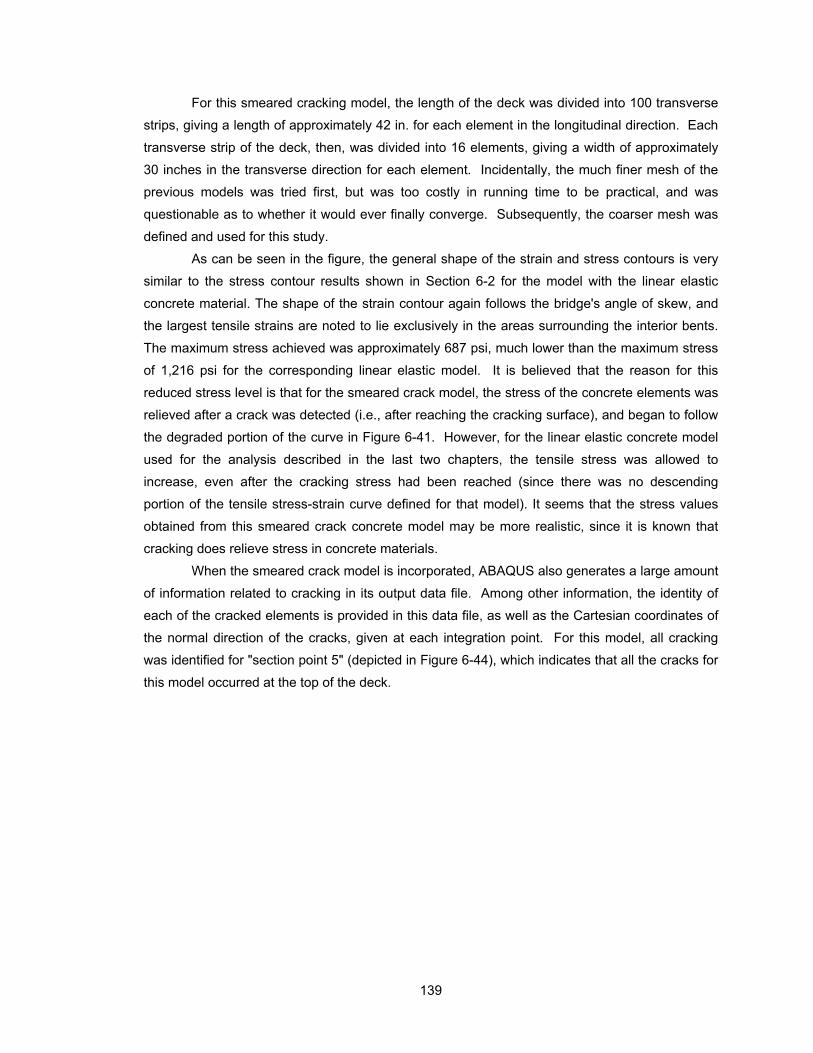
139
For this smeared cracking model, the length of the deck was divided into 100 transverse
strips, giving a length of approximately 42 in. for each element in the longitudinal direction. Each
transverse strip of the deck, then, was divided into 16 elements, giving a width of approximately
30 inches in the transverse direction for each element. Incidentally, the much finer mesh of the
previous models was tried first, but was too costly in running time to be practical, and was
questionable as to whether it would ever finally converge. Subsequently, the coarser mesh was
defined and used for this study.
As can be seen in the figure, the general shape of the strain and stress contours is very
similar to the stress contour results shown in Section 6-2 for the model with the linear elastic
concrete material. The shape of the strain contour again follows the bridge's angle of skew, and
the largest tensile strains are noted to lie exclusively in the areas surrounding the interior bents.
The maximum stress achieved was approximately 687 psi, much lower than the maximum stress
of 1,216 psi for the corresponding linear elastic model. It is believed that the reason for this
reduced stress level is that for the smeared crack model, the stress of the concrete elements was
relieved after a crack was detected (i.e., after reaching the cracking surface), and began to follow
the degraded portion of the curve in Figure 6-41. However, for the linear elastic concrete model
used for the analysis described in the last two chapters, the tensile stress was allowed to
increase, even after the cracking stress had been reached (since there was no descending
portion of the tensile stress-strain curve defined for that model). It seems that the stress values
obtained from this smeared crack concrete model may be more realistic, since it is known that
cracking does relieve stress in concrete materials.
When the smeared crack model is incorporated, ABAQUS also generates a large amount
of information related to cracking in its output data file. Among other information, the identity of
each of the cracked elements is provided in this data file, as well as the Cartesian coordinates of
the normal direction of the cracks, given at each integration point. For this model, all cracking
was identified for "section point 5" (depicted in Figure 6-44), which indicates that all the cracks for
this model occurred at the top of the deck.
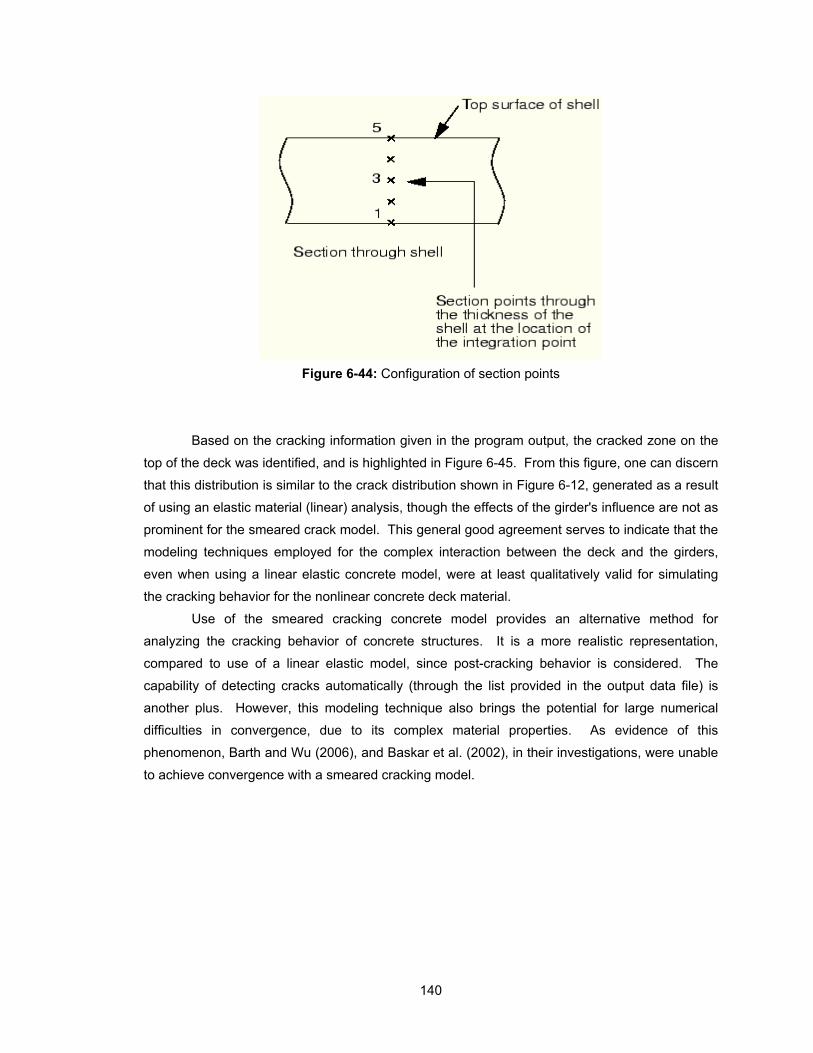
140
Figure 6-44: Configuration of section points
Based on the cracking information given in the program output, the cracked zone on the
top of the deck was identified, and is highlighted in Figure 6-45. From this figure, one can discern
that this distribution is similar to the crack distribution shown in Figure 6-12, generated as a result
of using an elastic material (linear) analysis, though the effects of the girder's influence are not as
prominent for the smeared crack model. This general good agreement serves to indicate that the
modeling techniques employed for the complex interaction between the deck and the girders,
even when using a linear elastic concrete model, were at least qualitatively valid for simulating
the cracking behavior for the nonlinear concrete deck material.
Use of the smeared cracking concrete model provides an alternative method for
analyzing the cracking behavior of concrete structures. It is a more realistic representation,
compared to use of a linear elastic model, since post-cracking behavior is considered. The
capability of detecting cracks automatically (through the list provided in the output data file) is
another plus. However, this modeling technique also brings the potential for large numerical
difficulties in convergence, due to its complex material properties. As evidence of this
phenomenon, Barth and Wu (2006), and Baskar et al. (2002), in their investigations, were unable
to achieve convergence with a smeared cracking model.
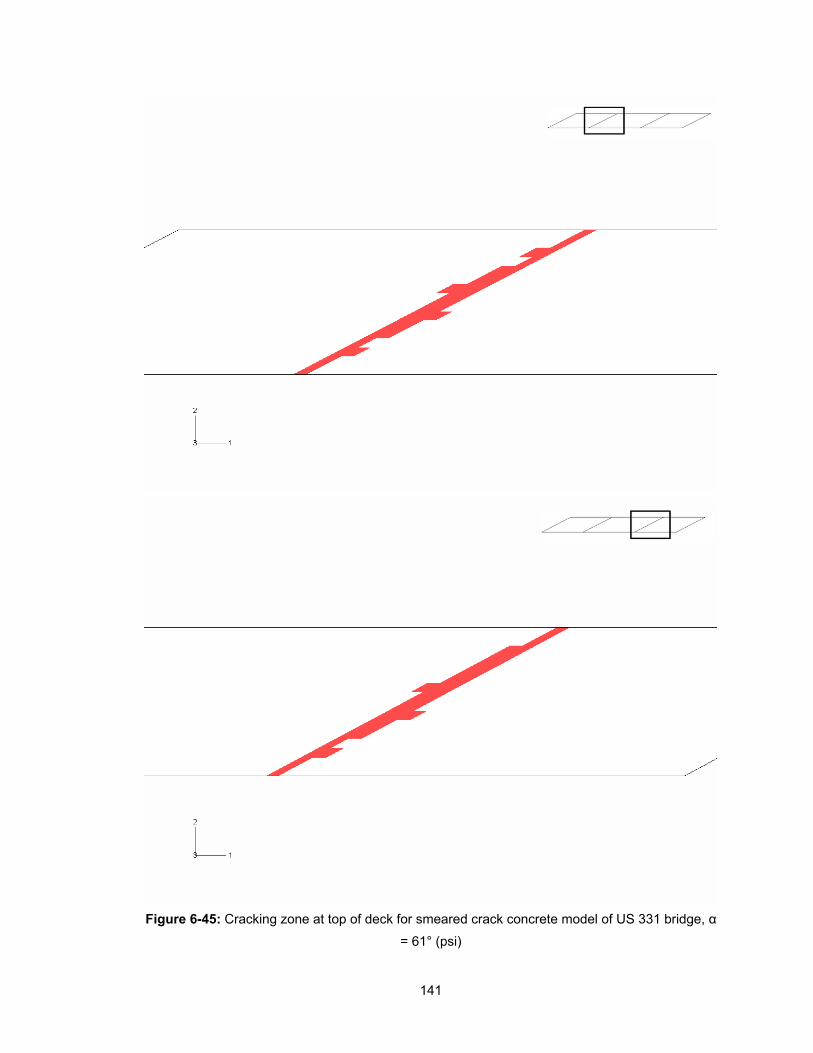
141
Figure 6-45: Cracking zone at top of deck for smeared crack concrete model of US 331 bridge, α
= 61° (psi)
142
6.5 SUMMARY AND CONCLUSIONS
6.5.1 Summary
A refined finite-element model of this continuous, skewed, composite bridge was developed in
detail to predict the stress distribution and cracking behavior of the deck on US 331. The
commercially available finite-element software ABAQUS was employed for the analysis. The
maximum principal stress contours, the cracking zone, and the direction of cracking were
obtained from the finite-element analysis. The suggested modeling technique has been shown to
capture the composite bridge's behavior.
To investigate the possible causes of the cracking, a parametric study, which
incorporated a skew angle effect and a differential support settlement effect, was conducted using
this finite-element bridge model. In addition, an advanced smeared cracking concrete model was
introduced to provide an alternative to linear elastic material modeling for simulating RC
structures.
6.5.2 Conclusions
Conclusions drawn from the results of the modeling study are as follows:
A finite-element model of an entire bridge is able to realistic predictions of the stress
distribution in the deck. The magnitude and direction of the maximum principal tensile
stresses are an important indicator of the crack distribution and direction of cracking.
For a continuous, skewed bridge, most cracking occurs at the top of the deck near the
location of the intermediate supports.
The skew angle of the deck has a large effect on the stress levels exhibited, and the cracking
behavior of the deck. Increasing the skew angle of the deck increases the tensile stresses
experienced in the deck. As a result, the deck is more prone to cracking if the skew angle is
severe. Cracking for a skewed deck will be parallel to the bridge skew. Since the observed
cracking on US 331 occurred perpendicular to the girders and not parallel to the bridge skew,
the large skew of this bridge is not a likely cause for the severe cracking encountered on the
US 331 deck.
Differential settlement at the supports is of importance to the cracking distribution of the deck
when it occurs at the intermediate supports of a continuous deck. However, the pattern of
cracking encountered on the US 331 deck does not match the pattern characteristic of
differential support settlement.
The smeared cracking concrete model of ABAQUS considers post-cracking concrete
behavior, and is able to detect the cracking automatically (i.e., without making inferences
based solely on a "cutoff" cracking stress). It is believed to be very efficient in reinforced

143
concrete structure modeling, if a well-configured model can be constructed that will allow for
numerical convergence.

144
Chapter 7
Conclusions and Recommendations
7.1 SUMMARY OF WORK
The focus of this investigation was a three-span, continuous, skewed bridge that was constructed
in the summer of 2003 as the northbound roadway bridge over the CSXT railroad on US 331
between Legrand and Montgomery at Station 946 + 40.7085 in Montgomery County, Alabama.
The bridge deck was cast in five placements, with the last two pours covering the sections above
the interior bents as shown in Figure 3-5. Cracking in the bridge deck was severe although it was
never opened to traffic, and in May 2005 the deck was removed and replaced. Excessive
amounts of wide surface cracks were initially observed; in addition, horizontal cracks were
discovered when cores were extracted from the deck. The horizontal cracks were generally
present at the level of the top reinforcement mat; however, in some cases these cracks
developed between the top reinforcement mat and the top concrete surface. The extent of the
horizontal cracking remains unknown; however, of the 26 cores extracted from the deck, 11
contained horizontal cracks. ALDOT personnel were unfamiliar with these horizontal cracks and
were interested in determining the possible cause(s) for the observed distresses.
The location of surface cracks was surveyed, and the results are shown in Figure 1-2.
Construction records of the bridge deck were obtained and reviewed. Many cores were extracted
from the deck to evaluate the in-place mechanical properties and the vertical distribution of
splitting tensile strength present in the deck. The concrete’s coefficient of thermal expansion was
determined in accordance with AASHTO TP-60 (2004). A petrographic evaluation was performed
on core samples. Ground penetrating radar was used to determine the as-built deck thickness
and the location of the steel reinforcement.
With the assistance of ALDOT personnel, five other bridges in Alabama were visited in
November and December of 2007. Cores were extracted adjacent to transverse cracks present
in the decks in an attempt to find horizontal cracks similar to those found in the US 331 bridge.
The effects of constituent materials on the cracking tendency and early-age behavior of
bridge deck concretes made with Alabama materials were experimentally evaluated by rigid
cracking frame testing techniques. The effect of supplementary cementing materials, water-
cement ratio, and placement temperature conditions on the early-age cracking tendency of bridge
deck concrete was evaluated.
The coefficient of thermal expansion values of Alabama concretes made with various
coarse aggregate types and volumes, water-cement ratios, and sand-aggregate ratios were
assessed.

145
Finite-element analysis techniques were used to gain an understanding of the cracking
mechanisms that may have caused excessive cracks in the US 331 bridge deck. A finite-element
model of the US 331 bridge was created and used to numerically predict the stress distribution
and cracking behavior of the deck. A parametric study was performed to evaluate the effect of
bridge skew angle and differential support settlement on the predicted crack patterns.
7.2 CONCLUSIONS
The conclusions from the work document in this report are as follows:
1. The surface crack survey (shown in Figure 1-2) reveals that the majority of the surface
cracking is perpendicular to the orientation of the steel girders. This indicates that this
cracking maybe caused by the girders’ restraint of concrete volume change effects.
2. The ground penetrating radar results indicated that the average deck thickness and the
top cover depth exceeded the design values by 1.25 in.
3. The concrete satisfied all standard slump, total air content, and compressive strength
requirements. Tests of deck core revealed adequate in-place compressive and splitting
tensile strengths.
4. No reduction in tensile strength was evident at the top of the deck when compared to the
middle and bottom of the deck. An average splitting tensile strength of 600 psi was
obtained. The bond between the aggregates and the paste was as anticipated for most
concretes made with this compressive strength. These results indicate that the cracking
is probably not attributable to inadequate curing.
5. No horizontal cracking was found in cores of five bridge decks that had structural
configurations similar to that of the US 331 bridge.
6. The results of the cracking sensitivity study show that the use of fly ash or slag cement
improves the concrete’s resistance to cracking when placed under hot weather
conditions. Bridge deck concrete is much more prone to cracking when placed under
summer construction conditions.
7. The average coefficient of thermal expansion (CTE) for Alabama concretes made with
river gravel, granite, and dolomitic limestone are 6.95, 5.60, and 5.52 x 10⁻⁶ /oF,
respectively. Changes to the sand-aggregate ratio and water-cement ratio do not have
much of an effect of the concrete’s CTE.
8. Finite-element analysis results indicate that increasing the skew of the deck increases the
tensile stresses experienced in the deck. As a result, a bridge deck is more prone to
cracking if the skew angle is severe. The cracking for a skewed deck will be parallel to
the bridge skew. However, four of the five in-place bridges surveyed had skew angles
that varied from 39° to 60° and no horizontal cracks were found in these decks. Since
the observed cracking on the US 331 deck occurred perpendicular to the girders and not

146
parallel to the bridge skew, the large skew of this bridge is not a likely cause for the
severe cracking encountered in the US 331 deck.
9. Differential settlement at the supports is of importance to the cracking distribution of the
deck when it occurs at the intermediate supports of a continuous deck. However, the
pattern of cracking encountered on the US 331 deck does not match the pattern
characteristic of differential support settlement.
10. The US 331 bridge was constructed during the summer months, which can produce high
early-age thermal stresses. The bridge deck was supported by steel girders and was
continuous over three spans, which is a condition that generates a high degree of
restraint to any volume change effects. The concrete in the US 331 deck had a high
coefficient of thermal expansion and high modulus of elasticity, which made it crack-
prone when subjected to significant early-age volume change effects and a high degree
of restraint. The majority of the surface cracking on the US 331 bridge deck is
perpendicular to the orientation of the steel girders, whichs supports the conclusion that
these cracks are related to the restraint provided by the steel girders. It is thus finally
concluded that horizontal cracking in the US 331 bridge deck was most likely caused by
excessive early-age temperature gradients combined with drying shrinkage gradients that
produced large shear and normal stresses at the top reinforcement mat location in a
concrete with a high coefficient of thermal expansion and high modulus of elasticity.
7.3 RECOMMENDATIONS
The following recommendations are offered based on the work documented in this report:
1. The use of fly ash or slag cement improves the concrete’s resistance to cracking when
placed under hot weather conditions. Bridge deck concrete is much more prone to
cracking when placed under summer construction conditions. It is thus recommended to
require the use of a partial cement replacement of 20% Class F fly ash, 30% Class C fly
ash, or more than 30% slag cement in bridge decks constructed from May 15 to
September 15 each year.
2. The use of concrete with a low coefficient of thermal expansion will reduce thermal
stresses in decks placed under hot weather conditions (Krauss and Rogalla 1996). It is
recommended to avoid the use of river gravel coarse aggregate in continuous bridge
decks constructed from May 15 to September 15 each year.
3. Some hot weather concreting problems, which include the development of large thermal
stresses during early hydration, can be controlled by limiting the concrete temperature at
placement (Krauss and Rogalla 1996). ALDOT has no specified limit on the fresh
concrete placement temperature. Krauss and Rogalla (1996) report that most
transportation agencies use a limit of 90 °F, but some have lower limits. It is

147
recommended to limit the maximum concrete temperature at placement to 85 °F for
bridge deck construction.
4. No horizontal cracking was found in cores of five bridge decks that had a structural
configuration similar to that of the US 331 bridge. If the primary failure mechanism
involves the use of a cracking-sensitive mixture, large thermal and moisture gradients,
and a high degree of restraint in the deck, then this type of cracking should be present in
other bridge decks in Alabama. It is recommended to visit more bridges in search of
additional decks with horizontal cracking.

148
REFERENCES
AASHTO TP 60. 2004. Standard Method of Test for Coefficient of Thermal Expansion of
Hydraulic Cement Concrete. Washington D.C: American Association of State Highway and
Transportation Officials.
AASHTO. 2007. AASHTO LRFD Bridge Design Specifications. Customary U.S. Units 4th ed.
Washington D.C: American Association of State Highway and Transportation Officials.
ABAQUS. 2006a. Benchmark Manual. Version 6.6-1. ABAQUS, Inc., Providence, Rhode Island.
ABAQUS. 2006b. User’s Manual. Version 6.6-1. ABAQUS, Inc., Providence, Rhode Island.
ACI 116R-12. 1997. Cement and Concrete Terminology. American Concrete Institute. Farmington
Hills, Michigan.
ACI 201.1. 1997. Guide for Making a Condition Survey of Concrete in Service. American
Concrete Institute. Farmington Hills, Michigan.
ACI 207.1R. 1996. Mass Concrete. American Concrete Institute, Farmington Hills, Michigan.
ACI 209R. 1997. Prediction of Creep, Shrinkage, and Temperature Effects in Concrete
Structures. American Concrete Institute, Farmington Hills, Michigan.
ACI 232.2R. 1997. Use of Fly Ash in Concrete, American Concrete Institute. Farmington Hills,
Michigan.
ACI 233.R. 1997. Ground Granulated Blast-Furnace Slag as a Cementitious Constituent in
Concrete. American Concrete Institute, Farmington Hills, Michigan.
ACI 318. 2008. Building Code Requirements for Structural Concrete and Commentary. American
Concrete Institute, Farmington Hills, Michigan.
Barth, K. E., and H. Wu. 2006. Efficient Nonlinear Finite Element Modeling of Slab on Steel
Stringer Bridges. Finite Elements in Analysis and Design, Vol. 42, pp. 1304-1313.
Baźant, Z.P., and L.J. Najjar. 1972. Nonlinear Water Diffusion in Nonsaturated Concrete.
Materials and Structures, Vol. 5, No. 25, pp. 3-20.
Bjøntegaard, Ø. 1999. Thermal Dilation and Autogenous Deformation as Driving Forces to Self-
Induced Stresses in High Performance Concrete. Doctoral Thesis. Norwegian University of
Science and Technology, Division of Structural Engineering.
Bogue, R.H. 1929. Calculations of the Compounds in Portland Cement. Industrial and
Engineering Chemistry, Vol. 1, No. 4, pp. 192-197.
Breitenbücher, R. 1990. Investigation of Thermal Cracking with the Cracking-Frame. Materials
and Structures, Vol. 23, No. 135, pp. 172-177.
Breitenbücher, R., and M. Mangold, 1994, Minimization of thermal cracking in concrete at early
ages. In RILEM Proceedings 25, Thermal cracking in concrete at early ages, ed. R.
Springenschmid, London: E & FN Spon, pp. 205-212.
149
Choo, T., D.G. Linzell, J. Lee, and J.A. Swanson. 2005. Response of a Continuous, Skewed,
Steel Bridge During Deck Placement. Journal of Constructional Steel Research, Vol. 61,
pp. 567-586.
Dakhil, F.H., P.D. Cady, and R.E. Carrier. 1975. Cracking of Fresh Concrete as Related to
Reinforcement. Journal of the American Concrete Institute, Vol. 72, No. 8, pp. 421-428.
Darwin, D., and J. Browning. 2008. Construction of Low Cracking High Performance Concrete
(LC-HPC) Bridge Decks: Field Experience. Proceedings of the Concrete Bridge
Conference, May 4-7, St. Louis, MO, CD-Rom.
Dobson, V. 1994. Time of Setting. In Significance of Tests and Properties of Concrete and
Concrete-Making Materials, STP 169C, ed. P. Klieger and J.F. Lamond, Philadelphia,
Pennsylvania, ASTM International, pp. 77-87.
Emanuel, J.H., and L. Hulsey. 1977. Prediction of the Thermal Coefficient of Expansion of
Concrete. Journal of the American Concrete Institute, Vol. 74, No. 4, pp. 149-155.
Emborg, M. 1989. Thermal Stresses in Concrete Structures at Early Ages. Doctoral Thesis. Luleå
University of Technology, Division of Structural Engineering.
FHWA. 2005. Cast-in-Place High Performance Concrete. Federal Highway Administration High
Performance Concrete Website,
http://knowledge.fhwa.dot.gov/cops/hpcx.nsf/home?openform&Group=HPC%20Cast-in-
Place%20Construction&tab=WIP, accessed 2008.
Holt, E. 2001. Early Age Autogenous Shrinkage of Concrete. Doctoral Thesis. The University of
Washington in Seattle.
Issa, M.A. 1999. Investigation of Cracking in Concrete Bridge Decks at Early Ages. Journal of
Bridge Engineering, Vol. 4, No. 2, pp. 116-124.
Japan Concrete Institute. 1998. Technical Committee Report on Autogenous Shrinkage of
Concrete. In Autogenous Shrinkage of Concrete, ed. Ei-ichi Tazawa, London, E & FN
Spon, pp. 3-67.
Jenkins, R.S., and J.F. Lane. 2004. Petrographic Evaluation of Cores from ALDOT Project MGF-
009(500). MACTEC Project No. 6136-05-0037, MACTEC Engineering and Consulting,
Atlanta, Georgia.
Kim, S.K., and M.C. Won. 2004. Horizontal Cracking in Continuously Reinforced Concrete
Pavements. ACI Structures Journal, Vol. 101, No. 6, pp. 784-791.
Kosmatka, S.H., B. Kerkhoff, and W.C. Panarese. 2002. Design and Control of Concrete
Mixtures. 14th Edition. Portland Cement Association, Skokie, Illinois.
Krauss, P.D., and E.A. Rogalla. 1996. Transverse Cracking in Newly Constructed Bridge Decks.
NCHRP Report 380, Transportation Research Board, National Research Council,
Washington, D.C.
Lange, D.A., and S.A. Altoubat. 2002. Early Thermal Changes. In RILEM Report 25, Thermal
Cracking in Concrete at Early Ages, ed. A. Bentur, RILEM Publications S.A.R.L., pp. 37-38.

150
Mangold, M. 1998. Methods for Experimental Determination of Thermal Stresses and Crack
Sensitivity in the Laboratory. In RILEM Report 15, Prevention of Thermal Cracking in
Concrete at Early Ages, ed. R. Springenschmid, E & FN Spon, London, UK, pp. 26-29.
Meadows, J.L. 2007. Early-Age Cracking of Mass Concrete Structures. Master’s Thesis, Auburn
University, Alabama.
Mehta, P. K., and P.J.M. Monterio. 2006. Concrete: Microstructure, Properties, and Materials. 3rd
Edition. McGraw-Hill, Inc., New York, NY.
Mindess, S., J. Young, and D. Darwin. 2002. Concrete. 2nd Edition. Prentice Hall, Upper Saddle
River, NJ.
Neville, A.M., and J.J. Brooks. 1987. Concrete Technology. Essex, UK: Longman Scientific and
Technical.
Nilsson, M. 2003. Restraint Factors and Partial Coefficients for Crack Risk Analyses of Early Age
Concrete Structures. Doctoral Thesis, Luleå University of Technology, Division of Structural
Engineering.
Poole, J.L, K.A. Riding, R.A. Browne, and A.K. Schindler. 2006. Temperature Management of
Mass Concrete Structures, Concrete Construction Magazine.
RILEM Technical Committee 119-TCE, 1998, Testing of the Cracking Tendency of Concrete at
Early Ages in the Cracking Frame Test. In Rilem Report 15, Prevention of Thermal
Cracking in Concrete at Early Ages, ed. by R. Springenschmid, E & FN Spon, London, UK,
pp. 339-346.
Schindler, A.K., and B.F. McCullough. 2002. The Importance of Concrete Temperature Control
During Concrete Pavement Construction in Hot Weather Conditions. Journal of the
Transportation Research Board, TRR No. 1813: 3-10.
Schindler, A.K., and K.J. Folliard. 2005. Heat of Hydration Models for Cementitious Materials. ACI
Materials Journal, Vol. 102, No. 1, pp. 24-33.
Sioulas, B., and J.G. Sanjayan. 2000. Hydration Temperatures in Large High-Strength Concrete
Columns Incorporating Slag. Cement and Concrete Research, Vol. 30, No.11, pp. 1791-
1799.
Springenschmid, R., and R. Breitenbücher. 1998. Influence of Constituents, Mix Proportions and
Temperature on Cracking Sensitivity of Concrete. In RILEM Report 15, Prevention of
Thermal Cracking in Concrete at Early Ages, ed. R. Springenschmid, E & FN Spon,
London, pp. 40-50.
Townsend, C.L. 1965. Control of Cracking in Mass Concrete Structures. Engineering Monograph
No. 34. Water Resources Technical Publication. U.S. Department of the Interior, Bureau of
Reclamation.
Westman, G. 1999. Concrete Creep and Thermal Stresses: New Creep Models and their Effects
on Stress Development. Doctoral Thesis. Luleå University of Technology, Division of
Structural Engineering.