Evaluation of corrosion in crevices in screw joints
57
TECHNICAL REPORT 7007429 Approved by UTMR, Mats Thörnqvist Approved Date 2011-05-16 Info class I Issued by UTMR, Philip Björlenstam Revision 0 Page 1 (41) Evaluation of corrosion in crevices in screw joints N.B. The copyright and ownership of this document including associated computer data are and will remain ours. They must not be copied, used or brought to the knowledge of any third party without our prior permission. © Scania CV AB, Sweden SV 1744 01-06 (2006-11-16) Attached Thesis Evaluation of corrosion in crevices in screw joints Author Björlenstam Philip Supervisors at Scania Bengt Johansson, SSSOJO and Tina Holmgren, SSSUJT Department Materials Technology UTMR – Cabs, chassis and buses Scope 30hp (hp/credits) University Royal Institute of Technology, Chemical Engineering Supervisor at University Inger Odnevall Wallinder, Professor Division of Surface and Corrosion Science Department Chemistry School of Chemical Science and Engineering, KTH Stockholm Date 2010-10-25 to 2011-03-31 Abstract In this Master of Science thesis screws with different coatings were exposed to an accelerated corrosion test in order to investigate the corrosion development. The test matrix constituted of hexagonal and flange screws (fastened on frames) coated with either zinc/iron (ZnFe) or a flake system of aluminum and zinc (GEOMET). The corrosion results were analyzed by means of X- ray diffraction (XRD). In this study the screws were also crosscut and analyzed by means of FEG-SEM in order to determine the thickness and the elemental content of the surface coating. The result of the corrosion test showed that the screws coated with GEOMET showed a very good corrosion resistance whilst the screws coated with ZnFe failed to fulfill the demands on corrosion resistance that Scania has.
Transcript of Evaluation of corrosion in crevices in screw joints

TECHNICAL REPORT 7007429
Approved by
UTMR, Mats Thörnqvist
Approved Date
2011-05-16 Info class
I Issued by
UTMR, Philip Björlenstam Revision
0
Page
1 (41)
Evaluation of corrosion in crevices in screw joints
N.B. The copyright and ownership of this document including associated computer data are and will remain ours.
They must not be copied, used or brought to the knowledge of any third party without our prior permission.
© Scania CV AB, Sweden
SV 1744 01-06 (2006-11-16)
Attached Thesis
Evaluation of corrosion in crevices in screw joints
Author
Björlenstam Philip
Supervisors at Scania
Bengt Johansson, SSSOJO and Tina Holmgren, SSSUJT
Department
Materials Technology
UTMR – Cabs, chassis and buses
Scope
30hp (hp/credits)
University
Royal Institute of Technology, Chemical Engineering
Supervisor at University
Inger Odnevall Wallinder, Professor
Division of Surface and Corrosion Science
Department Chemistry School of Chemical Science and Engineering, KTH Stockholm
Date
2010-10-25 to 2011-03-31
Abstract
In this Master of Science thesis screws with different coatings were exposed to an accelerated corrosion test in order to investigate the corrosion development. The test matrix constituted of hexagonal and flange screws (fastened on frames) coated with either zinc/iron (ZnFe) or a flake system of aluminum and zinc (GEOMET). The corrosion results were analyzed by means of X-ray diffraction (XRD). In this study the screws were also crosscut and analyzed by means of FEG-SEM in order to determine the thickness and the elemental content of the surface coating. The result of the corrosion test showed that the screws coated with GEOMET showed a very good corrosion resistance whilst the screws coated with ZnFe failed to fulfill the demands on corrosion resistance that Scania has.

TECHNICAL REPORT 7007429
Approved by
UTMR, Mats Thörnqvist
Approved Date
2011-05-16 Info class
I Issued by
UTMR, Philip Björlenstam Revision
0
Page
2 (41)
N.B. The copyright and ownership of this document including associated computer data are and will remain ours.
They must not be copied, used or brought to the knowledge of any third party without our prior permission.
© Scania CV AB, Sweden SV 1744 01-06
Summary The main objective of this thesis work was to determine whether or not the crevices found in screw joints contribute to the deteriorated corrosion properties that is seen on screw joints. The aim of the study was also to characterize the coating of the screws by means of SEM (scanning electron microscopy) in order to connect coating structure to the way the screws corrode.
The investigated screws consisted of 2 types of screws (galvanized steel), flange and hexagonal, and 3 types of surface coatings, zinc iron (ZnFe), DACROMET and GEOMET. The screw joints were exposed to an accelerated corrosion testing (ACT) during 16 weeks. This report will only evaluate the first 8 weeks due to lack of time within the framework of this master thesis. After the exposure, the corrosion products from the crevice were analyzed by means of X-ray diffraction (XRD). The corrosion process was analyzed and modeled in the light of the observed results.
The screws coated with zinc iron showed white rust already within a few days of ACT-testing and started to develop red rust after only one week. This does not fulfill the demands on corrosion resistance set by Scania. The GEOMET and DACROMET coated screws however showed a very good corrosion protection with no visible corrosion products formed after 8 weeks of ACT-testing.
The surface coating on the edges of both the GEOMET and the zinc iron coated screws was very thin. The plane surfaces on the other hand had coatings of sufficient thickness.

TECHNICAL REPORT 7007429
Approved by
UTMR, Mats Thörnqvist
Approved Date
2011-05-16 Info class
I Issued by
UTMR, Philip Björlenstam Revision
0
Page
3 (41)
N.B. The copyright and ownership of this document including associated computer data are and will remain ours.
They must not be copied, used or brought to the knowledge of any third party without our prior permission.
© Scania CV AB, Sweden SV 1744 01-06
1 Introduction ....................................................................................................................... 4
2 Theory ................................................................................................................................ 5 2.1 Corrosion in screw joints 5
2.1.1 Crevice corrosion 5 2.1.2 Waterline corrosion 6
2.2 Corrosion process 7 2.2.1 Zinc corrosion 7 2.2.2 Iron corrosion 9 2.2.3 Environment 10
2.3 Electrochemistry 11 2.4 Corrosion protection of fasteners 12
2.4.1 GEOMET - Flake coating 12 2.4.2 Painting of the frame 14 2.4.3 Settings in the screw joints 15
2.5 Test methods 16 2.5.1 Accelerated corrosion testing 16
3 Experimental .................................................................................................................... 17 3.1 Test materials 17 3.2 Instrumentation and methods used 17
3.2.1 Scanning electron microscope 17 3.2.2 X-ray diffraction 18 3.2.3 Accelerated corrosion testing chamber 19
4 Results ............................................................................................................................. 22 4.1 Crevice simulation 22 4.2 SEM/EDS analysis of the surface coating 23
4.2.1 SEM pictures for verifying the thickness of the surface coating 23 4.2.2 EDS analysis of the coating in GEOBLACK 500 25 4.2.3 EDS analysis of the coating in GEOBLACK 321 26 4.2.4 EDS analysis of the coating in GEOMET, unexposed 27 4.2.5 EDS analysis of the coating in GEOMET, exposed 6 weeks 28 4.2.6 EDS analysis of the coating in ZnFe, unexposed 29
4.3 Visual evaluation of corrosion 30 4.3.1 Visual evaluation 30 4.3.2 Corrosion results from the visual evaluation 32
4.4 Results of the X-ray diffraction 33
5 Discussion ....................................................................................................................... 36 5.1 Crevice simulation 36 5.2 SEM/EDS analysis of the surface coating 36 5.3 Visual evaluation of the corrosion 36 5.4 Results of the X-ray diffraction 37
6 Conclusions ..................................................................................................................... 38
7 Further work .................................................................................................................... 38
8 Acknowledgments ........................................................................................................... 39
9 References ....................................................................................................................... 40

TECHNICAL REPORT 7007429
Approved by
UTMR, Mats Thörnqvist
Approved Date
2011-05-16 Info class
I Issued by
UTMR, Philip Björlenstam Revision
0
Page
4 (41)
N.B. The copyright and ownership of this document including associated computer data are and will remain ours.
They must not be copied, used or brought to the knowledge of any third party without our prior permission.
© Scania CV AB, Sweden SV 1744 01-06
1 Introduction Corrosion on fasteners is an actual corrosion problem for Scania and other vehicle industries today. Except for this case, Scania has a very good corrosion protection. The reason that the screw joints corrode more than the remaining parts of the vehicles partly depends on the selection of the surface coating and partly on the geometry of the joint. There is also a possibility that initiation of corrosion starts in the crevice that always occurs in screw joints and afterwards spread over the entire joint. This could predominantly explain the fast corrosion evolution often observed.
The corrosion behavior can be evaluated from a crevice point of view in terms of selection of material and surface coatings. The environment in the crevices is very dependent of the size of the crevice. For example a crevice of 10µm often has an acidic environment with pH values down towards 2 whilst a crevice of 120µm has a pH around 9-10. This obviously affects the corrosion behavior and the material selection.
The aim of this project is to clarify whether or not the crevices around screw joints contribute to the deteriorated corrosion properties that is seen on screw joints. Another aim is to propose surface coatings/anti-corrosive treatments that leads to improved corrosion properties in comparison to systems used at Scania today.
Furthermore, the aim is to characterize the coating of the screws by means of SEM (scanning electron microscopy) in order to connect coating structure to the way the screws corrode.
At first fundamentally important screw joints were identified and described. The corrosion behavior of the joints after different usage in field was documented. Joints were designed and exposed to a cyclic corrosion testing during 16 weeks. After the exposure, the corrosion products from the crevice were analyzed by means of X-ray diffraction (XRD), and the placement, width and depth determined. The corrosion process was analyzed and modeled in the light of the observed results.
The initiating step of the corrosion process on the screw and reasons to corrosion in the joints were further investigated.
One objective was also to investigate screws with surface coatings containing flakes. Investigations were conducted to study the length and size of the flakes and their locations in order to understand their behavior on the corrosion process. Comparisons were made by means of FEG-SEM investigations between surface coatings of new screws and screws exposed to corrosive environment.

TECHNICAL REPORT 7007429
Approved by
UTMR, Mats Thörnqvist
Approved Date
2011-05-16 Info class
I Issued by
UTMR, Philip Björlenstam Revision
0
Page
5 (41)
N.B. The copyright and ownership of this document including associated computer data are and will remain ours.
They must not be copied, used or brought to the knowledge of any third party without our prior permission.
© Scania CV AB, Sweden SV 1744 01-06
2 Theory
2.1 Corrosion in screw joints
Crevices in metal constructions can be found between joint parts and in flanges. Crevice corrosion is initiated by a local change of the local chemistry within a crevice or at shielded surfaces. A stagnant solution (electrolyte) is present in the crevice, which is different from that of freely exposed surfaces. This chemical environment keeps moisture, traps pollutants, concentrates corrosion products and gradually excludes oxygen. It is one of the most common types of localized corrosion processes and also one of the most harmful because it can take place also on alloys that normally show perfect corrosion resistance and it also occurs in areas that are not immediately visible.
2.1.1 Crevice corrosion [1, 2, 3]
When fluid enters the crevice it constitutes as an electrolyte and the geometry of the crevice can cause the fluid to remain until it evaporates. The diffusion of elements, such as oxygen and carbon dioxide, into the crevice is also limited by the geometry of the crevice. The rate of corrosion inside the crevice is affected by the low concentrations of oxygen and carbon dioxide.
The corrosion rate depends on the width of the crevice where a broader crevice acts more as an open surface in the way it corrodes. In a more narrow crevice the diffusion of reactants is more restricted and the entrapment of fluids is also increased. What is more is that the capillary forces are stronger which prolongs the drying time. If the crevice is small enough no fluid will be able to penetrate and consequently there will not be any corrosion attack.
The first step in crevice corrosion is that oxygen is reduced while the metal surface is oxidized, similar to general corrosion processes. However, the electrolyte soon becomes oxygen deficient due to the fact that the reduction of oxygen in crevices most often is occurring faster than the diffusion of oxygen into the crevice. This oxygen deficiency leads to the formation of an oxygen concentration cell (also differential aeration cell). Since a higher oxygen concentration is found at the crevice opening, this is where the oxygen reduction occurs and hence also where the cathodic reaction takes place
OHeOHO 442 22 (1)
with the corresponding reaction on the anodic side inside the crevice surface, as
eMM n
(2)
In a differential aeration cell the anode and cathode are therefore physically separated, thus the electrons from the metal oxidation are transported through the metal from the crevice to the crevice surface opening (figure 1). This transportation of electrons creates an electrical potential gradient that in its turn leads to transportation of anions, such as chloride and hydroxide ions, into the crevice and cations (Na+, Mn+) out of the crevice.

TECHNICAL REPORT 7007429
Approved by
UTMR, Mats Thörnqvist
Approved Date
2011-05-16 Info class
I Issued by
UTMR, Philip Björlenstam Revision
0
Page
6 (41)
N.B. The copyright and ownership of this document including associated computer data are and will remain ours.
They must not be copied, used or brought to the knowledge of any third party without our prior permission.
© Scania CV AB, Sweden SV 1744 01-06
Figure 1. Schematic picture of crevice corrosion.
The concentration of chloride and metal ions will be high and the oxygen concentration low inside the crevice. However, outside of the crevice the concentration of oxygen and chloride ions will be normal whilst the hydroxide ion concentration will be high. The hydroxide ion liberation on the cathodic side leads to an increase of the pH value outside of the crevice. The metal dissolution inside the crevice produces cations, which in some cases undergo hydrolysis. This does not happen to all types of metal ions. Small ions are acidic enough to hydrolyse whilst the larger ions of magnesium and zinc, which are non-acidic and therefore do not hydrolyse. The hydrolysis of the metal ions creates hydrogen ions and metal hydroxides:
nHOHMOHnM n
n )(2 (3)
The metal dissolution is further facilitated by the decrease of pH caused by the hydrogen ions generated from the reaction. The more metal ions formed, the more chloride ions diffuse into the crevice with the latter being known to accelerate the dissolution of metal ions from oxidized metal surfaces. The pH within the crevice is further decreased by the formation of metal ions.
2.1.2 Waterline corrosion [2, 3]
Waterline corrosion is another phenomena found in crevices, as can be seen in figure 2. It can occur in larger crevices and flanges, where oxygen diffusion is not significantly limited but the geometry still confines water. The formation of a water line during drying inside of a crevice can also give rise to a differential cell, especially if the metal is zinc or iron. This situation is called a partial immersion cell or simply waterline corrosion. In the occurrence of water line corrosion, the electrolyte or fluid becomes depleted in oxygen. The anodic reaction will take place at the area under the waterline, while the area just above the water line serves as the cathodic site (figure 2).

TECHNICAL REPORT 7007429
Approved by
UTMR, Mats Thörnqvist
Approved Date
2011-05-16 Info class
I Issued by
UTMR, Philip Björlenstam Revision
0
Page
7 (41)
N.B. The copyright and ownership of this document including associated computer data are and will remain ours.
They must not be copied, used or brought to the knowledge of any third party without our prior permission.
© Scania CV AB, Sweden SV 1744 01-06
Figure 2. Formation of water line corrosion for Zn.
The reduction and oxidation reactions that occur follows as reaction (1) and (2). Waterline corrosion is characterized by the constant movement of the corroding area as the evaporation is proceeding. The electrolyte interface will move at varying speed over the crevice surface. The evaporation is initially fast, but as time goes on, the line moves at a slower pace due to the precipitation of corrosion products. The edges and corners of the crevice get more exposed, hence more corroded, when the concentration of the electrolyte is higher in combination with longer time of exposure. When the layer of electrolyte becomes thinner the diffusion of reacting components, such as carbon dioxide, to the metal surface is more easily facilitated. Naturally the diffusion depends on the surrounding atmosphere. Hydroxide ions are produced from the reduction of oxygen, which leads to an increase in pH and therefore there will be an area just above the line with a high pH. These conditions make the corrosion products precipitate, leaving a band of solid corrosion products as the process proceeds. There will be a pH gradient in the electrolyte interface because the anodic and cathodic areas are separated. When the electrolyte has left the crevice, the corrosion products are unevenly distributed over the surface. The placement of the anodic and cathodic areas are connected to this distribution since certain corrosion products form at different pH values.
2.2 Corrosion process
2.2.1 Zinc corrosion
Zinc oxide (ZnO), Hydrozincite (Zn5(OH)6(CO3)2) and Simonkolleite (Zn5(OH)8Cl2∙H2O) are the three main corrosion products formed within confined zinc surfaces. The surrounding atmospheric environment affects the relative appearance of these products [7]. Due to the fact that zinc does not hydrolyse as in the case of iron (Fe3+) ions, the crevices in zinc materials will probably not suffer the low pH-values caused by the hydrolysis and the following autocatalytic process.

TECHNICAL REPORT 7007429
Approved by
UTMR, Mats Thörnqvist
Approved Date
2011-05-16 Info class
I Issued by
UTMR, Philip Björlenstam Revision
0
Page
8 (41)
N.B. The copyright and ownership of this document including associated computer data are and will remain ours.
They must not be copied, used or brought to the knowledge of any third party without our prior permission.
© Scania CV AB, Sweden SV 1744 01-06
On a newly produced zinc surfaces a thin film of zinc oxide is formed instantly, even before the initialization of crevice corrosion. This film is recognized as a greyish layer and has a thickness of a few nanometres and is also somewhat protective against further corrosion. The crystalline form of zinc oxide is called Zincite and is formed by the following reaction:
OHZnOOHZn 2
2 2
(4)
As can be seen from reaction (4) the formation of zinc oxide is favored by a high pH value. As the time for corrosion goes on the zinc oxide decreases due to transformations into other products such as zinc hydroxide, Zn(OH)2. In a humid or wet environment that is neutral or alkaline, the zinc oxide is transformed into zinc hydroxide almost instantly. The hydroxide layer is denser than the zinc oxide layer. Depending on the pH of the surrounding liquid it can appear in different amorphous and crystalline forms [7, 8].
Second to the formation of hydroxides is the formation of zinc carbonates. Hydrozincite (zinc hydroxy carbonate) is formed close to cathodic areas since it is favored by the high pH values at these sites. The carbon dioxide concentration in the surrounding environment affects the amount of hydrozincite formed [4]. The formation involves the replacement of some of the hydroxide ligands by carbonate, a reaction that occurs in a few hours according to eq. 5.
2365
2
3
2 265 COOHZnCOOHZn
(5)
where carbonate originates from carbon dioxide. The formation of Simonkolleite can occur by the replacement of the carbonate ions with chloride ions, which on a zinc surface takes place within days. A low pH and a high concentration of chloride ions favor the formation of Simonkolleite [18]. From the pH and chloride dependence visualized in figure 3, it is clear that Simonkolleite is unstable at sufficiently high pH.
Figure 3. Stability diagram for zinc. showing the formation of zinc oxide and Simonkolleite at varying pH and
chloride concentrations [9]

TECHNICAL REPORT 7007429
Approved by
UTMR, Mats Thörnqvist
Approved Date
2011-05-16 Info class
I Issued by
UTMR, Philip Björlenstam Revision
0
Page
9 (41)
N.B. The copyright and ownership of this document including associated computer data are and will remain ours.
They must not be copied, used or brought to the knowledge of any third party without our prior permission.
© Scania CV AB, Sweden SV 1744 01-06
A thin film of electrolyte is normally formed in a crevice towards the end of a drying process. Carbon dioxide can with ease diffuse and dissolve in this electrolyte inducing the following pH decreasing reaction.
32 HCOOHaqCO (6)
The electrolyte is however neutralized by the formation of hydrogen carbonate, which also promotes the formation of Simonkolleite:
OHOHClOHZnOHClZnO 2625 22852 (7)
Simonkolleite is naturally formed at the anodic sites since it is formed in the regions with low pH, as shown in figure 3. In an environment with a high amount of chloride, the formation of Simonkolleite leads to a decrease of chloride ions in the electrolyte and this may to a small extent lower the conductivity of the electrolyte. Due to the formation of carbonate from carbon dioxide [8], the pH decreases leading to changes in the composition of the electrolyte.
The transport of carbon dioxide to the corroding areas will be limited by the crevice and this will have a considerable effect on the corrosion products. On open surfaces, carbonates will react with the hydroxide ions thus lowering the pH. When there are no carbonates, the pH will consequently rise, thus making way for different kinds of corrosion products. The most dominant corrosion product at low concentrations of carbon dioxide is zinc oxide [2]. When the concentration of carbon dioxide increases, Hydrozincite is more common. Since this phase is believed [4] to be more protective than other zinc corrosion products due to its passivating properties, this could have an impact on the corrosion rate. With a low concentration of carbon dioxide in chloride containing environments, an increase in the corrosion rate was observed.
Crevice corrosion is characterized by a high potential and a large spreading of anodic and cathodic areas and therefore the corrosion will be more localized. The more localized form of corrosion corrodes through the zinc coatings of galvanized steels whereas uniform corrosion spreads more evenly. At the slower pace of uniform corrosion, a layer of Simonkolleite will form over the whole surface as the anodic and cathodic areas tightly spaced, whilst a larger separation of these areas leads to the formation of Hydrozincite and Zincite at cathodic sites, and Simonkolleite at anodic sites.
2.2.2 Iron corrosion
Steel surfaces form passive films when exposed to alkaline environments. The Fe3+-ion is easily subjected to hydrolysis, which means that if an aeration differential cell is created in a sodium chloride containing environment, there will be a high chloride-concentration within the crevice. The corrosion process is initiated when chloride ions dissolve the passivating layer [3]. The passivating layer is also dissolved by the increased acidity caused by the hydrolysis of iron.
TECHNICAL REPORT 7007429
Approved by
UTMR, Mats Thörnqvist
Approved Date
2011-05-16 Info class
I Issued by
UTMR, Philip Björlenstam Revision
0
Page
10 (41)
N.B. The copyright and ownership of this document including associated computer data are and will remain ours.
They must not be copied, used or brought to the knowledge of any third party without our prior permission.
© Scania CV AB, Sweden SV 1744 01-06
Two layers build up the passivating oxide film of a steel surface. The first consists of an inner layer of Magnetite, Fe3O4, and an outer layer of FeOOH, or as it is commonly known, rust. The outer surface contains pores that reach down to the inner layer, making transport of oxygen and corrodents possible. Magnetite will be oxidized to hydrated Fe2O3 and FeOOH by oxygen diffused through the pores. If the steel surface is exposed to acidic environments, the oxide will be dissolved by the acid causing the pores in the inner layer of Magnetite to open and enable the dissolution of iron ions at the metal surface.
At atmospheric conditions the predominant corrosion products formed are various crystalline forms of FeOOH (α-FeOOH, β-FeOOH, γ-FeOOH) and amorphous rust [11]. If the iron rust formation continues in an environment with zinc corrosion products, these will as mentioned before, change the composition of the iron corrosion products to mainly amorphous forms.
2.2.3 Environment
Water vapour, humidity or rain must be present for atmospheric corrosion to occur. When a thin film of moisture is formed on a metal surface it will function as an electrolyte responsible for the transfer ions. This transfer makes it possible for the electrochemical reactions to proceed. The more ionic the electrolyte is the more the corrosion reactions will be enhanced. Contaminants in the atmosphere have a significant impact on the corrosion rate for automobiles and vehicles used outdoors. Depending on which metal is exposed to which pollutant there is also a difference in affect. A pollutant might exist in relatively high atmospheric concentrations but still have none or an insignificant effect on the corrosion rate of one metal, whereas another metal can be severely corroded by the same pollutant. Examples of pollutants and atmospheric components that are known to influence corrosion rates are carbon dioxide, sulphur dioxide, ozone, ammonia and nitrogen dioxide. Apart from carbon dioxide, sulphur dioxide is of significant impact to the corrosion of zinc, especially at relative humidites exceeding 70%. Sulphur dioxide is emitted during all combustion of fossil fuels containing sulphur. It is moderately soluble in water where it reacts to form sulphuric acid H2SO4. The dissolution of metal ions can be induced by sulphuric acids.
In sulphur-rich environments the corrosion rate is highly dependent on the temperature. Zincite (ZnO) and zinc sulphate (Zn SO4∙7H20) are promoted by low temperatures (4-14 °C) whilst higher temperatures (22-30 °C) is favorable for the formation of zinc hydroxy sulphates (Zn4(OH)6SO4∙nH2O, n=1-6) [12]. The presence of zinc sulphate tend to increase the corrosion rate while zinc hydroxy sulphates form a protective layer that results in a decreased corrosion rate.
The corrosion of zinc is also influenced by salts such as NaCl, KCl, LiCl and NaBr. The chloride anions in the atmosphere typically originate from marine environments and the content is therefore higher in areas close to the coasts. More important for Scania is the use of deicing salts on roads during the winter season, since this result in a severe chloride exposure of trucks and vehicles during traffic conditions.

TECHNICAL REPORT 7007429
Approved by
UTMR, Mats Thörnqvist
Approved Date
2011-05-16 Info class
I Issued by
UTMR, Philip Björlenstam Revision
0
Page
11 (41)
N.B. The copyright and ownership of this document including associated computer data are and will remain ours.
They must not be copied, used or brought to the knowledge of any third party without our prior permission.
© Scania CV AB, Sweden SV 1744 01-06
Chlorides have a influence on the corrosion as they can, due to their size and mobility, penetrate into the oxide layer and activate corrosion reactions. The presence of sodium chloride results in an enhanced conductivity of the electrolyte that lead to an increased corrosion rate. When the conductivity is low, the cathode and the anode are closely spaced. Since spreading of passivating corrosion products formed on the anodic sites to the cathodic sites tends to limit the cathodic reaction, the corrosion rate slows down. Higher conductivity leads to a higher corrosion current, larger distance between the anode and the cathode and thus a higher corrosion rate. On the other hand the presence of sodium chloride decreases the dissolution of oxygen in the electrolyte. For concentrations of sodium chloride above 3 % the corrosion rate starts to decrease.
Another form of pollutant that may affect the corrosion process is mud coming from the roads or the forest. The dirt may work as a moisture binder and enhance the corrosion by keeping the surface damp. It may also consist of metal- and carbon particles that can contribute to enhanced corrosion as they may function as local electrodes.
2.3 Electrochemistry [13]
When a wet metal surface corrodes the metal is oxidized into ions in a solution or to solid oxide or hydroxide. For this oxidation of the metal to proceed it requires that the emitted electrons from the oxidation process at the same time are consumed by an oxidant that thereby is reduced:
edRneOxeductionR
neMeMeOxidation n
:
:
OHeOHOeactionRCathodic
neMeMeeactionRAnodic n
442:
:
22
In nature the most common oxidant is oxygen, but also water and hydrogen ions in acidic solutions may oxidize some metals as for example iron with hydrogen evolution as a result of the reduction process.
In contrast with normal chemical reactions the electron exchange in corrosion does not happen directly between two reacting molecules, atoms or ions. In many cases it is even shown that the corrosion attack on a metal is the most severe where the access of oxygen limited. The oxidation and reduction process can occur locally separated from each other but still be connected through the electron exchange. The exchange comes when the electrons migrate through the metal from the surface where the oxidation takes place to the surface where the reduction occurs. At the same time there need to be a migration of ions in the water phase to maintain the electron neutrality in each point.
Corrosion is an electrochemical process with two different electrode reactions and an electrical circuit with electron conduction in the metal and ion migration in the water solution, the electrolyte. In cases where the different reaction surfaces can be distinguished from each other, corrosion is characterized as a local electrochemical corrosion whereas when the reactions

TECHNICAL REPORT 7007429
Approved by
UTMR, Mats Thörnqvist
Approved Date
2011-05-16 Info class
I Issued by
UTMR, Philip Björlenstam Revision
0
Page
12 (41)
N.B. The copyright and ownership of this document including associated computer data are and will remain ours.
They must not be copied, used or brought to the knowledge of any third party without our prior permission.
© Scania CV AB, Sweden SV 1744 01-06
occur simultaneously over the whole surface is often denoted as common electrochemical corrosion.
Since an electrochemical corrosion process is made up of two electrode reactions the kinetics of these two reactions have an impact on the corrosion rate, even though to different extent. The electrochemical reaction rate is normally expressed in current density (A/m2) instead of molar formation rate (mol/m2,s). The relation between these two measurements for the reaction rate follows from the stoichiometry of the electrode reaction and Faraday’s law. The practical advantage with this equivalence between current density and molar formation rate is that the rate of an electrode reaction conveniently can be measured with an amperemeter.
Figure 4. The potential of zinc and hydrogen half cell reactions versus the current density.
2.4 Corrosion protection of fasteners
Friction is one of the most important things for screws and it can be regulated with surface treatment, which is also important for the corrosion protection. Corrosion should be avoided partly for esthetical reasons but also because it affects the function. Screw joints might collapse due to corrosion. The most common surface treatments on Scania are electrolytical (ZnFe or ZnNi) and flake coatings.
2.4.1 GEOMET - Flake coating [14]
GEOMET is made with an aqueous base and is composed of zinc and aluminium flakes in an inorganic binder free from chromium. GEOMET has a sacrificial anodic function. Its corrosion resistance depend on the thickness of the coating and happen through a combination of several mechanisms:
Barrier protection – The overlapping zinc and aluminum flakes provide an excellent
barrier between the steel substrate and the corrosive atmosphere.

TECHNICAL REPORT 7007429
Approved by
UTMR, Mats Thörnqvist
Approved Date
2011-05-16 Info class
I Issued by
UTMR, Philip Björlenstam Revision
0
Page
13 (41)
N.B. The copyright and ownership of this document including associated computer data are and will remain ours.
They must not be copied, used or brought to the knowledge of any third party without our prior permission.
© Scania CV AB, Sweden SV 1744 01-06
Galvanic action – Zinc corrodes to protect the steel.
Passivation – Metal oxides slow down the corrosion reaction of zinc and steel to provide
a greater corrosion protection than with pure zinc.
The high concentration of metallic flakes allows for electrical current to be passed to the substrate making the GEOMET electrically conductive. It allows for the use of electrocoated paints. GEOMET can be overcoated by most organic coatings and, because of the electrical conductivity, more particularly by coatings applied by means of electrodeposition. (The usual cross-cut test for adhesion cannot be used because of the flake structure of GEOMET.)
The GEOMET technology also ensures that the coating is applied without any risk of hydrogen embrittlement because the process is nonelectrolytic.
The inorganic nature of GEOMET results in an organic solvent resistance to automotive fluids including motor oils, cooling fluids, hydraulic fluids and brake fluid, the most aggressive solvent.
The coating maintains its corrosion resistance even following an intermittent heat shock. The coating is effective for rotor applications.
If the coating is damaged, zinc oxides and carbonates migrate to the damaged area of the coating to self-repair and restore the barrier protection. When a coated fastener is abraded during installation, barrier protection is restored as the coating self-heals.
The GEOMET process
One process is when small parts are coated using the dip-spin application method. The parts are cleaned and loaded into a perforated metal basket and immersed into the GEOMET coating. The basket lifts and excess coating is thrown off by centrifuging the basket.The wet film is then dried and hardened in a convection oven at a temperature of 300°C. For the non electrolytic processing of small parts, a minimum of two coating operations with GEOMET is necessary in order to obtain an even coverage of the parts and the desired corrosion protection characteristics.
Another technique is by using a rotating cylinder with internal spray guns. The parts to be coated are then conveyed through a horizontal cylinder by means of an Archimedean screw. As the components are transferred along the internal surface several spray guns mounted within the drum coats the GEOMET coating on the parts of interest. The thickness distribution achieved by this technique is particularly useful for thread forms and exceptionally good for internal thread and recess drive features.
Maximum protection by thin coatings: The requirements for corrosion protection in the automotive industry and in many other fields of activity are satisfied with a GEOMET coating thickness between 5 and 10 μm. This low thickness allows the treatment to be applied on most standard threaded fasteners without any difficulty.

TECHNICAL REPORT 7007429
Approved by
UTMR, Mats Thörnqvist
Approved Date
2011-05-16 Info class
I Issued by
UTMR, Philip Björlenstam Revision
0
Page
14 (41)
N.B. The copyright and ownership of this document including associated computer data are and will remain ours.
They must not be copied, used or brought to the knowledge of any third party without our prior permission.
© Scania CV AB, Sweden SV 1744 01-06
Figure 5. Schematic picture of the GEOMET process.
2.4.2 Painting of the frame
On galvanised iron surfaces on automobile bodies, zinc-phosphating is performed to
improve the adhesion of paint or surface coatings. The phosphating-process starts by
treating the surface in a bath containing phosphoric acid, phosphates, zinc ions and other additives such as fluoride, nickel and organic compounds. This treatment induces oxidation of the surface that in turn leads to formation of almost insoluble zinc-iron phosphate and zinc phosphate. The amount of the phosphating species of the surface varies between 0.2 and 30 g/m2 and create a porous surface. The porous surface is the reason for the good adhesion as the paint or surface coating can then leak down the pores and fully integrate with the metal.
Painting of galvanized steel is performed to stop or prolong the time until initiation of corrosion of the metal. There are different methods of applying the paint. Scania uses a method called powder painting. The technique of powder painting applies electrostatic forces to adhere paint to the metal surface. The powder paint is taken out of a barrel through a spray gun where electrostatic forces are created against the walls of the barrel. The area around the automobile part that is to be painted is given a positive charge, thus forcing the powder particles towards the metal. This creates an even layer as the powder particles are repelled by each other. It also increases the possibilities to adhere the paint in and on difficult geometries and decreases the amount of wasted paint. The negative aspect is that a thicker layer is obtained at edges due to the electrostatic forces.
One other technique that is commonly employed is ED-painting. ED-painting is a type of alkaline colour that is applied by dipping the item in a bath of colour while connected to electrical tension, making the paint adhere to the metal surface. Thereafter it is hardened at around 180°C where good mechanical stability is achieved. Through this process the setting of the material gets limited and ED can be accepted in certain screw joints. The procedure gives rise to a well-defined coating. The reason that an even layer is formed is that when a certain thickness (20-30µm) is achieved the current decrease and the charged particles move on. The

TECHNICAL REPORT 7007429
Approved by
UTMR, Mats Thörnqvist
Approved Date
2011-05-16 Info class
I Issued by
UTMR, Philip Björlenstam Revision
0
Page
15 (41)
N.B. The copyright and ownership of this document including associated computer data are and will remain ours.
They must not be copied, used or brought to the knowledge of any third party without our prior permission.
© Scania CV AB, Sweden SV 1744 01-06
advantage of the technique is the coverage of paint in complicated geometries and that and even surface can be obtained.
2.4.3 Settings in the screw joints
When compressing two surfaces they have only a few spots in contact initially, depending on irregularities in the surface. The contact pressure in these spots thereby becomes that large that a plastic deformation will take place locally in which the real contact area will increase until it is high enough to carry the load, meaning the force in the screw. When an external load is applied to the joint the surfaces will be deformed furthermore. Rough surfaces, shape and geometrical errors such as evenness, perpendicularity and such causes larger uncontrolled settings. Softer materials like light-metals give rise to larger settings compared to hard materials such as steel. The total setting in the contact surfaces also depends on the number of contact surfaces and how the forces operate from the external load.
The threads might be considered as a contact surface. The setting therefore depends on unevenness, material and squeeze force. Also small particles in the thread causes setting.
Soft materials such as colour coating often result in large setting losses and causes a risk for creeping.
Figure 6. Diagram of the change of clamping force over time.
Static setting is the first, fast adaptation to the clamping force that is applied to the jammed surfaces. Static setting arise because of the clamping forces from the screw and not from external load.
Dynamic setting on the other hand arises through the impact of external load when the joint is being used. Typical for this kind of setting is that it decreases in time and that the loss in clamping force will be limited.
Creeping starts through inner deformations in the screw with time and might be accelerated by for example increased temperature. Typical for creeping is that it does not decrease and by that, it causes an ongoing reduction of the clamping force.

TECHNICAL REPORT 7007429
Approved by
UTMR, Mats Thörnqvist
Approved Date
2011-05-16 Info class
I Issued by
UTMR, Philip Björlenstam Revision
0
Page
16 (41)
N.B. The copyright and ownership of this document including associated computer data are and will remain ours.
They must not be copied, used or brought to the knowledge of any third party without our prior permission.
© Scania CV AB, Sweden SV 1744 01-06
Figure 7. Picture of the screw attached to the frame.
2.5 Test methods
2.5.1 Accelerated corrosion testing
Accelerated corrosion testing is used with the intention to speed up the corrosion process in order to be able to make conclusions in an early phase of how a metal would behave under normal long term field conditions.
Laboratory testing for corrosion is of vast importance as accurate testing with good correlation to field tests can cut down costs and make testing and research more efficient. Laboratory corrosion testing methods can include dipping in sodium chloride solution, salt spraying or deposition of sodium chloride-solution onto samples. These tests are easy and cheap to implement and can give information of the corrosion resistance of a material, but often provide inadequate correlations to real conditions. Important effects may be overseen since for instance the corrosion products can turn out different in high-chloride environments and under constant immersion. More accurate and effective testing can be achieved by imitating the conditions of surrounding environments more closely, however still at an accelerated rate.
Accelerated corrosion testing should be performed by moderately changing the time of wetness (TOW), temperature and content of corroding agents. The atmospheric conditions, as humidity and rain/wetness, during this form of corrosion testing are cycled. There can also be an increased concentration of sulphur containing salts, sodium chloride, carbon dioxide, iron chloride, simple road dirt or altered acidity, all depending on the field of usage and its local corrosive environment [15]. This type of accelerated corrosion testing can be performed on different geometries but is easiest conducted on open surfaces.

TECHNICAL REPORT 7007429
Approved by
UTMR, Mats Thörnqvist
Approved Date
2011-05-16 Info class
I Issued by
UTMR, Philip Björlenstam Revision
0
Page
17 (41)
N.B. The copyright and ownership of this document including associated computer data are and will remain ours.
They must not be copied, used or brought to the knowledge of any third party without our prior permission.
© Scania CV AB, Sweden SV 1744 01-06
3 Experimental
3.1 Test materials
The test matrix consisted of 2 types of screws (galvanized steel), flange and hexagonal, and 3 types of surface coatings, zinc iron (ZnFe), DACROMET and GEOMET. The screws were fastened on frames with 2 different torque ratings, 123 Nm and 149 Nm for the flange screws and 112 Nm and 135 Nm for the hexagonal screws. 3 screws of each combination were fastened on a frame. The used combinations are shown in figure 8. The screw nut was covered with a DACROMET coating. The frame had a layer of first phosphate, then a powder painting.
5 batches with triplicate tests of each combination were put in the ACT chamber. The samples were exposed to the corrosive environment for 1, 2, 4, 8 and 16 weeks. This report will only evaluate the first 8 weeks due to lack of time within the framework of this master thesis.
Each batch was photographed and the screws were unfastened to investigate corrosion on the contact surface.
One batch was continuously photographed without removing the screws in order to follow the corrosion development on the surface facing the atmosphere.
When the screws were attached, the tightening was applied on the screw nut causing as little deformation of the screw scull as possible.
Coating\Screw type Flange (149 Nm) Hexagonal (135 Nm) Flange (123 Nm) Hexagonal (112 Nm)
FeZn X X X X
DACROMET X X
GEOMET X X
GEOBLACK 500 X X
GEOBLACK 321 X X
Figure 8. A table over screws and applied coatings.
One of each screw were crosscut and analyzed by means of SEM/EDS at Swerea KIMAB to determine the thickness and the elemental content of the surface coating. An unexposed screw was investigated as a reference and compared with screws exposed for 2 and 4 weeks in the corrosion chamber for the ZnFe screws and for 6 weeks for the GEOMET screws.
To investigate the formation of crystalline corrosion products, the screws were analyzed by means of XRD (X-ray diffraction). An unexposed screw was investigated as a reference and compared with ZnFe screws exposed for 2 and 4 weeks and for GEOMET after 6 weeks of exposure.
3.2 Instrumentation and methods used
3.2.1 Scanning electron microscope
A scanning electron microscope equipped with energy-dispersive X-ray spectroscopy (SEM-EDS) was used to investigate the surface coating of the screws. The screws were cross-cut before analyzed. The thickness and the placement of elements in the coating were determined.

TECHNICAL REPORT 7007429
Approved by
UTMR, Mats Thörnqvist
Approved Date
2011-05-16 Info class
I Issued by
UTMR, Philip Björlenstam Revision
0
Page
18 (41)
N.B. The copyright and ownership of this document including associated computer data are and will remain ours.
They must not be copied, used or brought to the knowledge of any third party without our prior permission.
© Scania CV AB, Sweden SV 1744 01-06
With scanning electron microscopy (SEM), the sample is scanned with a high-energy beam of electrons which are produced from heating a tungsten filament. Primary (backscattered) and secondary electrons are used to create a high resolution image. These electrons are ejected from the sample that has been exposed to the electron beam. The numbers of electrons that are scattered from the sample surface are later measured by an electron detector. The detector then converts the number of detected electrons into a digital signal to a computer which creates a high resolution image by using the different intensities from the electrons.
By combining SEM and EDS (Energy Dispersive x-ray Spectroscopy) the elements in the sample can be characterized. The EDS works by exposing the sample to electrons that generate the emission of x-ray radiation. This excites the electrons from the inner shells of the atoms to a higher energy level. X-ray photons are then formed due to the release of energy when the electrons fall back to their original position. Elemental identification is possible by measuring the energy of these photons with a detector since each element has unique photon energy. When a photon hits the detector crystal a current pulse is formed whose value is determined by the photon energy creating a spectrum of elements.
3.2.2 X-ray diffraction
X-ray diffraction (XRD) was performed to identify crystalline corrosion products. It is a non-destructive analytical technique. The instrument used was a Bruker D8 advanced with parallel beam through a Göbbel mirror, 1.2 mm divergence slit, and long Soller slit on the detector.
There was also radiation with Cu K with energy dispersive detector, Sol X (Bruker). The sample was fixed horizontally. The diffraction patterns were matched against the ICCD 'PDF 4+" (version 2008) data base using filter elements allowing Fe, Zn, O, H, C, Cl, Ti, Cu, Al, Br, Na, Si, N, F, Mo and S. The matching was performed with the EVA software (Bruker).
The XRD gives a diffraction pattern which contains information about the internal lattice of crystalline substances. It is possible to characterize nearly all compounds of the sample since almost all crystalline solids have a specific X-ray diffraction pattern.
The most commonly used radiation in XRD is that emitted of copper. In order to produce monochromatic radiation and make the beam aligned and directed towards the sample the X-ray beam aligned is filtered and collimated. The X-rays will scatter by the electrons in the atom and the intensity of the scattering is measured. The intensity is a function of the scattering angle and the wavelength of the X-ray beam. With the Bragg equation: 2dsinθ = nλ it is possible to calculate the angle of diffraction.

TECHNICAL REPORT 7007429
Approved by
UTMR, Mats Thörnqvist
Approved Date
2011-05-16 Info class
I Issued by
UTMR, Philip Björlenstam Revision
0
Page
19 (41)
N.B. The copyright and ownership of this document including associated computer data are and will remain ours.
They must not be copied, used or brought to the knowledge of any third party without our prior permission.
© Scania CV AB, Sweden SV 1744 01-06
Figure 9. A sketch of Bragg's law of reflection [19].
In Bragg’s law the diffraction angle and the lattice spacing in a crystalline sample is related to the wavelength of the electromagnetic radiation. When the diffracted X-rays are has been detected, processed and counted a unique diffraction pattern is created [17].
3.2.3 Accelerated corrosion testing chamber
The corrosion testing was performed with Accelerated Corrosion Testing (ACT) following the Scania standard STD4319. The standard specifies the test procedure to, in a controlled way, simulate atmospheric corrosion conditions. It is also set to determine the corrosion resistance of metals in marine and winter road (from de-icing salts) environments where there is a significant concentration of chloride ions. In the ACT the humidity (%RH) and temperature are cycled as shown in figure 10. The major cycle, which is run most part of the week, is called sub-cycle 1 and the rain cycle, which is run twice a week, is called sub-cycle 2.
Figure 10. Cycles of the ACT [16].
Sub-cycle 1 can be divided into four different steps, 1:1-1:4. The temperature and the humidity are kept at constant values at 35°C and 95 %RH for four hours during the first step (1:1). Under the next step (1:2), there is an increase of temperature to 45°C whilst the relative humidity is decreased linearly to 50 % for a period of two hours. During the third step (1:3) the values are kept at constant level again, the temperature at 45°C and the relative humidity at 50 % for four hours. In the last step (1:4) there is a decrease in temperature from 45 to 35°C simultaneously with an increase of relative humidity from 50 % to 95 %, for a two hour period. The cycle is then repeated again. The second sub-cycle contains five steps (2:1-2:5) with the first consisting of a 15 minute spray with a 1.0 %-salt-solution. In the second step (2:2) the conditions are kept

TECHNICAL REPORT 7007429
Approved by
UTMR, Mats Thörnqvist
Approved Date
2011-05-16 Info class
I Issued by
UTMR, Philip Björlenstam Revision
0
Page
20 (41)
N.B. The copyright and ownership of this document including associated computer data are and will remain ours.
They must not be copied, used or brought to the knowledge of any third party without our prior permission.
© Scania CV AB, Sweden SV 1744 01-06
constant at 35°C with a relative humidity of 95-99 % for one hour and 45 minutes. The first two steps are then repeated twice resulting in a total run time of six hours. Step (2:3) is a drying period with a relative humidity of 50 % and the temperature increasing from 35 to 45°C over a two hour time period. In step four (2:4) the constant conditions are kept at 45°C and 50 % RH for two hours. The last step (2:5) consists of a decrease in temperature from 45°C to 35°C with the relative humidity simultaneously increasing from 50 % to 95 %, once again over a two-hour period. Sub-cycles 1 and 2 are visually described in figure 11.
Figure 11. Sub-cycles 1 and 2 of the ACT test [16].
The rain in the chamber is a 1 wt% ± 0.1 wt % sodium chloride-solution with an acidification achieved by adding 1 ml of 0.5 M sulphuric acid to every 10 liters of sodium chloride-solution resulting in a pH of 4.2 ± 0.1.
Inside the chamber, the screw joints were set in plastic holders at a 20° vertical angle with a mutual distance of approximately 30 mm. Figure 12 shows the placement of the samples in the test chamber and the spreading of the rain from the nozzles.

TECHNICAL REPORT 7007429
Approved by
UTMR, Mats Thörnqvist
Approved Date
2011-05-16 Info class
I Issued by
UTMR, Philip Björlenstam Revision
0
Page
21 (41)
N.B. The copyright and ownership of this document including associated computer data are and will remain ours.
They must not be copied, used or brought to the knowledge of any third party without our prior permission.
© Scania CV AB, Sweden SV 1744 01-06
Figure 12. Example of climate chamber (ACT) [16].
1. Test chamber
2. Machinery unit
3. Test object area
4. Well insulated walls/lids
5. Air distribution plate
6. Swaying tube/member with spraying nozzles
7. Air purge outlet
8. Outlet
9. Climatization unit
(cooling/heating/humidification)
10. Wet and dry Pt100 sensors
(psychrometric sensor)
11. Cooling machine
12. Vessel with salt solution +
pressurizing pump
13. Motor and link arms for swaying
motion of precipitation
tube/member
14. Control unit
15. Electronics and regulatory devices

TECHNICAL REPORT 7007429
Approved by
UTMR, Mats Thörnqvist
Approved Date
2011-05-16 Info class
I Issued by
UTMR, Philip Björlenstam Revision
0
Page
22 (41)
N.B. The copyright and ownership of this document including associated computer data are and will remain ours.
They must not be copied, used or brought to the knowledge of any third party without our prior permission.
© Scania CV AB, Sweden SV 1744 01-06
4 Results
4.1 Crevice simulation
The crevices in the flange and hexagonal screws were simulated with a FEM program performed by Niclas Stenberg at Swerea KIMAB.
Figure 13. The crevice simulation on the flange screw with two different contact pressures.
The results for the flange screw show that it could possibly be a crevice (yet small, approximately < 5 µm) closest to the threads and that it was, obviously, larger for the flange with the lower contact pressure. The possibility of crevice corrosion in this crevice was minor. However, there was a crevice facing the atmosphere where corrosion might occur. This crevice was relatively short but significantly thicker than the crevice closer to the threads.
Figure 14. The crevice simulation on the hexagonal screw with two different contact pressures.
The result for the hexagonal screwed show that there was a quite large crevice (approximately 120 µm) which was exposed out to the atmosphere. There is a possibility that crevice corrosion or waterline corrosion will occur in such crevices.

TECHNICAL REPORT 7007429
Approved by
UTMR, Mats Thörnqvist
Approved Date
2011-05-16 Info class
I Issued by
UTMR, Philip Björlenstam Revision
0
Page
23 (41)
N.B. The copyright and ownership of this document including associated computer data are and will remain ours.
They must not be copied, used or brought to the knowledge of any third party without our prior permission.
© Scania CV AB, Sweden SV 1744 01-06
4.2 SEM/EDS analysis of the surface coating
4.2.1 SEM pictures for verifying the thickness of the surface coating
Figure 15. SEM pictures of the surface coating on the GEOMET (flange) screw.
The result from the SEM pictures of the GEOMET (flange) coating showed that the edges had a thinner coating (0-3 µm) than the plane surfaces (between 7-10 µm).

TECHNICAL REPORT 7007429
Approved by
UTMR, Mats Thörnqvist
Approved Date
2011-05-16 Info class
I Issued by
UTMR, Philip Björlenstam Revision
0
Page
24 (41)
N.B. The copyright and ownership of this document including associated computer data are and will remain ours.
They must not be copied, used or brought to the knowledge of any third party without our prior permission.
© Scania CV AB, Sweden SV 1744 01-06
Figure 16. SEM pictures of the surface coating on the ZnFe (flange) screw.
The results from the SEM investigation of the ZnFe flange screw showed that the edges had a thinner coating (< 3µm) and in some cases no coating at all. The coating on the plane surfaces were between 10-15 µm.

TECHNICAL REPORT 7007429
Approved by
UTMR, Mats Thörnqvist
Approved Date
2011-05-16 Info class
I Issued by
UTMR, Philip Björlenstam Revision
0
Page
25 (41)
N.B. The copyright and ownership of this document including associated computer data are and will remain ours.
They must not be copied, used or brought to the knowledge of any third party without our prior permission.
© Scania CV AB, Sweden SV 1744 01-06
4.2.2 EDS analysis of the coating in GEOBLACK 500
Figure 17. The SEM-pictures of the flake system in GEOBLACK 500 before exposure (left picture) and after 6 weeks in ACT chamber (right picture).
Figure 18. The results of the EDS analysis on the GEOBLACK 500 before exposure and after 6 weeks in ACT
chamber.
The EDS analysis of the flake system in GEOBLACK 500 before and after exposure (6 weeks in ACT chamber) showed that the composition of elements was more or less unchanged.

TECHNICAL REPORT 7007429
Approved by
UTMR, Mats Thörnqvist
Approved Date
2011-05-16 Info class
I Issued by
UTMR, Philip Björlenstam Revision
0
Page
26 (41)
N.B. The copyright and ownership of this document including associated computer data are and will remain ours.
They must not be copied, used or brought to the knowledge of any third party without our prior permission.
© Scania CV AB, Sweden SV 1744 01-06
4.2.3 EDS analysis of the coating in GEOBLACK 321
Figure 19. The SEM-pictures of the flake system in GEOBLACK 321 before exposure (left picture) and after 6
weeks in ACT chamber (right picture).
Figure 20. The results of the EDS analysis on the GEOBLACK 321 before exposure and after 6 weeks in ACT chamber.
The EDS analysis of the flake system in GEOBLACK 321 before and after exposure (6 weeks in ACT chamber) showed that the composition of elements was more or less unchanged.

TECHNICAL REPORT 7007429
Approved by
UTMR, Mats Thörnqvist
Approved Date
2011-05-16 Info class
I Issued by
UTMR, Philip Björlenstam Revision
0
Page
27 (41)
N.B. The copyright and ownership of this document including associated computer data are and will remain ours.
They must not be copied, used or brought to the knowledge of any third party without our prior permission.
© Scania CV AB, Sweden SV 1744 01-06
4.2.4 EDS analysis of the coating in GEOMET, unexposed
Figure 21. EDS elemental mapping of the GEOMET coating.
Figure 22. EDS elemental mapping of the GEOMET coating.

TECHNICAL REPORT 7007429
Approved by
UTMR, Mats Thörnqvist
Approved Date
2011-05-16 Info class
I Issued by
UTMR, Philip Björlenstam Revision
0
Page
28 (41)
N.B. The copyright and ownership of this document including associated computer data are and will remain ours.
They must not be copied, used or brought to the knowledge of any third party without our prior permission.
© Scania CV AB, Sweden SV 1744 01-06
The EDS analysis of the flake system in the GEOMET (flange) before exposure showed that the placement of the aluminum and zinc flakes in the inorganic matrix consisted of titanates and silicates. The aluminum flakes were more concentrated into flakes whereas the zinc was located throughout the matrix but with some spots with a higher concentration of zinc.
4.2.5 EDS analysis of the coating in GEOMET, exposed 6 weeks
Figure 23. EDS elemental mapping on the GEOMET coating after 6 weeks in the ACT chamber.
The EDS analysis of the flake system in the GEOMET (flange) after exposure (4 weeks in ACT chamber) showed that there was a higher amount of oxygen on the side facing the atmosphere and that zinc, and in some extent aluminum, were compressed within the matrix. These results are however uncertain since the measurements were made on two different screws.

TECHNICAL REPORT 7007429
Approved by
UTMR, Mats Thörnqvist
Approved Date
2011-05-16 Info class
I Issued by
UTMR, Philip Björlenstam Revision
0
Page
29 (41)
N.B. The copyright and ownership of this document including associated computer data are and will remain ours.
They must not be copied, used or brought to the knowledge of any third party without our prior permission.
© Scania CV AB, Sweden SV 1744 01-06
4.2.6 EDS analysis of the coating in ZnFe, unexposed
Figure 24. EDS elemental mapping of the ZnFe coating.
The EDS analysis of the unexposed ZnFe coating showed the placement of the zinc, oxygen, chromium and silicon molecules in the coating. Zinc was spread throughout the matrix together with some oxygen. Oxygen, silicon and chromium dominated on the surface.

TECHNICAL REPORT 7007429
Approved by
UTMR, Mats Thörnqvist
Approved Date
2011-05-16 Info class
I Issued by
UTMR, Philip Björlenstam Revision
0
Page
30 (41)
N.B. The copyright and ownership of this document including associated computer data are and will remain ours.
They must not be copied, used or brought to the knowledge of any third party without our prior permission.
© Scania CV AB, Sweden SV 1744 01-06
4.3 Visual evaluation of corrosion
4.3.1 Visual evaluation
The original images from which the visual evaluation is based on are provided in appendix 10.2. The images show that the ZnFe coated screws developed white rust within a week and a significant amount of red rust after only 4 weeks. The GEOMET coated screws however showed a good resistance to corrosion and not even after 8 weeks of exposure in the ACT was white rust visible for the naked eye. No significant difference in how the corrosion proceeded was observed between the two different moments.
Figure 25. Corrosion development on ZnFe (200-201), DACROMET (202-203) and ZnFe (204-205) after 1, 2, 4
and 8 weeks in ACT chamber.
ZnFe (hexagonal, 200-201)
The hexagonal screws coated with ZnFe tended to start to corrode on the edges and on the contact edge to the frame. Over the surface facing the atmosphere there seemed to be general corrosion processes taking place but on the contact edge there was evidence for a crevice where it possibly had occurred crevice corrosion or waterline corrosion. There was no significant difference in corrosion between the two different moments. White rust could clearly be seen after one week and red rust was visible within two weeks.

TECHNICAL REPORT 7007429
Approved by
UTMR, Mats Thörnqvist
Approved Date
2011-05-16 Info class
I Issued by
UTMR, Philip Björlenstam Revision
0
Page
31 (41)
N.B. The copyright and ownership of this document including associated computer data are and will remain ours.
They must not be copied, used or brought to the knowledge of any third party without our prior permission.
© Scania CV AB, Sweden SV 1744 01-06
DACROMET (hexagonal, 202-203)
This coating showed a good resistance to corrosion. After 8 weeks it was, on some of the screws, possible to find a very small amount of red rust in the crevice between the screw and the frame and on the top edge of the screw.
ZnFe (flange, 204-205)
The flange screws also started to corrode on the edges and they showed slightly more corrosion products than the hexagonal screws. The fact that the flange screw has more edges than the hexagonal screw could be an explanation why it presented more corrosion products. On the edge facing the frame there was a small crevice where water may have accumulated. It seemed that corrosion was slightly more aggressive in this area.
Figure 26. The corrosion development on the GEOMET (206-207), GEOBLACK 321 (208-209) and GEOBLACK 500 (210-211) after 1, 2, 4 and 8 weeks in ACT chamber.

TECHNICAL REPORT 7007429
Approved by
UTMR, Mats Thörnqvist
Approved Date
2011-05-16 Info class
I Issued by
UTMR, Philip Björlenstam Revision
0
Page
32 (41)
N.B. The copyright and ownership of this document including associated computer data are and will remain ours.
They must not be copied, used or brought to the knowledge of any third party without our prior permission.
© Scania CV AB, Sweden SV 1744 01-06
GEOMET (flange, 206-207)
Showed a good corrosion resistance similar to findings for the DACROMET coating. For GEOMET it was not possible to distinguish any rust after 8 weeks of corrosion testing.
GEOBLACK 321 (hexagonal, 208-209)
Showed a very good corrosion resistance. No corrosion products were possible to be observed by the naked eye.
GEOBLACK 500 (hexagonal, 210-211)
Similar results as obtained for the GEOBLACK 321, i.e. no corrosion products visible.
4.3.2 Corrosion results from the visual evaluation
Figure 27. Graphs of the corrosion development on the ZnFe-coated flange (left) and hexagonal (right) screw.
As illustrated in figure 27 and from the images in appendix 10.2 white rust was observed within a week and was steadily increasing in extent week by week until red rust started to evolve. After 8 weeks the red rust covered a larger surface area than the white rust. The flange screw corroded more than the hexagonal screw.

TECHNICAL REPORT 7007429
Approved by
UTMR, Mats Thörnqvist
Approved Date
2011-05-16 Info class
I Issued by
UTMR, Philip Björlenstam Revision
0
Page
33 (41)
N.B. The copyright and ownership of this document including associated computer data are and will remain ours.
They must not be copied, used or brought to the knowledge of any third party without our prior permission.
© Scania CV AB, Sweden SV 1744 01-06
4.4 Results of the X-ray diffraction
In the following figures (28-31), the relative percentage of the corrosion products is plotted. The diffraction patterns from which the diagrams have been plotted are included in appendix 10.1.
ZnFe (hexagonal)
Figure 28. Relative presence of crystalline corrosion products of the ZnFe coated hexagonal screw from the
contact edge (left) and the hexagonal edge (right)
As the results from the XRD shows, zinc reacted and formed a relatively large amount of Simonkolleite and also some Zincite in the two locations of the screws examined. The contact edge was the location where most of the zinc had reacted.

TECHNICAL REPORT 7007429
Approved by
UTMR, Mats Thörnqvist
Approved Date
2011-05-16 Info class
I Issued by
UTMR, Philip Björlenstam Revision
0
Page
34 (41)
N.B. The copyright and ownership of this document including associated computer data are and will remain ours.
They must not be copied, used or brought to the knowledge of any third party without our prior permission.
© Scania CV AB, Sweden SV 1744 01-06
ZnFe (flange)
Figure 29. Relative presence of crystalline corrosion products of the ZnFe coated flange screw from the hexagonal edge (top left), the flange edge (top right) and the contact edge (bottom centre).
The results of the relative presence of corrosion products on the flange screw showed that the contact edge had almost no corrosion products. On the flange edge on the other hand all of the zinc had reformed into the corrosion products Simonkolleite and Zincite and also some iron zincoxide. The hexagonal edge revealed somewhat similar corrosion as the hexagonal screw with some Simonkolleite and a fraction of Zincite formed.

TECHNICAL REPORT 7007429
Approved by
UTMR, Mats Thörnqvist
Approved Date
2011-05-16 Info class
I Issued by
UTMR, Philip Björlenstam Revision
0
Page
35 (41)
N.B. The copyright and ownership of this document including associated computer data are and will remain ours.
They must not be copied, used or brought to the knowledge of any third party without our prior permission.
© Scania CV AB, Sweden SV 1744 01-06
GEOMET (flange)
Figure 30. Relative presence of crystalline corrosion products of the GEOMET coated flange screw.
The diagram shows that the contact edge only had displayed some Zincite in the corrosion products. The hexagonal edge revealed the presence of some Simonkolleite. Overall, the GEOMET presented a very low extent of corrosion.
GEOBLACK 321 and GEOBLACK 500
Figure 31. Relative presence of crystalline corrosion products on the GEOBLACK 321 (left) and 500 (right) coated
hexagonal screws.
The diagram of GEOBLACK 321 shows the formation of some Simonkolleite and Zincite.
The diagram of GEOBLACK 500 shows that some Simonkolleite formed on the hexagonal edge, however XRD also detected sodium chloride and citric acid.

TECHNICAL REPORT 7007429
Approved by
UTMR, Mats Thörnqvist
Approved Date
2011-05-16 Info class
I Issued by
UTMR, Philip Björlenstam Revision
0
Page
36 (41)
N.B. The copyright and ownership of this document including associated computer data are and will remain ours.
They must not be copied, used or brought to the knowledge of any third party without our prior permission.
© Scania CV AB, Sweden SV 1744 01-06
5 Discussion
5.1 Crevice simulation
The reason why a crevice closest to the threads on the flange screw was expected was because the flange screw has a slight angle which could create a crevice. The result from the FEM-simulation showed that there was a crevice but probably not large enough for corrosion to take place.
The crevice on the hexagonal screw was larger and more expected and the possibility of crevice corrosion or waterline corrosion to occur was therefore more likely.
5.2 SEM/EDS analysis of the surface coating
The SEM images showed that the surface coating differed in thickness over the screw for both the ZnFe and the GEOMET coating. As expected, the edges were the places with a thin coating and plane surfaces significant covered. However, it was surprisingly thin on the edges with less than 3 µm, and sometimes with no covering visible at all. This, of course, would be good places for the corrosion to initiate which later was proven from the corrosion testing.
5.3 Visual evaluation of the corrosion
From the corrosion testing it was easy to see that the ZnFe coating had a very poor corrosion resistance in comparison to the GEOMET coated screws.
Corrosion started on the edges were the coating was very thin. The coating however was thin on the edges of both ZnFe and GEOMET but it was only the ZnFe covered screws that actually started to corrode within the 8 weeks of exposure. By then, almost half of the screw was covered with red rust. This does not fulfill the demands of Scania which state that no white rust should be observed within 4 weeks of ACT testing. The ZnFe coating in this corrosion test developed white rust already after a couple of days of exposure and some red rust within a week. The GEOMET coating is believed to have self-repairing properties and that the flakes of zinc and aluminum can migrate to the damaged part. This in combination with the inorganic matrix (consisting of titanium and silicon oxides) could provide an extra help against corrosion on the edges where the coating was very thin.
On the hexagonal screw with ZnFe coating it was also possible to detect corrosion in the crevice between the screw and the frame. Whether it was crevice corrosion or waterline corrosion that took place is difficult to say since the mechanisms are very similar. The crevice however, was large enough to trap water and small enough to keep the water for a longer period causing corrosion to develop.
The reason why the corrosion on the flange screws was worse than what was observed on the hexagonal screws could be that the flange has more edges. Since the coating of the edges is thinner the corrosion then has more initiation points on the flange screw and the corrosion spreads faster over the screw. The thickness of the ZnFe coating was investigated on both the flange and the hexagonal screw without any observed differences in thickness. The difference in corrosion between the two screws is therefore not believed to depend on coating thickness.

TECHNICAL REPORT 7007429
Approved by
UTMR, Mats Thörnqvist
Approved Date
2011-05-16 Info class
I Issued by
UTMR, Philip Björlenstam Revision
0
Page
37 (41)
N.B. The copyright and ownership of this document including associated computer data are and will remain ours.
They must not be copied, used or brought to the knowledge of any third party without our prior permission.
© Scania CV AB, Sweden SV 1744 01-06
The different torque ratings did not have a clear influence on the corrosion process.
5.4 Results of the X-ray diffraction
ZnFe
It might seem strange that there is significantly more Simonkolleite formed compared with Zincite on the ZnFe coated screws already after 2 weeks since the latter is mechanistically formed first. However, white rust was observed already within some days why the peak of Zincite may have occurred before 2 weeks. Thereafter the Zincite have most likely reacted with chlorides and water forming Simonkolleite. It is also very possible that amorphous zinc oxides were present at early stages, phases not possible to identify by means of XRD.
The contact edge on the flange screw showed a very low amount of corrosion products. This was quite expected after the FEM simulation which showed that the crevice was very small.
GEOMET
The results showed the coating to have a very good resistance to corrosion with some Simonkolleite and Zincite present after 6 weeks of exposure.
The XRD on the GEOBLACK 500 showed the presence of citric acid and halite (NaCl). The latter comes from the salty rains within the ACT chamber and has probably migrated into the surface of the coating. The presence of citric acid is however a little strange, but it is possible that it was used for cleaning the surface of the screw before applying the GEOMET coating. This component should also be seen on the non-exposed reference screw. However, it may be the case that after being exposed to high temperatures and extreme environment citric acid may diffuse through the coating towards the surface on some screws.

TECHNICAL REPORT 7007429
Approved by
UTMR, Mats Thörnqvist
Approved Date
2011-05-16 Info class
I Issued by
UTMR, Philip Björlenstam Revision
0
Page
38 (41)
N.B. The copyright and ownership of this document including associated computer data are and will remain ours.
They must not be copied, used or brought to the knowledge of any third party without our prior permission.
© Scania CV AB, Sweden SV 1744 01-06
6 Conclusions
The surface coating on the edges of both the GEOMET and the ZnFe coated screws was
very thin. The plane surfaces on the other hand had coatings of sufficient thickness.
The GEOMET coated screws showed a very good corrosion protection with no visible
corrosion products formed after 8 weeks of ACT-testing.
ZnFe coated screws showed white rust already within a few days of ACT-testing and
started to develop red rust after only one week. This does not fulfill the demands on
corrosion resistance set by Scania.
The flange screw was more corroded compared with the hexagonal screw.
The crevice on the flange screw did not affect the corrosion development.
The crevice on the hexagonal screw influenced the corrosion development only to some
extent, but was not the main reason for the screw to corrode.
Different torque ratings did not have a clear effect on the corrosion.
The screw nuts on the ZnFe coated screws were difficult to remove after 8 weeks inside
the ACT chamber due the severe corrosion on the threads. This problem did not occur on
the GEOMET coated screws. Even though the screw nuts sometimes were significantly
corroded, it was still possible to remove them from the screw without any problem.
7 Further work
Make a similar study with ZnNi (instead of ZnFe) to investigate if this coating is more
corrosion resistant at similar conditions.
Conduct additional field studies to enable a more complete understanding on where and
how corrosion is initiated and develops to enable comparison with accelerated corrosion
test results.
The GEOMET covered screws showed a very good corrosion resistance but more trials
should be made to ensure that the high standard they seem to have is maintained.

TECHNICAL REPORT 7007429
Approved by
UTMR, Mats Thörnqvist
Approved Date
2011-05-16 Info class
I Issued by
UTMR, Philip Björlenstam Revision
0
Page
39 (41)
N.B. The copyright and ownership of this document including associated computer data are and will remain ours.
They must not be copied, used or brought to the knowledge of any third party without our prior permission.
© Scania CV AB, Sweden SV 1744 01-06
8 Acknowledgments
Many thanks to Bengt Johansson and Tina Holmgren, my supervisors at Scania, for the help and feedback they have given me during this master thesis.
I would also like to thank Karolina Stoltz Länta and Hannu Rantala for participating in meetings and contributing with ideas and thoughts.
Thanks to Dan Jacobsson and Oskar Karlsson at Swerea KIMAB for helping me with analysis with the XRD and SEM/EDS respectively.
Thanks also to my supervisor at KTH, Inger Odnevall Wallinder, for support and feedback.
Last but not least I would like to thank the department of UTM, especially UTMR, for making me feel welcome at Scania from the first day.

TECHNICAL REPORT 7007429
Approved by
UTMR, Mats Thörnqvist
Approved Date
2011-05-16 Info class
I Issued by
UTMR, Philip Björlenstam Revision
0
Page
40 (41)
N.B. The copyright and ownership of this document including associated computer data are and will remain ours.
They must not be copied, used or brought to the knowledge of any third party without our prior permission.
© Scania CV AB, Sweden SV 1744 01-06
9 References
1. D. Persson, A. Mikhailov, D. Thierry, Proc, Initial atmospheric corrosion of confined surfaces of zinc during wet-dry exposures, Eurocorr 2004, Nice, France, paper no. 50 (2004)
2. D. Persson, A. Mikhailov, D. Thierry, In situ studies of the corrosion during drying of confined surfaces, Materials and Corrosion 58 (2007), p.452-462
3. K. L. Heppner, R. W. Evitts, J. Postlethwaite, Effect of ionic interactions on the initiation of crevice corrosion in passive metals, Journal of The Electrochemical Society 152 (2005), p. B89-B98
4. F. Zhu, Atmopheric corrosion of precoated steel in a confined environment (Doctoral Thesis), Royal Institute of Technology, Stockholm (2000)
5. R. Lindström, J-E Svensson, L-G Johansson, The influence of zinc in the presence of NaCl – the influence of carbon dioxide and temperature, Journal of Electrochemical Society 147 (2000) p.1751-1757
6. R. Lindström, J-E. Svensson, L-G. Johanson, The atmospheric corrosion of zinc in the presence of NaCl, Journal of Electrochemical Society, 147 (2000) p.1751-1757
7. F. Zhu, D. Persson, C. Taxen, Formation of corrosion products on open and confined metal surfaces exposed to periodic wet/dry conditions – A comparison between zinc and electrogalvanized steel, Corrosion science section 54 (2000) p.1256-1265
8. Christofer Leygraf, Thomas E. Graedel, Atmospheric Corrosion, 1st edition, New York (2000)
9. R. Lindström, J-E Svensson, L-G Johansson, The influence of zinc in the presence of NaCl – the influence of carbon dioxide and temperature, Journal of Electrochemical Society 147 (2000) p.1751-1757
11. S. Fujita, H. Kajiyama, C. Kato, Assessment and application technologies for automobile materials (perforation) – Technologies for corrosion resistance and perforation feedback for automobile steel materials –, JFE GIHO 4 (2004), p. 8-14
12. J.E. Svensson and L.G. Johansson, The temperature-dependence of the SO2-induced atmospheric corrosion of zinc; a laboratory study, Corrosion Science, 38 (1996) p.2225-2233

TECHNICAL REPORT 7007429
Approved by
UTMR, Mats Thörnqvist
Approved Date
2011-05-16 Info class
I Issued by
UTMR, Philip Björlenstam Revision
0
Page
41 (41)
N.B. The copyright and ownership of this document including associated computer data are and will remain ours.
They must not be copied, used or brought to the knowledge of any third party without our prior permission.
© Scania CV AB, Sweden SV 1744 01-06
13. Mårten Behm, Carina Lagergren and Göran Lindbergh, Elektrokemi för bränsleceller och batterier, Inst. f. kemiteknik, Tillämpad elektrokemi (2001) p.62-69.
14. GEOMET – Low thickness corrosion protection (brochure), http://www.dacral.com/upload/FICHIER_TYPEARTICLE/geomet%20brochure%20GB.pdf, 2010-12-06.
15. Einar Mattsson, Elektrokemi och korrosionslara, Korrosioninstitutet, Stockholm, 1992 (reprint).
16. Scania standard STD4319, Accelerated corrosion test - atmospheric corrosion (2008), Södertälje.
17. P. Atkins, T. Overton, J. Rourke, M. Weller, F. Armstrong, Inorganic Chemistry, (4th ed.). (2006) Oxford: Shriver & Atkins.
18. T. Prosek, A. Nazarov, U. Bexell, D. Thierry and J. Serak, Corrosion mechanism of model zinc-magnesium alloys in atmospheric conditions, Corrosion Science 50 (2008), p 2216-2231
19. Bragg’s law, http://en.wikipedia.org/wiki/Bragg%27s_law, 2010-12-06

10 Appendix
10.1 Appendix 1: Diffraction patterns
ZnFe reference
Iron, syn - Fe - Cubic - Body-centered - I/Ic PDF 11.6 - S-Q 15.4 %
Zinc, syn - Zn - Hexagonal - Primitive - I/Ic PDF 9. - S-Q 84.6 %
ZnFe hexagonal reference
Lin
(C
ps)
0
1000
2000
3000
4000
5000
6000
7000
8000
9000
10000
11000
12000
13000
14000
2-Theta - Scale
5 10 20 30 40 50 60 70 80 90

ZnFe (hexagonal) hex. edge, 2 weeks
Zinc, syn - Zn - Hexagonal - Primitive - I/Ic PDF 8.5 - S-Q 38.6 %
Zincite, syn - ZnO - Hexagonal - Primitive - I/Ic PDF 5.4 - S-Q 10.2 %
Simonkolleite, syn - Zn5(OH)8Cl2·H2O - Rhombo.H.axes - Primitive - S-Q 51.3 %
ZnFe hexagonal hex surface 2 weeks
Lin
(C
ps)
0
1000
2000
3000
2-Theta - Scale
5 10 20 30 40 50 60 70 80 90
ZnFe (hexagonal) hex. edge, 4 weeks
Zinc, syn - Zn - Hexagonal - Primitive - I/Ic PDF 8.5 - S-Q 46.0 %
Zincite, syn - ZnO - Hexagonal - Primitive - I/Ic PDF 5.4 - S-Q 7.0 %
Simonkolleite, syn - Zn5(OH)8Cl2·H2O - Rhombo.H.axes - Primitive - S-Q 47.0 %
ZnFe hexagonal hex surface 4 weeks
Lin
(C
ps)
0
1000
2000
3000
4000
2-Theta - Scale
5 10 20 30 40 50 60 70 80 90

ZnFe (hexagonal) contact edge, 2 weeks
Zinc, syn - Zn - Hexagonal - Primitive - I/Ic PDF 9. - S-Q 29.0 %
Zincite, syn - ZnO - Hexagonal - Primitive - I/Ic PDF 5.4 - S-Q 14.8 %
Simonkolleite, syn - Zn5(OH)8Cl2·H2O - Rhombo.H.axes - Primitive - S-Q 56.2 %
ZnFe hexagonal contact edge 2 weeks
Lin
(C
ps)
0
1000
2000
3000
2-Theta - Scale
5 10 20 30 40 50 60 70 80
ZnFe (hexagonal) contact edge, 4 weeks
Zinc, syn - Zn - Hexagonal - Primitive - I/Ic PDF 9. - S-Q 33.7 %
Zincite, syn - ZnO - Hexagonal - Primitive - I/Ic PDF 5.4 - S-Q 16.0 %
Simonkolleite, syn - Zn5(OH)8Cl2·H2O - Rhombo.H.axes - Primitive - S-Q 50.2 %
ZnFe hexagonal contact edge 4 weeks
Lin
(C
ps)
0
1000
2000
3000
2-Theta - Scale
5 10 20 30 40 50 60 70 80 90

ZnFe (flange) hex. edge, 2 weeks
Zinc, syn - Zn - Hexagonal - Primitive - I/Ic PDF 3.8 - S-Q 64.2 %
Zincite, syn - ZnO - Hexagonal - Primitive - I/Ic PDF 5.4 - S-Q 4.7 %
Simonkolleite, syn - Zn5(OH)8Cl2·H2O - Rhombo.H.axes - Primitive - S-Q 31.1 %
Y + 10.0 mm - ZnFe top of flange 2 weeks
Lin
(C
ps)
0
1000
2000
3000
4000
5000
2-Theta - Scale
5 10 20 30 40 50 60 70 80 90
??
ZnFe (flange) hex. edge, 4 weeks
Zinc, syn - Zn - Hexagonal - Primitive - P63/mmc (194) - I/Ic PDF 9. - S-Q 43.4 %
Zincite, syn - ZnO - Hexagonal - Primitive - P63mc (186) - I/Ic PDF 5.4 - S-Q 6.4 %
Simonkolleite, syn - Zn5(OH)8Cl2·H2O - Rhombo.H.axes - Primitive - R-3m (166) - S-Q 50.2 %
Y + 10.0 mm - ZnFe flange 4 weeks
Lin
(C
ps)
0
1000
2000
3000
4000
5000
6000
7000
8000
2-Theta - Scale
5 10 20 30 40 50 60 70 80 90

ZnFe (flange) flange edge, 2 weeks
Iron, syn - Fe - Cubic - Body-centered - S-Q 24.8 %
Zincite, syn - ZnO - Hexagonal - Primitive - I/Ic PDF 5.4 - S-Q 45.9 %
Simonkolleite, syn - Zn5(OH)8Cl2·H2O - Rhombo.H.axes - Primitive - S-Q 29.3 %
ZnFe edge of flange 2 weeks
Lin
(C
ps)
0
100
200
300
400
500
600
700
800
900
1000
1100
2-Theta - Scale
5 10 20 30 40 50 60 70 80 90
ZnFe (flange) flange edge, 4 weeks
Iron Zinc Oxide - (Zn0.95Fe0.05)0.98O - Hexagonal - Primitive - S-Q 26.6 %
Iron, syn - Fe - Cubic - Body-centered - S-Q 12.7 %
Zincite, syn - ZnO - Hexagonal - Primitive - S-Q 16.0 %
Simonkolleite, syn - Zn5(OH)8Cl2·H2O - Rhombo.H.axes - Primitive - S-Q 44.7 %
ZnFe edge of flange 4 weeks
Lin
(C
ps)
0
1000
2-Theta - Scale
5 10 20 30 40 50 60 70 80

ZnFe (flange) contact edge, 2 weeks
Iron, syn - Fe - Cubic - Body-centered - I/Ic PDF 11.6 - S-Q 18.2 %
Zinc, syn - Zn - Hexagonal - Primitive - I/Ic PDF 9. - S-Q 69.5 %
Zincite, syn - ZnO - Hexagonal - Primitive - I/Ic PDF 5.4 - S-Q 3.5 %
Simonkolleite, syn - Zn5(OH)8Cl2·H2O - Rhombo.H.axes - Primitive - S-Q 8.8 %
ZnFe contact edge of flange 2 weeks
Lin
(C
ps)
0
1000
2000
3000
4000
5000
2-Theta - Scale
5 10 20 30 40 50 60 70 80 90
ZnFe (flange) contact edge, 4 weeks
Iron, syn - Fe - Cubic - Body-centered - S-Q 17.5 %
Zinc, syn - Zn - Hexagonal - Primitive - I/Ic PDF 8.5 - S-Q 75.5 %
Zincite, syn - ZnO - Hexagonal - Primitive - I/Ic PDF 5.4 - S-Q 2.8 %
Simonkolleite, syn - Zn5(OH)8Cl2·H2O - Rhombo.H.axes - Primitive - S-Q 4.2 %
ZnFe contact edge of flange 4 weeks
Lin
(C
ps)
0
1000
2000
3000
4000
5000
6000
2-Theta - Scale
5 10 20 30 40 50 60 70 80 90

ZnFe edge of flange powder vs normal
Zincite, syn - ZnO - Hexagonal - Primitive - S-Q 16.0 %
Iron, syn - Fe - Cubic - Body-centered - S-Q 12.7 %
Iron Zinc Oxide - (Zn0.95Fe0.05)0.98O - Hexagonal - Primitive - S-Q 26.6 %
Simonkolleite, syn - Zn5(OH)8Cl2·H2O - Rhombo.H.axes - Primitive - S-Q 44.7 %
Y + 10.0 mm - ZnFe edge flange 4 weeks (powder)
ZnFe edge of flange 4 weeks
Lin
(C
ps)
0
1000
2-Theta - Scale
5 10 20 30 40 50 60 70 80
GEOMET silver reference
Zinc Iron Oxide - Zn0.89Fe0.11O - Hexagonal - Primitive - I/Ic PDF 5. - S-Q 6.1 %
Iron Silicon Oxide - (Fe0.769Si0.231)(Fe0.975Si0.025)2O4 - Cubic - Face-centered - I/Ic PDF 4.8 - S-Q 5.6 %
Iron, syn - Fe - Cubic - Body-centered - I/Ic PDF 11.6 - S-Q 24.9 %
Zinc, syn - Zn - Hexagonal - Primitive - I/Ic PDF 8.5 - S-Q 63.3 %
GEOMET silver reference
Lin
(C
ps)
0
1000
2000
3000
2-Theta - Scale
5 10 20 30 40 50 60 70 80

GEOMET (flange) hex. edge, 6 weeks
Iron, syn - Fe - Cubic - Body-centered - I/Ic PDF 11.6 - S-Q 30.0 %
Zinc, syn - Zn - Hexagonal - Primitive - I/Ic PDF 8.5 - S-Q 49.5 %
Simonkolleite, syn - Zn5(OH)8Cl2·H2O - Rhombo.H.axes - Primitive - S-Q 20.5 %
GEOMET flange hex surface 6 weeks
Lin
(C
ps)
0
1000
2000
3000
2-Theta - Scale
5 10 20 30 40 50 60 70 80 90
GEOMET (flange) contact edge, 6 weeks
Iron, syn - Fe - Cubic - Body-centered - I/Ic PDF 11.6 - S-Q 26.2 %
Zinc, syn - Zn - Hexagonal - Primitive - I/Ic PDF 9. - S-Q 63.8 %
Zincite, syn - ZnO - Hexagonal - Primitive - I/Ic PDF 5.4 - S-Q 10.0 %
GEOMET contact edge of flange 6 weeks
Lin
(C
ps)
0
1000
2000
3000
2-Theta - Scale
5 10 20 30 40 50 60 70 80 90

GEOBLACK 500 reference
Iron, syn - Fe - Cubic - Body-centered - I/Ic PDF 11.6 - S-Q 13.4 %
Zinc, syn - Zn - Hexagonal - Primitive - I/Ic PDF 8.5 - S-Q 82.4 %
Zincite, syn - ZnO - Hexagonal - Primitive - I/Ic PDF 5.4 - S-Q 4.2 %
GEOMET 500 black reference
Lin
(C
ps)
0
1000
2000
3000
4000
5000
6000
7000
8000
2-Theta - Scale
5 10 20 30 40 50 60 70 80 90
GEOBLACK 500 hex. edge, 6 weeks
Citric acid - C6H8O7 - Monoclinic - Primitive - I/Ic PDF 0.6 - S-Q 25.9 %
Halite, syn - NaCl - Cubic - Face-centered - I/Ic PDF 4.7 - S-Q 17.5 %
Iron, syn - Fe - Cubic - Body-centered - I/Ic PDF 11.6 - S-Q 12.2 %
Zinc, syn - Zn - Hexagonal - Primitive - I/Ic PDF 8.5 - S-Q 36.4 %
Simonkolleite, syn - Zn5(OH)8Cl2·H2O - Rhombo.H.axes - Primitive - S-Q 8.0 %
Geromet black
Lin
(C
ps)
0
1000
2000
3000
4000
5000
6000
2-Theta - Scale
5 10 20 30 40 50 60 70 80 90
d=
2,8
1762

GEOBLACK 500 ref and 6 weeks
Citric acid - C6H8O7 - Monoclinic - Primitive - P21/a (14)
Halite, syn - NaCl - Cubic - Face-centered - Fm-3m (225)
Iron, syn - Fe - Cubic - Body-centered - Im-3m (229)
Zinc, syn - Zn - Hexagonal - Primitive - P63/mmc (194)
Zincite, syn - ZnO - Hexagonal - Primitive - P63mc (186)
Simonkolleite, syn - Zn5(OH)8Cl2·H2O - Rhombo.H.axes - Primitive
Y + 20.0 mm - Geromet black 6 weeks
Y + 10.0 mm - GEOMET 500 black reference
Lin
(C
ps)
0
1000
2000
3000
4000
5000
6000
7000
8000
2-Theta - Scale
5 10 20 30 40 50 60 70 80 90
?

GEOBLACK 321 reference
Aluminum - Al - Cubic - Face-centered - I/Ic PDF 4.1 - S-Q 11.7 %
Iron, syn - Fe - Cubic - Body-centered - I/Ic PDF 11.6 - S-Q 8.4 %
Zinc, syn - Zn - Hexagonal - Primitive - I/Ic PDF 9. - S-Q 79.9 %
GEOBLACK 321 reference
Lin
(C
ps)
0
1000
2000
3000
4000
5000
6000
7000
2-Theta - Scale
5 10 20 30 40 50 60 70 80 90
?
GEOBLACK 321 hex. edge, 6 weeks
Iron, syn - Fe - Cubic - Body-centered - I/Ic PDF 11.6 - S-Q 18.2 %
Zinc, syn - Zn - Hexagonal - Primitive - I/Ic PDF 8.5 - S-Q 51.0 %
Zincite, syn - ZnO - Hexagonal - Primitive - I/Ic PDF 5.4 - S-Q 12.7 %
Simonkolleite, syn - Zn5(OH)8Cl2·H2O - Rhombo.H.axes - Primitive - S-Q 18.1 %
GEOMET BLACK 321 6 weeks
Lin
(C
ps)
0
1000
2000
3000
4000
5000
2-Theta - Scale
5 10 20 30 40 50 60 70 80 90

DELTA reference
Clinochlore-1MIIb, ferroan - (Mg,Fe)6(Si,Al)4O10(OH)8 - Monoclinic
Talc-2M - Mg3Si4O10(OH)2 - Monoclinic - Base-centered
Silicon Oxide - SiO2 - Tetragonal - Body-centered
Iron, syn - Fe - Cubic - Body-centered
Zinc, syn - Zn - Hexagonal - Primitive
Zincite, syn - ZnO - Hexagonal - Primitive
Simonkolleite, syn - Zn5(OH)8Cl2·H2O - Rhombo.H.axes - Primitive
Delta reference
Lin
(C
ps)
0
1000
2000
3000
4000
5000
6000
7000
8000
2-Theta - Scale
5 10 20 30 40 50 60 70 80 90
DELTA hex. edge, 6 weeks
Talc-2M - Mg3Si4O10(OH)2 - Monoclinic - Base-centered
Iron, syn - Fe - Cubic - Body-centered
Zinc, syn - Zn - Hexagonal - Primitive
Zincite, syn - ZnO - Hexagonal - Primitive
Simonkolleite, syn - Zn5(OH)8Cl2·H2O - Rhombo.H.axes - Primitive
Delta 6v
Lin
(C
ps)
0
1000
2000
3000
4000
2-Theta - Scale
5 10 20 30 40 50 60 70 80 90

10.2 Appendix 2: Photographs of screw joints after exposure in the ACT chamber for 1, 2, 4 and 8 weeks.
ZnFe (flange) and GEOMET (flange)
After 1 week in the ACT chamber. Screw nr. 2 has been photographed separately (two pictures to the right):
After 2 weeks in the ACT chamber. Screw nr. 7 has been photographed separately (two pictures to the right):
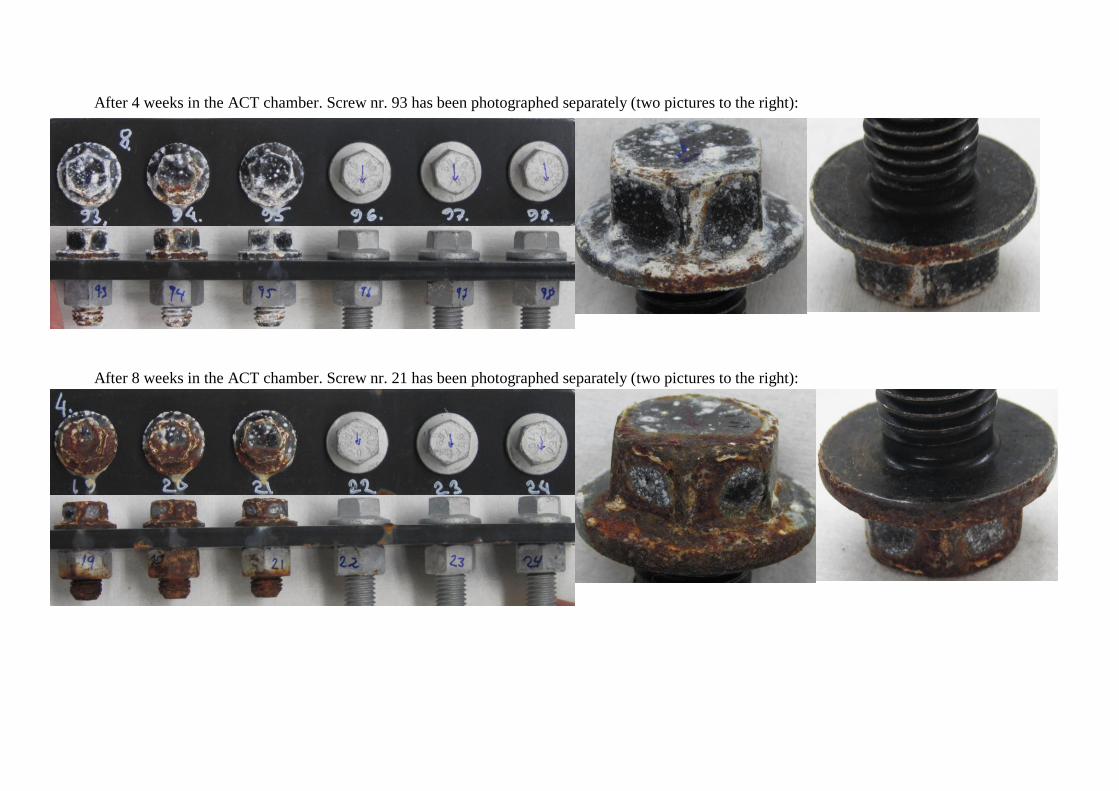
After 4 weeks in the ACT chamber. Screw nr. 93 has been photographed separately (two pictures to the right):
After 8 weeks in the ACT chamber. Screw nr. 21 has been photographed separately (two pictures to the right):

ZnFe (hexagonal) and DACROMET (hexagonal)
After 1 week in the ACT chamber. Screw nr. 32 has been photographed separately (two pictures to the right):
After 2 weeks in the ACT chamber. Screw nr. 41 has been photographed separately (two pictures to the right):

After 4 weeks in the ACT chamber. Screw nr. 51 has been photographed separately (two pictures to the right):
After 8 weeks in the ACT chamber. Screw nr. 62 has been photographed separately (two pictures to the right):