Evaluation of chlorindazone ds for the determination of metal ions
5
Analytica Chimica Acta, 106 (1979) 141-145 o Ekevier Scientific Publishing Company, Amsterdam -Printed in The Netherlands Short Communication EVALUATION OF CHLORINDAZONE DS FOR THE DETERMINATION OF METAL IONS DAVID PILOSOF and ERVIN JUNGREIS* Department of Inorganic and Analytical Chemistry, The Hebrew University of Jerusalem, Jerusalem (Israel) (Received 17th July 1978) Since the synthesis of chlorindazone DS (I; (1-(6’-chloroindazole-3’- ylazo)-2-hydroxynaphthalene-3,6-disulfonic acid) by Schweppe [ 11, the reagent has been used analytically in spot tests for cobalt, copper, nickel, zinc and cadmium [l] and for photometric determination of copper and nickel [ 2,3] _ Schweppe [l] suggested its use as a metallochromic indicator in com- pleximetric titrations. This question was examined in the work described here. The absorption spectra of the reagent and its metal complexes were recorded, the pK, values of the reagent calculated, the dependence of complex formation on pH evaluated, and the compositions of the complexes established. Finally, pH conditions and masking agents are suggested for selective spectrophotometric determinations or photometric titrations of cobalt, copper, nickel, zinc and cadmium. Chlorindazone DS can also serve as an acid-base indicator. ,503H Chlorindazone DS is a red water-soluble powder, insoluble in polar solvents_ Its aqueous solution shows an absorption maximum at 465 nm with a molar absorptivity of 9660 1 mol-’ cm-‘, and is stable for long periods. The absorption spectra of chlorindazone DS and of its metal complexes under optimal conditions had the characteristics shown in Table 1; Ah indi- cates the extent of the wavelength shift on metal-complex formation. The spectra were recorded with a Perkin-Elmer 550 spectrophotometer. The cobalt(I1) complex is not stable and turns from pink-violet to green unless ascorbic acid is added_ The pK, value of the indicator Like any other o-hydroxyazo dye, chlorindazone DS has acid-base indicator
-
Upload
david-pilosof -
Category
Documents
-
view
212 -
download
0
Transcript of Evaluation of chlorindazone ds for the determination of metal ions
Analytica Chimica Acta, 106 (1979) 141-145 o Ekevier Scientific Publishing Company, Amsterdam -Printed in The Netherlands
Short Communication
EVALUATION OF CHLORINDAZONE DS FOR THE DETERMINATION OF METAL IONS
DAVID PILOSOF and ERVIN JUNGREIS*
Department of Inorganic and Analytical Chemistry, The Hebrew University of Jerusalem, Jerusalem (Israel)
(Received 17th July 1978)
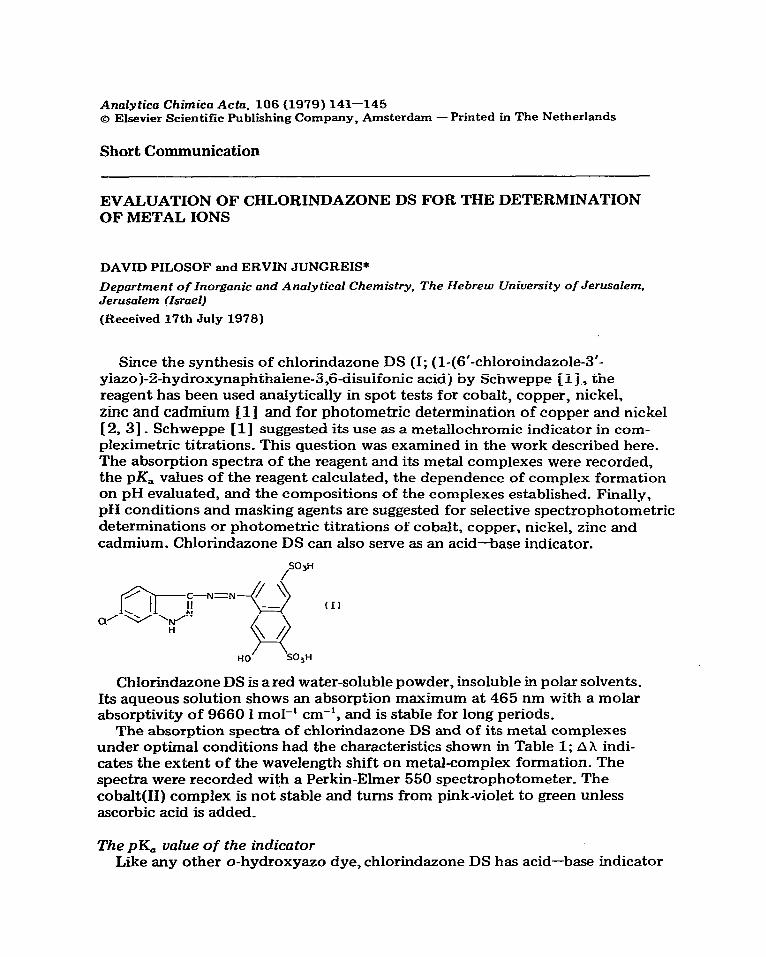
Since the synthesis of chlorindazone DS (I; (1-(6’-chloroindazole-3’- ylazo)-2-hydroxynaphthalene-3,6-disulfonic acid) by Schweppe [ 11, the reagent has been used analytically in spot tests for cobalt, copper, nickel, zinc and cadmium [l] and for photometric determination of copper and nickel [ 2,3] _ Schweppe [l] suggested its use as a metallochromic indicator in com- pleximetric titrations. This question was examined in the work described here. The absorption spectra of the reagent and its metal complexes were recorded, the pK, values of the reagent calculated, the dependence of complex formation on pH evaluated, and the compositions of the complexes established. Finally, pH conditions and masking agents are suggested for selective spectrophotometric determinations or photometric titrations of cobalt, copper, nickel, zinc and cadmium. Chlorindazone DS can also serve as an acid-base indicator.
,503H
Chlorindazone DS is a red water-soluble powder, insoluble in polar solvents_ Its aqueous solution shows an absorption maximum at 465 nm with a molar absorptivity of 9660 1 mol-’ cm-‘, and is stable for long periods.
The absorption spectra of chlorindazone DS and of its metal complexes under optimal conditions had the characteristics shown in Table 1; Ah indi- cates the extent of the wavelength shift on metal-complex formation. The spectra were recorded with a Perkin-Elmer 550 spectrophotometer. The cobalt(I1) complex is not stable and turns from pink-violet to green unless ascorbic acid is added_
The pK, value of the indicator Like any other o-hydroxyazo dye, chlorindazone DS has acid-base indicator

142
TABLE 1
Characteristicsofabsorptionspectra
&I)-DS
Co(II)-DS Zn( II)-DS Ni( II)-DS Cu( II)-DS Co(III)-DS
; mol-'cm")
9960 9100
9060 11400 15680
9900 8700
hmax Ah (nm) (nm)
465 513 48 -
524 59 524 59 540 75 580 115 619 154
Color
magenta orange
pink-violet violet-red violet blue green
properties_ The protonated form is orange, whereas DS is red. The pK, value was calculated from the formula
pKa + pH -log ([DS-] /[HDS] ) = pH - log (A - A,)/& -A)
where A, A, and Ab are the absorbances of the indicator at the intermediate pH in the acid form and in the basic form, respectively. For the measurements, 2 ml of aqueous low3 M chlorindazone DS solution were mixed with different buffer solutions, which were prepared by adding 0.1 M NaOH to 0.1 M glycine solution, and diU.ed to 25 ml. The data shown in Table 2, lead to an average pK, value of lo-4 + 0.2. This characterizes a very weak acid, which could be useful in acid-base titrations having a transition point at around pH lo_ The color change from pink-violet (base) to orange (acid) is quite sharp in titra- tions-of 0.5 M sodium hydroxide and hydrochloric acid.
Stability of the chlorindazone DS complexes and effect of pIi From the analytical point of view, the pH range in which the different
metal complexes exist is important_ Table 3 summarizes the changes in absorb- ance at different pH values. Absorption spectra are shown in Fig. 1.
The mole ratio between the ligand and the metal ion, found by the Job method and confirmed by photometric titration of 10m4 M chlorindazone DS solution [4, 5J was 1:2 in all cases_
TABLE2
Measurement of the pK, value
PI-I Measured at 420 nm Measured at 540 nm
A, Ab A PK, -4, Ab A PK,
9.70 0.72 O-48 0.68 10.4 0.44 0.71 0.50 10.24 10.25 0.72 0.48 0.61 10.32 0.44 0.71 0.55 10.41 10.60 0.72 0.48 0.56 10.30 0.44 0.71 0.58 10.57 11.70 O-72 0.48 0.49 10.34 0.44 0.71 0.69 10.60

143
TABLE 3
Stability of the complexes at different pH values (30 ml of 10q M chlorindazone DS was mixed with 60 ml of 10J M metal ion solution and made up to 100 ml; 5 ml of this solution was diluted to 25 ml with the appropriate buffer_)
DH Absorbance of metal complex
co cu Ni (623 nm) (590 nm) (550 nm) :?I0 nm)
Cd (540 nm)
1 0.197 -
2 0.199 0.112 3 0.296 0.292 4 0.310 0.358 5 0.340 0.352 6 0.371 0.352 7 0.364 0.362 8 0.376 0.365 9 0.388 0.360
10 0.385 0.380 11 0.385 0.408 12 0.400 0.440
- -
0.258 0.260 0.354 0.429 0.505 0.600 0.595 0.600 0.600 0.600
- - - -
0.151 0.229 0.230 0.258 0.280 0.296 0.303 0.304
- - - - -
0.124 0.183 0.216 0.238 0.245 0.267 0.262
1.5 I
Vtbvelengrh (nm) Wovelength (nm)
1.5.
A
400 500 600 700 800
Wovelength b-rd
A
400 500 600 700 800
Wavelength (nml
Fig. 1. Absorption spectra for the cobalt, copper, nickel and cadmium complexes at the pH values marked on the curves.
144
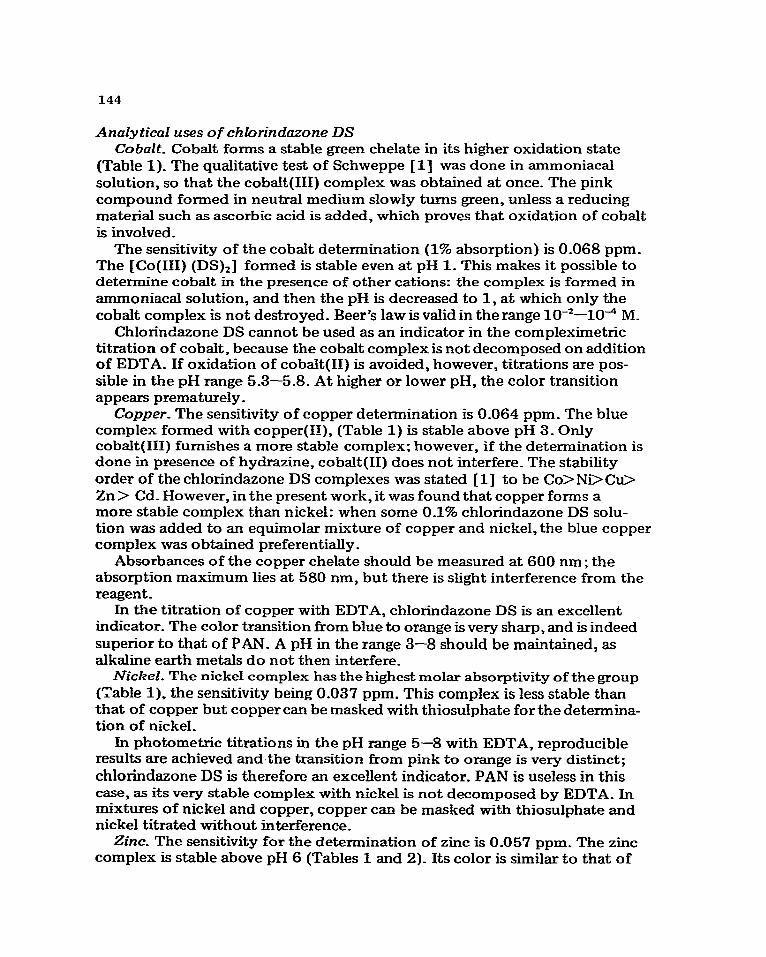
Analytical uses of chlorindazone DS Cobalt_ Cobalt forms a stable green chelate in its higher oxidation state
(Table 1). The qualitative test of Schweppe [l] was done in ammoniacal solution, so that the cobalt(II1) complex was obtained at once. The pink compound formed in neutral medium slowly turns green, unless a reducing material such as ascorbic acid is added, which proves that oxidation of cobalt is involved_
The sensitivity of the cobalt determination (1% absorption) is 0.068 ppm. The [Co(III) (DS),] formed is stable even at pH 1. This makes it possible to determine cobalt in the presence of other cations: the complex is formed in ammoniacal solution, and then the pH is decreased to 1, at which only the cobalt complex is not destroyed. Beer’s law is valid in the range lo-*-lo4 M.
Chlorindazone DS cannot be used as an indicator in the compleximetric titration of cobalt, because the cobalt complex is not decomposed on addition of EDTA. If oxidation of cobalt(I1) is avoided, however, titrations are pos- sible in the pH range 5.3-5.8. At higher or lower pH, the color transition appears prematurely.
Copper_ The sensitivity of copper determination is 0.064 ppm. The blue complex formed with copper( (Table 1) is stable above pH 3. Only cobalt(II1) furnishes a more stable complex; however, if the determination is done in presence of hydrazine, cobalt(I1) does not interfere_ The stability order of the chlorindazone DS complexes was stated [l] to be Co>Ni>Cu> Zn > Cd_ However, in the present work, it was found that copper forms a more stable complex than nickel: when some 0.1% chlorindazone DS solu- tion was added to an equimolar mixture of copper and nickel, the blue copper complex was obtained preferentially.
Absorbances of the copper chelate should be measured at 600 nm; the absorption maximum lies at 580 nm, but there is slight interference from the reagent.
In the titration of copper with EDTA, chlorindazone DS is an excellent indicator_ The color transition from blue to orange is very sharp, and is indeed superior to that of PAN. A pH in the range 3-8 should be maintained, as alkaline earth metals do not then interfere.
Nickel. The nickel complex has the highest molar absorptivity of the group (Table 1), the sensitivity being 0.037 ppm. This complex is less stable than that of copper but copper can be masked with thiosulphate for the deterrnina- tion of nickel.
In photometric titrations in the pH range 5-8 with EDTA, reproducible results are achieved and-the transition from pink to orange is very distinct; chlorindazone DS is therefore an excellent indicator. PAN is useless in this case, as its very stable complex with nickel is not decomposed by EDTA. In mixtures of nickel and copper, copper can be masked with thiosulphate and nickel titrated without interference.
Zinc. The sensitivity for the determination of zinc is 0.057 ppm. The zinc complex is stable above pH 6 (Tables 1 and 2). Its color is similar to that of
145
the nickel complex, but the latter is stable at lower pH values so that the complexes can be estimated separately by lowering the pH to less than 5.
Chlorindazone DS gives a poor color transition in the compleximetric titration of zinc.
Cadmium. The cadmium complex is the least stable complex in the group, and exists only above pH 7. The sensitivity is 0.126 ppm. Cadmium can be measured at 513 nm, but only in the absence of copper, nickel, cobalt and zinc. The reagent is not a suitable indicator for EDTA titrations because of the instability problem and inadequate color contrast.
We are indebted to Dr. Helmut Schweppe, BASF, Ludwigshafen am Rhein, for kindly supplying the reagent.
REFERENCES
1 H_ Schweppe, Fresenius Z. Anal. Chem., 244 (1969) 312. 2 D. Molch, H. Koening and E. Than, Z. Chem., 14 (5) (1974) 369. 3 D. Molch, H. Koening and E. Than, Z. Chem., 14 (10) (1974) 408.
4 D. D. Perrin, Organic Complexing Reagents, Interscience, 1964. 5 R. Singer, in Kolthoff and Elving (Eds.), Treatise on Analytical Chemistry, Part I,
Vol. 5, Interscience-Wiley, New York, 1964, p. 2980. 6 H. A. Flaschka, EDTA Titrations, Pergamon Press, Oxford, 1964.