Evaluation of CEEMS: The Cincinnati Engineering Enhanced ... External... · Table 6. Lesson...
66
Evaluation of CEEMS: The Cincinnati Engineering Enhanced Mathematics and Science Partnership Project ANNUAL REPORT 2016-2017 DISCOVERY CENTER for EVALUATION, RESEARCH, AND PROFESSIONAL LEARNING Formerly Ohio’s Evaluation & Assessment Center MIAMI UNIVERSITY OXFORD, OH
Transcript of Evaluation of CEEMS: The Cincinnati Engineering Enhanced ... External... · Table 6. Lesson...

Annual Report – UC AISL
Evaluation of CEEMS: The Cincinnati Engineering Enhanced
Mathematics and Science Partnership Project
ANNUAL REPORT 2016-2017
DISCOVERY CENTER
for
EVALUATION, RESEARCH, AND PROFESSIONAL LEARNING Formerly Ohio’s Evaluation & Assessment Center
MIAMI UNIVERSITY OXFORD, OH

Please cite as follows: Woodruff, S. B., Dixon, M. L., & Li, Y. (2017). Evaluation of CEEMS: The Cincinnati Engineering Enhanced Mathematics and Science Partnership Project: Annual report, 2016-2017. Oxford, OH: Miami University, Discovery Center for Evaluation, Research, and Professional Learning. Distributed by: © Discovery Center for Evaluation, Research, and Professional Learning Miami University, Oxford, OH 408 McGuffey Hall 210 E. Spring St. Oxford, Ohio 45056 [email protected] (513) 529-1686 phone (513) 529-2110 fax

Discovery Center for Evaluation, Research, and Professional Learning
Evaluation of CEEMS, Annual Report 2016-2017, Page 1
Table of Contents
Table of Tables ................................................................................................................................ 2
Introduction .................................................................................................................................... 4
Evaluation Methods and Findings................................................................................................... 6
Resource Team Focus Group, Fall 2016 ...................................................................................... 6
Instrument .............................................................................................................................. 6
Data Collection ........................................................................................................................ 6
Data Analysis ........................................................................................................................... 6
Findings ................................................................................................................................... 6
Summary ............................................................................................................................... 10
Classroom Observations, 2016-2017 Academic Year ............................................................... 11
Instrument ............................................................................................................................ 11
Data Collection ...................................................................................................................... 11
Quantitative Data Analysis .................................................................................................... 12
Qualitative Data Analysis ...................................................................................................... 12
Findings ................................................................................................................................. 12
Summary ............................................................................................................................... 29
Summary ............................................................................................................................... 46
Conclusions, Recommendations, and Next Steps ........................................................................ 47
Conclusions ............................................................................................................................... 47
Recommendations .................................................................................................................... 48
Next Steps ................................................................................................................................. 48
References .................................................................................................................................... 49
Appendices .................................................................................................................................... 50
Appendix A. Resource Team Focus Group Protocol ..................................................................... 51
Appendix B. Inside the Classroom Observation and Analytic Protocol ........................................ 52
Appendix C. Qualitative Code Book .............................................................................................. 63

Discovery Center for Evaluation, Research, and Professional Learning
Evaluation of CEEMS, Annual Report 2016-2017, Page 2
Table of Tables
Table 1. Alignment of Evaluation Questions and Measures ........................................................... 5
Table 2. Number of Lessons by Lesson Type, School Type, and Subject, Inside the Classroom Observation and Analytic Protocol, 2016-2017 ............................................................................ 13
Table 3. Lesson Design by Lesson Type, Rating Frequencies, Inside the Classroom Observation and Analytic Protocol, 2016-2017 ................................................................................................. 14
Table 4. Lesson Design by Lesson Type, ANOVA Comparisons, Inside the Classroom Observation and Analytic Protocol, 2016-2017 ................................................................................................. 16
Table 5. Lesson Implementation by Lesson Type, Rating Frequencies, Inside the Classroom Observation and Analytic Protocol, 2016-2017 ............................................................................ 17
Table 6. Lesson Implementation by Lesson Type, ANOVA Comparisons, Inside the Classroom Observation and Analytic Protocol, 2016-2017 ............................................................................ 19
Table 7. Mathematics/Science Content by Lesson Type, Rating Frequencies, Inside the Classroom Observation and Analytic Protocol, 2016-2017 ............................................................................ 20
Table 8. Lesson Content by Lesson Type, ANOVA Comparisons, Inside the Classroom Observation and Analytic Protocol, 2016-2017 ................................................................................................. 22
Table 9. Classroom Culture by Lesson Type, Rating Frequencies, Inside the Classroom Observation and Analytic Protocol, 2016-2017 ............................................................................ 23
Table 10. Classroom Culture by Lesson Type, ANOVA Comparisons, Inside the Classroom Observation and Analytic Protocol, 2016-2017 ............................................................................ 24
Table 11. Likely Impact of Instruction on Student Learning by Lesson Type, Rating Percentages, Inside the Classroom Observation and Analytic Protocol, 2016-2017 .......................................... 25
Table 12. Likely Impact of Instruction on Student Learning by Lesson Type, ANOVA Comparisons, Inside the Classroom Observation and Analytic Protocol, 2016-2017 .......................................... 26
Table 13. Lesson Features by Lesson Type, Inside the Classroom Observation and Analytic Protocol, 2016-2017 ...................................................................................................................... 27
Table 14. Capsule Ratings by Lesson Type, Frequencies and Percentages, Inside the Classroom Observation and Analytic Protocol, 2016-2017 ............................................................................ 28
Table 15. Pearson’s Chi-Square Test of Capsule Ratings by Lesson Type, Inside the Classroom Observation and Analytic Protocol, 2016-2017 ............................................................................ 28
Table 16. References by Code, by Lesson Type, Inside the Classroom Observation and Analytic Protocol, 2016-2017 ...................................................................................................................... 29
Discovery Center for Evaluation, Research, and Professional Learning
Evaluation of CEEMS, Annual Report 2016-2017, Page 3
Table 17. Lesson Design by Lesson Type, ANOVA Comparisons, Inside the Classroom Observation and Analytic Protocol, 2016-2017, Matched Teacher Sample ...................................................... 31
Table 18. Synthesis Ratings for Lesson Design by Lesson Type, Inside the Classroom Observation and Analytic Protocol, 2016-2017, Matched Teacher Sample ...................................................... 32
Table 19. Lesson Implementation by Lesson Type, ANOVA Comparisons, Inside the Classroom Observation and Analytic Protocol, 2016-2017, Matched Teacher Sample ................................. 32
Table 20. Synthesis Rating for Lesson Implementation by Lesson Type, ANOVA Comparisons, Inside the Classroom Observation and Analytic Protocol, 2016-2017, Matched Teacher Sample33
Table 21. Mathematics/Science Content by Lesson Type, ANOVA Comparisons, Inside the Classroom Observation and Analytic Protocol, 2016-2017, Matched Teacher Sample ............... 33
Table 22. Synthesis Rating for Mathematics/Science Content by Lesson Type, Inside the Classroom Observation and Analytic Protocol, 2016-2017, Matched Teacher Sample ............... 34
Table 23. Classroom Culture by Lesson Type, ANOVA Comparisons, Inside the Classroom Observation and Analytic Protocol, 2016-2017, Matched Teacher Sample ................................. 34
Table 24. Synthesis Rating for Classroom Culture by Lesson Type, Inside the Classroom Observation and Analytic Protocol, 2016-2017, Matched Teacher Sample ................................. 35
Table 25. Likely Impact of Instruction on Student Understanding by Lesson Type, Inside the Classroom Observation and Analytic Protocol, 2016-2017, Matched Teacher Sample ............... 35
Table 26. Teacher and Lesson Characteristics, Matched Teacher Sample, 2016-2017 ................ 36
Table 27. Summary of Lessons, Teacher HST1606, 2016-2017 .................................................... 37
Table 28. Summary of Lessons, Teacher HST1607, 2016-2017 .................................................... 38
Table 29. Summary of Lessons, Teacher MST1601, 2016-2017.................................................... 39
Table 30. Summary of Lessons, Teacher MST1602, 2016-2017.................................................... 40
Table 31. Summary of Lessons, Teacher MST1604, 2016-2017.................................................... 41
Table 32. Summary of Lessons, Teacher MST1605, 2016-2017.................................................... 42
Table 33. Summary of Lessons, Teacher MST1609, 2016-2017.................................................... 43
Table 34. Summary of Lessons, Teacher HST1611, 2016-2017 .................................................... 44
Table 35. Summary of Lessons, Teacher MST1615, 2016-2017.................................................... 45

Discovery Center for Evaluation, Research, and Professional Learning
Evaluation of CEEMS, Annual Report 2016-2017, Page 4
Introduction
The Discovery Center for Evaluation, Research, and Professional Learning (Discovery Center) completed the second year of a 2-year qualitative evaluation of instructional change for teachers involved with CEEMS: The Cincinnati Engineering Enhanced Mathematics and Science partnership project. The broad objective of the evaluation was to provide annual feedback and a summative assessment of the project’s ability to meet revised project Goal 3, “Develop math and science teacher knowledge of challenge-based learning, engineering, and the engineering design process as instructional strategies through explicit training and classroom implementation support” (Maltbie & Butcher, 2014). The purpose of this study was to evaluate the influence of CEEMS participation on teachers’ confidence and competence in their incorporation of engineering principles into their science instruction. Specifically, this evaluation asked the following questions:
1. In what ways did teachers’ instructional practices change in the course of their participation in CEEMS?
2. In what ways did CEEMS Resource Team support for teachers change in the course of their participation in CEEMS?
The CEEMS partnership project was funded through a Math and Science Partnership (MSP) program grant from the National Science Foundation (NSF). This project was a multi-year effort to create multiple professional development pathways to prepare pre-service and in-service teachers to meet revised standards for engineering education in the K-12 science curriculum. For this project, the Discovery Center Evaluation Team consisted of Dr. Sarah B. Woodruff, Principal Investigator for the evaluation; Ms. Yue Li, Senior Research Associate and Project Team Leader; and Ms. Maressa Dixon, Research Associate. This annual report describes evaluation activities conducted in the 2016-2017 academic year and findings from those activities. Table 1 summarizes alignment between evaluation questions and evaluation measures.

Discovery Center for Evaluation, Research, and Professional Learning
Evaluation of CEEMS, Annual Report 2016-2017, Page 5
Table 1. Alignment of Evaluation Questions and Measures
Evaluation Question Instrument/ Measure(s)
EQ 1: In what ways did teachers’ instructional practices change in the course of their participation in CEEMS?
Classroom Observations Principal Focus Group Resource Team Focus Groups
EQ2: In what ways did CEEMS Resource Team support for teachers change in the course of their participation in CEEMS?
Resource Team Focus Groups
In the 2016-2017 academic year, the Discovery Center Evaluation Team conducted 2 focus groups with CEEMS Resource Team members and analyzed classroom observations from 30 CEEMS cohort 4 and cohort 5 teachers. The next section of this report describes evaluation methods and findings.

Discovery Center for Evaluation, Research, and Professional Learning
Evaluation of CEEMS, Annual Report 2016-2017, Page 6
Evaluation Methods and Findings
Resource Team Focus Group, Fall 2016 The Discovery Center invited CEEMS Resource Team members to participate in one of two focus groups held on November 15, 2016. Eight Resource Team members attended: five former teachers and three former engineers. Each focus group included four participants.
Instrument The Resource Team focus group protocol was identical for both groups. Questions were focused on changes Resource Team members recognized in teachers’ instructional practices and in their own methods of support for teachers. Each focus group included an activity that asked participants to list personal, school, and community characteristics the most successful CEEMS teachers held in common. This activity was analyzed alongside other focus group data, and findings were included in this summary. A copy of the focus group protocol is available in Appendix A.
Data Collection One Evaluation Team member, Maressa Dixon, conducted and analyzed data from these focus groups. Prior to the start of each group, Ms. Dixon obtained informed consent to record the conversation and use the data to evaluate CEEMS. Each focus group lasted about one hour, and the conversation was recorded using a digital hand-held recorder. Digital audio data were uploaded to the data analysis software package NVivo, version 11, for transcription. Ms. Dixon created “clean” transcripts—transcripts that are close to verbatim but do not include pauses, misspoken words, or extraneous utterances—for each focus group.
Data Analysis To analyze these data, Ms. Dixon read participant responses, question by question, from both groups. She first identified the responses both groups had in common. She then identified responses held in common, regardless of the question to which participants were responding. Finally, she identified important information that indicated special insights participants brought to their work as Resource Team members based on their previous experiences as either engineers or teachers. The purpose of the analysis was to identify themes about the nature of CEEMS teacher change and change in Resource Team member support
Findings Findings were organized by evaluation question (EQ).
Discovery Center for Evaluation, Research, and Professional Learning
Evaluation of CEEMS, Annual Report 2016-2017, Page 7
EQ 1 – In what ways did teachers’ instructional practices change in the course of their participation in CEEMS?
Patterns of Teacher Change
• The nature of change was individual to the teacher. Some teachers improved dramatically, and others did not improve much at all.
• Teachers from later cohorts benefited from communication with teachers from earlier cohorts. The teacher networks that CEEMS facilitated allowed later cohorts to understand the expectations of the CEEMS program and troubleshoot problems with CEEMS lessons.
• One fundamental change was from direct instruction to student engagement and questioning. This change resulted in student development of the challenge rather than teacher explication of the challenge. As one former engineer explained, “The challenge-based learning is a change in the process of pedagogy from tell-teaching to ask-teaching” (11/15/16). This change tended to be most recognizable from the first to the second CEEMS lesson.
• Teachers were surprised to find that, when they gave up direct instruction and turned toward class discussion and questioning, students became engaged and enthusiastic. As one former teacher acknowledged, “They have that aha moment where they realized that if they do something right, it will engage students at a level they maybe hadn’t seen before. And they’ll go, ‘Oh, this stuff actually works!’” (11/15/16).
• Teachers often over-prepared for lessons, and the first lessons always went longer than expected. This instructional style began to change toward a more seamless facilitation of learning. Beginning with the second lesson, and especially by the second year, teachers became comfortable with their ability to guide students through important aspects of the lesson without that guidance appearing scripted.
• Teachers with good classroom management—or teachers in well-managed school environments—fared better than those who had weak classroom management. Classroom management included student discipline, but extended to logistical elements of the lesson, such as how to pass out materials most efficiently and when to provide instructions for the activity.
• Individual teachers responded differently to interruptions or unexpected time delays. Some teachers were able to adjust more easily than others. Teachers who struggled were unwilling to give up their original plans or control over every aspect of the lesson.
• Teachers considered exemplars for how CEEMS improved instructional practice had the following characteristics in common:
o Teacher characteristics: Open to change and enthusiasm for growth or new ideas.
o School characteristics: Support from administrators. The most successful teachers worked in districts/schools where multiple teachers were part of CEEMS and administrators incorporated CEEMS into the curriculum explicitly.
Discovery Center for Evaluation, Research, and Professional Learning
Evaluation of CEEMS, Annual Report 2016-2017, Page 8
o Community characteristics: Ability to bring community resources into the curriculum, especially resources that required field trips.
Barriers to Change
• Two barriers to change were testing and time. District- and state-based standardized testing posed a barrier because teachers had to ensure CEEMS units—which were implemented over several days and could span more than one week—did not interfere with test preparation activities and testing days. Time posed a barrier for CEEMS Challenge lessons, in particular, because students did not always complete challenges in the time allotted.
• Compared to science teachers, math teachers tended to have the greater difficulties changing their styles from direct instruction to challenge-based learning.
• One challenge for teachers was willingness to make a mistake. The CEEMS program taught many teachers that making a mistake is part of the learning process, in the classroom and in the field of engineering. Being able to give up absolute control for a more open, student-guided process is the key to being successful with CEEMS.
Discovery Center for Evaluation, Research, and Professional Learning
Evaluation of CEEMS, Annual Report 2016-2017, Page 9
EQ 2 – In what ways did CEEMS Resource Team support for teachers change in the course of their participation in CEEMS?
Change in Resource Team Support
• Resource Team members experienced a learning curve that mirrored teachers’ learning curve in terms of developing the best strategies to help teachers move from direct instruction to challenge-based instruction.
• Resource Team member support improved every year through conscious efforts to learn from mistakes or previous experiences. Resource Team members were instrumental in suggesting and making improvements to the nature of their support. As a result, pedagogical guides for and expectations of CEEMS teachers changed over time.
• The role of Resource Team member involved more focus on pedagogy and classroom management than was previously expected. The original expectation among some Resource Team recruits was to focus more exclusively on helping teachers incorporate engineering content into the curriculum.
• Resource Team members improved their practice based on regular communication with one another. They benefitted from networking and troubleshooting as a group and were able to help one another solve problems.
• Individual Resource Team members made changes to improve communication, such as using Skype or Facetime instead of meeting as a big group or writing observations and using photos instead of filling out a standard checklist that did not fit every situation.
Insights from Former Teachers
• The Resource Team was key to the success of CEEMS. The Resource Team acted as a coaching team, and served as a mechanism to reinforce CEEMS expectations. That is, the fact that coaches would follow up in class to observe and support the implementation of the lesson was one means to ensure the lessons were implemented (i.e., oversight). They also served as a low-pressure evaluative resource, in that a Resource Team member was able to provide evaluative feedback that was not linked to teachers’ performance evaluations.
• Teaching can be a lonely profession, because teachers do not have others in their classrooms watching them teach very often. CEEMS placed a former teacher in a current teacher’s classroom, which was beneficial because it exposed struggling teachers to their weaknesses and reinforced to successful teachers that they were doing well.
• CEEMS can be a vehicle for teachers to build rapport with administrators. If teachers invite administrators to their classrooms to see, for example, final presentations, they can build positive associations with their administrators. In this way, administrators are present at times other than when the teacher is being evaluated or when someone is being disciplined.

Discovery Center for Evaluation, Research, and Professional Learning
Evaluation of CEEMS, Annual Report 2016-2017, Page 10
• It is important for teachers to develop new lessons for CEEMS, rather than simply to edit an existing lesson. “The best CEEMS units are the ones that started from scratch. The ones that they tried to take something they did before . . . the gravity of the lesson draws them back into doing it that standard way” (former teacher, 11/15/16).
• It is important for Resource Team members to stress the centrality of the math, science, and engineering learning that is intended to result from the lessons, not just the building activity. Sometimes a teacher’s intense focus on the building activity resulted in a lack of attention to the math, science, and engineering concepts behind the lesson. Students retained the most information when the content learning was incorporated into the hands-on activity effectively.
Insights from Former Engineers
• One key to successful CEEMS lesson implementation was that a teacher tried the experiment/activity prior to teaching the lesson to see if and how it worked.
• One barrier to implementation came when teachers expected students to already know how to use particular tools, such as drills or rulers. An important step in lesson preparation is for teachers to ensure students have experience with the specific tools that will be used in the lesson.
• Student creation of their own worksheets required skills that were more realistic and reflective of the actual world of engineering than the use of pre-fabricated worksheets.
• Former engineers were able to support students’ learning about careers because they talked to students about engineering as a career field and the education necessary to succeed in engineering.
• Part of the learning process for former engineers on the Resource Team was learning about the academic environment and the many, sometimes disparate, expectations teachers must meet (e.g., classroom discipline).
• Part of the learning process for former engineers was learning how to get comfortable interacting with students in the classroom.
Summary The aspect of teacher change that Resource Team members discussed most was an instructional shift from direct instruction and traditional, teacher-centered practices to facilitation of student-directed learning. Teachers and Resource Team members, alike, improved their skills at facilitation and incorporation of engineering design through experience and opportunities for reflection that were built into the program. For teachers, improvements toward facilitation of student-directed learning were most dramatic between the first and second CEEMS unit, and continued through the teacher’s second year with the program. For Resource Team members, improvements in the coaching supports provided to teachers resulted from trial and error and regular team discussions to troubleshoot and collectively develop solutions to the problems they experienced. The Resource Team also improved the coaching supports they provided to teachers by modifying elements of the process—such as

Discovery Center for Evaluation, Research, and Professional Learning
Evaluation of CEEMS, Annual Report 2016-2017, Page 11
materials or the method of communication—to better reflect their experiences and the needs of both teachers and Resource Team members. For teachers, change from teacher-directed toward teacher-facilitated and student-directed learning was not uniform. Teachers who were better able to relinquish control of every aspect of the lesson, who had access to networks of CEEMS teachers, whose school or district administrators supported CEEMS, and who taught in well-managed environments made the most progress toward engineering design-based, student-directed teaching. Classroom Observations, 2016-2017 Academic Year
Instrument To understand change in instructional practices, classroom observation data were collected through hand-written field notes and completion of the Inside the Classroom Observation and Analytic Protocol (Horizon Research Inc., 2000). This mixed methods protocol included sections that allowed observers to record basic information about the classroom—such as the subject and number of students—and then provide both quantitative ratings and narrative descriptions of important elements of the lesson. These elements included lesson purpose, focus, design, implementation, and content; classroom culture; time usage; likely impact on mathematics/science learning; specific lesson features; and overall lesson quality. Observers also provided a narrative description of what occurred during the observation. A copy of the observation instrument can be found in Appendix B.
Data Collection In Fall 2016, Evaluation Team member, Ms. Dixon, trained 4 CEEMS engineering fellows to conduct classroom observations using the Inside the Classroom Observation and Analytic Protocol. The training session involved an introduction to low-inference observation techniques, a detailed review of the protocol, discussion of the meaning of protocol items, and practice with the instrument using video-taped lessons. Data collection was completed by these 4 trained engineering fellows, and fellows provided completed observation protocols to the Evaluation Team for analysis. Fellows observed 104 lessons from 30 CEEMS teachers (cohorts 4 and 5) in the 2016-2017 academic year. Fellows collected a minimum of 1 and a maximum of 7 observations per teacher. Fellows observed non-CEEMS, CEEMS Introductory, and CEEMS Challenge lessons, although the number of lessons observed by type varied for each teacher. Non-CEEMS lessons were lessons that were not a part of a CEEMS unit. In CEEMS Introductory lessons, the teacher introduced a challenge students would work on for several lessons. In CEEMS Challenge lessons, the teacher engaged students in one or more stages of CEEMS challenge implementation. Classroom observation data were entered into an Excel spreadsheet to facilitate analysis.

Discovery Center for Evaluation, Research, and Professional Learning
Evaluation of CEEMS, Annual Report 2016-2017, Page 12
Quantitative Data Analysis The Evaluation Team designed analyses to take into account unevenness in the number of observations by lesson type for each teacher. First, the Evaluation Team used descriptive statistics (e.g., frequencies, percentages), one-way ANOVA, and Pearson’s chi-square tests to understand lesson features and similarities and differences in lesson ratings, by lesson type, for the full sample. Next, the Evaluation Team identified teachers with at least one observation for each lesson type (n=10). These data were analyzed using repeated-measures one-way ANOVA, with significant findings followed by Friedman Tests and paired-samples t-tests to identify which pair of lesson types were statistically significantly different. This sub-sample was identified to better understand the nature of change within individual teachers.
Qualitative Data Analysis To analyze qualitative classroom observation data, the original Excel database was uploaded to NVivo (version 11) data analysis software. In the first year of the evaluation, the Evaluation Team developed 9 qualitative codes deductively and 9 qualitative codes inductively. These 18 codes were applied to 2016-2017 classroom observation data, and codes were compared by lesson type for the full sample. Data from the 10 teachers with observations of all three lesson types were analyzed in depth to understand the relationship between instructional practices and lesson type. The qualitative code book can be found in Appendix C.
Findings
Quantitative Comparisons by Lesson Type Fellows observed 25 mathematics lessons and 79 science lessons in 19 schools across 8 districts. Lessons were observed in Grades 6-12. Table 2displays the number of lessons by lesson type, school type, and subject for the full sample.

Discovery Center for Evaluation, Research, and Professional Learning
Evaluation of CEEMS, Annual Report 2016-2017, Page 13
Table 2. Number of Lessons by Lesson Type, School Type, and Subject, Inside the Classroom Observation and Analytic Protocol, 2016-2017
Lesson Type School Type Subject Total Mathematics Science
Non-CEEMS Middle School 6 24 30 High School 4 8 12 Missing 0 3 3 Total 10 35 45
CEEMS Introductory
Middle School 5 16 21 High School 0 4 4 Total 5 20 25
CEEMS Challenge Middle School 3 18 21 High School 6 3 9 Missing 1 3 4 Total 10 24 34
Total Middle School 14 58 72 High School 10 15 25 Missing 1 6 7 Total 25 79 104
The Inside the Classroom Observation and Analytic Protocol included individual item ratings and synthesis ratings for four subscales: lesson design, lesson implementation, lesson content, and classroom culture. Each subscale contained 6 to 9 individual item ratings, with response options that ranged from 1 (“not at all”) to 5 (“to a great extent”). Response options also included “don’t know” and “Not Applicable) (response options 6 and 7). Each subscale contained one synthesis rating, with response options that ranged from 1 (“not at all reflective of best practice in mathematics/science education”) to 5 (“extremely reflective of best practice in mathematics/science education”).
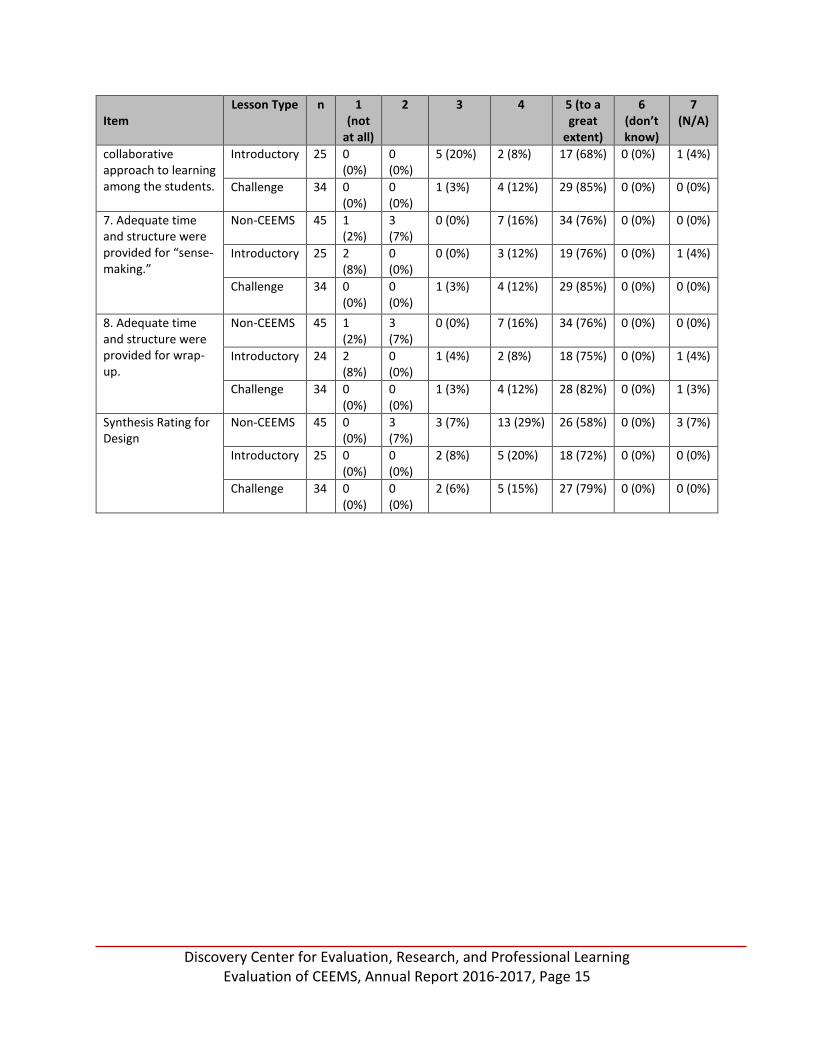
Table 3 and Table 4 provide comparisons of lesson ratings and the synthesis rating, by lesson type, for the Lesson Design subscale. In general across all lesson types, most lessons were rated highly on all individual items and overall. CEEMS Introductory and CEEMS Challenge lessons had significantly higher synthesis ratings for lesson design than Non-CEEMS lessons. Compared to Non-CEEMS lessons, CEEMS Challenge lessons had significantly higher ratings for having lesson designs that incorporated tasks, roles, and interactions consistent with investigative mathematics/science and encouraged a collaborative approach to learning among the students.

Discovery Center for Evaluation, Research, and Professional Learning
Evaluation of CEEMS, Annual Report 2016-2017, Page 14
Table 3. Lesson Design by Lesson Type, Rating Frequencies, Inside the Classroom Observation and Analytic Protocol, 2016-2017
Item Lesson Type n 1
(not at all)
2 3 4 5 (to a great
extent)
6 (don’t know)
7 (N/A)
1. The design of the lesson incorporated tasks, roles, and interactions consistent with investigative mathematics /science.
Non-CEEMS 45 4 (9%)
3 (7%)
11 (24%) 8 (18%) 16 (36%) 2 (4%) 1 (2%)
Introductory 25 3 (12%)
0 (0%)
3 (12%) 5 (20%) 14 (56%) 0 (0%) 0 (0%)
Challenge 34 2 (6%)
0 (0%)
3 (9%) 5 (15%) 24 (71%) 0 (0%) 0 (0%)
2. The design of the lesson reflected careful planning and organization.
Non-CEEMS 45 0 (0%)
2 (4%)
0 (0%) 12 (27%) 31 (69%) 0 (0%) 0 (0%)
Introductory 25 0 (0%)
1 (4%)
2 (8%) 4 (16%) 18 (72%) 0 (0%) 0 (0%)
Challenge 34 0 (0%)
0 (0%)
3 (9%) 5 (15%) 26 (76%) 0 (0%) 0 (0%)
3. The instructional strategies and activities used in this lesson reflected attention to students’ experience, preparedness, prior knowledge, and/or learning styles.
Non-CEEMS 45 0 (0%)
3 (7%)
2 (4%) 6 (13%) 34 (76%) 0 (0%) 0 (0%)
Introductory 25 0 (0%)
0 (0%)
1 (4%) 3 (12%) 21 (84%) 0 (0%) 0 (0%)
Challenge 34 0 (0%)
0 (0%)
2 (6%) 3 (9%) 29 (85%) 0 (0%) 0 (0%)
4. The resources available in this lesson contributed to accomplishing the purposes of the instruction.
Non-CEEMS 45 0 (0%)
2 (4%)
2 (4%) 6 (13%) 35 (78%) 0 (0%) 0 (0%)
Introductory 25 0 (0%)
0 (0%)
0 (0%) 3 (12%) 22 (88%) 0 (0%) 0 (0%)
Challenge 34 0 (0%)
0 (0%)
1 (3%) 3 (9%) 30 (88%) 0 (0%) 0 (0%)
5. The instructional strategies and activities reflected attention to issues of access, equity, and diversity for students (e.g., cooperative learning, language-appropriate strategies/materials)
Non-CEEMS 45 1 (2%)
3 (7%)
0 (0%) 6 (13%) 32 (71%) 2 (4%) 1 (2%)
Introductory 25 0 (0%)
0 (0%)
0 (0%) 1 (4%) 21 (84%) 3 (12%) 0 (0%)
Challenge 34 0 (0%)
0 (0%)
1 (3%) 3 (9%) 26 (76%) 4 (12%) 0 (0%)
6. The design of the lesson encouraged a
Non-CEEMS 45 2 (4%)
2 (4%)
8 (18%) 6 (13%) 27 (60%) 0 (0%) 0 (0%)
Discovery Center for Evaluation, Research, and Professional Learning
Evaluation of CEEMS, Annual Report 2016-2017, Page 15
Item Lesson Type n 1
(not at all)
2 3 4 5 (to a great
extent)
6 (don’t know)
7 (N/A)
collaborative approach to learning among the students.
Introductory 25 0 (0%)
0 (0%)
5 (20%) 2 (8%) 17 (68%) 0 (0%) 1 (4%)
Challenge 34 0 (0%)
0 (0%)
1 (3%) 4 (12%) 29 (85%) 0 (0%) 0 (0%)
7. Adequate time and structure were provided for “sense-making.”
Non-CEEMS 45 1 (2%)
3 (7%)
0 (0%) 7 (16%) 34 (76%) 0 (0%) 0 (0%)
Introductory 25 2 (8%)
0 (0%)
0 (0%) 3 (12%) 19 (76%) 0 (0%) 1 (4%)
Challenge 34 0 (0%)
0 (0%)
1 (3%) 4 (12%) 29 (85%) 0 (0%) 0 (0%)
8. Adequate time and structure were provided for wrap-up.
Non-CEEMS 45 1 (2%)
3 (7%)
0 (0%) 7 (16%) 34 (76%) 0 (0%) 0 (0%)
Introductory 24 2 (8%)
0 (0%)
1 (4%) 2 (8%) 18 (75%) 0 (0%) 1 (4%)
Challenge 34 0 (0%)
0 (0%)
1 (3%) 4 (12%) 28 (82%) 0 (0%) 1 (3%)
Synthesis Rating for Design
Non-CEEMS 45 0 (0%)
3 (7%)
3 (7%) 13 (29%) 26 (58%) 0 (0%) 3 (7%)
Introductory 25 0 (0%)
0 (0%)
2 (8%) 5 (20%) 18 (72%) 0 (0%) 0 (0%)
Challenge 34 0 (0%)
0 (0%)
2 (6%) 5 (15%) 27 (79%) 0 (0%) 0 (0%)

Discovery Center for Evaluation, Research, and Professional Learning
Evaluation of CEEMS, Annual Report 2016-2017, Page 16
Table 4. Lesson Design by Lesson Type, ANOVA Comparisons, Inside the Classroom Observation and Analytic Protocol, 2016-2017
Item Lesson Type n M SD p
1. The design of the lesson incorporated tasks, roles, and interactions consistent with investigative mathematics/science.
Non-CEEMSb 42 3.69 1.32 .037 Introductory 25 4.08 1.35 Challengeb 34 4.44 1.08
2. The design of the lesson reflected careful planning and organization.
Non-CEEMS 45 4.60 0.72 .814 Introductory 25 4.56 0.82 Challenge 34 4.68 0.64
3. The instructional strategies and activities used in this lesson reflected attention to students’ experience, preparedness, prior knowledge, and/or learning styles.
Non-CEEMS 45 4.58 0.87 .285 Introductory 25 4.80 0.50 Challenge 34 4.79 0.54
4. The resources available in this lesson contributed to accomplishing the purposes of the instruction
Non-CEEMS 45 4.64 0.77 .173 Introductory 25 4.88 0.33 Challenge 34 4.85 0.44
5. The instructional strategies and activities reflected attention to issues of access, equity, and diversity for students (e.g., cooperative learning, language-appropriate strategies/materials).
Non-CEEMS 42 4.55 0.99 .072
Introductory 22 4.95 0.21
Challenge 30 4.83 0.46
6. The design of the lesson encouraged a collaborative approach to learning among the students.
Non-CEEMSb 45 4.20 1.16 .012 Introductory 24 4.50 0.83 Challengeb 34 4.82 0.46
7. Adequate time and structure were provided for “sense-making.”
Non-CEEMS 45 4.56 0.97 .341 Introductory 24 4.54 1.14 Challenge 34 4.82 0.46
8. Adequate time and structure were provided for wrap-up.
Non-CEEMS 45 4.56 0.97 .307 Introductory 23 4.48 1.20 Challenge 33 4.82 0.46
Synthesis rating: extent to which content reflects best practices
Non-CEEMSab 44 4.34 0.83 <.001 Introductorya 25 4.96 0.20 Challengeb 34 4.82 0.39
Note: p values were calculated using one-way ANOVA. a indicates significant differences between Non-CEEMs and Introductory b indicates significant differences between Non-CEEMs and Challenge c indicates significant differences between Introductory and Challenge

Discovery Center for Evaluation, Research, and Professional Learning
Evaluation of CEEMS, Annual Report 2016-2017, Page 17
Table 5 and Table 6 provide comparisons of lesson ratings and the synthesis rating, by lesson type, for the Lesson Implementation subscale. Ratings for the implementation of lessons were, for the most part, consistently high across lesson types. Compared to Non-CEEMS lessons, both CEEMS Introductory and CEEMS Challenge lessons had significantly higher ratings for having instructional strategies consistent with investigative mathematics/science. Table 5. Lesson Implementation by Lesson Type, Rating Frequencies, Inside the Classroom Observation and Analytic Protocol, 2016-2017
Item Lesson Type n 1 (not at all)
2 3 4 5 (to a great
extent)
6 (don’t know)
7 (N/A)
1. The instructional strategies were consistent with investigative mathematics /science.
Non-CEEMS 45 0 (0%) 2 (4%)
14 (31%)
6 (13%) 23 (51%) 0 (0%) 0 (0%)
Introductory 25 0 (0%) 0 (0%)
1 (4%) 5 (20%) 19 (76%) 0 (0%) 0 (0%)
Challenge 34 0 (0%) 0 (0%)
5 (15%)
2 (6%) 27 (79%) 0 (0%) 0 (0%)
2. The teacher appeared confident in his/her ability to teach mathematics /science.
Non-CEEMS 45 0 (0%) 1 (2%)
1 (2%) 1 (2%) 42 (93%) 0 (0%) 0 (0%)
Introductory 25 0 (0%) 0 (0%)
0 (0%) 1 (4%) 22 (88%) 0 (0%) 2 (8%)
Challenge 34 0 (0%) 0 (0%)
3 (9%) 3 (9%) 28 (82%) 0 (0%) 0 (0%)
3. The teacher’s classroom management style/strategies enhanced the quality of the lesson.
Non-CEEMS 45 0 (0%) 1 (2%)
1 (2%) 1 (2%) 42 (93%) 0 (0%) 0 (0%)
Introductory 25 0 (0%) 1 (4%)
1 (4%) 1 (4%) 22 (88%) 0 (0%) 0 (0%)
Challenge 34 0 (0%) 0 (0%)
3 (9%) 4 (12%) 27 (79%) 0 (0%) 0 (0%)
4. The pace of the lesson was appropriate for the developmental levels/needs of the students and the purposes of the lesson.
Non-CEEMS 45 0 (0%) 1 (2%)
2 (4%) 3 (7%) 39 (87%) 0 (0%) 0 (0%)
Introductory 25 0 (0%) 0 (0%)
3 (12%)
2 (8%) 20 (80%) 0 (0%) 0 (0%)
Challenge 34 0 (0%) 0 (0%)
2 (6%) 4 (12%) 28 (82%) 0 (0%) 0 (0%)
5. The teacher was able to “read” the students’ level of understanding and adjusted instruction accordingly.
Non-CEEMS 45 0 (0%) 1 (2%)
2 (4%) 2 (4%) 40 (89%) 0 (0%) 0 (0%)
Introductory 25 0 (0%) 0 (0%)
1 (4%) 1 (4%) 21 (84%) 0 (0%) 2 (8%)
Challenge 34 0 (0%) 0 (0%)
4 (12%)
1 (3%) 29 (85%) 0 (0%) 0 (0%)
6. The teacher’s questioning strategies were likely to enhance
Non-CEEMS 45 0 (0%) 2 (4%)
7 (16%)
6 (13%) 30 (67%) 0 (0%) 0 (0%)
Discovery Center for Evaluation, Research, and Professional Learning
Evaluation of CEEMS, Annual Report 2016-2017, Page 18
Item Lesson Type n 1 (not at all)
2 3 4 5 (to a great
extent)
6 (don’t know)
7 (N/A)
the development of student conceptual understanding/problem solving (e.g., emphasized higher order questions, appropriately used “wait time,” identified prior conceptions and misconceptions).
Introductory 25 0 (0%) 0 (0%)
4 (16%)
2 (8%) 19 (76%) 0 (0%) 0 (0%)
Challenge 34 0 (0%) 0 (0%)
3 (9%) 4 (12%) 27 (79%) 0 (0%) 0 (0%)
Synthesis Rating for Design
Non-CEEMS 45 0 (0%) 1 (2%)
3 (7%) 8 (18%) 33 (73%) 0 (0%) 1 (2%)
Introductory 25 0 (0%) 0 (0%)
1 (4%) 4 (16%) 20 (80%) 0 (0%) 0 (0%)
Challenge 34 0 (0%) 1 (3%)
4 (12%)
3 (9%) 26 (76%) 0 (0%) 1 (3%)
Discovery Center for Evaluation, Research, and Professional Learning
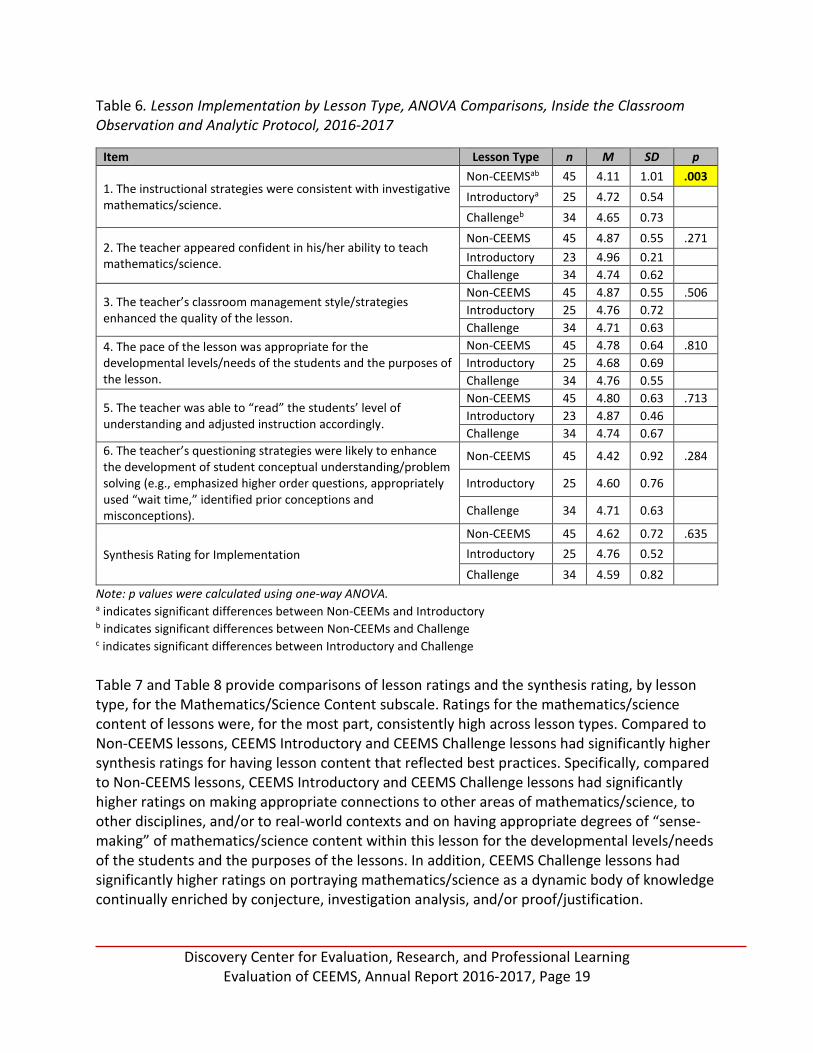
Evaluation of CEEMS, Annual Report 2016-2017, Page 19
Table 6. Lesson Implementation by Lesson Type, ANOVA Comparisons, Inside the Classroom Observation and Analytic Protocol, 2016-2017
Item Lesson Type n M SD p
1. The instructional strategies were consistent with investigative mathematics/science.
Non-CEEMSab 45 4.11 1.01 .003 Introductorya 25 4.72 0.54 Challengeb 34 4.65 0.73
2. The teacher appeared confident in his/her ability to teach mathematics/science.
Non-CEEMS 45 4.87 0.55 .271 Introductory 23 4.96 0.21 Challenge 34 4.74 0.62
3. The teacher’s classroom management style/strategies enhanced the quality of the lesson.
Non-CEEMS 45 4.87 0.55 .506 Introductory 25 4.76 0.72 Challenge 34 4.71 0.63
4. The pace of the lesson was appropriate for the developmental levels/needs of the students and the purposes of the lesson.
Non-CEEMS 45 4.78 0.64 .810 Introductory 25 4.68 0.69 Challenge 34 4.76 0.55
5. The teacher was able to “read” the students’ level of understanding and adjusted instruction accordingly.
Non-CEEMS 45 4.80 0.63 .713 Introductory 23 4.87 0.46 Challenge 34 4.74 0.67
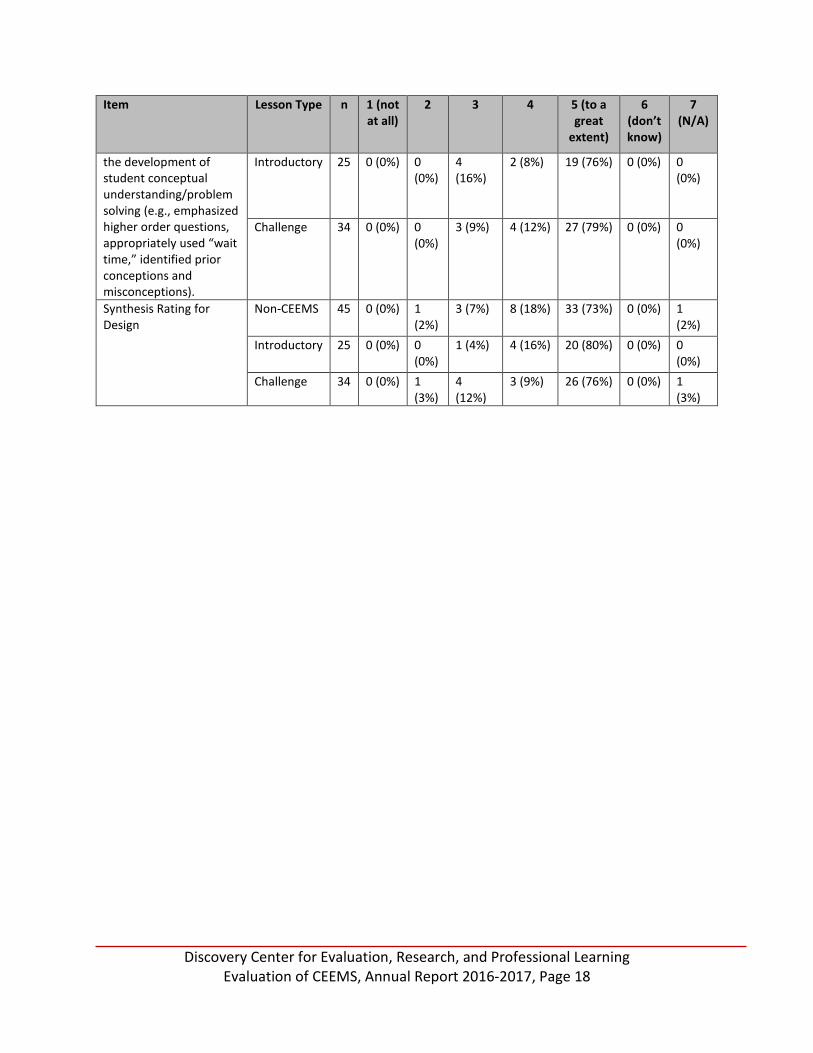
6. The teacher’s questioning strategies were likely to enhance the development of student conceptual understanding/problem solving (e.g., emphasized higher order questions, appropriately used “wait time,” identified prior conceptions and misconceptions).
Non-CEEMS 45 4.42 0.92 .284
Introductory 25 4.60 0.76
Challenge 34 4.71 0.63
Synthesis Rating for Implementation
Non-CEEMS 45 4.62 0.72 .635 Introductory 25 4.76 0.52 Challenge 34 4.59 0.82
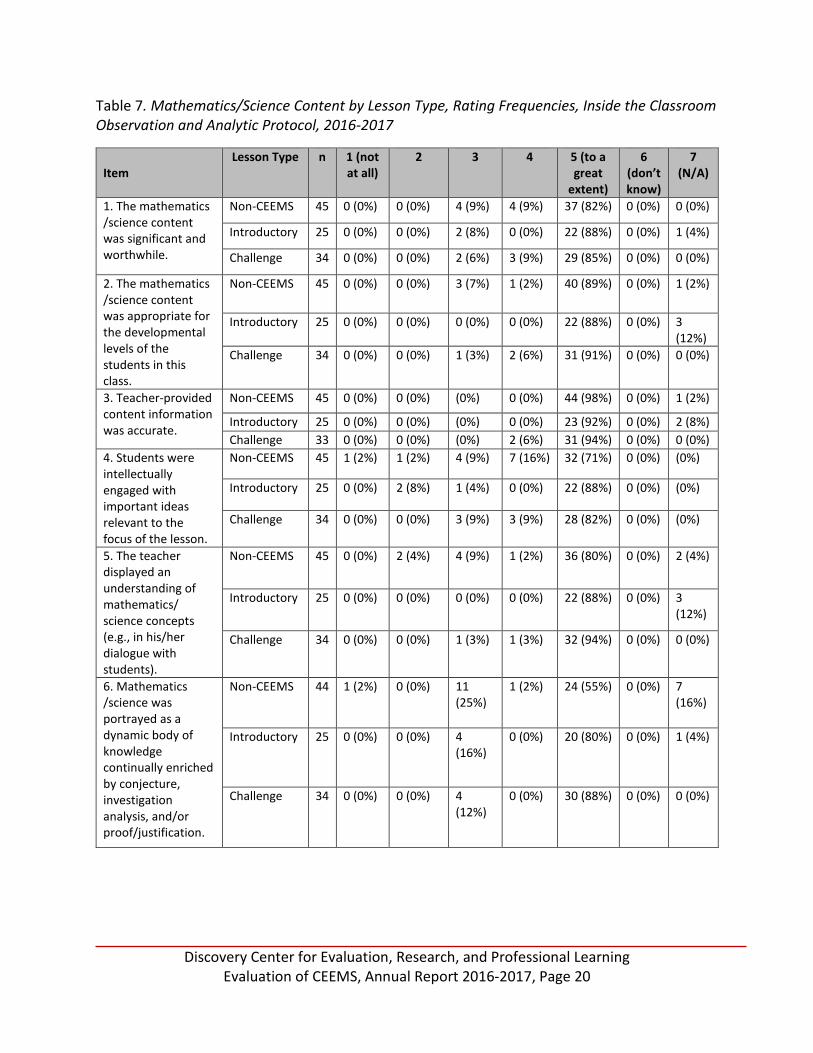
Note: p values were calculated using one-way ANOVA. a indicates significant differences between Non-CEEMs and Introductory b indicates significant differences between Non-CEEMs and Challenge c indicates significant differences between Introductory and Challenge Table 7 and Table 8 provide comparisons of lesson ratings and the synthesis rating, by lesson type, for the Mathematics/Science Content subscale. Ratings for the mathematics/science content of lessons were, for the most part, consistently high across lesson types. Compared to Non-CEEMS lessons, CEEMS Introductory and CEEMS Challenge lessons had significantly higher synthesis ratings for having lesson content that reflected best practices. Specifically, compared to Non-CEEMS lessons, CEEMS Introductory and CEEMS Challenge lessons had significantly higher ratings on making appropriate connections to other areas of mathematics/science, to other disciplines, and/or to real-world contexts and on having appropriate degrees of “sense-making” of mathematics/science content within this lesson for the developmental levels/needs of the students and the purposes of the lessons. In addition, CEEMS Challenge lessons had significantly higher ratings on portraying mathematics/science as a dynamic body of knowledge continually enriched by conjecture, investigation analysis, and/or proof/justification.
Discovery Center for Evaluation, Research, and Professional Learning
Evaluation of CEEMS, Annual Report 2016-2017, Page 20
Table 7. Mathematics/Science Content by Lesson Type, Rating Frequencies, Inside the Classroom Observation and Analytic Protocol, 2016-2017
Item Lesson Type n 1 (not
at all) 2 3 4 5 (to a
great extent)
6 (don’t know)
7 (N/A)
1. The mathematics /science content was significant and worthwhile.
Non-CEEMS 45 0 (0%) 0 (0%) 4 (9%) 4 (9%) 37 (82%) 0 (0%) 0 (0%)
Introductory 25 0 (0%) 0 (0%) 2 (8%) 0 (0%) 22 (88%) 0 (0%) 1 (4%)
Challenge 34 0 (0%) 0 (0%) 2 (6%) 3 (9%) 29 (85%) 0 (0%) 0 (0%)
2. The mathematics /science content was appropriate for the developmental levels of the students in this class.
Non-CEEMS 45 0 (0%) 0 (0%) 3 (7%) 1 (2%) 40 (89%) 0 (0%) 1 (2%)
Introductory 25 0 (0%) 0 (0%) 0 (0%) 0 (0%) 22 (88%) 0 (0%) 3 (12%)
Challenge 34 0 (0%) 0 (0%) 1 (3%) 2 (6%) 31 (91%) 0 (0%) 0 (0%)
3. Teacher-provided content information was accurate.
Non-CEEMS 45 0 (0%) 0 (0%) (0%) 0 (0%) 44 (98%) 0 (0%) 1 (2%)
Introductory 25 0 (0%) 0 (0%) (0%) 0 (0%) 23 (92%) 0 (0%) 2 (8%) Challenge 33 0 (0%) 0 (0%) (0%) 2 (6%) 31 (94%) 0 (0%) 0 (0%)
4. Students were intellectually engaged with important ideas relevant to the focus of the lesson.
Non-CEEMS 45 1 (2%) 1 (2%) 4 (9%) 7 (16%) 32 (71%) 0 (0%) (0%)
Introductory 25 0 (0%) 2 (8%) 1 (4%) 0 (0%) 22 (88%) 0 (0%) (0%)
Challenge 34 0 (0%) 0 (0%) 3 (9%) 3 (9%) 28 (82%) 0 (0%) (0%)
5. The teacher displayed an understanding of mathematics/ science concepts (e.g., in his/her dialogue with students).
Non-CEEMS 45 0 (0%) 2 (4%) 4 (9%) 1 (2%) 36 (80%) 0 (0%) 2 (4%)
Introductory 25 0 (0%) 0 (0%) 0 (0%) 0 (0%) 22 (88%) 0 (0%) 3 (12%)
Challenge 34 0 (0%) 0 (0%) 1 (3%) 1 (3%) 32 (94%) 0 (0%) 0 (0%)
6. Mathematics /science was portrayed as a dynamic body of knowledge continually enriched by conjecture, investigation analysis, and/or proof/justification.
Non-CEEMS 44 1 (2%) 0 (0%) 11 (25%)
1 (2%) 24 (55%) 0 (0%) 7 (16%)
Introductory 25 0 (0%) 0 (0%) 4 (16%)
0 (0%) 20 (80%) 0 (0%) 1 (4%)
Challenge 34 0 (0%) 0 (0%) 4 (12%)
0 (0%) 30 (88%) 0 (0%) 0 (0%)

Discovery Center for Evaluation, Research, and Professional Learning
Evaluation of CEEMS, Annual Report 2016-2017, Page 21
Item Lesson Type n 1 (not
at all) 2 3 4 5 (to a
great extent)
6 (don’t know)
7 (N/A)
7. Elements of mathematical /science abstraction (e.g., symbolic representations, theory building) were included when it was important to do so.
Non-CEEMS 44 0 (0%) 0 (0%) 8 (18%)
7 (16%)
24 (55%)
0 (0%) 5 (11%)
Introductory 25 0 (0%) 0 (0%) 4 (16%)
0 (0%)
20 (80%)
0 (0%) 1 (4%)
Challenge 33 0 (0%) 0 (0%) 3 (9%) 2 (6%)
28 (85%)
0 (0%) 0 (0%)
8. Appropriate connections were made to other areas of mathematics /science, to other disciplines, and/or to real-world contexts.
Non-CEEMS 44 1 (2%) 2 (5%) 4 (9%) 6 (14%)
26 (59%)
0 (0%) 5 (11%)
Introductory 25 0 (0%) 0 (0%) 1 (4%) 0 (0%)
24 (96%)
0 (0%) 0 (0%)
Challenge 33 0 (0%) 0 (0%) 1 (3%) 2 (6%)
30 (91%)
0 (0%) 0 (0%)
9. The degree of “sense-making” of mathematics/science content within this lesson was appropriate for the developmental levels/needs of the students and the purposes of the lesson.
Non-CEEMS 45 0 (0%) 1 (2%) 8 (18%)
2 (4%)
33 (73%)
0 (0%) 1 (2%)
Introductory 25 0 (0%) 0 (0%) 0 (0%) 1 (4%)
22 (88%)
0 (0%) 2 (8%)
Challenge 34 0 (0%) 0 (0%) 0 (0%) 2 (6%)
32 (94%)
0 (0%) 0 (0%)
Synthesis Rating for Mathematics /Science Content
Non-CEEMS 45 0 (0%) 1 (2%) 7 (16%)
12 (27%)
24 (55%)
0 (0%) 1 (2%)
Introductory 25 0 (0%) 0 (0%) 0 (0%) 1 (4%)
24 (96%)
0 (0%) 0 (0%)
Challenge 34 0 (0%) 0 (0%) 0 (0%) 6 (18%)
28 (82%)
0 (0%) 0 (0%)

Discovery Center for Evaluation, Research, and Professional Learning
Evaluation of CEEMS, Annual Report 2016-2017, Page 22
Table 8. Lesson Content by Lesson Type, ANOVA Comparisons, Inside the Classroom Observation and Analytic Protocol, 2016-2017
Item Lesson Type n M SD p
1. The mathematics/science content was significant and worthwhile
Non-CEEMS 45 4.73 0.62 .775 Introductory 24 4.83 0.56 Challenge 34 4.79 0.54
2. The mathematics/science content was appropriate for the developmental levels of the students in this class.
Non-CEEMS 44 4.84 0.53 .357 Introductory 22 5.00 0.00 Challenge 34 4.88 0.41
3. Teacher-provided content information was accurate. Non-CEEMS 44 5.00 0.00 .128 Introductory 23 5.00 0.00 Challenge 33 4.94 0.24
4. Students were intellectually engaged with important ideas relevant to the focus of the lesson.
Non-CEEMS 45 4.51 0.92 .460 Introductory 25 4.68 0.90 Challenge 34 4.74 0.62
5. The teacher displayed an understanding of mathematics/science concepts (e.g., in his/her dialogue with students).
Non-CEEMS 43 4.65 0.84 .050 Introductory 22 5.00 0.00 Challenge 34 4.91 0.38
6. Mathematics/science was portrayed as a dynamic body of knowledge continually enriched by conjecture, investigation analysis, and/or proof/justification.
Non-CEEMSb 37 4.27 1.07 .045 Introductory 24 4.67 0.76 Challengeb 34 4.76 0.65
7. Elements of mathematical/science abstraction (e.g., symbolic representations, theory building) were included when it was important to do so.
Non-CEEMS 39 4.41 0.82 .125 Introductory 24 4.67 0.76 Challenge 33 4.76 0.61
8. Appropriate connections were made to other areas of mathematics/science, to other disciplines, and/or to real-world contexts.
Non-CEEMSab 39 4.38 1.04 .005 Introductorya 25 4.92 0.40 Challengeb 33 4.88 0.42
9. The degree of “sense-making” of mathematics/science content within this lesson was appropriate for the developmental levels/needs of the students and the purposes of the lesson.
Non-CEEMSab 44 4.52 0.88 .003
Introductorya 23 4.96 0.21 Challengeb 34 4.94 0.24
Synthesis rating: extent to which content reflects best practices.
Non-CEEMSab 44 4.34 0.83 <.001 Introductorya 25 4.96 0.20 Challengeb 34 4.82 0.39
Note: p values were calculated using one-way ANOVA. a indicates significant differences between Non-CEEMs and Introductory b indicates significant differences between Non-CEEMs and Challenge c indicates significant differences between Introductory and Challenge Table 9 and Table 10 provide comparisons of lesson ratings and the synthesis rating, by lesson type, for the Classroom Culture subscale. Ratings for the classroom culture of lessons were, for the most part, consistently high across lesson types. Compared to Non-CEEMS lessons, CEEMS Challenge lessons had significantly higher ratings on having intellectual rigor, constructive criticism, and the challenging of ideas.

Discovery Center for Evaluation, Research, and Professional Learning
Evaluation of CEEMS, Annual Report 2016-2017, Page 23
Table 9. Classroom Culture by Lesson Type, Rating Frequencies, Inside the Classroom Observation and Analytic Protocol, 2016-2017
Item Lesson Type n 1 (not at all)
2 3 4 5 (to a great
extent)
6 (don’t know)
7 (N/A)
1. Active participation of all was encouraged and valued.
Non-CEEMS 45 0 (0%) 0 (0%) 0 (0%) 1 (2%) 43 (96%) 0 (0%) 1 (2%)
Introductory 25 0 (0%) 0 (0%) 1 (4%) 1 (4%) 23 (92%) 0 (0%) 0 (0%)
Challenge 34 0 (0%) 0 (0%) 0 (0%) 0 (0%) 34 (100%) 0 (0%) 0 (0%)
2. There was a climate of respect for students’ ideas, questions, and contributions.
Non-CEEMS 45 0 (0%) 0 (0%) 0 (0%) 0 (0%) 44 (98%) 0 (0%) 1 (2%)
Introductory 25 0 (0%) 0 (0%) 1 (4%) 1 (4%) 23 (92%) 0 (0%) 0 (0%)
Challenge 34 0 (0%) 0 (0%) 0 (0%) 0 (0%) 34 (100%) 0 (0%) 0 (0%)
3. Interactions reflected collegial working relationships among students (e.g., students worked together, talked with each other about the lesson).
Non-CEEMS 45 0 (0%) 1 (2%) 0 (0%) 4 (9%) 39 (87%) 0 (0%) 1 (2%)
Introductory 25 0 (0%) 0 (0%) 2 (8%) 2 (8%) 21 (84%) 0 (0%) 0 (0%)
Challenge 34 0 (0%) 0 (0%) 1 (3%) 1 (3%) 32 (94%) 0 (0%) 0 (0%)
4. Interactions reflected collaborative working relationships between teacher and students.
Non-CEEMS 45 0 (0%) 0 (0%) 0 (0%) 2 (4%) 42 (93%) 0 (0%) 1 (2%)
Introductory 25 0 (0%) 0 (0%) 2 (8%) 2 (8%) 21 (84%) 0 (0%) 0 (0%)
Challenge 34 0 (0%) 0 (0%) 0 (0%) 1 (3%) 33 (97%) 0 (0%) 0 (0%)
5. The climate of the lesson encouraged students to generate ideas, questions, conjectures, and/or propositions.
Non-CEEMS 45 1 (2%) 0 (0%) 8 (18%) 2 (4%) 34 (76%) 0 (0%) (0%)
Introductory 25 0 (0%) 0 (0%) 1 (4%) 4 (16%) 20 (80%) 0 (0%) (0%)
Challenge 34 0 (0%) 0 (0%) 2 (6%) 0 (0%) 32 (94%) 0 (0%) (0%)
6. Intellectual rigor,
Non-CEEMS 45 1 (2%) 1 (2%) 11 (24%) 3 (7%) 27 (60%) 0 (0%) 2 (4%)

Discovery Center for Evaluation, Research, and Professional Learning
Evaluation of CEEMS, Annual Report 2016-2017, Page 24
Item Lesson Type n 1 (not at all)
2 3 4 5 (to a great
extent)
6 (don’t know)
7 (N/A)
constructive criticism, and the challenging of ideas were evident.
Introductory 25 0 (0%) 1 (4%) 3 (12%) 2 (8%) 17 (68%) 0 (0%) 2 (8%)
Challenge 34 0 (0%) 0 (0%) 3 (9%) 0 (0%) 31 (91%) 0 (0%) 0 (0%)
Synthesis Rating for Classroom Culture
Non-CEEMS 45 0 (0%) 0 (0%) 1 (2%) 9 (20%) 35 (78%) (0%) (0%) Introductory 25 0 (0%) 2 (8%) 1 (4%) 4 (16%) 18 (72%) (0%) (0%) Challenge 34 0 (0%) 1 (3%) 0 (0%) 3 (9%) 30 (88%) (0%) (0%)
Table 10. Classroom Culture by Lesson Type, ANOVA Comparisons, Inside the Classroom Observation and Analytic Protocol, 2016-2017
Note: p values were calculated using one-way ANOVA. a indicates significant differences between Non-CEEMs and Introductory b indicates significant differences between Non-CEEMs and Challenge c indicates significant differences between Introductory and Challenge The classroom observation protocol included a subscale with item ratings for the lesson’s likely impact on students’ learning of mathematics/science. This subscale included response options
Item Lesson Type n M SD p
1. Active participation of all was encouraged and valued. Non-CEEMS 44 4.98 0.15 .138 Introductory 25 4.88 0.44 Challenge 34 5.00 0.00
2. There was a climate of respect for students’ ideas, questions, and contributions
Non-CEEMS 44 5.00 0.00 .058 Introductory 25 4.88 0.44 Challenge 34 5.00 0.00
3. Interactions reflected collegial working relationships among students (e.g., students worked together, talked with each other about the lesson).
Non-CEEMS 44 4.84 0.53 .519
Introductory 25 4.76 0.60
Challenge 34 4.91 0.38
4. Interactions reflected collaborative working relationships between teacher and students.
Non-CEEMS 44 4.95 0.21 .038 Introductory 25 4.76 0.60 Challenge 34 4.97 0.17
5. The climate of the lesson encouraged students to generate ideas, questions, conjectures, and/or propositions
Non-CEEMS 45 4.51 0.94 .074 Introductory 25 4.76 0.52 Challenge 34 4.88 0.48
6. Intellectual rigor, constructive criticism, and the challenging of ideas were evident.
Non-CEEMSb 43 4.26 1.07 .024 Introductory 23 4.52 0.90 Challengeb 34 4.82 0.58
Synthesis rating: extent to which classroom culture reflects best practices
Non-CEEMS 45 4.76 0.48 .183 Introductory 25 4.52 0.92 Challenge 34 4.82 0.58

Discovery Center for Evaluation, Research, and Professional Learning
Evaluation of CEEMS, Annual Report 2016-2017, Page 25
that ranged from 1 (“negative effect”) to 5 (“positive effect”). Response options also included “don’t know” and “Not Applicable (response options 6 and 7). Table 11 and Table 12 provide comparisons, by lesson type, for this subscale. Ratings for the likely impact of lessons on student learning were, for the most part, consistently high across lesson types. Compared to Non-CEEMS lessons, CEEMS Challenge lessons had a significantly higher impact on students’ capacities to carry out their own inquiries and to apply or generalize skills and concepts to other areas of mathematics/science, other disciplines, and/or real-life situations. Table 11. Likely Impact of Instruction on Student Learning by Lesson Type, Rating Percentages, Inside the Classroom Observation and Analytic Protocol, 2016-2017
Likely Impact of Lesson On . . . Lesson Type n Negative Effect (1&2)
Mixed or Neutral
Effect (3)
Positive Effect (4&5)
Don't Know
or N/A
a. Students’ understanding of mathematics/science as a dynamic body of knowledge generated and enriched by investigation.
Non-CEEMS 45 1 (2%) 10 (22%) 34 (76%) 0 (0%)
Introductory 25 0 (0%) 6 (24%) 18 (72%) 1 (4%)
Challenge 34 0 (0%) 3 (9%) 31 (91%) 0 (0%)
b. Students’ understanding of important mathematics/science concepts.
Non-CEEMS 45 1 (2%) 3 (7%) 40 (89%) 1 (2%)
Introductory 25 0 (0%) 5 (20%) 19 (76%) 1 (4%)
Challenge 34 0 (0%) 1 (3%) 33 (97%) 0 (0%)
c. Students’ capacity to carry out their own inquiries.
Non-CEEMS 45 2 (4%) 12 (27%) 29 (64%) 2 (4%) Introductory 25 0 (0%) 3 (12%) 22 (88%) 0 (0%) Challenge 34 0 (0%) 3 (9%) 31 (91%) 0 (0%)
d. Students’ ability to apply or generalize skills and concepts to other areas of mathematics/science, other disciplines, and/or real-life situations.
Non-CEEMS 45 4 (9%) 12 (27%) 29 (64%) 0 (0%)
Introductory 25 0 (0%) 4 (16%) 21 (84%) 0 (0%)
Challenge 34 0 (0%) 3 (9%) 31 (91%) 0 (0%)
e. Students’ self-confidence in doing mathematics/science.
Non-CEEMS 45 1 (2%) 7 (16%) 36 (80%) 1 (2%) Introductory 25 0 (0%) 5 (20%) 20 (80%) 0 (0%) Challenge 34 1 (3%) 2 (6%) 31 (91%) 0 (0%)
f. Students’ interest in and/or appreciation for the discipline.
Non-CEEMS 45 1 (2%) 6 (13%) 38 (84%) 0 (0%) Introductory 25 0 (0%) 4 (16%) 21 (84%) 0 (0%) Challenge 34 1 (3%) 2 (6%) 31 (91%) 0 (0%)

Discovery Center for Evaluation, Research, and Professional Learning
Evaluation of CEEMS, Annual Report 2016-2017, Page 26
Table 12. Likely Impact of Instruction on Student Learning by Lesson Type, ANOVA Comparisons, Inside the Classroom Observation and Analytic Protocol, 2016-2017
Likely Impact of Lesson On . . . Lesson Type n M SD p a. Students’ understanding of mathematics/science as a dynamic body of knowledge generated and enriched by investigation
Non-CEEMS 45 4.31 0.90 .103 Introductory 24 4.42 0.88 Challenge 34 4.71 0.63
b. Students’ understanding of important mathematics/science concepts.
Non-CEEMS 44 4.64 0.72 .263 Introductory 24 4.50 0.83 Challenge 34 4.79 0.48
c. Students’ capacity to carry out their own inquiries. Non-CEEMSb 43 4.19 1.01 .007 Introductory 25 4.64 0.70 Challengeb 34 4.76 0.61
d. Students’ ability to apply or generalize skills and concepts to other areas of mathematics/science, other disciplines, and/or real-life situations
Non-CEEMSb 45 4.09 1.08 .008 Introductory 25 4.52 0.77 Challengeb 34 4.71 0.63
e. Students’ self-confidence in doing mathematics/science. Non-CEEMS 44 4.39 0.84 .174 Introductory 25 4.40 0.82 Challenge 34 4.71 0.72
f. Students’ interest in and/or appreciation for the discipline.
Non-CEEMS 45 4.40 0.81 .214 Introductory 25 4.48 0.77 Challenge 34 4.71 0.72
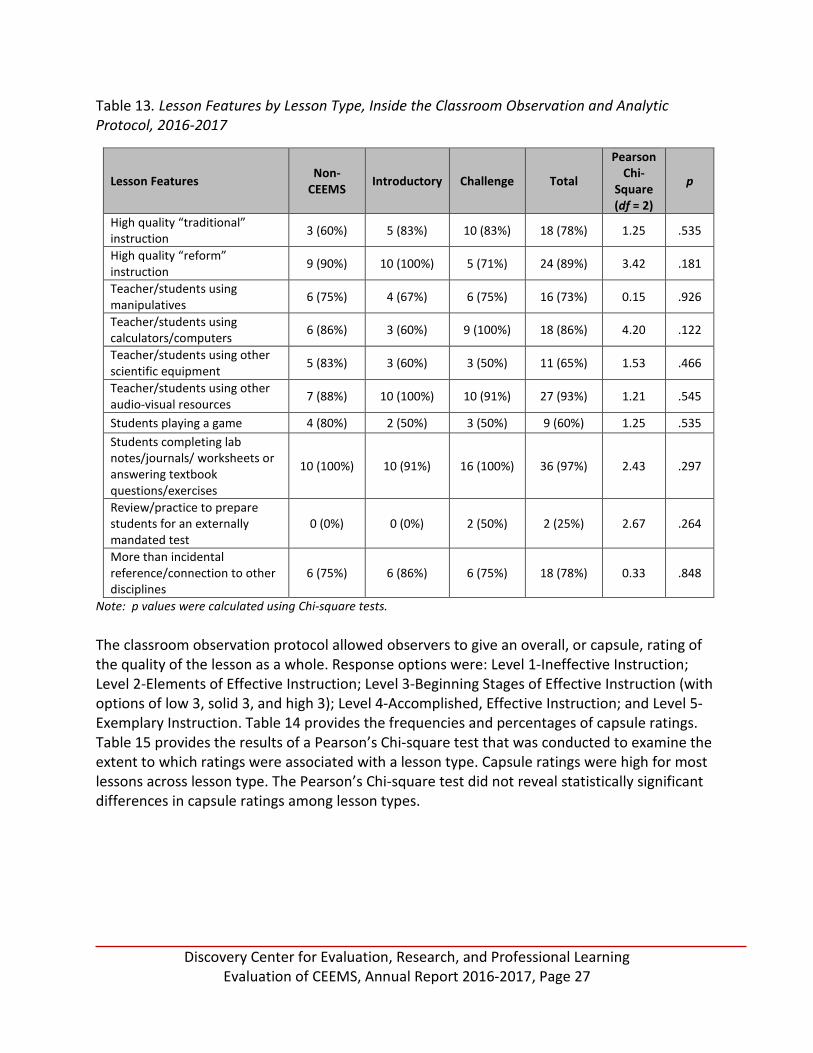
Note: p values were calculated using one-way ANOVA. a indicates significant differences between Non-CEEMs and Introductory b indicates significant differences between Non-CEEMs and Challenge c indicates significant differences between Introductory and Challenge The classroom observation protocol allowed observers to indicate whether or not specific features were observed during the lesson. Table 13 provides the frequencies and percentages of ratings for each lesson feature and the results of a Pearson’s chi-square test that was conducted to examine the extent to which specific lesson features were associated with different lesson types. A range of lesson features were observed in all lesson types. There were no statistically significant findings to suggest that any particular lesson feature was associated with any lesson type to a greater extent than with any other lesson type.
Discovery Center for Evaluation, Research, and Professional Learning
Evaluation of CEEMS, Annual Report 2016-2017, Page 27
Table 13. Lesson Features by Lesson Type, Inside the Classroom Observation and Analytic Protocol, 2016-2017
Lesson Features Non-CEEMS Introductory Challenge Total
Pearson Chi-
Square (df = 2)
p
High quality “traditional” instruction 3 (60%) 5 (83%) 10 (83%) 18 (78%) 1.25 .535
High quality “reform” instruction 9 (90%) 10 (100%) 5 (71%) 24 (89%) 3.42 .181
Teacher/students using manipulatives 6 (75%) 4 (67%) 6 (75%) 16 (73%) 0.15 .926
Teacher/students using calculators/computers 6 (86%) 3 (60%) 9 (100%) 18 (86%) 4.20 .122
Teacher/students using other scientific equipment 5 (83%) 3 (60%) 3 (50%) 11 (65%) 1.53 .466
Teacher/students using other audio-visual resources 7 (88%) 10 (100%) 10 (91%) 27 (93%) 1.21 .545
Students playing a game 4 (80%) 2 (50%) 3 (50%) 9 (60%) 1.25 .535 Students completing lab notes/journals/ worksheets or answering textbook questions/exercises
10 (100%) 10 (91%) 16 (100%) 36 (97%) 2.43 .297
Review/practice to prepare students for an externally mandated test
0 (0%) 0 (0%) 2 (50%) 2 (25%) 2.67 .264
More than incidental reference/connection to other disciplines
6 (75%) 6 (86%) 6 (75%) 18 (78%) 0.33 .848
Note: p values were calculated using Chi-square tests. The classroom observation protocol allowed observers to give an overall, or capsule, rating of the quality of the lesson as a whole. Response options were: Level 1-Ineffective Instruction; Level 2-Elements of Effective Instruction; Level 3-Beginning Stages of Effective Instruction (with options of low 3, solid 3, and high 3); Level 4-Accomplished, Effective Instruction; and Level 5-Exemplary Instruction. Table 14 provides the frequencies and percentages of capsule ratings. Table 15 provides the results of a Pearson’s Chi-square test that was conducted to examine the extent to which ratings were associated with a lesson type. Capsule ratings were high for most lessons across lesson type. The Pearson’s Chi-square test did not reveal statistically significant differences in capsule ratings among lesson types.

Discovery Center for Evaluation, Research, and Professional Learning
Evaluation of CEEMS, Annual Report 2016-2017, Page 28
Table 14. Capsule Ratings by Lesson Type, Frequencies and Percentages, Inside the Classroom Observation and Analytic Protocol, 2016-2017
Capsule Rating of the Quality of the Lesson Challenge Introductory Non-CEEMS Total Level 2 0 (0%) 0 (0%) 1 (3%) 1 (1%)
Level 3 Low 3 0 (0%) 0 (0%) 2 (5%) 2 (2%) Level 3 Solid 3 2 (6%) 2 (9%) 2 (5%) 6 (6%) Level 3 High 3 5 (15%) 3 (13%) 6 (15%) 14 (15%) Level 4 1 (3%) 7 (30%) 10 (26%) 18 (19%) Level 5 26 (76%) 11 (48%) 18 (46%) 55 (57%) Total 34 (35%) 23 (24%) 39 (41%) 96 (100%)
Table 15. Pearson’s Chi-Square Test of Capsule Ratings by Lesson Type, Inside the Classroom Observation and Analytic Protocol, 2016-2017
Pearson Chi-Square df p 15.33 10 .121
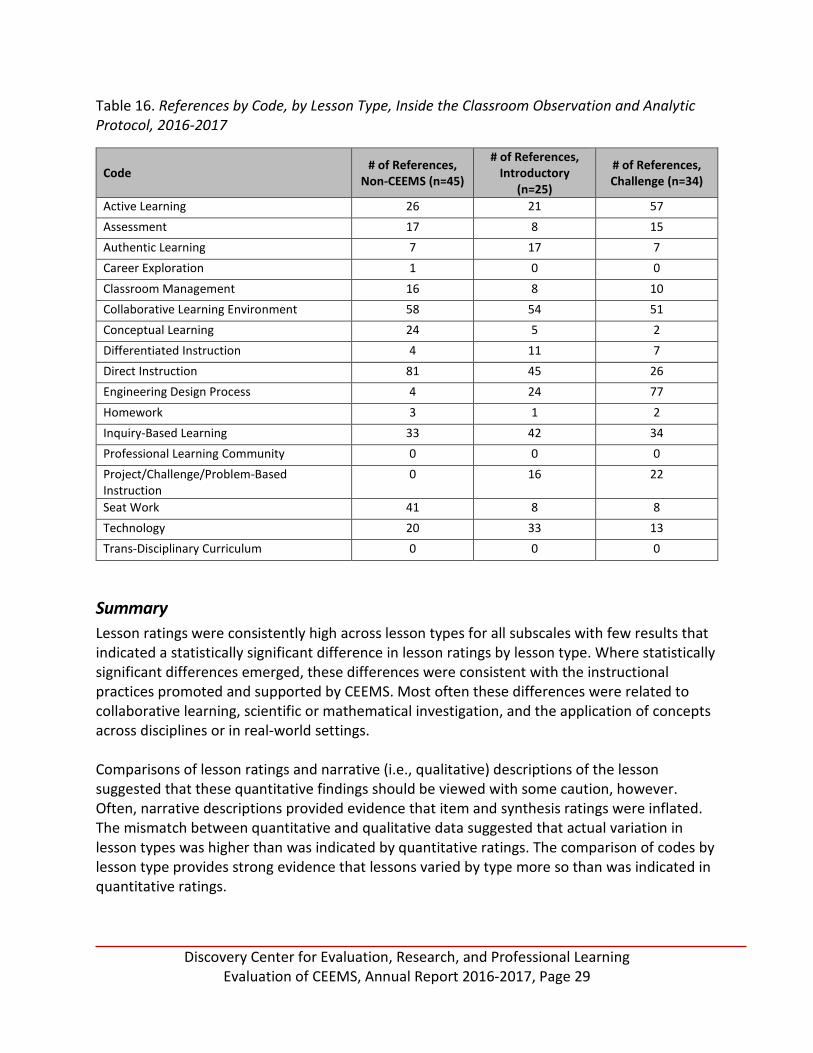
Qualitative Comparisons by Lesson Type Narrative descriptions of each lesson were coded based on the 18 codes developed in the 2015-2016 academic year. The unit of analysis for qualitative comparisons by lesson type was the reference. References are discrete units of text to which a code is applied. References can be as short as one word or as long as several paragraphs. Table 16 provides the number of references for each code, by lesson type, for the full sample. The codes Collaborative Learning Environment and Inquiry-Based Learning were applied to all lesson types a similar number of times, despite the higher number of Non-CEEMS lessons than either CEEMS Introductory or CEEMS Challenge lessons. This finding suggests that collaborative learning and inquiry-based instruction occurred more frequently in CEEMS Introductory and CEEMS Challenge lessons than in Non-CEEMS lessons and is consistent with quantitative findings. Additionally, the number of references to seat work and direct instruction for Non-CEEMS lessons was much higher than for CEEMS Introductory or CEEMS Challenge lessons. The number of references to active learning and the engineering design process were much higher for CEEMS Challenge lessons than for other lesson types. These findings are consistent with the CEEMS program’s focus on student-centered engineering design-based learning.
Discovery Center for Evaluation, Research, and Professional Learning
Evaluation of CEEMS, Annual Report 2016-2017, Page 29
Table 16. References by Code, by Lesson Type, Inside the Classroom Observation and Analytic Protocol, 2016-2017
Code # of References, Non-CEEMS (n=45)
# of References, Introductory
(n=25)
# of References, Challenge (n=34)
Active Learning 26 21 57 Assessment 17 8 15 Authentic Learning 7 17 7 Career Exploration 1 0 0 Classroom Management 16 8 10 Collaborative Learning Environment 58 54 51 Conceptual Learning 24 5 2 Differentiated Instruction 4 11 7 Direct Instruction 81 45 26 Engineering Design Process 4 24 77 Homework 3 1 2 Inquiry-Based Learning 33 42 34 Professional Learning Community 0 0 0 Project/Challenge/Problem-Based Instruction
0 16 22
Seat Work 41 8 8 Technology 20 33 13 Trans-Disciplinary Curriculum 0 0 0
Summary Lesson ratings were consistently high across lesson types for all subscales with few results that indicated a statistically significant difference in lesson ratings by lesson type. Where statistically significant differences emerged, these differences were consistent with the instructional practices promoted and supported by CEEMS. Most often these differences were related to collaborative learning, scientific or mathematical investigation, and the application of concepts across disciplines or in real-world settings. Comparisons of lesson ratings and narrative (i.e., qualitative) descriptions of the lesson suggested that these quantitative findings should be viewed with some caution, however. Often, narrative descriptions provided evidence that item and synthesis ratings were inflated. The mismatch between quantitative and qualitative data suggested that actual variation in lesson types was higher than was indicated by quantitative ratings. The comparison of codes by lesson type provides strong evidence that lessons varied by type more so than was indicated in quantitative ratings.

Discovery Center for Evaluation, Research, and Professional Learning
Evaluation of CEEMS, Annual Report 2016-2017, Page 30
Quantitative Analysis of Matched Teacher Sample As was discussed previously, observations of at least one of each lesson type were provided for 10 teachers. These observation data were matched for each teacher to get a better understanding of the nature of change for individual teachers. Tables 17-18 provide findings for the Lesson Design subscale for the matched teacher sample. The 10 teachers showed consistently high ratings across lesson type. Compared to Non-CEEMS lessons, CEEMS Introductory and CEEMS Challenge lessons had significantly higher ratings on having lesson designs that encouraged a collaborative approach to learning among the students. Teachers did not differ by lesson type in the overall synthesis rating.

Discovery Center for Evaluation, Research, and Professional Learning
Evaluation of CEEMS, Annual Report 2016-2017, Page 31
Table 17. Lesson Design by Lesson Type, ANOVA Comparisons, Inside the Classroom Observation and Analytic Protocol, 2016-2017, Matched Teacher Sample
Item Lesson Type n M SD ANOVA p Chi-
Square (df =2)
Friedman Test p
1. The design of the lesson incorporated tasks, roles, and interactions consistent with investigative mathematics/science.
Non-CEEMS 9 3.28 0.99 .014 5.45 .066
Introductory 9 4.04 1.39 Challenge 9 3.89 1.27
2. The design of the lesson reflected careful planning and organization.
Non-CEEMS 10 4.33 0.63 .945 Introductory 10 4.67 0.77 Challenge 10 4.32 0.70
3. The instructional strategies and activities used in this lesson reflected attention to students’ experience, preparedness, prior knowledge, and/or learning styles.
Non-CEEMS 10 4.33 0.82 .479
Introductory 10 4.87 0.32
Challenge 10 4.60 0.70
4. The resources available in this lesson contributed to accomplishing the purposes of the instruction
Non-CEEMS 10 4.33 0.82 .111 Introductory 10 4.83 0.36 Challenge 10 4.80 0.42
5. The instructional strategies and activities reflected attention to issues of access, equity, and diversity for students (e.g., cooperative learning, language-appropriate strategies/materials).
Non-CEEMS 8 4.17 0.84 .111
Introductory 8 4.88 0.35
Challenge 8 4.75 0.46
6. The design of the lesson encouraged a collaborative approach to learning among the students.
Non-CEEMSab 9 4.00 0.73 .027 11.22 .004
Introductorya 9 4.70 0.61 Challengeb 9 4.72 0.44
7. Adequate time and structure were provided for “sense-making.”
Non-CEEMS 9 4.30 0.77 .223 Introductory 9 4.59 0.91 Challenge 9 4.67 0.50
8. Adequate time and structure were provided for wrap-up.
Non-CEEMS 9 4.37 0.81 .321 Introductory 9 4.48 0.91 Challenge 9 4.67 0.50
Note: p-values were calculated using both one-way ANOVA and Friedman Test. a indicates significant differences between Non-CEEMs and Introductory b indicates significant differences between Non-CEEMs and Challenge c indicates significant differences between Introductory and Challenge

Discovery Center for Evaluation, Research, and Professional Learning
Evaluation of CEEMS, Annual Report 2016-2017, Page 32
Table 18. Synthesis Ratings for Lesson Design by Lesson Type, Inside the Classroom Observation and Analytic Protocol, 2016-2017, Matched Teacher Sample
Synthesis Rating Lesson Type n M SD p
Synthesis rating: extent to which design reflects best practices
Non-CEEMS 10 4.05 0.52 .089 Introductory 10 4.73 0.58 Challenge 10 4.45 0.69
Note: p values were calculated using one-way ANOVA. Tables 19-20 provide findings for the Lesson Implementation subscale for the matched teacher sample. Teachers’ ratings were consistently high across lessons. Teachers showed no statistically significant difference, by lesson type, in lesson implementation. Table 19. Lesson Implementation by Lesson Type, ANOVA Comparisons, Inside the Classroom Observation and Analytic Protocol, 2016-2017, Matched Teacher Sample
Item Lesson Type n M SD p
1. The instructional strategies were consistent with investigative mathematics/science.
Non-CEEMS 10 4.03 0.84 .443 Introductory 10 4.80 0.42 Challenge 10 4.30 0.82
2. The teacher appeared confident in his/her ability to teach mathematics/science.
Non-CEEMS 10 4.85 0.47 .271 Introductory 10 4.90 0.32 Challenge 10 4.50 0.71
3. The teacher’s classroom management style/strategies enhanced the quality of the lesson.
Non-CEEMS 10 4.85 0.47 .189 Introductory 10 4.83 0.36 Challenge 10 4.47 0.57
4. The pace of the lesson was appropriate for the developmental levels/needs of the students and the purposes of the lesson.
Non-CEEMS 10 4.78 0.50 .465 Introductory 10 4.77 0.50 Challenge 10 4.55 0.69
5. The teacher was able to “read” the students’ level of understanding and adjusted instruction accordingly.
Non-CEEMS 10 4.80 0.48 .411 Introductory 10 4.90 0.32 Challenge 10 4.52 0.80
6. The teacher’s questioning strategies were likely to enhance the development of student conceptual understanding/problem solving (e.g., emphasized higher order questions, appropriately used “wait time,” identified prior conceptions and misconceptions).
Non-CEEMS 10 4.35 0.86 1.000
Introductory 10 4.83 0.36
Challenge 10 4.35 0.82
Note: p values were calculated using one-way ANOVA.

Discovery Center for Evaluation, Research, and Professional Learning
Evaluation of CEEMS, Annual Report 2016-2017, Page 33
Table 20. Synthesis Rating for Lesson Implementation by Lesson Type, ANOVA Comparisons, Inside the Classroom Observation and Analytic Protocol, 2016-2017, Matched Teacher Sample
Synthesis Rating Lesson Type n M SD p
Synthesis rating: extent to which implementation reflects best practices
Non-CEEMS 10 4.42 0.71 .856 Introductory 10 4.83 0.36 Challenge 10 4.35 0.82
Note: p values were calculated using one-way ANOVA. Tables 21-22 provide findings for the Mathematics/Science Content subscale, by lesson type, for the matched teacher sample. Teachers’ ratings were consistently high across lessons. Teachers showed no statistically significant differences, by lesson type, in mathematics/science content. Table 21. Mathematics/Science Content by Lesson Type, ANOVA Comparisons, Inside the Classroom Observation and Analytic Protocol, 2016-2017, Matched Teacher Sample
Item Lesson Type n M SD p
1. The mathematics/science content was significant and worthwhile
Non-CEEMS 9 4.69 0.46 .506 Introductory 9 4.85 0.44 Challenge 9 4.46 0.85
2. The mathematics/science content was appropriate for the developmental levels of the students in this class.
Non-CEEMS 9 4.85 0.44 .576 Introductory 9 5.00 0.00 Challenge 9 4.69 0.66
3. Teacher-provided content information was accurate. Non-CEEMS 10 5.00 0.00 .177 Introductory 10 5.00 0.00 Challenge 10 4.92 0.18
4. Students were intellectually engaged with important ideas relevant to the focus of the lesson.
Non-CEEMS 10 4.52 0.65 .343 Introductory 10 4.73 0.84 Challenge 10 4.37 0.86
5. The teacher displayed an understanding of mathematics/science concepts (e.g., in his/her dialogue with students).
Non-CEEMS 9 4.37 0.99 .202 Introductory 9 5.00 0.00 Challenge 9 4.89 0.33
6. Mathematics/science was portrayed as a dynamic body of knowledge continually enriched by conjecture, investigation analysis, and/or proof/justification.
Non-CEEMS 9 4.06 1.42 .371 Introductory 9 4.93 0.22 Challenge 9 4.59 0.70
7. Elements of mathematical/science abstraction (e.g., symbolic representations, theory building) were included when it was important to do so.
Non-CEEMS 9 4.59 0.55 .847 Introductory 9 4.93 0.22 Challenge 9 4.54 0.69
8. Appropriate connections were made to other areas of mathematics/science, to other disciplines, and/or to real-world contexts
Non-CEEMS 10 4.33 0.85 .327 Introductory 10 5.00 0.00 Challenge 10 4.72 0.63
9. The degree of “sense-making” of mathematics/science content within this lesson was appropriate for the
Non-CEEMS 10 4.42 0.88 .090 Introductory 10 4.90 0.32 Challenge 10 4.92 0.18

Discovery Center for Evaluation, Research, and Professional Learning
Evaluation of CEEMS, Annual Report 2016-2017, Page 34
Item Lesson Type n M SD p
developmental levels/needs of the students and the purposes of the lesson.
Note: p values were calculated using one-way ANOVA. Table 22. Synthesis Rating for Mathematics/Science Content by Lesson Type, Inside the Classroom Observation and Analytic Protocol, 2016-2017, Matched Teacher Sample
Synthesis Rating Lesson Type n M SD p
Synthesis rating: extent to which content reflects best practices
Non-CEEMS 10 4.45 0.56 .316 Introductory 10 5.00 0.00 Challenge 10 4.62 0.46
Note: p values were calculated using one-way ANOVA. Tables 23-24 provide findings for the Classroom Culture subscale, by lesson type, for the matched teacher sample. Teachers’ ratings were consistently high across lessons. Teachers showed no statistically significant differences, by lesson type, in classroom culture. Table 23. Classroom Culture by Lesson Type, ANOVA Comparisons, Inside the Classroom Observation and Analytic Protocol, 2016-2017, Matched Teacher Sample
Item Lesson Type n M SD p
1. Active participation of all was encouraged and valued. Non-CEEMS 9 4.94 0.17 .347 Introductory 9 4.96 0.11 Challenge 9 5.00 0.00
2. There was a climate of respect for students’ ideas, questions, and contributions
Non-CEEMS 9 5.00 0.00 Introductory 9 4.96 0.11 Challenge 9 5.00 0.00
3. Interactions reflected collegial working relationships among students (e.g., students worked together, talked with each other about the lesson).
Non-CEEMS 9 4.74 0.50 .859 Introductory 9 4.85 0.44 Challenge 9 4.78 0.44
4. Interactions reflected collaborative working relationships between teacher and students.
Non-CEEMS 9 4.96 0.11 .347 Introductory 9 4.85 0.44 Challenge 9 4.89 0.33
5. The climate of the lesson encouraged students to generate ideas, questions, conjectures, and/or propositions
Non-CEEMS 10 4.63 0.67 .751 Introductory 10 4.90 0.32 Challenge 10 4.70 0.67
6. Intellectual rigor, constructive criticism, and the challenging of ideas were evident.
Non-CEEMS 9 4.22 0.69 .155 Introductory 9 4.72 0.67 Challenge 9 4.67 0.71
Note: p values were calculated using one-way ANOVA.

Discovery Center for Evaluation, Research, and Professional Learning
Evaluation of CEEMS, Annual Report 2016-2017, Page 35
Table 24. Synthesis Rating for Classroom Culture by Lesson Type, Inside the Classroom Observation and Analytic Protocol, 2016-2017, Matched Teacher Sample
Synthesis Rating Lesson Type n M SD p
Synthesis rating: extent to which classroom culture reflects best practices
Non-CEEMS 10 4.77 0.34 .448 Introductory 10 4.57 0.99 Challenge 10 4.55 0.96
Note: p values were calculated using one-way ANOVA. Table 25 provides findings for the Likely Impact of Instruction on Students’ Understanding of Mathematics/Science subscale for the matched teacher sample. Teachers’ ratings were consistently high across lesson type for the likely impact of the lesson on mathematics/science understanding. Compared to Non-CEEMS lessons, CEEMS Introductory and Challenge lessons had a significantly higher impact on students’ abilities to apply or generalize skills and concepts to other areas of mathematics/science, other disciplines, and/or real-life situations. Table 25. Likely Impact of Instruction on Student Understanding by Lesson Type, Inside the Classroom Observation and Analytic Protocol, 2016-2017, Matched Teacher Sample
Likely impact of lesson on . . . Lesson Type n M SD ANOVA p
Chi-Square (df =2)
Friedman Test p
1. Students’ understanding of mathematics/science as a dynamic body of knowledge generated and enriched by investigation
Non-CEEMS 9 4.37 0.67 .840 Introductory 9 4.67 0.71 Challenge 9 4.41 0.70
2. Students’ understanding of important mathematics/science concepts.
Non-CEEMS 9 4.69 0.52 .705 Introductory 9 4.41 0.76 Challenge 9 4.63 0.48
3. Students’ capacity to carry out their own inquiries.
Non-CEEMS 9 3.85 0.75 .151 Introductory 9 4.63 0.70 Challenge 9 4.33 0.87
4. Students’ ability to apply or generalize skills and concepts to other areas of mathematics/science, other disciplines, and/or real-life situations
Non-CEEMSab 10 3.82 0.78 .006 7.72 .021
Introductorya 10 4.53 0.69 Challengeb 10 4.47 0.69
5. Students’ self-confidence in doing mathematics/science.
Non-CEEMS 9 4.24 0.51 .763 Introductory 9 4.37 0.95 Challenge 9 4.33 0.97
6. Students’ interest in and/or appreciation for the discipline.
Non-CEEMS 10 4.40 0.59 .906 Introductory 10 4.43 0.92 Challenge 10 4.37 0.92
Note: p-values were calculated using both one-way ANOVA and Friedman Test. a indicates significant differences between Non-CEEMs and Introductory b indicates significant differences between Non-CEEMs and Challenge c indicates significant differences between Introductory and Challenge
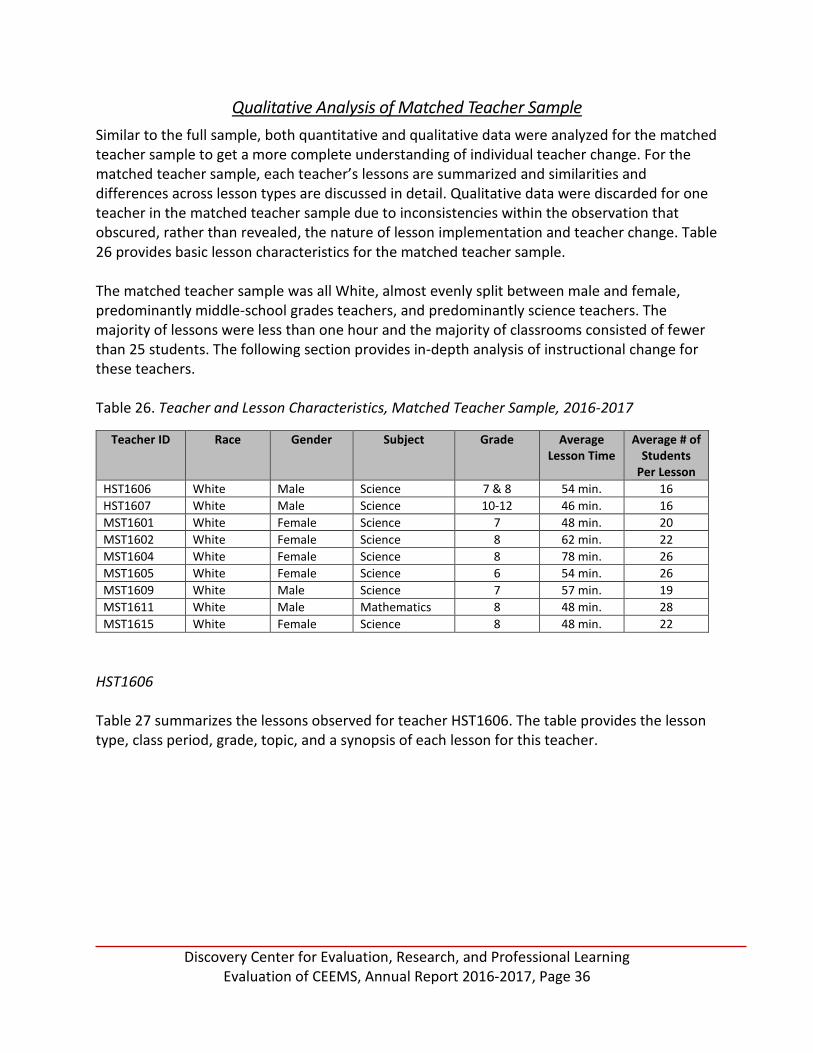
Discovery Center for Evaluation, Research, and Professional Learning
Evaluation of CEEMS, Annual Report 2016-2017, Page 36
Qualitative Analysis of Matched Teacher Sample Similar to the full sample, both quantitative and qualitative data were analyzed for the matched teacher sample to get a more complete understanding of individual teacher change. For the matched teacher sample, each teacher’s lessons are summarized and similarities and differences across lesson types are discussed in detail. Qualitative data were discarded for one teacher in the matched teacher sample due to inconsistencies within the observation that obscured, rather than revealed, the nature of lesson implementation and teacher change. Table 26 provides basic lesson characteristics for the matched teacher sample. The matched teacher sample was all White, almost evenly split between male and female, predominantly middle-school grades teachers, and predominantly science teachers. The majority of lessons were less than one hour and the majority of classrooms consisted of fewer than 25 students. The following section provides in-depth analysis of instructional change for these teachers. Table 26. Teacher and Lesson Characteristics, Matched Teacher Sample, 2016-2017
Teacher ID Race Gender Subject Grade Average Lesson Time
Average # of Students
Per Lesson HST1606 White Male Science 7 & 8 54 min. 16 HST1607 White Male Science 10-12 46 min. 16 MST1601 White Female Science 7 48 min. 20 MST1602 White Female Science 8 62 min. 22 MST1604 White Female Science 8 78 min. 26 MST1605 White Female Science 6 54 min. 26 MST1609 White Male Science 7 57 min. 19 MST1611 White Male Mathematics 8 48 min. 28 MST1615 White Female Science 8 48 min. 22
HST1606 Table 27 summarizes the lessons observed for teacher HST1606. The table provides the lesson type, class period, grade, topic, and a synopsis of each lesson for this teacher.
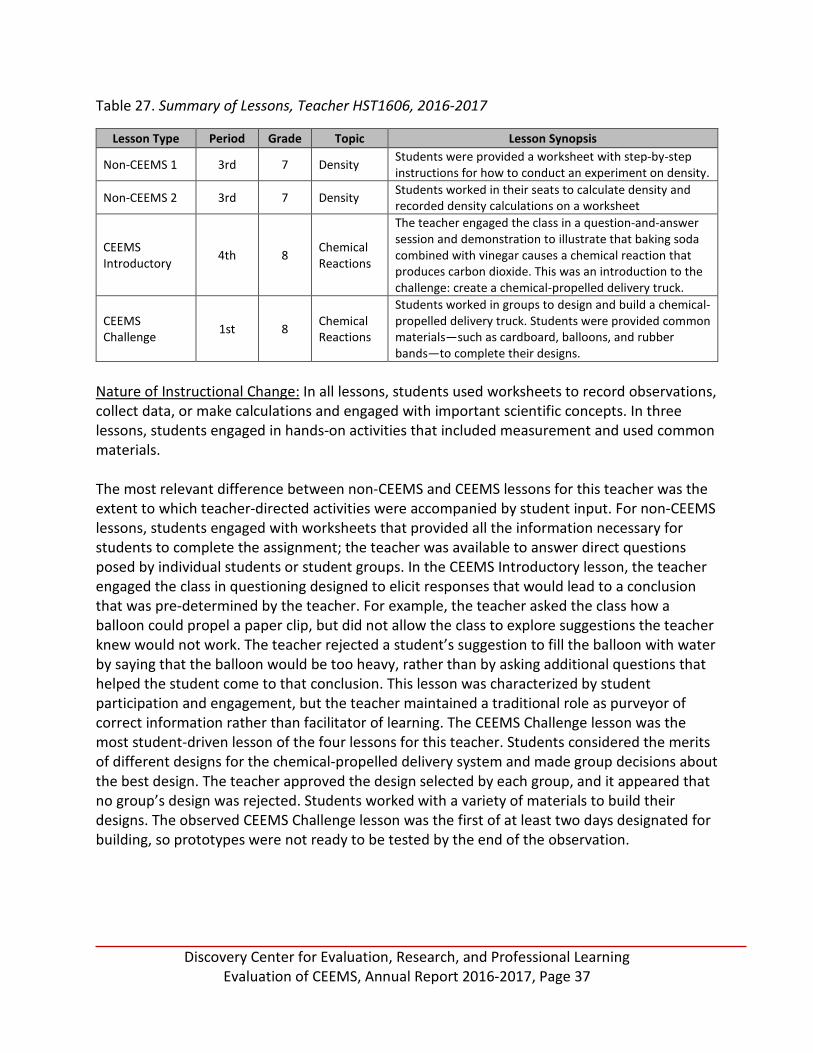
Discovery Center for Evaluation, Research, and Professional Learning
Evaluation of CEEMS, Annual Report 2016-2017, Page 37
Table 27. Summary of Lessons, Teacher HST1606, 2016-2017
Lesson Type Period Grade Topic Lesson Synopsis
Non-CEEMS 1 3rd 7 Density Students were provided a worksheet with step-by-step instructions for how to conduct an experiment on density.
Non-CEEMS 2 3rd 7 Density Students worked in their seats to calculate density and recorded density calculations on a worksheet
CEEMS Introductory 4th 8 Chemical
Reactions
The teacher engaged the class in a question-and-answer session and demonstration to illustrate that baking soda combined with vinegar causes a chemical reaction that produces carbon dioxide. This was an introduction to the challenge: create a chemical-propelled delivery truck.
CEEMS Challenge 1st 8 Chemical
Reactions
Students worked in groups to design and build a chemical-propelled delivery truck. Students were provided common materials—such as cardboard, balloons, and rubber bands—to complete their designs.
Nature of Instructional Change: In all lessons, students used worksheets to record observations, collect data, or make calculations and engaged with important scientific concepts. In three lessons, students engaged in hands-on activities that included measurement and used common materials. The most relevant difference between non-CEEMS and CEEMS lessons for this teacher was the extent to which teacher-directed activities were accompanied by student input. For non-CEEMS lessons, students engaged with worksheets that provided all the information necessary for students to complete the assignment; the teacher was available to answer direct questions posed by individual students or student groups. In the CEEMS Introductory lesson, the teacher engaged the class in questioning designed to elicit responses that would lead to a conclusion that was pre-determined by the teacher. For example, the teacher asked the class how a balloon could propel a paper clip, but did not allow the class to explore suggestions the teacher knew would not work. The teacher rejected a student’s suggestion to fill the balloon with water by saying that the balloon would be too heavy, rather than by asking additional questions that helped the student come to that conclusion. This lesson was characterized by student participation and engagement, but the teacher maintained a traditional role as purveyor of correct information rather than facilitator of learning. The CEEMS Challenge lesson was the most student-driven lesson of the four lessons for this teacher. Students considered the merits of different designs for the chemical-propelled delivery system and made group decisions about the best design. The teacher approved the design selected by each group, and it appeared that no group’s design was rejected. Students worked with a variety of materials to build their designs. The observed CEEMS Challenge lesson was the first of at least two days designated for building, so prototypes were not ready to be tested by the end of the observation.
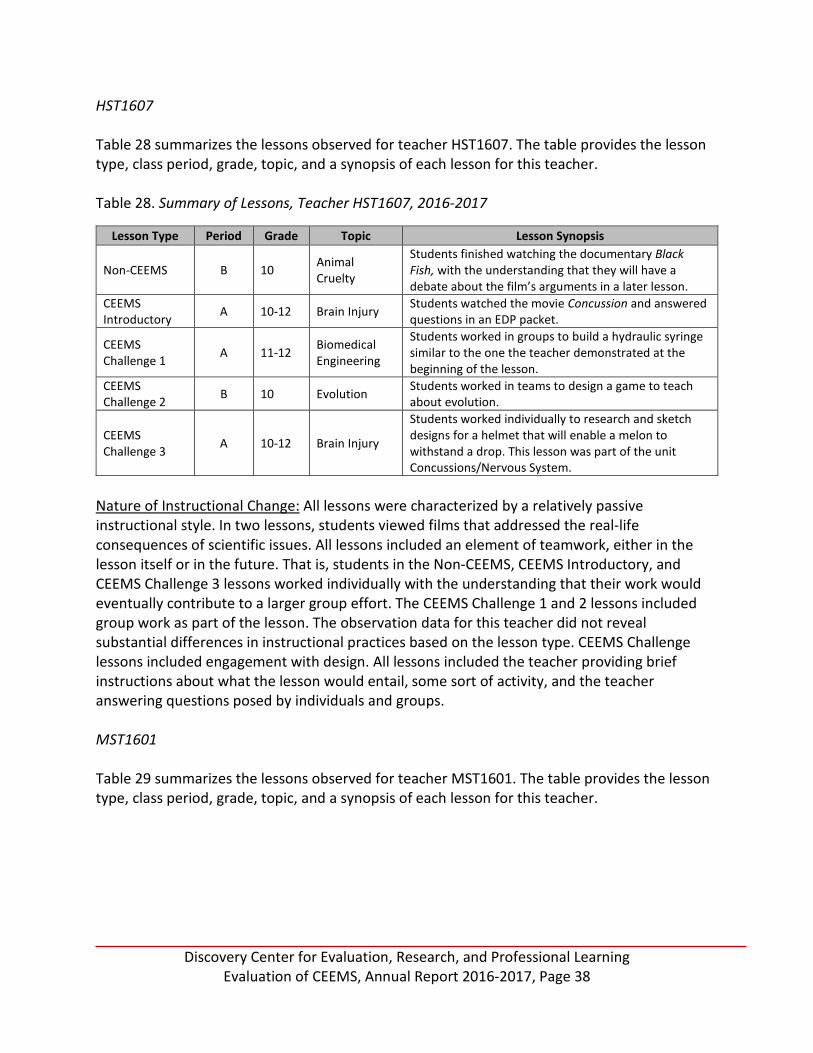
Discovery Center for Evaluation, Research, and Professional Learning
Evaluation of CEEMS, Annual Report 2016-2017, Page 38
HST1607 Table 28 summarizes the lessons observed for teacher HST1607. The table provides the lesson type, class period, grade, topic, and a synopsis of each lesson for this teacher. Table 28. Summary of Lessons, Teacher HST1607, 2016-2017
Lesson Type Period Grade Topic Lesson Synopsis
Non-CEEMS B 10 Animal Cruelty
Students finished watching the documentary Black Fish, with the understanding that they will have a debate about the film’s arguments in a later lesson.
CEEMS Introductory A 10-12 Brain Injury Students watched the movie Concussion and answered
questions in an EDP packet.
CEEMS Challenge 1 A 11-12 Biomedical
Engineering
Students worked in groups to build a hydraulic syringe similar to the one the teacher demonstrated at the beginning of the lesson.
CEEMS Challenge 2 B 10 Evolution Students worked in teams to design a game to teach
about evolution.
CEEMS Challenge 3 A 10-12 Brain Injury
Students worked individually to research and sketch designs for a helmet that will enable a melon to withstand a drop. This lesson was part of the unit Concussions/Nervous System.
Nature of Instructional Change: All lessons were characterized by a relatively passive instructional style. In two lessons, students viewed films that addressed the real-life consequences of scientific issues. All lessons included an element of teamwork, either in the lesson itself or in the future. That is, students in the Non-CEEMS, CEEMS Introductory, and CEEMS Challenge 3 lessons worked individually with the understanding that their work would eventually contribute to a larger group effort. The CEEMS Challenge 1 and 2 lessons included group work as part of the lesson. The observation data for this teacher did not reveal substantial differences in instructional practices based on the lesson type. CEEMS Challenge lessons included engagement with design. All lessons included the teacher providing brief instructions about what the lesson would entail, some sort of activity, and the teacher answering questions posed by individuals and groups. MST1601 Table 29 summarizes the lessons observed for teacher MST1601. The table provides the lesson type, class period, grade, topic, and a synopsis of each lesson for this teacher.

Discovery Center for Evaluation, Research, and Professional Learning
Evaluation of CEEMS, Annual Report 2016-2017, Page 39
Table 29. Summary of Lessons, Teacher MST1601, 2016-2017
Lesson Type Period Grade Topic Lesson Synopsis
Non-CEEMS 1 1 7 Periodic Table
Students identified a topic of interest to them (e.g., movies, professional athletes) and ways to categorize the topic to create a periodic table that included different “elements” of the topic of interest.
Non-CEEMS 2 1 7 Chemical Compounds
Students observed and described everyday items (e.g., sugar, oil and water), and then completed worksheet questions about the nature of the substance.
CEEMS Introductory 1 7 Deep Water
Horizon Oil Spill
Students observed two informational videos about the 2010 Deep Water Horizon oil spill in the Gulf of Mexico. After each video, the teacher engaged the class in discussion about the information in the videos.
CEEMS Challenge 6 7 Deep Water
Horizon Oil Spill
Students worked in groups to develop a plan to clean up a simulated oil spill using common materials (e.g., cotton balls, gauze).
Nature of Instructional Change: In all lessons, students used worksheets and/or packets of instructional materials to complete an activity related to science. All lessons had a hands-on or active component, although the hands-on nature of Non-CEEMS lesson 1 was limited to students’ creation of individualized note cards to model the periodic tables they developed. The teacher encouraged students’ questions in all lessons. Teacher questioning of students and student questioning of the teacher tended to focus on close-ended questions that required recall of a correct answer, as opposed to open-ended questions that required critical thinking. For this teacher, Non-CEEMS lessons included less student collaboration—either in small groups or as a whole class—than did CEEMS lessons. Although students were seated in groups for all lessons, students engaged in collaborative decision-making in only the CEEMS Challenge lesson. In addition, non-CEEMS lessons were more teacher-directed than were CEEMS lessons. Worksheets for Non-CEEMS lessons included step-by-step instructions for how to complete the activity. In contrast, the CEEMS Challenge lesson required students to develop their own procedures for cleaning up a simulated oil spill. In the CEEMS Introductory lesson, the teacher engaged the class in direct questioning and discussion that was intended to lead to the challenge. The majority of this direct questioning and discussion was close-ended (i.e., the teacher asked students to recall discrete facts highlighted in the video), but some of the questioning required students to express their own thoughts and experiences related to the topic. For this teacher, the nature of instructional change between Non-CEEMS and CEEMS lessons was characterized by a subtle shift from less to more student-directed.

Discovery Center for Evaluation, Research, and Professional Learning
Evaluation of CEEMS, Annual Report 2016-2017, Page 40
MST1602 Table 30 summarizes the lessons observed for teacher MST1602. The table provides the lesson type, class period, grade, topic, and a synopsis of each lesson for this teacher. Table 30. Summary of Lessons, Teacher MST1602, 2016-2017
Lesson Type Period Grade Topic Lesson Synopsis
Non-CEEMS 1 A -- Mapping
The teacher engaged the class in a pre-test and questioning to teach the class how to read and interpret contour lines on a map. The class worked in small groups to define vocabulary words and answer worksheet questions about maps.
Non-CEEMS 2 C 8
Earth’s Interior Radioactive Decay
As a review of previously-learned material, students viewed a video and wrote definitions of concepts related to radioactive decay. Students viewed a video as a class and answered the teacher’s questions related to the concepts in the video. Students then viewed a third video while they completed a worksheet assignment regarding the Earth’s interior.
Non-CEEMS 3 B 8 Frog Dissection
Students worked in groups of 4 to dissect a frog. The teacher’s aide gave the class step-by-step directions on how to dissect each part of the frog. After cleanup, the teacher’s aide gave a lecture that compared frog and human anatomy.
CEEMS Introductory B 8 Potential
Energy
Students viewed a video that featured a Rube Goldberg machine and answered questions in an EDP packet. The teacher engaged the class in questioning about potential and kinetic energy and discussed the parameters of the Rube Goldberg machine challenge they would complete. Students then worked in groups to sketch a design for their Rube Goldberg machines.
CEEMS Challenge 1 B 8 Potential
Energy Students worked in groups to build and test Rube Goldberg machines.
CEEMS Challenge 2 B 8 Potential
Energy
Each student group presented its Rube Goldberg machine to a visiting 7th-grade class by showing the functioning of the machine, discussing the building process, and answering audience questions.
--Indicates Missing Data Nature of Instructional Change: With the exception of the frog dissection lesson (which was taught by the teacher’s aide), the teacher used multiple instructional strategies to engage the class in every lesson. With the exception of the frog dissection lesson, the teacher encouraged students to either define scientific concepts in their own words or consider even their negative experiences (e.g., design failure) as an opportunity to learn. With the exception of the frog dissection lesson, the teacher discussed how the current lesson fit in with a challenge the

Discovery Center for Evaluation, Research, and Professional Learning
Evaluation of CEEMS, Annual Report 2016-2017, Page 41
students would complete during the unit. Students worked in groups or had the opportunity to work in groups for all lessons. For this teacher, the nature of instructional change was related to the design or purpose of the lesson. This teacher used direct questioning and other means (e.g., informational videos, concept definition) to transmit conceptual information about the scientific topics related to the lesson in all but the two CEEMS Challenge lessons. The first CEEMS Challenge lesson included student-directed, hands-on, engineering design-based activity. The second CEEMS Challenge lesson included student-led demonstration and discussion of the design process in students’ own words. The teacher ensured all students were engaged during direct questioning and other whole-class activities in Non-CEEMS and CEEMS Introductory lessons. On the other hand, some groups were highly engaged and some groups were not very engaged during CEEMS Challenge lessons. For this teacher, CEEMS Challenge lessons included student-directed activities, while the other lessons included mostly teacher-directed activities. MST1604 Table 31 summarizes the lessons observed for teacher MST1604. The table provides the lesson type, class period, grade, topic, and a synopsis of each lesson for this teacher.
Table 31. Summary of Lessons, Teacher MST1604, 2016-2017
Lesson Type Period Grade Topic Lesson Synopsis
Non-CEEMS C 8 Plate Tectonics
The teacher engaged the class in direct questioning about plate tectonics. Students used previously-recorded notes to learn vocabulary and take quizzes, including a live quiz, on plate tectonics. The teacher then used pictures to explain concepts regarding plate tectonics to the class.
CEEMS Introductory A 8 Potential
Energy
The teacher showed a video that featured a Rube Goldberg machine. Students began designing their own Rube Goldberg machines using instructions outlined in an EDP packet.
CEEMS Challenge 1 D 8 Mapping Students worked in groups to design a model topography.
CEEMS Challenge 2 A 8 Potential
Energy Students presented their Rube Goldberg machines to 6th-grade students.
Nature of Instructional Change: In all lessons, students had the opportunity to work in groups. In all lessons, students used written materials provided by the teacher (e.g., an EDP packet) to understand the expectations for the lesson. For this teacher, the nature of instructional change reflected the purpose or design of the lesson. The Non-CEEMS lesson was focused on vocabulary and conceptual learning and included a review of previously-covered material. This lesson was characterized by student recall of facts, review of notes, and quizzes. In the CEEMS Introductory lesson, the teacher used a video to introduce a Rube Goldberg machine and then asked students to begin designing their own machines. The CEEMS Challenge lessons included design of a model topography based on student knowledge of map features (CEEMS Challenge

Discovery Center for Evaluation, Research, and Professional Learning
Evaluation of CEEMS, Annual Report 2016-2017, Page 42
1) and presentation of Rube Goldberg machines students designed in previous lessons (CEEMS Challenge 2). For this teacher, the difference between non-CEEMS and CEEMS lessons was the extent to which students engaged in design tasks rather than the nature of instructional practice. MST1605 Table 32 summarizes the lessons observed for teacher MST1605. The table provides the lesson type, class period, grade, topic, and a synopsis of each lesson for this teacher. Table 32. Summary of Lessons, Teacher MST1605, 2016-2017
Lesson Type Period Grade Topic Lesson Synopsis
Non-CEEMS 1 C 6 Compounds
The teacher used notes, direct questioning, and lecture to transmit information about elements, atoms, and compounds. Students then began a homework assignment.
Non-CEEMS 2 C 6 Types of Rocks
Students wrote about what they knew about the three types of rock; explained the characteristics of the three rock types to one another; and circulated to different stations to identify, discuss, and take notes regarding the different types of rocks at each station.
CEEMS Introductory A 6 Speed
Students worked in groups to conduct research about, design, and sketch a design for a glider they will build as part of a challenge.
CEEMS Challenge B 6 Density
Students worked in groups to conduct research about, discuss, sketch, and begin to design a model of a flotation device, based on available materials.
Nature of Instructional Change: In all lessons, the teacher provided instructions for how students were expected to proceed with the lesson or presented a challenge that was pre-determined. All lessons included a whole-class activity or discussion followed by student work, either independently or in groups. During whole-class activities or discussion, the teacher consistently ensured all students participated. During group work, the teacher consistently circulated among groups to clarify, explain, or gauge student understanding. All lessons were characterized by more than one instructional strategy, were well organized, and were teacher-directed. For this teacher, instructional change was reflected in the purpose or design of the lesson. The CEEMS Introductory and Challenge lessons included sketching, engagement with hands-on materials, design, and collaborative decision-making within groups. In these lessons, students were assigned job roles as part of their group participation. The Non-CEEMS lessons were focused on conceptual learning and the transmission of scientific information, even when some hands-on materials were used as part of that learning (i.e., Non-CEEMS lesson 2). For this
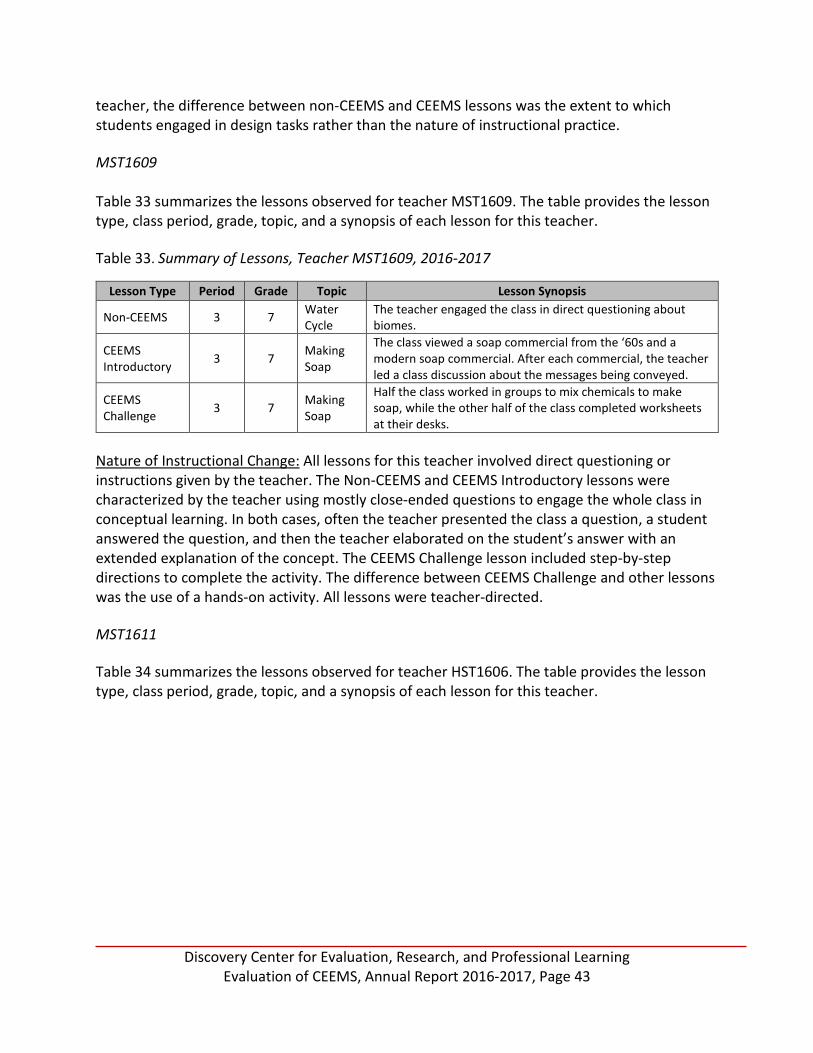
Discovery Center for Evaluation, Research, and Professional Learning
Evaluation of CEEMS, Annual Report 2016-2017, Page 43
teacher, the difference between non-CEEMS and CEEMS lessons was the extent to which students engaged in design tasks rather than the nature of instructional practice. MST1609 Table 33 summarizes the lessons observed for teacher MST1609. The table provides the lesson type, class period, grade, topic, and a synopsis of each lesson for this teacher. Table 33. Summary of Lessons, Teacher MST1609, 2016-2017
Lesson Type Period Grade Topic Lesson Synopsis
Non-CEEMS 3 7 Water Cycle
The teacher engaged the class in direct questioning about biomes.
CEEMS Introductory 3 7 Making
Soap
The class viewed a soap commercial from the ‘60s and a modern soap commercial. After each commercial, the teacher led a class discussion about the messages being conveyed.
CEEMS Challenge 3 7 Making
Soap
Half the class worked in groups to mix chemicals to make soap, while the other half of the class completed worksheets at their desks.
Nature of Instructional Change: All lessons for this teacher involved direct questioning or instructions given by the teacher. The Non-CEEMS and CEEMS Introductory lessons were characterized by the teacher using mostly close-ended questions to engage the whole class in conceptual learning. In both cases, often the teacher presented the class a question, a student answered the question, and then the teacher elaborated on the student’s answer with an extended explanation of the concept. The CEEMS Challenge lesson included step-by-step directions to complete the activity. The difference between CEEMS Challenge and other lessons was the use of a hands-on activity. All lessons were teacher-directed. MST1611 Table 34 summarizes the lessons observed for teacher HST1606. The table provides the lesson type, class period, grade, topic, and a synopsis of each lesson for this teacher.

Discovery Center for Evaluation, Research, and Professional Learning
Evaluation of CEEMS, Annual Report 2016-2017, Page 44
Table 34. Summary of Lessons, Teacher HST1611, 2016-2017
Lesson Type Period Grade Topic Lesson Synopsis
Non-CEEMS 1 5 8 Linear & Non-Linear Functions
The teacher lectured about different methods to determine proportional vs. non-proportional relationships on an x-y axis, and then students worked in pairs to complete problems from a textbook.
Non-CEEMS 2 5 8 Triangles
The teacher lectured and demonstrated to the class how to calculate the distance between two points of a triangle graph. Students then completed a worksheet to find distances for several triangles.
Non-CEEMS 3 1 8 Volume
The teacher lectured and demonstrated the method of calculating volume, and then students worked in groups to calculate the surface areas and volumes for several everyday items (e.g., coffee can, safety cone)
CEEMS Introductory 1 1 8 Architecture
The class worked in small groups to rate the attractiveness of various buildings pictured around the room, and then the teacher began to record the ratings in a master data table.
CEEMS Introductory 2 1 8 Volume and
Surface Area
The teacher engaged the class in direct questioning about how to find the volume of various solids (e.g., cylinder, cone), which segued into questioning about how packaging engineers design cereal boxes. The questioning introduced the CEEMS challenge: design a cereal box that holds the same volume with fewer materials, and students worked in groups to begin to research the topic and sketch designs.
CEEMS Challenge 1 8 Architecture
Students worked in groups to design an office building based on 3 constraints, which they will build out of cardboard in a later lesson.
Nature of Instructional Change: All lessons included either direct teacher questioning or a teacher-created challenge. However, Non-CEEMS and CEEMS lessons for this teacher had little in common beyond the engagement with mathematical concepts. Non-CEEMS lessons focused on conceptual understanding and calculating the correct answer to mathematical problems through traditional methods of direct questioning, step-by-step whole-class mathematical problem solving, and independent worksheet or textbook work. Although the teacher presented challenges to the class rather than guided the class toward the challenge, CEEMS lessons included student-directed activities and collaborative decision-making. The nature of instructional change for this teacher was the change from teacher-led, abstract mathematical problem solving to student-led activity to meet a challenge the teacher contextualized through the real-life application of design.

Discovery Center for Evaluation, Research, and Professional Learning
Evaluation of CEEMS, Annual Report 2016-2017, Page 45
MST1615 Table 35 summarizes the lessons observed for teacher MST1615. The table provides the lesson type, class period, grade, topic, and a synopsis of each lesson for this teacher. Table 35. Summary of Lessons, Teacher MST1615, 2016-2017
Lesson Type Period Grade Topic Lesson Synopsis
Non-CEEMS 1 2 8 Plain English Video Review
Students worked in groups to begin to create storyboards for a video they will shoot to teach their classmates concepts that will be tested on the state test.
Non-CEEMS 2 2 8 Genetics
Students completed a short introductory activity, after which the teacher provided the correct answers and explained the meaning of the terms. Students worked in groups to complete worksheets about genetics
CEEMS Introductory 1 6 8 Topography
The teacher engaged the class in a short direct questioning session about erosion and weathering. Students worked in groups to build a mountain using modeling dough and sliced and traced their mountains to create a contour map. Groups then traded contour maps, which they used to re-create the original group’s mountain.
CEEMS Introductory 2 2 8 Genetics
The class worked in small groups to develop questions about what they needed to know about genetics and dog breeds. Students then sorted decks of cards with pictures of dogs according to categories and criteria they developed. The groups completed three rounds of sorting based on different criteria they developed for each round.
CEEMS Challenge 1 6 8 Topography
and Mapping
Students worked in small groups to choose 2 quadrants on a map and develop a convincing pitch for someone to build houses on these quadrants.
CEEMS Challenge 2 2 8 Genetics
Students worked in groups to present posters that summarized their challenge: design a service dog with two traits that are beneficial to society.
Nature of Instructional Change: Students worked in groups for all lessons. With the exception of the Non-CEEMS lesson 2 (worksheet on genetics), all lessons included collaborative decision-making and project-based learning. All lessons included rubrics that outlined requirements for the challenge or activity. All lessons were characterized by limited teacher-led conceptual learning followed by extensive student-led work time. The teacher connected all lessons to previous or subsequent lessons. With the exception of Non-CEEMS lesson 2 (worksheet on genetics), Non-CEEMS lessons included many of the same project-based, student-led instructional strategies and were almost indistinguishable from non-CEEMS lessons.
Discovery Center for Evaluation, Research, and Professional Learning
Evaluation of CEEMS, Annual Report 2016-2017, Page 46
Summary Lesson ratings for the matched teacher sample showed high ratings across items and across lesson types, with few statistically significant differences based on lesson type. The items that showed statistically significant differences, based on lesson type, were related to inquiry-based instruction, collaborative learning, and the lesson’s likely impact on students’ abilities to apply learning across subjects or in the real world. These findings are consistent with findings for the full sample. Qualitative analyses revealed more variation among lesson types than was revealed by quantitative findings, alone. Student collaboration, in the form of group work, was evident in both CEEMS and Non-CEEMS lessons, although meaningful collaboration (i.e., collaborative decision-making) was more evident in CEEMS lessons than in Non-CEEMS lessons. Although most lessons were characterized by teacher-directed learning activities, student-directed activities were more prevalent in CEEMS Challenge lessons than in other lesson types. Consistent with the full sample, active learning was a conspicuous feature of CEEMS Challenge lessons and traditional instructional methods (e.g., direct instruction, vocabulary learning) were common features of non-CEEMS lessons.

Discovery Center for Evaluation, Research, and Professional Learning
Evaluation of CEEMS, Annual Report 2016-2017, Page 47
Conclusions, Recommendations, and Next Steps
Conclusions A summary of findings from the 2016-2017 academic year are organized by evaluation question, followed by recommendations to facilitate continued progress. Evaluation Question 1: In what ways did teachers’ instructional practices change in the course of their participation in CEEMS? Teachers’ instructional practices changed from relatively traditional in Non-CEEMS lessons, to inquiry-based in CEEMS Introductory lessons, to active and student-centered in CEEMS Challenge lessons. This pattern represented general differences by lesson type, but, consistent with Resource Team members’ perceptions, instructional differences for individual teachers varied. CEEMS Introductory and Challenge lessons often included teacher-directed instruction as well as active learning, inquiry, engineering design, and student-directed activity. Teacher-directed instruction in CEEMS lessons most often occurred when teachers provided direct instructions for completing a challenge or engaged in direct questioning as a means to introduce the challenge. Collaborative learning, in the form of group work, was evident in all lesson types. Collaborative learning in CEEMS Challenge lessons included collaborative decision-making and student-directed activity more often than in other lessons. Overall, lessons focused on worthwhile content regardless of lesson type, and CEEMS lessons addressed a variety of topics in creative ways. Quantitative lesson ratings were consistently high but less reflective of the variation in actual instructional practices than were qualitative findings. Evaluation Question 2: In what ways did CEEMS Resource Team support for teachers change in the course of their participation in CEEMS? Resource Team members improved their practice through experience and collaborative trouble-shooting, and were empowered throughout the project to make the changes that worked best for them and their teachers. Resource Team members used their experience to improve pedagogical guides, presentations, and other materials provided to teachers to support their instruction and diversified their methods of communication with teachers to ensure teachers’ coaching needs were met. The Resource Team focused on pedagogy, in general, and classroom management more often than many members had previously expected. The major change in Resource Team members’ practice was the development of techniques for helping teachers facilitate student learning through questioning rather than transmit content through lecture.

Discovery Center for Evaluation, Research, and Professional Learning
Evaluation of CEEMS, Annual Report 2016-2017, Page 48
Recommendations The Evaluation Team has developed two recommendations to aid the project:
1. Continue to foreground the engineering design process as the defining feature of CEEMS. Continue to emphasize the inquiry-based, student-centered, and discovery-based elements of the engineering design process over the hands-on and building elements. Students’ development of essential questions is a critical element of the engineering design process, and evidence suggests that teachers did not provide adequate opportunities for this process prior to engaging students in challenge.
2. Continue to help teachers differentiate between direct questioning and questioning that facilitates deeper learning. Direct questioning occurs when the teacher asks close-ended questions that have one or a limited number of answers. Questioning that facilitates learning asks students to think critically about a topic and explore different possibilities, and it often takes longer than direct questioning.
Next Steps The Evaluation Team will train new graduate fellows in the use of the classroom observation protocol and analyze these data in the 2017-2018 academic year. Improvements the Evaluation Team made to training in the 2016-2017 academic year resulted in richer data with better detail than in the 2015-2016 academic year. Improvements to the training planned for the 2017-2018 are designed to support fellows’ abilities to evaluate the quality of lessons in ways that reflect a broader range of instructional practices and result in lesson ratings that are supported by qualitative observations.
Discovery Center for Evaluation, Research, and Professional Learning
Evaluation of CEEMS, Annual Report 2016-2017, Page 49
References
Horizon Research Inc. (2000). Inside the classroom observation and analytic protocol. Retrieved from http://www.horizon-research.com/horizonresearchwp/wp-content/uploads/2013/04/cop1.pdf.
Maltbie, C. & Butcher, K. (2014). NSF MSP: CEEMS project – Year 3 complete academic year:
Evaluation summary report. Cincinnati, OH: Evaluation Services Center.

Discovery Center for Evaluation, Research, and Professional Learning
Evaluation of CEEMS, Annual Report 2016-2017, Page 50
Appendices
Appendix A. Resource Team Focus Group Protocol ..................................................................... 47
Appendix B. Inside the Classroom Observation and Analytic Protocol ........................................ 48
Appendix C. Qualitative Code Book .............................................................................................. 55
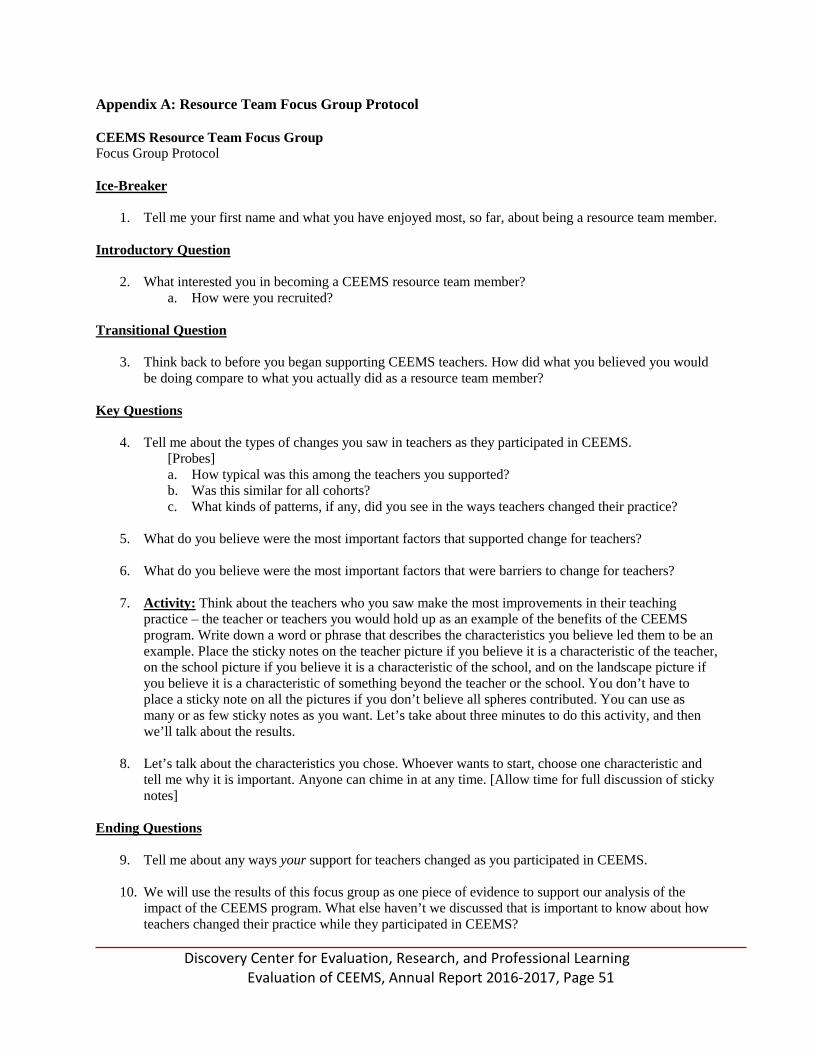
Discovery Center for Evaluation, Research, and Professional Learning Evaluation of CEEMS, Annual Report 2016-2017, Page 51
Appendix A: Resource Team Focus Group Protocol CEEMS Resource Team Focus Group Focus Group Protocol Ice-Breaker
1. Tell me your first name and what you have enjoyed most, so far, about being a resource team member.
Introductory Question
2. What interested you in becoming a CEEMS resource team member? a. How were you recruited?
Transitional Question
3. Think back to before you began supporting CEEMS teachers. How did what you believed you would be doing compare to what you actually did as a resource team member?
Key Questions
4. Tell me about the types of changes you saw in teachers as they participated in CEEMS. [Probes] a. How typical was this among the teachers you supported? b. Was this similar for all cohorts? c. What kinds of patterns, if any, did you see in the ways teachers changed their practice?
5. What do you believe were the most important factors that supported change for teachers?
6. What do you believe were the most important factors that were barriers to change for teachers?
7. Activity: Think about the teachers who you saw make the most improvements in their teaching
practice – the teacher or teachers you would hold up as an example of the benefits of the CEEMS program. Write down a word or phrase that describes the characteristics you believe led them to be an example. Place the sticky notes on the teacher picture if you believe it is a characteristic of the teacher, on the school picture if you believe it is a characteristic of the school, and on the landscape picture if you believe it is a characteristic of something beyond the teacher or the school. You don’t have to place a sticky note on all the pictures if you don’t believe all spheres contributed. You can use as many or as few sticky notes as you want. Let’s take about three minutes to do this activity, and then we’ll talk about the results.
8. Let’s talk about the characteristics you chose. Whoever wants to start, choose one characteristic and tell me why it is important. Anyone can chime in at any time. [Allow time for full discussion of sticky notes]
Ending Questions
9. Tell me about any ways your support for teachers changed as you participated in CEEMS.
10. We will use the results of this focus group as one piece of evidence to support our analysis of the impact of the CEEMS program. What else haven’t we discussed that is important to know about how teachers changed their practice while they participated in CEEMS?

Horizon Research, Inc. Inside the Classroom: Observation and Analytic Protocol – Page 1 11/30/00
Inside the ClassroomObservation and Analytic Protocol
Observation Date: Time: Start: End:
School: District:
Teacher:
PART ONE: THE LESSON
Section A. Basic Descriptive Information
1. Teacher Gender: Male Female
Teacher Ethnicity: American Indian or Alaskan NativeAsianHispanic or LatinoBlack or African-AmericanNative Hawaiian or Other Pacific IslanderWhite
2 Subject Observed: Mathematics Science
3. Grade Level(s):
4. Course Title (if applicable)
Class Period (if applicable)
5. Students: Number of Males Number of Females
6. Did you collect copies of instructional materials to be sent to HRI?
¨ Yes ¨ No, explain:
Appendix B: Inside the Classroom Observation and Analytic Protocol
Discovery Center for Evaluation, Research, and Professional Learning Evaluation of CEEMS, Annual Report 2016-2017, Page 52

Horizon Research, Inc. Inside the Classroom: Observation and Analytic Protocol – Page 2 11/30/00
Section B. Purpose of the Lesson:In this section, you are asked to indicate how lesson time was spent and to provide the teacher's statedpurpose for the lesson.
1. According to the teacher, the purpose of this lesson was:
2. Based on time spent, the focus of this lesson is best described as: (Check one.)
¡ Almost entirely working on the development of algorithms/facts/vocabulary
¡ Mostly working on the development of algorithms/facts/vocabulary, but working on some mathematics/scienceconcepts
¡ About equally working on algorithms/facts/vocabulary and working on mathematics/science concepts
¡ Mostly working on mathematics/science concepts, but working on some algorithms/facts/vocabulary
¡ Almost entirely working on mathematics/science concepts
Section C. Lesson RatingsIn this part of the form, you are asked to rate each of a number of key indicators in four differentcategories, from 1 (not at all) to 5 (to a great extent). You may list any additional indicators youconsider important in capturing the essence of this lesson and rate these as well. Use your “Ratings ofKey Indicators” to inform your “Synthesis Ratings”. It is important to indicate in “Supporting Evidencefor Synthesis Ratings” what factors were most influential in determining your synthesis ratings and togive specific examples and/or quotes to illustrate those factors.
Note that any one lesson is not likely to provide evidence for every single indicator; use 6, “Don’tknow” when there is not enough evidence for you to make a judgment. Use 7, “N/A” (Not Applicable)when you consider the indicator inappropriate given the purpose and context of the lesson. This sectionalso includes ratings of the likely impact of instruction and a capsule rating of the quality of the lesson.
Discovery Center for Evaluation, Research, and Professional Learning Evaluation of CEEMS, Annual Report 2016-2017, Page 53

Horizon Research, Inc. Inside the Classroom: Observation and Analytic Protocol – Page 3 11/30/00
I. Design
A. Ratings of Key Indicators
1. The design of the lesson incorporated tasks, roles, andinteractions consistent with investigative mathematics/science. 1 2 3 4 5 6 7
2. The design of the lesson reflected careful planning andorganization. 1 2 3 4 5 6* 7*
3. The instructional strategies and activities used in thislesson reflected attention to students’ experience,preparedness, prior knowledge, and/or learning styles. 1 2 3 4 5 6 7
4. The resources available in this lesson contributed toaccomplishing the purposes of the instruction. 1 2 3 4 5 6 7
5. The instructional strategies and activities reflected attentionto issues of access, equity, and diversity for students(e.g., cooperative learning, language-appropriatestrategies/materials). 1 2 3 4 5 6* 7*
6. The design of the lesson encouraged a collaborativeapproach to learning among the students. 1 2 3 4 5 6 7
7. Adequate time and structure were provided for “sense-making.” 1 2 3 4 5 6* 7*
8. Adequate time and structure were provided for wrap-up. 1 2 3 4 5 6 7
9. _______________________________________________ 1 2 3 4 5
* We anticipate that these indicators should be rated 1-5 for nearly all lessons. If you rated any of these indicators 6or 7, please provide an explanation in your supporting evidence below.
B. Synthesis Rating
1 2 3 4 5Design of the lesson notat all reflective of bestpractice inmathematics/scienceeducation
Design of the lessonextremely reflective ofbest practice inmathematics/scienceeducation
C. Supporting Evidence for Synthesis RatingProvide a brief description of the nature and quality of this component of the lesson, the rationale for your synthesisrating, and the evidence to support that rating.
Notatall
To agreatextent
Don’tknow N/A
Discovery Center for Evaluation, Research, and Professional Learning Evaluation of CEEMS, Annual Report 2016-2017, Page 54
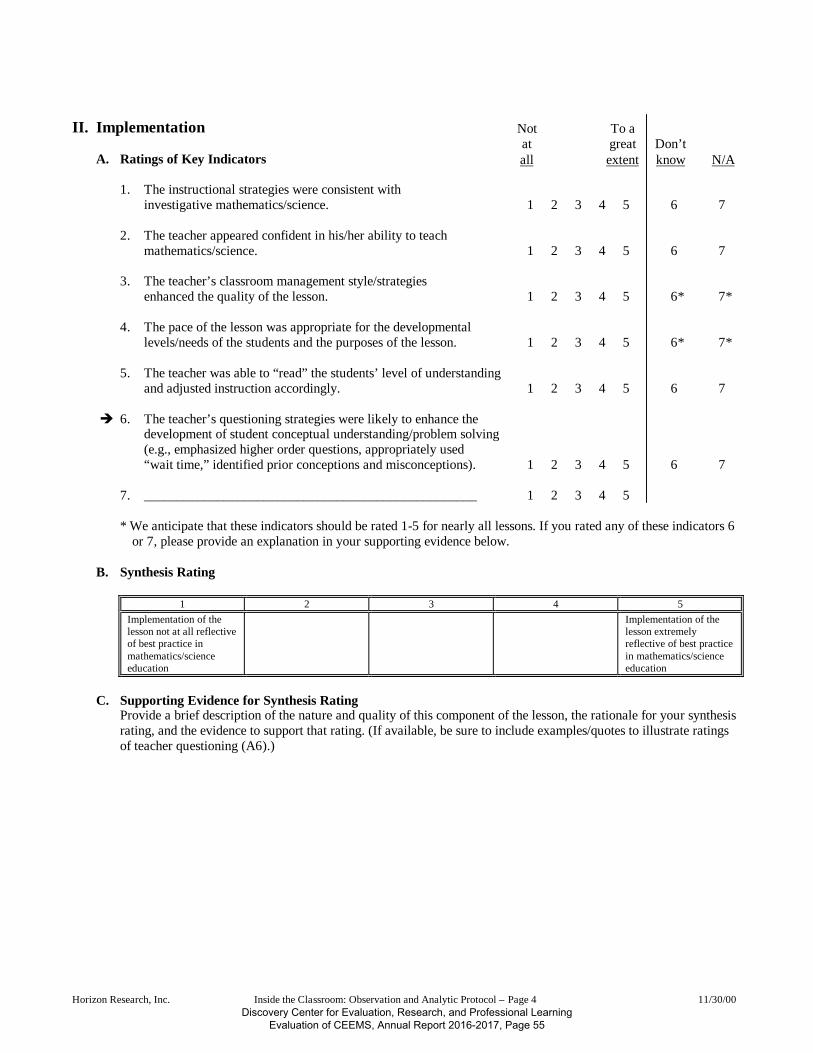
Horizon Research, Inc. Inside the Classroom: Observation and Analytic Protocol – Page 4 11/30/00
II. Implementation
A. Ratings of Key Indicators
1. The instructional strategies were consistent withinvestigative mathematics/science. 1 2 3 4 5 6 7
2. The teacher appeared confident in his/her ability to teachmathematics/science. 1 2 3 4 5 6 7
3. The teacher’s classroom management style/strategiesenhanced the quality of the lesson. 1 2 3 4 5 6* 7*
4. The pace of the lesson was appropriate for the developmentallevels/needs of the students and the purposes of the lesson. 1 2 3 4 5 6* 7*
5. The teacher was able to “read” the students’ level of understandingand adjusted instruction accordingly. 1 2 3 4 5 6 7
è 6. The teacher’s questioning strategies were likely to enhance thedevelopment of student conceptual understanding/problem solving(e.g., emphasized higher order questions, appropriately used“wait time,” identified prior conceptions and misconceptions). 1 2 3 4 5 6 7
7. __________________________________________________ 1 2 3 4 5
* We anticipate that these indicators should be rated 1-5 for nearly all lessons. If you rated any of these indicators 6or 7, please provide an explanation in your supporting evidence below.
B. Synthesis Rating
1 2 3 4 5Implementation of thelesson not at all reflectiveof best practice inmathematics/scienceeducation
Implementation of thelesson extremelyreflective of best practicein mathematics/scienceeducation
C. Supporting Evidence for Synthesis RatingProvide a brief description of the nature and quality of this component of the lesson, the rationale for your synthesisrating, and the evidence to support that rating. (If available, be sure to include examples/quotes to illustrate ratingsof teacher questioning (A6).)
Notatall
To agreatextent
Don’tknow N/A
Discovery Center for Evaluation, Research, and Professional Learning Evaluation of CEEMS, Annual Report 2016-2017, Page 55

Horizon Research, Inc. Inside the Classroom: Observation and Analytic Protocol – Page 5 11/30/00
III. Mathematics/Science Content
A. Ratings of Key Indicators
è 1. The mathematics/science content was significant and worthwhile. 1 2 3 4 5 6* 7*
è 2. The mathematics/science content was appropriate for thedevelopmental levels of the students in this class. 1 2 3 4 5 6* 7*
è 3. Teacher-provided content information was accurate. 1 2 3 4 5 6 7
è 4. Students were intellectually engaged with important ideasrelevant to the focus of the lesson. 1 2 3 4 5 6* 7*
5. The teacher displayed an understanding of mathematics/scienceconcepts (e.g., in his/her dialogue with students). 1 2 3 4 5 6 7
6. Mathematics/science was portrayed as a dynamic body ofknowledge continually enriched by conjecture, investigationanalysis, and/or proof/justification. 1 2 3 4 5 6 7
7. Elements of mathematical/science abstraction (e.g., symbolicrepresentations, theory building) were included when it wasimportant to do so. 1 2 3 4 5 6 7
8. Appropriate connections were made to other areas of mathematics/science, to other disciplines, and/or to real-world contexts. 1 2 3 4 5 6 7
è 9. The degree of “sense-making” of mathematics/science contentwithin this lesson was appropriate for the developmentallevels/needs of the students and the purposes of the lesson. 1 2 3 4 5 6* 7*
10. _______________________________________________ 1 2 3 4 5
* We anticipate that these indicators should be rated 1-5 for nearly all lessons. If you rated any of these indicators 6or 7, please provide an explanation in your supporting evidence below.
B. Synthesis Rating
1 2 3 4 5Mathematics/sciencecontent of lesson not atall reflective of currentstandards formathematics/scienceeducation
Mathematics/sciencecontent of lessonextremely reflective ofcurrent standards formathematics/scienceeducation
C. Supporting Evidence for Synthesis Rating Provide a brief description of the nature and quality of this component of the lesson, the rationale for yoursynthesis rating, and the evidence to support that rating. (If available, be sure to include examples/quotes toillustrate ratings of quality of content (A1, A2, A3), intellectual engagement (A4), and nature of “sense-making”(A9).)
Notatall
To agreatextent
Don’tknow N/A
Discovery Center for Evaluation, Research, and Professional Learning Evaluation of CEEMS, Annual Report 2016-2017, Page 56

Horizon Research, Inc. Inside the Classroom: Observation and Analytic Protocol – Page 6 11/30/00
IV. Classroom Culture
A. Ratings of Key Indicators
è 1. Active participation of all was encouraged and valued. 1 2 3 4 5 6* 7*
è 2. There was a climate of respect for students’ ideas,questions, and contributions. 1 2 3 4 5 6* 7*
3. Interactions reflected collegial working relationshipsamong students (e.g., students worked together, talked witheach other about the lesson). 1 2 3 4 5 6 7
4. Interactions reflected collaborative working relationshipsbetween teacher and students. 1 2 3 4 5 6* 7*
5. The climate of the lesson encouraged students to generateideas, questions, conjectures, and/or propositions. 1 2 3 4 5 6 7
è 6. Intellectual rigor, constructive criticism, and the challengingof ideas were evident. 1 2 3 4 5 6* 7*
7. _______________________________________________ 1 2 3 4 5
* We anticipate that these indicators should be rated 1-5 for nearly all lessons. If you rated any of these indicators 6or 7, please provide an explanation in your supporting evidence below.
B. Synthesis Rating
1 2 3 4 5Classroom cultureinterfered with studentlearning
Classroom culturefacilitated the learning ofall students
C. Supporting Evidence for Synthesis RatingProvide a brief description of the nature and quality of this component of the lesson, the rationale for yoursynthesis rating, and the evidence to support that rating. (If available, be sure to include examples/quotes toillustrate ratings of active participation (A1), climate of respect (A2), and intellectual rigor (A6). While directevidence that reflects particular sensitivity or insensitivity toward student diversity is not often observed, wewould like you to document any examples you do see.)
Notatall
To agreatextent
Don’tknow N/A
Discovery Center for Evaluation, Research, and Professional Learning Evaluation of CEEMS, Annual Report 2016-2017, Page 57
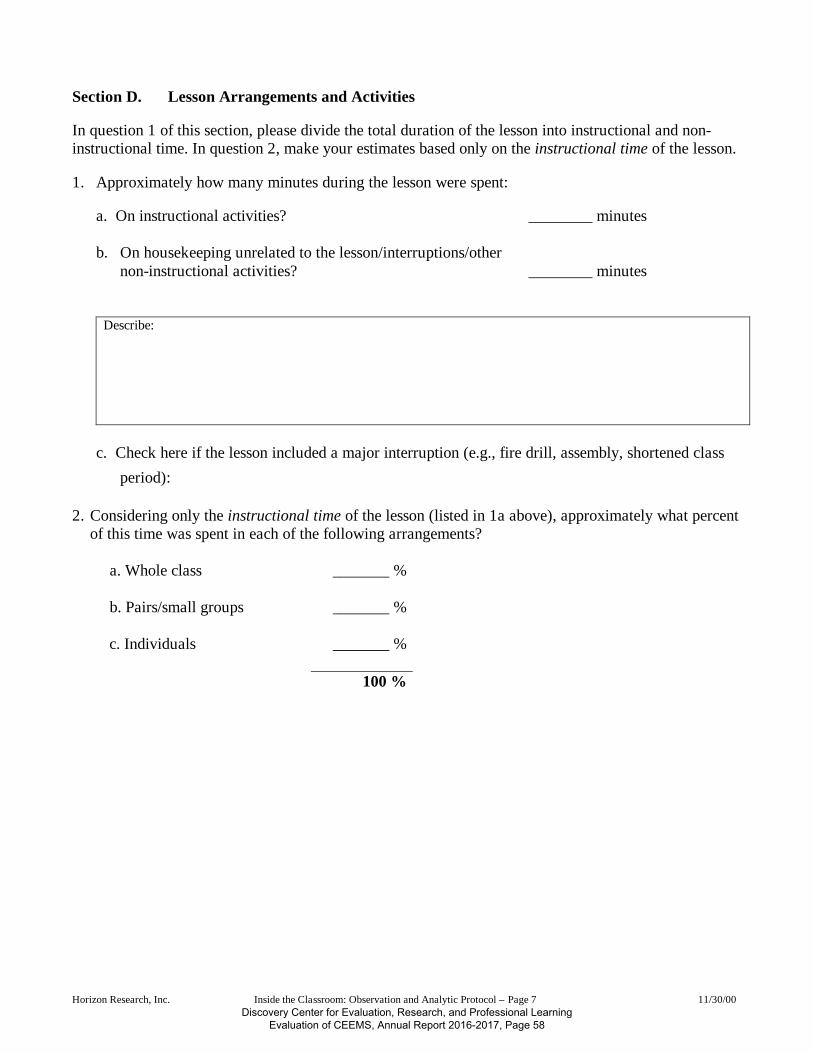
Horizon Research, Inc. Inside the Classroom: Observation and Analytic Protocol – Page 7 11/30/00
Section D. Lesson Arrangements and Activities
In question 1 of this section, please divide the total duration of the lesson into instructional and non-instructional time. In question 2, make your estimates based only on the instructional time of the lesson.
1. Approximately how many minutes during the lesson were spent:
a. On instructional activities? ________ minutes
b. On housekeeping unrelated to the lesson/interruptions/othernon-instructional activities? ________ minutes
Describe:
c. Check here if the lesson included a major interruption (e.g., fire drill, assembly, shortened classperiod): �
2. Considering only the instructional time of the lesson (listed in 1a above), approximately what percentof this time was spent in each of the following arrangements?
a. Whole class _______ %
b. Pairs/small groups _______ %
c. Individuals _______ %
100 %
Discovery Center for Evaluation, Research, and Professional Learning Evaluation of CEEMS, Annual Report 2016-2017, Page 58
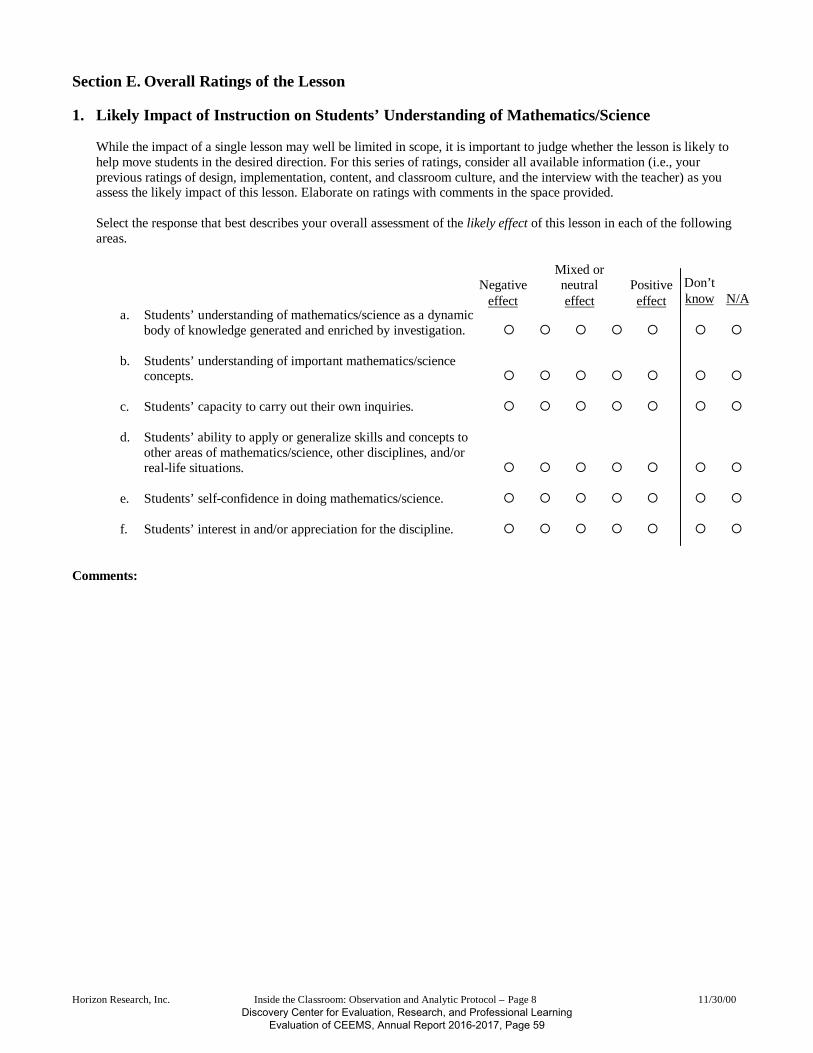
Horizon Research, Inc. Inside the Classroom: Observation and Analytic Protocol – Page 8 11/30/00
Section E. Overall Ratings of the Lesson
1. Likely Impact of Instruction on Students’ Understanding of Mathematics/Science
While the impact of a single lesson may well be limited in scope, it is important to judge whether the lesson is likely tohelp move students in the desired direction. For this series of ratings, consider all available information (i.e., yourprevious ratings of design, implementation, content, and classroom culture, and the interview with the teacher) as youassess the likely impact of this lesson. Elaborate on ratings with comments in the space provided.
Select the response that best describes your overall assessment of the likely effect of this lesson in each of the followingareas.
a. Students’ understanding of mathematics/science as a dynamicbody of knowledge generated and enriched by investigation. ¡ ¡ ¡ ¡ ¡ ¡ ¡
b. Students’ understanding of important mathematics/scienceconcepts. ¡ ¡ ¡ ¡ ¡ ¡ ¡
c. Students’ capacity to carry out their own inquiries. ¡ ¡ ¡ ¡ ¡ ¡ ¡
d. Students’ ability to apply or generalize skills and concepts toother areas of mathematics/science, other disciplines, and/orreal-life situations. ¡ ¡ ¡ ¡ ¡ ¡ ¡
e. Students’ self-confidence in doing mathematics/science. ¡ ¡ ¡ ¡ ¡ ¡ ¡
f. Students’ interest in and/or appreciation for the discipline. ¡ ¡ ¡ ¡ ¡ ¡ ¡
Comments:
Negativeeffect
Don’t know N/A
Mixed orneutraleffect
Positiveeffect
Discovery Center for Evaluation, Research, and Professional Learning Evaluation of CEEMS, Annual Report 2016-2017, Page 59
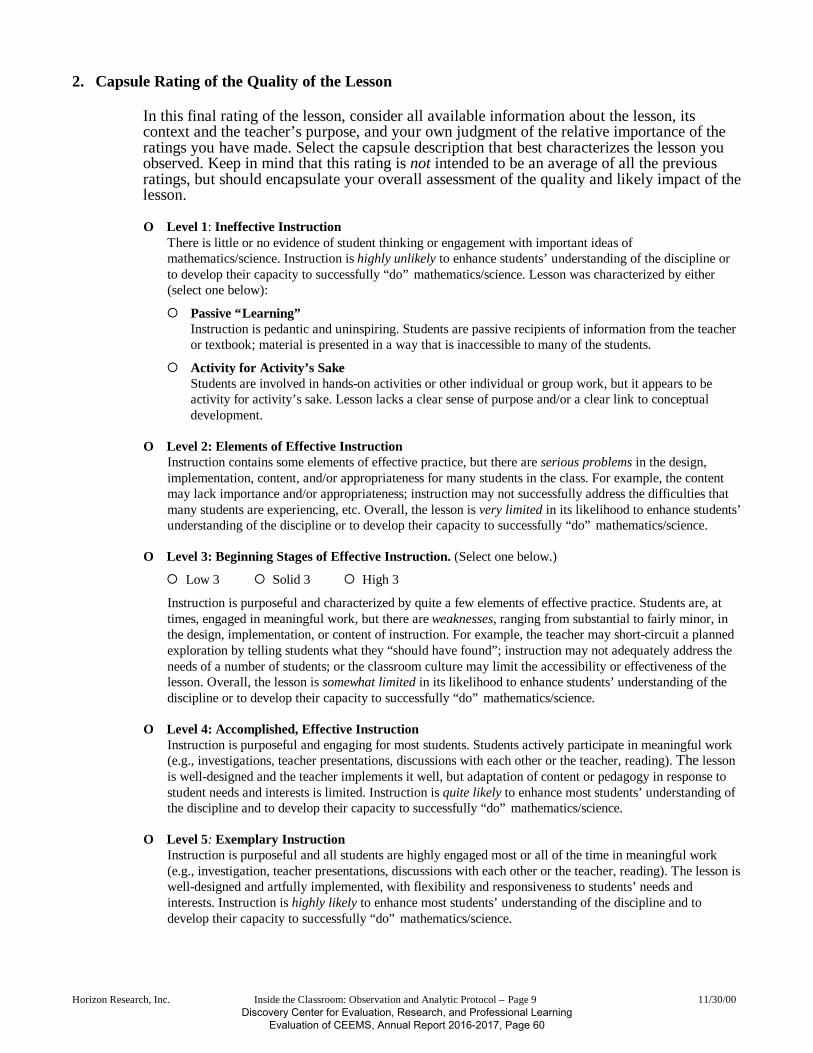
Horizon Research, Inc. Inside the Classroom: Observation and Analytic Protocol – Page 9 11/30/00
2. Capsule Rating of the Quality of the Lesson
In this final rating of the lesson, consider all available information about the lesson, itscontext and the teacher’s purpose, and your own judgment of the relative importance of theratings you have made. Select the capsule description that best characterizes the lesson youobserved. Keep in mind that this rating is not intended to be an average of all the previousratings, but should encapsulate your overall assessment of the quality and likely impact of thelesson.
O Level 1: Ineffective InstructionThere is little or no evidence of student thinking or engagement with important ideas ofmathematics/science. Instruction is highly unlikely to enhance students’ understanding of the discipline orto develop their capacity to successfully “do” mathematics/science. Lesson was characterized by either(select one below):
¡ Passive “Learning”Instruction is pedantic and uninspiring. Students are passive recipients of information from the teacheror textbook; material is presented in a way that is inaccessible to many of the students.
¡ Activity for Activity’s SakeStudents are involved in hands-on activities or other individual or group work, but it appears to beactivity for activity’s sake. Lesson lacks a clear sense of purpose and/or a clear link to conceptualdevelopment.
O Level 2: Elements of Effective InstructionInstruction contains some elements of effective practice, but there are serious problems in the design,implementation, content, and/or appropriateness for many students in the class. For example, the contentmay lack importance and/or appropriateness; instruction may not successfully address the difficulties thatmany students are experiencing, etc. Overall, the lesson is very limited in its likelihood to enhance students’understanding of the discipline or to develop their capacity to successfully “do” mathematics/science.
O Level 3: Beginning Stages of Effective Instruction. (Select one below.)
¡ Low 3 ¡ Solid 3 ¡ High 3
Instruction is purposeful and characterized by quite a few elements of effective practice. Students are, attimes, engaged in meaningful work, but there are weaknesses, ranging from substantial to fairly minor, inthe design, implementation, or content of instruction. For example, the teacher may short-circuit a plannedexploration by telling students what they “should have found”; instruction may not adequately address theneeds of a number of students; or the classroom culture may limit the accessibility or effectiveness of thelesson. Overall, the lesson is somewhat limited in its likelihood to enhance students’ understanding of thediscipline or to develop their capacity to successfully “do” mathematics/science.
O Level 4: Accomplished, Effective InstructionInstruction is purposeful and engaging for most students. Students actively participate in meaningful work(e.g., investigations, teacher presentations, discussions with each other or the teacher, reading). The lessonis well-designed and the teacher implements it well, but adaptation of content or pedagogy in response tostudent needs and interests is limited. Instruction is quite likely to enhance most students’ understanding ofthe discipline and to develop their capacity to successfully “do” mathematics/science.
O Level 5: Exemplary InstructionInstruction is purposeful and all students are highly engaged most or all of the time in meaningful work(e.g., investigation, teacher presentations, discussions with each other or the teacher, reading). The lesson iswell-designed and artfully implemented, with flexibility and responsiveness to students’ needs andinterests. Instruction is highly likely to enhance most students’ understanding of the discipline and todevelop their capacity to successfully “do” mathematics/science.
Discovery Center for Evaluation, Research, and Professional Learning Evaluation of CEEMS, Annual Report 2016-2017, Page 60
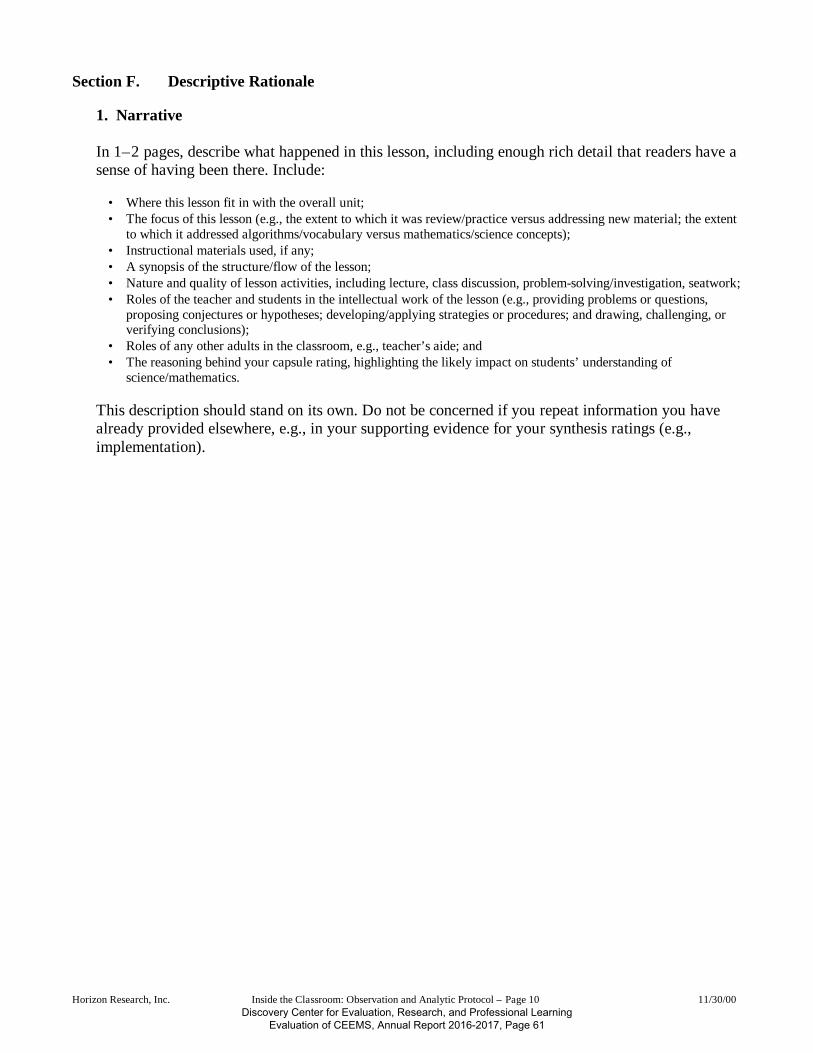
Horizon Research, Inc. Inside the Classroom: Observation and Analytic Protocol – Page 10 11/30/00
Section F. Descriptive Rationale
1. Narrative
In 1–2 pages, describe what happened in this lesson, including enough rich detail that readers have asense of having been there. Include:
• Where this lesson fit in with the overall unit;• The focus of this lesson (e.g., the extent to which it was review/practice versus addressing new material; the extent
to which it addressed algorithms/vocabulary versus mathematics/science concepts);• Instructional materials used, if any;• A synopsis of the structure/flow of the lesson;• Nature and quality of lesson activities, including lecture, class discussion, problem-solving/investigation, seatwork;• Roles of the teacher and students in the intellectual work of the lesson (e.g., providing problems or questions,
proposing conjectures or hypotheses; developing/applying strategies or procedures; and drawing, challenging, orverifying conclusions);
• Roles of any other adults in the classroom, e.g., teacher’s aide; and• The reasoning behind your capsule rating, highlighting the likely impact on students’ understanding of
science/mathematics.
This description should stand on its own. Do not be concerned if you repeat information you havealready provided elsewhere, e.g., in your supporting evidence for your synthesis ratings (e.g.,implementation).
Discovery Center for Evaluation, Research, and Professional Learning Evaluation of CEEMS, Annual Report 2016-2017, Page 61
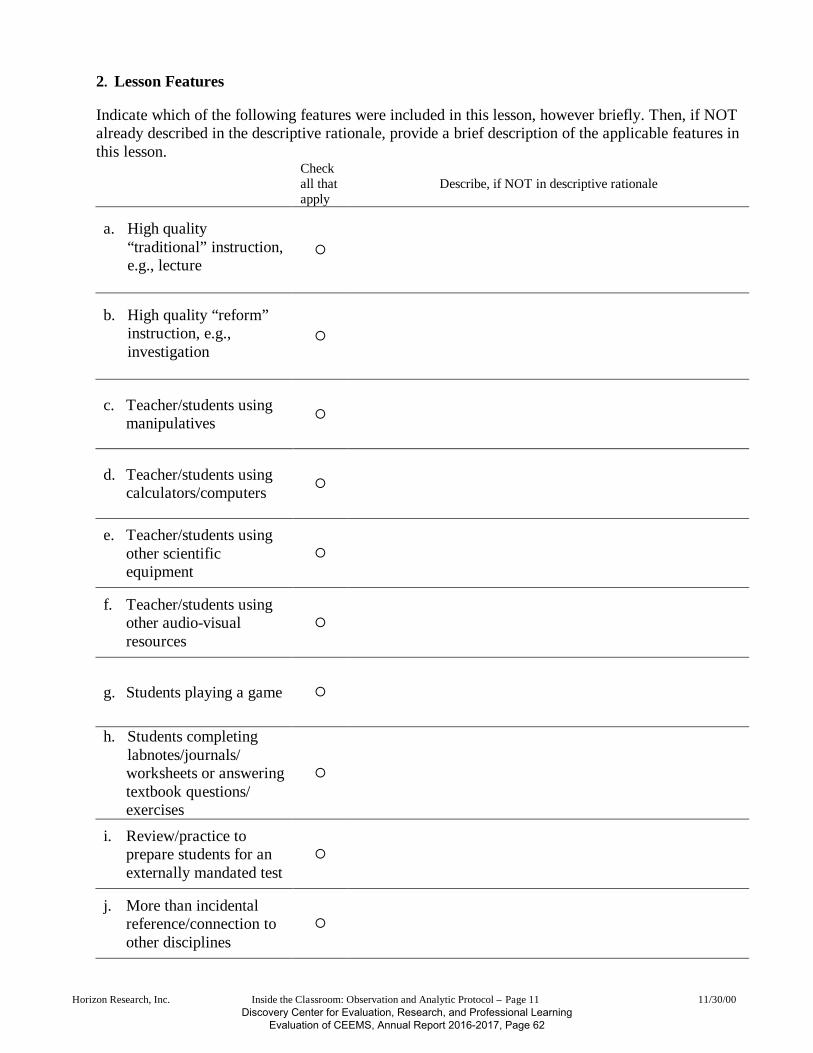
Horizon Research, Inc. Inside the Classroom: Observation and Analytic Protocol – Page 11 11/30/00
2. Lesson Features
Indicate which of the following features were included in this lesson, however briefly. Then, if NOTalready described in the descriptive rationale, provide a brief description of the applicable features inthis lesson.
Checkall thatapply
Describe, if NOT in descriptive rationale
a. High quality“traditional” instruction,e.g., lecture
¡
b. High quality “reform”instruction, e.g.,investigation
¡
c. Teacher/students usingmanipulatives ¡
d. Teacher/students usingcalculators/computers ¡
e. Teacher/students usingother scientificequipment
¡
f. Teacher/students usingother audio-visualresources
¡
g. Students playing a game ¡
h. Students completinglabnotes/journals/worksheets or answeringtextbook questions/exercises
¡
i. Review/practice toprepare students for anexternally mandated test
¡
j. More than incidentalreference/connection toother disciplines
¡
Discovery Center for Evaluation, Research, and Professional Learning Evaluation of CEEMS, Annual Report 2016-2017, Page 62

Discovery Center for Evaluation, Research, and Professional Learning
Evaluation of CEEMS, Annual Report 2016-2017, Page 63
Appendix C: CEEMS Qualitative Code Book
Code Name Code Definition Sub-Codes Trans-Disciplinary Curriculum TDC—1.0 Curriculum that includes information, concepts, terms,
examples, etc. from more than one academic discipline. Information Concepts Terms Examples Other
Inquiry-Based Learning IBL—2.0 Instructional practices that encourage, support, and/or require scientific inquiry processes. Scientific inquiry processes include question development, hypothesis development, designing a study, observing and making predictions, collecting and analyzing data, and interpreting results from an inquiry study.
Question Development Hypothesis Development Study Design Observation/Predictions Data Collection/Analysis Data Interpretation
Authentic Learning AUL—3.0 Curriculum and/or instruction that utilizes real-world examples, connects content to students’ everyday lives, and/or can be applied to novel real-world situations. Curriculum and/or instruction that utilizes real-world concepts or processes, such as project management or budgeting for materials.
Real-World Examples Everyday Connection Novel Situations Real-World Concepts Real-World Processes
Engineering Design Process EDP—4.0 Curriculum and instruction that situates the learning of STEM concepts within the engineering design process.
Study of Design Design Implementation Re-Design/Reflection
Project/Challenge/Problem-Based Learning
PBL—5.0 Curriculum and instruction that situates the learning of STEM concepts within the context of a challenge (problem, project) that must be solved.
Challenge Introduction Challenge Implementation Challenge Presentation / Summary Challenge Reflection/Revision
Career Exploration CAE—6.0 Discussion, research, or consideration of STEM careers in the context of science and/or math learning. Interaction with
Career Discussion/Lecture

Discovery Center for Evaluation, Research, and Professional Learning
Evaluation of CEEMS, Annual Report 2016-2017, Page 64
individuals who have direct professional knowledge of STEM careers.
Career Exploration (student-led) Professional Guest
Collaborative Learning Environment CLE—7.0 A learning environment that supports, encourages, and/or requires cooperation among students and/or between students and the teacher.
Student Collaboration
Student-Teacher Collaboration
Professional Learning Community PLC—8.0 Cooperation among/between teachers to prepare for and/or conduct lessons.
Integrated Curriculum/Instruction Instructional Support
Active Learning ACL—9.0 Learning that is engaging to students and/or requires active student participation, including teacher questioning/feedback. Active Learning includes hands-on experiences.
Hands-On
Engagement
Assessment (incl. review) Discussion of giving or preparing for an assessment, assessing other students, or self-assessment
Assignment of homework Discussions of the assignment of homework Classroom Management Discussions of actions or inaction, on the part of the teacher, to
control, redirect, address, or stop disruptive or off-task student behavior. Discussion of the orderliness and quietness--or lack thereof--of the classroom environment
Conceptual Learning Discussions of activities intended to foster or result in learning about concepts, vocabulary, etc.
Differentiated Instruction Discussions of the teacher's efforts to address individual students' learning needs, questions, or concerns
Direct instruction Discussions of direct instruction activities, including lecture, teacher demonstration, teacher fact-finding (i.e., questioning students in a way that requires a specific answer), specific directions given by the teacher, and teacher clarification of misconceptions through direct answers to student questions.
Misconceptions Teacher Directions
Teacher Questioning
Technology Discussion of technology use as part of the lesson. Seat Work Discussion of worksheets, seat-based assignments, and
individualized learning unconnected to a challenge.