EVALUATION OF BLASTING IN AN OPENCAST...
44
EVALUATION OF BLASTING IN AN OPENCAST MINE A THESIS SUBMITTED IN PARTIAL FULFILLMENT OF THE REQUIREMENTS FOR THE DEGREE OF Bachelor of Technology In Mining Engineering By ARYA PRAGYAN 108MN015 Department of Mining Engineering National Institute of Technology Rourkela-769008 2012
Transcript of EVALUATION OF BLASTING IN AN OPENCAST...
EVALUATION OF BLASTING IN AN OPENCAST MINE
A THESIS SUBMITTED IN PARTIAL FULFILLMENT OF THE
REQUIREMENTS FOR THE DEGREE OF
Bachelor of Technology
In
Mining Engineering
By
ARYA PRAGYAN
108MN015
Department of Mining Engineering
National Institute of Technology Rourkela-769008
2012

EVALUATION OF BLASTING IN AN OPENCAST MINE
A THESIS SUBMITTED IN PARTIAL FULFILLMENT OF THE
REQUIREMENTS FOR THE DEGREE OF
Bachelor of Technology
In
Mining Engineering
By
ARYA PRAGYAN
Under the Guidance of
Dr. MANOJ KUMAR MISHRA
Department of Mining Engineering
National Institute of Technology Rourkela-769008
2012

i
National Institute of Technology
Rourkela
CERTIFICATE
This is to certify that the thesis entitled “EVALUATION OF BLASTING IN AN
OPENCAST MINE” submitted by Sri Arya Pragyan in partial fulfilment of the
requirements for the award of Bachelor of Technology degree in Mining Engineering at
National Institute of Technology, Rourkela is an authentic work carried out by him under
my supervision and guidance.
To the best of my knowledge, the matter embodied in this thesis has not been submitted
to any other University/Institute for the award of any Degree or Diploma.
Dr.M.K.Mishra
Dept. Of Mining Engineering
National Institute of Technology
Rourkela – 769008

ii
ACKNOWLEDGEMENT
I wish to express my profound gratitude and indebtedness to Dr. M.K.Mishra,
Department of Mining Engineering, NIT Rourkela for introducing the present topic and
for his inspiring guidance, constructive criticism and valuable suggestion throughout the
project work. His able knowledge and supervision with unswerving patience guided my
work at every stage, for without his warm affection and encouragement the fulfilment of the
task would have been difficult.
I am also thankful to Mr Soumya Ranjan Mallik for his ass is tance and help in
collecting the data for analysis. Last but not least, my sincere thanks to all my friends and my parents who have patiently
extended all sorts of help for accomplishing this undertaking.
Date: Arya Pragyan
108MN015

iii
CONTENTS
Title Page no.
CERTIFICATE i
ACKNOWLEDGEMENT ii
ABSTRACT v
LIST OF FIGURES vi
CHAPTER 1
INTRODUCTION
1
1.1 General 2
1.2 Importance of better fragmentation 3
1.3 Optimum fragmentation
3
1.4 Aim and Objective of the project 3
1.5 Methodology 4
CHAPTER 2
LITERATURE REVIEW
5
2.1 Mechanism of Rock fragmentation by blasting 6
2.2 Parameters of rock breakage 6
2.2.1 Explosive properties 6
2.2.2 Rock properties 6
2.2.3 Charge loading and Blasting geometry 7
2.3 Study of Models developed for evaluation of energy utilised in fracture 8
2.4 The Kuz-Ram Model 9
2.5 Importance of joints and fracture in the degree of fragmentation
2.6 Different Image analysis system
CHAPTER 3
FIELD VISIT AND DATA COLLECTION
13
3.1 Image taking instrument 14
3.2 Data analysis programme 13
3.2.1 WipFrag 14
3.2.2 Algorithm 15
3.2.3 Methodology 15
3.2.4 Mode of analysis 16
3.2.5 Sources of error 16

iv
CHAPTER 4
RESULTS and ANALYSIS
20
4.1 Single image analysis result 21
4.2 Merged image analysis
32
4.3 calculation of uniformity coefficient and coefficient of curvature 33
CHAPTER 5
CONCLUSION AND RECOMMENDATION
34
5.1 Conclusion 35
5.2 Recommendation 35
REFERENCE 36
v
ABSTRACT
Fragmentation is one of the key issues in opencast blasting as properties like shape and size
of rock materials are very important information for production optimization. The degree of
fragmentation influences the economy of the mining process and hence the fragmentation of
blasted rock forms the basis to evaluate the quality of a blast. Digital image processing
technique is the latest fragmentation analysis tool. This technique has recently been proved
better than the conventional methods. Those methods are also time saving and offer accurate
measurement.
Wipfrag is an image analysis system for measuring size distribution for blasted or crushed
rock. It was developed by Wipware, Inc. Canada. It accepts images from a variety of sources
such as roving cam coders, digital camera, photographs, or digital files. It uses automatic
algorithms to identify individual fragments on the image, and measures the profile areas on
the blocks. It reconstructs a three-dimensional distribution using geometric probability.
In this study, 10 images from a blasted chromite muck pile were analysed through WipFrag
image analysis system. Both single and merged image analysis were done and the merged
image analysis was used to evaluate optimum fragmentation. Mean fragmented size of the
blasted rocks has been predicted from the analysis.

vi
LIST OF FIGURES
Figure/Plate
No.
Title
Page No.
3.1 Sample1 15
3.2 Sample2 15
4.1 Rock pile sample1 22
4.2 Size distribution obtained from sample1 22
4.3 Rock pile sample 2 23
4.4 Size distribution obtained from sample2 23
4.5 Rock pile sample 3 24
4.6 Size distribution obtained from sample 3 24
4.7 Rock pile sample 4 25
4.8 Size distribution obtained from sample 4 25
4.9 Rock pile sample 5 26
4.10 Size distribution obtained from sample 5 26
4.11 Rock pile sample 6 27
4.12 Size distribution obtained from sample 6 27
4.13 Rock pile sample 7 28
4.14 Size distribution obtained from sample 7 28
4.15 Rock pile sample 8 29
4.16 Size distribution obtained from sample 8 29
4.17 Rock pile sample 9 30
4.18 Size distribution obtained from sample 9 30
4.19
Rock pile sample 10 31
4.20 Size distribution obtained from sample10 31
4.21 Size distribution obtained from the merged analysis 32

1
CHAPTER-1
INTRODUCTION

2
INTRODUCTION
1.1 GENERAL
Mining has been the second most old profession or activity undertaken by humankind for
improving its habitation. The mining industry is ranked as the basic industries of early
civilisation. From ancient times to the present, mining has a lot of importance in human
existence. The essence of mining in extracting mineral from the earth is to drive an
excavation or excavations from the surface to the mineral deposit. If the excavation is entirely
open or done from the surface, it is termed as a surface mine. If the excavation is done for
human entry below the earth’s surface, it is called an underground mine.
To break the ore and loose it from the surrounding rock mass was the primary challenge to
the early miners. The unit operations of mining are the basic steps used to produce mineral
from the deposit, and the auxiliary operations that are used to support them. The steps
contributing directly to mineral extraction are production operation, which constitute the
production cycle of operations and the ancillary steps that support the production cycle are
termed as auxiliary operations. The production cycle employs unit operations that are
normally grouped into rock breakage and material handling. Breakage generally consists of
drilling and blasting (Shankar, 2001).
The degree of fragmentation affects the economy of the mining process. Different
characteristics of blasted rock such as fragmentation size, volume and mass are fundamental
variables affecting the economics of mining operation and the decisive factors for evaluating
the quality of a blast.
The properties of fragmentation such as size and shape are very important information for
the optimisation of the production. Three factors control the fragment size distribution: the
rock structure, the quantity of explosive and its distribution with in the rock mass.

3
1.2 IMPORTANCE OF BETTER FRAGMENTATION
Blasting results are generally accessed according to the ability of the mining system to cope
with the resulting muck. If the blasting fragmentation is poor, then so many difficulties will
arise. Some major problems due to poor fragmentation are described below
Secondary blasting will be necessary that is a cost-additive process.
The mucking rates gets reduced. The loading rate from a draw point is controlled by
the size and looseness of the muck (Bhandari,1996). Extensive manoeuvring is
required by the excavator to load large rocks and the bucket loads are usually reduced
when working coarse grain.
Poor fragmentation creates problems in handling and transport. It affects crushing and
efficiency of the transportation.
It also leads to poor milling performance. The development and growing application
of semi autogenous grinding mills and fully autogenous mills put increasing emphasis
on the size distribution of the ore delivered from the mine. Problems arise when the
size distribution varies with time and when the proportion of fines exceeds the
desirable levels (Winzer et al., 1983).
Hence a better fragmentation is desirable that would reduce all above problems.
1.3 OPTIMUM FRAGMENTATION
The rock fragmentation is optimum when it contains maximum percentage of fragments
in the required range of size. The desired size is the size which is in demand and can be
effectively used by the consumers without any further operation. The desired size varies
from consumer to consumer, (Venkatesh,2010). Optimum fragmentation results in higher
productivity, less wear and tear of the loading equipments and hence less maintenance of
equipment and plant.
1.4 AIM AND OBJECTIVES OF THE PROJECT
The goal of the investigation is to evaluate blasting efficiency through fragmentation.
The following specific objectives are determined to achieve the goal.
To critically review literature to obtain a background of different aspects of blast
performance, in general and fragmentation, in particular.
To view the fragmentation process and collect data.
4
To study the WipFrag image analysis system.
To analyse the data collected and find the optimum fragmentation.
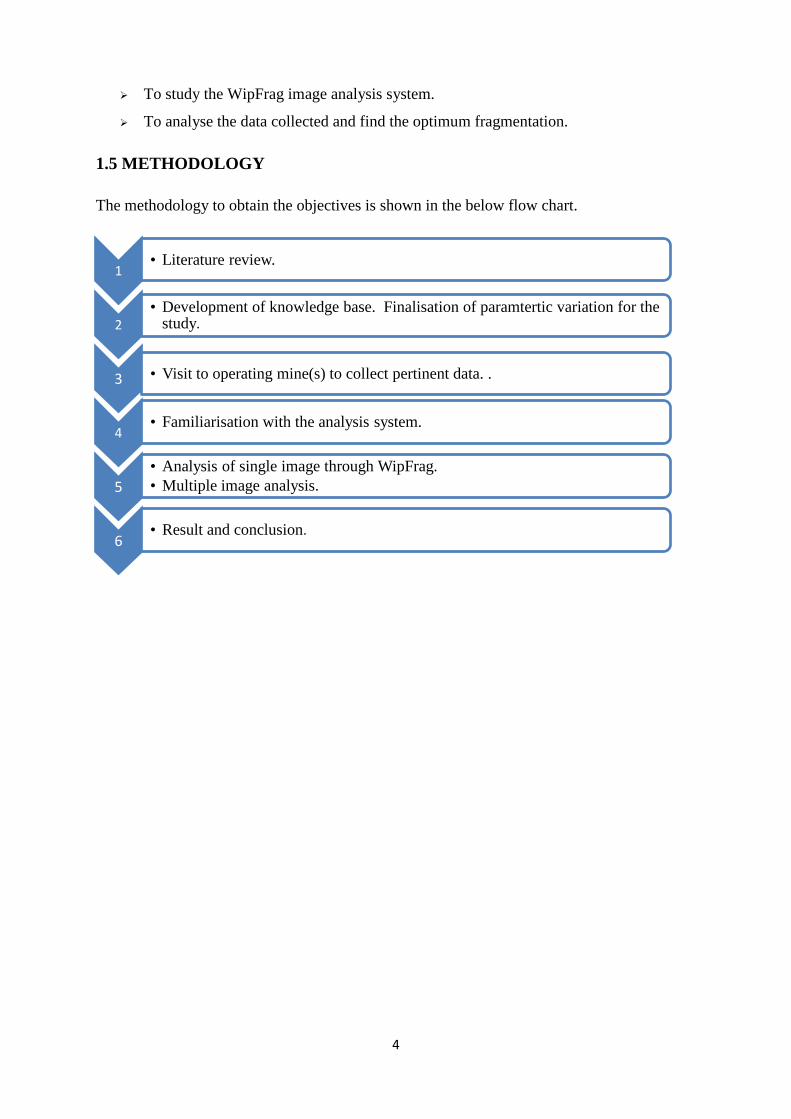
1.5 METHODOLOGY
The methodology to obtain the objectives is shown in the below flow chart.
1 • Literature review.
2 • Development of knowledge base. Finalisation of paramtertic variation for the
study.
3 • Visit to operating mine(s) to collect pertinent data. .
4 • Familiarisation with the analysis system.
5
• Analysis of single image through WipFrag.
• Multiple image analysis.
6 • Result and conclusion.

5
CHAPTER-2
LITERATURE REVIEW

6
LITERATURE REVIEW
2.1 MECHANISM OF ROCK FRAGMENTATION BY BLASTING
Various parameters like explosive parameters, blast geometry, strength of rock, geo-technical
conditions affect the degree of fragmentation of rock. The blasting operation causes the rock
fail due to crushing, tensile fracture, release of load, strain energy generation, shearing
action,flexural rupture etc.
After an explosive is initiated, the site around the drill hole will crush and will deform
plastically. The effects of an explosion can be divided into:
The charge explodes and it is divided into high-pressure, high-temperature gases.
The gases are applied to the borehole, which contains them .Then it creates a strain
field in the rock.
This strain field, due to its impulse nature, generates a strain wave that is propagated
in the rock and damages it.
This damage is the centre of the cracks in the rock.
The gas pressure is reduced via the cracks and separates the rock fragments.
The pressure of these gases applied to the face of the fragments, produces forces that
propel the fragments.
The fragments adopt a ballistic trajectory.
In areas if the damage to the rock was insufficient to generate fragments, the strain
wave continues its trajectory until it runs out of energy that dissipates by making the
rock vibrate.
2.2 DIFFERENT PARAMETERS OF ROCK BREAKAGE
The parameters are divided mainly into the following: Properties of explosive, Blast
geometry and charge loading parameters.
2.2.1 Explosive properties
Different properties of explosive like V.O.D, density of explosive, shock wave energy and
gas pressure, volume of gas, composition of explosives, powder factor, and type of
detonation, primers, nature and strength of explosives affect the rock fragmentation (Das,
2001).

7
2.2.2 Rock properties.
The properties of rock that affect the rock breakage or fragmentation are dip, strike,
compressive strength, tensile strength, shear strength, density, elastic property, bedding
plane structure, presence of geological disturbances like faults, folds, fractured ground.
2.2.3 Charge loading and blasting parameters and blast geometry.
The parameters which are included in this category are diameter and the length of shotholes
and charges, stemming material and height of stemming, degree of decoupling, method and
sequence of initiation, blasthole diameter, spacing and burden, distribution of explosive
along the hole, loading density, angle of blast hole, number of holes in a row, number of
rows, subgrade drilling, climate condition, amount of strata to be broken, requirement of
shape of the excavation, factors of loading, transporting and requirement of crushing and
screening etc.
2.3 STUDY OF MODELS DEVELOPED FOR EVALUATION OF ENERGY
UTILISED IN FRACTURING.
Good fragmentation `is a subjective matter and depends generally on the end use of the rock.
The necessary degree of fragmentation also depends upon the type and size of the equipment,
which is used for the subsequent handling of the fragments. Large loaders, trucks and
crushers generally allow large fragments. But larger equipments are not made for handling
larger fragments but for handling larger volume of materials. The ideally fragmented rock is
that which needs no further treatment after blast and the desired size can be different if the
blasted rock is to be transported to the dump area than if it has to be sent to the crusher.
McKenzie (1966) found, that the efficiency of all the subsystems is dependent on the
fragmentation.
Nielsen (1983) determined the optimum actual specific charge (kg/m3) considering the
influence on different subsystems of mining in an iron ore mine of Norway.
There are several models developed for evaluation of energy utilised in fracturing. The oldest
theory of Rittinger (1867) states that energy consumed in size reduction is proportional to
the reduction in particle size. Hence,
W=KR(1/D1-1/D2)
Where W=energy input for size reduction;
D1=initial particle size;

8
D2=final particle size; and
KR=the Rittinger's constant.
Kick (1885), on the other hand, concludes that breaking energy is related to the total strain
energy required by the particles to bring them to the point of failure and, hence, is a function
of volume.
Bond (1952) indicates in his “Third law” that the particle must first be strained to the
breaking point (volume dependent) and then new surface area is created during the failure
(area dependent).
Oka and Majima (1969) showed that all these laws of Rittinger, Bond and Kick can be best
described in the below equation.
W=K1 (P-6/B
-F-6/B
)
Where F=feed parameter;
P=Product diameter
Ki=constant
B=infinite(Kick’s law)
=6 (Rittinger’s law)
=12(Bond’s law)
Farmer et al. (1991) relate the difference in the pre and post blast specific surface area (SSA,
m−1
), which is surface area per unit volume of rock, as a measure of explosive energy
utilisation.
GB=W0 (SSA2-SSA1)n
Where SSA1 and SSA2 are the original and final specific surface areas of rock;
n is a constant exponent.
Wo is a complex variable affected by rock joints.
The above expression is based on various comminution equations, such as Kick's (1885) law
and Bond's (1952) theory.
It is evident from the above literature that when the explosive energy utilised in blasting is
high, the product becomes finer. But only explosive energy does not govern the the product
size but also the initial size of the rock which is to be fragmented. In widely jointed rocks, as
the average block size is more, so more explosive energy should be utilised to obtain the
desired product size. Whereas, in thinly bedded rocks, the explosive energy requirement
would be less if similar size of the product is to be obtained. In openly jointed rock mass, the
rock fragments get liberated from the rock mass instead of being fragmented. It is evident that

9
the stress wave is responsible for such liberation and the gas pressure can be poorly utilised to
extend the fractures created by the stress wave.
2.4 THE KUZ-RAM FRAGMENTATION MODEL
Various models have been put forward over the years, attempting to predict the size
distribution resulting from particularblast designs. The approaches fall into two broad camps.
Empirical modelling, which infers finer fragmentation from higher energy input, and
Mechanistic modelling, which considers the physics of detonation and the process of
energy transfer in well-defined rock for specific blast layouts, deriving the whole
range of blasting results.
The mechanistic approach is able to illustrate the effect of individual mechanisms in a better
way than empirical models.Due to limited scale, difficulty in collecting adequate about
detonation, it becomes difficult to apply it frequently. It requires greater or lesser degrees of
empiricism, so is not necessarily more accurate. For all practical purposes, the empirical
models are the ones used for daily blast design, and the present author published a scheme as
the Kuz–Ram model in the 1980s (Cunningham 1983 &1987).The adapted Kuznetsov
equation
Xm=AK-0.8
Q1/6
(115/RWS) 19/20
Where Xm = mean particle size, cm;
A = rock factor [it varies between 0.8 and 22, depending on hardness and structure – this is a
critical parameter];
K = powder factor, kg explosive per cubic metre of rock;
Q = mass of explosive in the hole, kg;
RWS = weight strength relative to ANFO,
The adapted Rosin–Rammler equation
RX=exp [-0.693(x/xm) n
]
Where Rx= mass fraction retained on screen opening x;
n = uniformity index, usually between 0.7 and 2
2.4.1 Parameters not taken into account
The primary assumption in empirical fragmentation modelling is that increased energy levels
result in reduced fragmentation across the whole range of sizes, from oversize to fines.
Although this isgenerally valid, but not necessarily applicable to real situations. Some of the
other factors that may override the expected relationship include:

10
Rock properties and structure (variation, relationship to drilling pattern, dominance
of Jointing).
Blast dimensions (number of holes per row and number of rows).
Bench dimensions (bench height versus stemming and sub drilling).
Timing between holes, and precision of the timing.
Detonation behaviour, in particular detonation velocity (VOD).
Decking with air, water and stemming.
Edge effects from the six borders of the blast, each conditioned by previous blasting .
Geological influences.
Thus, unless these parameters are catered for, it is possible for a model to be seriously wrong
in its estimation of blasting fragmentation. Assessing and dealing with the whole range of
inputs is the essence of blast engineering.
2.5 IMPORTANCE OF JOINTS AND FRACTURES ON THE DEGREE OF
FRAGMENTATION
Chakraborty et al. (1994) found the joint orientations can considerably influence the
average fragment size and shape.
Pal Roy and Dhar (1996) suggested a fragmentation prediction scale based on joint
orientation with respect to bench face.
Hagan (1995) concludes that the results of rock blasting are affected more by rock properties
than by any other variables. He also states that as the mean spacing between the joints,
fissures or cracks decreases, and the importance of rock material strength decreases while that
of rock mass strength increases. He also opines that in a rock mass with widely spaced joints,
the blasts are required to create many new cracks. In a closely fissured rock mass, on the
other hand, generation of new cracks is not needed and the fragmentation is achieved by
explosion gas pressure which opens the joints to transform a large rock mass into several
loose blocks. He again comments that the blasting efficiency is affected to a lesser degree by
the internal friction, grain size, and porosity compared to rock strength.
Jurgensen and Chung (1987) and Singh (1991) state that the blast results are influenced by
the overall formational strength in a direct way.

11
2.6 DIFFERENT IMAGE ANALYSIS SYSTEMS
Digital image processing using different software and hardware is the latest fragmentation
tool. It has replaced the conventional methods like visual analysis, photographic,
photogrammetry, and boulder count and sieve analysis technique. The conventional methods
possess inherent problems. Digital image processing method comprises of image capturing of
muck pile, scaling and image, filtering the image, segmentation of image, binary image
manipulation, measurement and stereo metric interpretation. The method is quick and very
accurate.
Research works have been carried out all over the world in developing image analysis
systems. Several countries have developed their own image analysis systems. Some of these
systems are:
IPACS
TUCIPS
FRAGSCAN
CIAS
GoldSize
WipFrag
SPLIT
Power Sieve
Fragalyst

12
Although all the systems claim that they are suitable for rock fragmentation analysis,limited
field experiments have been conducted so far to check the validity of the results.
Liu and Tran (1996) revealed that the results of fragmentation determined by three different
image analysis systems were not the same.
In India mostly WipFrag and Fraglyst are used for analysis of fragmentation. To compare the
output from both the software an experiment was done by Sudhakar et al (2003) where they
compared the output of fragmentation analysis by three methods, namely WipFrag, Fragalyst
and manual. The fragmentation size distribution curves for all the 10 photographs determined
by all the three methods are compared. The mean fragmentation size obtained by three
methods differed from each other and is not consistently higher or lower for a particular
method. The uniformity index determined by the Fragalyst was greater than 3, which shows
to very uniform distribution, which is not applicable to a blasted muck pile (Cunningham,
1983). WipFrag showed a uniformity index of 1.5, which is expected. The maximum size of
fragmentation at 100% passing determined by Fragalyst was smaller than the other two
methods which showed that Fragalyst had underestimated the range of fragmentation. Then
the merged results were found in this study. The merging facility was there in WipFrag and
Fragalyst. In case of manual method, all the individual results of 10 photographs were
combined and mass passing percentage at various sieve sizes were found. The size
distribution obtained from manual and WipFrag was similar, but Fragalyst gave a coarser
result. The Rosin-Rammler curves corresponding to the measured distribution were found out
and the deviation of D50 from the adjusted Rosin-Rammler curve is about 26% for WipFrag,
107% for Fragalyst and 24% for manual analysis. This indicates that Fragalyst is the least
accurate with respect to fines content and WipFrag has a better analysis than Fragalyst.

13
CHAPTER-3
FIELD VISIT AND DATA COLLECTION

14
3 FIELD VISIT AND DATA COLLECTION
One important objective of the investigation is to collect pertinent data. So a local chromite
mine was visited frequently and different parameters that affect the blasting was properly
studied. They are
Geology of the rock
Rock properties
Blasting pattern
Spacing
Burden
Powder factor
Blast hole dia,length.
Explosive type
After studying those basic parameters, different images from different angle of view of the
blasted muck pile were taken.
The chromite deposit occurs as discontinuous bands, lenses and pockets in the serpentinised
dunite peridotite. The mine visited comes under Boula-Nuasahi Complex belt and in this
region the chromite body is well exposed in the mines at the central part and confined to the
altered dunite peridotite. These bands have a NW-SE to NNW-SSE STRIKE with moderately
easterly dip and an average width of 5 meter. These discontinuous bands as well as the lences
of chrome ore occurring to the north and south have been affected by shearing and faulting
during post- consolidation stage.In the chromite mine visited, for data collection, v type
blasting pattern was followed with hole depth of 6.5m. the spacing and burden were 3 and 2.5
m respectively. PowergelC explosive was used with a powder factor of 2.8-2.9 kg.
3.1 IMAGE TAKING INSTRUMENT
A digital camera (make: Kodak) which features 8.2 mega pixel with 3x optical zoom was
used to take the image of blasted muck pile. While taking the images, two calibrated scales of
1 m each were used for measuring the scaling factor while analysing through the software
and also for the tilt option. A no of images were taken from different distances from the pile
with different angle of view. And later 10 samples were selected for the analysis. Some
samples are given here

15
Figure 3.1Image of sample1 Figure3.2 Image of sample2
3.2 DATA ANALYSIS PROGRAMME:
3.2.1 WipFrag
WipFrag is an image analysis system for sizing materials such as blasted or crushed rock
(Palangio et. al., 1985). It has also been used to measure other materials, such as ammonium
nitrate prills, glass beads, and zinc concentrates. From its inception about 10 years ago,
WipFrag and its predecessor WIEP have been designed to take full advantage of the
flexibility of general purpose microcomputers (in contrast to purpose designed image
analysing computers, which being designed for metallurgical or medical use place a number
of undesirable constraints on the use in mining and quarrying). This flexibility is apparent at
image input, processing, and output stages of analysis.
3.2.1 Algorithm
It uses automatic algorithms to identify individual blocks, and create outline “net”, using state
of the art edge detection. If desired or necessary, manual intervention (editing of the image
net) can be used to improve its fidelity. WipFrag measures the 2-D net and reconstructs a 3-
D distribution using principles of geometric probability (Maerz, 1996). A “missing fines”
correction based on empirical calibrations, can be used, if appropriate. Alternatively, the
WipFrag zoom-merge mode allows the combination of results either from several images of
the same scale (“merging”) which is necessary for reliable estimation of large blocks, or the
combination of results from several images at different magnification (“zoommerging”,
Morley et. al, 1996) for accurate estimation of fines or for system calibration.
3.2.3 Methodology
image processing

16
Image processing is used to transform the image rock fragments into a binary image
consisting of a net of block outlines.
Block Identification
The delineation of blocks in WipFrag involves the identification of block edges. This is done
in a two stage process. The first stage uses several conventional images
Processing techniques, including the use of thresholding and gradient operators. The
operators detect the faint shadows between adjacent blocks, and work best on clean images
with lightly textured rock surfaces. The second stage uses a number of reconstruction
techniques to further delineate blocks that are only partly outlined during the first stage.
These include both knowledge based and arbitrary reconstruction techniques, to complete the
net.
Edge Detection Variables (EDV)
For each of the image processing stages, parameters called Edge Detection Variables (EDV)
are accessible to the user, to optimize the edge detection process. The user has the choice of
adjusting individual variables to optimize one stage of the process, or selecting one of nine
preset combinations of EDV. These combinations are arranged in sequence to produce more
or fewer edges, depending on the nature of the image. Thus selecting more edges will reduce
the number of missing edges in a given image, while selecting fewer edges will reduce the
number of false edges in that image.
Editing to improve fidelity of the net
When improved accuracy is required, the fidelity of the net can be increased by manual
editing. A set of interactive editing tools, to draw lines and polylines, erase lines, or erase
areas, can be used to quickly remove false edges and draw missing edges to complete the net.
The net is normally displayed as an overlay on the original rock images, so the fidelity of the
net can at all times be evaluated by the user.
3.2.4 Modes of analysis
There are three methods of analysis that can be employed when using WipFrag, depending on
the relative accuracy required, and the time and resources available. Since WipFrag uses
geometric probability theory to unfold a 3-D distribution (Maerz, 1996), there are sometimes
smaller particles “missing” in individual images. These small fragments are not visible either
because they are too small to be resolved or are hidden behind larger particles (washed down
by rain or dust control watering). Because the proportion of these “missing fines” is highly
variable and difficult to predict, one of the following solutions is used.
Image analysis

17
Having identified a net of fragment outlines, WipFrag proceeds with the analysis portion of
the measurement. This involves a 2 dimensional measurement on the image, reconstruction of
a 3 dimensional distribution and the production of graphical output.
Measurement of Fragment Areas
In the final operation on the digital image, the block profile areas and shape factors are
measured on the outline net of block edges. To this point in the analysis, all operations are
performed sequentially on individual digital images in the computer main memory. At any
stage of the analysis, the image or net can be saved on disk for future reference (complete
with information such as scaling factors) or printed out on a laser printer to provide a
hardcopy for reference.
At this point the list of block profile areas is saved to a small, compact disk file. Subsequent
operations can be done immediately, or later, using one or several files at a time, including
merging multiple data files into a single analysis.
Reconstruction from 2-D to 3-D
The initial step in this phase of analysis is to divide the measured two dimensional
distributions into 40 size classes or “bins”. The 2-D to 3-D conversions, using principles of
geometric probability (Maerz, 1996), are performed on each bin. Initially the distribution is
converted into a 3-D frequency distribution, and then to a weight percent basis. Finally the
distribution if converted to a cumulative weight percent distribution.
Graphical and Other Output
WipFrag provides output in terms of graphs and hard copies of analysis results.
The user has the option of automatically accepting the default graph during the analysis, or
selecting several
Options:
Selection of graph type, either a histogram or a cumulative curve, or both.
Selection of one or more data files to be plotted, either sequentially, or in a combined
merged single graph.
Selection of a batch mode, in which sequential graphs are cycled and printed
automatically, without user intervention.
Selection of an output log files to record the results of each analysis.
Selection of value of rock density for the purpose of the calculation of weight.
Selection of a calibration value for the purposes of reconstructing the Rosin-Rammler
distribution, assuming calibration values have been pre-determined.
All graphs are imprinted with four labels:

18
A user supplied title.
A user supplied secondary title.
A WipFrag identifier, copyright, and the version number and the date of analysis.
The assigned user identifier, and the name of the data file from which the graph was
generated
3.2.5 Sources of error
There are potentially three sources of significant error in all vision based granulometry
systems; sampling errors, poor edge net fidelity, and missing fines.
Sampling Errors
Sampling errors, i.e. systematic bias in the process of taking an image of the fragmentation
have the potential to be the most serious of all the errors. Such errors result if the camera is
pointed at a place in the muck pile where the coarse blocks or zones of fines dominate.
Poor Delineation of Fragments
Poor delineation of individual fragments results in erroneous results. Poor delineation arises
from a combination of two sources:
Poor images, e.g. contrast too low or high, too grainy, lighting inadequate or uneven,
or the size of the fragments in the image is too small.
Highly textured rock, where shadows and/or colourings on the surface of the rocks are
as prominent as the shadows between rock fragments. Poor delineation of fragments
manifests itself in two ways (Eden and Franklin, 1986):
A group of fragments are mistakenly grouped together and identified as a single block. This
is knownas “fusion” and represents a bias toward overestimating the true size. A single
fragment is mistakenly divided into two or more individual blocks. This is known as
“disintegration” and represents a bias toward underestimating the true size. Experience with
WipFrag has shown that in most cases this problem is not severe. The relative amounts of
disintegration and fusion tend to counteract each other and typically the effect on the
measures of central tendency such as the mean or D50 tends to be slight. The effect on the
measures of variability, such as standard deviation or the slope of the cumulative curve, is
however somewhat more pronounced. The effects of fusion and disintegration can be
somewhat reduced by careful selection of the edge detection variables. The effect of fusion
and disintegration can be completely eliminated by editing the net. Experience with WipFrag
has shown that just a few minutes of editing per image can almost completely negate that
problem of fusion and disintegration (Eden and Franklin, 1996).
Missing Fines

19
Where the smallest fragments in a distribution are not delineated on the image, either because
they are too small relative to the image to be resolved, or they have fallen in and behind
larger fragments, there is clearly a bias towards over representing the size of the distribution.
Where the distribution has a relatively narrow size range (well sorted, or poorly graded) this
is normally not a problem. However, where the distribution has a relatively wider size range
(poorly sorted, or well graded), typically with size differences of more than 1 order of
magnitude, missing fines start affecting the measurement results. WipFrag has the ability to
deal with the missing fines problem using either an empirically based calibrations or by using
multiple images taken at different scales of observation.
3.2 Single analysis of images
Using WipFrag image analysis software, all the 10 images are analysed individually. The size
distribution obtained from the single image analysis cannot provide the optimum size
distribution as they do not represent the whole area.
3.3 Merged image analysis
The results obtained from the single image analysis cannot be conclusive as it will not cover
the whole area. But if they are merged and analysis with WipFrag, then we can get the
optimum size distribution and correct parameters.

20
CHAPTER-4
RESULT AND ANALYSIS

21
RESULT AND ANALYSIS
4.1 SINGLE IMAGE ANALYSIS RESULTS
Following the methodology of image analysis in WipFrag system, the results of single image
from 1 to 10 are given with the images. The image analysis shows the size distribution. The
different notations shown in the image analysis curve are described below.
Dn: Nominal diameter, or equivalent spherical diameter, i.e. the diameter of a sphere with the
same volume as that computed for the fragment.
D10: Percentile sizes. For example D10 is the ten-percentile, the value of De for which 10% by
weight of the sample is finer and 90% coarser. In terms of sieving, D10 is the size of sieve
opening through which 10% by weight of the sample would pass.
D50:The Median or 50-percentile, the value of Dn for which half the sample weight is finer
and half coarser.
Mean: Arithmetic mean (average) fragment size, equal to the sum of all equivalent spherical
diameters divided by the total number of particles [Dav (m)]
Mode: Most common sized particle, the geometric mean Dn size class interval for the class
containing the greatest number of net elements (fragments) [Dn (m)]
N:Rosin-Rammler Uniformity Coefficient, equal to the slope of the Rosin-Rammler straight
line fitted to the data in log-log co-ordinates.
Xc:Characteristic Size, the intercept of the Rosin-Rammler straight line fitted to the
WipFragDn data in log-log co-ordinates. This is equivalent to the D63.2.

22
Figure 4.1 Photograph of rock pile sample1
Figure4.2 Size distribution obtained from sample1

23
Figure4.3 Photograph of rock pile sample2
Figure4.4 Size distribution obtained from rock pile sample 2

24
Figure4.5 Photograph of rock pile sample3
Figure 4.6 Size distribution obtained from rock pile sample 3

25
Figure4.7 Photograph of rock pile sample4
Figure4.8 Size distribution obtained from rock pile sample 4

26
Figure4.9 Photograph of rock pile sample5
Figure4.10 Size distribution obtained from rock pile sample 5.
27
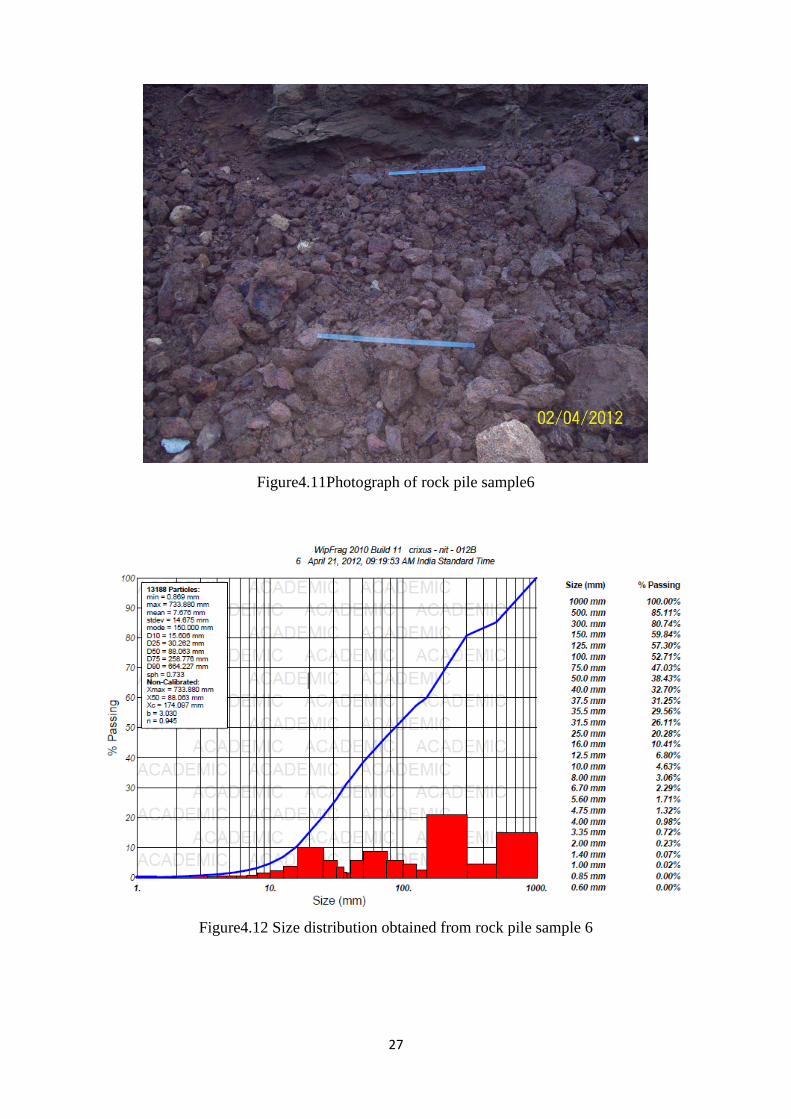
Figure4.11Photograph of rock pile sample6
Figure4.12 Size distribution obtained from rock pile sample 6

28
Figure4.13 Photograph of rock pile sample7
Figure4.14 Size distribution obtained from rock pile sample 7

29
Figure4.15 Photograph of rock pile sample8
Figure4.16 Size distribution obtained from rock pile sample 8

30
Figure4.17 Photograph of rock pile sample9
Figure4.18 Size distribution obtained from rock pile sample 9

31
Figure4.19 Photograph of rock pile sample10.
Figure4.20 Size distribution obtained from rock pile sample 10.
32
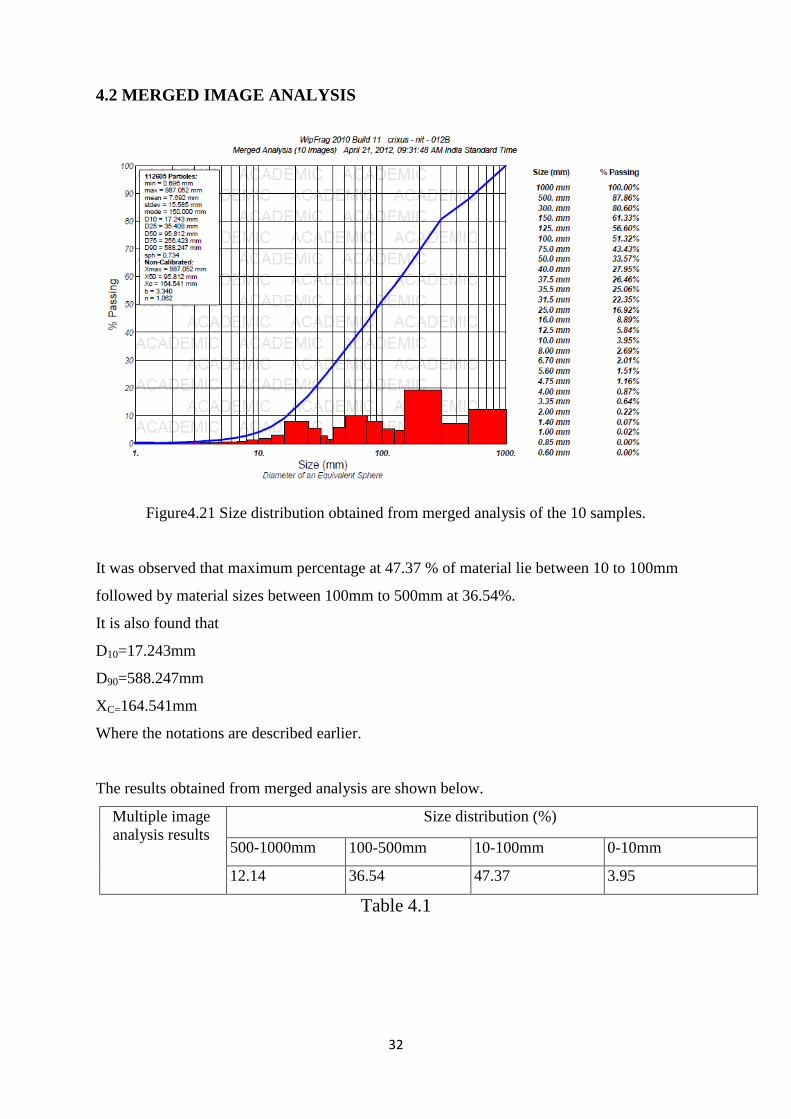
4.2 MERGED IMAGE ANALYSIS
Figure4.21 Size distribution obtained from merged analysis of the 10 samples.
It was observed that maximum percentage at 47.37 % of material lie between 10 to 100mm
followed by material sizes between 100mm to 500mm at 36.54%.
It is also found that
D10=17.243mm
D90=588.247mm
XC=164.541mm
Where the notations are described earlier.
The results obtained from merged analysis are shown below.
Multiple image
analysis results
Size distribution (%)
500-1000mm 100-500mm 10-100mm 0-10mm
12.14 36.54 47.37 3.95
Table 4.1
33
4.3 CALCULATION OF UNIFORMITY COEFFICIENT AND COEFFICIENT
OF CURVATURE
4.3.1 Uniformity Coefficient Cu (measure of the particle size range)
Cu is also called Hazen Coefficient. Hazen found that the sizes smaller than the effective size
affected the functioning of filters more than did the remaining 90 percent of the sizes. To
determine whether a material is uniformly graded or well graded he proposed the following
Cu= D60 / D10
Cu< 5 ----- Very Uniform
Cu = 5-15 ----- Medium Uniform
Cu>15 ----- Non uniform
From the above merged analysis graph (fig 4.21), we found that D60 =149mm
D10=17.243mm
Hence Cu =149/17.243 =8.64
So it shows that the size distribution is non-uniform.
4.3.2Coefficient of Gradation or Coefficient of Curvature Cg
(Measure of the shape of the particle size curve)
Cg= (D30)2/ (D60 X D10)
Cg from 1 to 3 shows the distribution is well graded or desired sizes.
From the merged analysis graph it is found that D30=45mm
Putting the value of D60 =149mm, D10=17.243mm and D30=45mm in the above given
formulae we get the value of Cg=0.79 which is less than 1.
So the distribution is poor graded.

34
CHAPTER-5
CONCLUSION AND RECOMMENDATION

35
5.1 CONCLUSIONS
The investigation was carried out to evaluate the efficiency of blasting process of the target
mine. The images taken were only ten. The analysis was based on those ten images. Both
single and merged image analysis were carried out. The following conclusions are drawn
from the analysis.
The optimum size distribution of the 10 samples with merged analysis contain the size
Between 500-1000mm:12.14%
Between 100-500mm:36.54%
Between 10-100mm:47.37%
Less than 10mm:3.95%
The blasted pile contained maximum percentage of material in the size range 10 to
100mm with a percentage of 47.37 followed by between 100 to 500mm with a
percentage of 36.54.
The coefficient of curvature is less than 1 thus classifying that the distribution is not
well graded.
The WipFrag system is less time consuming analysis method than the traditional
approaches as sieving with a better accuracy. Multiple images can be analysed
individually as well in combined form.
5.2RECOMMENDATION FOR FURTHER RESEARCH
This investigation was undertaken as a part of final year project with a fixed time limit.
Hence many aspects of fragmentation could not be investigated. In future research may be
carried out by considering more blasting parameters as well as by analysing more images for
better understanding of the subject in detail.

36
REFERENCES
1. Maerz, N. H., Palangio, T. C., and Franklin, J. A., 1996. WipFrag image based
granulometry system. Proceedings of the FRAGBLAST5 Workshop on Measurement
of Blast Fragmentation, Montreal, Quebec, Canada, 23-24 Aug., pp. 91-99.
2. Maerz, N. H., 1996. Reconstructing 3-D Block Size Distributions from 2-D
Measurements on Sections. Proc. ISRM/Fragblast 5 Workshop and Short Course on
Fragmentation Measurement, Montreal, Publi.A.A.Balkema.
3. Eden, D. J., and Franklin, J. A., 1996. Fusion anddisintegration problems. Proc.
ISRM/Fragblast 5 Workshop and Short Course on Fragmentation Measurement,
Montreal, Publi. A. A. Balkema.
4. Shankar, M.R., Blasting technology for mining, Mangalam Publications, first edition,
2010, pp. 16-18.
5. Das, S.K., Explosives and Blasting Practices in Mines, Lovely Prakashan, Dhanbad,
second edition, 2001, pp. 324-327
6. Bhandari, S., 1996, Changes in Fragmentation process with blasting conditions, Rock
Fragmentation by Blasting , Fragblast 5, 301-309, Balkema, Montreal.
7. Winzer, S.R., Anderson, D.A., Ritter, A.P., 1983, Rock fragmentation by explosives,
Proceedings of the first International Symposium on Rock Fragmentation by Blasting,
225-249, Lucea, Sweden.
8. Venkatesh, M., Limestone rock fragmentation analysis using WipFrag, unpublished
B.Tech thesis, NIT Rourkela, 2010, pp. 11-12.
9. Cunningham, C.V.B 1983. The Kuz-Ram model for prediction of fragmentation from
blasting. In R. Holmberg and A Rustan (eds), Proceedings of first International
Symposium of Rock Fragmentation b y blasting. Lulea 439-454.
10. Sudhakar, J., Adhikari, G. R., Gupta, R.N., Comparision of Fragmentation
Measurements by Photographic and Image Analysis Technique, 2005, pp. 160-167.
11. Chakraborty,A.K., Jethwa,J.L., Paithankar, A.G.,1994. Effect of Joint orientation and
rock mass quality on tunnel blasting. Engineering geology 37, 247-262.
12. Bond, F.C., 1952. The third theory of comminution. Transactions of the American
Institute of Mining Engineers 193, 494-496.
13. Scott, A., 1996. Blastability and blast design . Proc. 5th
International Symp. On Rock
fragmentation by b lasting , Montreal, Canada. 25-29 Sept. Colorado School of
Mines, Colorado, Balkema, Rotterdam, Netherlands, iv-63-iv-68.


![[3786] – 21](https://static.fdocuments.in/doc/165x107/61da88ea91fbc310454c9d37/3786-21.jpg)