
Evaluation of Angular Velocity Data from Inertial ...
57
Clemson University TigerPrints All eses eses 5-2013 Evaluation of Angular Velocity Data from Inertial Measurement Units for Use in Clinical Seings Chelsea Ex-lubeskie Clemson University, [email protected] Follow this and additional works at: hps://tigerprints.clemson.edu/all_theses Part of the Biomedical Engineering and Bioengineering Commons is esis is brought to you for free and open access by the eses at TigerPrints. It has been accepted for inclusion in All eses by an authorized administrator of TigerPrints. For more information, please contact [email protected]. Recommended Citation Ex-lubeskie, Chelsea, "Evaluation of Angular Velocity Data from Inertial Measurement Units for Use in Clinical Seings" (2013). All eses. 1598. hps://tigerprints.clemson.edu/all_theses/1598
Transcript of Evaluation of Angular Velocity Data from Inertial ...

Clemson UniversityTigerPrints
All Theses Theses
5-2013
Evaluation of Angular Velocity Data from InertialMeasurement Units for Use in Clinical SettingsChelsea Ex-lubeskieClemson University, [email protected]
Follow this and additional works at: https://tigerprints.clemson.edu/all_theses
Part of the Biomedical Engineering and Bioengineering Commons
This Thesis is brought to you for free and open access by the Theses at TigerPrints. It has been accepted for inclusion in All Theses by an authorizedadministrator of TigerPrints. For more information, please contact [email protected].
Recommended CitationEx-lubeskie, Chelsea, "Evaluation of Angular Velocity Data from Inertial Measurement Units for Use in Clinical Settings" (2013). AllTheses. 1598.https://tigerprints.clemson.edu/all_theses/1598

EVALUATION OF ANGULAR VELOCITY DATA FROM INERTIAL
MEASUREMENT UNITS FOR USE IN CLINICAL SETTINGS
A Thesis
Presented to
the Graduate School of
Clemson University
In Partial Fulfillment
Of the Requirements for the Degree
Master of Science
Bioengineering
by
Chelsea L. Ex-Lubeskie
May 2013
Accepted by:
Dr. Lisa Benson, Committee Chair
Dr. Randy Hutchison
Dr. John DesJardins

ii
ABSTRACT
Evaluating the human gait cycle with inertial measurement units (IMU) may
prove beneficial for applications such as diagnoses of musculoskeletal diseases and
assessment of rehabilitation regimes. An IMU system is potentially applicable for
diagnosing and assessing rehabilitation outcomes for a variety of neuromuscular diseases
since it is small, portable, and less expensive than a camera system. IMUs directly
measure angular velocity, whereas position data from a camera system must be processed
twice to obtain this information. The purpose of this research is to determine repeatability
of IMU angular velocity data, and agreement between angular velocity data from an IMU
system and a camera system during normal gait. From this data, the feasibility of using
IMU systems in clinical or rehabilitative settings for obtaining reliable angular velocity
data will be determined.
Lower limb motion data was collected simultaneously from six XSens MTx IMUs
(XSens Technologies, Enschede, The Netherlands) and an 8-camera Qualisys Motion
Capture system (Pro-Reflex, 240 Hz system). Each IMU consists of three orthogonal
accelerometers, gyroscopes, and magnetometers. Data from 4 subjects (3 males, 2
females) were collected after an initialization technique before each trial to reduce effects
of electro-magnetic interference with the IMUs. Knee joint angular velocities (Gx, Gy,
Gz) corresponding to appropriate knee joint angles (flexion/extension,
adduction/abduction, and internal/external rotations) from both systems were used in this
analysis. Coefficients of variation (COV) were calculated for both IMU and camera data
to determine variability of data from both systems. Knee joint Average angular velocities

iii
from both systems for each subject and limb were plotted together to visually evaluate
correlation between data sets. F-test analyses were performed on linear models of the
data to determine areas of co-linearity within the gait cycle, and at different intervals of
angular velocities.
The IMUs had lower COV’s than the camera system, likely due to the fact that the
IMUs directly measure angular velocity, and camera system derives angular velocity
from position data. However, these differences were not statistically different, likely due
to variability within trials for individual subjects. Linearity between camera system and
IMU angular velocity was visually observed only about the flexion/extension axis during
segments of the gait cycle occurring from 0-4% (heel strike) and 65-100% (swing phase)
of the gait cycle. Comparisons about the adduction/abduction and internal/external axes
showed evidence of linearity for lower angular velocities. Linear regression statistics
showed that the only correlational trend between the two systems was around 8-12% of
the gait cycle for all three rotational axes. This may be due to drift of the IMU data.
Although the camera system is the “gold standard” in motion analysis, IMUs may be
used for applications in which angular velocity for a flexion-extension movement at low
joint angles is being evaluated. Future studies will include a larger sample population,
and evaluate specific movements within human gait that affect drift of the IMUs. In
addition, other IMU system designs could be evaluated for clinical use, and other
algorithms that further reduce the effects of drift should be implemented.

iv
DEDICATION
I would like to dedicate this manuscript to all of my family and friends that have
supported, encouraged, and pushed me to keep going over my years at Clemson
University. Thank you to Ashley, Laura, Shelley, Lauren C, Lauren E, Courtney,
Andrew, and Shawqi for being true and constant friends to me over the years, and to
Megan, Amelie, Caleb, and Justin for the encouragement and laughs this past year. To
my brother, Connor, thank you for being a wonderful sibling and helping me to
remember to have fun. I would most importantly like to thank my parents for all of their
love. They have shown unwavering support in my personal and academic endeavors, and
would not be where I am today without their faith in me.

v
ACKNOWLEDGMENTS
I would like to thank of all the people who have helped, guided, and supported me
during my graduate career at Clemson. I would like to acknowledge Maria Martin for
helping me with everything academically related for the past two years. I would like to
thank Dr. Pat Gerard for his assistance with the statistics analysis for this project. I would
acknowledge my two committee members Dr. John DesJardins and Dr. Randy Hutchison.
I further would like to thank Dr. Randy Hutchison for the guidance, support, and efforts
with my research topic. I would most importantly like to thank my advisor, Dr. Lisa
Benson. You have always been caring, understanding, and supportive. I appreciate you
always challenging me to be the best I can be. I could not have asked for a better advisor,
and thank you for always supporting my multiple endeavors outside of my research topic.

vi
TABLE OF CONTENTS
TITLE PAGE………………………………………………………………………….......i
ABSTRACT ........................................................................................................................ ii
DEDICATION ................................................................................................................... iv
ACKNOWLEDGMENTS .................................................................................................. v
LIST OF FIGURES ......................................................................................................... viii
LIST OF TABLES .............................................................................................................. x
Chapter 1 - Introduction ...................................................................................................... 1
Background ..................................................................................................................... 1
Human Gait ..................................................................................................................... 1
Gait Analysis ................................................................................................................... 3
Camera Based Gait Analysis Systems ........................................................................ 4
MEMS Based Motion Tracking: Inertial Measurement Units .................................... 6
Joint Angular Velocity .................................................................................................... 9
Clinical Applications ..................................................................................................... 10
Parkinson’s Disease .................................................................................................. 10
Stroke ........................................................................................................................ 11
Spinal Cord Injury ..................................................................................................... 15
Cerebral Palsy ........................................................................................................... 16

vii
Summary of the Literature ............................................................................................ 17
Research Objectives ...................................................................................................... 18
Chapter II – Comparison of Accuracy and Precision Between Camera and IMU Systems
........................................................................................................................................... 19
Materials and Methods .................................................................................................. 19
Data Collection ......................................................................................................... 19
Data Analysis ............................................................................................................ 20
Data Comparison ...................................................................................................... 21
Results ........................................................................................................................... 23
Coefficient of Variation ............................................................................................ 23
Linear Regression Analyses ...................................................................................... 28
Discussion ..................................................................................................................... 30
Chapter III – Conclusions and Future Considerations ...................................................... 32
References ......................................................................................................................... 35
Appendices ........................................................................................................................ 39
Appendix A: Camera vs. Sensor Data ........................................................................... 39
Appendix B: Linear Correlation Graphs ....................................................................... 43

viii
LIST OF FIGURES
Figure 1: A Normal Human Gait Cycle .............................................................................. 2
Figure 2: XSens MTX IMU with Reference Coordinates
(http://www.brighton.ac.uk/sohp/research/resources/xsens.php) ............................... 8
Figure 3: GAITRite mat along with data outcomes seen on a computer screen after a
patient has successfully completed an analysis.
(http://www.gaitrite.com/geriatrics.html) ................................................................. 12
Figure 4: Gait Events that are affected by Neuromuscular Pathologies. Comparing Paretic
and Non Paretic Leg (Yang et al. 2012).................................................................... 14
Figure 5: Initialization positions to minimize drift associated with yaw (IE) and align
object axes. Projected horizontal component (left) and vertical position (right).
(Adapted from Hutchison, 2011) .............................................................................. 19
Figure 6: Comparison of camera system and IMU system of knee angular velocity of
Subject 3 for 1 gait cycle. Gx (top), Gy (middle), Gz (bottom)................................ 25
Figure 7: Evaluation of Linear Correlation between Camera and Sensor systems for
Subject 3 for 1 gait cycle. Gx (top), Gy (middle), Gz (bottom). Data points represent
points within gait cycle and are shown to evaluate clustered area............................ 27
Figure 8: A Visual Representation of co-linearity between camera and sensor systems
plotted against a Typical Knee Flexion-Extension Angle Curve .............................. 28
Figure 9: Ranges and Points of Angular Velocities at which Camera and Sensor Angular
Velocities are Co-Linear ........................................................................................... 29

ix
Figure 10: Comparison of camera system and IMU system of knee angular velocity for
walking gait of 4 subjects. ........................................................................................ 39
Figure 11: Linear correlation between camera system and IMU system of knee angular
velocity for walking gait of 4 subjects. ..................................................................... 43

x
LIST OF TABLES
Table 1: Coefficients of Variation (COV) for angular velocities of the knee averaged over
multiple trials for each subject and limb. Average COV values for sensor and
camera systems in each plane of motion shown in bottom row................................ 23
Table 2: Percentages of Gait Cycle In which co-linearity occurred ................................. 28
Table 3: Ranges and Points of Angular Velocities at which Camera and Sensor Angular
Velocities are Co-Linear ........................................................................................... 29

1
CHAPTER 1 - INTRODUCTION
Background
The ability to quantitatively measure gait kinematics for a variety of purposes
spanning from rehabilitation to evaluating osteoarthritis progression is crucial for patient
outcomes. Motion capture systems have the ability to define spatio-temporal, kinematic,
and kinetic parameters which is advantageous for quantifying patient outcomes
throughout recovery, or over the lifetime of a disease that affects their gait.
Human Gait
Human gait, or locomotion, is how people walk, and can be normal or abnormal.
The physical activity of walking involves not only the musculoskeletal system, but also
the central nervous system and peripheral nervous system (Sadeghi et al. 2000, Vaughan,
Davis & O'connor 1992). For a walking event to occur, there are a sequence of events
that occur starting at the central nervous system. First, the central nervous system center
that controls locomotion must be registered and activated to send a signal; then a gait
signal is sent to the peripheral nervous system. The muscles contract and forces and
moments are generated across the synovial joints. Skeletal segments regulate the joint
moments and forces, the segments move, and finally ground reaction forces are generated
from moving (Vaughan, Davis & O'connor 1992).
A gait cycle is broken into two main phases, swing and stance. Stance phase
accounts for approximately 60% of the gait cycle while swing phase accounts for 40%
(Vaughan, Davis & O'connor 1992, DeLisa 1998).

2
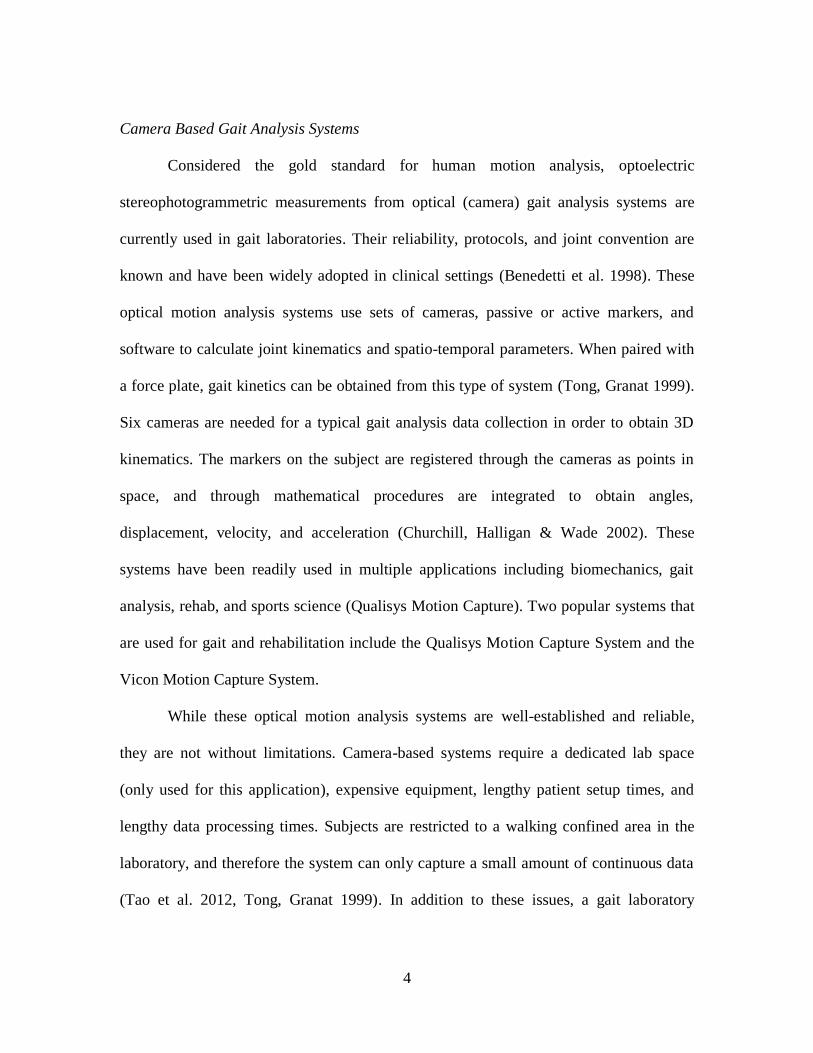
Figure 1.0: A Normal Human Gait Cycle (DeLisa 1998)
Figure 1: A Normal Human Gait Cycle
A complete gait cycle is defined as the sequence of motion that occurs from heel
strike to heel strike of the same foot. Figure 1.0 (DeLisa 1998) shows a breakdown of the
specific phases of the gait cycle and the stance and swing phases can be further broken
down. The stance phase can be divided into single and double limb support, while the
swing phase consists of initial swing, midswing, and terminal swing. The muscles of the
leg including the quadriceps, gastrocnemius, soleus, gluteus, and others aid in helping act
as shock absorbers, stabilizers, accelerators, and for general control of the feet and legs
(Vaughan, Davis & O'connor 1992, DeLisa 1998). It is important to note that when there
is pathology affecting locomotion, the time spent in each of swing and stance phase may
change. For example, a patient who has osteoarthritis in their left hip will spent almost

3
80% of their time in the stance phase for their unaffected limb, allowing for them to rely
on that limb and likely reduce their pain (Vaughan, Davis & O'connor 1992).
The body acts in a sinusoidal motion with respect to the center of mass (COM),
this is located midway between hip joints, and anterior to the second sacral vertebra. The
body’s COM has both vertical and lateral displacement, which both average about 5 cm.
The body moves in a relatively low energy state with normal gait patterns, however,
pathology can affect the vertical and lateral displacements of the COM, and in turn
increase the energy expenditure of locomotion. The observation of COM displacement is
referred to as the smoothness of gait, and is a visual clinical observation used in
diagnosing or evaluating patients (DeLisa 1998).
Gait Analysis
Gait analysis is a commonly used tool in many clinical and rehabilitation settings.
Research surrounding gait analysis has been going on since the 19th
century, and it’s
widespread use concerning biomechanics and bioengineering began with the
commercialization of video camera systems (Tao et al. 2012).This type of analysis can
provide valuable kinetic, kinematic, and EMG data that is useful in treating a variety of
disorders or evaluating rehabilitation progress. Kinematics of joints describes the
movements of joints and their various components. Kinetic data focuses on the forces and
moments around the joints, and often kinematic data is used in conjunction with kinetic
data. EMG data provides information about muscle activity and activation (Tao et al.
2012, Aminian et al. 2004). Kinematic data (joint angles, velocities, and accelerations) is
able to provide a great deal of insight into gait abnormalities (Jasiewicz et al. 2006).
4
Camera Based Gait Analysis Systems
Considered the gold standard for human motion analysis, optoelectric
stereophotogrammetric measurements from optical (camera) gait analysis systems are
currently used in gait laboratories. Their reliability, protocols, and joint convention are
known and have been widely adopted in clinical settings (Benedetti et al. 1998). These
optical motion analysis systems use sets of cameras, passive or active markers, and
software to calculate joint kinematics and spatio-temporal parameters. When paired with
a force plate, gait kinetics can be obtained from this type of system (Tong, Granat 1999).
Six cameras are needed for a typical gait analysis data collection in order to obtain 3D
kinematics. The markers on the subject are registered through the cameras as points in
space, and through mathematical procedures are integrated to obtain angles,
displacement, velocity, and acceleration (Churchill, Halligan & Wade 2002). These
systems have been readily used in multiple applications including biomechanics, gait
analysis, rehab, and sports science (Qualisys Motion Capture). Two popular systems that
are used for gait and rehabilitation include the Qualisys Motion Capture System and the
Vicon Motion Capture System.
While these optical motion analysis systems are well-established and reliable,
they are not without limitations. Camera-based systems require a dedicated lab space
(only used for this application), expensive equipment, lengthy patient setup times, and
lengthy data processing times. Subjects are restricted to a walking confined area in the
laboratory, and therefore the system can only capture a small amount of continuous data
(Tao et al. 2012, Tong, Granat 1999). In addition to these issues, a gait laboratory
5
requires specially trained personnel to apply the markers (Aminian et al. 2004). The
markers can also be obscured from sight while a study is being conducted, resulting in
incomplete data (Mayagoitia, Nene & Veltink 2002). Soft tissue artifacts pose an issue
for this technology. Due to this issue, camera based gait systems have a limitation in
measuring internal/external and varus/valgus rotations as precisely as flexion/extension
rotations of the knee. Measurements can be improved by using intracortical pins that
connect directly to the bone, but this invasive procedure is obviously not conducive to the
patient (Sadeghi et al. 2000). In addition, optional motion analysis systems do not directly
measure joint angles or joint angular velocities. 3D optical tracking systems use various
calibration techniques, whether it be with a wand with reflective markers attached or the
patients standing with the markers in place, to orient the markers in a reference frame and
identify specific anatomical landmarks including feet, knees, and hips (Churchill,
Halligan & Wade 2002, Windolf, Götzen & Morlock 2008). A mathematical procedure
takes the views of the markers from several cameras and integrates them into 3D position
data within space. From this data, joint angles can be calculated from subtracting position
data, and joint angular velocities can be obtained by differentiating joint angles. There is
no standardized calibration or reference frame; however most optical motion systems use
the right hand rule for 3D joint analysis (Churchill, Halligan & Wade 2002, Soutas-Little
1998). Considering the calibration technique and numerous mathematical steps taken to
obtain angular velocity, error could be acquired during this process.
Costs of setting up and running a gait laboratory with an optical motion analysis
are high; additionally, costs to the patient are high both in terms of money and time. The

6
total time for a patient for gait analysis is around 2 hours, and costs about $2000, of
which approximately $500 is reimbursed (Simon 2004). On average, a gait laboratory
requires 70 therapist hours, 120 technician hours, and 25 clerical hours per month.
Hospitals do not typically have the budget to allow for gait laboratories, and if they do,
the laboratory typically focuses on only one gait disorder, such as cerebral palsy, leaving
victims of stroke or Parkinson’s with less effective clinical measurements and
observation techniques (Churchill, Halligan & Wade 2002).
In 1999, the NIH stated that future research studies concerning gait analysis
needed to be focused on efficacy, outcomes, and cost-effectiveness of these procedures
(Simon 2004). There is a push to take gait analysis out of the laboratory, and into
environments that allow more varied motions. Motor performance as measured in the
laboratory setting may not accurately reflect actual functionality seen in normal life
(Favre et al. 2008). An example is stair climbing, which has been proven to be a more
critical pre-clinical assessment than walking for fall risk in geriatric patients. Stair
climbing cannot be performed inside a confined laboratory space. It would be
advantageous to have a more cost-effective, less bulky, and more adaptable technology
that can be worn for long periods of time for data collection (Bamberg et al. 2008,
Bergmann, Mayagoitia & Smith 2009). There are all unmet needs that the “gold
standard” optical motion analysis systems will not be able to satisfy.
MEMS Based Motion Tracking: Inertial Measurement Units
In order to mitigate many of the problems seen with optical motion analysis
systems, alternative solutions have arisen for use in 3D motion analysis within the last 20

7
years (Tao et al. 2012). Advances in MEMS (microelectromechanical systems) have
allowed for light, low cost, and low power body mounted sensors to be used in human
gait analysis and biomechanics research. These systems allow data collection outside of
conventional gait laboratory spaces, which satisfies the need for an ambulatory motion
analysis system (Favre et al. 2009). MEMS sensors may include accelerometers,
gyroscopes, and/or magnetometers (Gouwanda, Senanayake 2008). Accelerometers are
able to capture linear velocity and acceleration, gyroscopes capture angular velocity and
acceleration, and magnetometers allow for a relative reference frame obtained by
magnetic north to indicate the ground reference for all of the axes to use (Caruso 2000).
However, the use of magnetometers inside is limited due to their interaction with ferrous
metals that are typically present in indoor laboratories, which can affect the data
(Roetenberg 2006). Extensive testing has shown that any small amount of
electromagnetic interference will significantly affect the orientation of the sensors, and
EMI does not necessarily affect all of the sensors equally (Swanson 1994).
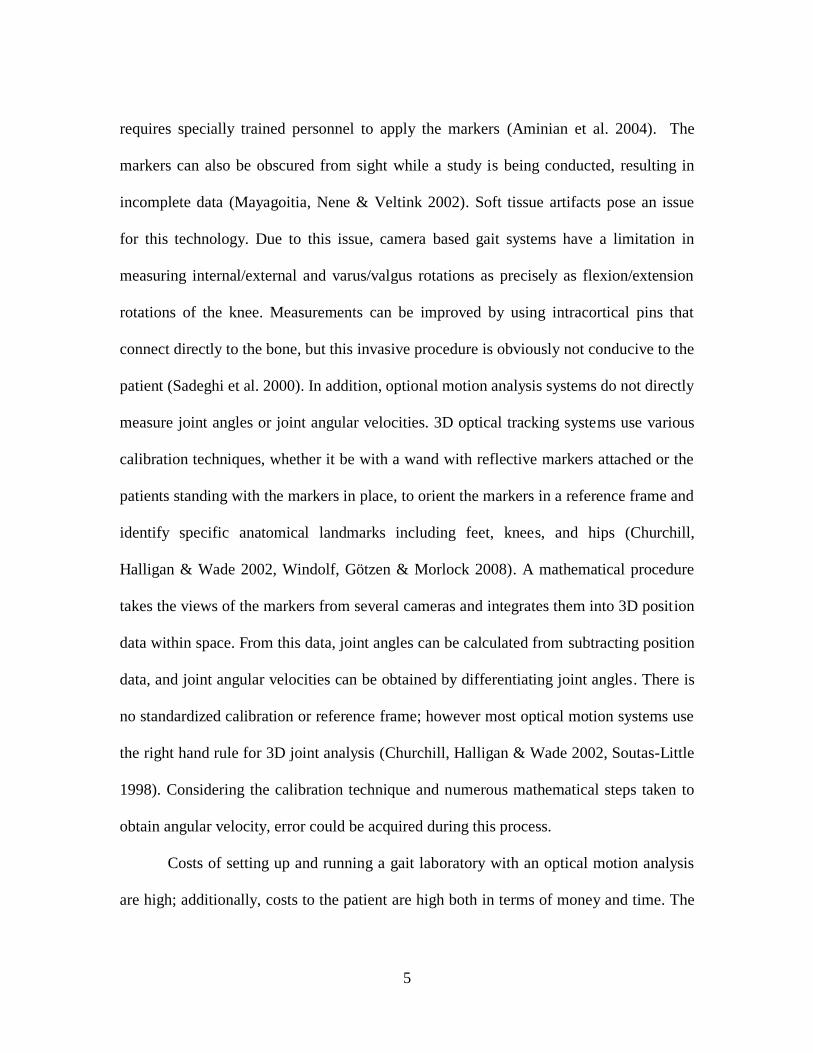
An IMU is defined as a tri-axial accelerometer and gyroscope. These IMUs are
able to measure linear and angular motions in 3D space without external references.
Figure 2 shows an IMU from the XSens MTX system that is currently used on today’s
market (University of Brighton 2013). Within this system, Euler angles are used to define
the angles of rotation around the x, y, and z axes that correspond to roll, pitch, and yaw.

8
Figure 2: XSens MTX IMU with Reference Coordinates
(http://www.brighton.ac.uk/sohp/research/resources/xse
ns.php)
The sensor defines a global orientation by using rotational matrices of these three angles
(Hutchison, 2011).
Performing gait analysis with systems such as this allows for portable, cost
effective, convention, and efficient method of assisting patients. These wearable sensors
can be attached to any part of the body including the feet, waist, arms, and leg. Data is
typically collected, and sent wirelessly to a portable computer, or to a data logging device
(Tong, Granat 1999).
Although this technology has enormous potential, there are still some issues that
need to be optimized such as the reliability of algorithms used to minimize or eliminate
drift, and the stability of the sensor signals (Tao et al. 2012, Mayagoitia, Nene & Veltink
2002, Favre et al. 2009, Gouwanda, Senanayake 2008, Yang et al. 2012, Arai et al. 2011,
Arai et al. 2008). Typically, drift is addressed by using an initialization technique and
various fusion algorithms. However, when integrating angular velocity with respect to the
reference frame, an offset of one axis, will give rise to large errors in another axis
(Gouwanda, Senanayake 2008). Numerous studies have been done to reduce variability

9
of IMU outputs, and prove their effectiveness independently (Bamberg et al. 2008,
Bergmann, Mayagoitia & Smith 2009, Georgoulis et al. 2003). However, IMUs are
currently an underutilized technology due to the lack of evidence of their accuracy. It is
apparent that the issues of repeatability and validity in comparison to the current gold
standard optical motion analysis system need to be addressed, and these two systems
need to be used simultaneously to further evaluate the IMUs reliability and accuracy
(Yang et al. 2012, Cloete, Scheffer 2008).
Joint Angular Velocity
The gyroscope component of the IMU system measures the angular rate, or
angular velocity. Joint angular velocity in the sagittal plane is defined as the rate of
flexion and extension of a joint, and can therefore be affected by muscle activation and
force generation (Granata, Abel & Damiano 2000). The angular velocity of a joint is the
relative angular velocity (rate of rotation) of the proximal body segment subtracted from
the relative angular velocity of the distal body segment. In terms of the knee, the equation
below is used.
Joint angular velocity has components in three directions: flexion/extension,
abduction/adduction (varus/valgus), and internal/external. It is simply a measurement of
how fast the joint is moving in its respective plane (Soutas-Little 1998).
Angular velocity can be used to calculate joint power, which is defined as the
product of the moment and the angular velocity (Soutas-Little 1998). Muscle power has a
10
high correlation to overall muscle function, and can affect overall functional activities
such as walking, standing and sitting from a chair, and walking up stairs (Arai et al.
2008). Joint angular velocities, especially for hips, knees and ankles, can provide
valuable insight to the diagnosis and progression of mobility-related disease, and can be
used in the geriatric community as a signal of muscle functionality.
Clinical Applications
To date, gait analysis has proved to hold its greatest value in the clinic regarding
patients with central nervous system (CNS) disorders, in particular children with cerebral
palsy who exhibit spastic gait (van den Noort, Josien C et al. 2012). Spastic gait is known
as the occurrence of a heightened stretch response of the muscles, meaning that they
don’t want to stretch, and the legs move in a stiff manner (Damiano et al. 2006).
Children who exhibit spasticity have lower angular velocity measurements around their
ankles, knees, and hips due to a lowered stretch response threshold. Spastic and stiff knee
gait both affect foot clearance during swing phase by limiting maximum knee flexion
achieved (Damiano et al. 2006). For patients with gait disorders originating
neurologically, gait analysis laboratories often serve to prescribe treatment and assess
disease after surgical intervention, as well as observing long term degenerative disorders
(Simon 2004).
Parkinson’s Disease
Parkinson’s disease (PD) can be a debilitating disease that affects gait pattern and
balance, and both of these factors increase the risk of falling (Mera et al. 2012).
11
Unfortunately, there are no objective tests to confirm early stage PD; these diagnoses rely
on the judgment of skilled clinicians observing movements and gait patterns. This
diagnostic method is highly subjective, and leaves the patient’s wellbeing up to
experience, rather than quantifiable data (Tien et al. 2010).
As the disease progresses, deep brain stimulation can be used to relieve typical
symptoms such as resting tremor, rigidity, and Bradykinesia, which is defined as the
slowness of movement (Mera et al. 2012). Gait and balance disturbances are also
manifested during disease progression, and this is difficult to manage with deep brain
stimulation, and as the disease progresses. There is currently no standardized protocol on
how deep brain stimulation affects gait and balance, which are the two main complaints
from patients. The Unified Parkinson’s Disease Rating Scale (UPDRS) is a standard
rating scale for PD, and can determine the risk between fallers and non-fallers. Although
these methods are reliable, there is bias that is introduced by the clinicians. Quantitative
kinematic data from IMUs may provide more detailed reports of gait and balance, and
angular velocity would allow for better characterization of limb rotation (Mera et al.
2012).
Stroke
Stroke affects approximately 15 million people a year, and 5 million people of
that population are permanently disabled (Yang et al. 2012). Regaining community-based
mobility is a major rehabilitation goal for many stroke patients (Arai et al. 2011).
Typically, self-selected walking speed tests are good indicators of general mobility and
function after a stroke and during rehabilitation regimes (Yang et al. 2012).

12
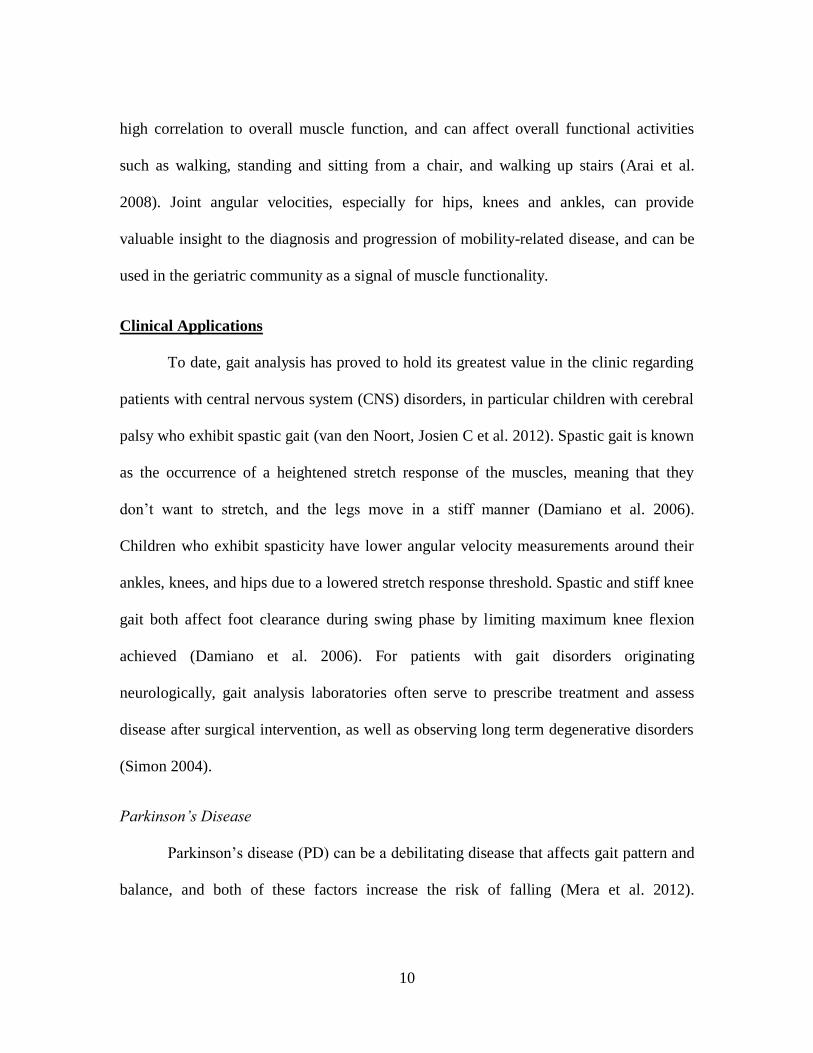
Figure 3: GAITRite mat along with data outcomes seen on a computer screen after a patient
has successfully completed an analysis. (http://www.gaitrite.com/geriatrics.html)
Instrumented walkways like GAITRite (seen in Figure 3) are commonly used to identify
temporal gait parameters, including gait speed, swing and stance of the paretic limb as
well as spatial parameters such as stride length and velocity. The GAITRite system,
which is a pressure-sensitive walkway, has been validated against optical motion capture
systems and force plates (Greene et al. 2012). Although these systems are useful and
comparable to other methods for obtaining spatio-temporal data, they are costly and take
up a valuable space in a clinic or laboratory. IMUs can be used during post-stroke
rehabilitation for the detection of gait parameters such as walking speed, and to evaluate

13
gait symmetry (Yang et al. 2012). Recently, two fusion algorithms have been proposed
for use with gyroscopes mounted on the shank to obtain temporal gait parameters. The
sensor system was validated against the GAITRite system at three walking speeds
(Greene et al. 2012).
In addition to spatio-temporal outcomes, kinematic outcomes for gait are also
important measures of post-stroke rehabilitation. One way that angular velocity outcomes
could be utilized in the clinic is for assessing gait symmetry. Temporal parameters that
are needed to evaluate gait symmetry and gait phases are typically determined from toe-
off (TO) and heel-strike (HS) events. The overall temporal symmetry ratio for gait is
defined as the ratio between the paretic swing-stance ratio and the non-paretic swing-
stance ratio (Yang et al. 2012). Excellent correlation between shank angular velocity in
the sagittal plane and at heel strike and toe off events has been found, although there have
been problems in the algorithm at walking speeds less than 6.0m/s that require
modification (Yang et al. 2012).
Figure 3 shows angular velocity curves that correspond to gait events important in
rehabilitation (Yang et al. 2012).

14
Figure 4: Gait Events that are affected by Neuromuscular Pathologies. Comparing Paretic and Non
Paretic Leg (Yang et al. 2012)
Another diagnostic and rehabilitative measure for evaluating stroke victims is
looking at muscle power. Muscle power can affect every day activities such as sitting and
standing from a chair or walking up stairs; and decreasing muscle power can also be
related to the geriatric population by risk of falling. Power is measured as the torque
times the angular velocity, and therefore angular velocity can play a part in evaluating
15
muscle power. In particular, using angular velocity as an outcome measure after power
training is commonly done in post-stroke rehabilitation regimes (Arai et al. 2011). It has
been concluded that ankle angular velocities relate directly to muscle function that affects
mobility in post-stroke patients, and also that angular velocity of the knee extensor had a
strong relationship with a geriatric population’s belief in their own physical state (Arai et
al. 2011, Arai et al. 2008). When dealing with the geriatric population, it is not only
important to improve their clinical outcomes, but to also improve their general sense of
well-being.
Spinal Cord Injury
Spinal cord injury patients often experience spastic gait, similar to cerebral palsy
patients. Typically, only injury level has been evaluated for treatment and rehabilitation
measures, but spastic gait, which affects angular velocity, also needs to be an indicator of
treatment for spinal cord injury patients (Krawetz, Nance 1996). Krawetz claims that
kinematic data, including angular velocity, of the knees and ankles varies depending on
whether the patient suffered a thoracic or lumbar injury, and this type of quantitative data
can help establish rehabilitation plans as well as track progress.
Similar to stroke victims, heel strike and toe off are used to assess rehabilitation
outcomes and gait symmetry in spinal cord injury victims. In addition to pressure mats
such as the GAITRite, footswitches and force plates are used to identify gait events.
Both of these technologies have shortcomings. Footswitches are prone to breaking, and
force plates limit the overall area in which the data can be collected (Jasiewicz et al.
2006). Jasiewicz et al. conducted a study to validate that foot linear accelerations, as well

16
as foot and shank sagittal plane angular velocities, could correctly identify the events of
foot initial contact (IC or toe-off) and foot end contact (EC or heel strike). The study
showed that both foot linear accelerations and shank sagittal plane angular velocity were
able to appropriately identify IC and EC in both control patients and American Spinal
Injury Association (ASIA) D grade spinal cord injury patients (Jasiewicz et al. 2006).
Cerebral Palsy
Cerebral palsy, which is a central nervous system disorder, causes gait
abnormalities, such as spastic gait, and most commonly affects children. To date, gait
analysis has proven most valuable in clinical settings for this disorder and gait
abnormality (Simon 2004). Multiple studies have shown the relation of joint angular
velocity to cerebral palsy, and the overall reduction of this kinematic parameter as
compared to normal patients.
Clinical evaluation looks particularly at joint movements in the sagittal plane,
corresponding to flexion and extension motion. Granata et al. showed that for analysis of
patients with CP exhibiting spastic gait, joint angular velocity data was a better
determinant than joint angle data for comparing gait patterns between a control and CP
population (Granata, Abel & Damiano 2000). Piazza et al. correlated knee angular
velocity to knee muscle activity for further understanding of the swing phase of gait since
a lack of flexion and extension can cause falls or trips (Piazza, Delp 1996). Damiano et
al. concluded that children with cerebral palsy had slower peak knee angular velocities
and less total forward movement for a complete gait cycle than normal children
(Damiano et al. 2006).

17
Studies by Piazza et al. and Granta et al. used a VICON motion capture system,
and Damiano et al. used isokinetic equipment to obtain angular velocity data. It is
apparent that there is a strong correction between angular velocity and spastic gait
hallmark events seen in CP, as well as other neuromuscular disorders. Using an
ambulatory system for evaluating people with CP would not only significantly reduce
cost, but also allow for patients’ movement to be analyzed in a variety of setting outside
the gait laboratory, such as in their own homes.
Summary of the Literature
With the emergence of ambulatory, lightweight and cost effective motion analysis
technology such as IMUs, there is a plethora of opportunities to adopt these technologies
into a clinical environment. While cerebral palsy treatments and interventions are
established, there is always room for improvement in the data collection process to
minimize time and cost. It is also apparent that there is fundamental need for diagnostic
and quantitative measurement techniques for other central nervous system disorders.
Despite advantages over optical motion capture systems, motion analysis results
with IMUs have yet to be adopted by clinicians. Many studies have shown great promise
for the use of IMUs with rehabilitation and diagnostics. By working to improve
algorithms, reduce drift, and establish validity and reliability of IMU systems in direct
comparison to commonly used camera systems, these technologies can be incorporated
into rehabilitation and physical assessment regimes allowing for quantitative data to
establish appropriate treatment.

18
Research Objectives
The purpose of this study is to evaluate angular velocity measurements during
normal human motion as measured simultaneously by IMU and camera-based systems. In
particular, this study evaluated the precision and accuracy of both individual systems. It
is hypothesized that the IMU system will have higher precision for angular velocity
considering angular velocity is directly measured by gyroscopes, whereas the camera
system has to process position data to obtain angular velocity, introducing errors due to
data processing.
Accuracy of the IMU system with respect to the “gold standard” camera system
will be evaluated as well. It is hypothesized that the camera system and inertial sensors
will have more correlation at lower angular velocities. In a robot arm validation study, the
inertial sensors proved to be repeatable for measurements of angular displacement
(analogous to joint angle) for limited angular rates and differences between the two
systems was seen at the beginning of swing phase (Hutchison 2011). In a patient study
done by Hutchison, highest agreement between an IMU and camera based system
measurements for knee angles occurred during flexion/extension knee joint motions, with
less agreement for varus/valgus and internal/external rotations. Lag in angle
measurements were seen at higher angular rates, particularly at the beginning of swing
phase (Hutchison 2011).

19
CHAPTER II – COMPARISON OF ACCURACY AND PRECISION
BETWEEN CAMERA AND IMU SYSTEMS
Materials and Methods
Data Collection
Four normal subjects (1 female and 3 males) were included in this study, and ten
walking trials were conducted for each. Data was collected simultaneously with the
Qualisys Pro-Reflex 240 Hz eight camera system (Qualisys Motion Capture Systems,
Gothenburg, Sweden) and the XSens MTx
system (XSens Technologies, Enschede,
The Netherlands) for all subjects. Data was
collected using Labiew software with a
customized Labview program (National
Instruments, Austin, TX). The XSens
sensors use an algorithm based on an
Extended Kalman Filter (EKF) that predicts
future values of angular displacements
based on the previous readings (Hutchison,
2011). The EKF helps guard against the
effects of body motion and temporary
magnetic disturbances (Sabatini 2006).
Sensors were placed on thigh, shank, and foot segments. Thigh and shank sensors
Figure 5: Initialization positions to minimize drift
associated with yaw (IE) and align object axes.
Projected horizontal component (left) and vertical
position (right). (Adapted from Hutchison, 2011)

20
allowed for knee motion to be assessed, which shank and foot sensors allowed for ankle
motion to be assessed. The sensors on the shank were placed superficial to the IT band;
the sensors on the shin were placed superficially to the mid-shaft of the tibia; and the
sensors on the feet were placed superficial to 2nd
and 3rd
tarsometatarsal joints
(Hutchison, 2011).
For this study, due to the magnetometer being disabled to minimize EMI
interference, an initialization technique was used to orient the x and y axes. This
technique was used to minimize drift within the measurements throughout the data
collection process. Figure 5.0 shows an example of the initialization technique, which
was established by Hutchison (2011). The initialization technique is a two-step procedure
adopted by Favre et al. (2008). One leg is first initialized with all body parts vertical and
facing forward to allow for a +x axis alignment. During this step, accelerometer and
rotation matrices were stored for each sensor. Next, the specific leg was abducted so that
the thigh and shank sensors were oriented with the +y axes, allowing for a component
pointing upwards. During this step, accelerometer data for each sensor was stored. This
initialization technique allows for sensor-to-object and object-to-ground reference
rotational matrices to be established for data collection (Hutchison, 2011).
Data Analysis
Angular and angular velocity data of knee movements were collected, processed,
and normalized. All data analysis was completed using Excel spread sheets and
arithmetic functions. The movements selected for analysis in this study were knee
flexion/extension (FE), varus/valgus (VV), and internal/external (IE) rotations. Angular

21
velocities Gx, Gy, and Gz were obtained along the axes in the 3-D coordinate system
corresponding to the three angular motions, respectively. Sensor data to be normalized
were extracted from shank data which was taken relative to the thigh coordinate system.
The third gait cycle within each walking trial was selected for analysis to represent
walking with no acceleration, excluding data for incomplete gait cycles, and the
flexion/extension graph was used to find instances of heel strike. Once one full gait cycle
was obtained, data was normalized to 101 points, representing 0 to 100 percent of a gait
cycle. Camera data was obtained similarly, by identifying the third gait cycle and
normalizing the data to 101 points. For each subject and limb, all trials were averaged to
find average knee angles and angular velocities.
Data Comparison
Coefficients of variations (COV), linear correlation graphs, and linear regression
analyses were used to evaluate the procession and well as accuracy for the two systems.
The COV, or also known as the relative standard deviation, was used to evaluate
variability within each system. This measurement shows the variability in relation to the
mean population. COV’s closer to zero are ideal, which is indicative of a low standard
deviation, and thus less variability within the data.
The COV’s were calculated by taking the standard deviation of all trials of a subject’s
right or left leg, and dividing that value by the average. The COV for each data point was
calculated and the absolute value was taken. The COV’s were then averaged over all 101

22
data points to obtain an average COV for one subject’s limb. Each trial for each subject’s
limb was evaluated in the same manner. Data points with a 0 average were excluded. A
two-tailed, paired t-test was performed in Excel to evaluate if the COVs between the two
systems were statistically different.
Linear correlation graphs were plotted to evaluate the accuracy of the IMU system
in comparison to the camera system, with the assumption that the camera system data set
is correct. Ideally the plot would be a straight line with a slope of 1 and would intersect at
zero, indicating perfect alignment of the data points between both systems. Average
angular velocities for each limb of each subject were plotted with camera data on the x-
axis, and IMU data on the y-axis. Areas of linearity were visually indicated, and further
statistical tests were performed to assess what percentages of the gait cycle exhibited co-
linear portions (i.e. data agreement).
F-test analyses were run on linear regression models in Statistical Analysis
Software (SAS) to statistically determine areas of co-linearity within the 101 points of the
gait cycle, and at different intervals of angular velocities. All subject data were analyzed
as a single data set, treating each trial as independent. The first linear regression analysis
included the averages of the camera and sensor data for all subjects. A Bonferroni
correction of 100 was used for this analysis, as there were approximately 100 data points
per trial. This adjustment involved dividing the P value at which significance was
detected (0.05) by 100, to avoid the chance of type 1 errors, or incorrectly rejecting the
null hypothesis that the data from the two systems are statistically equivalent (Napierala,
2012.). The new P value for this analysis for rejecting the null hypothesis was P >

23
Table 1: Coefficients of Variation (COV) for angular velocities of the knee averaged over multiple
trials for each subject and limb. Average COV values for sensor and camera systems in each plane
of motion shown in bottom row.
Subject Gx_S Gx_C Gy_S Gy_C Gz_S Gz_C
1 Left 0.3538 2.2861 7.3434 3.6019 3.8340 2.9194
1 Right 0.9708 1.0470 1.2225 2.0552 5.7477 8.7607
2 Left 0.5851 0.4163 3.6110 1.8144 1.9900 7.7443
2 Right 1.1112 0.4678 4.4662 7.2550 2.6733 2.9244
3 Left 0.8443 0.4595 3.2037 3.2861 2.1271 9.1901
3 Right 0.1799 0.0683 0.7645 2.2640 5.1287 1.3502
4 Left 0.0966 0.5587 2.1839 3.8526 1.9860 2.0378
4 Right 2.1493 8.3028 1.6896 12.1414 1.6825 1.5462
Average COV Values 0.7864 1.7008 3.0606 4.5338 3.1462 4.5591
0.0005. The second linear regression analysis looked for co-linearity of angular velocity
measurements between the camera and IMU systems at 5 ⁄ intervals, ranging from -200
⁄ to 200 ⁄ with a P value of 0.05.
Results
Coefficient of Variation
Table 1 shows the average COV values between all four subjects in the study.
COV values for knee angular velocity measurements around the axes of
flexion/extension rotation (Gx), internal/external rotation (Gy), and varus/valgus rotation
(Gz) were compared for the camera (C) system and the IMU sensor (S) system for each
subject and trial. Although COV values for the sensor system were lower than those for
the camera system, t-test results showed that they were not significantly different at a
significance level of 0.05.

24
The average of all trials, as well as standard deviations for Subject 3 and are
shown in Figures 6 a-c. This subject was chosen to show areas of agreement within the
two systems.

25
-600
-400
-200
0
200
400
600
800
0 0.2 0.4 0.6 0.8 1
An
gula
r V
elo
city
(d
egre
es/s
eco
nd
)
% Gait Cycle
Figure 6a: Camera vs. Sensor - Gx
S_AVG_GX
S_GX+1SD
S_GX-1SD
C_AVG_GX
C_GX+1SD
C_GX-1SD
-300
-250
-200
-150
-100
-50
0
50
100
150
200
0 0.2 0.4 0.6 0.8 1
An
gula
r V
elo
city
(d
egre
es/s
eco
nd
)
% Gait Cycle
Figure 6b: Camera vs. Sensor - Gy
S_AVG_GY
S_GY+1SD
S_GY_-1SD
C_AVG_GY
C_GY+1SD
C_GY-1SD
-300
-200
-100
0
100
200
300
0 0.2 0.4 0.6 0.8 1
An
gula
r V
elo
city
(d
egre
es/s
eco
nd
)
% Gait Cycle
Figure 6c: Camera vs. Sensor - Gz
S_AVG_GZ
S_GZ+1SD
S_GZ-1SD
C_AVG_GZ
C_GZ+1SD
C_GZ-1SD
Figure 6: Comparison of camera system and IMU system of knee angular velocity of
Subject 3 for 1 gait cycle. Gx (top), Gy (middle), Gz (bottom)

26
Average sensor angular velocities were plotted against average camera angular velocities
for each subject and trial to evaluate areas of linear correlation for each rotational axis.
Subject 3 linear correlation graphs are shown in Figures 7 a-c.

27
-300
-200
-100
0
100
200
300
400
500
-600 -400 -200 0 200 400 600
Sen
sor
An
gula
r V
elo
city
(d
egr
ee
s/se
con
d)
Camera Angular Velocity (degrees/second)
Figure 7a: Correlation Between Camera and Sensor - Gx
-100
-80
-60
-40
-20
0
20
40
60
80
-200 -150 -100 -50 0 50 100 150
Sen
sor
An
gula
r V
elo
city
(deg
rees
/se
con
d)
Camera Angular Velocity (degrees/second)
Figure 7b: Correlation Between Camera and Sensor - Gy
-200
-150
-100
-50
0
50
100
150
200
-200 -150 -100 -50 0 50 100 150 200
Sen
sor
An
gula
r V
elo
city
(deg
rees
/se
con
d)
Camera Angular Velocity (degrees/second)
Figure 7c: Correlation Between Camera and Sensor - Gz
Figure 7: Evaluation of linear correlation between camera and sensor systems for
Subject 3 for 1 gait cycle. Gx (top), Gy (middle), Gz (bottom). Data points
represent points within gait cycle and are shown to evaluate clustered area.

28
Gx Gy Gz
0.08-0.12 0.06 0.06-0.17
0.08-0.11 0.19-0.20
0.14-0.17 0.24-0.25
0.24 0.31-0.39
0.32-0.40 0.41
0.65 0.52-0.61
0.86 0.67-0.74
0.99-1.00
Linear Regression Analyses
Table 2 shows the portions of the gait cycle that are significantly not different for the
linear correlation between the camera and IMU system. Figure 8 is a visual representation
of the areas within the gait cycle in which the two systems are co-linear. The plot is a
typical flexion-extension knee joint angle curve.
Table 2: Percentages of Gait Cycle In
which co-linearity occurred
-10
0
10
20
30
40
50
60
70
0 20 40 60 80 100
Kn
ee A
ngl
e (
°)
% Gait Cycle
Flexion Angle
GX Corr
GY Corr
GZ Corr
Figure 8: A Visual Representation of co-linearity between camera and sensor systems plotted
against a typical knee flexion-extension angle curve

29
Table 3 and Figure 9 show the ranges of angular velocities in which angular velocity
measurements of the camera and IMU system linearly correlated.
Table 3: Ranges and points of angular velocities at which camera and sensor angular velocities are co-linear
Gx Gy Gz
-200 -195 -190 -200 -195
-175 -170 -175 -185 -175
-160 -110 -145 -145
-100 -30 -135 -95 -85
100 110 -40 -55
130 175 0 -45
180 200 85 90 -25
105 5
130 185 20
145 35
155 50
165 170 75 80
185 110 115
200 130
140 150
160 165
180
190 200
-200 -150 -100 -50 0 50 100 150 200
Angular Velocities (°/sec)
Gx
Gy
Gz
Figure 9: Ranges and points of angular velocities at which camera and sensor angular
velocities are co-linear

30
Discussion
Table 1 shows that the lowest overall COV values occurred for both camera and
sensor angular velocities around the flexion-extension plane of motion (sagittal).
Hutchison found the highest agreement with knee angles between camera and IMU
systems in the sagittal plane for normal gait trials (Hutchison, 2011). It was hypothesized
that the COV’s for angular velocity would be lowest in the sagittal plane. The COVs for
the sensor were lower than COV values for the camera for every plane of motion. This
was to be expected, and can be attributed to the fact that the sensor gyroscopes directly
measure angular velocity, whereas the camera system has to integrate position data twice
to obtain the same output. As hypothesized, the sensor system is more repeatable, and
less variable within its own system. However, no statistically significant difference was
seen between the two systems for their values of COVs. Some of the significance that
may have been detected within the study could have been masked due to the variability
between trials for each subject. The lack of statistical significance is also likely tied to the
lack of accuracy in quantitative measurements between the two systems.
Linear correlation graphs, seen in Figures 6 a-c show the sensor angular velocities
plotted versus the camera angular velocities. An ideal plot would have a slope of 1, and
intersect at zero. The only graph that has portions resembling this pattern is Figure 6a,
which portrays angular velocity around the x-axis (flexion-extension). The other axes
showed small areas of co-linearity, but were hard to distinguish with the naked eye. There
were also clusters of data points that may or may not have been co-linear; this indicated a
need for statistical analysis of the co-linearity of the data.

31
Table 2 shows at what percent of the gait cycle the camera and sensor data are co-
linear. The null hypothesis for this data was that the slope was 1 and had an intercept of
zero. The P-value was set to 0.0005 using the Bonferroni correction, and all values below
this were rejected. In agreement with visually observing linear correlation graphs, the
data was co-linear from 8-12% of the gait cycle for Gx. There were short, intermittent
occurrences of co-linearity for Gy and Gz, but there was no trend seen among the data
except for co-linearity at approximately 8-12% of the data for all three angular velocities.
Figure 8 is a visual representation of areas within the gait cycle in which the two systems
are co-linear over a typical flexion-extension knee joint angle graph.
Since a distinct pattern among the data was not seen with the linear regression
analysis between camera and sensor evaluated against the gait cycle, co-linearity between
data sets was evaluated at 5 ⁄ intervals of angular velocity values, with the assumption
there would be greater co-linearity at lower angular velocities. Figure 9 and Table 3
shows the ranges of angular velocity at which the camera and sensor data were co-linear.
Again, there was no distinct pattern in these results, and the areas of co-linearity were not
seen at low angular velocities, as hypothesized.
32
CHAPTER III – CONCLUSIONS AND FUTURE CONSIDERATIONS
The results of this study show promise for the continued study of IMU systems.
The data analysis for this study showed that the IMU system measurements of joint
angular velocities are repeatable. There were limitations in this study that should be
addressed and considered for future studies. The study population used in this study was
small, only having four subject to evaluate. The data comparison was against two
separate systems that do not obtain data in the same manner, nor are they comparable in
set up or calibration/initialization technique; in other words, they are both models of
motion, not direct measurements. Each system will have error due to the fact that the
markers and sensors are not directly attached to the bone. Soft tissue artifacts are a known
issue with camera based motion capture systems (Sadeghi et al. 2000), and this is likely
also the case with IMU systems.
The literature has shown that IMUs hold great promise for use in clinical
laboratory settings, as well as many other applications. However, drift is an issue with
IMU data collection, and is addressed in the literature surrounding this technology and
studies conducted using IMUs using specialized software, initialization techniques, and
algorithms (Tao et al. 2012, Mayagoitia, Nene & Veltink 2002, Favre et al. 2009,
Gouwanda, Senanayake 2008, Roetenberg 2006, Swanson 1994, Arai et al. 2011, Arai et
al. 2008). Drift was most likely a source of error in this study, but can be alleviated with
incorporating more effective algorithms and initialization techniques.
For future studies and consideration for using this technology in clinical
applications, there are many studies that can be conducted. First, a power study should be

33
conducted in order to evaluate the appropriate sample size to be used, as well as
identifying the minimum angular velocity difference between the two systems to be
statistically significant. Knowing that human gait is not the same for everyone, one future
study could evaluate specific motions in which motion capture systems correlate, by
having subject repeat a statistically relevant number of walking trials and evaluating heel
strike, toe off, and the beginning of swing phase for agreement. Another study set up to
evaluate specific motions could have subjects flex and extend their knees and ankles
while being stationary. Other sensors should also be evaluated for use in human motion
analysis. There are other IMU sensor systems such as the Memsense Wireless
(http://memsense.com/products/wireless), that have smaller geometric dimensions, which
would leave the sensor with a lower profile against the skin, and would likely be less
prone to drift and soft tissue artifacts. To address the lack of statistical significance
between the two systems’ COVs, a robot arm validation study should be completed with
simultaneous data collection with a sensor and camera system. In this study, variability
was introduced by the subjects, and the robot arm would eliminate that variability. Newer
algorithms should also be incorporated into any future studies, which would likely reduce
the effects of drift.
Overall, this study along with many others shows the feasibility for IMUs as a
tool in clinical, laboratory, and rehabilitative environments. By improving the
technologies used to assess patient outcomes and rehabilitation progress, it is hoped that
overall patient well-being can be improved. Using low-cost, lightweight, and easy to use
systems will not only help clinicians, but also patients. Improvements to various filters or

34
algorithms, as well as more refined initialization techniques to reduce the effects of soft
tissue artifacts and drift may all help with the implementation of IMUs in the clinical
environment as a replacement to the conventionally used camera-based systems for
specific medical conditions.

35
REFERENCES
Aminian, K., Trevisan, C., Najafi, B., Dejnabadi, H., Frigo, C., Pavan, E., Telonio, A.,
Cerati, F., Marinoni, E. & Robert, P. 2004, "Evaluation of an ambulatory system for
gait analysis in hip osteoarthritis and after total hip replacement", Gait & posture,
vol. 20, no. 1, pp. 102-107.
Arai, T., Obuchi, S., Shiba, Y., Omuro, K., Inaba, Y. & Kojima, M. 2011, "The validity
of an assessment of maximum angular velocity of knee extension (KE) using a
gyroscope", Archives of Gerontology and Geriatrics, .
Arai, T., Obuchi, S., Shiba, Y., Omuro, K., Nakano, C. & Higashi, T. 2008, "The
feasibility of measuring joint angular velocity with a gyro-sensor", Archives of
Physical Medicine and Rehabilitation, vol. 89, no. 1, pp. 95-99.
Bamberg, S., Benbasat, A.Y., Scarborough, D.M., Krebs, D.E. & Paradiso, J.A. 2008,
"Gait analysis using a shoe-integrated wireless sensor system", Information
Technology in Biomedicine, IEEE Transactions on, vol. 12, no. 4, pp. 413-423.
Benedetti, M., Catani, F., Leardini, A., Pignotti, E. & Giannini, S. 1998, "Data
management in gait analysis for clinical applications", Clinical Biomechanics, vol.
13, no. 3, pp. 204-215.
Bergmann, J.H.M., Mayagoitia, R.E. & Smith, I.C.H. 2009, "A portable system for
collecting anatomical joint angles during stair ascent: a comparison with an optical
tracking device", Dynamic Medicine, vol. 8, no. 1, pp. 3.
Caruso, M.J. 2000, "Applications of magnetic sensors for low cost compass systems",
Position Location and Navigation Symposium, IEEE 2000IEEE, , pp. 177.
Churchill, A.J., Halligan, P.W. & Wade, D.T. 2002, "RIVCAM: a simple video-based
kinematic analysis for clinical disorders of gait", Computer methods and programs
in biomedicine, vol. 69, no. 3, pp. 197-209.
Cloete, T. & Scheffer, C. 2008, "Benchmarking of a full-body inertial motion capture
system for clinical gait analysis", Engineering in Medicine and Biology Society,
2008. EMBS 2008. 30th Annual International Conference of the IEEEIEEE, , pp.
4579.
Damiano, D.L., Laws, E., Carmines, D.V. & Abel, M.F. 2006, "Relationship of spasticity
to knee angular velocity and motion during gait in cerebral palsy", Gait & posture,
vol. 23, no. 1, pp. 1-8.

36
DeLisa, J.A. 1998, Gait analysis in the science of rehabilitation, Diane Publishing
Company.
Favre, J., Jolles, B., Aissaoui, R. & Aminian, K. 2008, "Ambulatory measurement of 3D
knee joint angle", Journal of Biomechanics, vol. 41, no. 5, pp. 1029-1035.
Favre, J., Aissaoui, R., Jolles, B.M., de Guise, J.A. & Aminian, K. 2009, "Functional
calibration procedure for 3D knee joint angle description using inertial sensors",
Journal of Biomechanics, vol. 42, no. 14, pp. 2330-2335.
GAITRite Systems. 2013. GAITRite Systems. Available at:
http://www.gaitrite.com/geriatrics.html. [Accessed: 5th
April 2013]
Georgoulis, A.D., Papadonikolakis, A., Papageorgiou, C.D., Mitsou, A. & Stergiou, N.
2003, "Three-dimensional tibiofemoral kinematics of the anterior cruciate ligament-
deficient and reconstructed knee during walking", The American Journal of Sports
Medicine, vol. 31, no. 1, pp. 75-79.
Gouwanda, D. & Senanayake, S. 2008, "Emerging trends of body-mounted sensors in
sports and human gait analysis", 4th Kuala Lumpur International Conference on
Biomedical Engineering 2008Springer, , pp. 715.
Granata, K.P., Abel, M.F. & Damiano, D.L. 2000, "Joint Angular Velocity in Spastic
Gait and the Influence of Muscle-Tendon Lengthening*", The Journal of Bone &
Joint Surgery, vol. 82, no. 2, pp. 174-186.
Greene, B.R., Foran, T.G., McGrath, D., Doheny, E.P., Burns, A. & Caulfield, B. 2012,
"A Comparison of Algorithms for Body-Worn Sensor Based Spatio-Temporal Gait
Parameters to the GAITRite Electronic Walkway.", Journal of applied
biomechanics, vol. 28, pp. 349-355.
Hutchison R.E. (2011). A Validation Study Using Inertial Sensor Technology for Knee
Function During Gait Analysis. Master of Science, Clemson University.
Jasiewicz, J.M., Allum, J.H., Middleton, J.W., Barriskill, A., Condie, P., Purcell, B. & Li,
R.C.T. 2006, "Gait event detection using linear accelerometers or angular velocity
transducers in able-bodied and spinal-cord injured individuals", Gait & posture, vol.
24, no. 4, pp. 502-509.
Krawetz, P. & Nance, P. 1996, "Gait analysis of spinal cord injured subjects: effects of
injury level and spasticity", Archives of Physical Medicine and Rehabilitation, vol.
77, no. 7, pp. 635-638.

37
Mayagoitia, R.E., Nene, A.V. & Veltink, P.H. 2002, "Accelerometer and rate gyroscope
measurement of kinematics: an inexpensive alternative to optical motion analysis
systems", Journal of Biomechanics, vol. 35, no. 4, pp. 537-542.
Mera, T.O., Filipkowski, D.E., Riley, D.E., Whitney, C.M., Walter, B.L., Gunzler, S.A.
& Giuffrida, J.P. 2012, "Quantitative analysis of gait and balance response to deep
brain stimulation in Parkinson's disease", Gait & posture, .
Napierala, M. 2012. What Is the Bonferroni Correction? Available:
http://www.aaos.org/news/aaosnow/apr12/research7.asp. Last accessed 8th April
2013.
Piazza, S.J. & Delp, S.L. 1996, "The influence of muscles on knee flexion during the
swing phase of gait", Journal of Biomechanics, vol. 29, no. 6, pp. 723-733.
Roetenberg, D. 2006, Inertial and magnetic sensing of human motion, University of
Twente.
Sabatini, A.M. 2006, "Quaternion-based extended Kalman filter for determining
orientation by inertial and magnetic sensing", Biomedical Engineering, IEEE
Transactions on, vol. 53, no. 7, pp. 1346-1356.
Sadeghi, H., Allard, P., Prince, F. & Labelle, H. 2000, "Symmetry and limb dominance in
able-bodied gait: a review", Gait & posture, vol. 12, no. 1, pp. 34-45.
Simon, S.R. 2004, "Quantification of human motion: gait analysis—benefits and
limitations to its application to clinical problems", Journal of Biomechanics, vol. 37,
no. 12, pp. 1869-1880.
Soutas-Little, R.W. 1998, "Motion analysis and biomechanics", J Rehabil Res Dev, , pp.
49-68.
Swanson, J. 1994, "Measurements of static magnetic fields in homes in the UK and their
implication for epidemiological studies of exposure to alternating magnetic fields",
Journal of Radiological Protection, vol. 14, no. 1, pp. 67.
Tao, W., Liu, T., Zheng, R. & Feng, H. 2012, "Gait analysis using wearable sensors",
Sensors, vol. 12, no. 2, pp. 2255-2283.
Tien, I., Glaser, S.D., Bajcsy, R., Goodin, D.S. & Aminoff, M.J. 2010, "Results of using
a wireless inertial measuring system to quantify gait motions in control subjects",
Information Technology in Biomedicine, IEEE Transactions on, vol. 14, no. 4, pp.
904-915.

38
Tong, K. & Granat, M.H. 1999, "A practical gait analysis system using gyroscopes.",
Medical engineering & physics, vol. 21, no. 2, pp. 87.
van den Noort, Josien C, Ferrari, A., Cutti, A.G., Becher, J.G. & Harlaar, J. 2012, "Gait
analysis in children with cerebral palsy via inertial and magnetic sensors", Medical
& biological engineering & computing, , pp. 1-10.
Vaughan, C.L., Davis, B.L. & O'connor, J.C. 1992, Dynamics of human gait, Human
Kinetics Publishers Champaign, Illinois.
Windolf, M., Götzen, N. & Morlock, M. 2008, "Systematic accuracy and precision
analysis of video motion capturing systems--exemplified on the Vicon-460 system.",
Journal of Biomechanics, vol. 41, no. 12, pp. 2776.
Yang, S., Zhang, J., Novak, A.C., Brouwer, B. & Li, Q. 2012, "Estimation of spatio-
temporal parameters for post-stroke hemiparetic gait using inertial sensors", Gait &
posture, .
Xsens.com. 2009. MT-X inertial sensors. Available: www.xsens.com
Xsens | Human movement laboratory | Clinical Research Centre - Health Professions,
University of Brighton. 2013. Available at:
http://www.brighton.ac.uk/sohp/research/resources/xsens.php. [Accessed: 5th
April
2013].

39
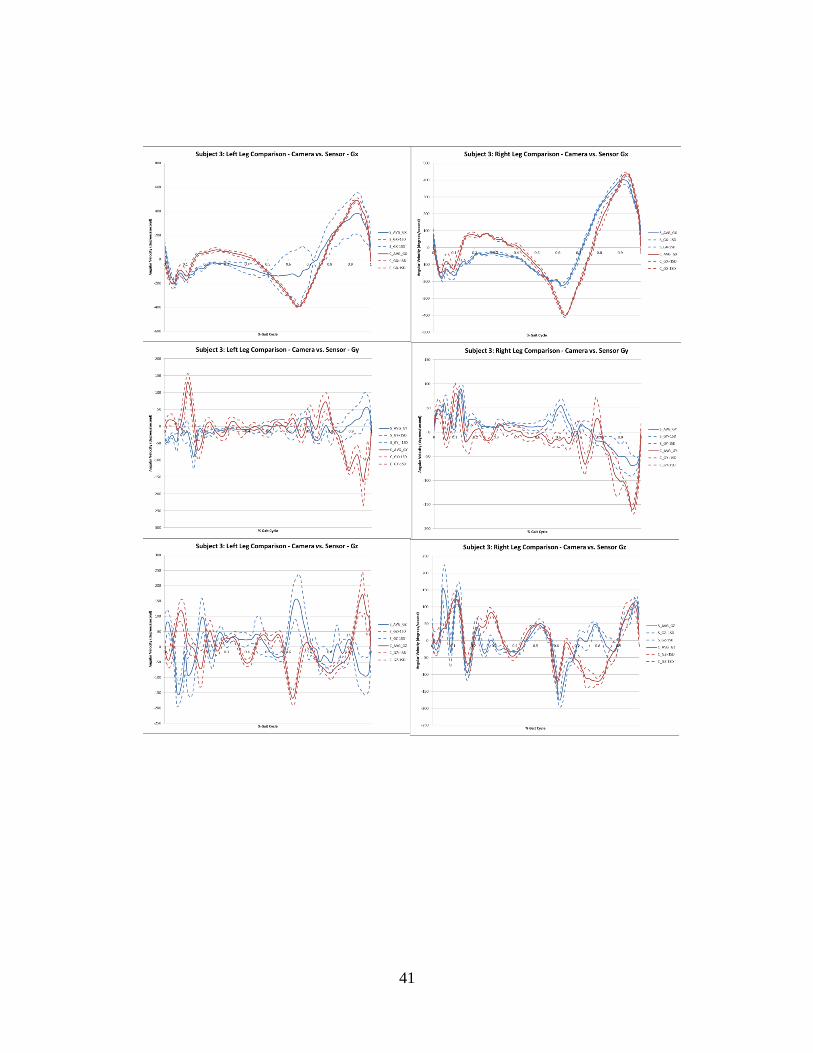
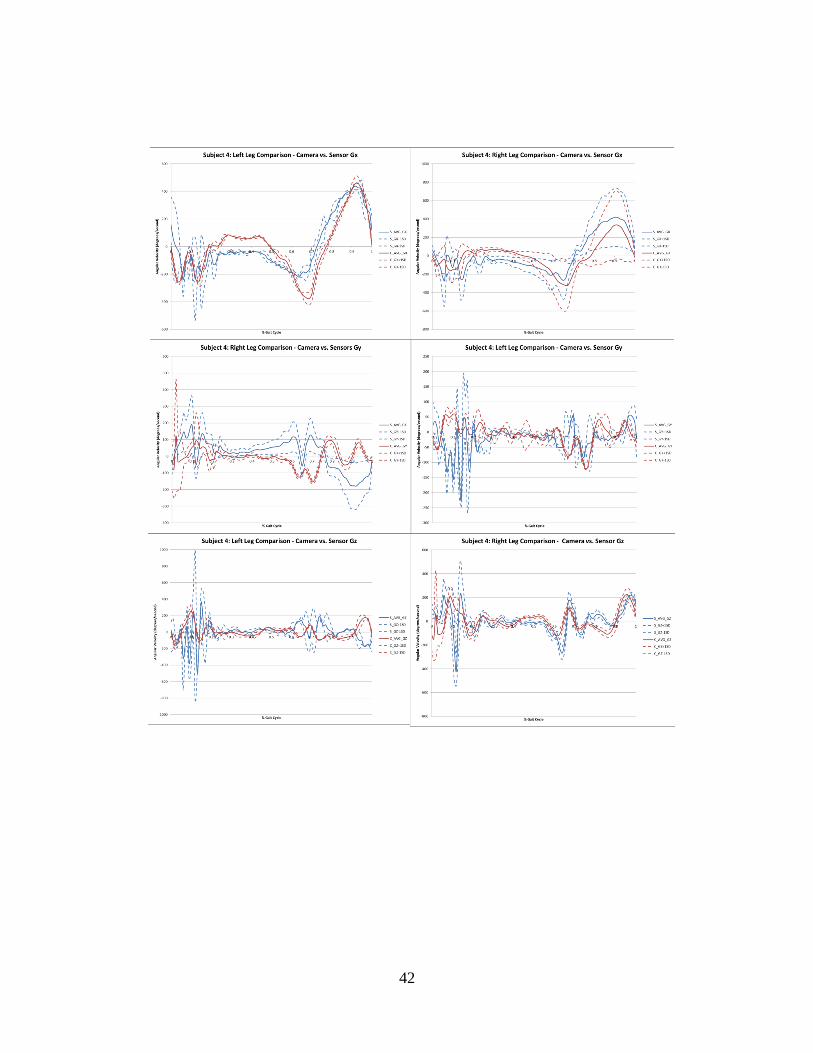
Figure 10: Comparison of camera system and IMU system of knee angular velocity for walking gait of
4 subjects.
APPENDICES
Appendix A: Camera vs. Sensor Data

40
41
42

43
Figure 11: Linear correlation between camera system and IMU system of knee angular velocity for
walking gait of 4 subjects.
Appendix B: Linear Correlation Graphs

44

45

46


![Learning Human Identity from Motion Patterns · The accelerometer captures linear acceleration, the gyroscope provides angular velocity (photo taken from [24]). inertial data, and](https://static.fdocuments.in/doc/165x107/5eab975b8f9f7f4d3b4d9c9d/learning-human-identity-from-motion-patterns-the-accelerometer-captures-linear-acceleration.jpg)