Evaluation of Aimhigher: Excellence Challenge Longitudinal ...
94
Evaluation of Aimhigher: Excellence Challenge Longitudinal Pupil Analysis Report Marian Morris and Simon Rutt National Foundation for Educational Research Research Report RR814 R ESEARCH
Transcript of Evaluation of Aimhigher: Excellence Challenge Longitudinal ...

Evaluation of Aimhigher:Excellence ChallengeLongitudinal Pupil Analysis Report
Marian Morris and Simon RuttNational Foundation for Educational Research
Research Report RR814
RESEARCH
Evaluation of Aimhigher: Excellence Challenge
Longitudinal Pupil Analysis Report
Marian Morris and Simon Rutt National Foundation for Educational Research
The views expressed in this report are the authors’ and do not necessarily reflect those of the Department for Education and Skills. © NFER Trading Ltd 2006 ISBN 978 1 84478 846 0
Research Report No 814

Contents
page
Executive summary i
1. Introduction 1
2. Data overview 5
2.1 Which pupils were included? 5 2.2 How representative is the sample? 8 2.3 The analysis 9
3. Profile of the cohorts 13
3.1 Background characteristics 14 3.2 The cohorts in Aimhigher: Excellence Challenge 16
4. The impact of Aimhigher: Excellence Challenge 21
4.1 The analysis 21 4.2 The impact of Aimhigher: Excellence Challenge on attainment 23 4.3 In summary 35
5. Reflections 37
5.1 In conclusion 39
Appendix 1 41
Appendix 2 43
Appendix 3 47
Appendix 4 75
Appendix 5 79


Executive summary
i
Executive summary
Aimhigher: Excellence Challenge (initially known as Excellence Challenge) was specifically established by the Department for Education and Skills (DfES) in 2001, with the aim of increasing the number of young people from disadvantaged backgrounds who had the qualifications and aspirations necessary to enter higher education. In August 2004 the programme was further extended through integration with the Aimhigher: Partnership for Progression (P4P) programme that had been run by the Higher Education Funding Council for England (HEFCE) and the Learning and Skills Council (LSC). The unified programme, known as Aimhigher and managed by HEFCE on behalf of the LSC and DfES, covers the whole of England and operates at three levels: national, regional and local. This report is one of a series of evaluation reports, compiled during a multifaceted evaluation commissioned by the DfES from a consortium comprising the National Foundation for Educational Research, the London School of Economics and the Institute for Fiscal Studies. The evaluation adopted an integrated, mixed methodology strategy, incorporating wide-ranging surveys (of young people in compulsory education, post-16 destinations and post-18 destinations, including higher education), interview programmes (in Aimhigher: Excellence Challenge partnerships, schools, colleges and higher education institutions) and detailed area case studies (in ten selected partnerships). This report draws specifically on the analysis of data that was collected, over three academic years (2001/02, 2002/03 and 2003/04), from 24,485 young people in Year 11. These figures include data from 19,434 young people in Year 11 in the ‘treatment’ schools and 5,051 who were enrolled in comparison schools. Key findings In summary, once all background characteristics at school and pupil level had been controlled for, statistically significant associations were identified between a number of policy interventions, pupil attainment and pupil aspirations. Higher than expected levels of attainment were associated with the following interventions: • Designation as a member of the widening participation cohort was
associated with higher levels of attainment in terms of:

Evaluation of Aimhigher: Excellence Challenge - Longitudinal Pupil Analysis Report
ii
! capped eight GCSE score (an additional 0.72 GCSE points or just under one grade at GCSE);
• Designation as a member of the gifted and talented cohort was associated with higher levels of attainment in terms of:
! capped eight GCSE score (an additional 3.52 GCSE points); ! an increased likelihood of achieving five of more A* to C grades at
GCSE – young people in the gifted and talented cohort were more than twice as likely to have achieved such grades as young people with the same background characteristics who were not so designated.
There appeared to be a significant association with visits to university during their final year in compulsory education and young people changing their mind between Year 9 and Year 11 and deciding to look for consider higher education. Young people who had taken part in such visits were nearly twice as likely to have changed their minds about participating post-18. Discussions about university life with university undergraduates and lecturers and similar discussions with their family and friends were also associated with increased probabilities of thinking about a university course (by a factor of one and one third and one and two thirds, respectively). Aims of the study The analysis conducted for this report aimed to address some key research questions about the extent to which Aimhigher: Excellence Challenge had made an impact on young people's attainment and on their aspirations towards obtaining a place in higher education. Methods The analysis reported in this paper drew on data from young people in Year 11 in 2001/02, 2002/03 and 2003/04, matched to PLASC (the Pupil Level Annual Schools Census) and the National Pupil Database NPD and to questionnaire data and other information from young people’s teachers and their schools’ senior management teams. Earlier data, collected from the 2003/04 Year 11 cohort when they were in Year 9 (2001/02) was also incorporated. The data was analysed using a variety of statistical techniques, culminating in a series of multilevel and logistic regression models. The various cross-sectional models (comparing the 2001/02, 2002/03 and 2003/04 Year 11 cohorts) and longitudinal models (following the 2001/02 Year 9 cohort into Year 11) were constructed to look at a range of different ‘hard’ (attainment) and ‘soft’ (attitudes and aspirations) outcome measures in order to explore the impact of Aimhigher and the various activities that have been implemented under the initiative.

Executive summary
iii
Profile of the Cohorts As identified in earlier reports from this study, the profile of the Aimhigher: Excellence Challenge cohorts was not identical to those of all young people nationally. The young people were from schools predominantly located in metropolitan areas and, compared with all schools nationally, had higher proportions of pupils who were entitled to Free School Meals; who spoke a first language other than English and had lower mean levels of aggregated attainment: few of the young people responding to the surveys came from high performing schools. The participating Year 11 cohorts in 2001/02, 2002/03 and 2003/04, however, were largely similar in relation to their background circumstances, particularly in terms of young people’s socio-economic circumstances, the percentage with special educational needs and the proportion of young people who had been excluded for a fixed term during the previous academic year. As part of the Aimhigher: Excellence Challenge policy, two specific cohorts of young people have been identified by partnerships. The first of these included young people designated as part of the widening participation cohort; that is, those who were in learning (whether pre- or post-16) who had the ability to progress to higher education, but who came from disadvantaged backgrounds without any history of higher education. Nine per cent of the young people in the Year 11 cohorts in the study were identified as part of the widening participation group in their school. The targeting strategies adopted across the various schools and partnerships appears to have ensured a degree of equity for this strategy, with similar proportions of boys and girls (9% of the year group in each case) being included in the cohort and no significant differences in the level of representation between young people from different minority ethnic groups. The second cohort included those who would be identified as gifted and talented. Under Aimhigher: Excellence Challenge this group was confined (for funding purposes) to those who were in post-16 education. Pre-16, the gifted and talented cohort was funded under the EiC initiative in Phase 1 and 2 areas (11.5% of the Year 11 cohort was designated as gifted and talented) and in Phase 3 areas (6.5% of the Year 11 cohort was designated as gifted and talented). Under EiC, participating schools were required to identify a gifted and talented cohort of some five to ten per cent of each year group in Key Stages 3 and 4. At least two thirds of this cohort are expected to be those with the highest levels of attainment in academic areas of the curriculum. No specific policy-related funding was available for this group in EAZ areas, although some identified such young people among their pre-16 cohorts. Amongst the young people in the study, 10% of the Year 11 cohorts were designated as gifted and talented.

Evaluation of Aimhigher: Excellence Challenge - Longitudinal Pupil Analysis Report
iv
Unlike the profile of the widening participation cohort, the picture within the gifted and talented cohort demonstrated some significant variations in relation to minority ethnic groups. Even when prior attainment was taken into account, the probability of a young person from an Indian background being designated as gifted and talented was significantly lower than the probability for a young person from any other ethnic group. Pupils from Black Caribbean, Black African and Black other groups were more likely than pupils from white UK or other backgrounds to be so designated. It is possible for young people to be identified in both groups (both pre- and post-16 and 20% of the young people in the widening participation cohort were also identified as gifted and talented. Once all background characteristics at school and pupil level had been included in the analysis, along with information on young people's experiences of Aimhigher: Excellence Challenge activities, associations were identified between the following policy interventions and higher attainment at Key Stage 4 across all three Year 11 cohorts: • Designation as a member of the widening participation cohort was
associated with higher levels of attainment in terms of:
! capped eight GCSE score (an additional 0.72 GCSE points or just under one grade at GCSE);
• Designation as a member of the gifted and talented cohort was associated with higher levels of attainment in terms of:
! capped eight GCSE score (an additional 3.52 GCSE points); ! an increased likelihood of achieving five of more A* to C grades at
GCSE – young people in the gifted and talented cohort were more than twice as likely to have achieved such grades as young people with the same background characteristics who were not so designated.
This story is not quite as straightforward as the initial analyses (nor the analyses in previous years) may have suggested, however: • While young people in both widening participation and gifted and talented
cohorts across the three cohorts consistently achieved higher capped eight GCSE scores than their peers with the same background characteristics, only those in the gifted and talented cohort appeared to have a greater likelihood of achieving five or more GCSEs.
• The impact of being in the widening participation cohort was more evident amongst young people who lived in areas in which there were a high proportion of owner occupiers, rather than those in more disadvantaged areas. However, it also appeared to benefit those young people in the widening participation cohort who had previously attained less well in Key Stage assessment tests.

Executive summary
v
• Amongst young people in the 2004 Year 11 cohort, there was an association between being in the gifted and talented cohort when in Year 9 (2002), or in the gifted and talented cohort when in Year 11 (2004), and higher capped eight scores and an increased probability of achieving five or more GCSEs at grades A* to C. No such association emerged for the widening participation cohort in the longitudinal analysis.
• Amongst young people in the longitudinal cohort, however, visits to higher education institutions and discussions with university staff and undergraduates (both potentially Aimhigher: Excellence Challenge-related activity and open to widening participation pupils) were associated with both higher capped eight scores and higher probabilities of achieving five or more good GCSEs. It should be noted that these activities were often open to gifted and talented as well as to widening participation pupils.
• The role of the school, in encouraging young people to consider higher education, was also associated with higher capped eight scores in the cross-sectional analysis, but did not emerge as significant during the longitudinal analyses. Indeed, the statistical analyses identified few school level variables as significantly related to pupil attainment, suggesting that it is the experience of each individual pupil and the circumstances and educational outlooks of each pupil, rather than the school type (age range, size, management type) that has the most significant impact on attainment.
The Impact of Aimhigher: Excellence Challenge on Pupil Attitudes Overall, young people from schools in Aimhigher: Excellence Challenge areas tended to display less positive attitudes to learning than the young people in the comparison cohorts, even though their (self-reported) behaviour was good. This was in direct contrast to the gifted and talented cohorts who were significantly associated only with those who had both a good attitude and good behaviour. This suggests that Aimhigher: Excellence Challenge may have successfully sought out young people who, as yet, may not have a positive attitude to learning or to the possibility of continuing in learning, even though their ostensible behaviour in school may be good. There was no association, however, with young people who had a good attitude but poor behaviour, raising the question as to whether it was low prior attainment or poor behaviour (in school at least) that may have precluded young people’s designation to the widening participation group. The analysis suggested that some Aimhigher: Excellence Challenge activities appeared to be more associated with positive attitudes, while others were more associated with good behaviour. • Visits to university and being in schools in which the value of a university
education was discussed appeared to be associated with positive attitudes amongst pupils (whether behaviour was good or bad);
• Feeling, as a pupil, that teachers listened to young people, seemed to be a key factor associated with good behaviour.

Evaluation of Aimhigher: Excellence Challenge - Longitudinal Pupil Analysis Report
vi
Talking to undergraduates and talking to university staff were also associated with pupils with good attitudes and behaviour, though not with those with poor attitudes though good behaviour, even though a proportion of young people in this group took part in such activities (13.6% spoke to undergraduates and 22.4% to higher education staff). This raises a number of questions: are such discussions always motivational, or are they effective only when attitudes are already good? It should be noted that, from the cross-sectional analysis, causal effect cannot be imputed and, indeed, the longitudinal analysis proved inconclusive. While there were associations with a range of school variables (including teachers being seen by pupils as treating them with respect and teachers encouraging young people to do the things at which they were good) parental input (including making sure young people did their homework and encouraging them to stay in education beyond 16) had a bigger impact on attitudes to learning. Nonetheless, an aspiration to go to university was, arguably, the biggest single factor associated with positive changes in attitude over time. To what extent, therefore, has Aimhigher: Excellence Challenge had an impact on young people’s aspirations? The impact of Aimhigher: Excellence Challenge on pupil aspirations Not surprisingly, across the three Year 11 cohorts, the strongest associations with intentions to enter higher education were with pupil level variables, such as parents educated to at least degree level, being a girl and having a greater number of books in the home. Young people who spoke a first language other than English had a higher probability of signalling this intention, while those from white UK backgrounds were only half as likely as other pupils with the same characteristics and prior attainment to suggest they might go to university. Parental support, with parents praising good work and making it clear that they considered education important, was also a significant factor. Nonetheless, policy-related activities also appeared to be strongly associated with young people’s aspirations. Teachers talking about the value of university, visits to higher education institutions, and talking with undergraduates, university lecturers and Personal Advisers, were all linked to a stated intention to take up a university place. Are such visits and discussions associated with young people who were already considering such a pathway, or have they significantly influenced young people’s decision-making? There was a higher probability that those who had previously rejected but had now decided in favour of a university education (by comparison with those who continued to reject it) were female, were speakers of EAL or were from families with a large number of books in the home. According to their own self-report, there was a greater chance that they were well behaved and conformed to the requirements of their schools in terms of homework

Executive summary
vii
completion and attendance. There was also a higher likelihood that they enjoyed school and came from families where they thought education was valued. Crucially for the Aimhigher: Excellence Challenge policy, however, young people’s change of mind appeared to be associated with visits to university during their final year in compulsory education (though only 13% had taken up such an opportunity); young people who had taken part in such visits were nearly twice as likely to have changed their minds about participating post-18. Discussions about university life with university undergraduates and lecturers and similar discussions with their family and friends were associated with increased probabilities of thinking about a university course. In conclusion: The impact of Aimhigher: Excellence Challenge The story that emerges with respect to the impact of Aimhigher: Excellence Challenge is, not surprisingly, somewhat complex. While a number of associations between policy inputs and pupil outcomes exist across the three Year 11 cohorts, the role of Aimhigher: Excellence Challenge in significantly influencing young people’s attainment, attitudes and aspirations over time is harder to identify. Nonetheless, there are indications that: • There are associations between some Aimhigher: Excellence Challenge
interventions and improvements in young people’s attainment between Key Stage 3 and Key Stage 4. Whilst designation to the widening participation cohort was not specifically associated with longitudinal change, visits to higher education institutions and discussions with staff and undergraduates were associated with higher levels of attainment at Key Stage 4, including the probability of attaining five or more GCSEs at grades A* to C.
• Taking part in visits to higher education institutions and discussions with staff and undergraduates were associated with a higher probability of changing a negative decision about higher education into a positive one. There is no clear indication, however, that it necessarily contributed to a sustained decision to follow such a path.
These outcomes, while small, are nonetheless encouraging. Over a relatively short period of time (given the nature of the initiative) and considering the different ways that the policy has been implemented, as well as the variations in prior activity and experience across the different partnerships, the apparent emergence of attributable outcomes suggests that there is value in continuing interventions that challenge and shape young people’s awareness of higher education and its potential contribution to their future lives. While the data from the surveys does not provide any clear indication of length, duration or quality of visits, for instance, it nonetheless echoes the findings from the qualitative analyses, which suggest that carefully structured visits, as part of a planned programme of Aimhigher: Excellence Challenge interventions, play important role in changing young people’s attitudes and aspirations towards higher education.

Evaluation of Aimhigher: Excellence Challenge - Longitudinal Pupil Analysis Report
viii

Introduction
1
1. Introduction
Participation rates in higher education appear to have increased significantly over the last decade, with participation by young people in full-time higher education (including sandwich courses), as measured by the Age Participation Index (API),1 rising from 19% in 1990/91 to 35% in 2001/02, an increase of 16 percentage points (DfES, 2004a).2 More recently, and in order to measure progress towards the Government’s 50% target for participation amongst people aged 17 to 30, the API was replaced by the Higher Education Initial Participation Index (HEIPR). This also demonstrates an increase (though not as dramatic) in participation over the period from 1990/00 (41% participation) to 2002/03 (43%). However, recent data from HESA, and published by the DfES, shows that the provisional Higher Education Initial Participation Index (HEIPR) for 2003/2004 remains at 43%, suggesting that there has been no increase in participation rates since 2002/2003 (DfES, 2005a).3 There is, nonetheless, an indication of differential rises in the rate of participation, with rates of entry to higher education rising at a greater rate amongst women than amongst men. The provisional rate of participation for females in 2003/04, for example, was 47%, a four percentage point increase since 1999/2000, while that amongst men was 38%, the same rate as in 2000/2001 and showing a decrease of one percentage point from 2002/2003. Such differences in participation rates are also evident between other groups of young people, as highlighted in the analysis of the fourth sweep of the eleventh Youth Cohort Survey in 2005 (DfES, 2005b).
1 The Age Participation Index (API) measured the number of home domiciled young (aged under
21) initial entrants to full-time and sandwich undergraduate courses, expressed as a proportion of the average 18 to 19 year old Great Britain population. The DfES, in measuring progress towards targets, previously used the IER (Initial Entry Rate) which summed ‘the percentages of the age group who enter Higher Education for the first time in each year of age between 18 and 30’ http://www.dfes.gov.uk/psa2002/TechnicalNotesFinalPSA.rtf. This was replaced by the Higher Education Participation Index (HEIPR), which gave a clearer measure of participation and included those who were not included in the API; that is, part-time students and those that participate in higher education for the first time aged 21-30. The HEIPR has been compiled for students aged 17-30 domiciled in England in full or part-time higher education in the UK and is now being used to measure progress towards the Government’s 50% target for experience of higher education.
2 Department for Education and Skills (2004). 4.6: Participation in Higher Education [online]. Available: http://www.dfes.gov.uk/trends/index.cfm?fuseaction=home.showIndicator&cid=4&iid=23 [December 2005]
3 The rates quoted here are for UK domiciled young people studying in English universities only. The HESA data upon which the figures are based omits young people studying in Scotland, Wales, Northern Ireland or overseas. Department for Education and Skills (2005a) Participation Rates in Higher Education: Academic Years 1999/2000 - 2003/2004 (Provisional) (Statistical First Release 14/2005) [online]. Available http://www.dfes.gov.uk/rsgateway/DB/SFR/s000572/SFR14-2005v3.pdf [December 2005]

Evaluation of Aimhigher: Excellence Challenge - Longitudinal Pupil Analysis Report
2
This analysis suggested that, of the respondents to the survey, participation in higher education was greater, for instance, amongst young people from higher professional backgrounds than amongst those whose parents were in lower supervisory and routine occupations (59% compared to 16% and 19% respectively).4 In part, this was because such young people were more likely to have achieved higher qualifications at the end of Year 11 and at age 18, significant indicators of subsequent participation rates.5 Eighty-nine per cent of survey respondents from professional backgrounds achieved a level 2 qualification, compared with 62% of those whose parents were in lower supervisory occupations and 64% of those who were in routine occupations. Seventy two per cent of the young people from professional backgrounds achieved a level 3 qualification, compared with 32% of those whose parents were in lower supervisory occupations and 31% of those who were in routine occupations. However, this also brings into focus one of the main issues facing the Government in its efforts to widen participation in higher education amongst young people from families with no such tradition. In this cohort (all of whom were aged 19 in the spring of 2005) around half of the young people who had appropriate qualifications but who came from routine occupation backgrounds, for example, had not progressed to higher education. This echoes the findings from Gilchrist et al. (2004) who noted that, while nearly 90% of young people from social classes I and II who have appropriate entry qualifications at age 21 achieve higher education qualifications by the age of 30, the proportion of qualified young people from social classes III (non-manual) to V (unskilled) achieving such higher education qualifications by the same age is significantly lower.6 The figures for young people from such backgrounds ranged from 36% for social class III (non-manual) down to 18% for social classes III (manual) and V (unskilled). Aimhigher: Excellence Challenge (initially known as Excellence Challenge) was specifically established by the Department for Education and Skills (DfES) in 2001, with the aim of increasing the number of young people from disadvantaged backgrounds who had the qualifications and aspirations necessary to enter higher education. Following the publication of the Government’s White Paper, ‘The Future of Higher Education’ (DfES, 2003),7 funding for the initiative was guaranteed up to 2006 and new areas (Phase 3
4 Department for Education and Skills (2005b) Youth Cohort Study: The Activities and Experiences
of 19 Year Olds: England and Wales 2005 (Statistical First Release 49/2005) [online]. Available http://www.dfes.gov.uk/rsgateway/DB/SFR/s000613/SFR49-2005.pdf
5 Three quarters of the young people in the cohort who gained eight or more GCSEs at grades A* to C in Year 11, for example, were still in full time education at aged 19.
6 Gilchrist, R., Phillips, D. and Ross, A. (2002). ‘Participation and potential participation in UK higher education.’ In: Archer, L., Hutchings, M. and Ross, A. (2002) Higher Education and Social Class. London: RoutledgeFalmer.
7 Great Britain. Parliament. House of Commons (2003). The Future of Higher Education (Cm. 5735). London: The Stationery Office. This signalled the expansion of the programme to 86 new local partnerships and the integration with Partnerships for Progression in 2004.

Introduction
3
EiC areas and those established Excellence Clusters that were still outwith the policy) were incorporated. In August 2004 the programme was further extended through integration with the Aimhigher: Partnership for Progression (P4P) programme that had been run by the Higher Education Funding Council for England (HEFCE) and the Learning and Skills Council (LSC). The unified programme, known as Aimhigher and managed by HEFCE on behalf of the LSC and DfES, covers the whole of England and operates at three levels: national, regional and local. Previous research suggested that a lack of information about higher education opportunities (which was thought to be more evident amongst families that had no history of higher level study), as well as social and financial concerns, played a part in reduced levels of applications from young people from lower social class groups (Connors et al 2001).8 Aimhigher: Excellence Challenge sought to address some of these issues through, for instance, the provision of pertinent information, targeted student-centred and school or college-centred activities and an element of financial support. These were intended to improve motivation, raise aspirations and assist transition to further and higher education. To what extent has it succeeded in its aim of raising aspirations amongst young people from groups with traditionally low rates of participation? This report explores this question, using data obtained from 24,485 young people and their schools both in and outwith Aimhigher: Excellence Challenge areas.9 It is one of a series of evaluation reports,10 compiled during a multifaceted evaluation commissioned by the DfES from a consortium comprising the National Foundation for Educational Research, the London School of Economics and the Institute for Fiscal Studies. The evaluation adopted an integrated, mixed methodology strategy, incorporating wide-ranging surveys (of young people in compulsory education, post-16 destinations and post-18 destinations, including higher education), interview programmes (in Aimhigher: Excellence Challenge partnerships, schools, colleges and higher education institutions) and detailed area case studies (in ten selected partnerships).11 The analysis that has been undertaken includes techniques to ascertain aspects both of the educational impact and the economic
8 See, for example Connor, H. and Dewson, S. with Tyers, C., Eccles, J., Regan, J. and Aston, J.
(2001). Social Class and Higher Education: Issues Affecting Decisions on Participation by Lower Social Class Groups (DfEE Research Report 267). Sheffield: DfEE.
9 Questionnaire data was received from nearly 37,000 young people in Year 11, but some of this data could not be included in some of the detailed statistical analyses outlined in this report, either because young people’s schools did not return their senior manager and teacher questionnaires (this was the reason for the omission of pupil data in the majority of cases) or because a match could not be made to PLASC data for that young person.
10 A full list of all of the reports that have been produced since the evaluation began in 2001 is included in Appendix 4.
11 Details of the overall evaluation strategy and research methodology are outlined in Appendix 5, while details of the statistical methods used are presented in Appendix 3.
Evaluation of Aimhigher: Excellence Challenge - Longitudinal Pupil Analysis Report
4
effectiveness of the Aimhigher: Excellence Challenge policy. This report focuses on the educational impact of the programme. The report begins with an overview, in Chapter 2, of the datasets included in the analysis, before providing a profile of the responding cohorts in Chapter 3. This profile outlines a range of background factors (such as sex, ethnic background, socio-economic and family variables) and attainment at Key Stages 3 and 4 (split by pupil background characteristics and school characteristics). Chapter 4 explores the relationship between attainment, attitude, aspirations and educational interventions, taking into account background variables at pupil and school level. It presents the findings from a series of multilevel cross-sectional and longitudinal models. For pupils in Year 11, these include multilevel models that examine the relationship between interventions and best (or capped) eight GCSE scores, and logistic multilevel models examining the probability of a young person achieving five or more GCSEs at A* to C. It also includes models exploring the relationship between policy-related interventions and young people’s attitudes to learning, young people’s behaviour and young people’s aspirations to higher education. Chapter 5 explores the links between the statistically significant findings from the modelling process and the results of both quantitative and qualitative analysis carried out elsewhere in the evaluation and looks at the implications of these findings for the wider Aimhigher policy.

Data overview
5
2. Data overview
The data that contributed to this report was collected as part of a large-scale longitudinal study of young people aged 13-19 in schools and colleges both in Aimhigher: Excellence Challenge partnerships (the treatment group) and in non-Aimhigher: Excellence Challenge schools (the comparison group). Over the period of the study, schools in the treatment group became incorporated into the comparison group as the policy was extended, a factor that the statistical techniques that were adopted for the study had to take into account. Figure 2.1 shows the structure of the treatment and comparison groups and of the six cohorts that took part in the evaluation.
2.1 Which pupils were included? Schools in Phase 1 and 2 of Excellence in Cities (EiC)12 and those in non-EiC Education Action Zones (EAZs)13 were incorporated into Aimhigher: Excellence Challenge from the outset and so young people from these schools comprised the treatment group (see Figure 2.1). Schools in Phase 3 EiC areas were initially outwith the initiative and so pupils formed the comparison group, along with those in a further group of schools (not in EIC or EAZ areas) who constituted a comparison group for the evaluation of EiC; this latter group were included in Cohort 2 only – those who were in Year 9 in 2001/02. However, in September 2003, Phase 3 EiC areas were incorporated into Aimhigher: Excellence Challenge and so became part of the treatment rather than the comparison group. As a result, the young people who were in Cohort 1 (those in Year 8 in 2001/02) in the comparison schools became exposed to Aimhigher: Excellence Challenge in Year 10, while those who were in Cohort 2 (Year 9 in 2001/02) in the Phase 3 comparison schools became exposed to Aimhigher: Excellence Challenge in Year 11. The analysis reported here controlled for these changes and sought to identify any phase effects related to the point at which the school entered Aimhigher: Excellence Challenge partnerships.
12 Launched in September 1999, Excellence in Cities is one of the Government’s key policy
initiatives for redressing educational disadvantage and under-performance in schools located within the most deprived urban areas of England. It has adopted a multi-strand approach to raising standards and performance and emphasises the use of locally-based partnership approaches and targeted provision. While some of the policy strands (such as Excellence Action Zones, City Learning Centres, Beacon Schools and Specialist Schools) operate at either area or whole school level, others (the Gifted and Talented Strand, Learning Support Units, and Learning Mentors) are specifically targeted at the individual student.
13 Education Action Zones have been transformed into Excellence Clusters.

Evaluation of Aimhigher: Excellence Challenge - Longitudinal Pupil Analysis Report
6
Post-16, it was rather more difficult to maintain the distinction between the treatment and the comparison groups, because young people may have left their non-Aimhigher: Excellence Challenge schools and entered FE colleges or other schools who were taking part in Aimhigher: Excellence Challenge activities. Similarly, young people who had been exposed to Aimhigher: Excellence Challenge activities pre-16, might have moved on to FE colleges or schools outwith the initiative. The analysis conducted for this group (not described in this paper) sought to identify the impact of young people’s self-reported experiences, pre- and post-16, of Aimhigher: Excellence Challenge related activities on their aspirations and intentions. This report draws specifically on the analysis of data that was collected, over three academic years (2001/02, 2002/03 and 2003/04), from 24,485 young people in Year 11.14 These figures include data from 19,434 young people in Year 11 in the ‘treatment’ schools and 5,051 who were enrolled in comparison schools. A breakdown of the number of responses, by year and from treatment and comparison schools, is provided in Appendix 1.
14 Note that young people in Year 10 also completed questionnaires in 2001/02, 2002/03 and
2003/04. Data from these pupils are included primarily in the longitudinal analyses. The analysis of the three Year 9 cohorts was previously presented in Morris et al. (2005).

Data overview
7
Figure 2.1 The structure of the treatment and comparison groups in each of the cohorts in the evaluation
2001/02 2002/03 2003/04
Treatment Comparison Treatment Comparison Treatment Comparison
Cohort 1 8 Phase 1 and 2 EiC and non-EiC EAZs
8 Phase 3 EiC
9 Phase 1 and 2 EiC and non-EiC EAZs
9 Phase 3 EiC
10 Phase 1 and 2 EiC and non-EiC EAZs
10 None
Cohort 2 9 Phase 1 and 2 EiC and non-EiC EAZs
9 Phase 3 EiC
10 Phase 1 and 2 EiC and non-EiC EAZs
10 Phase 3 EiC
11 Phase 1 and 2 EiC and non-EiC EAZs
11 None
Cohort 3 10 Phase 1 and 2 EiC and non-EiC EAZs
10 Phase 3 EiC plus EiC comparison
11 Phase 1 and 2 EiC and non-EiC EAZs
11 Phase 3 EiC plus EiC comparison
12 Phase 1 and 2 EiC and non-EiC EAZs
12 EiC comparison
only
Cohort 4 11 Phase 1 and 2 EiC and non-EiC EAZs
11 Phase 3 EiC
12 Phase 1 and 2 EiC and non-EiC EAZs
12 [Phase 3 EiC]
13 Phase 1 and 2 EiC and non-EiC EAZs
13 None
EiC cohort 1
12 Phase 1 and 2 EiC and non-EiC EAZs
12 [Phase 3 EiC]
Post-18 Phase 1 and 2 EiC and non-EiC EAZs
None
Aimhigher: Excellence Challenge baseline
13 Phase 1 and 2 EiC and non-EiC EAZs
None
Shaded boxes show the cohorts that were involved in the cross-sectional analysis in this report. Cohort 2 was the focus of the longitudinal analysis.

Evaluation of Aimhigher: Excellence Challenge - Longitudinal Pupil Analysis Report
8
2.2 How representative is the sample? Given that the areas in which Aimhigher: Excellence Challenge was implemented were primarily those with high levels of socio-economic and educational disadvantage, it is not surprising that the profile of the young people in the Aimhigher: Excellence Challenge cohorts are not identical to those of all young people nationally. Young people were from schools predominantly located in metropolitan areas: 74% of all Year 11 Aimhigher: Excellence Challenge pupils (and 70% of the respondents), for instance, were from such schools, compared with only 36% of all pupils nationally. In 2003/04, and compared with non-Aimhigher: Excellence Challenge schools, for example, they had: • higher proportions of pupils who were entitled to Free School Meals: 39%
of the Aimhigher: Excellence Challenge schools were in the top quintile of pupil eligibility, compared with 15% of all schools
• higher proportions of pupils who spoke a first language other than English: 14% of the Aimhigher: Excellence Challenge Year 11 cohorts, compared with five per cent nationally, were in schools where more than 50% of the population are identified as such speakers.15
• generally lower mean levels of aggregated attainment: only 10% of the Aimhigher: Excellence Challenge schools were in the highest band of achievement at Key Stage 3, compared with 19% of schools nationally, while 38% of the Aimhigher: Excellence Challenge schools were in the lowest band, in contrast with only 19% of non-Aimhigher: Excellence Challenge schools. The picture is similar at Key Stage 4, with eight per cent of Aimhigher: Excellence Challenge schools in the highest band of achievement, compared with 15% of schools nationally, and 36% were in the lowest band, in comparison with 19% of non-Aimhigher: Excellence Challenge schools.
Tables 1 to 3 in Appendix 2 provide a picture of the representativeness of the young people (in Year 11) who responded to the surveys in 2001/02, 2002/03 and 2003/04 compared with all pupils in these cohorts in England. From this data it is evident that young people responding to this survey are broadly representative of all young people in Aimhigher: Excellence Challenge schools, and, as outlined above, include a higher proportion of young people from disadvantaged and low performing schools than would be expected were one to look at all secondary schools nationally. However, it should be noted that the most disadvantaged and lowest performing schools in Aimhigher areas may not be fully represented. At the time when the surveys were conducted, some of these schools were already the subject of intense scrutiny, from Ofsted, from local authorities and from the evaluation of other initiatives (such
15 This group of people were previously classified as speakers of English as an additional language
(EAL). For convenience in reporting, the abbreviation EAL has sometimes been used in this report.

Data overview
9
as the DfES commissioned study into schools in extremely challenging circumstances), and proved to be the hardest group to recruit to the evaluation.
2.3 The analysis As in earlier analyses (see Morris et al., 2005) individual pupil-level data was used to provide descriptive statistics and to facilitate more complex multilevel analyses, in order to address some key research questions. These included: • What is the general pattern of attainment amongst different groups of
pupils? Are these differences still evident once young people’s background characteristics are taken into consideration?
• Are there any differences in young people’s attitudes to education and aspirations between different groups of pupils?
• To what extent are there any variations in performance between young people, with the same background characteristics, in Aimhigher: Excellence Challenge schools and those in comparison schools?
• What is the relationship (if any) between Aimhigher: Excellence Challenge interventions and attainment and/or attitudes and aspirations, once individual pupil and school characteristics and pupil prior attainment are taken into account?
• Is it possible to identify the particular impact of any specific Aimhigher: Excellence Challenge interventions on attainment and/or attitudes and aspirations?
Data from the young people’s questionnaires was matched to PLASC (the Pupil Level Annual Schools Census) and the National Pupil Database NPD,16 in order to obtain background characteristics (sex, ethnicity, special educational needs, in receipt of Free School Meals or level of fluency, for example) and levels of attainment (prior attainment and end of Key Stage data or GCSEs, as appropriate).17 Individual pupil information obtained from the schools (such as a young person’s designation as gifted and talented or as a member of the widening participation cohort) was also matched to the survey data, as was questionnaire data from young people’s teachers and their schools’ senior management teams. In order to be included in the multilevel modelling process, all relevant background data (at pupil and school level) needed to be available.18 At each stage of the analysis, a decision was made as to whether young people for
16 This included prior attainment (at Key Stage 2 or 3, as appropriate) and, in the case of young
people in Years 9 and 11, attainment at the end of the Key Stage. 17 It should be noted that the attainment data for the Year 11 cohort does not include data from
NISVQ, as no agreement had been reached about equivalency measures between GCSE and NVQ level 1 qualifications for the 2001/02 cohort.
18 An explanation of the modelling process can be found in Appendix 3.

Evaluation of Aimhigher: Excellence Challenge - Longitudinal Pupil Analysis Report
10
whom the relevant individual data item was missing (such as number of books in the home or prior attainment at Key Stage 3) should be assigned to the mean for that variable or omitted from the analysis.19 This means that the number of young people for whom the various models were constructed is therefore lower than the number for whom the basic descriptive statistics were derived. However, as Tables 2.1 and 2.2 indicate, the numbers of pupils in each of the cross-sectional and longitudinal models is sufficiently large to enable the research team to have confidence in the reliability of the findings. Figure 2.2 provides an overview of the numbers of young people included in each of the various cross-sectional attainment and attitude models. The models were constructed to measure the relationship between policy-related activities and outcomes at the end of Year 11, focusing, in particular, on GCSE attainment, on attitudes and behaviour and on aspirations to higher education.
Figure 2.2 Data included in multilevel modelling: Cross-sectional models
Multilevel models Type of model Year 11
Attitudes and behaviour Multinomial 21,797
Attitudes to learning Continuous outcome variable 21,549
Capped 8 GCSEs Continuous outcome variable 21,745
5 A*–C grades Logistic 21,745 Aspirations to higher education Logistic 21,797
Using a cross-sectional approach to the analysis enables an exploration of any differences between cohorts in different years. Are the attainment and attitudinal outcomes for young people in Year 11, for example, associated with the same demographics (background variables and socio-economic characteristics) in each cohort, or is there any indication that the impact of demographics may be different between cohorts or between those in Aimhigher: Excellence Challenge schools and those in comparison schools? Is there any suggestion that particular Aimhigher: Excellence Challenge activities may have been associated with young people's aspirational outcomes across all Year 11 three cohorts (see Figure 2.1), for instance, or does such an association appear to be evident for only one of the cohorts?
19 The decision as to whether or not to omit young people from the analysis depended upon the
nature of the variable that was missing. It is possible, for example, to assign a mean value to young people for whom data on the number of books in the home was missing. It is not possible to assign a mean value to prior attainment. Young people remained eligible for inclusion for any subsequent analyses that did not require a particular missing variable, however.

Data overview
11
The study also sought to examine the impact of Aimhigher: Excellence Challenge on changes to young people's attainment, attitudes and aspirations within cohorts, however. Is there any evidence to suggest that taking part in widening participation activities from Year 9 has had an impact on young people's changed aspirations to take up a place in higher education for instance? In order to address such questions, a different analytical approach, using longitudinal models, was adopted. Figure 2.2 provides an overview of the numbers of young people included in each of the various longitudinal attainment, attitudinal and aspiration models. These were constructed using data from Cohort 2 - the 2001/02 Year 9 cohort who were in Year 11 in 2003/04 (see Figure 2.1). In order to maximise the number of pupils upon which the longitudinal analysis could draw, these models included pupil level and school level data (from the NFER’s Register of Schools) and did not draw on the data from teacher or school questionnaires.
Table 2.2 Data included in multilevel modelling: Longitudinal models
Multilevel models Type of Model Year 9 to Year 11
Attitudes to education and behaviour
Multinomial 3,338
Capped 8 GCSEs Continuous outcome variable 3,424
5 A*–C grades Logistic 3,424 Aspirations to higher education: potential negative change*
Logistic 1,152
Aspirations to higher education: potential positive change**
Logistic 1,675
*This analysis was conducted for a sub-set of the data; young people who had made a positive decision towards higher education in Year 9 and who had either maintained that choice or had changed their mind between Year 9 and Year 11. **This analysis was conducted for a sub-set of the data; young people who had made a negative decision towards higher education in Year 9 and who had either maintained that choice or had changed their mind between Year 9 and Year 11.
The coefficients generated by each of these models can found in Appendix 3. Prior to a discussion of the outcomes of the statistical modelling, however, Chapter 3 provides an overview of the background characteristics of the young people in the cohorts, including the extent to which they may have been identified or targeted under the Aimhigher: Excellence Challenge policy.

Evaluation of Aimhigher: Excellence Challenge - Longitudinal Pupil Analysis Report
12

Profile of the cohorts
13
3. Profile of the cohorts
As indicated in Chapter 2, the relative size of the cohorts from both the ‘treatment’ schools and the ‘comparison’ schools differed across the three years. While some of these changes were a result of attrition, most of the differences between the years reflect the changing reach of the policy, with young people from comparison schools becoming part of the treatment group in 2003/04. • In 2001/02, the comparison group comprised 794 Year 11 pupils from
schools in Phase 3 EiC areas (12% of the respondents in that year).
• In 2002/03, the comparison cohort in Year 11 was larger (4257, or 31% of the respondents in that year) since, alongside pupils from the Phase 3 EiC schools, it included pupils who were part of the non-EiC comparison cohort survey.
• By 2003/04, there was no comparison cohort, since Phase 3 EiC schools had been phased into the Aimhigher: Excellence Challenge initiative. The analysis uses a phase marker to ascertain whether or not there is any difference in outcomes between young people in the Phase 1 and 2 EiC schools and EAZ schools that took part in Aimhigher: Excellence Challenge from the outset and those in the Phase 3 EiC schools that entered Aimhigher: Excellence Challenge at a later date.
The Year 11 cohorts in 2001/02, 2002/03 and 2003/04 were largely similar in relation to their background circumstances, particularly in terms of young people’s socio-economic circumstances, the percentage with special educational needs and the proportion of young people who had been excluded for a fixed term during the previous academic year. While there were marginally higher proportions of female respondents to the surveys in all three years, the proportion of female respondents in 2001/02 was greater (at 52% against 47%) than in 2002/03 (48% against 47%) when there was less of a female response bias (data on sex was missing for one per cent of the cohort in 2002 and five per cent of the cohort in 2003). The percentage of young people who spoke a first language other than English was also greater in 2003/04 than in the 2002/03 cohort, which, in turn, was also greater than the 2001/02 cohort. As indicated in Chapter 1, few of the young people responding to the surveys came from high performing schools. While more than one third of the Year 11 cohort came from schools with low levels of performance (schools in which fewer than 30% of young people achieved five or more GCSEs at A* to C in the year in which pupils in the cohort began their Key Stage 4 courses), only seven per cent of the Year 11 pupils included in the analysis came from
Evaluation of Aimhigher: Excellence Challenge - Longitudinal Pupil Analysis Report
14
schools in which attainment levels were high (schools in which more than 82% of young people achieved five or more GCSEs at A* to C). What was the profile of the young people in these different schools?
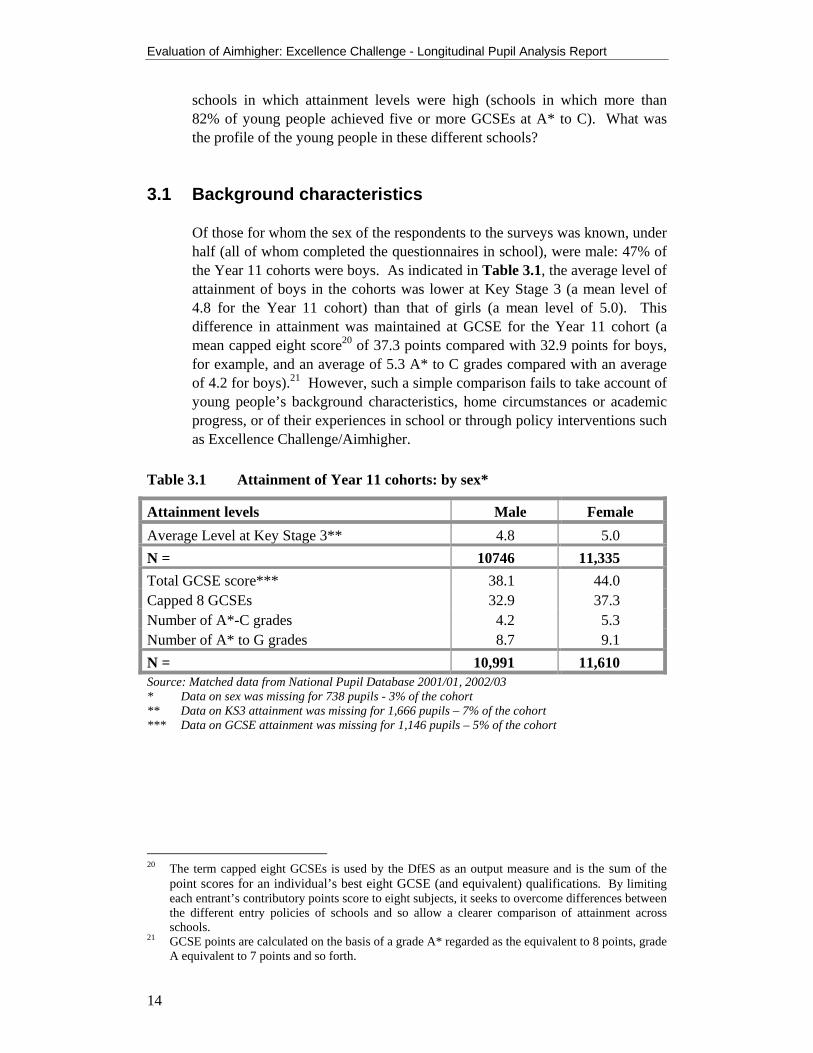
3.1 Background characteristics Of those for whom the sex of the respondents to the surveys was known, under half (all of whom completed the questionnaires in school), were male: 47% of the Year 11 cohorts were boys. As indicated in Table 3.1, the average level of attainment of boys in the cohorts was lower at Key Stage 3 (a mean level of 4.8 for the Year 11 cohort) than that of girls (a mean level of 5.0). This difference in attainment was maintained at GCSE for the Year 11 cohort (a mean capped eight score20 of 37.3 points compared with 32.9 points for boys, for example, and an average of 5.3 A* to C grades compared with an average of 4.2 for boys).21 However, such a simple comparison fails to take account of young people’s background characteristics, home circumstances or academic progress, or of their experiences in school or through policy interventions such as Excellence Challenge/Aimhigher.
Table 3.1 Attainment of Year 11 cohorts: by sex*
Attainment levels Male Female Average Level at Key Stage 3** 4.8 5.0 N = 10746 11,335 Total GCSE score*** 38.1 44.0 Capped 8 GCSEs 32.9 37.3 Number of A*-C grades 4.2 5.3 Number of A* to G grades 8.7 9.1 N = 10,991 11,610 Source: Matched data from National Pupil Database 2001/01, 2002/03 * Data on sex was missing for 738 pupils - 3% of the cohort ** Data on KS3 attainment was missing for 1,666 pupils – 7% of the cohort *** Data on GCSE attainment was missing for 1,146 pupils – 5% of the cohort
20 The term capped eight GCSEs is used by the DfES as an output measure and is the sum of the
point scores for an individual’s best eight GCSE (and equivalent) qualifications. By limiting each entrant’s contributory points score to eight subjects, it seeks to overcome differences between the different entry policies of schools and so allow a clearer comparison of attainment across schools.
21 GCSE points are calculated on the basis of a grade A* regarded as the equivalent to 8 points, grade A equivalent to 7 points and so forth.

Profile of the cohorts
15
The majority of the Year 11 pupils (70%), were from white UK backgrounds, with additional groups of young people from white other backgrounds (1.4%).22 Pakistani (4.8%) and Indian (4.4%) pupils formed the largest minority ethnic groups within the survey, while those from Black Caribbean (1.9%)and Black African (1.8%) heritage constituted a larger group than those of Bangladeshi (1.1%) or Chinese (<1%) pupils. Overall, average levels of attainment (see Table 3.2) at the end of Year 11 were highest amongst the Chinese pupils (who attained a mean of just over grade C at GCSE and a mean of 7.1 GCSES at A* to C) and lowest amongst the Black Caribbean pupils (who attained a mean of just under grade D at GCSE and a mean of 3.7 GCSES at A* to C).
Table 3.2 Attainment by Year 11 cohorts: by Ethnicity
Prio
r at
tain
men
t K
S3
Tot
al
GC
SE
scor
e
Cap
ped
8 G
CSE
s
Num
ber
of
A*-
C
grad
es
Num
ber
of
A*
to G
gr
ades
Tot
al
White UK 5.0 41.2 35.2 4.8 8.9 16,979 White other 4.8 38.2 33.6 4.5 8.6 327 Black Caribbean 4.5 35.6 31.5 3.7 8.5 451 Black African 4.5 40.7 34.8 4.6 8.8 411 Black other 4.6 37.6 32.5 4.1 8.7 185 Indian 5.0 44.9 38.5 5.8 9.1 1063 Pakistani 4.4 38.1 32.7 4.1 8.8 1154 Bangladeshi 4.6 43.2 35.6 5.2 9.5 277 Chinese 5.5 52.8 43.4 7.1 9.5 80 Other 4.8 40.7 34.9 4.8 8.9 531 Information not obtained 5.1 41.8 35.7 4.7 8.9 1143
Source: Matched data from National Pupil Database 2001/01, 2002/03, 2003/04 The degree of socio-economic deprivation amongst the cohorts was relatively high. Eighteen per cent of the Year 11 cohort were in receipt of Free School Meals, compared with an average of 11% of all pupils in England.23 However, the majority of young people reported that they lived with at least one of their
22 Note that the definitions of minority ethnic group background are those derived from 2002 PLASC
data, since the changes in the 2003 data could not be back-matched to the 2002 Year 11 cohorts. However, while White European was used as a category in the 2002 PLASC dataset, it was not used in subsequent years, so the 2002 White European cohort have been re-categorised, mainly as White Other.
23 The proportion known to be eligible for Free School Meals in England is higher (14%) than the proportion known to be in receipt (10%), but information on eligibility for each individual pupil is not available to the research team. Data on young people in receipt of Free School Meals was obtained from PLASC (Pupil Level Annual School Census).

Evaluation of Aimhigher: Excellence Challenge - Longitudinal Pupil Analysis Report
16
birth parents: at least 92% of the Year 11 pupils lived in a household with their mother (27.2% lived with their mother), their father (3.8%) or both parents (61%). Some 19% of the Year 11 cohort suggested that at least one of their parents had been educated to degree level, and up to 42% that one of their parents had progressed into further education. Most, however, reported that their parents had left education at 16.24
3.2 The cohorts in Aimhigher: Excellence Challenge The cohorts in the ‘treatment’ groups (79% of the Year 11 cohorts) and the ‘comparison’ groups differed in relation to a number of background characteristics, both within the cohorts and between the cohorts.25 While marginally more of the Year 11 pupils in Aimhigher: Excellence Challenge schools were in receipt of Free School Meals (19% compared with 17%), there were significant differences in terms of: • the proportion with special educational needs (13% of the treatment group
compared with 18% of the comparison group);
• the proportion with a first language other than English (12% of the treatment group compared with 18% of the comparison group).
This suggests that, while some pupils in the Aimhigher: Excellence Challenge Year 11 cohorts may be more disadvantaged (in a socio-economic sense) than those in the comparison cohorts, the proportion of survey respondents from Aimhigher: Excellence Challenge schools who were suffering from other levels of disadvantage was lower. Levels of attainment amongst young people in the treatment and comparison cohorts also varied. Mean levels of prior attainment amongst the Year 11 cohorts were marginally higher in the treatment schools (a mean of Level 5 at Key Stage 3) than the comparison schools (a mean of 4.9). Attainment at Key Stage 4 was also marginally higher on some measures, with mean capped eight GCSE totals of 35.3 points for those in the treatment group, compared with 34.7 points for those in the comparison group. Young people in Aimhigher: Excellence Challenge schools achieved a mean of 4.8 A* to C grades compared to a mean of 4.7 for those in the comparison schools, although the mean total for A* to G grades was 8.9 compared with 9 in the comparison schools. These variations do not take account of any other background characteristics, however.
24 Levels of parental education were obtained from pupil questionnaires and not from the parents
themselves, so it is likely that there is a margin of error in this data, which should probably be regarded as indicative rather than definitive.
25 The analysis strategy that was used for this study (that of multilevel modelling) takes account of any observed differences between cohorts, since it controls for each of the various demograpohic and other characteristics.

Profile of the cohorts
17
As part of the Aimhigher: Excellence Challenge policy, two specific cohorts of young people were identified by partnerships. The first of these included young people designated as part of the widening participation cohort; that is, those who were in learning (whether pre- or post-16) who had the ability to progress to higher education, but who came from disadvantaged backgrounds without any history of higher education. Nine per cent of the young people in the Year 11 cohorts in the study were identified as part of the widening participation group in their school.26 The targeting strategies adopted across the various schools and partnerships appears to have ensured a degree of equity, with similar proportions of boys and girls (9% of the year group in each case) included in the widening participation cohort in Year 11. Moreover, the initial apparent differences in representation from different minority ethnic groups (with a comparatively higher proportion of pupils from Chinese [17.1%] and Black African [15.1%] backgrounds and fewer from Indian [5.9%] and Bangladeshi [3.7%] backgrounds) was not found to be significant once background characteristics such as prior attainment, sex and eligibility for Free School Meals were taken into account. Mean levels of attainment were, on average, higher amongst the Year 11 widening participation cohorts, both at Key Stage 3 and at GCSE, than amongst those not so designated, suggesting that targeting, on the whole, had been effective in identifying those with the appropriate levels of ability. The mean number of A* to C grades achieved by young people in the widening participation cohort alone,27 for example, was 5.3, compared to a mean of 4.3 for those outside the cohort. The second cohort included those who would be identified as gifted and talented. Under Aimhigher: Excellence Challenge this group was confined (for funding purposes) to those who were in post-16 education. Pre-16, the gifted and talented cohort was funded under the EiC initiative in Phase 1 and 2 areas (11.5% of the Year 11 cohort was designated as gifted and talented) and in Phase 3 areas (6.5% of the Year 11 cohort was designated as gifted and talented). Under EiC, participating schools were required to identify a gifted and talented cohort of some five to ten per cent of each year group in Key
26 This information, along with policy-related information, such as whether or not young people were
part of the gifted and talented cohort, whether or not they had been referred to a Learning Mentor or Learning Support Unit and their level of attendance, for instance, was collected from schools on a pupil-by-pupil basis. It should be noted that Learning Mentors and Learning Support Units were elements of the EiC policy, but, as they were support mechanisms operating in the Aimhigher: Excellence Challenge schools in EiC areas, had to be included in the analysis. It should also be noted that some EiC Phase 3 schools outside Excellence Challenge/Aimhigher had identified young people as members of the widening participation cohort (less than one per cent of all respondents), even though Phase 3 schools were not officially funded under Excellence Challenge/Aimhigher at the time of the research.
27 Some young people were in both the widening participation and gifted and talented cohorts. The attainment levels of young people in both cohorts is presented separately.
Evaluation of Aimhigher: Excellence Challenge - Longitudinal Pupil Analysis Report
18
Stages 3 and 4. At least two thirds of this cohort are expected to be those with the highest levels of attainment in academic areas of the curriculum.28 No specific policy-related funding was available for this group in EAZ areas, although some identified such young people among their pre-16 cohorts. Amongst the young people in the study, 10% of the Year 11 cohorts were designated as gifted and talented. Unlike the profile of the widening participation cohort, the picture within the gifted and talented cohort demonstrated some significant variations in relation to minority ethnic groups.29 The apparent difference between the sexes, with 11% of the females compared to 9% of males being so designated in Year 11,30 was not significant once other background characteristics were taken into account. However, even when prior attainment was taken into account, the probability of a young person from an Indian background being designated as gifted and talented was significantly lower (an odds ration of 0.62 ) than the probability for a young person from any other ethnic group. Pupils from Black Caribbean (1.48), Black African (30.14)31 and Black other (1.48) groups were more likely than pupils from white UK or other backgrounds to be so designated. Mean levels of attainment amongst young people designated as gifted and talented were higher than for other young people, with an average of 8.4 GCSEs at grades A* to C (compared to a mean of 4.1 for the rest of the cohort) and a mean GCSE average score of 46 (a grade B), compared with a mean GCSE average score of 34 (a grade D for those outside the designated cohort).32
28 In the first data collection exercise carried out by the evaluation consortium (for the evaluation of
Excellence in Cities), schools were asked to identify gifted pupils and talented pupils separately, but in practice it was difficult for schools to provide the information in this way, and subsequent data has been gathered for the whole gifted and talented cohort. This is also true for data gathered from schools in EAZs and in non-EIC non-EAZ comparison schools.
29 See Table 7 in Appendix 3. The coefficients for seeing a mentor are presented in Table 8 and indicated that young people from Black Caribbean backgrounds and those with SEN were more likely to have been referred to a mentor, while girls and young people from Indian backgrounds were less likely to have been referred. No table of coefficients is included for young people designated as part of the widening participation cohort, since no variables, other than prior attainment, appeared as significant in the model .
30 Indeed, 54% of the Year 11 gifted and talented cohorts were female, while 45% were male. One per cent of the young people for whom sex data was not available were also designated as gifted and talented.
31 Note that the numbers of young people in this group are low, so the odds ratio may be inflated. Note too that the likelihood of a Black African pupil being designated as a member of the gifted and talented group was higher for those of the cohort who had not necessarily had the highest levels of performance at Key Stage 3; in other words the policy was more inclusive of those Black African pupils at the lower end of the academic performance criteria.
32 These mean figures do not compare gifted and talented pupils with other pupils with the same prior attainment and background characteristics (sex, ethnicity or free school meals, for example) and so should be treated with caution. Such comparisons are included in Chapter 4.

Profile of the cohorts
19
It is possible for young people to be identified in both groups (both pre- and post-16). Indeed, 20% of the young people in the widening participation cohort were also identified as gifted and talented.33 The attainment of young people in this group was marginally lower than the gifted and talented cohort as a whole, both at Key Stage 3 (an average level of 5.8) and Key Stage 4 (a mean of 8.1 GCSEs at A* to C and an average of just under a grade B across their eight best GCSEs). However, this means that some 78% of the widening participation cohort were not designated as gifted and/or talented, but were still seen as having the ability to progress to higher education with the appropriate encouragement and support. While one can provide a profile of the Aimhigher: Excellence Challenge cohorts and examine the attainment outcomes for those designated as widening participation and gifted and talented, this provides little indication of the relative impact of the policy. Overall attainment amongst the widening participation cohort might appear be higher than for the non-widening participation cohort, for example, but does this indicate that the policy has led to such difference emerging? Other factors, related to sex, prior attainment, individual background characteristics (such as ethnicity, fluency in English and home circumstances), attendance and school factors (including performance levels, type and location) have emerged from previous research as significant indicators of attainment. Moreover, and as indicated in Chapter 1, these inherent, socio-economic and educational factors also appear to be associated with different levels of participation in higher education. To what extent has Aimhigher: Excellence Challenge had an impact on young people’s aspirations towards higher education? Is there any indication not only of an association between Aimhigher: Excellence Challenge-related activities and young people’s views of education, but of its impact in changing young people’s attitudes, behaviour or intentions to seek a higher education place? In the following chapters, the report seeks to explore any statistical association between Aimhigher: Excellence Challenge-related inputs and young people’s attainment, attitudes and aspirations, taking into account their background characteristics, prior attainment and home and school circumstances, as well as their participation in Aimhigher-related activities.
33 Of the gifted and talented cohort, 20% were identified as part of the widening participation cohort.

Evaluation of Aimhigher: Excellence Challenge - Longitudinal Pupil Analysis Report
20

The impact of Aimhigher: Excellence Challenge
21
4. The impact of Aimhigher: Excellence Challenge
Emmerson et al. (forthcoming),34 in an overview of the estimated impact of Aimhigher: Excellence Challenge on young people pre-16, suggested that the implementation of the policy was associated with higher attainment in GCSE English (though not with higher overall GCSE attainment) and an increase in the proportion of young people aspiring to higher education.35 This chapter seeks to explore the extent to which there appears to be any statistical association between Aimhigher: Excellence Challenge inputs and the attainment and aspiration outcomes amongst young people in three different cohorts in the study, those in Year 11 in 2002, 2003 and 2004. It also explores the extent to which Aimhigher: Excellence Challenge, and any activities implemented under the policy, may have contributed to improved attainment levels or changes in aspirations amongst one longitudinal cohort of pupils – those who were in Year 9 in 2002 and in Year 11 in 2004.36
4.1 The analysis The approach that was adopted for this analysis reflected that which was adopted in earlier sweeps of this study. In order to explore the five questions outlined in Section 3.2, the study needed to examine a complex set of variables, to control for the variety of home and school backgrounds from which young people came, as well as their different academic abilities and prior attainment and the extent to which they had been exposed to a range of different educational experiences. These included, for some, different Aimhigher: Excellence Challenge activities. All of these could be expected to have an impact on their awareness of, and attitudes towards, higher education, as well as on their aspirations to a university education. As in the first two annual analyses, therefore,37 a progressively focused approach was adopted. To begin with, within each cohort, young people’s responses to the surveys were combined (within year cohorts) to derive a
34 Emmerson, C., Frayne, C., McNally, S. and Silva, O. (forthcoming). An economic evaluation of
the early impact of Aimhigher: Excellence Challenge on pre-16 outcomes: an update. 35 In an accompanying analysis, using data from the Labour Force Survey (LFS) for young people
aged 16 to 20, they suggested that, while there were many caveats, the policy may have had an impact on those from the most disadvantaged backgrounds, with an increased probability of those from such backgrounds entering higher education. The current study focuses on younger cohorts, the majority of whom would not have reached the age for entry into higher education entry.
36 See data overview in Chapter 3. 37 Morris, M. Rutt, S. and Yeshanew, T. (2005) Evaluation of Aimhigher: Excellence Challenge
Pupil Outcomes One Year On. (Research Report RR649). London: DfES.

Evaluation of Aimhigher: Excellence Challenge - Longitudinal Pupil Analysis Report
22
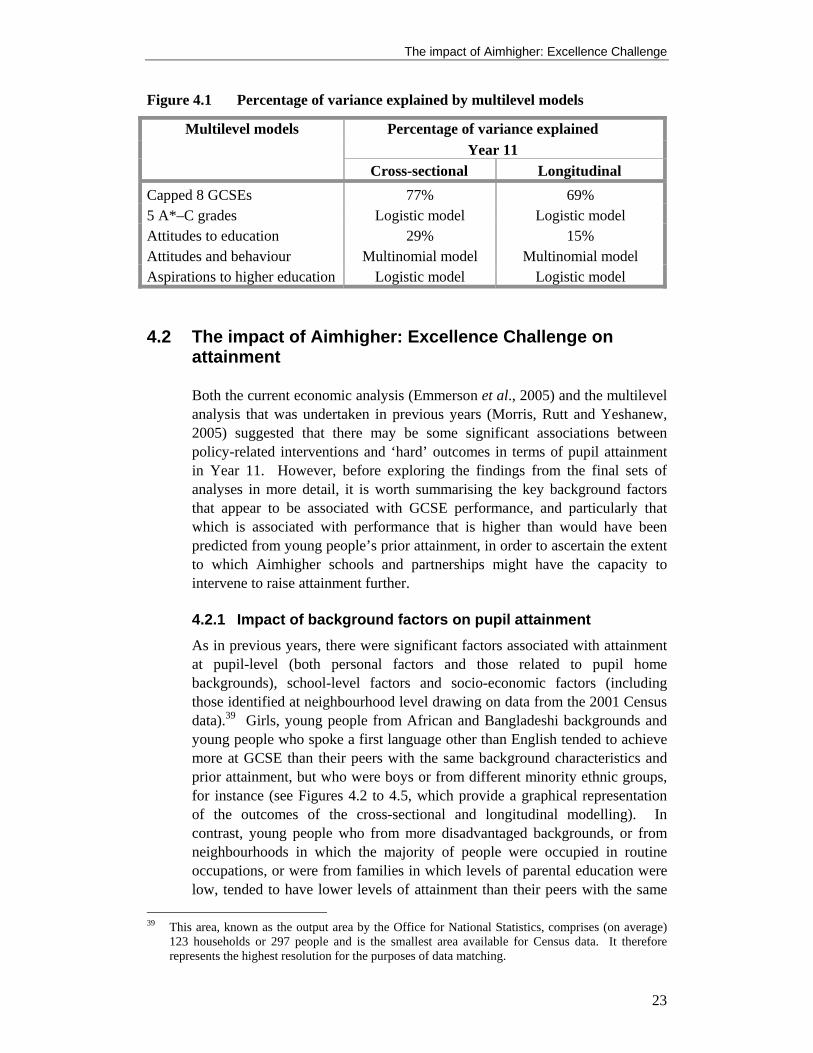
series of measures relating to their attitudes and experiences. Since the questions were replicated in each survey, these measures were calculated in the same way for each of the various cohorts of students and facilitated the exploration of changes over time for particular items amongst the 2004 Year 11 cohort. A similar strategy was deployed for both the schools’ survey and the teachers’ survey, in order to develop a series of composite measures of provision and of teachers’ attitudes and perceptions of Aimhigher: Excellence Challenge. Following data matching, a series of different statistical tests, including analyses of variance, multiple regression analyses and t-tests, were then used to identify the measures that were subsequently incorporated into the series of multilevel and logistic regression models developed to explore the impact of Aimhigher and the various activities that have been implemented under the initiative.38 Cross-sectional and longitudinal models were then constructed to look at a range of different ‘hard’ (attainment) and ‘soft’ (attitudes and aspirations) outcome measures. Background variables, at pupil and school level, were common to both the cross-sectional and longitudinal models, but the latter models, additionally, included measurements of change over time in pupils’ attitudes to school and to learning, for example, as well as exploring changes in their aspirations to higher education. The explanatory power of the attainment models was very high, with the variance at pupil level (in other words the difference between GCSE point scores between the highest and lowest scoring pupils) reduced by between two thirds and three quarters, once background variables, prior attainment and pupil attitudes and Aimhigher: Excellence Challenge experiences were included (see Figure 4.1). The explanatory power of the attitudinal models was somewhat lower, even when prior attainment was included, since neither the available questionnaire data, nor the pupil data included in national pupil datasets provided all of the information needed to assess why young people adopt particular attitudes or modes of behaviour. Nonetheless, the reduction of variance of between one fifth (for the longitudinal model) and just under one third (for the cross-sectional model) suggest that a number of the observed variables had a significant impact on young people’s attitudes to learning and to changes in such attitudes over time.
38 A description of the technique can be found in Appendix 3, along with the various background and
interaction variables that were included in the modelling process.
The impact of Aimhigher: Excellence Challenge
23
Figure 4.1 Percentage of variance explained by multilevel models
Percentage of variance explained Multilevel models Year 11
Cross-sectional Longitudinal Capped 8 GCSEs 77% 69% 5 A*–C grades Logistic model Logistic model Attitudes to education 29% 15% Attitudes and behaviour Multinomial model Multinomial model Aspirations to higher education Logistic model Logistic model
4.2 The impact of Aimhigher: Excellence Challenge on attainment Both the current economic analysis (Emmerson et al., 2005) and the multilevel analysis that was undertaken in previous years (Morris, Rutt and Yeshanew, 2005) suggested that there may be some significant associations between policy-related interventions and ‘hard’ outcomes in terms of pupil attainment in Year 11. However, before exploring the findings from the final sets of analyses in more detail, it is worth summarising the key background factors that appear to be associated with GCSE performance, and particularly that which is associated with performance that is higher than would have been predicted from young people’s prior attainment, in order to ascertain the extent to which Aimhigher schools and partnerships might have the capacity to intervene to raise attainment further. 4.2.1 Impact of background factors on pupil attainment As in previous years, there were significant factors associated with attainment at pupil-level (both personal factors and those related to pupil home backgrounds), school-level factors and socio-economic factors (including those identified at neighbourhood level drawing on data from the 2001 Census data).39 Girls, young people from African and Bangladeshi backgrounds and young people who spoke a first language other than English tended to achieve more at GCSE than their peers with the same background characteristics and prior attainment, but who were boys or from different minority ethnic groups, for instance (see Figures 4.2 to 4.5, which provide a graphical representation of the outcomes of the cross-sectional and longitudinal modelling). In contrast, young people who from more disadvantaged backgrounds, or from neighbourhoods in which the majority of people were occupied in routine occupations, or were from families in which levels of parental education were low, tended to have lower levels of attainment than their peers with the same
39 This area, known as the output area by the Office for National Statistics, comprises (on average)
123 households or 297 people and is the smallest area available for Census data. It therefore represents the highest resolution for the purposes of data matching.

Evaluation of Aimhigher: Excellence Challenge - Longitudinal Pupil Analysis Report
24
prior attainment. Details on the impact of each of these background variables are provided in the boxes below. • Girls’ attainment at GCSE was higher than that of boys, both in terms of
their capped GCSE scores and their likelihood of achieving five or more A* to C grades.40 Across the three cohorts, girls were nearly three times as likely as boys to have achieved five or more such higher grades, once prior attainment and other background characteristics were taken into account (an odds multiplier of 2.72).41 This difference was marginally less evident (though still significant) when the longitudinal data was examined.42 Girls in the 2004 longitudinal cohort were just under one and one quarter times more likely to have achieved higher grade GCSEs, once additional factors such as changes in attitudes to learning had been included in the models.
• The minority ethnic group differences noted in the raw data (with highest attainment amongst the Chinese pupils and lowest attainment amongst the Black Caribbean pupils) were not statistically evident once other background characteristics and prior attainment had been controlled for. Indeed, there were indications that high performing Chinese pupils at Key Stage 3 may have made less progress than other young people with the same prior attainment; such pupils in the longitudinal study scored 0.63 fewer GCSE points than would have been expected, given their Key Stage 3 scores.43 High performing Pakistani pupils in the same cohort, by contrast, made more progress between Key Stage 3 and Key Stage 4 than would have been anticipated (0.67 GCSE points).
Other ethnic differences emerged from the cross-sectional analysis. This suggested that pupils from African and Bangladeshi backgrounds had higher than expected GCSE point scores at Key Stage 4 than young people with the same prior attainment from white UK backgrounds. Girls from Black Caribbean backgrounds achieved, on average, 2.87 GCSE points more than Black Caribbean boys. There were no differences between ethnic groups (in either the cross-sectional or longitudinal analyses) in the probability of attaining five or more GCSEs, once known background variables (and variables such as changes in pupil attitudes to learning) had been included in the models.
• On the whole, young people with a first language other than English (14% of the combined cohorts) had higher levels of GCSE attainment than would have been expected from their prior attainment at Key Stage 3, equivalent to a mean of 2.54 GCSE points across all three Year 11 cohorts. Such pupils had significantly higher levels of probability of gaining five or more higher grade GCSEs (an odds ratio of 2.38), a finding that also emerged from the longitudinal analysis. This latter found that young people in the 2004 Year 11 cohort (13% of whom were EAL speakers)
40 See Tables 1 and 2 in Appendix 3. 41 An odds multiplier of greater than one indicates an increased probability, while an odds multiplier
of less than one shows a decreased probability. 42 See Tables 9 and 10 in Appendix 3 43 It should be noted, however, that the numbers of young people of Chinese background were low
(73) and so this finding needs to be treated with some caution. It echoes earlier findings from the evaluation of EiC: Morris, M., Rutt, S. and Eggers, M. (2003). Pupil outcomes: the impact of EIC

The impact of Aimhigher: Excellence Challenge
25
were more than twice as likely as their peers to have achieved the higher grades, once all background and change over time variables had been included.
• Pupils with higher levels of socio-economic disadvantage (those in receipt of Free School Meals, or with few books in the home, for instance) and young people with special educational needs had lower than expected levels of attainment at Key Stage 4, as did young people who had been excluded from school for at least one fixed term during the previous academic year.44 Across the three Year 11 cohorts, levels of attainment were lower than expected (across all measures) for pupils who had not been in their school since the start of Year 7 (some 10% of the cohort); such young people were only three quarters as likely as their peers from the same backgrounds and with the same level of prior attainment to obtain five or more higher grade GCSEs, for example. This difference between pupils who joined the school at different stages did not emerge during the longitudinal analysis, however.
• While young people who lived with both parents at home (63% of the cohort) had higher levels of attainment than other pupils (capped GCSE score and likelihood of achieving five or more GCSEs at grades A* to C), those who lived with at least their mother in their home (a further 27% of the cohort) had higher levels of attainment than young people who were looked after or who lived only with other members of their family. Amongst the young people in the longitudinal cohort, living with both parents (62% of the cohort) was associated with higher than expected attainment: other pupils appeared to attain the results that would have been predicted from their Key Stage 3 achievements.
• Parental levels of education also appeared significant, with maternal and paternal education to degree level associated with higher levels of GCSE attainment across every measure (including the likelihood of achieving five or more GCSEs at grades A* to C).45 Paternal education to at least 16 was associated with higher capped eight GCSE scores and a greater likelihood of achieving five or more higher grade GCSEs.
• The characteristics of pupil neighbourhoods were associated with attainment levels in both the cross-sectional and longitudinal studies. Young people who came from neighbourhoods in which the majority of people were in routine rather than professional or managerial occupations were associated with lower levels of attainment and a decreased likelihood of achieving five or more higher grade GCSEs, supporting the findings from the Youth Cohort Study reported in 2005.46 Those who lived in areas of higher owner occupation were associated with higher capped eight GCSE scores.
44 Just over three per cent of the pupils included in this model had been excluded for a fixed period at
some point over the previous year. 45 Eleven per cent of the cohort said that their mothers had studied to degree level, 13% said that their
fathers were so educated. 46 Department for Education and Skills (2005) Youth Cohort Study: The Activities and Experiences of
19 Year Olds: England and Wales 2005 (Statistical First Release 49/2005) [online]. Available http://www.dfes.gov.uk/rsgateway/DB/SFR/s000613/SFR49-2005.pdf

Evaluation of Aimhigher: Excellence Challenge - Longitudinal Pupil Analysis Report
26
Reflecting the findings in 2005,47 these results continue to suggest that there may still be a degree of educational underperformance associated with young people’s home circumstances (particularly poverty, mobility and levels of parental education) and with educational support needs. They also suggest that some of the apparent social barriers to high attainment at Key Stage 4 and, subsequently, therefore, entry to higher education have not yet been fully overcome. 4.2.2 Impact of Aimhigher: Excellence Challenge on pupil
attainment The analysis sought to explore the relationship between specific aspects of the policy (such as the designation of a young person to the widening participation cohort) and policy-related activities (such as university visits, summer schools and contact with undergraduates) with higher levels of attainment at the end of Key Stage 4. The initial comparative analyses (outlined in Section 4.2) suggested that, on the basis of the raw data alone, mean levels of attainment in Aimhigher: Excellence Challenge schools were marginally higher than in comparison schools. These differences were not evident once background characteristics at school and pupil level had been taken into account. However, some of the differences that had been observed between young people in the widening participation cohorts and other pupils, and between those in the gifted and talented cohorts and other pupils, remained. The outcomes of the modelling process indicated that these differences were evident, across the three Year 11 cohorts, even when young people’s sex, ethnicity, prior attainment and socio-economic, home and school circumstances were taken into account. In summary, once young people's experience of Aimhigher: Excellence Challenge-related activities, such as summer schools, university visits, and Aimhigher Roadshows and background characteristics at school and pupil level had been included in the analysis, associations were identified between the following policy interventions and higher attainment at Key Stage 4 across the three Year 11 cohorts (see Figures 4.2 to 4.5):48 • Designation as a member of the widening participation cohort was
associated with higher levels of attainment in terms of:
! capped eight GCSE score (an additional 0.72 GCSE points or just under one grade at GCSE);
• Designation as a member of the gifted and talented cohort was associated with higher levels of attainment in terms of:
! capped eight GCSE score (an additional 3.52 GCSE points);
47 Morris, M. Rutt, S. and Yeshanew, T. (2005) Evaluation of Aimhigher: Excellence Challenge
Pupil Outcomes One Year On. (Research Report RR649). London: DfES. 48 See Table 9 and 10 in Appendix 3.

The impact of Aimhigher: Excellence Challenge
27
! an increased likelihood of achieving five of more A* to C grades at GCSE – young people in the gifted and talented cohort were more than twice as likely to have achieved such grades as young people with the same background characteristics who were not so designated.
This story is not quite as straightforward as the initial analyses (nor the analyses in previous years) may have suggested, however, with the impact of the EiC gifted and talented strand on attainment being rather more evident across all measures of GCSE, and over time, than the Aimhigher: Excellence Challenge widening participation strategy. The impact of the latter strategy was also more evident amongst some groups of young people (those living in less deprived areas) than amongst all who were so designated, although it appeared to have contributed to a reduction in the gap between those who had been higher attaining and lower attaining members of the cohort at Key Stage 3). • To begin with, while young people in both widening participation and
gifted and talented cohorts across the three cohorts consistently achieved higher capped eight GCSE scores than their peers with the same background characteristics, only those in the gifted and talented cohort (primarily an artefact of the Excellence in Cities policy amongst the cohorts in the study) appeared to have a greater likelihood of achieving five or more GCSEs.
• Secondly, the impact of being in the widening participation cohort was more evident amongst young people who lived in areas in which there were a high proportion of owner occupiers; the GCSE scores amongst this group were, on average, 0.5 points greater than their peers in the widening participation cohort who lived in other areas. However, it also appeared to benefit those young people in the widening participation cohort who had previously attained less well in Key Stage assessment tests; higher attaining pupils at Key Stage 3 were associated with 0.48 GCSE points more than might have been anticipated from their prior attainment, whilst all other members of the widening participation cohort were associated with an additional 0.72 GCSE points.
• Thirdly, amongst young people in the 2004 Year 11 cohort, there was an association between being in the gifted and talented cohort when in Year 9 (2002), or in the gifted and talented cohort when in Year 11 (2004),49 and higher capped eight scores and an increased probability of achieving five or more GCSEs at grades A* to C.50 No such association emerged for the widening participation cohort in the longitudinal analysis.
49 Being designated as a member of this cohort from Year 9 through to Year 11 did not appear to be
associated with any additional increase in attainment. 50 Note that designation as a member of the gifted and talented cohort appeared to benefit those who
had been less high attaining members of the gifted and talented cohort; higher attaining pupils attained a mean of 2.20 points more than anticipated, compared to the mean of 3.52 points for all other pupils.

Evaluation of Aimhigher: Excellence Challenge - Longitudinal Pupil Analysis Report
28
• Amongst young people in the longitudinal cohort, however, visits to higher education institutions and discussions with university staff and undergraduates (both potentially Aimhigher: Excellence Challenge-related activity and open to widening participation pupils) were associated with both higher capped eight scores and higher probabilities of achieving five or more good GCSEs (see Figure 4.2, for example). It should be noted that these activities were often open to gifted and talented as well as to widening participation pupils.
Figure 4.2 Longitudinal model: Probability of attaining 5+ A to C
Grades • The role of the school, in encouraging young people to consider higher
education, was also associated with higher capped eight scores in the cross-sectional analysis, but did not emerge as significant during the longitudinal analyses.51 Indeed, the statistical analyses identified few school level variables as significantly related to pupil attainment, suggesting that it is the experience of each individual pupil and the circumstances and educational outlooks of each pupil, rather than the school type52 (age range, size, management type) that has the most significant impact on attainment.
This final point is crucial. Young people’s attitudes to learning, and particularly young people’s attitudes to the longer term benefits of staying in education, as well as their behaviour in school, were strongly associated with higher levels of attainment. Young people across the three Year 11 cohorts
51 The associations noted between higher levels of attainment and attendance at a girls’ school, while
significant, should be treated with some caution. The numbers of such pupils were relatively small: 1,978 (nine per cent of the pupil cohort) based in 16 schools in the cross-sectional study and 170 girls in 2 schools (five per cent of the pupil cohort) in the longitudinal study.
52 This is with the possible exception of girls’ schools – see footnote above.
0
10
20
30
40
50
60
70
80
90
100
0 10 20 30 40 50 60 70 80 90 100
Base ProbabilityTalked to familyTalked to university staffGifted and talented 2004Gifted and talented 2002

The impact of Aimhigher: Excellence Challenge
29
demonstrating such positive views were associated with a mean of 3.08 additional GCSE points. For a young person with average prior attainment (4.94 at Key Stage 3) living in an area in which home ownership and the percentage of the population is involved in routine occupations is the mean for the cohort (these young people achieved less well than their peers in more affluent areas), this is equivalent to raising attainment from a mean capped 8 GCSE score of 28 points (equivalent to eight GCSEs at just under grade D) to 31 points (equivalent to 8 grade Ds). So what is the evidence that Aimhigher: Excellence Challenge has had any impact on pupil attitudes? Have such activities as visiting universities or attending summer schools led to more positive attitudes to learning or to any changes in behaviour? Is there any evidence that being designated as a member of the Aimhigher: Excellence Challenge widening participation cohort contributed to more positive attitudes to learning or further or higher education amongst such young people? 4.2.3 Impact of Aimhigher: Excellence Challenge on pupil
attitudes Pupil background variables such as pupils’ sex and ethnicity, as well as their SEN and EAL status and whether or not they had been excluded for a fixed term at some point over the previous year, were all significantly associated with Year 11 pupils’ attitudes to learning and with a stated intention to stay in learning beyond 16, even when prior attainment had been included in the model.53 Girls appeared to have more positive attitudes than boys, while pupils from minority ethnic groups (including Indian, Pakistani, Bangladeshi, Black African and Black Caribbean pupils) displayed more positive attitudes than young people from white UK backgrounds. Those who lived with both their parents tended to display more positive attitudes than those who lived with only one parent, some other member of their family or were looked after. However, while young people who came from areas in which a high proportion of people were employed in routine occupations tended to have less positive attitudes to learning, those who were in schools in which the intake had a relatively high level of socio-economic deprivation (as indicated by data from the 2001 Census) were associated with more positive attitudes to learning. Pupils from the 2004 cohort were also associated with more positive attitudes than those in the 2002 and 2003 cohorts, suggesting that more of this cohort were possibly considering post-16 participation. What association, if any, do Aimhigher: Excellence Challenge activities have in promoting such positive attitudes? Is there any indication that such activities also change young people’s behaviour? In order to investigate these questions more fully, the young people in the three cohorts were divided into four groups according to their responses to
53 See Table 3 in Appendix 3.

Evaluation of Aimhigher: Excellence Challenge - Longitudinal Pupil Analysis Report
30
questionnaire items that identified either their attitudes to learning (ranging from their views on schoolwork to their aspirations re further and higher education) or their behaviour (ranging from the completion of homework to incidents of truancy). The default group, for modelling purposes, was the group designated as the young people who displayed a predominantly negative attitude to learning (though, it should be noted, not necessarily to their school) and negative behaviour in school (referred to as BABB): this group comprised over one third of the three Year 11 cohorts. The comparison groups were the young people who demonstrating a negative attitude, but good behaviour (22% of the combined cohorts - BAGB); those demonstrated a positive attitude, but poor behaviour (eight per cent of the cohorts GABB) and those with both positive attitudes and good behaviour (35% of the cohorts GAGB). An initial exploration of these groups suggested that they differed significantly in a number of ways (see Figure 4.3): • Young people from the GAGB group were higher attainers at Key Stage 3
and at GCSE than young people from all of the other groups. This was evident across all measures, Key Stage 3 level, capped eight score, achievement of five or more higher grade GCSEs, English GCSE score (a mean score equivalent to just over grade C) and maths GCSE score (a mean of just under grade C).
• Those from the GABB group differed from all other groups at GCSE (though not at Key Stage 3, where scores were not significantly different from BABB). Their attainment levels were lower, both at individual subject level and in terms of overall achievement.
• Pupils in the BABB and BAGB groups differed from each other in terms of capped eight scores, but did not differ significantly from each other for any other measure.

The impact of Aimhigher: Excellence Challenge
31
Figure 4.3 Attainment: by attitude and behaviour
BABB (1)
BAGB (2)
GABB (3)
GAGB (4)
Key Stage 3 average level 4.78 4.82 4.74 5.23
*(4) *(3,4) *(2,4) *(1,2,3)Capped eight GCSE 32.64 33.41 31.31 40.35
*(2,3,4) *(1,3,4) *(1,2,4) *(1,2,3)Percentage 5 or more GCSEs at grades A* to C
42% 42% 37% 66%
*(3,4) *(3,4) *(1,2,4) *(1,2,3)Highest grade English 4.45 4.48 4.34 5.24
*(3,4) *(3,4) *(1,2,4) *(1,2,3)Highest grade mathematics 3.85 3.89 3.7 4.66
*(3,4) *(3,4) *(1,2,4) *(1,2,3)
*(x) = significant differences were found between the performance outcomes for this group and the groups indicated by summary numbers in brackets
The story with respect to attitudes and behaviour is clearly rather more complex than the initial models might suggest. The analysis above does not take account of any other background factors, however, so a series of multinomial multilevel models were run to test the extent to which attitudes and behaviours appeared to be associated with background variables at pupil and school level; with specific policy-related variables (including designation as a member of the widening participation cohort); and with school and Aimhigher: Excellence Challenge related activities (such as study support, visits to universities and talking to undergraduates). Controlling for background variables alone suggested that girls, rather than boys, were associated with the GAGB group (they were also less evident in the GABB group), whilst young people from white UK backgrounds were more associated with the BABB group. Overall, better attitudes and behaviour were associated with young people from non-disadvantaged backgrounds and backgrounds in which the majority of people were employed in non-routine occupations. Once policy variables were included in the equations, a number of different associations emerged.54 Overall, young people from schools in Aimhigher: Excellence Challenge areas tended to display less positive attitudes than the young people in the comparison cohorts. The widening participation cohorts
54 See Table 4 in Appendix 3.

Evaluation of Aimhigher: Excellence Challenge - Longitudinal Pupil Analysis Report
32
appeared to be associated with both the BAGB and the GAGB groups. This was in direct contrast to the gifted and talented cohorts who were significantly associated only with the GAGB groups, suggesting that Aimhigher: Excellence Challenge may have successfully sought out young people who, as yet, may not have a positive attitude to learning or to the possibility of continuing in learning, even though their ostensible behaviour in school may be good. There was no association, however, with the GABB group, raising the question as to whether it was low prior attainment or poor behaviour (in school at least) that may have precluded young people’s designation to the widening participation group. The final development of the models, in which school and Aimhigher: Excellence Challenge-related activities were included, corroborated the previous models, with a negative association between Aimhigher: Excellence Challenge schools and positive attitudes and an association between young people with more negative attitudes but good behaviour (BAGB). This model also suggested, however, that some activities appeared to be more associated with positive attitudes, while others were more associated with good behaviour, although, from the cross-sectional analysis, causal effect cannot be imputed. • Visits to university and being in schools in which the value of a university
education was discussed appeared to be associated with positive attitudes amongst pupils (whether behaviour was good or bad);
• Feeling as a pupil, that teachers listened to young people, seemed to be a key factor associated with good behaviour.
Talking to undergraduates and talking to university staff were also associated with pupils in the GAGB group, though not those in the BAGB group, even though a proportion of young people in this group took part in such activities (13.6% spoke to undergraduates and 22.4% to higher education staff). This raises a number of questions: are such discussions always motivational, or are they effective only when attitudes are already good? An examination of the relationship between Aimhigher: Excellence Challenge activities and changes in attitudes to learning over time was inconclusive. While there were associations with a range of school variables (including teachers being seen by pupils as treating them with respect and teachers encouraging young people to do the things at which they were good) parental input (including making sure young people did their homework and encouraging them to stay in education beyond 16) had a bigger impact. Nonetheless, an aspiration to go to university was, arguably, the biggest single factor associated with positive changes in attitude over time. To what extent, therefore, has Aimhigher: Excellence Challenge had an impact on young people’s aspirations?

The impact of Aimhigher: Excellence Challenge
33
4.2.3 Impact of Aimhigher: Excellence Challenge on pupil aspirations
Not surprisingly, across the three Year 11 cohorts, the strongest associations with intentions to enter higher education were with pupil level variables, such as parents educated to at least degree level (an odds multiplier of 1.65), being a girl (an odds multiplier of 1.51) and having a greater number of books in the home (an odds multiplier of 1.22).55 Young people who spoke a first language other than English had a higher probability of signalling this intention (an odds multiplier of 2.08), while those from white UK backgrounds were only half as likely as other pupils with the same characteristics and prior attainment to suggest they might go to university. Parental support, with parents praising good work and making it clear that they considered education important, was also a significant factor. Nonetheless, policy-related activities also appeared to be strongly associated with young people’s aspirations. Teachers talking about the value of university (an odds multiplier of 1.52), visits to higher education institutions (an opportunity taken up by 31% of the cohort and with an odds multiplier of 1.27) and talking with undergraduates (an odds multiplier of 1.65),56 university lecturers (an odds multiplier of 1.36) and Personal Advisers (an odds multiplier of 1.13), were all linked to a stated intention to take up a university place. Are such visits and discussions associated with young people who were already considering such a pathway, or have they significantly influenced young people’s decision-making? Between Year 9 and Year 11, some 14.5% of the longitudinal cohort (499 pupils) had changed their mind from a decision not to go to university (or from a position of uncertainty) to a desire to follow a degree course.57 Over half of these (57.5%) were female and 64% were from white UK backgrounds; 23% were EAL speakers. Most (68%) lived with both parents, although nearly one third were living with only one birth parent, with other members of their family or were looked after. Only just over one quarter, however, were from families in which at least one parent had been educated to degree level, while 19% were eligible for Free School Meals and 7.6% had some form of special educational needs. At a policy level the proportion from the widening participation cohort (18%) was larger than those from the gifted and talented cohort (14%). At the same time a similar proportion (13%) had changed their mind and decided that they were no longer interested in following a higher education course. More of this group (53.6%) were male, from white UK backgrounds (70.6%), were in receipt of Free School Meals (80%) or had special
55 See Table 6 in Appendix 3. 56 Nearly 29% of the three Year 11 cohorts had taken part in such discussions. 57 Of the 3434 young people in the study, over one third (1176) were still certain that they would not
study beyond the age of 16 or 18.

Evaluation of Aimhigher: Excellence Challenge - Longitudinal Pupil Analysis Report
34
educational needs (89.7%). Only one fifth had parents educated to degree level. The proportion in the widening participation changing their mind was greater (17.7%) than the proportion in the gifted and talented cohort so doing (6.1%). Do either of these groups differ significantly from those who remained in the ‘No’ group or ‘Yes’ since Year 9? Have Aimhigher: Excellence Challenge activities played any role in this? The outcomes of the modelling suggest that, by comparison with those who had intended and still hoped to seek a place in higher education, there was a higher probability that those who had considered but rejected higher education (controlling for all background variables and prior attainment) were male58 and (according to their own self report) not well behaved in school nor likely to complete their homework on time.59 There was a greater likelihood that they were based in areas in which most people were in routine occupations and that they considered that their parents did not want them to stay in education (even though they reported that parents made sure they did their homework). The importance of parental influence is emphasised by the fact that young people whose parents wanted them to stay in education for as long as possible were four times more likely than the group whose parents’ had negative expectations of education to consider higher education. Although eight per cent of these young people had visited a higher education institution in 2004, there does not seem to be any particular association between this visit and their ultimate decision to reject this route, when comparing their responses to those who still hoped to obtain a place (15% of whom had taken part in a visit to an higher education institution). Nor is there any association with being designated a member of the gifted and talented or widening participation cohorts. Interestingly, young people in London were only half as likely to have decided against following a course of study in higher education as young people elsewhere in the country. There was a higher probability that those who had previously rejected but had now decided in favour of a university education (by comparison with those who continued to reject it) were female, were speakers of EAL or were from families with a large number of books in the home.60 According to their own self-report, there was a greater chance that they were well behaved and conformed to the requirements of their schools in terms of homework completion and attendance.61 There was also a higher likelihood that they enjoyed school and came from families where they thought education was valued.62 There was no significant association between a positive change of mind and being designated a member of the gifted and talented and/or
58 Girls were only two thirds as likely as boys to have rejected the university route between Year 9
and Year 11. 59 See Table 11 in Appendix 3. 60 See Table 12 in Appendix 3. 61 Amongst this group, their was no indication of changes in their attitudes to learning, although their
was evidence of positive changes in their 62 Note that there was no significant association with current family structure, however.

The impact of Aimhigher: Excellence Challenge
35
widening participation cohorts. Crucially for the Aimhigher: Excellence Challenge policy, however, young people’s change of mind appeared to be associated with visits to university during their final year in compulsory education (though only 13% had taken up such an opportunity);63 young people who had taken part in such visits were nearly twice as likely to have changed their minds about participating post-18. Discussions about university life with university undergraduates and lecturers and similar discussions with their family and friends were associated with increased probabilities of thinking about a university course (by a factor of one and one third and one and two thirds, respectively). There are some indications, therefore, that, while visits to higher education institutions may not be significantly associated with either sustained decisions to enter university (or a rejection of this path having initially considered it), there may be an association between such visits and a positive change of mind. This encouraging association also appears significant with respect to discussions with undergraduates and university staff.
4.3 In summary The story that emerges with respect to the impact of Aimhigher: Excellence Challenge is, not surprisingly, somewhat complex. While a number of associations between policy inputs and pupil outcomes exist across the three Year 11 cohorts, the role of Aimhigher: Excellence Challenge in significantly influencing young people’s attainment, attitudes and aspirations over time is harder to identify. Nonetheless, there are indications that: • There are associations between some Aimhigher: Excellence Challenge
interventions and improvements in young people’s attainment between Key Stage 3 and Key Stage 4. Whilst designation to the widening participation cohort was not specifically associated with longitudinal change, visits to higher education institutions and discussions with staff and undergraduates were associated with higher levels of attainment at Key Stage 4, including the probability of attaining five or more GCSEs at grades A* to C.
• Taking part in visits to higher education institutions and discussions with staff and undergraduates were associated with a higher probability of changing a negative decision about higher education into a positive one. There is no clear indication, however, that it necessarily contributed to a sustained decision to follow such a path.
These outcomes, while small, are nonetheless encouraging. Over a relatively short period of time (given the nature of the initiative) and considering the
63 Five per cent of those who continued to reject a higher education pathway had visited a university
during 2004.

Evaluation of Aimhigher: Excellence Challenge - Longitudinal Pupil Analysis Report
36
different ways that the policy has been implemented, as well as the variations in prior activity and experience across the different partnerships, the apparent emergence of attributable outcomes suggests that there is value in continuing interventions that challenge and shape young people’s awareness of higher education and its potential contribution to their future lives. While the data from the surveys does not provide any clear indication of length, duration or quality of visits, for instance, it nonetheless echoes the findings from the qualitative analyses, which suggest that carefully structured visits, as part of a planned programme of Aimhigher: Excellence Challenge interventions, play important role in changing young people’s attitudes and aspirations towards higher education.

Reflections
37
5. Reflections
At this point, it is worth revisiting the five questions raised at the outset of this report. Question 1 What is the general pattern of attainment amongst
different groups of pupils? Are these differences still evident once young people’s background characteristics are taken into consideration?
There are significant differences between different groups of pupils once young people’s background characteristics are taken into consideration. Girls and young people from Black African and Bangladeshi backgrounds demonstrated higher levels of performance than might have been expected from their levels of attainment at Key Stage 3 (while young people from Pakistani backgrounds made more progress than might have been expected), as did pupils with a first language other than English, those who lived with both parents or with their birth mother, and those from families with higher levels of parental education and from neighbourhoods with higher levels of owner-occupation. In contrast, young people with higher levels of socio-economic deprivation, with special educational needs or with a high degree of mobility tended to be associated with lower levels of performance, as did those form neighbourhoods in which there was a higher level of employment in routine rather than managerial or professional occupations. Question 2 Are there any differences in young people’s attitudes
to education and aspirations between different groups of pupils?
The attitudes demonstrated by different groups of pupils also varied, with girls displaying more positive attitudes than boys and those from minority ethnic groups showing more positive attitudes than young people from white UK backgrounds. Although less positive attitudes to learning were displayed by young people from areas in which a high proportion of the population were employed in routine occupations, positive attitudes to learning were evident amongst those in areas in which socio-economic deprivation was high.

Evaluation of Aimhigher: Excellence Challenge - Longitudinal Pupil Analysis Report
38
Question 3 To what extent are there any variations in performance between young people, with the same background characteristics, in Aimhigher: Excellence Challenge schools and those in comparison schools?
There do not appear to be any significant variations in performance, attitudes or aspirations between young people (with the same background characteristics) in Aimhigher: Excellence Challenge schools and those in comparison schools. Question 4 What is the relationship (if any) between Aimhigher:
Excellence Challenge interventions and attainment and/or attitudes and aspirations, once individual pupil and school characteristics and pupil prior attainment are taken into account?
A number of Aimhigher: Excellence Challenge interventions were associated with higher levels of attainment and aspirations to higher education. However, while visits to universities appeared to be positively associated with young people with positive attitudes to learning, there is no clear evidence that specific activities (such as visits to higher education) contributed to the development of such attitudes between Year 9 and Year 11. Nonetheless, since an aspiration towards a university education was the biggest single factor that appeared to contribute to positive changes in attitudes, Aimhigher: Excellence Challenge activities that promote such aspirations may be influential. In addition, teachers’ attitudes towards their pupils and the extent of perceived parental support appeared to have a significant impact on positive changes over time in attitudes towards learning. From a policy perspective, therefore, encouraging a pupil-focused ethos in schools, in which young people believe they are treated with respect and are encouraged to do their best, and facilitating outreach to parents, may be the most effective interventions. Question 5 Is it possible to identify the particular impact of any
specific Aimhigher: Excellence Challenge interventions on attainment and/or attitudes and aspirations?
From a policy perspective, the associations noted between visits to higher education institutions and discussions about higher education with undergraduates and university lecturers and both Key Stage 4 attainment and aspirations towards higher education are perhaps the most critical factors for the further development of the integrated Aimhigher programme.

Reflections
39
5.1 In conclusion The findings that were identified as significant here (particularly the role of campus visits and discussions with undergraduates and lecturers) reflect the wider qualitative findings of this study. It is important, however, not to adopt a too simplistic interpretation. For some young people, visits to higher education institutions were not influential, while for others they may have made a critical difference. What is clear from the study is that there is a complex interaction between the experiences and opportunities open to young people and their social capital, their own and teacher and parental attitudes and their longer-term aspirations. The challenge for the integrated Aimhigher programme remains to target specific activities towards those young people for whom they will have the greatest benefit. Clearly, the opportunity to experience higher education first-hand, both in terms of visits and the chance to talk to current students about their experiences, is probably the most influential factor. The bigger challenge is to identify appropriate individuals and, in so doing, to ensure that there is no systematic lack of inclusion of potential future undergraduates.

Evaluation of Aimhigher: Excellence Challenge - Longitudinal Pupil Analysis Report
40

Appendix 1
41
Appendix 1 Survey respondents by year and from treatment and comparison schools
2002 2003 2004 Total In treatment schools (EiC Phase 1,2 EAZ) 5682 9265 4487 19,434
In comparison schools (Phase 3 EiC and non-EiC/non-EAZ schools)
794 4257 0 5,051
6476 13522 4487 24,485

Evaluation of Aimhigher: Excellence Challenge - Longitudinal Pupil Analysis Report
42

Appendix 2
43
Appendix 2 Table 1. Characteristics of Schools Attended by Year 11 Pupils (2001/02),
weighted by pupil numbers
EC schools in sample
ALL EC schools
Comparison Schools
All Schools
% % % % Met-Non Met Area Met 78 74 77 35 Non-Met 22 26 23 65
Location North 70 53 11 30 Midlands 18 19 89 33 South 13 28 0 37
Percentage of pupils with a first language other than English (EAL) None 55 29 0 34 1 - 5% 22 28 0 41 6 - 49% 18 28 68 20 50% + 5 13 32 5 Not Applicable 0 2 0 1
Percentage of pupils eligible for free school meals Lowest 20% 0 1 11 6 2nd lowest 20% 8 6 0 26 Middle 20% 19 16 23 28 2nd highest 20% 42 31 34 24 Highest 20% 31 47 32 16
KS3 Achievement Band Lowest band 28 39 32 18 2nd lowest band 27 20 34 19 Middle band 19 19 23 19 2nd highest band 17 10 0 19 Highest band 9 10 11 18 Not Applicable 0 2 0 7
GCSE Achievement Band Lowest band 32 37 11 18 2nd lowest band 23 24 36 20 Middle band 22 17 41 20 2nd highest band 14 11 0 20 Highest band 9 7 11 15 Not Applicable 0 3 0 7
Beacon School No 89 88 79 91 Yes 11 12 21 9
Specialist School No 60 70 66 77 Yes 40 30 34 23
Total number of schools 63 6 848 3598

Evaluation of Aimhigher: Excellence Challenge - Longitudinal Pupil Analysis Report
44
Table 2. Characteristics of Schools Attended by Year 11 Pupils (2002/03), weighted by pupil numbers
Pupils
Responding pupils Sample pupils All pupils
Number % Number % Number % Metropolitan Non-Metropolitan 4398 34 4388 16 342153 63 Metropolitan 8412 66 23466 84 200163 37 Region North 6740 53 16456 59 165844 31 Midlands 3361 26 5239 19 172986 32 South 2709 21 6159 22 203486 38 Percentage of EAL pupils (NOT-Quintiles) None 4508 35 7566 27 179860 33 1 - 5% 2757 22 7082 25 222864 41 6 - 49% 3739 29 8723 31 107120 20 50% + 1806 14 4011 14 26500 5 Not available 0 0 472 2 5973 1 Percentage eligible FSM 2001 (5 pt scale) Lowest 20% 0 0 343 1 32498 6 2nd lowest 20% 426 3 1362 5 138210 25 Middle 20% 2382 19 4232 15 145865 27 2nd highest 20% 4662 36 7854 28 131342 24 Highest 20% 5340 42 14063 50 93923 17 Not available 0 0 0 0 479 0 Achievement Band (KS3 Overall performance) Lowest band 4417 34 10772 39 106158 20 2nd lowest band 2989 23 5697 20 109024 20 Middle band 2462 19 5302 19 108928 20 2nd highest band 1735 14 3811 14 106631 20 Highest band 1207 9 2272 8 102654 19 Not available 0 0 0 0 8922 2 Achievement Band (GCSE total point score) Lowest band 4335 34 10875 39 103491 19 2nd lowest band 3969 31 7596 27 116213 21 Middle band 2103 16 3751 13 117034 22 2nd highest band 1665 13 4201 15 116563 21 Highest band 738 6 1431 5 86301 16 Not available 0 0 0 0 2714 1 Beacon School No 11416 89 24371 87 484137 89 Yes 1394 11 3483 13 58179 11 Specialist School No 7075 55 17182 62 350231 65 Yes 5735 45 10672 38 192086 35 Total pupils 12810 100 27854 100 542316 100

Appendix 2
45
Table 3. Characteristics of Schools Attended by Year 11 Pupils (2003/04), weighted by pupil numbers
Pupils Responding
pupils Sample pupils All EiC/EAZ pupils All pupils
Number % Number % Number % Number % Metropolitan Non-Metropolitan 2781 30 10601 32 43837 26 369365 64Metropolitan 6393 70 22980 68 125913 74 209948 36Location North 5045 55 14554 43 86138 51 174355 30Midlands 1378 15 6702 20 36777 22 185356 32South 2751 30 12325 37 46835 28 219602 38Percentage of pupils with a first language other than English (EAL) (2004) None 1954 21 6023 18 27638 16 107508 191 – 5% 3862 42 11119 33 60285 36 301638 526 – 49% 2027 22 11951 36 58858 35 140870 2450% + 1331 15 4488 13 22969 14 29298 5Percentage of pupils eligible for free school meals 2004 (5 pt scale) Lowest 20% 0 0 153 0 1089 1 30327 52nd lowest 20% 512 6 1960 6 12164 7 152650 26Middle 20% 1428 16 5372 16 30513 18 168107 292nd highest 20% 4037 44 12484 37 59749 35 139199 24Highest 20% 3197 35 13612 41 66235 39 89030 15Achievement Band (KS3 Overall performance 2003) Lowest band 3216 35 13649 41 64837 38 111795 192nd lowest band 1912 21 6912 21 40816 24 118080 20Middle band 2005 22 5589 17 26532 16 116268 202nd highest band 1597 17 3770 11 19922 12 111551 19Highest band 444 5 3527 11 16729 10 107651 19Not available 0 0 134 0 914 1 13969 2Achievement Band (Total GCSE point-score 2002) Lowest band 3131 34 12658 38 60998 36 108933 192nd lowest band 2456 27 7883 23 43743 26 125365 22Middle band 1821 20 6245 19 29372 17 125875 222nd highest band 1178 13 3606 11 21119 12 121796 21Highest band 588 6 2797 8 13520 8 88197 15Not available 0 0 392 1 998 1 9147 2Beacon School No 7973 87 28818 86 145651 86 517914 89Yes 1201 13 4763 14 24099 14 61399 11Specialist School No 5459 60 19664 59 107521 63 374565 65Yes 3715 40 13917 41 62229 37 204748 35Total pupils 9174 100 33581 100 169750 100 579313 100

Evaluation of Aimhigher: Excellence Challenge - Longitudinal Pupil Analysis Report
46

Appendix 3
47
Appendix 3
An exploration of the relative impact of Excellence Challenge requires a systematic approach to the analysis of the available statistical data. In order to assess the ways in which, for example, young people’s attitudes towards higher education are associated with the range of different policy-related and other inputs to which young people are exposed, a complex set of variables need to be examined. Young people in participating schools and colleges come from a variety of home and school backgrounds, have different academic abilities and have been exposed, to varying degrees, to a range of different educational experiences. All of these could be expected to have an impact on their awareness of and attitudes towards higher education, as well as on their aspirations to a university education. Since the data to which the research team has access is hierarchical (variables can be identified at distinct levels – that of the partnership, the school and the student) the team has adopted the use of a multilevel modelling approach to data analysis. In multilevel modelling, the process is begun by identifying an outcome variable (for example pupil attainment, attitudes or actions), then, for each level of the data, the background variables that might be thought to influence that outcome are defined. Regardless of the outcome variables that are selected, it is expected that there will be differences of outcome at each level: • individuals will be different from each other;
• individuals within one school will be collectively different from those in other schools; and
• individuals within schools implementing a specific policy, initiative or activity will be collectively different from those in schools not implementing the policy initiative or activity.
These differences can be measured in terms of the extent to which each outcome variable is ‘conditioned’ by the background variables at each level. For example, the effect that being included in the widening participation cohort is having on any pupil can be assessed through comparing the mean observed difference in the attainment, attitudes or behaviour of that young person with the expected mean for all young people in the survey, taking into account the relevant background variables at school and pupil level (including prior attainment).

Evaluation of Aimhigher: Excellence Challenge - Longitudinal Pupil Analysis Report
48
By analysing the data in this way, it is possible to see the overall effects of each of the variables and identify the variables which have a significant impact. However, it should be remembered that: • no multi-level model is likely to include every possible variable. The
background variables to be included in the models that will be developed for the evaluation of Excellence Challenge will be:
! those which are known from past and current research to be relevant to pupil outcomes;
! those attitudinal variables that appear, from the EiC research, to be associated with different aspects of pupil behaviour and performance;
! those which are specifically related to the policy area. • the models do not identify causality in a definitive way, but simply
indicate significant factors which appear to bear some relationship to the outcomes. For instance, the analysis of the data indicated that young people in receipt of free school meals had lower levels of attainment than young people not in receipt of free school meals. This does not mean that being in receipt of free school meals (a proxy for socio-economic disadvantage) caused lower levels of attainment, but simply indicates that the attainment amongst such young people was lower than would have been expected by comparison with young people with the same level of prior attainment and other background characteristics. Similarly, while the self-reported behaviour and attitudes towards education of Year 11 pupils designated as gifted and talented was more positive than those expressed by other pupils with the same prior attainment score at key stage 3, it is not possible to ascertain whether these attitudes entirely pre-dated Aimhigher: Excellence Challenge (and may even have contributed to the designation of the young person as gifted and talented) or whether they had become more evident as a result of the activities in which they had taken part as a result of Aimhigher: Excellence Challenge.
• a multilevel model is only as good as our understanding of the educational processes at work in influencing young people’s attitudes, aspiration and motivation.
In order to prepare the data for inclusion in the models, the items in the questionnaires need to be reduced to a more manageable data set. Ideally, data needs to be either dichotomous (for example male or not male) or continuous (in which the variable can take any value over a given range). The data in the surveys had, therefore, to be manipulated in order to provide information that could be used in the models. This data manipulation has largely been accomplished through the use of factor analysis, although other scoring or pattern identification techniques have been used where more appropriate. The Models The multilevel models of pupil outcomes presented here (attainment, attitudes and aspirations) included data obtained from a number of sources.

Appendix 3
49
• Individual data on pupil backgrounds obtained from pupil data forms returned by schools (these forms also included data on young people designated as part of the gifted and talented or widening participation cohorts under EiC and Aimhigher).
• Data on young people’s sex, eligibility for free school meals, special educational needs, first language other than English and ethnicity, obtained from pupil data forms in PLASC in 2001/02, 2002/03 and 2003/04.
• Data on pupil prior attainment (at Key Stage 3) and attainment (at Key Stage 4) obtained from the National Pupil Database (2001/02, 2002/03 and 2003/04).
• Background data obtained from the NFER’s Register of Schools (ROS). This included data on schools’ location, size, age range, management type (Foundation, maintained, voluntary aided, etc.), school type (grammar, comprehensive, modern, etc.), aggregated profiles of SEN, free school meal eligibility, attainment profile, etc.
• Data on young people’s home neighbourhood, obtained by matching pupil-post-code data to the 2001 Census. For each pupil, the percentage of people who were unemployed, or in single parent households, for instance, in their immediate home geographical area (classified by the Office of National Statistics as the output area) was calculated and then aggregated to school level (these raw percentages were used in the multilevel models).64 The data for each variable was then divided into quintiles, so that an assessment of the relative deprivation of young people’s neighbourhoods could be made (these quintiles were used in the analyses of variance).65 One variable (the percentage of households not deprived on any measure) was calculated at pupil neighbourhood alone, all other Census variables were calculated to represent the pupil catchment of the school.
• Policy specific data (e.g. Phase of EiC, school in an EAZ, designation as Beacon or Specialist School etc.).
The analysis has focused on the outcomes for Year 11 cohorts, for whom end of Key Stage attainment data (average levels at Key Stage 3 and GCSE and equivalent scores) is available. The construction of the models was an iterative, stepwise process. To begin with, each model was constructed at two levels, with simple residuals at school and pupil levels. In order to identify all significant variables, a procedure was adopted whereby the models were first set up without the background variables in order to establish the amount of variance at school and pupil level for each of the outcome variables. Subsequently, sets of the pupil-level variables were included and those that
64 This area, known as the output area by the Office for National Statistics, comprises (on average)
123 households or 297 people and is the smallest area available for census data. It therefore represents the highest resolution for the purposes of data matching.
65 It should be noted that these variables represent young people’s neighbourhoods, not their own home circumstances. Data on some aspects of young people’s socio-economic and family backgrounds was available for a sub-set of pupils, from EiC and Aimhigher: Excellence Challenge questionnaire data, but not for all of the young people used in this study or set of analyses.

Evaluation of Aimhigher: Excellence Challenge - Longitudinal Pupil Analysis Report
50
were not significant were removed. School-level variables were then fitted and all non-significant variables were removed in order to get the most ‘parsimonious’ overall model (that is, the model that would explain the greatest amount of variance with the removal of all non-significant variables). During this process, a number of further strategies were introduced at each stage in order to make sure that the various derived variables and background data were not overly weighted in the models. As in all such modelling, background variables were checked to examine their interaction with other variables and, where necessary, specific interaction variables were derived for inclusion in the analysis. Where data was recorded on a continuous scale (particularly in terms of prior attainment and free school meals) investigations were undertaken to see whether quadratic functions ‘fitted’ the input data better than a straight line function. Using this function reduced the likelihood that the impact of such data (such as the percentage of young people eligible for free school meals in a school) would be over-emphasised. In the final model, however, no variables to which quadratic functions were fitted emerged as significant. The following table lists the range of background variables, derived variables and interaction terms used in the models. It does not include all the individual questionnaire items included in the models, however.

Appendix 3
51
Table A: List of included variables Variable Name Variable label PUPILID2 Unique pupil id PUPILID Pupil ID Pupil id LEA LEA SCHOOL SCHOOL NFERNO School number
Background variables at school level BOYSCH Boys Schools GIRLSCH Girls Schools MIXSCH Mixed Schools LCOM Local Community Schools LFOU Local Foundation Schools LVA Local VA Schools LVC Local VC Schools PHASE1 EIC Phase 1 PHASE2 EIC Phase 2 PHASE12 EIC Phase 1 & 2 PHASE3 Phase 3 AIMHIGH Aim Higher COMP Comparison Group EAZ EAZ school PCFSM00 School level FSM eligibility LOW Low performing school MID Mid performing school HIGH High performing school NTHEAST North East NTHWEST North West YORKSH Yorkshire EASTMID East Midlands WESTMID West Midlands EAST East LONDON London SEAST South East SWEST South West Background variables at pupil level LIVEMF Live with mum and dad MOTONLY Live with mother only FATONLY Live with father only BOOKS Number of Books in home MSECOND Mother’s highest education was secondary MPOST16 Mother’s highest education was FE MDEGREE Mother’s highest education was FE MMISSING Missing mother’s education FSECOND Father’s highest education was secondary FPOST16 Father’s highest education was FE FDEGREE Father’s highest education was FE FMISSING Missing father’s education

Evaluation of Aimhigher: Excellence Challenge - Longitudinal Pupil Analysis Report
52
Data from school questionnaire SQ2 Percentage of y11 students going on to FE SQ15YES Involved with beacon school SQ7TOT Number of activities involving the local community SQ12TOT Total income from non-LEA and DfES sources SQ14BTOT Number of activities offered as a result of Aimhigher SNUMBQ14 Number of activities offered SQ4FAC1(tailor) Number of strategies to promote HE (items 1,7,9 and 10) SQ4FAC2(exstudy) Number of strategies to promote HE (items 2 and 6) SQ4FAC3(under) Number of strategies to promote HE (items 5 and 13) SQ4FAC4(advance) Number of strategies to promote HE (items 4 and 8) MODEK3SE Grouping arrangement ks3 MODEK4SE Grouping arrangement ks4
Tutor questionnaire TQ12A_1 How important is it that all students have access to opportunities
beyond school? TQ12B_1 How important is it that every school has access to distinct teaching
and learning programme? TQ12C_1 How important is it all local schools work together? TQ12D_1 How important is that a wide range of students are encouraged to go
into HE? TQ13B1_1 Aimhigher will encourage a wide range of children to go into HE TQ13B2_1 Opportunity bursaries will help you people from this school TQ13B3_1 Aimhigher advertising will influence more families GAWARE Awareness of Aimhigher in general SAWARE Awareness of Aimhigher in your school
Second order composite variables created using first order composites (Tutor questionnaire)
FAC1TU_1(benall) impsch2+benefit1+benefit2+benefit3+benefit4 FAC2TU_1(goodsp) tutorgr1+tutorgr1+parent1+parent2+public1 FAC3TU_1(percep) facil1+facil2+public2+public3 FAC4TU_1(cpd) profdev1+profdev2+profdev3+impsch1+lelink2+lelink3 FAC5TU_1(Method) teach2+teach3+teach4+lelink1
Pupil background and outcome measures FSMYES Free School Meals TOTSCORE Total GCSE score TOTSC8 Capped GCSE score GCSEENG English GCSE score GCSEMATH Maths GCSE score TOTATOC Total A* to C Grades TOTATOG Total A* to G Grades KS3ENG KS3 English Level KS3MATH KS3 Maths Level KS3AV KS3 Average Level EXCLFYES Excluded fixed or permanent EXCLFMIS Missing Exclusion data MOB1 Pupil not in school in Year 7 EALYES First language other than English SENYES Special educational needs (A, P, Q and S) GNT Gifted and Talented GNTMIS Missing G&T

Appendix 3
53
WIDEPYES Widening participation cohort WIDEMISS Missing WP data MENTYES Seen a learning mentor MENTMISS Missing mentor data WHITEUK White UK WHITEOTH White other CARIB Caribbean AFRICAN African BLACKOTH Black other INDIAN Indian PAKISTAN Pakistan BANGLA Bangladeshi CHINESE Chinese OTHER other ethnicity CONS constant SEXYES Boy or Girl FIVEPLUS 0 ‘score value less than 5’ 1 ‘score value greater than 4.9’ Y2002 Year 2002 Y2003 Year 2003 Y2004 Year 2004 PDEP2 % of households in OA deprived in two dimensions PROUT % of people aged 16-74 in routine occupations in OA POWNER % of households that are owner-occupied in OA SCDEP2 mean % of households deprived in two dimensions SCROUT mean % of people aged 16-74 in routine occupations SCOWNER mean % of households that are owner occupied KS3AVC Centred KS3 Average Level
Second order composites created using first order composites (Pupil questionnaire)
FAC1Y11 (Goodsch) Learn3 +teach1 +goodsch+goodsch2+facil1+facil2+future _uni+chances
FAC2Y11 (Posatt) likesch+goodpup+truant+stayon FAC3Y11 Happy) planner+analysis+happy-sad-nouni FAC4Y11 Active) help+outside1+outside2+outside3 FAC5Y11 (Schact) curract +noncurr+learn1+learn2+teamman
Interaction terms KS3WIDE Average KS3 Level *Widening participation WIDEMENT Widening participation*Seeing Learning Mentor WIDESEX Widening participation*Sex WIDEGNT Widening participation*Gifted and Talented WIDELOW Widening participation*Low performing school WIDEMID Widening participation*Mid performing school WIDEHIGH Widening participation*High performing school WIDPDEP2 Widening participation* % of households in OA deprived in two or more
dimensions WIDPROUT Widening participation* % of people aged 16-74 in routine occupations
in OA WIDPOWNR Widening participation* % of households that owner-occupied in OA MENPDEP2 Seen a learning mentor *% of households in OA deprived in two or
more dimensions MENPROUT Seen a learning mentor *% of people aged 16-74 in routine

Evaluation of Aimhigher: Excellence Challenge - Longitudinal Pupil Analysis Report
54
occupations in OA MENPOWNR Seen a learning mentor *% of households that owner-occupied in OA GNTPDEP2 Gifted and Talented * % of households in OA deprived in two or more
dimensions GNTPROUT Gifted and Talented * % of people aged 16-74 in routine occupations in
OA GNTPOWNR Gifted and Talented * % of households that owner-occupied in OA WGNTDEP2 Widening participation* Gifted and Talented *% of households in OA
deprived in two or more dimensions WGNTROUT Widening participation* % of people aged 16-74 in routine occupations
in OA WGTPOWNR Widening participation* % of households that owner-occupied in OA WIDEAL Widening participation* First language other than English WIDCARIB Widening participation*Caribbean WIDINDI Widening participation*Indian WIDBANG Widening participation*Bangladeshi WIDPAK Widening participation*Pakistan WIDCHINE Widening participation*Chinese WIDAFRIC Widening participation*African WIDEFF1 Widening participation*fac1y11(Goodsch) WIDEFF2 Widening participation*fac2y11(Posatt) WIDEFF3 Widening participation*fac3y11(Happy) WIDEFF4 Widening participation*fac4y11(Active) WIDEFF5 Widening participation*fac5y11(Schact) KS3CARIB KS3 Average Level *Black Caribbean KS3INDI KS3 Average Level *Indian KS3BANG KS3 Average Level *Bangladeshi KS3PAK KS3 Average Level *Pakistan KS3CHINE KS3 Average Level *Pakistan KS3AFRIC KS3 Average Level *Chinese MENTHIGH Seen a learning mentor *High performing school MENTLOW Seen a learning mentor *Low performing school MENTMID Seen a learning mentor *Mid performing school GNTLOW Gifted and Talented * Low performing school GNTMID Gifted and Talented * Mid performing school GNTHIGH Gifted and Talented *High performing school KS3GNT KS3 Average Level *Gifted and Talented KS3SEX KS3 Average Level *Sex KS3EAL KS3 Average Level* First language other than English GNTMENT Gifted and Talented * Seen a learning mentor CARIBSEX Black Caribbean *sex AFRSEX Black African *sex INDSEX Indian * sex BANGSEX Bangladeshi*sex CHINSEX Chinese*sex CARIBGNT Black Caribbean *Gifted and Talented AFRGNT Black African *Gifted and Talented INDGNT Indian * Gifted and Talented BANGGNT Bangladeshi*Gifted and Talented CHINGNT Chinese*Gifted and Talented CARMENT Black Caribbean *Seen a learning mentor

Appendix 3
55
AFRMENT Black African *Seen a learning mentor INDMENT Indian * Seen a learning mentor BANGMENT Bangladeshi*Seen a learning mentor CHINMENT Chinese*Seen a learning mentor LOWSEX Low performing school *sex MIDSEX Mid performing school *sex HIGHSEX High performing school *sex GNTSEX Chinese*sex SEXFF1 SEX *fac1y11(Goodsch) SEXFF2 SEX*fac2y11(Posatt) SEXFF3 SEX*fac3y11(Happy) SEXFF4 SEX*fac4y11(Active) SEXFF5 SEX*fac5y11(Schact) WIDEFSM Widening participation* Free School Meals GNTFSM Gifted and Talented *Free School Meals WID2002 Widening participation*Year 2002 WID2003 Widening participation*Year 2003 WID2004 Widening participation*Year 2004 GNTFF1 Gifted and Talented*fac1y11(Goodsch) GNTFF2 Gifted and Talented*fac2y11(Posatt) GNTFF3 Gifted and Talented*fac3y11(Happy) GNTFF4 Gifted and Talented*fac4y11(Active) GNTFF5 Gifted and Talented*fac5y11(Schact) MENTFF1 Seen a learning mentor*fac1y11(Goodsch) MENTFF2 Seen a learning mentor*fac2y11(Posatt) MENTFF3 Seen a learning mentor*fac3y11(Happy) MENTFF4 Seen a learning mentor*fac4y11(Active) MENTFF5 Seen a learning mentor*fac5y11(Schact)
The following tables provide the final coefficient tables from the modelling process.

Evaluation of Aimhigher: Excellence Challenge - Longitudinal Pupil Analysis Report
56
Table 1. Coefficients for cross-sectional model: capped 8 total GCSE score totsc8 Score Multilevel results
95% Confidence interval
Parameter Estimate Standard error
Sig. Min. Max.
Base case School variance 30.891 3.435 * 24.158 37.624 Pupil variance 152.559 1.441 * 149.735 155.383 Final model #DIV/0! 0.000 0.000 School variance 2.940 0.356 * 2.242 3.638 School KS3 covar. -0.459 0.158 * -0.769 -0.149 School KS3 variance 0.943 0.134 * 0.680 1.206 Pupil variance 35.564 0.344 * 34.890 36.238 Effect Fixed coefficients #DIV/0! 0.000 0.000 Size CONS 28.057 0.949 * 26.197 29.917 Lower Mean Upper KS3AV 8.447 0.101 * 8.249 8.645 12.97 13.28 13.59 posattc 0.416 0.009 * 0.398 0.434 2.95 3.08 3.22 happyc 0.053 0.009 * 0.035 0.071 0.35 0.52 0.69 activec 0.177 0.021 * 0.136 0.218 0.96 1.25 1.54 livemf 1.030 0.144 * 0.748 1.312 0.75 1.03 1.31 motonly 0.636 0.151 * 0.340 0.932 0.34 0.64 0.93 booksc 0.320 0.032 * 0.257 0.383 0.56 0.69 0.83 mdegree 0.395 0.144 * 0.113 0.677 0.11 0.40 0.68 fsecond 0.448 0.102 * 0.248 0.648 0.25 0.45 0.65 fpost16 0.679 0.129 * 0.426 0.932 0.43 0.68 0.93 fdegree 0.947 0.150 * 0.653 1.241 0.65 0.95 1.24 goodsp 0.900 0.023 * 0.855 0.945 7.07 7.44 7.81 tq12d_1 0.592 0.251 * 0.100 1.084 0.07 0.43 0.80 fsmyes -1.172 0.117 * -1.401 -0.943 -1.40 -1.17 -0.94 gnt 3.521 0.216 * 3.098 3.944 3.10 3.52 3.94 EXCLFYES -3.243 0.243 * -3.719 -2.767 -3.72 -3.24 -2.77 MOB1 -0.626 0.164 * -0.947 -0.305 -0.95 -0.63 -0.30 ealyes 2.541 0.171 * 2.206 2.876 2.21 2.54 2.88 SENYES -2.247 0.135 * -2.512 -1.982 -2.51 -2.25 -1.98 westmid 0.893 0.390 * 0.129 1.657 0.13 0.89 1.66 widepyes 0.719 0.181 * 0.364 1.074 0.36 0.72 1.07 african 2.640 0.392 * 1.872 3.408 1.87 2.64 3.41 bangla 1.341 0.453 * 0.453 2.229 0.45 1.34 2.23 other 0.663 0.293 * 0.089 1.237 0.09 0.66 1.24 sex 1.676 0.090 * 1.500 1.852 1.50 1.68 1.85 y2002 2.226 0.422 * 1.399 3.053 1.40 2.23 3.05 y2003 1.462 0.422 * 0.635 2.289 0.63 1.46 2.29 proutc -0.034 0.007 * -0.048 -0.020 -0.58 -0.41 -0.25 pownerc 0.018 0.002 * 0.014 0.022 0.53 0.67 0.82 ks3wide -0.552 0.171 * -0.887 -0.217 -0.39 -0.24 -0.10 widepownrc -0.014 0.005 * -0.024 -0.004 -0.28 -0.17 -0.05 mentmid -0.519 0.142 * -0.797 -0.241 -0.80 -0.52 -0.24 ks3gnt -1.336 0.158 * -1.646 -1.026 -1.01 -0.82 -0.63 ks3sex 0.206 0.081 * 0.047 0.365 0.05 0.23 0.41 caribsex 1.188 0.432 * 0.341 2.035 0.34 1.19 2.03 afrgnt -3.138 1.021 * -5.139 -1.137 -5.14 -3.14 -1.14 indment -0.943 0.474 * -1.872 -0.014 -1.87 -0.94 -0.01 sexactivec -0.079 0.018 * -0.114 -0.044 -0.57 -0.39 -0.22 gntposattc -0.073 0.029 * -0.130 -0.016 -0.30 -0.17 -0.04 gnthappyc -0.052 0.020 * -0.091 -0.013 -0.30 -0.17 -0.04 sexgoodschc -0.019 0.008 * -0.035 -0.003 -0.27 -0.15 -0.03 Percentage reduction = 77% of pupil variance

Appendix 3
57
Figure 1. Cross-sectional model: Capped 8 total GCSE score
-7
-6
-5
-4
-3
-2
-1
0
1
2
3
4
5
6
7
KS3
AV
posa
ttc
happ
ycac
tivec
livem
fm
oton
ly
book
scm
degr
ee
fsec
ond
fpos
t16
fdeg
ree
good
sptq
12d_
1
fsm
yes
gnt
EXC
LFY
ESM
OB
1
ealy
esSE
NY
ESw
estm
idw
idep
yes
afric
anba
ngla
othe
rse
x
y200
2y2
003
prou
tc
pow
nerc
ks3w
ide
wid
epow
nrc
men
tmid
ks3g
ntks
3sex
carib
sex
afrg
ntin
dmen
t
sexa
ctiv
ecgn
tpos
attc
gnth
appy
c
Cha
nge
in B
est 8
scor
e

Evaluation of Aimhigher: Excellence Challenge - Longitudinal Pupil Analysis Report
58
Table 2. Coefficients for cross-sectional model: 5+ A*-C grades 5+ A* to C Grades Multilevel results
95% Confidence interval
Parameter Estimate Standard error
Sig. Min. Max.
Base case School variance 0.41 0.05 * 0.32 0.50 Final model School variance 0.61 0.08 * 0.46 0.76 School KS2 covar. -0.40 0.07 * -0.54 -0.26 School KS2 variance 0.72 0.11 * 0.51 0.93
Fixed coefficients Odds multiplier CONS -1.30 0.17 * -1.626 -0.968 Lower Mean Upper KS3AVc 2.588 0.08 * 2.435 2.741 11.42 13.30 15.50 posatt 0.113 0.01 * 0.103 0.123 1.11 1.12 1.13 happy 0.013 0.01 * 0.003 0.023 1.00 1.01 1.02 active 0.049 0.01 * 0.027 0.071 1.03 1.05 1.07 livemf 0.173 0.05 * 0.081 0.265 1.08 1.19 1.30 books 0.083 0.02 * 0.052 0.114 1.05 1.09 1.12 fsecond 0.162 0.05 * 0.060 0.264 1.06 1.18 1.30 fpost16 0.18 0.07 * 0.051 0.309 1.05 1.20 1.36 fdegree 0.395 0.08 * 0.242 0.548 1.27 1.48 1.73 benall 0.025 0.01 * 0.007 0.043 1.01 1.03 1.04 method -0.032 0.02 * -0.061 -0.003 0.94 0.97 1.00 fsmyes -0.207 0.06 * -0.317 -0.097 0.73 0.81 0.91 gnt 0.793 0.10 * 0.595 0.991 1.81 2.21 2.69 exclfyes -0.562 0.15 * -0.850 -0.274 0.43 0.57 0.76 mob1 -0.23 0.09 * -0.397 -0.063 0.67 0.79 0.94 ealyes 0.867 0.09 * 0.695 1.039 2.00 2.38 2.83 senyes -0.542 0.08 * -0.701 -0.383 0.50 0.58 0.68 sexyes 1 0.25 * 0.514 1.486 1.67 2.72 4.42 y2002 1.151 0.19 * 0.781 1.521 2.18 3.16 4.58 y2003 0.826 0.19 * 0.448 1.204 1.56 2.28 3.33 prout -0.007 0.00 * -0.013 -0.001 0.99 0.99 1.00 powner 0.004 0.00 * 0.002 0.006 1.00 1.00 1.01 mentmid -0.183 0.07 * -0.318 -0.048 0.73 0.83 0.95 lowsex -0.589 0.26 * -1.093 -0.085 0.34 0.55 0.92 midsex -0.589 0.25 * -1.083 -0.095 0.34 0.55 0.91 sexactive -0.023 0.01 * -0.041 -0.005 0.96 0.98 0.99

Appendix 3
59
Figure 2. Cross-sectional model: Probability of attaining 5 or more A*-C
0.00
1.00
2.00
3.00
4.00
5.00
6.00
posa
tt
happ
y
activ
e
livem
f
book
s
fsec
ond
fpos
t16
fdeg
ree
bena
ll
met
hod
fsm
yes
gnt
excl
fyes
mob
1
ealy
es
seny
es
sexy
es
y200
2
y200
3
prou
t
pow
ner
men
tmid
low
sex
mid
sex
sexa
ctiv
e
Odd
s M
ultip
lier

Evaluation of Aimhigher: Excellence Challenge - Longitudinal Pupil Analysis Report
60
Table 3. Coefficients for cross-sectional model: attitudes to learning POSATT Score Multilevel results
95% Confidence interval
Parameter Estimate Standard error
Sig. Min. Max.
Base case School variance 1.696 0.199 * 1.306 2.086 Pupil variance 26.092 0.237 * 25.627 26.557 Final model #DIV/0! 0.000 0.000 School variance 6.258 1.074 * 4.153 8.363 School KS3 covar. -1.154 0.206 * -1.558 -0.750 School KS3 variance 0.231 0.041 * 0.151 0.311 Pupil variance 18.389 0.179 * 18.038 18.740 Effect Fixed coefficients #DIV/0! 0.000 0.000 Size CONS -7.760 0.718 * -9.167 -6.353 Lower Mean Upper KS3AV 0.435 0.060 * 0.317 0.553 0.50 0.68 0.87 GOODSCH 0.236 0.004 * 0.228 0.244 2.53 2.62 2.71 HAPPY 0.123 0.007 * 0.109 0.137 1.08 1.21 1.35 ACTIVE 0.153 0.015 * 0.124 0.182 0.87 1.08 1.29 SCHACT 0.100 0.007 * 0.086 0.114 0.77 0.89 1.01 LIVEMF 0.421 0.064 * 0.296 0.546 0.30 0.42 0.55 BOOKS 0.312 0.022 * 0.269 0.355 0.58 0.68 0.77 FPOST16 0.348 0.081 * 0.189 0.507 0.19 0.35 0.51 EXCLFYES -1.780 0.175 * -2.123 -1.437 -2.12 -1.78 -1.44 EALYES 1.086 0.165 * 0.763 1.409 0.76 1.09 1.41 SENYES -0.310 0.096 * -0.498 -0.122 -0.50 -0.31 -0.12 EAST -0.932 0.302 * -1.524 -0.340 -1.52 -0.93 -0.34 MENTYES -0.556 0.079 * -0.711 -0.401 -0.71 -0.56 -0.40 CARIB 0.927 0.224 * 0.488 1.366 0.49 0.93 1.37 AFRICAN 0.871 0.270 * 0.342 1.400 0.34 0.87 1.40 INDIAN 0.873 0.209 * 0.463 1.283 0.46 0.87 1.28 PAKISTANI 1.319 0.210 * 0.907 1.731 0.91 1.32 1.73 BANGLADESHI 1.804 0.587 * 0.653 2.955 0.65 1.80 2.95 CHINESE 1.548 0.522 * 0.525 2.571 0.52 1.55 2.57 SEXYES 0.796 0.064 * 0.671 0.921 0.67 0.80 0.92 Y2002 -1.224 0.233 * -1.681 -0.767 -1.68 -1.22 -0.77 Y2003 -0.677 0.240 * -1.147 -0.207 -1.15 -0.68 -0.21 PROUT -0.021 0.004 * -0.029 -0.013 -0.35 -0.26 -0.16 SCDEP2 0.077 0.020 * 0.038 0.116 0.18 0.37 0.57 GNTPROUT 0.019 0.004 * 0.011 0.027 0.12 0.20 0.29 KS3SEX 0.190 0.058 * 0.076 0.304 0.09 0.21 0.34 BANGSEX -1.576 0.680 * -2.909 -0.243 -2.91 -1.58 -0.24 SEXAVTIVE -0.078 0.013 * -0.103 -0.053 -0.52 -0.39 -0.26 SEXSCHACT 0.029 0.010 * 0.009 0.049 0.06 0.18 0.31 GNTACTIVE -0.064 0.021 * -0.105 -0.023 -0.23 -0.14 -0.05 MENTHAPPY -0.036 0.010 * -0.056 -0.016 -0.27 -0.17 -0.08 MENTSCHACT -0.035 0.011 * -0.057 -0.013 -0.24 -0.15 -0.06 Percentage reduction = 29% of pupil variance

Appendix 3
61
Table 4. Probability model: associations with attitudes and behaviour (cross-sectional multinomial)
Probability of not being in BABB Multinomial Models Results
95% Confidence interval Parameter Estimate Standard
error Sig. Min. Max.
Base case School variance #DIV/0! 0.00 0.00 Final model School variance 0.07 0.01 * 0.04 0.09
Fixed coefficients Odds multiplier against
BABB
CONS BAGB GABB GAGB Q1AX 1.53 1.25 1.99 Q1BX 0.70 0.54 0.37 Q1DX 0.79 0.72 0.54 Q1EX 1.00 1.00 0.61 Q2AX 1.12 1.39 1.46 Q2BX 1.28 1.13 1.51 Q3BX 1.00 1.00 1.10 Q3CX 1.13 1.11 1.23 Q3DX 1.00 1.00 1.20 Q3FX 0.90 0.84 1.00 Q3HX 1.00 1.28 1.18 Q13X 1.60 1.48 2.27 Q14GX 1.15 1.25 1.77 Q14JX 1.00 1.00 1.21 Q18AX 1.42 1.58 2.05 Q18BX 1.19 1.36 1.70 Q18CX 1.07 1.00 1.00 Q18DX 1.12 1.28 1.32 Q18EX 1.00 1.16 1.22 Q19DX 1.00 1.15 1.00 Q19EX 1.00 1.00 1.14 Q19FX 1.00 1.00 1.17 Q19GX 0.87 1.18 1.00 Q12AZ_1 1.59 1.49 2.10 FSM 1.14 1.21 1.00 G&T 0.85 1.00 1.39 EXCLYES 0.60 1.37 0.46 SEN 0.86 1.00 0.57 WIDEPYES 1.12 1.00 1.00 MENTYES 0.87 1.00 0.67 AIMHIGH 1.17 0.81 1.00 BOOKSC 1.04 1.05 1.19 WHITEUK 1.00 0.71 0.74 EAL 1.00 1.00 1.72 ENGFLU12 1.00 1.00 1.52 SEX 1.00 1.00 1.46 PARED 1.00 1.00 1.08

Evaluation of Aimhigher: Excellence Challenge - Longitudinal Pupil Analysis Report
62
Table 5. Probability of aspiring to higher education: activities only (cross-sectional model)
Like uni Multilevel results
95% Confidence interval
Parameter Estimate Standard error
Sig. Min. Max.
Base case School variance #DIV/0! 0.00 0.00 Final model School variance 0.35 0.04 * 0.27 0.43 School KS2 covar. #DIV/0! 0.00 0.00 School KS2 variance #DIV/0! 0.00 0.00
Fixed coefficients Odds multiplier CONS -2.37 0.09 * -2.534 -2.196 Lower Mean Upper Q1A 0.129 0.04 * 0.056 0.202 1.06 1.14 1.22 Q1B 0.13 0.05 * 0.038 0.222 1.04 1.14 1.25 Q1C 0.099 0.04 * 0.023 0.175 1.02 1.10 1.19 Q1D 0.187 0.05 * 0.093 0.281 1.10 1.21 1.32 Q1E -0.173 0.05 * -0.267 -0.079 0.77 0.84 0.92 Q3A -0.134 0.03 * -0.187 -0.081 0.83 0.87 0.92 Q3D 0.118 0.03 * 0.061 0.175 1.06 1.13 1.19 Q3E -0.094 0.04 * -0.172 -0.016 0.84 0.91 0.98 Q3F 0.297 0.03 * 0.238 0.356 1.27 1.35 1.43 Q3G -0.283 0.03 * -0.338 -0.228 0.71 0.75 0.80 Q3H 0.395 0.03 * 0.334 0.456 1.40 1.48 1.58 Q13 0.414 0.03 * 0.347 0.481 1.42 1.51 1.62 Q14J -0.062 0.03 * -0.119 -0.005 0.89 0.94 0.99 Q18C -0.149 0.03 * -0.204 -0.094 0.82 0.86 0.91 Q18E 0.402 0.03 * 0.345 0.459 1.41 1.49 1.58 Q19C 0.113 0.03 * 0.058 0.168 1.06 1.12 1.18 Q19E 0.771 0.03 * 0.714 0.828 2.04 2.16 2.29 Q19G 0.246 0.03 * 0.189 0.303 1.21 1.28 1.35 Q12A -0.179 0.05 * -0.277 -0.081 0.76 0.84 0.92 Q12B -0.257 0.05 * -0.359 -0.155 0.70 0.77 0.86 Q12C 0.292 0.05 * 0.192 0.392 1.21 1.34 1.48 Q12D 0.68 0.08 * 0.529 0.831 1.70 1.97 2.30 GBGA 0.988 0.03 * 0.929 1.047 2.53 2.69 2.85
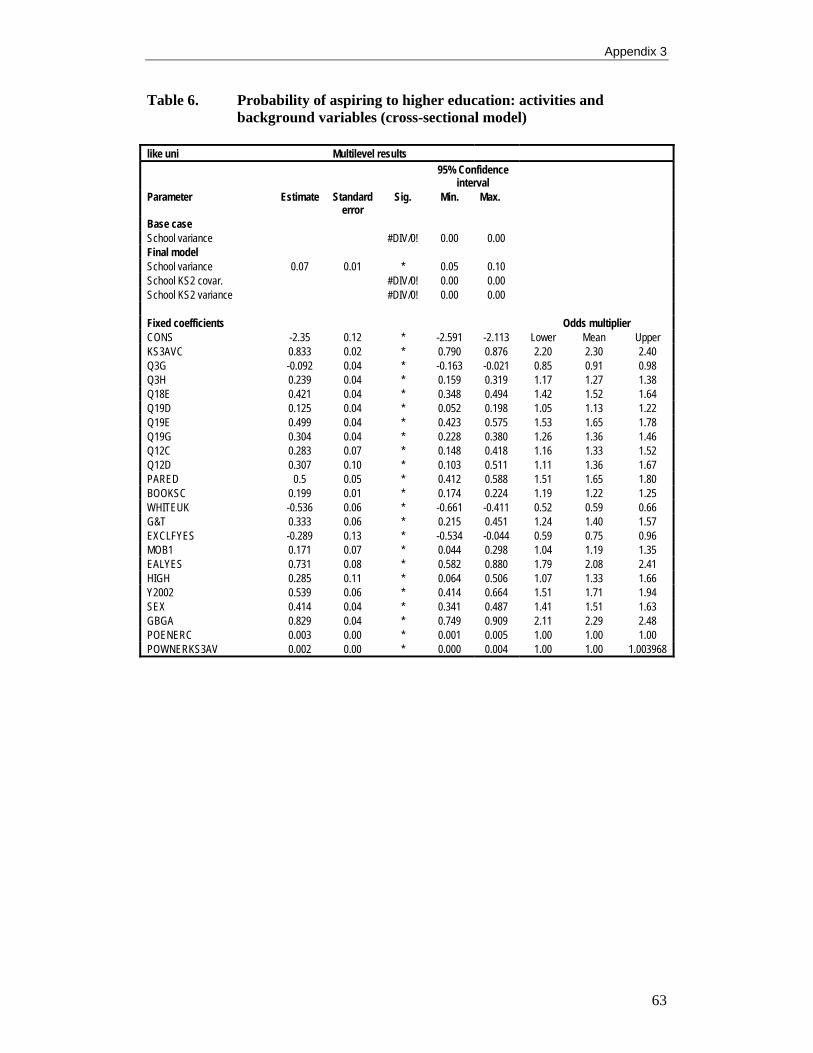
Appendix 3
63
Table 6. Probability of aspiring to higher education: activities and background variables (cross-sectional model)
like uni Multilevel results
95% Confidence interval
Parameter Estimate Standard error
Sig. Min. Max.
Base case School variance #DIV/0! 0.00 0.00 Final model School variance 0.07 0.01 * 0.05 0.10 School KS2 covar. #DIV/0! 0.00 0.00 School KS2 variance #DIV/0! 0.00 0.00
Fixed coefficients Odds multiplier CONS -2.35 0.12 * -2.591 -2.113 Lower Mean Upper KS3AVC 0.833 0.02 * 0.790 0.876 2.20 2.30 2.40 Q3G -0.092 0.04 * -0.163 -0.021 0.85 0.91 0.98 Q3H 0.239 0.04 * 0.159 0.319 1.17 1.27 1.38 Q18E 0.421 0.04 * 0.348 0.494 1.42 1.52 1.64 Q19D 0.125 0.04 * 0.052 0.198 1.05 1.13 1.22 Q19E 0.499 0.04 * 0.423 0.575 1.53 1.65 1.78 Q19G 0.304 0.04 * 0.228 0.380 1.26 1.36 1.46 Q12C 0.283 0.07 * 0.148 0.418 1.16 1.33 1.52 Q12D 0.307 0.10 * 0.103 0.511 1.11 1.36 1.67 PARED 0.5 0.05 * 0.412 0.588 1.51 1.65 1.80 BOOKSC 0.199 0.01 * 0.174 0.224 1.19 1.22 1.25 WHITEUK -0.536 0.06 * -0.661 -0.411 0.52 0.59 0.66 G&T 0.333 0.06 * 0.215 0.451 1.24 1.40 1.57 EXCLFYES -0.289 0.13 * -0.534 -0.044 0.59 0.75 0.96 MOB1 0.171 0.07 * 0.044 0.298 1.04 1.19 1.35 EALYES 0.731 0.08 * 0.582 0.880 1.79 2.08 2.41 HIGH 0.285 0.11 * 0.064 0.506 1.07 1.33 1.66 Y2002 0.539 0.06 * 0.414 0.664 1.51 1.71 1.94 SEX 0.414 0.04 * 0.341 0.487 1.41 1.51 1.63 GBGA 0.829 0.04 * 0.749 0.909 2.11 2.29 2.48 POENERC 0.003 0.00 * 0.001 0.005 1.00 1.00 1.00 POWNERKS3AV 0.002 0.00 * 0.000 0.004 1.00 1.00 1.003968

Evaluation of Aimhigher: Excellence Challenge - Longitudinal Pupil Analysis Report
64
Table 7. Probability of being designated as member of the gifted and talented cohort (cross-sectional coefficients)
Gifted & Talented Multilevel results
95% Confidence interval
Parameter Estimate Standard error
Sig. Min. Max.
Base case School variance 1.65 0.24 * 1.19 2.12 Final model School variance 35.64 5.67 * 24.52 46.75 School KS3 covar. -5.84 0.95 * -7.70 -3.97 School KS3 variance 1.00 0.16 * 0.68 1.32
Fixed coefficients Odds multiplier CONS -12.03 1.22 * -14.418 -9.644 Lower Mean Upper KS3AVC 1.478 0.11 * 1.268 1.688 3.55 4.38 5.41 CARIB 0.391 0.20 * 0.001 0.781 1.00 1.48 2.18 AFRICAN 3.406 1.06 * 1.338 5.474 3.81 30.14 238.36 BLACKOTHER 0.587 0.25 * 0.095 1.079 1.10 1.80 2.94 INDIAN -0.485 0.15 * -0.777 -0.193 0.46 0.62 0.82 FSMYES -0.142 0.07 * -0.283 -0.001 0.75 0.87 1.00 AFRICKS3 -0.56 0.20 * -0.954 -0.166 0.39 0.57 0.85 Y2003 0.395 0.16 * 0.091 0.699 1.10 1.48 2.01

Appendix 3
65
Table 8. Probability of seeing a learning mentor (cross-sectional coefficients)
Seeing a Learning Mentor Multilevel results
95% Confidence interval
Parameter Estimate Standard error
Sig. Min. Max.
Base case School variance 0.31 0.05 * 0.21 0.40 Final model School variance 0.33 0.05 * 0.23 0.43 School KS3 covar. 0.07 0.02 * 0.03 0.10 School KS3 variance 0.03 0.00 * 0.02 0.03
Fixed coefficients Odds multiplier CONS -1.32 0.01 * -1.343 -1.289 Lower Mean Upper KS3AVC -0.045 0.01 * -0.057 -0.033 0.94 0.96 0.97 SEXYES -0.109 0.04 * -0.182 -0.036 0.83 0.90 0.96 FSMYES 0.107 0.05 * 0.019 0.195 1.02 1.11 1.22 SENYES 0.346 0.05 * 0.240 0.452 1.27 1.41 1.57 CARIB 0.519 0.12 * 0.294 0.744 1.34 1.68 2.11 INDIAN -0.26 0.09 * -0.438 -0.082 0.65 0.77 0.92 POSATT -0.028 0.00 * -0.036 -0.020 0.96 0.97 0.98 GOODSCH 0.007 0.00 * 0.001 0.013 1.00 1.01 1.01 ACTIVE 0.012 0.01 * 0.000 0.024 1.00 1.01 1.02 SCHACT 0.025 0.00 * 0.019 0.031 1.02 1.03 1.03

Evaluation of Aimhigher: Excellence Challenge - Longitudinal Pupil Analysis Report
66
Table 9. Coefficients for longitudinal model: capped 8 total GCSE score totsc8 Score Multilevel results
95% Confidence interval
Parameter Estimate Standard error
Sig. Min. Max.
Base case School variance 20.257 5.365 * 9.742 30.772 Pupil variance 140.028 3.345 * 133.472 146.584 Final model #DIV/0! 0.000 0.000 School variance 1.888 0.590 * 0.732 3.044 School KS3 covar. -0.444 0.247 -0.928 0.040 School KS3 variance 0.382 0.193 * 0.004 0.760 Pupil variance 42.787 1.043 * 40.743 44.831 Effect Fixed coefficients #DIV/0! 0.000 0.000 Size CONS 35.633 0.425 * 34.800 36.466 Lower Mean Upper KS3AVC 7.122 0.179 * 6.771 7.473 10.26 10.79 11.32 NEWFF2CH 0.199 0.022 * 0.156 0.242 1.15 1.47 1.79 NEWBOOKS 0.571 0.085 * 0.404 0.738 0.86 1.21 1.57 GIRLSCH 3.453 1.061 * 1.373 5.533 1.37 3.45 5.53 BOTHPAR 0.733 0.251 * 0.241 1.225 0.24 0.73 1.22 MSECOND 0.615 0.236 * 0.152 1.078 0.15 0.62 1.08 EAZ -1.905 0.928 * -3.724 -0.086 -3.72 -1.91 -0.09 VISUNI04 0.796 0.263 * 0.281 1.311 0.28 0.80 1.31 Q22FAM 0.453 0.149 * 0.161 0.745 0.16 0.45 0.75 Q22UNI 0.663 0.177 * 0.316 1.010 0.32 0.66 1.01 FSMYES -1.086 0.307 * -1.688 -0.484 -1.69 -1.09 -0.48 SEXYES 1.352 0.241 * 0.880 1.824 0.88 1.35 1.82 EXCLFYES -4.427 0.808 * -6.011 -2.843 -6.01 -4.43 -2.84 EALYES 2.728 0.496 * 1.756 3.700 1.76 2.73 3.70 SENYES -4.660 0.378 * -5.401 -3.919 -5.40 -4.66 -3.92 MENT04 -0.908 0.261 * -1.420 -0.396 -1.42 -0.91 -0.40 POWNERC 0.013 0.006 * 0.001 0.025 0.05 0.47 0.90 PROUTC -0.065 0.018 * -0.100 -0.030 -1.11 -0.72 -0.33 KS3PAK 1.794 0.515 * 0.785 2.803 0.29 0.67 1.05 KS3CHIN -7.844 2.019 * -11.801 -3.887 -0.95 -0.63 -0.31 KS3G&TBOTH -2.378 0.542 * -3.440 -1.316 -1.48 -1.03 -0.57 G&T04 3.721 0.506 * 2.729 4.713 2.73 3.72 4.71 G&T02 2.233 0.513 * 1.228 3.238 1.23 2.23 3.24 Percentage reduction = 69% of pupil variance

Appendix 3
67
Figure 9. Longitudinal model: Capped 8 GCSEs
-7
-6
-5
-4
-3
-2
-1
0
1
2
3
4
5
6
7K
S3A
VC
NEW
FF2C
H
NEW
BO
OK
S
GIR
LSC
H
BO
THPA
R
MSE
CO
ND
EAZ
VIS
UN
I04
Q22
FAM
Q22
UN
I
FSM
YES
SEX
YES
EXC
LFY
ES
EALY
ES
SEN
YES
MEN
T04
POW
NER
C
PRO
UTC
KS3
PAK
KS3
CH
IN
KS3
G&
TBO
TH
G&
T04
G&
T02
Cha
nge
in B
est 8
scor
e

Evaluation of Aimhigher: Excellence Challenge - Longitudinal Pupil Analysis Report
68
Table 10. Coefficients for longitudinal model: 5+ A*-C grades 5+ A* to C Grades Multilevel results
95% Confidence interval
Parameter Estimate Standard error
Sig. Min. Max.
Base case School variance 0.31 0.09 * 0.14 0.48 Final model School variance 0.17 0.07 * 0.04 0.30
Fixed coefficients Odds multiplier CONS -0.67 0.15 * -0.966 -0.366 Lower Mean Upper KS3AVc 2.265 0.09 * 2.089 2.441 8.07 9.63 11.49 NEWFF2CH 0.056 0.01 * 0.036 0.076 1.04 1.06 1.08 NEWBOOKS 0.099 0.04 * 0.025 0.173 1.02 1.10 1.19 EALYES 0.759 0.21 * 0.347 1.171 1.42 2.14 3.22 EXCLFYES -1.242 0.43 * -2.077 -0.407 0.13 0.29 0.67 GIRLSCH 1.395 0.46 * 0.495 2.295 1.64 4.03 9.92 BOTHPAR 0.367 0.11 * 0.151 0.583 1.16 1.44 1.79 Q22FAM 0.222 0.07 * 0.093 0.351 1.10 1.25 1.42 Q22UNI 0.317 0.08 * 0.166 0.468 1.18 1.37 1.60 G&T04 1.424 0.31 * 0.811 2.037 2.25 4.15 7.67 G&T02 0.961 0.28 * 0.406 1.516 1.50 2.61 4.55 G&TB24 -1.372 0.61 * -2.575 -0.169 0.08 0.25 0.84 MENT04 -0.415 0.12 * -0.648 -0.182 0.52 0.66 0.83 PROUTC -0.03 0.01 * -0.044 -0.016 0.96 0.97 0.98 SEX 0.217 0.11 * 0.009 0.425 1.01 1.24 1.53

Appendix 3
69
Figure 10. Longitudinal model: 5 or more A*-C grades at GCSE
0.00
1.00
2.00
3.00
4.00
5.00
6.00
7.00
8.00
9.00
10.00K
S3A
Vc
NE
WFF
2CH
NE
WB
OO
KS
EA
LYE
S
EX
CLF
YE
S
GIR
LSC
H
BO
THP
AR
Q22
FAM
Talk
ed to
uni
vers
ity s
taff
G&
T04
G&
T02
G&
TB24
ME
NT0
4
PR
OU
TC SE
X
Odd
s M
ultip
lier

Evaluation of Aimhigher: Excellence Challenge - Longitudinal Pupil Analysis Report
70
Table 11. Probability of changing from a positive to a negative aspiration towards higher education (longitudinal model)
YES/NO Model Multilevel results
95% Confidence interval
Parameter Estimate Standard error
Sig. Min. Max.
Base case School variance 0.04 0.17 -0.30 0.37 Final model School variance 0.00 0.00 #DIV/0! 0.00 0.00
Fixed coefficients Odds multiplier CONS -0.15 0.40 -0.929 0.635 Lower Mean Upper KS3AVC -0.56 0.07 * -0.705 -0.415 0.49 0.57 0.66 SEX -0.457 0.14 * -0.735 -0.179 0.48 0.63 0.84 Q5A -0.703 0.18 * -1.060 -0.346 0.35 0.50 0.71 Q5C -0.458 0.15 * -0.748 -0.168 0.47 0.63 0.85 Q15A 1.743 0.30 * 1.163 2.323 3.20 5.71 10.21 Q19A -1.475 0.19 * -1.855 -1.095 0.16 0.23 0.33 PROUT 0.021 0.01 * 0.001 0.041 1.00 1.02 1.04 LONDON -0.541 0.22 * -0.976 -0.106 0.38 0.58 0.90

Appendix 3
71
Table 12. Probability of changing from a negative to positive aspiration towards higher education (longitudinal model)
NO/YES Model Multilevel results
95% Confidence interval
Parameter Estimate Standard error
Sig. Min. Max.
Base case School variance 0.40 0.13 * 0.15 0.64 Final model School variance 0.09 0.06 -0.03 0.21
Fixed coefficients Odds multiplier CONS -3.58 0.32 * -4.202 -2.964 Lower Mean Upper KS3AVC 0.459 0.09 * 0.281 0.637 1.32 1.58 1.89 SEX 0.513 0.14 * 0.231 0.795 1.26 1.67 2.21 BOOKS 0.188 0.05 * 0.088 0.288 1.09 1.21 1.33 Q22FAM 0.507 0.09 * 0.331 0.683 1.39 1.66 1.98 Q22UNI 0.306 0.10 * 0.110 0.502 1.12 1.36 1.65 EAL 1.466 0.25 * 0.980 1.952 2.66 4.33 7.04 FF2CHG42 -0.058 0.01 * -0.085 -0.031 0.92 0.94 0.97 FF4CHG42 0.07 0.02 * 0.027 0.113 1.03 1.07 1.12 Q5A 0.536 0.20 * 0.150 0.922 1.16 1.71 2.51 Q5C 0.41 0.15 * 0.114 0.706 1.12 1.51 2.03 Q9A 0.384 0.17 * 0.051 0.717 1.05 1.47 2.05 Q17B 0.514 0.18 * 0.161 0.867 1.17 1.67 2.38 Q19A 1.285 0.18 * 0.932 1.638 2.54 3.61 5.14 Q19M -1.138 0.18 * -1.491 -0.785 0.23 0.32 0.46 VISUNI04 0.646 0.25 * 0.148 1.144 1.16 1.91 3.14

Evaluation of Aimhigher: Excellence Challenge - Longitudinal Pupil Analysis Report
72
Glossary of terms Factor analysis The aim of factor analysis is to reduce a large set of interdependent variables to a smaller set (usually just one or two, but can be more) of derived variables or ‘factors’, whose relationships to the original variables are such as to reproduce the largest part of their inter-correlations in terms of the new factors. This technique enables ‘factor ‘scores’ to be derived for each individual in a survey, which can be studied in lieu of the original more complex set of variables. Multilevel modelling Multilevel modelling is a development of multiple regression techniques. The latter studies the relationships between variables in terms of the dependency of a single variable (the dependent or outcome variable, which may be a factor score) on a set of other explanatory or background variables. In multilevel modelling, the assumption is made that the data is collected from a hierarchical system, with, for example, some data relating to individual students and some relating to schools. Random variations can occur at any of these levels (see notes on standard error and residuals below), and can be fitted in the model. The model can therefore study the relationships between outcome variables and background variables, taking into account any random variations that might occur at student or school level. Variance A measure of the spread of values between different objects in the same data set. It is based on the squares of the differences between individual values and the overall mean, and is always greater than or equal to 0. A variance of 0 implies that all values are identical. Multi-level models allow us to estimate variances at different levels. For example, the student level variance is a measure of the variability in outcomes between different students, and the school level variance measures the variability between the average outcomes for different schools. These variances are generally reduced by the addition of background variables for the model, which tend to ‘explain’ some of the variability. Outcome variable A numerical measure of some desired educational outcome, computed for each individual being modelled. It is assumed to be single-valued and continuous. Thus student outcomes, such as Key Stage 3 attainment, must be converted to a single-valued score for use in the model. .

Appendix 3
73
Background variable This is a numerical measure of some educational or social factor that is supposed to be influencing the outcome variable, either positively or negatively. A number of background variables may be included in the model, and may relate to students, schools or other levels. Background variables may either be continuous or dichotomous. An example of the latter is an ‘indicator’ variable which has the variable 1 if the individual or unit belongs to a particular group (Aimhigher: Excellence Challenge school) and 0 otherwise (non-Aimhigher: Excellence Challenge school). Most of the background variables used in the models derived for this study were dichotomous indicator variables. Coefficient One of the results of the modelling process is a coefficient estimated to each background variable which measures the strength of its influence on the outcome variable. It should be regarded as the rate at which the outcome variable increases per unit increase in the background variable. Indicator variables have coefficients which measure the average difference between being in the given group versus belonging to the reference (control) group. Therefore a coefficient of 2.643 for sex indicates the average difference between boys and girls for the selected outcome variable. Standard error Each coefficient or variance computed by the modelling process is an estimate of its corresponding ‘true’ value based on the data available, and is therefore liable to be in error. The model also computes a standard error for each estimated parameter which measures the amount by which it might be in error. As a rule of thumb, coefficients less than twice their standard error in absolute value are not regarded as significantly different from zero. Residual The residual or error term in the model for an object at any level (for example, student or school) is the amount of the outcome variable which is not predicted by the overall mean or the background variables. In other words, it is what is ‘left over’ after the model has been fitted. Residuals sum to zero for objects at a given level, and tend to become smaller as more background variables are fitted.

Evaluation of Aimhigher: Excellence Challenge - Longitudinal Pupil Analysis Report
74

Appendix 4
75
Appendix 4
List of all Aimhigher: Excellence Challenge reports (does not yet include all of those on the NFER website): Books Cleaver, E., Holland, M., Merrilees, S. and Morris, M. (2003). Evaluation of Aimhigher: the Partnerships’ View (DfES Research Report 477) [online]. Available: http://www.dfes.gov.uk/research/data/uploadfiles/RR477.pdf [2 February, 2006].
Emmerson, C., Frayne, C., McNally, S. and Olmo, S. (2005). The Early Impact of Aimhigher: Excellence Challenge on Pre-16 Outcomes – an Economic Evaluation (DfES Research Report 652) [online]. Available: http://www.dfes.gov.uk/research/data/uploadfiles/RR652.pdf [2 February, 2006].
Emmerson, C., Frayne, C., McNally, S. and Silva, O. (2005). Evaluation of Aimhigher: Excellence Challenge – Economic Evaluation of Opportunity Bursaries (DfES Research Report 647) [online]. Available: http://www.dfes.gov.uk/research/data/uploadfiles/RR647.pdf [2 February, 2006]. Ireland, E. and O’Donnell, L. (2004). Post-16 and Post-18 Transitions: Initial Findings (Excellence in Cities Report 5/2004) [online]. Available: http://www.nfer.ac.uk/publications/other-publications/downloadable-reports/post-16-and-post-18-transitions-initial-findings.cfm [2 February, 2006]. Judkins, M., Golden, S., Ireland, E. and Morris, M. (2005). Evaluation of Aimhigher: Excellence Challenge. Implementing Aimhigher: Excellence Challenge. The Experiences of Ten Partnerships (DfES Research Report 646) [online]. Available: http://www.dfes.gov.uk/research/data/uploadfiles/RR646.pdf [2 February, 2006].
Morris, M. (2001). Evaluation of Excellence Challenge [online]. Available: http://www.nfer.ac.uk/research-areas/pims-data/outlines/evaluation-of-excellence-challenge.cfm [2 February, 2006]. Morris, M. (2002). Excellence Challenge: Executive Summary of the Baseline Evaluation Report [online]. Available: http://www.nfer.ac.uk/publications/other-publications/downloadable-reports/excellence-challenge-executive-summary-of-the-baseline-evaluation-report.cfm [2 February, 2006].

Evaluation of Aimhigher: Excellence Challenge - Longitudinal Pupil Analysis Report
76
Morris, M. and Rutt, S. (2003). Aspirations to Higher Education: a Baseline Analysis (Excellence in Cities Report 11/2003) [online]. Available: http://www.nfer.ac.uk/publications/other-publications/downloadable-reports/aspirations-to-higher-education-a-baseline-analysis.cfm [2 February, 2006]. Morris, M. and Golden, S. (2005). Evaluation of Aimhigher: Excellence Challenge – Interim Report 2005 (DfES Research Report 648) [online]. Available: http://www.dfes.gov.uk/research/data/uploadfiles/RR648.pdf [2 February, 2006]. Morris, M., Golden, S., Ireland, E. and Judkins, M. (2005). Evaluation of Aimhigher: Excellence Challenge. The Views of Partnership Coordinators 2004 (DfES Research Report 650) [online]. Available: http://www.dfes.gov.uk/research/data/uploadfiles/RR650.pdf [2 February, 2006].
Morris, M. and Rutt, S. (2003). Aspirations to Higher Education: a Baseline Analysis (Excellence in Cities Report 11/2003) [online]. Available: http://www.nfer.ac.uk/publications/other-publications/downloadable-reports/aspirations-to-higher-education-a-baseline-analysis.cfm [2 February, 2006]. Morris, M. and Rutt, S. (2005). Evaluation of Aimhigher: Excellence Challenge. Aspirations to Higher Education: One Year On (DfES Research Report 651) [online]. Available: http://www.dfes.gov.uk/research/data/uploadfiles/RR651.pdf [2 February, 2006].
Morris, M., Rutt, S. and Yeshanew, T. (2004). Pupil Outcomes: the Impact of Aimhigher. Baseline Anaysis [online]. Available: http://www.nfer.ac.uk/publications/other-publications/downloadable-reports/pupil-outcomes-the-impact-of-aimhigher-baseline-analysis.cfm [2 February, 2006].
Morris, M., Rutt, S. and Yeshanew, T. (2005). Evaluation of Aimhigher: Excellence Challenge. Pupil Outcomes One Year On (DfES Research Report 649) [online]. Available: http://www.dfes.gov.uk/research/data/uploadfiles/RR649.pdf [2 February, 2006].
O’Donnell, L. and Ireland, E. (2002). Analysing Post-16 Outcomes (Excellence in Cities Report 10/2002) [online]. Available: http://www.nfer.ac.uk/publications/other-publications/downloadable-reports/analysing-post-16-outcomes-december-2002.cfm [2 February, 2006]. O’Donnell, L. and Ireland, E. (2004). Analysing Post-16 Outcomes (Excellence in Cities Report 4/2004) [online]. Available: http://www.nfer.ac.uk/publications/other-publications/downloadable-reports/analysing-post-16-outcomes-may-2004.cfm [2 February, 2006].

Appendix 4
77
Pennell, H., West, A. and Hind, A. (2004). The National Evaluation of Aimhigher: Survey of Higher Education Providers 2003 (DfES Research Report 537) [online]. Available: http://www.dfes.gov.uk/research/data/uploadfiles/ACF6D3E.pdf [2 February, 2006]. Pennell, H., West, A. and Hind, A. (2005). Evaluation of Aimhigher: Excellence Challenge – Survey of Higher Education Providers (DfES Research Report 644) [online]. Available: http://www.dfes.gov.uk/research/data/uploadfiles/RR644.pdf [2 February, 2006].
West, A., Hind, A. and Pennell, H. (2005). Evaluation of Aimhigher: Excellence Challenge – First Survey of Opportunity Bursary Applicants 2002/03: Preliminary Findings (DfES Research Report 654) [online]. Available: http://www.dfes.gov.uk/research/data/uploadfiles/RR654.pdf [2 February, 2006].
West, A., Hind, A. and Xavier, R. with Jupp, J. (2003). Evaluation of Aimhigher. Survey of Opportunity Bursary Applicants 2001/02: Preliminary Findings (DfES Research Report 497) [online]. Available: http://www.dfes.gov.uk/research/data/uploadfiles/RR497.pdf [2 February, 2006]. West, A., Xavier, R. and Hind, A. (2003). Evaluation of Excellence Challenge: Survey of Higher Education Providers 2002 (DfES Research Report 449). London: DfES. Digest and research summaries Judkins, M., Golden, S., Ireland, E. and Morris, M. (2005). Evaluation of Aimhigher: Excellence Challenge. Implementing Aimhigher: Excellence Challenge. The Experiences of Ten Partnerships (DfES Research Brief 646). London: DfES.
Morris, M. and Golden, S. (2005). Evaluation of Aimhigher: Excellence Challenge. Interim Report (DfES Research Brief 648). London: DfES.
Morris, M., Golden, S., Ireland, E. and Judkins, M. (2005). Evaluation of Aimhigher: Excellence Challenge. The Views of Partnership Coordinators 2004 (DfES Research Brief 650). London: DfES.
Morris, M. and Rutt, S. (2005). Evaluation of Aimhigher: Excellence Challenge. Aspirations to Higher Education: One Year On (DfES Research Brief 651). London: DfES.
Morris, M., Rutt, S. and Yeshanew, T. (2005). Evaluation of Aimhigher: Excellence Challenge. Pupil Outcomes One Year On (DfES Research Brief 649). London: DfES.

Evaluation of Aimhigher: Excellence Challenge - Longitudinal Pupil Analysis Report
78

Appendix 5
79
Appendix 5
About the evaluation The DfES commissioned a consortium comprising the National Foundation for Educational Research, the London School of Economics and the Institute for Fiscal Studies to undertake the evaluation of Aimhigher: Excellence Challenge. The overall aim of the evaluation is to explore the effectiveness of the Aimhigher: Excellence Challenge programme in terms of the extent to which it appears to contribute to widening participation in higher education. The evaluation was multifaceted, with a combination of quantitative and qualitative methods being used to evaluate the programme. The quantitative methods are being used to explore associations between activities and outcomes. The qualitative methods (including annual interviews and in-depth case-studies) seek to examine the processes involved and to identify practice that is perceived to be effective in terms of the overall programme aims. Methods included: • Large-scale longitudinal surveys of young people and tutors in schools and
further education sector institutions, in order to provide information about such factors as the activities undertaken as part of the Aimhigher: Excellence Challenge programme and young people’s attitudes towards pre-and post-16 education. The information obtained from these surveys (combined with administrative data sources) has been used to look at the impact of Aimhigher: Excellence Challenge on attainment and progression.
• Surveys of higher education providers to establish information about activities aimed at widening participation, and policies and practices in relation to access to higher education and perceived effectiveness;
• Surveys of young people eligible for Opportunity Bursaries to ascertain their characteristics, financial circumstances and experiences;
• Annual interviews with 42 Aimhigher: Excellence Challenge partnership coordinators;
• Area-based studies of selected partnerships and higher education institutions to explore policy and practice at a local level and the perceived effectiveness of the various strands of the programme.
Further information about the methods deployed in each of these elements can be found in the individual reports listed in Appendix 4. The data used in the current report was obtained from school management teams, class teachers and pupils. All Aimhigher: Excellence Challenge

Evaluation of Aimhigher: Excellence Challenge - Longitudinal Pupil Analysis Report
80
treatment schools and those identified as comparison schools were invited, during the autumn term of each academic year from 2001/02 to 2003/04, to take part in the study. Management teams and teachers in recruited schools then completed questionnaires (in the spring terms of those years) as did pupils from an entire year cohort in the school. At the outset of the study, schools were allocated to one of four different cohorts – from Year 8 to Year 11 – and these named pupils were followed up in each of the three years. Schools also completed pupil data forms for the young people in the study, indicating policy-related information, such as designation to the widening participation cohort, that would not be available from the NPD. Following completion of the questionnaires, schools were provided with annual feedback reports, summarising the responses of their pupils by comparison with other pupils in the same year group in the study.

Copies of this publication can be obtained from:
DfES PublicationsP.O. Box 5050Sherwood ParkAnnesleyNottinghamNG15 0DJ
Tel: 0845 60 222 60Fax: 0845 60 333 60Minicom: 0845 60 555 60Online: www.dfespublications.gov.uk
© NFER Trading Ltd 2006
Produced by the Department for Education and Skills
ISBN 978 1 84478 846 0Ref No: RR814www.dfes.go.uk/research