
EVALUATION OF A NEAR REAL TIME METALS MONITOR FOR … · 2012. 4. 9. · Performance Evaluation 1....
27
EVALUATION OF A NEAR REAL TIME EVALUATION OF A NEAR REAL TIME METALS MONITOR FOR MEASURING METALS MONITOR FOR MEASURING METALS MONITOR FOR MEASURING METALS MONITOR FOR MEASURING FUGITIVE METAL EMISSIONS FUGITIVE METAL EMISSIONS Krag Krag Petterson Petterson, John Cooper , John Cooper Cooper Environmental Services Cooper Environmental Services D Bi i Bi i Dan Dan Bivins Bivins USEPA Research Triangle Park USEPA Research Triangle Park Jay Turner Jay Turner Washington University Washington University Will Will Wetherell Wetherell Missouri Department of Natural Missouri Department of Natural Missouri Department of Natural Missouri Department of Natural Resources Resources Cooper Environmental Services 1 A&WMA Annual Conference and Exhibition Calgary, Alberta June 25 th 2010
Transcript of EVALUATION OF A NEAR REAL TIME METALS MONITOR FOR … · 2012. 4. 9. · Performance Evaluation 1....

EVALUATION OF A NEAR REAL TIME EVALUATION OF A NEAR REAL TIME METALS MONITOR FOR MEASURING METALS MONITOR FOR MEASURING METALS MONITOR FOR MEASURING METALS MONITOR FOR MEASURING
FUGITIVE METAL EMISSIONSFUGITIVE METAL EMISSIONS
KragKrag PettersonPetterson, John Cooper, John CooperCooper Environmental ServicesCooper Environmental Services
DD Bi iBi iDan Dan BivinsBivinsUSEPA Research Triangle ParkUSEPA Research Triangle Park
Jay TurnerJay TurneryyWashington UniversityWashington University
Will Will WetherellWetherellMissouri Department of NaturalMissouri Department of NaturalMissouri Department of Natural Missouri Department of Natural ResourcesResources
Cooper Environmental Services 1
A&WMA Annual Conference and ExhibitionCalgary, AlbertaJune 25th 2010

Why Measure Metals?Why Measure Metals?Significant adverse human health effects D l i f & hild i ll iblDeveloping fetus & children especially susceptibleMetals represent 8 of US EPA’s top 33 pollutants of highest concernhighest concernArsenic is one of US EPA’s top three priority pollutants of concernsGlobal concern for metals – As, Cd, Cr, Pb and Hg -RoHS, WEEE and ELV
•US EPA. Framework for Inorganic Metals Risk Assessment. EPA 120/R-07/001. March 2007.•US EPA. Health Effects Notebook for Hazardous Air Pollutants. EPA Technology Transfer Network Air Toxics Website. Accessed November 2007. •Agency for Toxic Substances and Disease Registry. Toxic Substances Portal. Accessed November 2007.
Cooper Environmental Services 2
g y g y

Why Measure Metals (cont.)?Why Measure Metals (cont.)?Metals Represent Significant Health ConcernsMetals Represent Significant Health Concerns
fNo apparent threshold for blood PbPersistent – will not biodegradeSource Apportionment
Cooper Environmental Services 3

Why Continuous Real Time Metals Why Continuous Real Time Metals M it ?M it ?Monitors?Monitors?
Improved exposure estimates – time resolution of concentration dataImproved source apportionment – Correlation with wind speed and wind direction
Pl t f db k t li i t blPlant feedback to eliminate problemIdentification of hot spots
Cooper Environmental Services 4

Xact 620 Ambient Metals MonitorXact 620 Ambient Metals Monitor
PM size-selective inlet
Heater
Sampling & Analysis Module
Operator interface/control panelOperator interface/control panel
Flow control module
Cooper Environmental Services 5

X t 620 O ti i d f Xact 620 Optimized for Remote Measurement of
As Se Hg & Pb As, Se, Hg & Pb
Cooper Environmental Services 6 6

XACT SAMPLING AND ANALYSISXACT SAMPLING AND ANALYSIS
XX--Ray TubeRay TubeAerosol DepositAerosol DepositSample FlowSample Flow
Analysis AreaAnalysis AreaAnalysis AreaAnalysis Area
Filter TapeFilter Tape Filter TapeFilter Tape
Previous sample is analyzed while t l i ll t dcurrent sample is collected
Cooper Environmental Services 7

Performance EvaluationPerformance Evaluation
1. Minimum Detection Limit Determination2. Precision – Comparison of Two Xacts Side by Side3. Comparison with Federal Reference Method (FRM)
Sampling followed by XRF Analysis (IO 3.3)a
a. EPA Compendium of Methods for the Determination of Inorganic Compounds in Ambient Air. June,1999. Compendium Method IO-3.3 Determination of Metals in Ambient Particulate Matter Using X-Ray Fluorescence (XRF) Spectroscopy.
Cooper Environmental Services 8

Minimum Detection Limit Minimum Detection Limit DeterminationDetermination
Laboratory EvaluationCalculated from Spectrum of Blank Sample (95 %Calculated from Spectrum of Blank Sample (95 % Confidence Interference Free)
– Standard method used to calculate MDL for XRF d l l i li i i i O 3 3– Used to calculate Detection limits given in IO 3.3
Empirically Determined - 66 Blank SamplesReplaced PM inlet ith Hi ol filter to remo e PM– Replaced PM inlet with Hi-vol filter to remove PM
– Operated the unit in 1 hour mode– 95% confidence MDL – means 95% of samples fell below stated
i l lconcentration level
Cooper Environmental Services 9

XactXact 620 Minimum Detection Limits620 Minimum Detection Limits
General Agreement between calculated and empirical detection limitsdetection limits
– Fe and Ca are exceptions
Xact 1 hour detection limits areXact 1 hour detection limits are generally lower than 24-hour FRM/IO 3.3 Detection Limits
All these MDL’s are Interference Free
Cooper Environmental Services 10
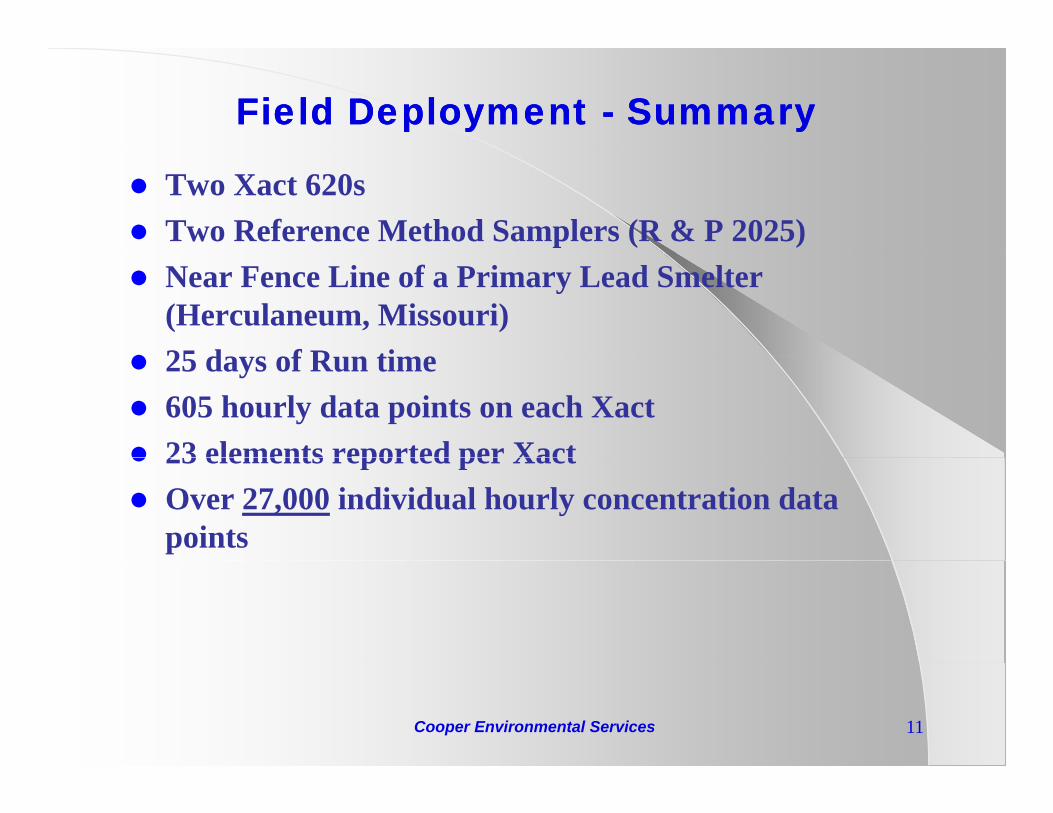
Field Deployment Field Deployment -- SummarySummary
Two Xact 620sTwo Reference Method Samplers (R & P 2025)Near Fence Line of a Primary Lead Smelter (Herculaneum, Missouri)25 d f R ti25 days of Run time605 hourly data points on each Xact23 elements reported per Xact23 elements reported per XactOver 27,000 individual hourly concentration data points
Cooper Environmental Services 11

Field Deployment Field Deployment -- LocationLocation
LeadLead Smelter
Sampling Location
Cooper Environmental Services 12

Field Deployment Field Deployment -- SamplersSamplers
Reference Method Inlets
CES X t I l tCES Xact Inlet
M DNR X tMoDNR Xact Inlet
Cooper Environmental Services 13

XactXact PrecisionPrecision
Percent Difference Used as an Indicator– Non-detects and concentrations less than the limit of Quantitation
( i t l th ti th i i d t ti li it) d(approximately three times the minimum detection limit) removed from calculation
Least squares linear regression also used as an indicator of PrecisionPrecision also calculated for FRM IO 3.3
Cooper Environmental Services 14

Precision Precision –– Percent DifferencePercent Difference
Precision of hourly Xact measurement similar to that of 24Precision of hourly Xact measurement similar to that of 24 hour FRM sampling with XRF analysisPrecision of Xact daily average is generally better than that for FRM li i h XRF l iFRM sampling with XRF analysisXact Precision results include two samplers and two analyzersFRM Precision results include two samplers and one analyzer
Cooper Environmental Services 15
FRM Precision results include two samplers and one analyzer
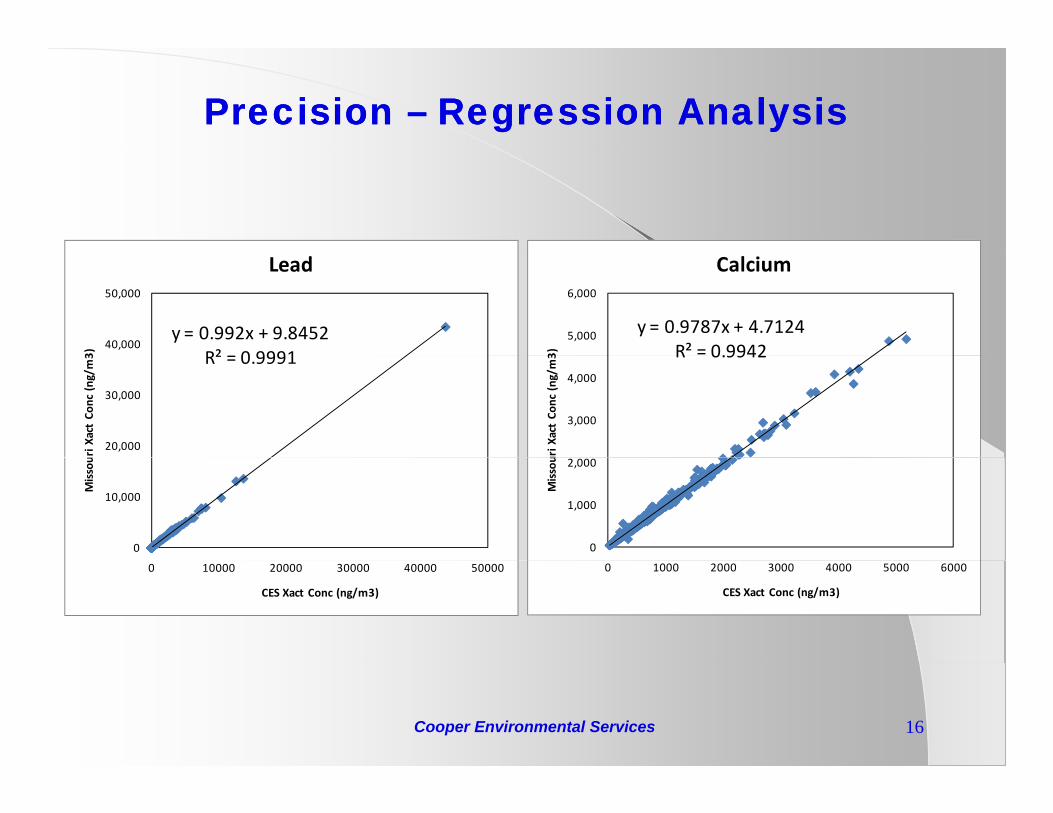
Precision Precision –– Regression AnalysisRegression Analysis
y = 0.992x + 9.8452R² 0 9991
40,000
50,000
3)
Lead
y = 0.9787x + 4.7124R² = 0.9942
5,000
6,000
3)
Calcium
R² = 0.9991
20,000
30,000
uri X
act Co
nc (ng/m
3 R 0.9942
3,000
4,000
uri X
act Co
nc (ng/m
30
10,000
Missou
0
1,000
2,000
Missou
0 10000 20000 30000 40000 50000
CES Xact Conc (ng/m3)
0 1000 2000 3000 4000 5000 6000
CES Xact Conc (ng/m3)
Cooper Environmental Services 16

Comparison With FRM/IO 3.3Comparison With FRM/IO 3.3
FRM /IO 3.3 – 24 hour sample on Teflon Filter followed by XRF AnalysisXRF Analysis Performed by CESQA of XRF Analysis Performed by USEPA ORDX t 24 h l l t d b i 24 1 hXact 24 hour average calculated by averaging 24, 1 hour samplesDaily average Xact (average of two units) plotted against y g ( g ) p gdaily average FRM/IO 3.3 (average of two samplers when both where available)All d t i l d dAll data included
Cooper Environmental Services 17

XRF Analysis “Round Robin” XRF Analysis “Round Robin” Comparison (CES and EPA)Comparison (CES and EPA)p ( )p ( )
Element N Average Percent DifferenceDifference
Calcium (Ca) 23 - 0.41Iron (Fe) 23 0.92
( )Copper (Cu) 8 8.66Zinc (Zn) 23 - 1.48Lead (Pb) 23 -0.42
Excellent Agreement Between CES’ and EPA’s XRF Analysis
Cooper Environmental Services 18

XactXact 620 and FRM/IO 3.3 Comparison620 and FRM/IO 3.3 Comparison
Calcium Iron
y = 1.1085x + 9.5378R² = 0.99441500
2000
m3 )
y = 1.1904x - 0.8478R² = 0.9928
300
350
400
450
m3 )
500
1000
ct C
alci
um (n
g/m
100
150
200
250
Xac
t Iro
n (n
g/m
0
0 500 1000 1500 2000
Xac
FRM Calcium (ng/m3)
0
50
100
0 50 100 150 200 250 300 350 400
FRM Iron (ng/m3)FRM Calcium (ng/m ) FRM Iron (ng/m )
Cooper Environmental Services 19

XactXact 620 and FRM/IO 3.3 Comparison620 and FRM/IO 3.3 Comparison
Copper Zinc
y = 1.2193x + 0.5128R² = 0.991230
35
40
y = 1.0626x + 5.0407R² = 0 9989
800
1000
R 0.9912
15
20
25
30
oppe
r (ng
/m3 )
R² = 0.9989
400
600
Zinc
(ng/
m3 )
0
5
10
0 5 10 15 20 25 30 35 40
Xac
t Co
0
200
0 200 400 600 800 1000X
act
0 5 10 15 20 25 30 35 40
FRM Copper (ng/m3)
0 200 400 600 800 1000
FRM Zinc (ng/m3)
Cooper Environmental Services 20

XactXact 620 and FRM/IO 3.3 Comparison620 and FRM/IO 3.3 Comparison
Lead
y = 1.0651x + 15.451R² = 0.9976
2000
2500
3000
m3 )
1000
1500
Xac
t Lea
d (n
g/m
0
500
0 500 1000 1500 2000 2500 3000
X
FRM Lead (ng/m3)FRM Lead (ng/m3)
Cooper Environmental Services 21

Post Field Test Work Post Field Test Work –– Deposition Size Deposition Size MeasurementsMeasurements
Xact Tape DepositsXact Tape Deposits
Deposit Area Used = 0.747 cm2
Corrected Deposit Area = 0.707 cm2 (6%)Determined with actual Herculaneum deposits
Cooper Environmental Services 22

ConclusionsConclusions
1 hour Minimum Detection Limits Are as good or better than those achieved using 24 hour FRM S li d L b t XRF A l iSampling and Laboratory XRF AnalysisPrecision – Xact 620 Exhibits Excellent Precision – 1 hour precision is as good as 24 hour sampling and analysis1 hour precision is as good as 24 hour sampling and analysis– Precision of 24 hour average is better than FRM/XRF
Comparability – Agrees well with FRM/XRF analysis i l l f h l iparticularly for those metals present at concentrations
well above MDL
Cooper Environmental Services 23

WHAT YOU MISS WITH 24 HOUR WHAT YOU MISS WITH 24 HOUR AVERAGESAVERAGES
50000
Hourly Lead Concentrations 8/27/2010
Is this degree of variability included in exposure
35000
40000
45000
)
1 hour = 11% of total monthly exposure to Pb
Is this degree of variability included in exposure risk assessments?
20000
25000
30000
Pb Con
c (ng/m
3
0
5000
10000
15000
Pb Daily Ave = 2700 ng/m3
0
Hour
Cooper Environmental Services 24

Further WorkFurther Work
Further Data Analysis – Jay TurnerAnalysis of Filter samples by ICP-MS
Cooper Environmental Services 25

AcknowledgementsAcknowledgements
• Jim Brunnert, Celeste Koon – Missouri Department of Natural Resources
• Terri Conner, Bob Willis – USEPA Office of Research and Development
• US EPA Office of Air Quality Planning and Standards• US EPA Office of Air Quality Planning and Standards• MACTEC Federal Programs
Cooper Environmental Services 26

QUESTIONSQUESTIONS??
For further information:www.cooperenvironmental.comorKrag [email protected]
Cooper Environmental Services 27
503 670 8335


