Evaluation of a Box Crab (Lopholithodes foraminatus) Trap Test...
41
Fisheries and Oceans Science Pêches et Océans Sciences C S A S Canadian Science Advisory Secretariat S C C S Secrétariat canadien de consultation scientifique Research Document 2001/158 Document de recherche 2001/158 Not to be cited without permission of the authors * Ne pas citer sans autorisation des auteurs * Evaluation of a Box Crab (Lopholithodes foraminatus) Trap Test in British Columbia Zane Zhang Fisheries and Oceans Canada Shellfish Stock Assessment Section Pacific Biological Station 3190 Hammond Bay Road Nanaimo, B.C. V9T 6N7 * This series documents the scientific basis for the evaluation of fisheries resources in Canada. As such, it addresses the issues of the day in the time frames required and the documents it contains are not intended as definitive statements on the subjects addressed but rather as progress reports on ongoing investigations. * La présente série documente les bases scientifiques des évaluations des ressources halieutiques du Canada. Elle traite des problèmes courants selon les échéanciers dictés. Les documents qu’elle contient ne doivent pas être considérés comme des énoncés définitifs sur les sujets traités, mais plutôt comme des rapports d’étape sur les études en cours. Research documents are produced in the official language in which they are provided to the Secretariat. This document is available on the Internet at: Les documents de recherche sont publiés dans la langue officielle utilisée dans le manuscrit envoyé au Secrétariat. Ce document est disponible sur l’Internet à: http://www.dfo-mpo.gc.ca/csas/ ISSN 1480-4883 Ottawa, 2001
Transcript of Evaluation of a Box Crab (Lopholithodes foraminatus) Trap Test...

Fisheries and OceansScience
Pêches et OcéansSciences
C S A SCanadian Science Advisory Secretariat
S C C SSecrétariat canadien de consultation scientifique
Research Document 2001/158 Document de recherche 2001/158
Not to be cited withoutpermission of the authors *
Ne pas citer sansautorisation des auteurs *
Evaluation of a Box Crab (Lopholithodes foraminatus) Trap Test in BritishColumbia
Zane Zhang
Fisheries and Oceans CanadaShellfish Stock Assessment Section
Pacific Biological Station3190 Hammond Bay RoadNanaimo, B.C. V9T 6N7
* This series documents the scientific basis forthe evaluation of fisheries resources in Canada.As such, it addresses the issues of the day inthe time frames required and the documents itcontains are not intended as definitivestatements on the subjects addressed butrather as progress reports on ongoinginvestigations.
* La présente série documente les bases scientifiquesdes évaluations des ressources halieutiques du Canada.Elle traite des problèmes courants selon les échéanciersdictés. Les documents qu’elle contient ne doivent pasêtre considérés comme des énoncés définitifs sur lessujets traités, mais plutôt comme des rapports d’étape surles études en cours.
Research documents are produced in theofficial language in which they are provided tothe Secretariat.
This document is available on the Internet at:
Les documents de recherche sont publiés dans la langueofficielle utilisée dans le manuscrit envoyé au Secrétariat.
Ce document est disponible sur l’Internet à:
http://www.dfo-mpo.gc.ca/csas/
ISSN 1480-4883Ottawa, 2001


2
Abstract
A survey was carried out to test the effectiveness of five trap designs (largecircular trap, modified Dungeness trap, prawn trap, Dorian top-loading trap, and Ladnertop-loading trap) in catching box crabs in the northern Strait of Georgia in April 2001.Altogether 102 sets were made and 1724 box crabs were caught with 1096 males and 628females. The modified Dungeness trap appears to be most suitable for future surveysbased on an overall evaluation on the box crab catch rate, convenience of trapdeployment, and the amount of by-catch. The paper also presents some new biologicalfeatures on box crabs revealed by this survey, such as size and sex composition anddistribution, relationship between carapace length and weight, relative abundance, shellconditions, relative number of egg-bearing females for different size groups. The paperalso proposes recommendations as how we should proceed in the development of thispotential fishery.

3
Résumé
Une étude de l’efficacité de cinq différents casiers (gros casier circulaire, casierDungeness modifié, casier à crevettes, casier Dorian à chargement vertical, casier Ladnerà chargement vertical) pour ce qui est de capturer le crabe à pattes trouées a été menée enavril 2001 dans le nord du détroit de Georgia. Les 102 mouillages effectués ont permis derécolter 1 724 crabes, dont 1 096 mâles et 628 femelles. Le casier Dungeness modifiésemble le plus approprié pour mener d’autres études d’après une évaluation globale dutaux de capture de crabe à pattes trouées, de la facilité de mouillage des casiers et desquantités de prises accessoires. Sont aussi présentées de nouvelles données biologiquessur l’espèce recueillies dans le cadre de l’étude, dont la distribution et la répartition partaille et par sexe, la relation entre la longueur de la carapace et le poids, l’abondancerelative, la condition des carapaces et le nombre relatif de femelles oeuvées pourdifférents groupes de taille. Des recommandations sont proposées au sujet de la démarcheà adopter pour développer cette pêche potentielle.

4
1. Introduction
Interest in developing a box crab trap fishery has persisted for the past few years.Under the guidelines for developing new fisheries (Perry et. al. 1999), a phase-0 reviewon the biology and fisheries of box crabs in British Columbia (B.C.) was presented to thePacific Scientific Advice Review Committee (PSARC) in 1999 (Zhang et. al. 1999). Boxcrabs have never been commercially harvested, but have been caught as by-products incommercial ground fish and shrimp trawl fisheries, and prawn trap fishery in B.C. Boxcrab by-catch from shrimp trawl surveys was low. Two experimental fisheries wereconducted on box crabs in the early 1990s. Box crab catch in these two experimentalfisheries was also low, suggesting that the stock size might be small in B.C.
There has been a commercial fishery on box crabs in Oregon. Box crab fishermenin Oregon reported that box crabs like to live around the edges of rocky bottoms or onmuddy bottoms near rocks in big patches. A preliminary study on some reproductivefeatures of box crabs showed that females functionally mature at 78-83 mm in carapacelength, and males start to mate possibly around 80 mm in carapace length and activelymate possibly around 106 mm in carapace length.
Due to the possible low abundance of box crab resource and little knowledge ontheir biology, PSARC recommended that considerable caution is required for thepotential development of a box crab trap fishery. It was recommended to carry outsurveys to determine the abundance of box crab population and obtain biologicalinformation that will help determine the feasibility of developing a box crab trap fishery.
A survey was proposed by the DFO in 2000, and a request for proposals (RFP)was sent to potentially interested individuals, organisations, first nations, and companies,inviting them to compete for participating in this box crab trap survey. Sointula Box Craband Whelk Association was awarded to undertake the survey project, which was to befulfilled in two stages. At stage 1, a survey was carried out to evaluate the effectiveness ofseveral trap designs in catching box crabs and side-effects in by-catch of other species,and to provide some preliminary information on box crab biology, such as size and sexcomposition, distribution, and reproductive status. At stage 2, the preferred trap typesdefined after stage 1 are to be used to conduct a systematic survey to estimate the relativeabundance of box crabs, and gain more detailed information on their productive andreproductive biology.
The first stage survey was carried out in the northern Straight of Georgia in a 10-day period in April 2001. This paper presents the findings from this survey and providesrecommendations on how we might proceed with the development of this potentialfishery.

5
2. Material and Methods
The main objective of the survey was to test five different trap types on theeffectiveness of catching box crabs, the side effects of by-catching other species, andidentifying an "ideal" trap type to be used in future surveys of box crab populations. Thecriteria for selecting an ideal trap type are: (1) a high catch rate for a wide range of sizesof box crabs; (2) a low by-catch rate for other species; and (3) ease of trap handling. Atrap type, which is ideal for surveys, is not necessarily ideal for a fishery. The survey wasalso to provide some preliminary biological information on box crab, such as size and sexcomposition, distribution, and reproductive features.
2.1. Trap Design
The following five types of traps were tested in this survey:
Type 1: Circular trap with a diameter of 198 cm and a height of 30 cm. It has fourgates with a width of 23 cm and a height of 10 cm. It is covered with 70× 90 cm whitemesh. Ten such traps, brought over by an Oregon fisherman, were used in the currentsurvey.
Type 2: Modified Dungeness crab pot with a diameter of 107 cm and a height of33 cm. It has, at the opposite sides of the pot, two enlarged gates with a width of 18 cmand a height of 13 cm. It is covered with 70× 90 cm white mesh. Twenty such pots wereused.
Type 3: Prawn pot with a diameter of 94 cm and a height of 32 cm. It has, at theopposite sides of the pot, two enlarged gates with a width of 18 cm and a height of 13 cm.It is covered with 70× 90 cm black mesh. Twenty such traps were used.
Type 4: Dorian top-loading trap with a diameter of 107 cm and a height of 51 cm.A plastic entrance tunnel with a diameter of 20 cm and a depth of 15 cm was fitted ontothe top entrance. It is covered with 2.5 cm red mesh. Twenty-five such traps were used.
Type 5: Ladner top-loading trap with a diameter of 107 cm and a height of 33 cm.The top entrance does not have a plastic entrance tunnel. It is covered with 2.5 cm blackmesh. Twenty-five such traps were used.
2.2. Survey Locations
The survey was carried out from a 68-foot seine vessel, Teri Christina, betweenApril 18 - 28, 2001 in the northern Strait of Georgia. Specific locations were chosen in anattempt to locate big aggregations of box crabs, so that the effectiveness of these traptypes could be tested. An experienced Oregon box crab fisherman, Gene Law, was onboard the survey vessel for the first few days of the survey and provided a considerableamount of advice on what he regarded as a good sounder signal for box crab habitat.

6
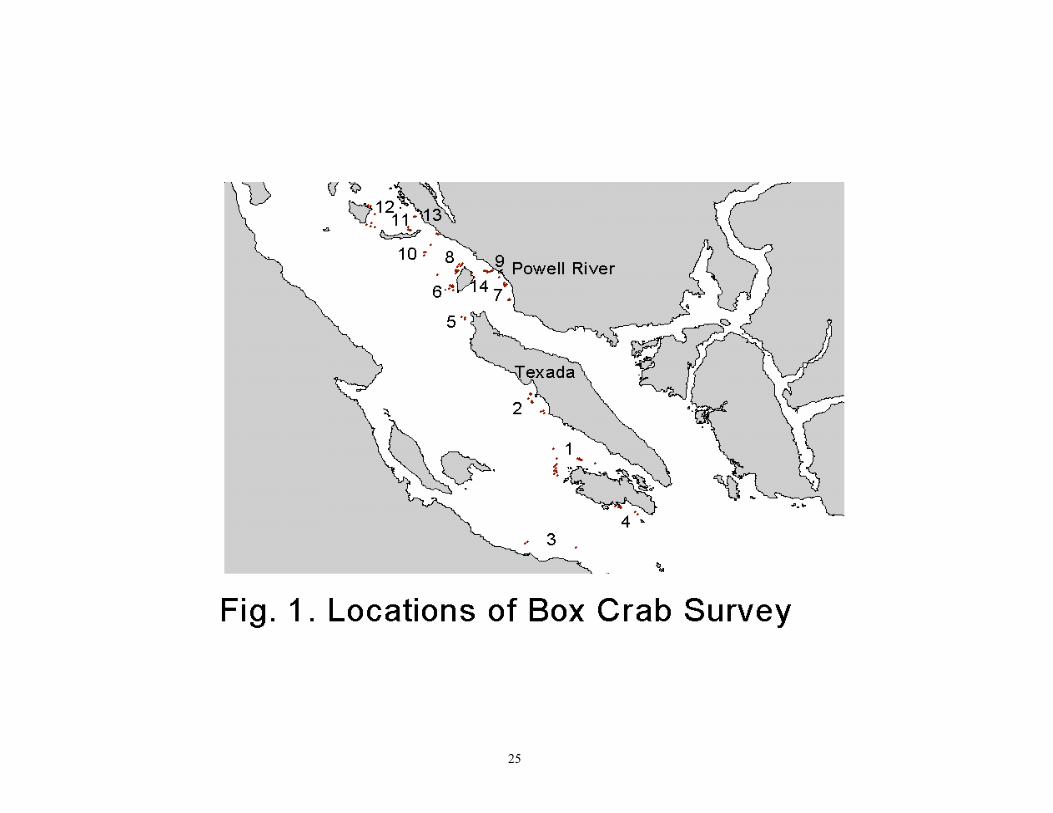
Criteria for setting traps include depth of 90 m, apparent bottom type (not too soft or toohard), and the cliff edges (EUI, 2001). This information was used throughout the projectand also augmented with local knowledge obtained from recreational crab andcommercial prawn fishermen (EUI, 2001). The survey was generally conducted in 14locations (EUI, 2001, Fig. 1, Table 1).
Altogether 102 sets were made. Sixty-eight sets comprised a single trap of type 1,as these traps are too large to be deployed or retrieved in multiple traps per string. Theother thirty-four sets were largely composed of 12 traps -- four of type 2, four of type 3,two of type 4 and two of type 5. Traps of type 1 were set in the immediate neighbourhoodof a string of multiple trap types deployed on the same occasions. The inter-trap distancewas either 18 m or 36 m. Eighty-nine sets were soaked overnight between 13 and 27hours, and the other 13 sets were soaked over two-nights between 37 and 48 hours. Threetraps, two of type 2 and one of type 4, were lost during the operation. The survey depthranged between 20 and 146 m except for one occasion where a trap of type 1 was set 187m deep (Table 2).
2.3. Bait
Two kinds of bait, herring and turbot, were used. Traps of type 2-5 were eachbaited with 1-kg frozen herring throughout the survey, and traps of type 1 were eachbaited with 3-kg freshly processed and iced turbot frames for the first 48 sets. For theremaining 20 sets, herring was used instead, as the quality of turbot had deteriorated.Nineteen of the 20 sets were baited with 3-5 kg of herring, and on one occasion 1-kg ofherring was used for a trap of type 1 in Location 12. Five of the 20 sets were set in alocation with a relatively high abundance of box crabs (location 7), whereas the other 15sets were set in locations with low abundance of box crabs. Two traps of type 1 baitedwith turbot were also set in location 7, allowing a preliminary comparison of the baiteffect on catching box crabs.
2.4. Biological Sampling
Altogether 1724 box crabs were caught with 1096 males and 628 females. Thenumber and weight of box crabs and other species caught in each trap were recorded.Carapace length, carapace width and orbit lengths of 1626 box crabs were taken. Inaddition, sex, shell conditions (hard or new shell) and shell injuries were recorded. Lackor presence of epiphytic growths on the box crab was used as an important indicator ofnew and old shells respectively. In addition, older shells also seem to have additionalblackening on the abdomen and on dentition of the main cheliped (EUI, 2001). Presenceand color of eggs (yellow, orange, red, brown and black) were also noted, except for thefirst 14 sets. To detect the presence and color of eggs, the abdomen of the female needs tobe pulled open, which was not realised until set 15. Thus, the 144 female box crabscaught in the first 14 sets were excluded in the analysis on reproductive characters offemale box crabs.
7
2.5. Relative Abundance of Box Crab
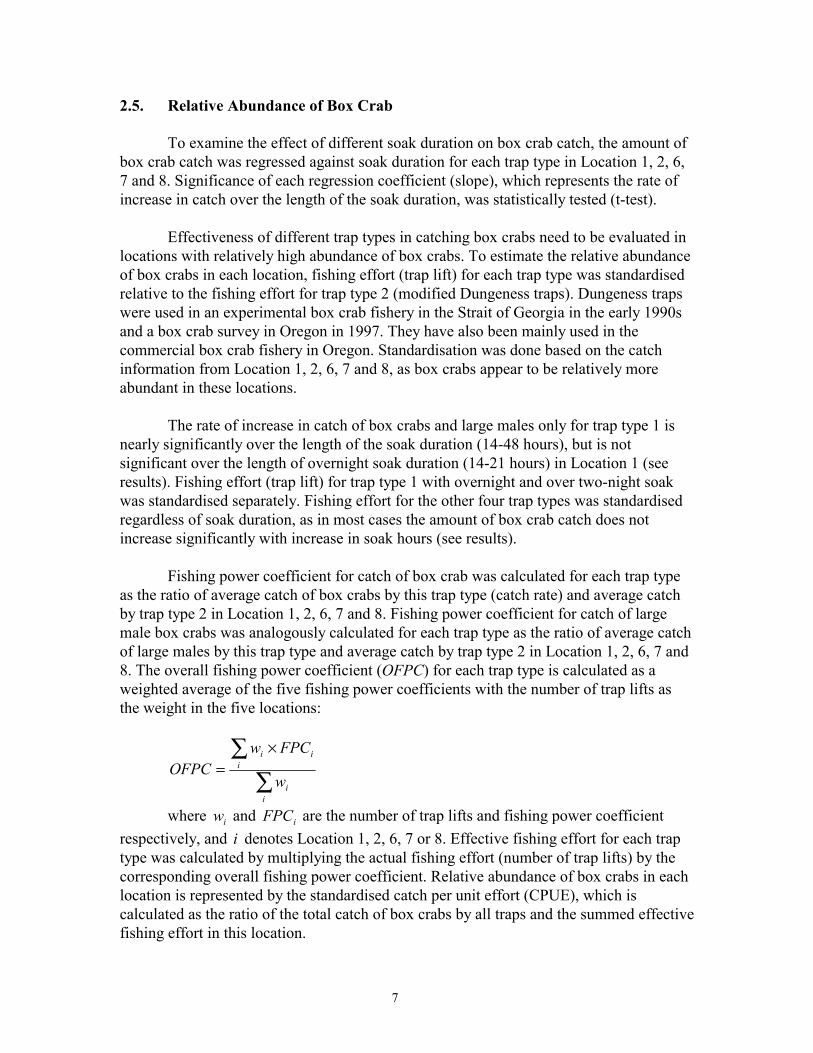
To examine the effect of different soak duration on box crab catch, the amount ofbox crab catch was regressed against soak duration for each trap type in Location 1, 2, 6,7 and 8. Significance of each regression coefficient (slope), which represents the rate ofincrease in catch over the length of the soak duration, was statistically tested (t-test).
Effectiveness of different trap types in catching box crabs need to be evaluated inlocations with relatively high abundance of box crabs. To estimate the relative abundanceof box crabs in each location, fishing effort (trap lift) for each trap type was standardisedrelative to the fishing effort for trap type 2 (modified Dungeness traps). Dungeness trapswere used in an experimental box crab fishery in the Strait of Georgia in the early 1990sand a box crab survey in Oregon in 1997. They have also been mainly used in thecommercial box crab fishery in Oregon. Standardisation was done based on the catchinformation from Location 1, 2, 6, 7 and 8, as box crabs appear to be relatively moreabundant in these locations.
The rate of increase in catch of box crabs and large males only for trap type 1 isnearly significantly over the length of the soak duration (14-48 hours), but is notsignificant over the length of overnight soak duration (14-21 hours) in Location 1 (seeresults). Fishing effort (trap lift) for trap type 1 with overnight and over two-night soakwas standardised separately. Fishing effort for the other four trap types was standardisedregardless of soak duration, as in most cases the amount of box crab catch does notincrease significantly with increase in soak hours (see results).
Fishing power coefficient for catch of box crab was calculated for each trap typeas the ratio of average catch of box crabs by this trap type (catch rate) and average catchby trap type 2 in Location 1, 2, 6, 7 and 8. Fishing power coefficient for catch of largemale box crabs was analogously calculated for each trap type as the ratio of average catchof large males by this trap type and average catch by trap type 2 in Location 1, 2, 6, 7 and8. The overall fishing power coefficient (OFPC) for each trap type is calculated as aweighted average of the five fishing power coefficients with the number of trap lifts asthe weight in the five locations:
∑∑ ×
=
ii
iii
w
FPCwOFPC
where iw and iFPC are the number of trap lifts and fishing power coefficientrespectively, and i denotes Location 1, 2, 6, 7 or 8. Effective fishing effort for each traptype was calculated by multiplying the actual fishing effort (number of trap lifts) by thecorresponding overall fishing power coefficient. Relative abundance of box crabs in eachlocation is represented by the standardised catch per unit effort (CPUE), which iscalculated as the ratio of the total catch of box crabs by all traps and the summed effectivefishing effort in this location.

8
2.6. Evaluation of Catching Efficiencies and Some Biological Features
The mean catches of box crabs by traps of the five types were compared, and thestatistical significance was tested (unbalanced two-way ANOVA). By-catch for each traptype was also evaluated. Some new biological features on box crabs, such as size and sexcomposition, depth distribution, shell conditions, and characters of egg-bearing females,are also presented.
3. Results
3.1. Size Composition
Variations in weight (W) increase with carapace length (CL) for both male andfemale box crabs (Fig. 2, 3). Thus, the following model with a lognormal distributionerror was used to describe carapace length and weight relationship:
εeCLAW B ××= orε+×+= )log()log()log( CLBAW
where A and B are model parameters, and ε is an error of normal distribution with meanof zero. The estimated parameters together with other statistics were shown in Fig. 2 and3, and Table 3. The model was used to estimate carapace lengths of the ninety-eight boxcrabs, whose carapace lengths were not taken in the survey.
The mean carapace length is 102 mm for males and 85 mm for females. Thesmallest male and female are, respectively, 48 mm (39 g) and 47 mm (34 g) in carapacelength, and the largest male and female are, respectively, 153 mm (1638 g) and 123 mm(608 g) in carapace length (Fig. 4, 5). In this paper, male box crabs are categorised intotwo groups, small (CL < 100) and large (CL >= 100) group.
3.2. Bait Effect on Box Crab Catch
On average, 3.5 and 15.2 box crabs were caught, respectively, by the two traps oftype 1 baited with turbot and by the five traps of type 1 baited with herring in Location 7.On average, 3 and 8 large male box crabs were caught, respectively, by the two trapsbaited with turbot and by the five traps baited with herring in Location 7 (Table 4). Oneof the five traps baited with herring caught a particularly high number (61) of box crabs,possibly because it was set on a spot with a particularly high density of box crabs aroundit. If this high catch is excluded, the average catch of box crabs and large males is 3.75and 3.5 respectively for the four traps baited with herring. This average catch iscomparable to that for the two traps baited with turbot suggesting that the effect of thetwo different baits, herring and turbot, on box crab catch might be small, although the baiteffect is still uncertain due to such a small number of samples.
9
3.3. Effect of Soak Duration on Box Crab Catch
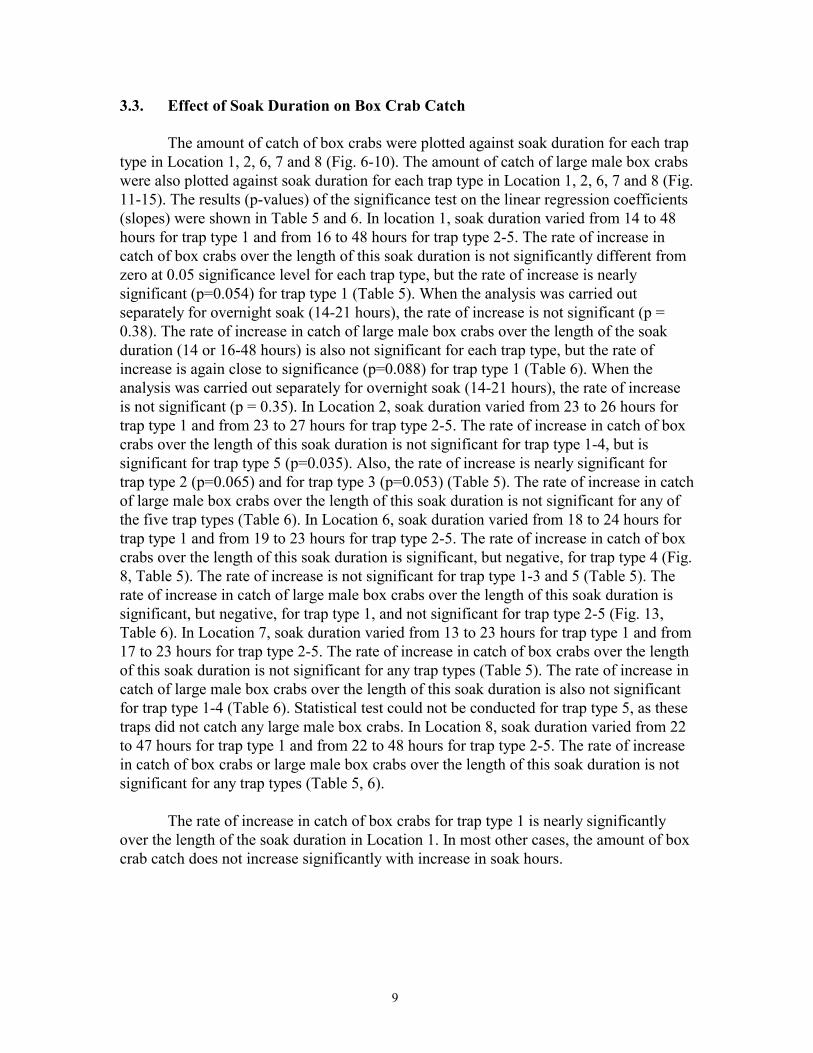
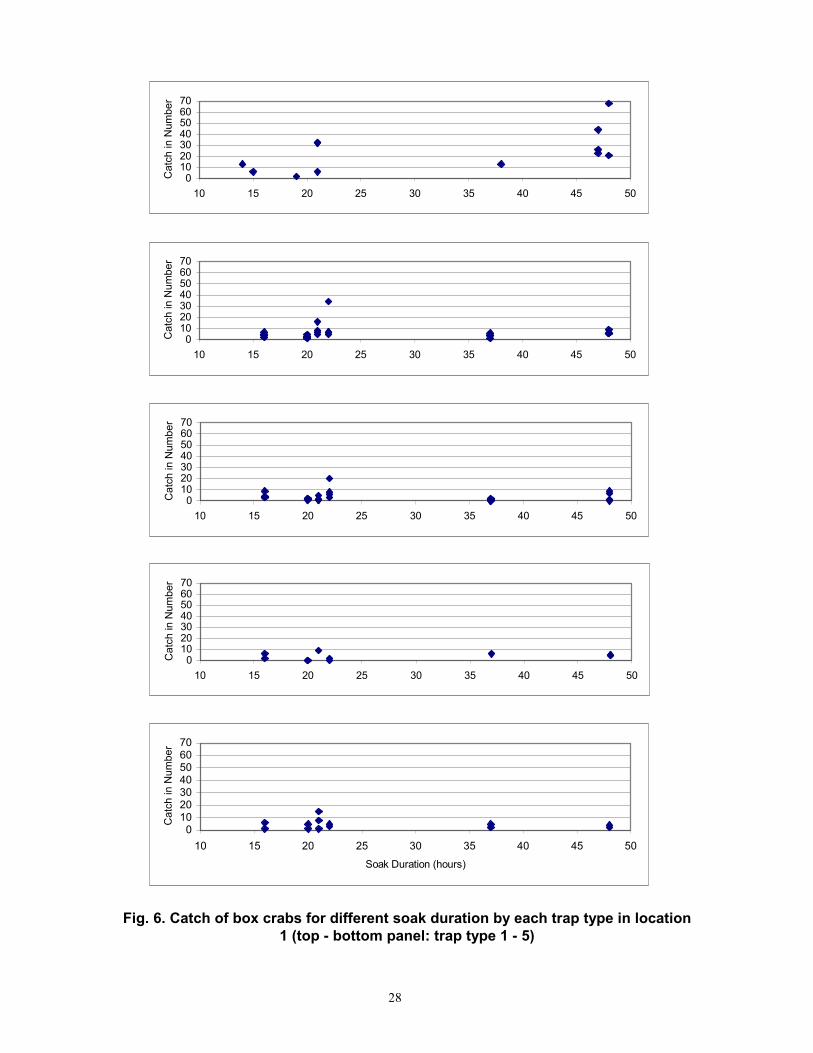
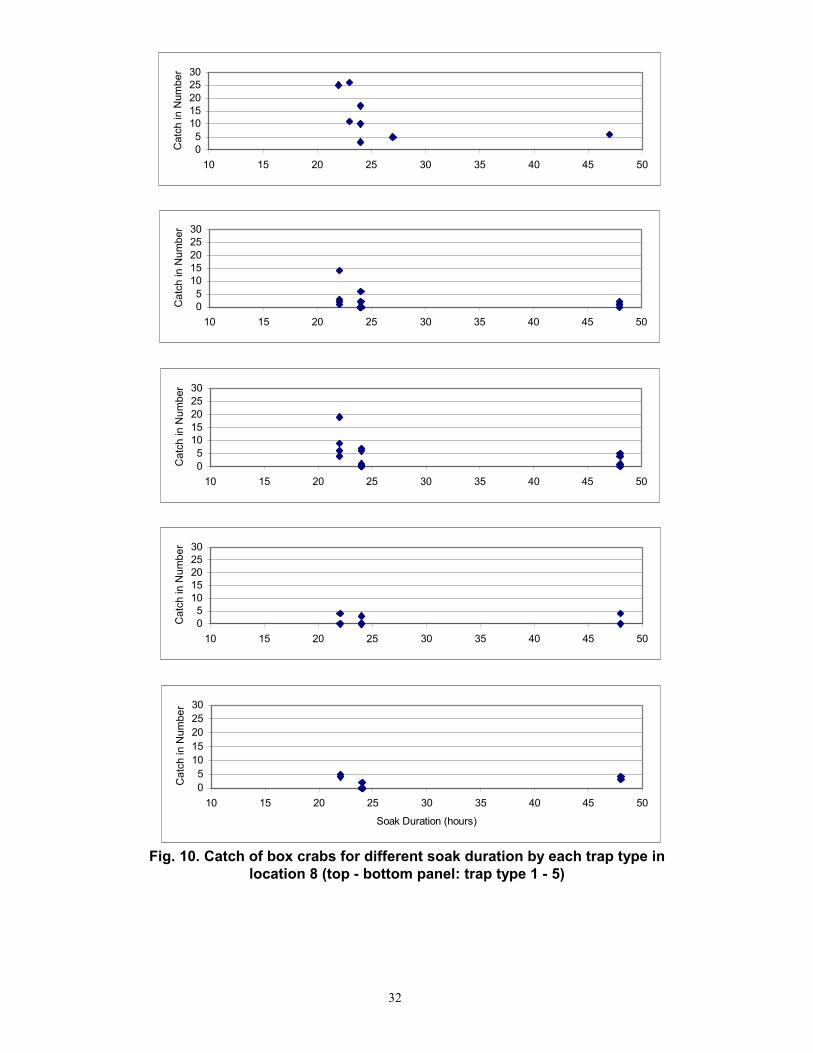
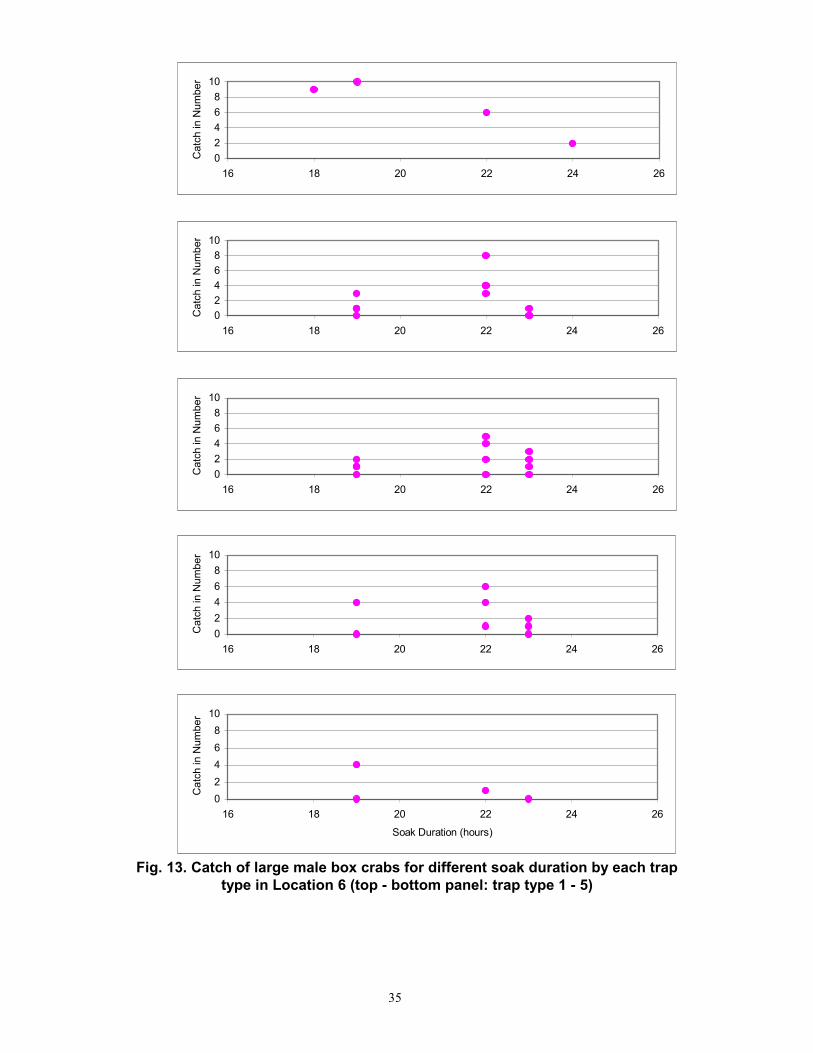
The amount of catch of box crabs were plotted against soak duration for each traptype in Location 1, 2, 6, 7 and 8 (Fig. 6-10). The amount of catch of large male box crabswere also plotted against soak duration for each trap type in Location 1, 2, 6, 7 and 8 (Fig.11-15). The results (p-values) of the significance test on the linear regression coefficients(slopes) were shown in Table 5 and 6. In location 1, soak duration varied from 14 to 48hours for trap type 1 and from 16 to 48 hours for trap type 2-5. The rate of increase incatch of box crabs over the length of this soak duration is not significantly different fromzero at 0.05 significance level for each trap type, but the rate of increase is nearlysignificant (p=0.054) for trap type 1 (Table 5). When the analysis was carried outseparately for overnight soak (14-21 hours), the rate of increase is not significant (p =0.38). The rate of increase in catch of large male box crabs over the length of the soakduration (14 or 16-48 hours) is also not significant for each trap type, but the rate ofincrease is again close to significance (p=0.088) for trap type 1 (Table 6). When theanalysis was carried out separately for overnight soak (14-21 hours), the rate of increaseis not significant (p = 0.35). In Location 2, soak duration varied from 23 to 26 hours fortrap type 1 and from 23 to 27 hours for trap type 2-5. The rate of increase in catch of boxcrabs over the length of this soak duration is not significant for trap type 1-4, but issignificant for trap type 5 (p=0.035). Also, the rate of increase is nearly significant fortrap type 2 (p=0.065) and for trap type 3 (p=0.053) (Table 5). The rate of increase in catchof large male box crabs over the length of this soak duration is not significant for any ofthe five trap types (Table 6). In Location 6, soak duration varied from 18 to 24 hours fortrap type 1 and from 19 to 23 hours for trap type 2-5. The rate of increase in catch of boxcrabs over the length of this soak duration is significant, but negative, for trap type 4 (Fig.8, Table 5). The rate of increase is not significant for trap type 1-3 and 5 (Table 5). Therate of increase in catch of large male box crabs over the length of this soak duration issignificant, but negative, for trap type 1, and not significant for trap type 2-5 (Fig. 13,Table 6). In Location 7, soak duration varied from 13 to 23 hours for trap type 1 and from17 to 23 hours for trap type 2-5. The rate of increase in catch of box crabs over the lengthof this soak duration is not significant for any trap types (Table 5). The rate of increase incatch of large male box crabs over the length of this soak duration is also not significantfor trap type 1-4 (Table 6). Statistical test could not be conducted for trap type 5, as thesetraps did not catch any large male box crabs. In Location 8, soak duration varied from 22to 47 hours for trap type 1 and from 22 to 48 hours for trap type 2-5. The rate of increasein catch of box crabs or large male box crabs over the length of this soak duration is notsignificant for any trap types (Table 5, 6).
The rate of increase in catch of box crabs for trap type 1 is nearly significantlyover the length of the soak duration in Location 1. In most other cases, the amount of boxcrab catch does not increase significantly with increase in soak hours.

10
3.4. Relative Abundance
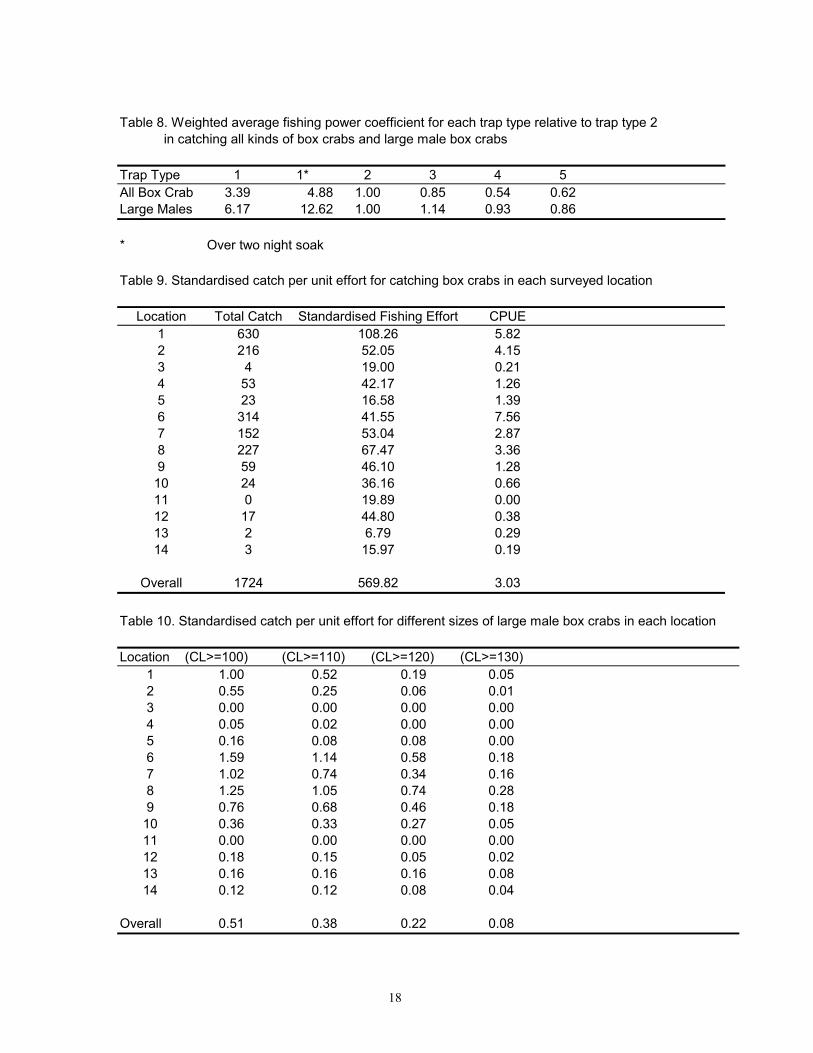
Fishing power coefficients for catch of box crab and large males for each trap typeare shown in Table 7, and the overall fishing power coefficient for each trap type ispresented in Table 8. The standardised CPUE for box crabs is 3.03 for the entire surveyedarea (Table 9). The standardised CPUE is higher in Location 1, 2, 6, 7 and 8 with anaverage of 4.75, and lower in the other nine locations, indicating that box crabs arerelatively more aggregated in the former five locations. The standardised CPUE for largemale box crabs is 0.51 for the entire surveyed area (Table 10). The standardised CPUE ishigher in Location 1, 2, 6, 7, 8 and 9, ranging between 0.55 and 1.59 with an average of1.03 for large males only. The standardised CPUE is lower in the other eight locations,ranging between 0 and 0.36.
3.5. Effectiveness of Trap Types in Catching Box Crabs
As box crabs are relatively abundant in location 1, 2, 6, 7 and 8, catch informationfrom only these locations was used to compare the effectiveness of the five different traptypes. Effectiveness of a trap type in catching box crabs is represented by the mean catchrate (catch of box crab per trap lift). Comparison was made both for catching all kinds ofbox crabs and for catching large males with sets of over two-night soak excluded andincluded.
Trap type 1 is the most effective, and trap type 2 and 3 are more effective thantrap type 4 and 5 in catching all kinds of box crabs or large males (Table 11, 12). Theoverall average catch rate (mean of the means of box crab catches per trap lift) is 13.4 fortrap type 1, 5.7 and 3.9 for trap type 2 and 3, and 2.8 and 3.0 for trap type 4 and 5respectively in catching all kinds of box crabs, when catches with over two-night soak arenot considered (Table 11). The overall average is 14.9 for trap type 1, 5.5 and 3.6 for traptype 2 and 3, and 3.0 and 3.1 for trap type 4 and 5 respectively in catching all kinds ofbox crabs, when catches with over two-night soak are considered (Table 12). The overallaverage is 6.27 for trap type 1, 1.22 and 1.35 for trap type 2 and 3, and 1.05 and 0.87 fortrap type 4 and 5 respectively in catching large male box crabs only, when catches withover two-night soak is excluded (Table 7). The overall average is 6.88 for trap type 1,1.23 and 1.25 for trap type 2 and 3, and 1.16 and 0.80 for trap type 4 and 5 respectively incatching large male box crabs only, when catch information from over two-night soak isincluded (Table 12). Statistically, only trap type 1 is significantly more effective than theother trap types in each of the above cases. The difference between the other four traptypes is not significant.
3.6. By-Catches
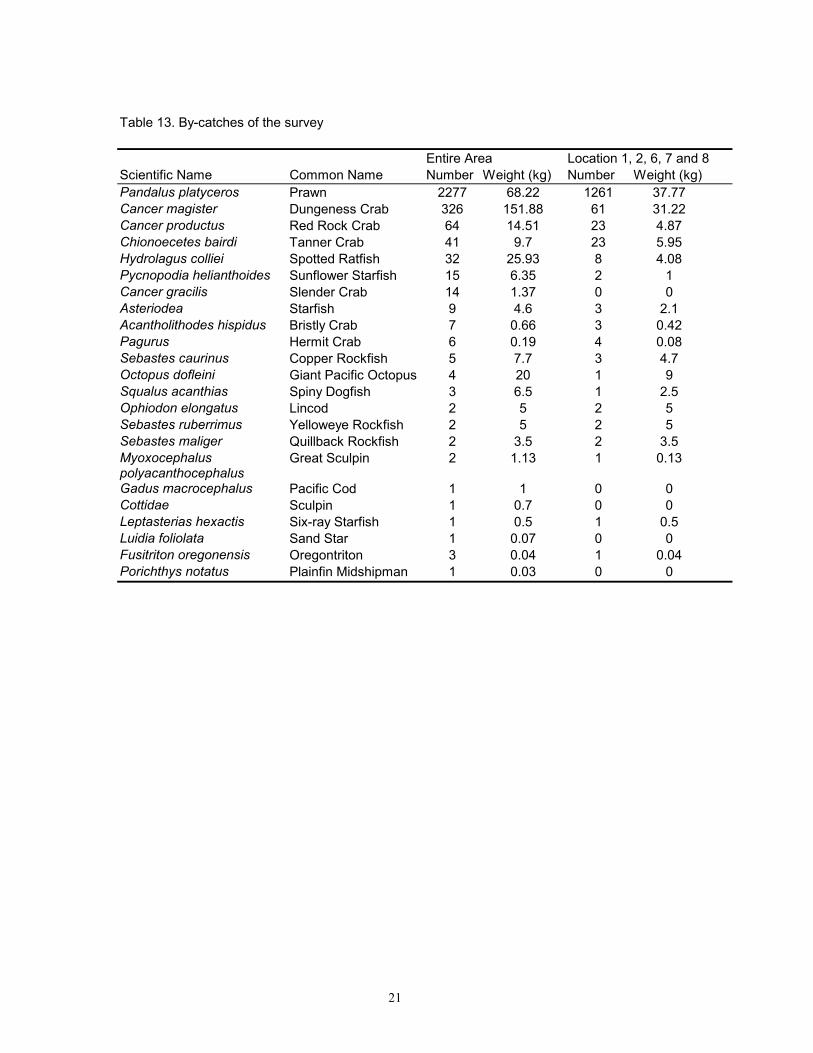
The most frequent by-catches were prawn, Dungeness crabs, red rock crabs andtanner crabs. Other by-catch species were minimum in both number and weight (Table13). The amount of prawn by-catch by trap type 1 and 2 is negligible due to large meshsize. Prawn was mainly caught by trap type 3, 4 and 5 (Table 14). By-catch of Dungeness,

11
red rock and tanner crabs combined was between 0.2 and 0.5 pieces or between 0.1 and0.2 kg per trap in Location 1, 2, 6, 7, and 8. By-catch of these crabs was higher, rangingbetween 0.6 and 1.6 pieces or between 0.2 and 0.7 kg per trap in the entire surveyed area.The amount of by-catch of Dungeness, red rock and tanner crabs combined was similaramong trap type 2, 3, 4 and 5. Traps of type 1 caught considerably smaller amount ofthese crabs in Location 1, 2, 6, 7 and 8, while they caught considerably larger amount ofthese crabs in the entire surveyed area. In Location 11 and 12, few box crabs but mainlyDungeness crabs were caught. About 78% of Dungeness crabs were caught by traps oftype 1 from these two locations.
3.7. Comparison of Relative Abundance of Box Crabs
In the early 1990s, a fisherman fished for box crabs at the north end of theThormanby Island using Dungeness trap pots. He caught 1481 box crabs with 729 trappulls with a catch rate of about 2 box crabs per trap. The standardised CPUE (catch perDungeness trap lift) in location 1, 2, 6, 7, 8 is 4.75, suggesting that the abundance inthese locations is possibly higher, although the modified Dungeness traps used in thecurrent survey are higher and their gates are larger.
In 1997, Oregon Department of Fish and Game conducted a survey in fourlocations between Newport and Florence, Oregon in a depth range of 120-156 m on April18-19 and 24-26 1997 (Zhang et. al. 1999). Standard Dungeness crab traps were usedwith mackerel and squid as baits, and most traps were set in the afternoon and retrievedthe following morning for an average of 15-hour soak. Abundance of box crabs was highin two locations and very low in the other two locations. The CPUE (catch per trap lift) inthe two abundant locations was more than 5 times as high as that in location 1, 2, 6, 7, 8in the current survey (Table 15).
Mesh size is large for traps of type 1 and 2, and small for traps of type 3, 4 and 5.The average carapace length of male and female box crabs caught by traps of type 1 and 2is 102.6 mm and 86.1 mm respectively. The average carapace length of male and femalebox crabs caught by traps of type 3, 4 and 5 is 101.1 mm and 82.6 mm respectively. Thedifference between the mean carapace lengths of males is not significant, whereas thedifference between the mean carapace lengths of females is significant. Both males andfemales caught by traps of type 1 and 2 from the current survey are, on average,significantly smaller than males and females caught in the Oregon survey (Table 16).
3.8. Depth Distribution, and Size and Sex Composition
The standardised CPUE is relatively high in the depth range between 76 and 150m and low in the depth range between 20 and 75 m (Fig. 16). The highest standardisedCPUE occurs in the depth from 101 to 125. The percentage of large individuals (CL>=100 mm) decrease for both sex, while the fishing depth increases (Fig. 16). Theproportion of large males in the depth between 20 and 50 m is more than twice as high asthat in the depth between 76 and 150 m. The proportion of large females in the depth

12
between 20 and 50 m is almost 11 times as high as that in the depth between 76 and 150m. One trap of type 1 was set at a depth of 187 m, and it caught 12 small box crabswithout a single large one. The percentage of male box crabs in the aggregated locations(Location 1, 2, 6, 7 and 8) varied, on average, from 57 to 71 % (Table 17).
3.9. Injury
Box crabs sustained a low level of injuries, which include deformed shell, holes inthe shell, town tason, regenerated legs or claws. Among the captured box crabs, 1.55% ofmales and 0.48% of females were found to be injured (Table 18).
3.10. Shell Condition
Most of the box crabs had new shells; 71.5% males and 57.5% females containednew shells (Table 19). The mean carapace length of old shells is 113 mm for males and91 mm for females, significantly larger than the mean carapace length of males andfemales of new shells (Table 19).
There is a higher proportion of new shells among females without eggs than witheggs. Among females with eggs the proportion of new shells decreased from 69% to 0%,as egg color gets darker from yellow, orange, red, brown and black (Table 20). Meancarapace length of females without eggs is significantly smaller than that of females witheggs of orange color or darker. Females with eggs of yellow colors are also, on average,significantly smaller than those with eggs of orange or darker (Table 20). The percentageof females with eggs increases with the size. Among box crabs with a carapace length ofapproximately 80 mm, 50% of them bear eggs. When they are around 90 mm in carapacelength, approximately 95% bear eggs (Table 21).
4. Discussion
Trap type 1 is most effective in catching box crabs, probably because of moreroom within the trap and possibly also due to larger amount of bait used. Catch of boxcrabs increased (almost significantly) for traps of type 1 over the length of the entire soakduration (14-48 hours). The average rate of catch of box crabs and large males for traptype 1 is, respectively, about 2.5 and 5.5 times as high as that for the trap type 2.However, these large traps could only be deployed and retrieved singularly in each set dueto their heavy weight, whereas traps of the other types can be set in multiple numbers ineach set. It is, therefore, more likely to catch more box crabs with a set employing, forinstance, 10-20 traps of type 2 than a set employing a single trap of type 1. In addition, itis more demanding to deploy and retrieve traps of type 1 due to their large size and heavyweight. Thus, trap type 2 appears to be more suitable for use in future box crab surveysthan trap type 1.
The average rate of catch of box crabs for trap type 2 is approximately 1.5 timesas high as that for trap type 3, and almost 2 times as high as for trap type 4 or 5. The

13
average rate of catch of large male box crabs for trap type 2 is slightly higher than that fortrap type 4 or 5, and slightly lower than trap type 3. For the sake of surveys, it is of greaterconcern to have a trap type capable of catching all sizes of box crabs than catching largeones. In addition, traps of type 3, 4 and 5 have the shortcoming of by-catching aconsiderable amount of prawn, whereas prawn by-catch is negligible for traps of type 2.
This survey offers an opportunity to examine the relative abundance of box crabsin the surveyed area. Catch of large male box crabs per standardised effort (relative totype 2 trap) is only 1.03 in the box crab aggregated locations. Although the CPUE washigher than that in the experimental fishery in the early 1990s, it was 5 times as low asthat in the Oregon's survey in 1997, indicating again that the resource of box crabs isprobably low in B.C. In addition, the average size of box crabs in the surveyed area wasalso significantly smaller than that from Oregon. The smallest box crab caught is 47 mmin carapace length. Among the box crabs caught, the proportion of very small box crabswas low, although considerable amount of prawn were retained. Small box crabs mightlive in a different habitat or the bait used might not be so attractive to them.
The abundance of box crabs appears to be higher in the depth range of 76-150 mthan that of 20-75 m. This depth range with a relatively high abundance of box crabsagrees well with what has been reported (Zhang et. al. 1999). A higher proportion oflarger male and female box crabs were caught with decrease in depth, and male andfemale box crabs do not appear to live separately, suggesting that these large box crabsmight have come to the shallower waters for spawning. When females reach 75-84 mm incarapace length, 50% of them bears eggs. The size of female maturity is similar to that inOregon, where females begins to bear eggs at 78-83 mm in carapace length (Goddard1997).
Female box crabs holding new egg clutches (yellowish eggs) are composed ofboth new shell (69%) and old shell (31%) crabs, suggesting that female box crabs mightbe capable of breeding in both soft and hard shell states.
5. Recommendations
The catch rate for large male box crabs is low, despite that the surveyed locationswere chosen with some previous experience on box crab catch distribution and habitat. Ifthis species continues to be considered for a commercial fishery, then the followingrecommendations are proposed.
1. The preferred trap type for a survey (and possibly for a fishery) is type 2(modified Dungeness trap). The box crab catch rate is higher for this trap type thanfor trap type 3, 4 and 5. The amount of prawn by-catch is negligible for this trap type,but is of concern for the latter three types. Traps of type 1 can only be set singularlyfor each set, although the box crab catch rate is the highest for this trap type. Morebox crabs could be sampled in a set having multiple number of traps of type 2 than a

14
set containing only a single trap of type 1. It is also easier to set traps of type 2 than oftype 1.
2. A systematic distribution survey is to be carried out to gain more detailedinformation on box crab biology, such as distribution, relative abundance, andreproductive characters. Change-in-ratio method may be used to investigate theabundance of box crab resource. A survey is carried out to remove all large males,before another survey is conducted in the same area. Abundance is estimated based onthe change in the ratio of large males to small males plus all females (Chen et al.1998). It was found from the Oregon box crab survey that the degree of damage to themale genital pore setae is positively related to male mating behaviour. Thispreliminary finding need to be verified in order to more reliably determine the size ofmales, when they begin to actively mate.
6. Acknowledgements
I would like to thank Greg Workman for his thorough review of this paper withmany good points, which helped to enhance the quality of the paper. I am also grateful toDr. Ian Perry, Geoff Krause and Inja Yeon for their reading of the paper and providingmany constructive suggestions.
7. References
Chen, C.-L., J.M. Hoenig, E.G. Dawe, C. Brownie, and K.H. Pollock. 1998. Newdevelopments in change-in-ratio and index-removal methods, with application tosnow crab (Chionoecetes opilio). P. 49-61. In G.S. Jamieson and A. Campbell.(eds.). Proceedings of the North Pacific symposium on invertebrate stockassessment and management. Can. Spec. Publ. Fish. Aquat. Sci. 125.
EUI, 2001. Project report for the box crab trap evaluation study 2001. Report prepared forSointula Box Crab and Whelk Association.
Goddard, J. 1997. Size at maturity in box crabs, Lopholithodes foraminatus , fromOregon. Report prepared for the Oregon Department of Fish and Wildlife. 7 pp.
Perry, R.I., C.J. Walters and J.A. Boutillier. 1999. A framework for providing scientificadvice for the management of new and developing invertebrate fisheries. Rev. FishBiol. Fish. 9:125-150.
Zhang, Z.Y., G. Workman, and A.C. Philips. 1999. A Review of the Biology and Fisheriesof the Box Crab (Lopholithodes foraminatus Stimpson) in British Columbia.Canadian Stock Assessment Secretariat Research Document 99/131.

15
Table 1. The survey locations
Location Sets AverageDepth
Location
1 1-7, 17-19, 21-28 109 Northen end of Lasqueti Island2 8-16, 20 103 Central western bays on Texada Island3 29-31 96 Georgia Strait off Qualicum Beach4 32-38 105 South-western shore of Lasqueti Island5 39-41 88 Northern end of Texada Island (Limekiln Bay)6 42-44, 54-55, 65-66 49 South-western shore of Harwood Island7 45-47, 88-90, 99-102 52 Mianland shore off Powel River8 48-53, 56-59, 63-64 59 North-western shores of Harwood Island9 60-62, 91-95 42 Mianland shore north off Powel River pulpmill10 67-68, 73-77 64 Banks south of Savary Island11 69-72 54 Northern side of Savary Island in Keefer Bay12 78-85 61 Eastern Shore of Hernando Island13 86-87 68 Mainland shore south of Lund14 96-98 63 Eastern Shore of Harwood Island across from
Powel River
Table 2. The number of trap lift at different depth ranges for each trap type
Depth Range (m) Type 1 Type 2 Type 3 Type 4 Type 5 Sum20-50 14 59 59 31 29 19251-75 19 10 13 7 6 5576-100 19 17 20 10 12 78101-125 24 27 29 10 17 107126-150 1 16 16 7 9 49
187 1 0 0 0 0 1
Table 3. Carapace length (CL) and weight (W) relationship for box crabs: log(W) = log(A) + B*log(CL)
log(A) B Residual Srandard Error Degrees of Freedom R2
Male -8.8117 3.2247 0.07224 1041 0.99Female -7.9374 3.0111 0.06664 581 0.98
16
Table 4. Catch of box crabs by traps of type 1 baited with turbot or herring in Location 7
Bait Soak Hours Catch of Box Crab Catch of Large Male Box CrabTurbot 23 6 5Turbot 23 1 1Herring 21 0 0Herring 21 2 2Herring 13 10 9Herring 17 3 3Herring 17 61 26
Table 5. Statistics of the significance test on the slope of the linear regression of box crabcatch against soak duration for each of the five trap types
Trap Type Location 1 Location 2 Location 6 Location 7 Location 81 Sample Size 12 7 4 7 8
p-value 0.054 0.646 0.292 0.419 0.301
2 Sample Size 24 11 11 13 16p-value 0.807 0.065 0.148 0.355 0.453
3 Sample Size 25 12 12 11 16p-value 0.551 0.053 0.288 0.235 0.413
4 Sample Size 10 4 8 6 8p-value 0.345 0.37 0.033 0.343 0.673
5 Sample Size 13 8 4 6 8p-value 0.544 0.035 0.263 0.435 0.455
Table 6. Statistics of the significance test on the slope of the linear regression of large male box crab catch against soak duration for each of the five trap types
Trap Type Location 1 Location 2 Location 6 Location 7 Location 81 Sample Size 12 7 4 7 8
p-value 0.088 0.235 0.049 0.268 0.450
2 Sample Size 24 11 11 13 16p-value 0.253 0.318 0.664 0.844 0.600
3 Sample Size 25 12 12 11 16p-value 0.913 0.546 0.423 0.291 0.150
4 Sample Size 10 4 8 6 8p-value 0.527 0.434 0.837 0.343 0.593
5 Sample Size 13 8 4 6 8p-value 0.948 0.153 0.509 N/A 0.722

17
Table 7. Fishing power coefficient for each trap type relative to trap type 2
Location 1Trap Number of Catch of Catch of Catch of Box Catch of LargeType Trap Pulls Box Crab Large Males Crab per Trap Males per Trap FPC1 FPC2
1 6 91 37 15.17 6.17 2.28 5.691 * 6 195 82 32.50 13.67 4.88 12.622 24 160 26 6.67 1.08 1.00 1.003 25 91 22 3.64 0.88 0.55 0.814 10 35 9 3.50 0.90 0.53 0.835 13 58 9 4.46 0.69 0.67 0.64
Location 21 7 90 24 12.86 3.43 2.62 7.542 11 54 5 4.91 0.45 1.00 1.003 12 43 9 3.58 0.75 0.73 1.654 4 9 1 2.25 0.25 0.46 0.555 8 20 4 2.50 0.50 0.51 1.10
Location 61 4 53 27 13.25 6.75 1.29 2.972 11 113 25 10.27 2.27 1.00 1.003 12 72 21 6.00 1.75 0.58 0.774 8 55 18 6.88 2.25 0.67 0.995 4 21 5 5.25 1.25 0.51 0.55
Location 71 7 83 45 11.86 6.43 3.28 4.642 13 47 18 3.62 1.38 1.00 1.003 11 13 11 1.18 1.00 0.33 0.724 6 7 7 1.17 1.17 0.32 0.845 6 2 0 0.33 0.00 0.09 0.00
Location 81 7 97 60 13.86 8.57 6.93 9.142 16 32 15 2.00 0.94 1.00 1.003 16 63 28 3.94 1.75 1.97 1.874 8 11 10 1.38 1.25 0.69 1.335 8 18 14 2.25 1.75 1.13 1.87
* Over two night soakFPC1 Fishing power coefficient for catching box crabsFPC2 Fishing power coefficient for catching large male box crabs (CL >= 100 mm)
18
Table 8. Weighted average fishing power coefficient for each trap type relative to trap type 2 in catching all kinds of box crabs and large male box crabs
Trap Type 1 1* 2 3 4 5All Box Crab 3.39 4.88 1.00 0.85 0.54 0.62Large Males 6.17 12.62 1.00 1.14 0.93 0.86
* Over two night soak
Table 9. Standardised catch per unit effort for catching box crabs in each surveyed location
Location Total Catch Standardised Fishing Effort CPUE1 630 108.26 5.822 216 52.05 4.153 4 19.00 0.214 53 42.17 1.265 23 16.58 1.396 314 41.55 7.567 152 53.04 2.878 227 67.47 3.369 59 46.10 1.2810 24 36.16 0.6611 0 19.89 0.0012 17 44.80 0.3813 2 6.79 0.2914 3 15.97 0.19
Overall 1724 569.82 3.03
Table 10. Standardised catch per unit effort for different sizes of large male box crabs in each location
Location (CL>=100) (CL>=110) (CL>=120) (CL>=130)1 1.00 0.52 0.19 0.052 0.55 0.25 0.06 0.013 0.00 0.00 0.00 0.004 0.05 0.02 0.00 0.005 0.16 0.08 0.08 0.006 1.59 1.14 0.58 0.187 1.02 0.74 0.34 0.168 1.25 1.05 0.74 0.289 0.76 0.68 0.46 0.1810 0.36 0.33 0.27 0.0511 0.00 0.00 0.00 0.0012 0.18 0.15 0.05 0.0213 0.16 0.16 0.16 0.0814 0.12 0.12 0.08 0.04
Overall 0.51 0.38 0.22 0.08

19
Table 11. Mean catch of box crabs per trap in location 1, 2, 6, 7 and 8 with overnight soak
Mean Catch of Box Crab per Trap
Area Trap Type 1 Trap Type 2 Trap Type 3 Trap Type 4 Trap Type 51 15.17 7.38 4.38 2.71 52 12.86 4.91 3.58 2.25 2.56 13.25 10.27 6 6.88 5.257 11.86 3.62 1.18 1.17 0.338 13.86 2.33 4.42 1.17 1.83
Overall Average 13.40 5.70 3.91 2.84 2.98
Mean Catch of Large Male Box Crab per Trap
Area Trap Type 1 Trap Type 2 Trap Type 3 Trap Type 4 Trap Type 51 6.17 0.94 1 0.57 0.782 3.43 0.45 0.75 0.25 0.56 6.75 2.27 1.75 2.25 1.257 6.43 1.38 1 1.17 08 8.57 1.08 2.25 1 1.83
Overall Average 6.27 1.22 1.35 1.05 0.87
Number of Trap Pulls
Area Trap Type 1 Trap Type 2 Trap Type 3 Trap Type 4 Trap Type 51 6 16 16 7 92 7 11 12 4 86 4 11 12 8 47 7 13 11 6 68 7 12 12 6 6

20
Table 12. Mean catch of box crabs per trap in location 1, 2, 6, 7 and 8 with overnight soak and over two-night soak combined
Mean Catch of Box Crab per Trap
Area Trap Type 1 Trap Type 2 Trap Type 3 Trap Type 4 Trap Type 51 23.83 6.67 3.64 3.50 4.462 12.86 4.91 3.58 2.25 2.506 13.25 10.27 6.00 6.88 5.257 11.86 3.62 1.18 1.17 0.338 12.88 2.00 3.73 1.38 2.78
Overall Average 14.93 5.49 3.63 3.03 3.06
Mean Catch of Large Male Box Crab per Trap
Area Trap Type 1 Trap Type 2 Trap Type 3 Trap Type 4 Trap Type 51 9.92 1.08 0.88 0.90 0.692 3.43 0.45 0.75 0.25 0.506 6.75 2.27 1.75 2.25 1.257 6.43 1.38 1.00 1.17 0.008 7.88 0.94 1.87 1.25 1.56
Overall Average 6.88 1.23 1.25 1.16 0.80
Number of Trap Pulls
Area Trap Type 1 Trap Type 2 Trap Type 3 Trap Type 4 Trap Type 51 12 24 25 10 132 7 11 12 4 86 4 11 12 8 47 7 13 11 6 68 8 16 15 8 9
21
Table 13. By-catches of the survey
Entire Area Location 1, 2, 6, 7 and 8Scientific Name Common Name Number Weight (kg) Number Weight (kg)Pandalus platyceros Prawn 2277 68.22 1261 37.77Cancer magister Dungeness Crab 326 151.88 61 31.22Cancer productus Red Rock Crab 64 14.51 23 4.87Chionoecetes bairdi Tanner Crab 41 9.7 23 5.95Hydrolagus colliei Spotted Ratfish 32 25.93 8 4.08Pycnopodia helianthoides Sunflower Starfish 15 6.35 2 1Cancer gracilis Slender Crab 14 1.37 0 0Asteriodea Starfish 9 4.6 3 2.1Acantholithodes hispidus Bristly Crab 7 0.66 3 0.42Pagurus Hermit Crab 6 0.19 4 0.08Sebastes caurinus Copper Rockfish 5 7.7 3 4.7Octopus dofleini Giant Pacific Octopus 4 20 1 9Squalus acanthias Spiny Dogfish 3 6.5 1 2.5Ophiodon elongatus Lincod 2 5 2 5Sebastes ruberrimus Yelloweye Rockfish 2 5 2 5Sebastes maliger Quillback Rockfish 2 3.5 2 3.5Myoxocephaluspolyacanthocephalus
Great Sculpin 2 1.13 1 0.13
Gadus macrocephalus Pacific Cod 1 1 0 0Cottidae Sculpin 1 0.7 0 0Leptasterias hexactis Six-ray Starfish 1 0.5 1 0.5Luidia foliolata Sand Star 1 0.07 0 0Fusitriton oregonensis Oregontriton 3 0.04 1 0.04Porichthys notatus Plainfin Midshipman 1 0.03 0 0

22
Table 14. By-catches by different trap types
By-catch in the entire surveyed area
Average catch of prawn per trap Average catch of crabs per trap *Trap Type Trap pulls in pieces in weight (kg) in pieces in weight (kg)Type 1 68 0.01 0.00 1.56 0.69Type 2 129 0.08 0.00 0.82 0.35Type 3 138 8.92 0.27 0.83 0.34Type 4 65 7.58 0.23 0.92 0.32Type 5 72 7.53 0.23 0.63 0.23
By-catch in Location 1, 2, 6, 7 and 8
Average catch of prawn per trap Average catch of crabs per trap *Trap Type Trap pulls in pieces in weight (kg) in pieces in weight (kg)Type 1 38 0.00 0.00 0.16 0.09Type 2 75 0.13 0.00 0.51 0.23Type 3 76 8.04 0.24 0.37 0.13Type 4 36 7.03 0.21 0.50 0.18Type 5 39 9.92 0.30 0.44 0.13
* Including Dungeness, Red Rock and Tanner Crabs
Table 15. Comparison of CPUE among the current survey, the early 1990s survey and Oregon's survey
Survey Locations Catch of box crabs Trap Pulls*** CPUECurrent Abundant Locations* 1539 322.4 4.77
Less Abundant Locations ** 185 247.5 0.75Early 1990s' catch Thormanby Island 1481 729 2.03Oregon survey Abundant Locations 2955 116 25.47
Less Abundant Locations 28 46 0.61
* Location 1, 2, 6-8** Location 3-5, 9-14*** Equivalent to the number of lifts of modified Dungeness trap pots

23
Table 16. Differences in sizes of box crabs caught in the current survey and the Oregon survey
MaleCurrent Survey Current Survey Oregon SurveyTrap Type 3, 4 and 5 Trap Type 1 and 2
Mean Length 101.1 102.6 106.5Standard Deviation 22.6 18.7 13.0Minimum 48 55 69Maximum 153 144 144Number of Sample 365 731 364
FemaleCurrent Survey Current Survey Oregon SurveyTrap Type 3, 4 and 5 Trap Type 1 and 2
Mean Length 82.6 86.1 94.1Standard Deviation 14.6 11 10.7Minimum 47 55 67Maximum 123 115 113Number of Sample 234 394 145
Table 17. Sex composition of box crabs in aggregated locations
Locations Number of Male Number of Female % of Male 95% confidence interval1 386 244 61.3 57.3-63.12 136 80 63.0 56.1-69.36 178 136 56.7 51-62.27 96 56 63.2 54.9-70.78 160 67 70.5 64-76.2
Table 18. Percentage of injuries
Sex Total Number Deformed Hole in Torn Regenerated Multiple Total % ofShell the shell Telson Legs/Claws Injuries Injuries injury
Male 1096 5 4 1 5 2 17 1.55
Female 628 1 1 1 3 0.48

24
Table 19. Percentage and size of new and old shells
Sex Number % Mean Length Standard DeviationMale New Shell 784 71.5 97.79 19.63
Old Shell 312 28.5 112.99 17.04
Female New Shell 361 57.5 80.1 12.17Old Shell 267 42.5 91.18 9.93
New Shell includes new hard, new hardening and new softOld Shell includes old shell and real old shell
Table 20. Size and shell composition of females with different egg colors
Egg Color Number Mean Length Standard Deviation % of new shell % of old shellNo Eggs 143 73.16 10.48 86.0 14.0yellow 13 80 6.99 69.2 30.8orange 125 93.13 9.13 68.0 32.0
red 61 89.75 7.26 19.7 80.3brown 133 93.46 8.01 7.5 92.5black 9 93.44 5.96 0.0 100.0
Table 21. Proportion of egg bearing females at different size groups
Number of females Number of females Percentage of femalesLength Group (mm) without eggs with eggs with eggs
45-54 10 0 0.055-64 13 0 0.065-74 54 5 8.575-84 55 58 51.385-94 7 155 95.795-104 3 91 96.8105-114 1 28 96.6115-124 0 4 100.0
25

26
0 200 400 600 800
1000 1200 1400 1600 1800
40 60 80 100 120 140 160 Carapace Length (mm)
Wei
ght (
g) W = 0.000149CL
3.2247
0
100
200
300
400
500
600
700
40 50 60 70 80 90 100 110 120 130 Carapace Length
(mm)
Wei
ght (
g) W = 0.000357L
3.0001
Fig. 3. Relationship between carapace length and weight for femalebox crabs
Fig. 2. Relationship between carapace length and weight for malebox crabs

27
0
5
10
15
20
25
30
50 55 60 65 70 75 80 85 90 95 100
105
110
115
120
125
130
135
140
145
150
Carapace Length (mm)
Fig. 4. Carapace Length Frequency Distribution for Male Box Crab
Num
ber
Mean Carapace Length = 120 mm
0
5
10
15
20
25
30
50 55 60 65 70 75 80 85 90 95 100
105
110
115
120
125
130
135
140
145
150
Carapace Length (mm)
Fig. 5. Carapace Length Frequency Distribution for Female Box Crab
Num
ber
Mean Carapace Length = 85 mm
28
Fig. 6. Catch of box crabs for different soak duration by each trap type in location1 (top - bottom panel: trap type 1 - 5)
010203040506070
10 15 20 25 30 35 40 45 50
Cat
ch in
Num
ber
010203040506070
10 15 20 25 30 35 40 45 50
Cat
ch in
Num
ber
010203040506070
10 15 20 25 30 35 40 45 50
Cat
ch in
Num
ber
010203040506070
10 15 20 25 30 35 40 45 50
Cat
ch in
Num
ber
010203040506070
10 15 20 25 30 35 40 45 50Soak Duration (hours)
Cat
ch in
Num
ber

29
Fig. 7. Catch of box crabs for different soak duration by each trap type in location2(top - bottom panel: trap type 1 - 5)
0
10
20
30
40
22 23 24 25 26 27 28
Cat
ch in
Num
ber
-5
5
15
25
35
22 23 24 25 26 27 28
Cat
ch in
Num
ber
05
101520253035
22 23 24 25 26 27 28
Cat
ch in
Num
ber
05
101520253035
22 23 24 25 26 27 28
Cat
ch in
Num
ber
05
101520253035
22 23 24 25 26 27 28Soak Duration (hours)
Cat
ch in
Num
ber

30
Fig. 8. Catch of box crabs for different soak duration by each trap type in location6 (top - bottom panel: trap type 1 - 5)
0
10
20
30
40
16 18 20 22 24 26C
atch
in N
umbe
r
0
10
20
30
40
16 18 20 22 24 26
Cat
ch in
Num
ber
0
10
20
30
40
16 18 20 22 24 26
Cat
ch in
Num
ber
0
10
20
30
40
16 18 20 22 24 26
Cat
ch in
Num
ber
0
10
20
30
40
16 18 20 22 24 26
Soak Duration (hours)
Cat
ch in
Num
ber

31
Fig. 9. Catch of box crabs for different soak duration by each trap type in location7 (top - bottom panel: trap type 1 - 5)
0
20
40
60
80
10 15 20 25C
atch
in N
umbe
r
010203040506070
10 15 20 25
Cat
ch in
Num
ber
010203040506070
10 15 20 25
Cat
ch in
Num
ber
010203040506070
10 15 20 25
Cat
ch in
Num
ber
010203040506070
10 15 20 25Soak Duration (hours)
Cat
ch in
Num
ber
32
Fig. 10. Catch of box crabs for different soak duration by each trap type inlocation 8 (top - bottom panel: trap type 1 - 5)
05
1015202530
10 15 20 25 30 35 40 45 50C
atch
in N
umbe
r
05
1015202530
10 15 20 25 30 35 40 45 50
Cat
ch in
Num
ber
05
1015202530
10 15 20 25 30 35 40 45 50
Cat
ch in
Num
ber
05
1015202530
10 15 20 25 30 35 40 45 50
Cat
ch in
Num
ber
05
1015202530
10 15 20 25 30 35 40 45 50
Soak Duration (hours)
Cat
ch in
Num
ber

33
05
101520253035
10 15 20 25 30 35 40 45 50C
atch
in N
umbe
r
-5
5
15
25
35
10 15 20 25 30 35 40 45 50
Cat
ch in
Num
ber
05
101520253035
10 15 20 25 30 35 40 45 50
Cat
ch in
Num
ber
05
101520253035
10 15 20 25 30 35 40 45 50
Cat
ch in
Num
ber
05
101520253035
10 15 20 25 30 35 40 45 50
Soak Duration (hours)
Cat
ch in
Num
ber
Fig. 11. Catch of large male box crabs for different soak durationby each trap type in Location 1(top - bottom panel: trap type 1-5)

34
Fig. 12. Catch of large male box crabs for different soak duration by eachtrap type in Location 2 (top - bottom panel: trap type 1 - 5)
02468
1012
22 23 24 25 26 27 28
Cat
ch in
Num
ber
02468
1012
22 23 24 25 26 27 28
Cat
ch in
Num
ber
02468
1012
22 23 24 25 26 27 28
Cat
ch in
Num
ber
02468
1012
22 23 24 25 26 27 28
Cat
ch in
Num
ber
02468
1012
22 23 24 25 26 27 28
Soak Duration (hours)
Cat
ch in
Num
ber
35
Fig. 13. Catch of large male box crabs for different soak duration by each traptype in Location 6 (top - bottom panel: trap type 1 - 5)
02468
10
16 18 20 22 24 26
Cat
ch in
Num
ber
02468
10
16 18 20 22 24 26
Cat
ch in
Num
ber
02468
10
16 18 20 22 24 26
Cat
ch in
Num
ber
02468
10
16 18 20 22 24 26
Cat
ch in
Num
ber
02468
10
16 18 20 22 24 26
Soak Duration (hours)
Cat
ch in
Num
ber

36
Fig. 14. Catch of large male box crabs for different soak duration by each traptype in Location 7 (top - bottom panel: trap type 1 - 5)
05
10152025
10 15 20 25
Cat
ch in
Num
ber
05
10152025
10 15 20 25
Cat
ch in
Num
ber
05
10152025
10 15 20 25
Cat
ch in
Num
ber
05
10152025
10 15 20 25
Cat
ch in
Num
ber
05
10152025
10 15 20 25
Soak Duration (hours)
Cat
ch in
Num
ber

37
Fig. 15. Catch of large male box crabs for different soak duration by each traptype in Location 8 (top - bottom panel: trap type 1 - 5)
05
10152025
10 15 20 25 30 35 40 45 50
Cat
ch in
Num
ber
05
10152025
10 15 20 25 30 35 40 45 50
Cat
ch in
Num
ber
05
10152025
10 15 20 25 30 35 40 45 50
Cat
ch in
Num
ber
05
10152025
10 15 20 25 30 35 40 45 50
Cat
ch in
Num
ber
05
10152025
10 15 20 25 30 35 40 45 50
Soak Duration (hours)
Cat
ch in
Num
ber

38
Figure 16: Composition of box crab size at different depth ranges

39
Date Submitted: April 2001
Individual or group requesting advice:(Fisheries Manager/Biologist, Science, SWG, PSARC, Industry, Other
stakeholder etc.)B.Adkins, Shellfish Co-ordinator, FM; DFO/BCFish - SeafoodDiversification Committee, and proposal from Sointula Box Crab andWhelk Association
Proposed PSARC Presentation Date:(outline any timing concerns for the provision of advice)
Next WP review date - Nov 2001
Subject of Paper (title if developed): Brown Box Crab (Lopholithodesforaminatus) Phase 1 Trap Evaluation Study in British Columbia.
Lead Author(s): Ziyang ZhangFisheries Management Author/Reviewer: Dan Clark
Rational for request:(What is the issue, what will it address, importance, etc.)
An unsolicited literature review and proposal for experimental fishing forinformation gathering was supported by Fisheries Renewal BC.
A Phase 0 literature and data review suggested that there was littleinformation on the biology of brown box crabs. Phase 1 field studies weresuggested to define some of the missing biological information usingstandard techniques used in other crab fisheries. These studies were toprovide some of the missing information on box crab and determine a trapconfiguration that could be used in a distributional survey.
A Request For Proposal was advertised to conduct Phase 1 distributionalsurveys and collect biological information. A proposal to conduct a traptest and to collect data on the catch was accepted. Ten days of trapfishing with five trap designs were conducted, biological samples and datacollected.
The relative success of five trap types and biological information needs tobe analysed to define field techniques for investigating the distribution andpopulation of this species. Information gaps for further investigation need
PSARC INVERTEBRATE SUBCOMMITTEE
Request for Working Paper – Brown Box CrabPhase 1 Trap Evaluation Study in British Columbia

40
to be defined. Potential management frameworks for commercialexploitation need to be developed.
Stakeholders Affected: An industry association has been formed (SointulaBox Crab and Whelk Association), First Nations, Coastal Communities
How Advice May Impact the Development of A Fishing Plan:Advice will help define field techniques for a distributional survey andsuggestions for an experimental/adaptive management plan.
Question(s) to be addressed in the Working Paper:(To be developed by initiator)
What information on the parameters that affect the trap catch success forbrown box crabs (bait, soak time, depth, substrate, current) were providedby this study?What trap design (from the five designs tested) would be best to use in adistributional survey?What information was contributed on box crab biology by the trap teststudy?What information gaps on the biology of brown box crabs still need to beaddressed?Can the data from this study provide any advice on designing andmonitoring experimental studies to address information gaps, and thepotential for a commercial fishery?
Objective of Working Paper:(To be developed by FM & StAD for internal papers)
Identify trap design and assessment procedures and an accompanyingexperimental studies that will provide managers with the necessaryinformation on stocks and biology of Brown Box Crab (Lopholithodesforaminatus) to develop management plans that will lead towards andensure long term sustainable harvests.
Timing Issues Related to when Advice in NecessaryAdvice is necessary to respond to proposals to continue investigation intothis species.Studies will be funded from sources outside the department or from saleof catch.The potential for a market has not been investigated.


![Hanks Crab Shack | Louisiana Seafood in Katy Texas · snow crab [Served with corn potato] — Snow Crab Shrimp [Served with corn potato]—.— — Dungeness Crab [Served with corn](https://static.fdocuments.in/doc/165x107/5f90e26740a0b71de11bd623/hanks-crab-shack-louisiana-seafood-in-katy-texas-snow-crab-served-with-corn-potato.jpg)