Evaluation of 3 Hemoglobin A1c Point of Care Instruments ... of 3 Hemogolobin A1c Point of... ·...
6
Clin. Lab. 7+8/2017 1 Clin. Lab. 2017;63:XXX-XXX ©Copyright ORIGINAL ARTICLE Evaluation of 3 Hemoglobin A 1 c Point of Care Instruments. Point of Care Testing for HbA 1 c: Evaluation of Cobas b101, B-Analyst and Afinion™ María de Toro-Crespo, Catalina Sánchez-Mora, Patricia Fernández-Riejos, José M. Maesa-Márquez, Concepción González-Rodríguez Clinic Biochemistry Department, Virgin Macarena University Hospital, Spain SUMMARY Background: The aim of our study was to evaluate three POC instruments for the measurement of glycated hemo- globin (HbA 1 c) (Cobas b101 (Roche Diagnostics ® ), Afinion ™ (Alere Technologies), and B-analyst (Menarini Di- agnostics)), which were compared to G8 (Tosoh ® ) as the reference method. In addition, the inter-assay and intra- assay variability, and linearity of the different techniques were analyzed. Methods: Method comparison was performed according to Clinical and Laboratory Standards Institute (CLSI) EP9-A2 guidelines. We selected 100 samples from the routine laboratory workload and analyzed them in dupli- cate with the three analyzers, as well as with the reference method. The imprecision study was performed accord- ing to CLSI EP5-A2 guidelines for both inter-assay and intra-assay variability. The inter-assay variability was es- timated from aliquots of a sample obtained from a blood pool with an HbA 1 c value of 6.1% as determined by the reference method. To establish linearity, the CLSI EP6-A protocol was followed. Results: Method comparison (95% confidence intervals in parentheses): Passing-Bablok regression between the Cobas b101 and the G8, the slope was 0.886 (0.865, 0.909), y-intercept: 0.80 (0.61, 0.96), r = 0.99 (p < 0.05). Bland- Altman mean difference: -0.0985 (-0.0171, -0.0264). In the case of the Afinion, slope 0.967 (0.938, 1.000), y-inter- cept 0.263 (0.000, 0.475), r = 0.984, Bland-Altman mean difference: 0.0178 (-0.0561, 0.0917) and finally in the case of B-analyst compared to the G8 the slope: 1.036 (1.000, 1.056), y-intercept: -0.14 (-0.30, 0.10), r = 0.996 Bland-Alt- man mean difference: 0.124 (0.0851, 0.162). The values for CV% obtained for Cobas b101, Afinion, and B-Analyst were, respectively, for inter-assay coefficient of variation (CV): 1.92%, 2.13%, 1.34%, for intra-assay CV: 2.06%, 1.13%, 1.79% (low level), and 1.87%, 1.97%, 3.17% (high level). The three methods studied are linear in the test interval. Conclusions: The results of this study show that the Cobas b101, Afinion, and B-analyst instruments present a good correlation with the reference method. In summary, the three POC HbA 1 c devices assessed offer the advan- tages of fast and reliable test results that make their use possible to improve the care of diabetic patients as well as the possibility of establishing early treatment because of their immediate availability. They are therefore consid- ered suitable for the control, but not for the diagnosis of diabetes. (Clin. Lab. 2017;63:xx-xx. DOI: 10.7754/Clin.Lab.2017.161212) Correspondence: María de Toro-Crespo Clinic Biochemistry Department Virgin Macarena University Hospital Avda Doctor Fedriani, 3 41009 Sevilla España Phone: +34 667737451 Email: [email protected] KEY WORDS glycated hemoglobin A 1 c, point of care devices (POC), evaluation _____________________________________________ Manuscript accepted February 14, 2017
Transcript of Evaluation of 3 Hemoglobin A1c Point of Care Instruments ... of 3 Hemogolobin A1c Point of... ·...

Clin. Lab. 7+8/2017 1
Clin. Lab. 2017;63:XXX-XXX ©Copyright
ORIGINAL ARTICLE
Evaluation of 3 Hemoglobin A1c Point of Care Instruments. Point of Care Testing for HbA1c: Evaluation of Cobas b101, B-Analyst
and Afinion™
María de Toro-Crespo, Catalina Sánchez-Mora, Patricia Fernández-Riejos, José M. Maesa-Márquez, Concepción González-Rodríguez
Clinic Biochemistry Department, Virgin Macarena University Hospital, Spain
SUMMARY Background: The aim of our study was to evaluate three POC instruments for the measurement of glycated hemo-globin (HbA1c) (Cobas b101 (Roche Diagnostics®), Afinion ™ (Alere Technologies), and B-analyst (Menarini Di-agnostics)), which were compared to G8 (Tosoh®) as the reference method. In addition, the inter-assay and intra-assay variability, and linearity of the different techniques were analyzed. Methods: Method comparison was performed according to Clinical and Laboratory Standards Institute (CLSI) EP9-A2 guidelines. We selected 100 samples from the routine laboratory workload and analyzed them in dupli-cate with the three analyzers, as well as with the reference method. The imprecision study was performed accord-ing to CLSI EP5-A2 guidelines for both inter-assay and intra-assay variability. The inter-assay variability was es-timated from aliquots of a sample obtained from a blood pool with an HbA1c value of 6.1% as determined by the reference method. To establish linearity, the CLSI EP6-A protocol was followed. Results: Method comparison (95% confidence intervals in parentheses): Passing-Bablok regression between the Cobas b101 and the G8, the slope was 0.886 (0.865, 0.909), y-intercept: 0.80 (0.61, 0.96), r = 0.99 (p < 0.05). Bland-Altman mean difference: -0.0985 (-0.0171, -0.0264). In the case of the Afinion, slope 0.967 (0.938, 1.000), y-inter-cept 0.263 (0.000, 0.475), r = 0.984, Bland-Altman mean difference: 0.0178 (-0.0561, 0.0917) and finally in the case of B-analyst compared to the G8 the slope: 1.036 (1.000, 1.056), y-intercept: -0.14 (-0.30, 0.10), r = 0.996 Bland-Alt-man mean difference: 0.124 (0.0851, 0.162). The values for CV% obtained for Cobas b101, Afinion, and B-Analyst were, respectively, for inter-assay coefficient of variation (CV): 1.92%, 2.13%, 1.34%, for intra-assay CV: 2.06%, 1.13%, 1.79% (low level), and 1.87%, 1.97%, 3.17% (high level). The three methods studied are linear in the test interval. Conclusions: The results of this study show that the Cobas b101, Afinion, and B-analyst instruments present a good correlation with the reference method. In summary, the three POC HbA1c devices assessed offer the advan-tages of fast and reliable test results that make their use possible to improve the care of diabetic patients as well as the possibility of establishing early treatment because of their immediate availability. They are therefore consid-ered suitable for the control, but not for the diagnosis of diabetes. (Clin. Lab. 2017;63:xx-xx. DOI: 10.7754/Clin.Lab.2017.161212) Correspondence: María de Toro-Crespo Clinic Biochemistry Department Virgin Macarena University Hospital Avda Doctor Fedriani, 3 41009 Sevilla España Phone: +34 667737451 Email: [email protected]
KEY WORDS
glycated hemoglobin A1c, point of care devices (POC), evaluation _____________________________________________ Manuscript accepted February 14, 2017

M. de Toro-Crespo et al.
Clin. Lab. 7+8/2017 2
INTRODUCTION Diabetes mellitus, especially type 2 diabetes (DM2), is a chronic disease that represents an important public health problem, not only because of its high prevalence and incidence, but also because it is associated whith high morbidity and mortality rates [1]. Since 1977, HbA1c (glycated hemoglobin) has been a useful tool for metabolic control in patients with diabe-tes mellitus [2] as it makes it possible to assess the risk of developing micro- and macro-complications associat-ed with the disease [3]. In January 2014, the American Diabetes Association (ADA) updated its criteria and in-cluded an HbA1c value ≥ 6.5% (48 mmol/mol) [4] for the diagnosis of diabetes, the HbA1c value makes it pos-sible to estimate the probability of developing compli-cations, as well as the need for therapeutic changes. Different programs, such as the National Glycohemo-globin Standardization Program (NGSP), the HbA1c harmonization program, and the IFCC Working group for standardization of HbA1c, have made it possible to reach a consensus on the development of well-defined reference measurement procedures as well as primary reference materials [5]. In September 2007, the ADA, the International Diabetes Federation (IDF), the European Association for the Study of Diabetes (EASD), and the International Feder-ation of Clinical Chemistry (IFCC) [6] published a Con-sensus Document which included different points about general standardization and the issue of analytical re-sults for HbA1c. Among other measures, it was decided to use the method suggested by the IFCC to calibrate different techniques for the determination of HbA1c, as well as deliver the results in traceable units to the Dia-betes Control and Complications Trial (DCCT) (Nation-al Glycohemoglobin Standardization Program [NGSP], %) and in IFCC units (mmol/mol). Various techniques have been developed for point of care instruments (POC). The advantages offered by them are obvious and include simplification of the ad-ministrative procedures and hospital circuits, the rapid availability of results, and the simple management of the measuring instrument enabling use by professionals not experienced in laboratory techniques. In addition since 2006, the Standards of Medical Care in Diabetes (ADA) indicate that the measurement of HbA1c using POC analyzers provides the opportunity to make suitable treatment changes during the visit itself [4,5,7,8]. The performance of NGSP certified POC instruments, in comparison to the methods used in a conventional laboratory, have been cause of concern. Over the last few years different assessments have been made of POC instruments for determining HbA1c and this has shown an improvement in units that did not previously meet quality specifications [9-11]. The purpose of our study is to assess three POC ana-lyzers for measuring HbA1c; Cobas b101 (Roche Diag-nostics®), Afinion™ (Alere Technologies), and B-ana-
lyst (Menarini Diagnostics). We have compared the results obtained with POC ana-lyzers with our laboratory HPLC reference method, G8 (Tosoh®) that uses the validated method of cation ex-change high performance liquid chromatography (HPLC). Furthermore, an analysis was made of the in-ter-assay and intra-assay variability and the linearity of the different techniques.
MATERIALS AND METHODS
This study used three POC HbA1c analyzers: Cobas b101 (Roche Diagnostics), Afinion™ (Alere Technolo-gies), and B-analyst (Menarini Diagnostics) which were compared to G8 (Tosoh®) as the reference method. The Cobas b101 (Roche Diagnostics) uses the latex ag-glutination inhibition immunoassay technique with re-sults available in 5 minutes, Afinion™ (Alere Technol-ogies) is based on separation by affinity to boronate and the results are obtained in 3 minutes, and B-analyst (Menarini Diagnostics) is based on turbidimetric latex agglutination inhibition immunoassay with results avail-able in 8 minutes. The reference instrument is a G8 unit (Tosoh®) that uses HPLC columns with cation exchange resin. All the methods are standardized as per the IFCC refer-ence procedure. The instruments were calibrated ac-cording to the manufacturers' specifications and subject to daily control with two, high and low, quality control levels provided by the manufacturers. The analytical results were compared as described in protocol EP9-A2 CLSI [12]. The samples used were ob-tained from the routine Biochemistry Laboratory of Vir-gin Macarena University Hospital and four concentra-tion ranges were selected: 4 - 6% HbA1c, 6 - 8% HbA1c, 8 - 10% HbA1c y > 10% HbA1c. All these sam-ples were analyzed by the units being assessed and by the reference unit. Variability The intra- and inter-assay variability was determined as described in protocol CLSI EP5-A2 [13]. The inter-as-say variability was estimated from aliquots of a sample obtained from a blood pool with an HbA1c value of 6.1% as determined by the reference method and frozen to -80°C for up to one month. Measurements were made in the analizers being assessed over 20 consecutive days. Afinion only accepts samples that are not hemo-lyzed and have not been frozen so in this case the inter-assay variability was determined from the quality con-trol data provided by the manufacturer, with a target value of 6.2% HbA1c. The intra-assay variability was estimated from two pa-tient samples, high and low HbA1c values (12% and 4.4%, respectively) that were processed twenty consec-utive times using the same work routine on the same day.

Evaluation of 3 Hemoglobin A1c Point of Care Instruments: Cobas b101, B-Analyst, and Afinion™
Clin. Lab. 7+8/2017 3
Table 1. Passing-Bablok regression of the data obtained with Cobas b101, Afinion and B- analyst compared to G8.
Slope 95% confidence
interval Y-intercept
95% confidence interval
r
Cobas b101 0.886 0.865, 0.909 0.80 0.61, 0.96 0.990
Afinion 0.967 0.938, 1.000 0.263 0.000, 0.475 0.984
B-analyst 1.036 1.000, 1.056 -0.14 -0.30, -0.10 0.996
Table 2. Bland-Altman plot of the data obtained with Cobas b101, Afinion, and B- analyst compared to G8.
Mean difference Confidence interval (95%)
Cobas b101 -0.0985 -0.0171, -0.0264
Afinion 0.0178 -0.0561, 0.0917
B-analyst 0.124 0.0851, 0.162 Table 3. Intra- and inter-assay variability of the data obtained with Cobas b101, Afinion and B-analyst.
Intra-assay variability Inter-assay variability
Mean value
HbA1c %
Standard deviation CV%
Mean value
HbA1c %
Standard deviation CV%
Mean value
HbA1c %
Standard deviation CV%
Cobas b101 11.12 0.21 1.92 5.51 0.11 2.06 6.23 0.11 1.87
Afinion 14.23 0.30 2.13 4.72 0.05 1.13 6.42 0.12 1.97
B-analyst 12.01 0.16 1.34 4.49 0.08 1.79 5.84 0.18 3.17 Linearity The linearity was determined by making duplicate as-says of a mixture of two samples with the same amount of hemoglobin obtained from patients, one in the high range with a value of 14.6% HbA1c and the other in the low range of 4.5% HbA1c in the following proportions: 4:0, 3:1; 2:2, 1:3, 0:4, as described in protocol EP6-CLSI [14]. Statistical analysis The methods were compared and the correlation assess-ed using Passing-Bablok non-parametric regression and calculating Pearson’s coefficient of correlation (r) to de-termine the confidence intervals for p < 0.05. The bias was estimated using a Bland-Altman dispersion plot. The coefficients of variation (CV %) to estimate intra- and inter-assay variability were also calculated. The da-ta analysis and statistical calculations were performed using Excel and Method Validator.
RESULTS
The first comparison was between Cobas b101 (Roche Diagnostics, Afinion™ (Alere Technologies), B-analyst (Menarini Diagnostics) and G8 (Tosoh®) as the refer-ence method. After analyzing the values for glycated hemoglobin in the patient samples, there were no outliers for any of the three units. We are therefore working with 100 samples distributed in four HbA1c ranges: 4% to 6% (20 - 42 mmol/mol), 6% to 8% (42 - 64 mmol/mol), 8% to 10% (64 - 86 mmol/mol) and > 10% (> 86 mmol/mol). Applying Passing-Bablok regression (Table 1, Figure 1) between the Afinion and the G8 results in a slope of 0.967 with a 95% confidence interval (0.938 - 1.000) and a y-intercept: 0.263, confidence interval (0.000, 0.475), and the coefficient of correlation r: 0.984. In the case of B-analyst compared to the G8 results in a slope of 1.036 (1.000, 1.056), y-intercept: -0.14 (-0.30, 0.10), r = 0.996 (p < 0.05), and finally in the case of the Cobas b101 the slope was 0.886 (0.865, 0.909), y-intercept: 0.80 (0.61, 0.96), r = 0.99 (p < 0.05).
M. de Toro-Crespo et al.
Clin. Lab. 7+8/2017 4
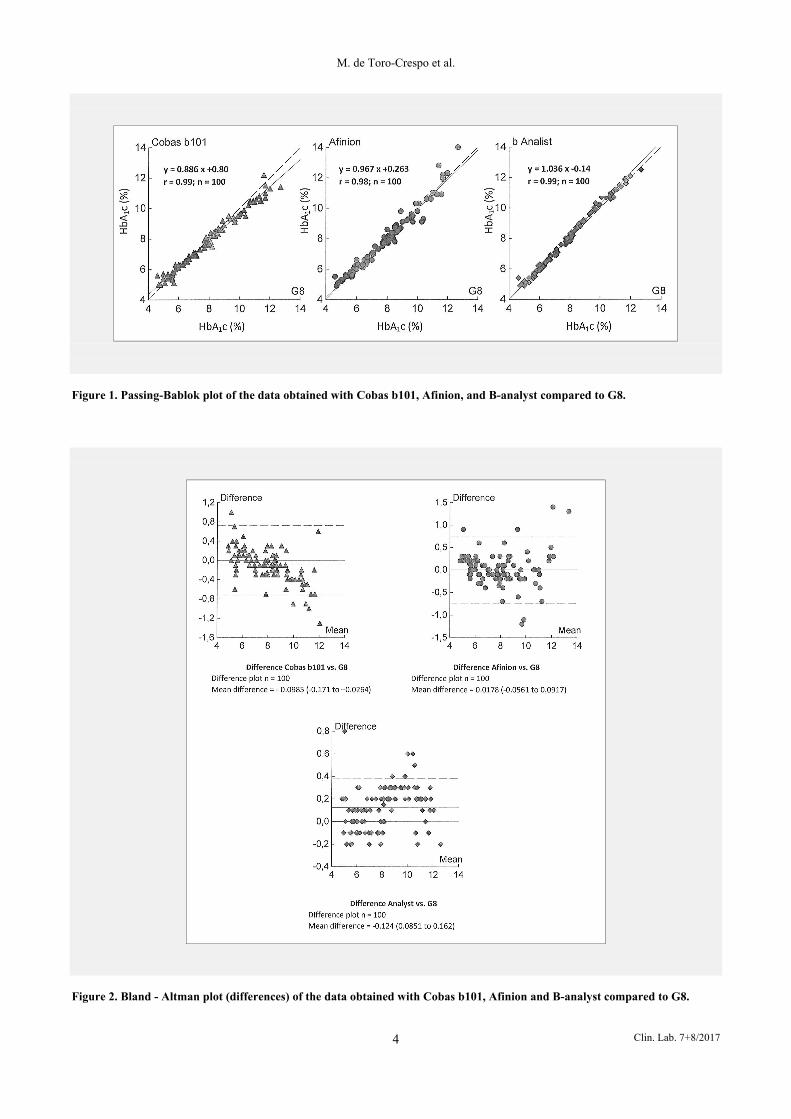
Figure 1. Passing-Bablok plot of the data obtained with Cobas b101, Afinion, and B-analyst compared to G8.
Figure 2. Bland - Altman plot (differences) of the data obtained with Cobas b101, Afinion and B-analyst compared to G8.

Evaluation of 3 Hemoglobin A1c Point of Care Instruments: Cobas b101, B-Analyst, and Afinion™
Clin. Lab. 7+8/2017 5
Figure 3. Plot of the linearity of the different methods from data obtained with Cobas b101, Afinion, and B-analyst compared to the theoretical HbA1c concentrations. A study of the differences between the HbA1c measure-ments is shown in Figure 2 and Table 2. The mean dif-ference between Afinion and G8 was 0.0178 (-0.0561, 0.0917), between B-analyst® and G8 0.124 (0.0851, 0.162), and in the case of the Cobas b101, -0.0985 (-0.0171, -0.0264), in all three cases with a 95% confi-dence interval. The values for CV% obtained for Cobas b101, Afinion, and B-Analyst for in intra-assay variability were 1.92, 2.13, and 1.34, respectively, in the case of samples with high HbA1c value = 12% and in the case of samples with a low HbA1c value = 4.4% they were 2.06, 1.13, and 1.79, respectively. The inter-assay variability for an HbA1c value of 6.1% were 1.87, 1.97, and 3.17%, re-spectively, (Table 3). The three methods studied are linear in the test interval (Figure 3), even though when performing the assess-ment we noted that for the last dilution, corresponding to the 14.6% HbA1c high value sample, no value for glycated hemoglobin was obtained with any of the three units.
DISCUSSION
Considerable effort is being made for POC methods for determining HbA1c toward their technological develop-ment and this has resulted in considerable improve-ments in the analytical performance of these devices, as shown by Lenters-Westra et al. [10]. The results of this study show that the Cobas b101, Afinion, and B-analyst instruments present a good cor-relation with the reference method. Direct observation of the straight lines plotted using Passing-Bablok re-gression shows that there is a very high degree of con-cordance between the three units and good linear corre-
lation with the laboratory reference method. These re-sults agree with those reported earlier for Afinion and B-analyst [10,15,16]. By checking thoroughly the slope and intercept data from the Passing Bablok regression, we can conclude that Afinion is comparable to G8 while b-Analyst and Cobas b 101 are not. The results obtained after Bland-Altman analysis of the units studied and the reference method shows that the differences are minimal, ranging between -0.0985 in the case of the Afinion and 0.124 in that of the B-analyst, indicating only slight differences between methods. As it can be seen from the Passing Bablok regression as well as the Bland-Altman plot, Afinion is comparable to G8 while b-Analyst and Cobas b101 show a concentra-tion dependent variation. The units assessed show a within-run imprecision of 2.1% or less for all three analyzers when, according to generally accepted performance criteria for the determi-nation of HbA1c, an acceptable imprecision is consid-ered to be < 3% [10] with only B-analyst presenting a slightly higher value of 3.1%. Although it is unusual that inter-assay-CVs are lower than intra-assay CVs, the slight differences maybe can be explained by the fact that the samples used to intra-assay CVs had more ex-treme values (4% and 12 % HbA1c values) and thus the linearity is weaker than in the case of inter-assay CVs (6.1% HbA1c value). Assessment of the performance of the three POC ana-lyzers showed bias and imprecision values compatible with the clinical use of HbA1c for controlling and moni-toring diabetic patients in accordance with NGSP rec-ommendations. Nevertheless, the bias and imprecision are not low enough to recommend the use of POC HbA1c for diagnostic purposes as suggested by an ear-lier study by Lenters-Westra et al. [9,10].

M. de Toro-Crespo et al.
Clin. Lab. 7+8/2017 6
CONCLUSION
In summary, the three POC HbA1c devices assessed of-fer the advantages of fast and reliable test results that making it possible to improve the care of diabetic pa-tients as well as the possibility of establishing early treatment because of their immediate availability. They are therefore considered suitable for the control, but not for the diagnosis of diabetes [15,17]. Ethics: Due to the study design, there was no need for a state-ment of ethics. Declaration of Interest: The authors declare that they have no conflicts of inter-est. References: 1. Shaw JE, Sicree RA, Zimmet PZ. Global estimates of the preva-
lence of diabetes for 2010 and 2030. Diabetes Res Clin Pract. 2010 Jan;87(1):4-14 (PMID: 19896746).
2. Gonen B, Rochman H, Rubenstein A, Tanega S, Horwitz D. He-moglobin a1: an indicator of the metabolic control of diabetic pa-tients. Lancet. 1977;Oct 8;2(8041):734-7 (PMID: 71541).
3. Hoelzel W, Weykamp C, Jeppsson JO, et al. IFCC reference sys-tem for measurement of hemoglobin A1c in human blood and the national standardization schemes in the United States, Japan, and Sweden: a method-comparison study. Clin Chem. 2004 Jan; 50(1):166-74 (PMID: 14709644).
4. American Diabetes Association. Standards of medical care in dia-betes. 2014. Diabetes Care. 2014 Jan 1;37 Suppl 1:S14-80 (PMID: 24357209).
5. Cagliero E, Levina EV, Nathan DM. Immediate feedback of HbA1c levels improves glycemic control in type 1 and insulin-treated type 2 diabetic patients. Diabetes Care. 1999 Nov;22(11): 1785-9 (PMID: 10546008).
6. Consensus statement on the worldwide standardisation of the HbA1c measurement. Diabetologia. 2007 Oct;50(10):2042-3 (PMID: 17712546).
7. Miller CD, Barnes CS, Phillips LS, et al. Rapid A1c Availability Improves Clinical Decision-Making in an Urban Primary Care Clinic. Diabetes Care. 2003 Apr 1;26(4):1158-63 (PMID: 1266 3590).
8. Ferenczi A, Reddy K, Lorber DL. Effect of immediate hemoglo-bin A1c results on treatment decisions in office practice. Endocr Pract. Jan;7(2):85-8 (PMID: 11421550).
9. Lenters-Westra E, Slingerland RJ. Six of Eight Hemoglobin A1c Point-of-Care Instruments Do Not Meet the General Accepted Analytical Performance Criteria. Clin Chem. 2010 Jan 1;56(1): 44-52 (PMID: 19926777).
10. Lenters-Westra E, Slingerland RJ. Three of 7 Hemoglobin A1c Point-of-Care Instruments Do Not Meet Generally Accepted Ana-lytical Performance Criteria. Clin Chem. 2014 Aug 1;60(8):1062-72 (PMID: 24865164).
11. Little RR. Performance of hemoglobin A1c assay methods: Good enough? Clin Chem. 2014 Aug;60(8):1031-3 (PMID: 24938751).
12. Clinical and Laboratory Standards Institute. Method comparison and bias estimation using patients samples; approved guideline. Document EP9-A2 (2nd ed.) CLSI, Pennsylvania.
13. Clinical and Laboratory Standards Institute. Evaluation of preci-sion performance of quantitative measurements methods, ap-proved guideline. Document EP5-A2. CLSI, Pennsylvania.
14. Clinical and Laboratory Standar Institute. EP 06 Evaluation of the linearity of quantitative measurement procedures: A statistical ap-proach. April 2003. Approved guideline. CLSI, Pennsylvania.
15. Sánchez-Mora C, S Rodríguez-Oliva M, Fernández-Riejos P, et al. Evaluation of two HbA1c point-of-care analyzers. Clin Chem Lab Med. 2011 Apr 1;49(4):653-7 (PMID: 21323623).
16. Menendez-Valladares P, Fernandez-Riejos P, Sanchez-Mora C, Perez-Perez A, Sanchez-Margalet V, Gonzalez-Rodriguez C. Evaluation of a HbA1c point-of-care analyzer. Clin Biochem. 2015 Jul;48(10-11):10-3 (PMID: 25835152).
17. Hanas R, John G; International HbA Consensus Committee. 2010 consensus statement on the worldwide standardization of the he-moglobin A1C measurement. Diabetes Care. 2010 Aug;33(8): 1903-4 (PMID: 20636952).