
Evaluation and Recommendation of Mix Design for Emulsion ...
116
University of Texas at El Paso DigitalCommons@UTEP Open Access eses & Dissertations 2011-01-01 Evaluation and Recommendation of Mix Design for Emulsion Stabilized Bases Samuel Franco University of Texas at El Paso, [email protected] Follow this and additional works at: hps://digitalcommons.utep.edu/open_etd Part of the Civil Engineering Commons , and the Transportation Commons is is brought to you for free and open access by DigitalCommons@UTEP. It has been accepted for inclusion in Open Access eses & Dissertations by an authorized administrator of DigitalCommons@UTEP. For more information, please contact [email protected]. Recommended Citation Franco, Samuel, "Evaluation and Recommendation of Mix Design for Emulsion Stabilized Bases" (2011). Open Access eses & Dissertations. 2284. hps://digitalcommons.utep.edu/open_etd/2284
Transcript of Evaluation and Recommendation of Mix Design for Emulsion ...

University of Texas at El PasoDigitalCommons@UTEP
Open Access Theses & Dissertations
2011-01-01
Evaluation and Recommendation of Mix Designfor Emulsion Stabilized BasesSamuel FrancoUniversity of Texas at El Paso, [email protected]
Follow this and additional works at: https://digitalcommons.utep.edu/open_etdPart of the Civil Engineering Commons, and the Transportation Commons
This is brought to you for free and open access by DigitalCommons@UTEP. It has been accepted for inclusion in Open Access Theses & Dissertationsby an authorized administrator of DigitalCommons@UTEP. For more information, please contact [email protected].
Recommended CitationFranco, Samuel, "Evaluation and Recommendation of Mix Design for Emulsion Stabilized Bases" (2011). Open Access Theses &Dissertations. 2284.https://digitalcommons.utep.edu/open_etd/2284

EVALUATION AND RECOMMENDATION OF MIX DESIGN FOR
EMULSION STABILIZED BASES
SAMUEL FRANCO
Department of Civil Engineering
APPROVED:
Soheil Nazarian, Ph.D., Chair
Vivek Tandon, Ph.D.
Peter Golding, Ph.D.
Benjamin C. Flores, Ph.D. Interim Dean of the Graduate School

Copyright
by
Samuel Franco
2011

Dedication
There are a number of people whom without; this thesis would not have been possible. First and foremost I would like to thank God for the many blessings I have in my life. If it were not for all that he has given me none of this would be possible. I would like to thank my mother and father, Mary S. and Guillermo D. Franco (may the latter rest in peace). Their unwavering faith in their
children has always been a guiding light for me. They instilled a respect for education and knowledge that has led me down the path I am on today. I would also like to thank my three
siblings Guillermo Jr, Eduardo, and Patricia Marie who were very supportive of me throughout all of my time spent at UTEP. I am certain that we could take a 3 month family vacation around the globe staying at the Four Seasons every night on just the interest from the loans they granted
me during college. And finally, I would like to thank all my friends who were very understanding on those occasions when I could not spend time with them, yet were always there
after finals with a much welcomed “cold one”.
EVALUATION AND RECOMMENDATION OF MIX DESIGN FOR
EMULSION STABILIZED BASES
by
SAMUEL FRANCO, B.S.C.E.
THESIS
Presented to the Faculty of the Graduate School of
The University of Texas at El Paso
in Partial Fulfillment
of the Requirements
for the Degree of
MASTER OF SCIENCE
Department of Civil Engineering
THE UNIVERSITY OF TEXAS AT EL PASO
May 2012

v
Acknowledgements
The author as well as the rest of the research team would like to express their sincere
appreciation to the Project Management Committee of this project, consisting of Mykol Woodruff,
Bobby Littlefield, Jr., Caroline Herrera, Miguel Arellano, Paul Jungen, Ken Dirksen and K.C. Evans for
their support. We are grateful to a number of TxDOT district personnel, especially Eric Hall, Gregory
Biediger, Gilbert Davila and Peter Groff in San Antonio District, Buster Sanders and Mike Podd in
Amarillo District and John Clark in Yoakum District for their assistance in material collection and field
testing.
We are also grateful to CEMEX of El Paso and Martin Marietta Materials of San Antonio for
their continuous donations of materials used in this research project. We appreciate the help from Mr.
Guillermo Marquez and the many other research assistants at CTIS of the University of Texas at El
Paso.

vi
Abstract
Asphalt emulsion has been used for base material stabilization in a few TxDOT districts. Results
from these practices were quite different. The initial performance of two projects on US287 constructed
around 2000 in the Amarillo District has been found to be satisfactory. However, the Yoakum District
has reported problems with asphalt emulsion for base work in a project on FM 237. The preliminary
conclusion from these trials has been that asphalt emulsion may not perform well in the high
humidity/high rainfall areas like east Texas. On the other hand, using calcium-based additives to
stabilize base courses in road construction has been a common practice in most TxDOT districts. It is
expected that the blend of calcium-based additives with asphalt emulsion (dual stabilization) will
produce a base which has an optimum combination of strength, stiffness, moisture resistance and
flexibility. In this case, the calcium-based stabilizer may reduce the plasticity of the base fines making it
a more friable material that accepts well the blending with emulsions. TxDOT has drafted a special
specification for the use of asphalt emulsions treatment in road mixing. In this project, the trial version
of the TxDOT special specification is evaluated. The output of this research project includes: laboratory
test procedure for mix design with dual stabilization, a guideline for the construction of bases with dual
stabilization, and results from a series of parametric studies that show which parameters may have
significant impacts on the engineering properties of emulsion-treated base materials and on the
performance of emulsion-treated bases.

vii
Table of Contents
Acknowledgements......................................................................................................................................v
Abstract.......................................................................................................................................................vi
Table of Contents...................................................................................................................................... vii
List of Tables ...............................................................................................................................................x
List of Figures.............................................................................................................................................xi
Chapter 1 - Introduction...............................................................................................................................1
1.1 Background...................................................................................................................................1
1.2 Objective.......................................................................................................................................2
1.3 Organization of Report .................................................................................................................3
Chapter 2 - Literature Review .....................................................................................................................4
2.1 Full-Depth Reclamation................................................................................................................4
2.2 Stabilizers Used for FDR Process.................................................................................................6
2.2.1Asphalt Emulsion...............................................................................................................6
2.2.2 Portland Cement ...............................................................................................................7
2.2.3 Lime..................................................................................................................................7
2.3.4 Fly Ash..............................................................................................................................8
2.4 Mix Design Parameters.................................................................................................................8
2.5 Collection of Road Samples .........................................................................................................8
2.5 Material Characterization of Road Samples .................................................................................9
2.6 Emulsion Selection .......................................................................................................................9
2.7 Optimum Emulsion Content .......................................................................................................10
2.8 Water Content .............................................................................................................................10
2.9 Overview of Various Mix Designs .............................................................................................11
2.9.1 Missouri ..........................................................................................................................11
2.9.3 Maine ..............................................................................................................................12
2.9.4 Chevron...........................................................................................................................12
2.10 Strength Characteristics ............................................................................................................13
2.11 Climactic Conditions ................................................................................................................14
2.12 Curing Time..............................................................................................................................15

viii
Chapter 3 - Overview of Procedures Used in Texas..................................................................................17
3.1 Introduction.................................................................................................................................17
3.2 TxDOT........................................................................................................................................17
3.3 SEM Materials ............................................................................................................................19
Chapter 4 - Laboratory Testing – Initial Mix Design ................................................................................22
4.1 Introduction.................................................................................................................................22
4.2 Material Selection.......................................................................................................................22
4.3 Aggregates Properties.................................................................................................................23
4.4 Specimen Preparation .................................................................................................................27
4.5 Selection of Optimum Total Liquid Content ..............................................................................27
4.6 Strengths of Specimens with Emulsion Only .............................................................................30
4.7 Comparison of Strengths with Dual Stabilizer and Other Options.............................................35
4.8 Moisture Conditioning Testing...................................................................................................39
4.9 Resilient Modulus Test ...............................................................................................................44
4.10 Optimum Mix Designs .............................................................................................................47
Chapter 5 - Laboratory Testing – Parametric Studies ...............................................................................48
5.1 Introduction.................................................................................................................................48
5.2 Impact of Gradation....................................................................................................................48
5.3 Impact of Emulsion Type ...........................................................................................................50
5.4 Impact of Mixing Method...........................................................................................................54
5.5 Impact of Compaction Method...................................................................................................59
Chapter 6 - Preliminary Guideline.............................................................................................................63
6.1 Introduction.................................................................................................................................63
6.2 Sampling and Preparation of Material ........................................................................................63
6.3 Determination of OMC and TLC ...............................................................................................63
6.4 optimum Emulsion content for strength .....................................................................................68
6.5 Addition of Calcium-Based Additive .........................................................................................68
Chapter 7 - Observations and Recommendations......................................................................................70
7.1 Introduction.................................................................................................................................70
7.2 Mix Design Selection Based on Results from IDT Testing .......................................................70
7.3 Moisture Susceptibility Testing..................................................................................................70
7.4 Initial Mixing Water Content......................................................................................................71
7.5 Misleading Modulus Results ......................................................................................................71

ix
7.6 Parametric Study Results............................................................................................................71
References..................................................................................................................................................73
Appendix A: Special Specification Emulsion Treatment Road Mixed (by TxDOT)................................75
Appendix B: Mix design Procedure – Emulsion Treatment Road Mixed (By Sem Materials) ................84
Appendix C: Preliminary Guideline for Mix Design and Lab Testing of Dual Stabilized Bases .............93
Appendix D: Mix Design Flowchart .........................................................................................................97
Appendix E: Emulsion Analysis Tool Manual ..........................................................................................99
Curriculum Vita .......................................................................................................................................104

x
List of Tables
Table 2.1 - MoDOT Min Strength Requirements......................................................................................11 Table 3.1 – Laboratory Mix Design Properties and Testing Methods ......................................................18 Table 4.1 – Gradation, Soil Classification and Atterberg Limits of Raw Base Materials.........................23 Table 4.2 – AIVs of Materials along with Gradations after Testing .........................................................26 Table 4.3 – ACVs of Materials along with Gradations after Testing........................................................27 Table 4.5 – Testing Matrix to Evaluate TLC/Moisture/Strength Relationship .........................................28 Table 4.6 - Final Mix Designs and Properties for Materials under Study.................................................47 Table 5.1 - Gradations Used in This Study................................................................................................49 Table 5.2 – Changes in Gradation due to High-Shear Mixing ..................................................................58

xi
List of Figures
Figure 2.1 – Specifications of Chevron USA, Inc. for Mix Design (after Epps, 1990) ............................13 Figure 3.1 – Initial Emulsion Contents Suggested by SEM’s Procedure ..................................................20 Figure 4.1 – Global Gradation Curves for materials Used in Preparing Specimens .................................24 Figure 4.2 – Test Apparatuses for Aggregate Impact Value (Left) and Aggregate Crushing Value (Right)........................................................................................................................................................25 Figure 4.3 – Variations in Density with Total Liquid Content at Different Initial Water Contents..........29 Figure 4.4 – Unconfined Compressive Strengths for Materials with Different Moisture and Emulsion Contents .....................................................................................................................................................32 Figure 4.5 - Indirect Tensile Strengths for Materials with Different Moisture and Emulsion Contents...33 Figure 4.6 – Variations in Strains at Failure with Different Moisture and Emulsion Contents ................34 Figure 4.7 - Retained Indirect Tensile Strengths .......................................................................................35 Figure 4.8- Unconfined Compressive Strengths for El Paso and Yoakum Materials ...............................37 Figure 4.9- Indirect Tensile Strengths for El Paso and Yoakum Materials...............................................38 Figure 4.10 – Dielectric Constants for Materials with Different Moisture and Emulsion Contents from TST Specimens..........................................................................................................................................40 Figure 4.11 – Retained Strengths for Materials with Different Moisture and Emulsion Contents from TST Specimens..........................................................................................................................................41 Figure 4.12 - Seismic Moduli for Materials with Different Moisture and Emulsion Contents from UCS Specimens ..................................................................................................................................................42 Figure 4.13 - Retained Moduli for Materials with Different Moisture and Emulsion Contents from TST...................................................................................................................................................................43 Figure 4.14 – Resilient Modulus Test Device and Setup ..........................................................................45 Figure 4.15 – Resilient Moduli of El Paso and San Antonio Materials from Specimens Prepared at Designed Total Liquid Contents................................................................................................................46 Figure 5.1 - Gradation Curves of Four Mixes from El Paso Material .......................................................49 Figure 5.2 – Impact of Gradation on Strength of Different El Paso and San Antonio Mixes ...................51 Figure 5.3 – Impact of Gradation on FFRC Modulus of Different El Paso and San Antonio Mixes .......52 Figure 5.4 - Impact of Emulsion Type on Strength Parameters ................................................................53 Figure 5.5 – Impact of Mixing Method on Strength Parameters ...............................................................56 Figure 5.6 – Impact of Mixing Method on FFRC Modulus ......................................................................57 Figure 5.7 – Appearances of Specimens Mixed with High-Shear Mixer (Left) and.................................58 Concrete Mixer (Right)..............................................................................................................................58 Figure 5.8 – Impact of Compaction Method on Dry Density....................................................................60 Figure 5.9 – Impact of Compaction Method on Strength Parameters .......................................................61 Figure 5.10 – Impact of Compaction Method on FFRC Modulus ............................................................62 Figure 6.1 –Constituents of an Emulsion Treated Base ............................................................................66 Figure 6.2 – Example Variation in Mixing Moisture Content with Maximum Allowable Emulsion Content.......................................................................................................................................................67

1
Chapter 1 - Introduction
1.1 BACKGROUND
Rehabilitation of highway pavements through full-depth reclamation (FDR) is a cost-effective
option that reduces the use of virgin base aggregates and eliminates the effort as well as cost associated
with disposal of the old aggregates. The process of FDR consists of in-place cold grinding of the
existing asphalt along with a predetermined amount of unbound granular base material, stabilizing the
material with additives and compacting the new layer to a proper density level. FDR can be used to treat
a wide range of problems, particularly problems related to weak base courses or pavements with
insufficient structural capacity. If designed and implemented properly, this process is capable of
rectifying deep rutting problems, reflective fatigue and thermal cracking, deterioration of pavements due
to maintenance patching and deterioration of ride quality caused by depressions and heaving.
Using calcium-based additives (cement, lime or fly ash) to stabilize base courses has been a
common practice in road construction and rehabilitation through FDR. The strengths and weaknesses of
each additive have been well documented. One other common stabilizer used in the FDR process is
asphalt emulsion. It has been found that the bituminous based mixture tends to enhance the mechanical
properties of the aggregate skeleton. The residual asphalt in an emulsified base selectively adheres to the
smaller particles forming binding mastic which in turn binds the larger particles together. The granular
matrix in the emulsified base has similar internal friction as hot mix asphalt when compacted under
optimum total liquid content, defined as the total amount of added water plus asphalt emulsion.
Therefore, it is expected that the dual stabilization, blend of calcium-based additives with asphalt
emulsion, will produce a base which has an optimum combination of strength, stiffness, moisture
resistance and flexibility.
Currently, there are some uncertainties that need to be addressed when using asphalt emulsion
alone or the blend of calcium-based additives with asphalt emulsion as stabilizers in FDR. These
include:

2
• Determining the optimum mix design to ensure that the recycled materials are properly
coated with the additive
• Establishing the proper laboratory procedure/protocols to achieve the optimum mix
design
In addition, curing time is another issue that has not been adequately evaluated. In most cases,
the curing time is based on an arbitrary number of days for which the recycled base should be left open
before surfacing and is not related to any criteria or test that measures the development of strength with
time. In the past, contractors have relied heavily on guidelines from product and equipment
manufacturers to address this subject. Hence, there is always an unknown element in the design and
construction process with different contractors having their own methods to achieve each. Good results
are not necessarily guaranteed when different materials at different climatic zones are used. This report
represents the results from a systematic study on these matters.
1.2 OBJECTIVE
The main objective of this research project is to develop a laboratory test protocol for selecting
the correct combination of additives for dual stabilization. To achieve this goal, the following tasks
were proposed and completed. The first task of the project was to perform an information search
relevant to the use of emulsion or dual stabilized bases. The information search included the current
practices with regard to mix design and construction for these types of base materials. The second task
required the selection of sites ready for construction to acquire materials for use in the study as well as
the strength and performance of emulsion stabilized projects under realistic conditions. The third task
was to select the amount and type of additives to be used in a parametric study of the selected materials.
This task included an in-depth investigation on the effects of emulsion quantity as well as initial mixing
water to be added to these types of materials. Also included in this task was an investigation into
whether or not the addition of a cementitious additive should be introduced into the emulsion stabilized
base. Task 4 was to establish laboratory testing procedures. In order to do so, a number of parametric
studies were performed to gain a better understanding of the factors that affect strength and modulus of

3
the materials. A preliminary guideline for laboratory testing and mix design procedures was developed
in Task 5 of this project.
1.3 ORGANIZATION OF REPORT
Chapter two contains a summary of the literature review and information search on the FDR
process, additives used for FDR, consideration of mix design parameters and the effects of climactic
conditions emulsion-treated bases. Chapter three provides a general overview of the testing procedures
provided by TxDOT and SemMaterials. Both of them were closely scrutinized during the extent of this
project. The fourth chapter presents the results of testing carried out on samples collected from quarries
as well as actual construction sites and the description of laboratory tests performed in order to achieve a
final mix design for each material.
Chapter five summaries the results from a comprehensive parametric executed over the course of
this project. Included in this study were changes in gradation, curing regime, mixing temperature,
mixing method and compaction method among others. A preliminary guideline for mix design and
laboratory testing based on those results is presented in chapter six of this thesis. Chapter seven presents
the results of lab tests conducted on a fifth material which was used as a validation of the preliminary
guideline. And lastly, chapter 8 consists of the summary and conclusions of this project as well as
recommendations for the changes to TxDOT specifications

4
Chapter 2 - Literature Review
2.1 FULL -DEPTH RECLAMATION
Full Depth Reclamation is a form of cold in-place recycling (CIR) of flexible pavements. During
this procedure, the hot mix layer and a predetermined amount of the underlying base course are
pulverized simultaneously by special equipment. As a common practice, the two materials are mixed
with asphalt emulsion or other stabilizing agents. Depending on the severity of structural problems of
the original base course, additional virgin base material (add-rock) or even recycled asphalt pavement
(RAP) are sometimes mixed with the pulverized materials. The result of this process is an entirely new
base course. This method dates back to the early 20th century, however, it did not become widely used
until around 1975 (Epps, 1990). Shortages of virgin aggregate, rising fuel costs, as well as
environmental concerns have led to an increased utilization of FDR in many states and countries.
Similar to any other road rehabilitation procedure, FDR has both its pros and cons.
Recycling using the FDR process has many advantages encompassing a broad range of
engineering concerns from improving the economics of the project to safeguarding the environment.
FDR facilitates complete reconstruction of a pavement system while utilizing all or most of the existing
material. The process allows for grade corrections and small adjustments in road geometry, but more
importantly, remedies structural pavement problems (Kearney and Huffman, 2000). The ability to
utilize almost 100% of the existing materials reduces project costs associated with the transportation of
virgin material to the site while concurrently eliminating disposal costs of the old aggregates. This is a
great benefit for states such as Texas, where fresh aggregate is sometimes shipped from locations as far
as Guadalajara, Mexico. Aside from the obvious economic benefits, FDR addresses “deeper” pavement
problems as well.
Cracking and other defects are sometimes caused by inadequate base materials in flexible
pavement systems. In these cases resurfacing of the road with another hot mix layer will not solve the
problem. FDR can be implemented on these roads to strengthen the base materials (Kearney and

5
Huffman, 2000). The new base that is formed from the combination of the existing pavement and part
or all of the base material along with a stabilizing agent is often times stronger than the original
materials. For this reason, roads that have undergone the FDR process are often considered to be
structurally sounder than the original flexible pavement.
Since the pulverization process reaches deep into the base material, changes in the profile of the
road are attainable during the FDR process. Epps (1990) states that significant pavement structural
improvements can be made in horizontal and vertical geometry and without shoulder reconstruction.
Old pavement profile, crown, and cross slope may also be modified. This is possible since the entire
layer of flexible pavement as well as part of the base is taken up. The advantages of FDR are not only
limited to road improvements, most state transportation departments consider the process an
environmentally sound choice for pavement rehabilitation as well.
With the strategy of “greener” roads being advocated by policy makers worldwide, FDR fits in
as a viable solution to flexible pavement problems. The process as a whole conserves energy. Roads
can be recycled in-place without any fuel being expended for heating of bituminous materials. Also,
extra fuel is not required nor added emissions produced during the hauling of aggregates to and from the
job site. This in turn leads to overall project savings in transport costs. In terms of aggregate, scarce
supplies are not depleted for reasons of structural improvements.
Conversely, problem areas have also been associated with the use of FDR. No comprehensive
guideline is currently in place which governs the implementation of the process. This has lead to large
variations in the results of such projects, even within the same state. Another concern with FDR is the
curing time required for strength gain. Curing time is a major factor in the decision of when to let traffic
back on that particular section of road. This in turn causes inconvenient disruptions in traffic. However,
advances in equipment used for FDR has helped streamline the process so that road closures can be kept
to a minimum (Epps, 1990). Also, the entire process is susceptible to climactic conditions, especially
when asphalt emulsions are used as a stabilizing agent. Since the strength gain in asphalt stabilized
materials is dependent on the rate of moisture loss by the emulsion, it is not recommended that the
process be carried out on days when heavy rainfall is expected.

6
2.2 STABILIZERS USED FOR FDR PROCESS
During the FDR process, various types of stabilizing agents can be added to the mixture of RAP
and the existing base material. The process of adding chemicals to stabilize a soil is known as chemical
stabilization. Some of the more common additives used in the process are asphalt emulsion, portland
cement, lime, and fly ash. The following section gives a description of the uses and mechanisms behind
each.
2.2.1Asphalt Emulsion
An emulsion is a suspension of small globules of one liquid in a second liquid with which the
first will not mix. The two liquids that comprise an asphalt emulsion are asphalt and water. Since oil
and water do not mix well, an asphalt emulsion contains an emulsifier which prevents the separation of
the two liquids. Unlike hot mix, emulsion is used as part of a cold process where no heating of either
the aggregate or the emulsion is required. Since one of the components of emulsion is water, it can be
combined with the base material even if the aggregate is wet. The final strength of the material develops
as the emulsion “sets”. The setting process is also known as the “breaking” of the emulsion. More
simply put, the breaking of the emulsion is the process in which the water initially mixed into the
emulsion separates and eventually makes its way out of the mixture. This leaves behind only the
bituminous portion of the original mix. Water can leave the emulsion mixture either by compaction or
natural evaporation.
Asphalt emulsion provides various benefits to a recycled base mixture. According to Kandahl
and Mallick (1997), it helps to increase cohesion and load bearing capacity of a mix. It also helps in
rejuvenating and softening the aged binder in the existing asphalt material. Aside from the structural
gains by the newly stabilized base, there are other benefits to using emulsion as well. The lack of heat
needed for placement of the material allows for a safer working environment for those carrying out the
process.
There are many factors that affect the performance of asphalt emulsion. Besides the rate of
residual asphalt, the variables having a significant effect are the following (AEMA, 1997):
• Chemical properties of the base asphalt cement

7
• Hardness and quantity of the base asphalt cement
• Asphalt particle size in the emulsion
• Type and concentration of the emulsion
• Manufacturing conditions such as temperatures, pressures, and shear
• The ionic charge on the emulsion particles
• The order of addition of the ingredients
• Type of equipment used in manufacturing the emulsion
• The property of the emulsifying agent
• The addition of chemical modifiers
The above factors can be varied to suit the available aggregates or construction conditions. It is
always advisable to consult the emulsion supplier with respect to a particular asphalt-aggregate
combination as there are few absolute rules that will work the same under all conditions. An
examination of the three main constituents (asphalt, water, and emulsifier or surface-active agent) is
essential to an understanding of why asphalt emulsions work as they do.
2.2.2 Portland Cement
Portland cement is commonly used as a stabilizing agent in FDR projects. In Texas, portland
cement has been utilized in approximately 80% of the districts as a chemical additive for base
stabilization of recycled asphalt mixtures (Scullion et. al., 2003). Portland cement is a multi-mineral
compound made up of oxides of calcium, silica, alumina, and iron. The combination of water, cement,
and soil form cementitious bonds between the soil particles which facilitate a gain in strength over long
periods of time (Kandahl and Mallick, 1997).
2.2.3 Lime
Lime is another commonly utilized compound used for chemical stabilization of recycled asphalt
and base courses. This material exchanges its higher valence cations with the mono-valent cations
readily available in many soils. This exchange of ions between the two materials leads to an increase in
strength of the mixture (Parsons and Milburn, 2003). Lime is generally used as an additive to mitigate
the effects of some organics in base materials. When used as a stabilizing agent in soils, lime can lessen

8
the effects of moisture damage by increasing tensile and compressive strengths of the recycled mix
(Kandahl and Mallick, 1997). Lime has historically been added to recycled asphalt bases in the form of
powder or slurry.
2.3.4 Fly Ash
Fly ash is an industrial by product that comes from the combustion of fossil fuels in electricity
generating plants (Parsons and Milburn, 2003). When coal is burned in these plants, the exhaust from
the boilers contains fly ash. Class C fly ash is a pozzolanic material that contains silica, alumina, and
calcium based minerals. Much like portland cement, when fly ash is mixed with water cementitious
bonds are formed which lead to an increase in impermeability and strength of the recycled mix. Fly ash
is spread out by a separate machine and then mixed in with the reclaiming machine after initial
pulverization has been performed (Kandahl and Mallick, 1997).
2.4 M IX DESIGN PARAMETERS
Various mix designs have been proposed and implemented by different agencies for use in FDR.
Different mix design procedures have the following items in common (Newcomb and Salomon, 2000):
• Collection of road samples
• Determination of material characteristics of road samples
• Selection of stabilizing agent
• Determination of optimum moisture content and/or total liquid content
• Mixing, compaction, and curing of specimens
2.5 COLLECTION OF ROAD SAMPLES
For a mix design to be properly evaluated about 500 lbs of the in-place material are needed. The
collection of road samples is typically done with opening a trench at a random location at the site. The
HMA layer is also sampled if the construction plans require combining it with the base. One concern
with this process is that the sampled material may not be representative of the entire project site.
Mallick et al. (2001) utilized a coring device to retrieve the materials from a number of locations
throughout the site to sample the HMA and the base. Even though more cumbersome, this may be a
more prudent way of sampling.

9
2.5 MATERIAL CHARACTERIZATION OF ROAD SAMPLES
The main characterization activity is the determination of the gradation and index properties of
the retrieved materials with or without RAP. Of particular interest are the percentages of gravel, sand
and fines as well as the plasticity index (PI) of the material. These parameters are used to determine the
appropriate additives. If the gradation is not desirable, the addition of virgin materials to the mix will
also be considered.
As stated by Epps (1990), the addition of new aggregate to the recycled material appears to be a
widespread standard practice. According to his research, 66% of the agencies which were surveyed in
the study did allow new aggregate to be combined into the existing recycled material. Adding thickness
to the stratum and gradation corrections are two of the pavement layers characteristics that can be
adjusted by the addition of new aggregate in to the mix (Epps, 1990).
Additional aggregate has also been used during FDR as a means of mechanical modification.
When used in this context, the new aggregate is added to the mixture to supplement the strength of the
material. According to Johnston et al. (2003), a small portion of additional aggregate was added to the
mix design used in their study in order to improve the physical properties of the mixture; in this case
strength. Other organizations allow for the addition of new aggregate to the mixture so as to increase
the allowable amount of emulsion used. Pennsylvania reported allowing up to 50% new aggregate to be
combined with RAP material in order to facilitate the use of additional emulsion in the mixture (Epps,
1990).
2.6 EMULSION SELECTION
The type and amount of emulsion selected is extremely important and thus becomes a matter
which most mix designs often consider. A study by Clyne et al. (2003) for the Minnesota DOT
concentrated on the importance of the proper selection of emulsion for cold-in-place recycling of bases.
Emulsions are categorized according to the electric charge which surrounds the asphalt particle.
Emulsions which utilize positively charged asphalt particles are known as cationic emulsions; while
those which include negatively charged asphalt particles are known as anionic emulsions. A third

10
category of emulsion known as nonionic, which is neutral, also exists. However, nonionic emulsions are
not often used as stabilizing agents in base materials.
The two commonly used emulsions are then broken down by the speed at which they convert
back into asphalt. Mean rapid setting (RS), medium setting (MS), slow setting (SS), and quick setting
(QS) are the terms used to further identify an emulsion (AEMA, 1997). Of these four types, SS
emulsions are generally used for CIR because of their superior ability to coat dense graded aggregates
(Pouliot et al., 2003). With respect to aggregate-emulsion mixtures, the relationship between the
aggregate electronic surface charge and the emulsion electronic charge heavily impacts the interaction of
the emulsion with the aggregate (Ibrahim, 1998). This being said, emulsion droplets will be most
attracted to aggregates which bear opposing charges. An example of this was given by Lesueur and
Potti (2004). In their study it was determined that siliceous aggregates are said to bear negative charges
and therefore attract all positively charged droplets. As such, the compatibility of the emulsion and
aggregates should be considered.
2.7 OPTIMUM EMULSION CONTENT
The optimum emulsion content for a material is defined by several agencies as the amount of
emulsion added to a material which meets minimum strength requirements defined by the particular
agency. However, some agencies chose to use empirical values based on emulsion type as their base
emulsion content and adjust according to the materials characteristics. Other agencies utilize the
modulus of the mix to determine the optimum emulsion content, as the modulus is a more appropriate
parameter for design of pavements.
2.8 WATER CONTENT
Like all granular materials, water is added to the mix so that maximum density can be achieved.
The total amount of mixing water required is not the same for every material combination. The water
required for maximum dispersion of the emulsion to occur varies by type of emulsion. According to
Mallick et al. (2001), the mixing water and the water contained in the emulsion work together to aid in
compaction of the specimen. The amount of mixing water is generally less than the optimum moisture
content of the recycled base material without a bituminous additive (Ibrahim, 1998).

11
No firm guideline for selecting the amount of additional mixing water is available. One of the
more prevalent practices is to add a percentage of the traditional moisture content to the material first
based on the sand equivalency of the material. This value is anywhere from 50% to 80% of the
optimum moisture content. Some other organizations arbitrarily select anywhere from 0% to 3% water
(by weight of dry material) to be added to the mix.
2.9 OVERVIEW OF VARIOUS M IX DESIGNS
An extensive review of the specifications of a number of highway agencies was carried out. For
the most part, those specifications leave the mix design to the contractor. In this section, some typical
specifications are reviewed.
2.9.1 Missouri
The Missouri DOT (MoDOT) utilizes a similar practice to Texas for determining the appropriate
mix design. (Texas’ guideline is described in chapter three of this report.) The differences are
essentially in the method of sample preparation The MoDOT method utilizes the Superpave Gyratory
Compactor (SGC) for compaction. Also, the allowable curing time for strength (2 hours) is less than
that of Texas. This guideline also specifies that the additional water content should be 65% of the OMC
of the raw material. Strength requirements for MoDOT are included in Table 2.1.
Table 2.1 - MoDOT Min Strength Requirements
Criteria Property < 10% passing No. 200 > 10% passing No. 200 Compaction effort, SGC 1.25° angle, 600 kPa, 30 gyrations
Short term strength test - modified cohesiometer, ASTM D 1560-92, psi 200 min. 150 min.
Indirect tensile strength test - ASTM D 4867 Part 8.11.1, 25 C, psi 45 min. 40 min.
Conditioned ITS, ASTM D 4867 (see note 1), psi 25 min. 20 min.
Resilient modulus, ASTM D 4123, 25 C, psi 175,000 min. 150,000 min. Thermal cracking (IDT), AASHTO TP 9-96
(Based on LTPP Binder for climate) See note in appendix

12
2.9.3 Maine
No specific mix design process is outlined in Maine’s specification. The mix design is carried
out following the recommendations made by Mallick et al. (2001). Compaction of the specimens is
achieved using 50 gyrations of a SGC with a specially fabricated mold which has holes in it that allows
loose water to escape during the compaction process. The specimens are tested after they are placed in a
40ºC oven for 7 days. They are then subjected to both resilient modulus and indirect tensile testing. The
minimum strength and modulus requirements are not evident.
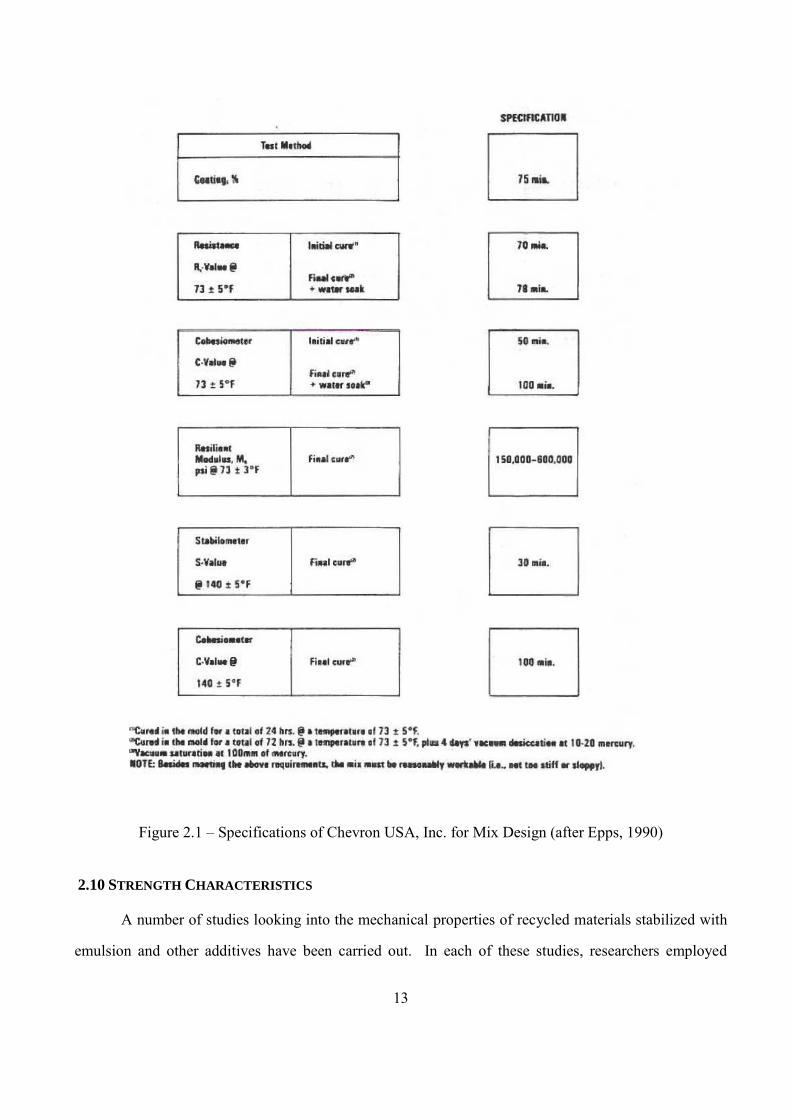
2.9.4 Chevron
Chevron USA, Inc. makes use of an equation to estimate the initial emulsion content for use in
FDR. Under the Chevron mix design system, the initial emulsion estimate (Pc) is based on aggregate
gradation and emulsion residue. Once these parameters have been determined, they are input into the
following equation (Epps, 1990):
Pc = (0.5A+0.1B+0.5C)-Pa(Pp/R) (2.1)
where:
A = amount of aggregate retained on No. 8 sieve (%),
B = amount of aggregate passing the #8 sieve and retained on No. 200 (%),
C = amount of aggregate passing No. 200 sieve (%),
Pa = amount of asphalt in reclaimed asphalt pavement (%),
Pp = percent reclaimed asphalt pavement in the recycled mix, and
R = percent emulsion residue (normally 60% – 65%)
After the initial emulsion quantity is determined, trial mixes are then prepared at 1% below and 1
and 2% above the estimated value. According to Chevron specifications, the trial mixes shall never
contain less than 2% emulsion. Laboratory testing is then carried out on all specimens. The emulsion
quantity that meets the minimum requirements outlined in Figure 2.2 is then selected as the design
emulsion content.
13
Figure 2.1 – Specifications of Chevron USA, Inc. for Mix Design (after Epps, 1990)
2.10 STRENGTH CHARACTERISTICS
A number of studies looking into the mechanical properties of recycled materials stabilized with
emulsion and other additives have been carried out. In each of these studies, researchers employed

14
different test methods to quantify the effects of calcium-based additives on the emulsion stabilized
material. However, since in-situ field evaluation is not common, laboratory testing is often used as a
means to quantify the effects of dual stabilization on in-place materials. A survey of those studies and
their results are reported in this section.
James et al. (1996) performed a study to gain more insight into the behavior of emulsion in
mixtures as well as measure the effects of cement when mixed with emulsion and recycled aggregate.
Various tests were run on emulsion-cement mixtures where the percentage of cement (by weight of total
solids) varied. With respect to the mechanical tests performed on the specimens, the results are as
follows:
• The modulus increased with an increase in cement content
• The specimen’s resistance to permanent deformation was also increased after the addition
of cement to the mixture
Cement and lime have been found to be similar in their ability to improve the quality of base
materials. Cross (2000) evaluated the effects of hydrated lime slurry (HLS) when used in conjunction
with asphalt emulsion in CIR projects. In order to quantify the effects of lime on emulsion-RAP
mixtures the specimens were subjected to various strength tests including indirect tensile strength,
resilient modulus, and permanent deformation. The addition of HLS to emulsion stabilized base
materials led to an improvement in the material properties that affect the performance of pavements.
HLS resulted in an increase in tensile strength and resilient modulus. The addition of HLS to the
mixture also aided in enhancing the materials ability to resist permanent deformation (Cross, 2000).
2.11 CLIMACTIC CONDITIONS
FDR is influenced by weather conditions both during and after it is performed. Two factors that
greatly affect the FDR process are the ambient temperature and moisture conditions of the surrounding
area (Salomon and Newcomb, 2001). Several studies have been performed in attempt to quantify the
effects of climactic conditions on dual stabilized bases.
It has been shown that the addition of either lime or cement to emulsion-RAP mixes aids in
increasing a materials resistance to moisture-induced damage. Mallick et al. (2002) performed indirect
tensile tests on emulsion-stabilized base materials with the addition of either cement or lime to the

15
mixture. Results from these investigations showed significant gains in indirect tensile strength when
compared to emulsion only mixtures under wet conditions.
Brown and Needham (2000) also attempted to quantify the effects of both lime and portland
cement on emulsion stabilized mixtures. During this study specimens were tested for modulus after an
initial soaking period and then again after a second soaking period. Results from these tests showed that
the modulus increased with the addition of either cement or lime into the mixture when compared to
specimens that did not have a calcium-based additive. Even additions of small amounts of cement to
bituminous-RAP mixtures have shown to increase a material’s modulus. The inclusion of 1% cement to
RAP-emulsion mixtures can lead to increases in wet stiffness modulus of more than half when compared
to the dry results (James and Needham, 1996).
An additional procedure by which moisture induced damage can be quantified is by evaluating
the materials ability to resist permanent deformation; also under both dry and wet conditions. It has
been shown that the addition of lime to emulsion stabilized bases significantly increases the materials
resistance to permanent deformation (Cross, 1999).
Another important factor that has been analyzed by researchers is the materials ability to
withstand various freeze-thaw cycles throughout the course of its lifetime. Testing performed on
emulsion-lime mixtures has shown that freeze-thaw damage resistance increases when compared to
specimens that do not contain emulsion in the mixture. It has been suggested that this is true due to
asphalts inherent ability to flex (Cross and Young, 1997).
2.12 CURING TIME
Maximum strength gain is reached when dual-stabilized bases lose their initial water and are
fully cured. It was shown by James et al. (1996) that the rate of strength gain with respect to curing time
is directly related to increasing amounts of cement in the mixture. Coalescence tests performed by
Brown and Needham (2000) showed that the breaking times of cement-emulsion mixtures decrease with
increasing cement content. These findings suggest overall improved curing rates of the material.
An alternative approach to accelerate the curing process has been implemented by the Oregon
Department of Transportation (ODOT). The agency has found that heating the mix water as well as the
emulsion to temperatures between 49-60ºC helps to reduce cure times. It is the opinion of ODOT field

16
personal that this process reduces curing problems in construction projects being carried out under cool
or damp ambient conditions (Rogue et al., 1992).

17
Chapter 3 - Overview of Procedures Used in Texas
3.1 INTRODUCTION
Currently, all road rehabilitation projects with asphalt emulsion treatment in Texas follow the
“Special Specification-Emulsion Treatment (Road Mixed)” drafted by TxDOT and “Mix Design
Procedure-Emulsion Treatment (Road Mixed)” drafted by SemMaterials. The two procedures are
similar to each other being that they share the same minimum strength. However the procedure of
SemMaterials is more specific than that of TxDOT in the following aspects:
• Apparatus required to perform laboratory tests for the mix design
• Sieve analysis of constituent materials to be used in the mixture performed individually
• Determination of correct blend ratio of materials (RAP/old base/add-rock) used for
construction is detailed
• Approximate starting emulsion contents for materials
• Mixing procedure
• Compacting procedure
• Curing regimens for strength testing of specimens
Both of these procedures were evaluated before the initiation of laboratory testing for this study;
as such, a general overview of these two procedures is given in this chapter.
3.2 TXDOT
The current Special Specification provided by TxDOT for the use of dual stabilization is a
performance based guideline. There are no specific directions for determining the optimum emulsion
content for the emulsion/base mixture. Likewise, nor are there any specifications which outline a
procedure for determining the optimum amount of calcium-based additive. A list of general
requirements for strength and other relevant parameters is proposed in the Special Specification. The
specification can be viewed in its entirety in Appendix A provided at the end of this report.

18
The performance tests selected in the TxDOT Special Specification and the criteria for
acceptance currently used to design are included in Table 3.1. Acceptance values for the unconfined
compressive strength (UCS), indirect tensile strength (IDT) and the retained unconfined compressive
strength are provided. The Tube Suction Test (TST) and the modulus (stiffness) tests do not have
specified acceptance values but are required to be reported to the department.
Table 3.1 – Laboratory Mix Design Properties and Testing Methods
Property and Testing Criteria Unconfined Compressive Strength (UCS), Tex 117 150 psi min. Indirect Tensile Strength (IDTS), Tex-226-F1 50 psi min. Dielectric Constant, Tube Suction Test (TST), Tex-144-E Report Retained Unconfined Compressive Strength, Tex-117-E 80% min. Resilient Modulus (AASHTO T-307) Report Modulus, Free-free Resonant Column Test (Tex-149-E) Report 1. Specimens will be cured 72 hr. at 104°F before testing
The procedure refers to Tex-113 “Laboratory Compaction Characteristics and Moisture-Density
Relationships of Base Materials” as the proper method for preparing materials undergoing UCS testing.
The TxDOT specification uses Tex-117-E “Triaxial Compression for Disturbed Soils and Base
Materials” as the procedure for carrying out UCS testing. Stated within Tex-117 are the specifications
for sample preparation. In the case of IDT testing, the specification requires the use of procedure Tex-
226-F “Indirect Tensile Strength Test”. In turn, this procedure specifies the use of Tex 241-F
“Superpave Gyratory Compaction of Test Specimens of Bituminous Mixtures” in order to prepare the
samples for testing. After compaction of the IDT specimens, the specification calls for a 3 day cure
period in which the specimens are placed in an oven set at 104°F; after which , they are subjected to IDT
testing under a controlled rate of deformation (2 in./min). The specific tests outlined have been
historically used for classification of non-stabilized bases or materials that utilize a cementitious additive
only.
According to the Special Specification, the retained UCS values are also found as per Tex-117-E
and a procedure similar to that outlined by Tex-144-E “Tube Suction Test”. This procedure calls for an
8-day saturation period in which the specimens are placed on porous stones surrounded by a
predetermined amount of water. The general idea is that the water will be distributed within the

19
specimen through the natural capillary absorption process. Upon completion of the saturation period,
the specimens are then subjected to compression testing. A ratio between the original UCS value and
that of the specimen subjected to moisture susceptibility testing is then calculated.
During the saturation process, the dielectric constant of the material is read on a daily basis. The
final dielectric value is then reported so as to comply with the requirements in the Special Specification.
The modulus value of all the specimens undergoing strength testing is measured on a daily basis as well.
In order to determine the modulus of an individual UCS specimen, a testing device known as the Free-
free Resonant Column (FFRC) is utilized. Modulus values for IDT specimens are measured utilizing a
device know as a V-Meter. Both methods are non-destructive forms of measuring the stiffness of both
granular as well as non-granular materials and are common practice for TxDOT personnel. The resilient
modulus of the material is measured by utilizing AASHTO T-307 “Standard Method of Test for
Determining the Resilient Modulus of Soils and Aggregate Materials“. It should be noted that the curing
regimens as well as general testing procedures outlined for each set of tests may not be the most suitable
for these types of materials and are part the basis for this research.
3.3 SEM MATERIALS
The SEM Materials (SEM) procedure is also performance based; however, the guidelines are
more specific with regards to achieving a final mix design than those of TxDOT. The minimum strength
requirements for UCS and IDT are the same as those in Table 3.1. In addition, an exact process for
determining the necessary amounts of moisture and emulsion are stated. A draft version of this
procedure can be viewed in its entirety in Appendix B provided at the end of this report.
This procedure also outlines the equipment necessary for performing a mix design on any given
emulsion treated base material. The apparatus required are for the most part standard testing devices
and will not be mentioned here. As such, any device that is not generally used in laboratory testing of
base materials will be described in the text.
It is stated in the SEM procedure that the correct blend ratio must be determined. This blend
ratio is generally proportional to the amount of materials (RAP/old base/add-rock) which will be used
during field construction. After which, the correct amount of each type of aggregate is gathered from
the construction site. The materials are then dried and the RAP is crushed. A sieve analysis is run on all

20
of the materials to be used in the mixture on an individual basis. The Plasticity Index and Sand
Equivalency values of the old base and add-rock are determined using existing standard TxDOT
procedures. The Methelyne Blue Value of the materials is determined utilizing AASHTO TP-57. These
values are considered as optional testing which is simply for characterization of the constituent
aggregates and are not used for further mix design calculations.
Once these tests have been performed, a predetermined amount of specimens are then batched
accordingly with respect to the design ratio. Different size batches are required depending on whether
the material will be used for UCS or IDT testing. After batching the required number of specimens, the
optimum moisture content (OMC) of the material is then found utilizing Tex-113-E. However,
emulsion is added to the material along with the mixing water. According to the procedure, the amount
of emulsion to be added is defined on an arbitrary basis as shown in Figure 3.1. This figure provides a
suggested starting emulsion content to be used depending on the region of the state from which the
material was gathered.
Figure 3.1 – Initial Emulsion Contents Suggested by SEM’s Procedure
Before adding the emulsion to the mixture water is combined with the dry aggregate. The wetted
material is then allowed to sit for a minimum of twelve hours before any stabilizer is added. The
emulsion is then mixed into the material. After the addition of emulsion to the material, the entire batch
is then mixed using a high-shear mechanical mixer for approximately 60 seconds. At that point the
District
Aggregate Type < 50% RAP >50% RAP < 50% RAP >50% RAP < 50% RAP >50% RAP < 50% RAP >50% RAP < 50% RAP >50% RAPEmulsionn Content TBD TBD 5.0% 4.0% TBD TBD 5.0% 4.0% 4.5% 4.0%
District
Aggregate Type < 50% RAP >50% RAP < 50% RAP >50% RAP < 50% RAP >50% RAP < 50% RAP >50% RAP < 50% RAP >50% RAPEmulsionn Content TBD TBD TBD TBD 5.0% 4.0% 5.0% 4.0% 4.5% 3.5%
District
Aggregate Type < 50% RAP >50% RAP < 50% RAP >50% RAP < 50% RAP >50% RAP < 50% RAP >50% RAP < 50% RAP >50% RAPEmulsionn Content TBD TBD 4.5% 3.5% 4.5% 4.0% 5.0% 4.0% 5.0% 4.0%
District
Aggregate Type < 50% RAP >50% RAP < 50% RAP >50% RAP < 50% RAP >50% RAP < 50% RAP >50% RAP < 50% RAP >50% RAPEmulsionn Content TBD TBD 5.0% 4.0% TBD TBD TBD TBD TBD TBD
District
Aggregate Type < 50% RAP >50% RAP < 50% RAP >50% RAP < 50% RAP >50% RAP < 50% RAP >50% RAP < 50% RAP >50% RAPEmulsionn Content 5.0% 4.0% TBD TBD TBD TBD TBD TBD 4.5% 3.5%
Beumont
Brownw ood Bryan Childress Corpus Christi Dallas
Abiline Amarillo Atlanta Austin
Lubbock
Lufkin Odessa Paris Pharr San Angelo
El Paso Fort Worth Houston Laredo
YoakumSan Antonio Tyler W aco W ichita Fa lls

21
mixture is transferred to a plastic container and placed in an oven set to 140°F for 30 minutes. The
combination of additives as well as the mixing process is the same for both UCS and IDT specimens.
After allowing the emulsion/aggregate mixture to cure, the material is then compacted utilizing
the procedures outlined in Tex-113-E for those specimens undergoing UCS testing. In order to perform
IDT testing, the material is compacted using a Superpave Gyratory Compacter (SGC). The number of
gyrations used for compaction is 30. Also stated in the SEM procedure are the final dimensions of the
IDT specimens. These specimens should be 6 in. in diameter and 3.75 in. in height. Where as the
TxDOT procedure calls for the use of specimen that is only 2.4 in in height.
After compaction, the specimens are then allowed to cure for a given period of time and at a
predetermined temperature, depending on the test being performed. For UCS testing, the specimens are
cured at 140°F for 48 hours. IDT specimens are subjected to a curing regimen of 72 hours at 104°F
similar to that of the TxDOT procedure. After which, both sets of specimens are allowed to cool to
ambient temperature before undergoing strength testing. Moisture susceptibly tests are performed on
specimens prepared in a similar manner as that described above for UCS testing. FFRC testing is also
performed on the UCS specimens in order to determine the modulus of the material. One specimen
prepared in a manner similar to those undergoing UCS testing is prepared for the purposes of carrying
out the resilient modulus test in accordance with the AASHTO T-307 procedure.
In order to determine the amount of calcium based additive required, two extra specimens of
each type (UCS and IDT) are prepared. The initial moisture content to be added to the dry material is
not adjusted. After allowing the wetted mixture to sit for 12 hours the dry additive is then combined into
the material. After which emulsion is added to the material according to the emulsion content
previously selected.
If the minimum strength requirements are met by the emulsion only specimens, that would be the
design reported. In the case where a design is not achieved, this process is carried out again, increasing
the amount of emulsion used in the mix until the minimum strength requirements are met. No mention
of the use of the dual stabilized materials is made.

22
Chapter 4 - Laboratory Testing – Initial Mix Design
4.1 INTRODUCTION
The objective of the mix design is to determine the type and content of asphalt and/or calcium-
based additives and to evaluate the improvement of engineering properties with varying contents of the
selected additive(s). Due to the ambiguity of the current specification with regards to how a mix design
procedure should be carried out, an “initial” mix design study was performed. In this section of the
report a detailed description of how the final mix designs used in this study were selected.
4.2 MATERIAL SELECTION
A survey was conducted to identify the activities related to the use of the dual-stabilized bases
throughout Texas, as well as to identify possible sites to be incorporated in this study. Survey responses
were received from the following 19 districts: Abilene, Amarillo, Atlanta, Austin, Beaumont,
Brownwood, Bryan, Childress, El Paso, Fort Worth, Houston, Lubbock, Lufkin, Odessa, Paris, San
Angelo, Tyler, Waco, Wichita Falls, and Yoakum.
Materials from three sources were selected to generate a baseline for verification of the outcome
of this project. These materials were selected after carefully reviewing the responses from the
questionnaire. In addition, granite from a local quarry was included in this study to cover a wider
spectrum of materials. A fifth material was selected also based on the responses from the initial
questionnaire; this material was used as a verification of the preliminary guideline (the validation
material is incorporated in another report provide to TxDOT and is not included in this thesis). The five
base materials that were selected for the overall study were:
• El Paso Base from CEMEX McKelligon Canyon Quarry due to availability.
• Material from Martin Marietta Pit in San Antonio that is either used extensively as add
rock or widening of shoulders in the San Antonio District.
• Materials from FM 154 project in Fayette County, Yoakum District which included the
old RAP (18%) and base (53%) as well as add-rock (29%).

23
• Materials from US 287 project in Armstrong County, Amarillo District which include the
old RAP (80%) and base (20%).
• Materials from FM 2790 project in Atascosa County, San Antonio District which
included a mixture of old RAP (42%) old base (30%) and virgin aggregate from San
Antonio Quarry (28%).
4.3 AGGREGATES PROPERTIES
The gradation, soil classification and index parameters of raw materials from the two quarries (El
Paso and San Antonio) and from the in place base courses (FM 154 in Yoakum, US 287 in Amarillo and
FM 2790) as well as the add-rock used for FM 154 are summarized in Table 4.1.
Table 4.1 – Gradation, Soil Classification and Atterberg Limits of Raw Base Materials
Gradation Classification Atterberg Limits Material
Gravel Coarse Sand
Fine Sand Fines USCS AASHTO LL PI
Sand Equivalency
El Paso 55 22 18 5 GW A-2-4 27 8 53 San Antonio 51 25 23 1 GP A-2-4 20 8 33
Yoakum Add-Rock 54 35 7 3 GP A-2-6 21 12 13
Yoakum Base 43 31 24 2 SP A-2-4 17 8 63 Amarillo Base 26 32 27 15 SC-SM A-2-6 26 18 13
FM 2790 Base 45 21 10 3 SP N/A N/A N/A N/A
FM 2790 Add Rock 51 25 23 1 GP A-2-4 20 8 33
To prepare the materials for initial testing, the entire stock of material brought from a quarry or a
project (including RAP and/or add-rock as per the blend ratio used in construction) was sieved to
develop the global gradation curve which was used throughout the study for that particular material or
material combination. The gradation curves for the El Paso, San Antonio, Amarillo, and Yoakum
materials are included in Figure 4.1. For reference, the lower and upper limits of gradation required by
TxDOT Item 247 for Grade 1 base are also included in the figure.
The toughness of coarse aggregates was measured through two tests called the Aggregate Impact
Value (AIV) and Aggregate Crushing Value (ACV) under British Standard 812. For AIV, a coarse

24
aggregate sample passing the 1/2 in. sieve and retained on the 3/8 in. sieve is placed within a mold
(shown in Figure 4.2) to perform the test. The sample is subjected to 15 blows of a 30 lb falling hammer
dropped from a height of 15 in. to simulate its resistance to rapid loading. A sieve analysis is then
performed on the resulting sample. The AIV being the amount of material passing the No. 8 sieve;
expressed as a percentage of the initial sample weight:
AIV = M2/M1 x 100% (4.1)
where:
M1 is the mass of test specimen and
M2 is the mass of the specimen passing the No. 8 sieve.
0
10
20
30
40
50
60
70
80
90
100
0.010.101.0010.00100.00
Sieve size, mm
Per
cent
Pas
sing
Amarillo San AntonioYoakumEl PasoFM 2790
#4 #40 #200Gravel Sand Fines
Figure 4.1 – Global Gradation Curves for materials Used in Preparing Specimens

25
The AIV can be performed either on a dry specimen (called the dry AIV) or on specimens
soaked for 24 hours in water (called the wet AIV). A value of less than 30 is usually indicative of a
reasonably good material. The AIV for each of the raw base materials used in this study are
summarized in Table 4.2. Based on this criterion, the San Antonio material and the Amarillo material
when wet may be of concern. With regards to the material which comprises FM 2790; it also shows
cause for alarm. Both of its constituents resulted in high AIV values especially under wet conditions.
The gradations of materials after performing the AIV tests are also shown in Table 4.2.
Figure 4.2 – Test Apparatuses for Aggregate Impact Value (Left) and Aggregate Crushing Value (Right)
On the other hand, the ACV of a material indicates the ability of an aggregate to resist crushing.
The lower the value, the stronger the aggregate or the greater its ability to resist crushing will be. A
sample of aggregate passing through the 1/2 in. sieve and retained on the 3/8 in. sieve is placed in a steel
mold. A steel plunger is then inserted into the mold directly on top of the aggregate (see Figure 4.2).

26
The aggregate is then subjected to a force rising to 90 kip over a period of 10 min. This test is typically
performed with a concrete compression machine.
Similar to the AIV procedure, the resulting sample is then subjected to a sieve analysis. Once
again, the material passing the No. 8 sieve is represented as a percentage of the original mass. This
percentage is known as the ACV of the aggregate. Equation 4.1 is also used to perform the calculation
of ACV. The ACV values of the materials are summarized in Table 4.3. Under this test, the San
Antonio material and the old base materials from Amarillo, Yoakum and FM 2790 are of concern.
Table 4.2 – AIVs of Materials along with Gradations after Testing
Gradation, Individual Retained (%) Material AIV
Gravel Coarse Sand Fine Sand Fines
Dry 14 78 16 3 3 El Paso (Quarry) Wet 20 69 20 8 3
Dry 25 62 28 6 5 San Antonio (Quarry) Wet 29 59 24 5 12
Dry 13 71 23 4 2 Yoakum Add-Rock Wet 18 69 25 4 1
Dry 17 79 17 3 1 Yoakum Old Base Wet 19 72 23 4 1
Dry 16 77 16 5 2 Amarillo Old Base Wet 22 67 24 7 2
Dry 18 37 6 1 0 FM 2790 Old Base Wet 22 34 6 1 1
Dry 25 62 28 6 5 FM 2790 New Base Wet 29 59 24 5 12

27
Table 4.3 – ACVs of Materials along with Gradations after Testing
Gradation, Individual Retained (%) Material ACV
Gravel Coarse Sand Fine Sand Fines
El Paso (Quarry) 19 66 27 4 3 San Antonio (Quarry) 31 51 36 7 6
Yoakum Add-rock 21 54 38 7 1 Yoakum Old Base 27 66 27 6 2 Amarillo Old Base 34 51 32 12 5 FM 2790 Old Base 26 38 10 5 2.19 FM 2790 New Base 31 51 36 7 6
4.4 SPECIMEN PREPARATION
Several different tests were run on the materials used in this study including, UCS, IDT; TST,
and resilient modulus. All testing conducted on the materials was performed in accordance with its
respective TxDOT laboratory procedure. For UCS and resilient modulus tests, the samples were
prepared as per Tex-113-E, with the following variations due to the addition of emulsion to the mixture.
• After allowing the wetted material to mellow in a sealed container for a minimum of 12
hours, the emulsion was then added to the mixture.
• The emulsion/aggregate combination was then blended in a high-shear mechanical mixer
rotating at 60 revolutions per minute for 1 minute.
• The material was then transferred into 6 in. diameter containers and placed in an oven at
140oF for thirty minutes.
Initially, a total of three different sets of test specimens were prepared. UCS and moisture
conditioning tests were conducted on specimens of 6 in. in diameter and 8 in. in height. The IDT
specimens were 6 in. in diameter and 4.5 in. in height and compacted using a SGC for a total of 30
gyrations. For resilient modulus test, specimens measuring 6 in. in diameter and 12 in. in height were
prepared as per Tex-113-E also.
4.5 SELECTION OF OPTIMUM TOTAL L IQUID CONTENT
The current guideline is vague in terms of the selection of the optimum Total Liquid Content
(TLC). The recommended moisture content (mixing water only not including emulsion) in the literature

28
is 50% to 75% of the traditional OMC for a base material treated with asphalt emulsion. To investigate
the most appropriate initial moisture and emulsion contents for emulsion-treated materials, an
experimental study was carried out. The matrix shown in table 4.4 was used for this portion of the
study.
Table 4.4 – Testing Matrix to Evaluate TLC/Moisture/Strength Relationship
Initial
Mixing
Water
45% of OMC 60% of OMC 75% of OMC
Emulsion
Content 0% 3% 5% 7% 0% 3% 5% 7% 0% 3% 5% 7%
UCS UCS UCS UCS UCS UCS UCS UCS UCS UCS UCS UCS
TST TST TST TST TST TST TST TST TST TST TST TST Tests
Performed IDT IDT IDT IDT IDT IDT IDT IDT IDT IDT IDT IDT
The determination of the OMC is particularly important when the material is mixed with the
stabilizer. Once the OMC for a particular material was determined, the impact of emulsion on the
strength parameters of the mix was evaluated. IStrength test specimens were prepared at 45%, 60%, and
75% of their OMC determined from the traditional moisture-density (MD) curves for each material.
Emulsion contents of 0%, 3%, 5%, and 7% were studied at the three different moisture levels.
A comparison of the TLC-density curves for the three selected moisture contents and the MD
curves for each of the four materials used in this study is shown in Figure 4.3. For materials from El
Paso, San Antonio and Yoakum with 45% of the OMC, the TLC-density curves are similar to the MD
curves. However, the corresponding maximum dry densities are lower than when the specimens are
prepared with water only by several pounds per cubic foot. For water contents of 60% and 75% of the
OMC, it seems that the maximum density is obtained when no emulsion is added. This phenomena is
more than likely due to the water that is contained in the emulsion during initial compaction and will be
discussed in a later chapter.

29
Figure 4.3 – Variations in Density with Total Liquid Content at Different Initial Water Contents
110
115
120
125
130
135
140
145
150
0% 5% 10% 15%
TLC, %
Dry
De
nsity
, pcf
MC = 45% of OMC60% of OMC75% of OMCMD Curve
a) El Paso
32
52
57
36
0
10
20
30
40
50
60
2%Lime 2%Cement 1% Lime 3% emulsion 1% Cement 3% emulsion
Additive Type and Amount
Indi
rect
Ten
sile
Str
engt
h, p
si
Required Value = 50 psi forEmulsion-Treated Base
b) Yoakum
110
115
120
125
130
135
140
145
150
0% 5% 10% 15%
TLC, %
Dry
Den
sity
, pcf
110
115
120
125
130
135
140
145
150
0% 5% 10% 15%
TLC, %
Dry
Den
sity
, pcf
b) San Antonio
c) Amarillo d) Yoakum

30
4.6 STRENGTHS OF SPECIMENS WITH EMULSION ONLY
The UCS tests were performed on all four materials for each moisture content and emulsion
content. The results from these tests are shown in Figure 4.4. Only the El Paso mix with 3% emulsion
and 60% of the OMC and the San Antonio mix with 5% emulsion and 60% of the OMC provided the
required strength of 150 pounds per square inch (psi). As a comparison, the strengths with the
corresponding moisture contents and with no emulsion at all were also measured. An average 100 psi of
strength can be achieved by simply curing the specimens under the same curing condition (at 140°F for
48 hrs) as used for emulsion mixes. For specimens with 60% and 75% of the OMC, the addition of
emulsion generally results in a reduction in strength. This may be the effect of excess of moisture (from
both mixing water and emulsion) in the specimen. The interaction of moisture introduced into the
specimen from both the mixing water and emulsion is discussed in more detail in chapter 6.
The results from the IDT tests are shown in Figure 4.5. None of the El Paso mixes provided the
required tensile strength of 50 psi, even for the specimens with 3% emulsion and 60% of the OMC
which previously provided the required UCS strength. For the San Antonio material, a number of
mixes, in particular, the mix with 5% emulsion and 60% of the OMC provided adequate IDT strength
values. With respect to the Amarillo material, the addition of emulsion reduced the tensile strengths.
Unlike the other three materials used in this study, one specimen without emulsion actually provided the
50 psi threshold required. This occurrence could possibly be attributed to the high RAP content of the
mix (80%). It is likely that the high curing temperature used in this study actually causes the RAP to
soften and bind the mix together. The Yoakum specimens with 18% RAP also provided higher IDTS as
compared to the San Antonio and El Paso mixes. This trend however was not as pronounced for the
Amarillo materials.
In general, one can observe the substantial increase in IDT from the specimens with emulsion as
compared to those without emulsion when RAP is not included or the RAP content is a small proportion
of the mix. This can be considered the “value-added” benefit of using emulsion. The increased tensile
strength may impede the cracking of the pavement. At higher moisture and emulsion contents, the
benefits of the emulsion are significantly diminished.

31
Another benefit of the addition of emulsion can be observed in Figure 4.6, where the strains at
failure are plotted. The higher the strain at failure is, the less brittle the material will become, and a
lower potential for cracking can be anticipated. As the emulsion content increases, the strain at failure
increases for almost all materials. The increase in strain seems to be independent of the added initial
moisture content. This benefit is more pronounced for the El Paso and San Antonio materials perhaps
due to their lower fine content and lack of RAP.
In order to further investigate the possible benefits of emulsion treatment, IDT tests were carried
out on specimens moisture-conditioned for 10 days after 2-day dry cure. As shown in Figure 4.7, the
retained tensile strengths for all mixes with emulsion are greater than 80% which is the value required
by the TxDOT Special Specification for retained unconfined compressive strength. According to these
results, it seems that improved moisture susceptibility may be another benefit of using emulsion. Based
on the results from both UCS and IDT tests, the possibility of improving the engineering properties of
materials with dual stabilizer (asphalt emulsion plus the calcium-based additives such as lime or cement)
was studied next.

32
33
120 115105
77
131122
108
140
97
5747
0
20
40
60
80
100
120
140
160
0% 3% 5% 7%
Emulsion ContentU
ncon
fined
Com
pres
sive
Str
engt
h,
psi
Figure 4.4 – Unconfined Compressive Strengths for Materials with Different Moisture and Emulsion Contents
90
112
75
10099
155
114
92
115126 122
85
0
20
40
60
80
100
120
140
160
180
0% 3% 5% 7%
Emulsion Content
Unc
onfin
ed C
ompr
essi
ve S
tren
gth,
psi
45% OMC60% OMC75% OMC
a) El Paso
51
133124
99
77
146154
124126
9988
113
0
20
40
60
80
100
120
140
160
180
0% 3% 5% 7%
Emulsion Content
Unc
onfin
ed C
ompr
essi
ve S
tren
gth,
psi
b) San Antonio
104 109
133
77
137123
102
81
140133
98
81
0
20
40
60
80
100
120
140
160
0% 3% 5% 7%
Emulsion Content
Unc
onfin
ed C
ompr
essi
ve S
tren
gth,
psi
c) Amarillo
c) Yoakum
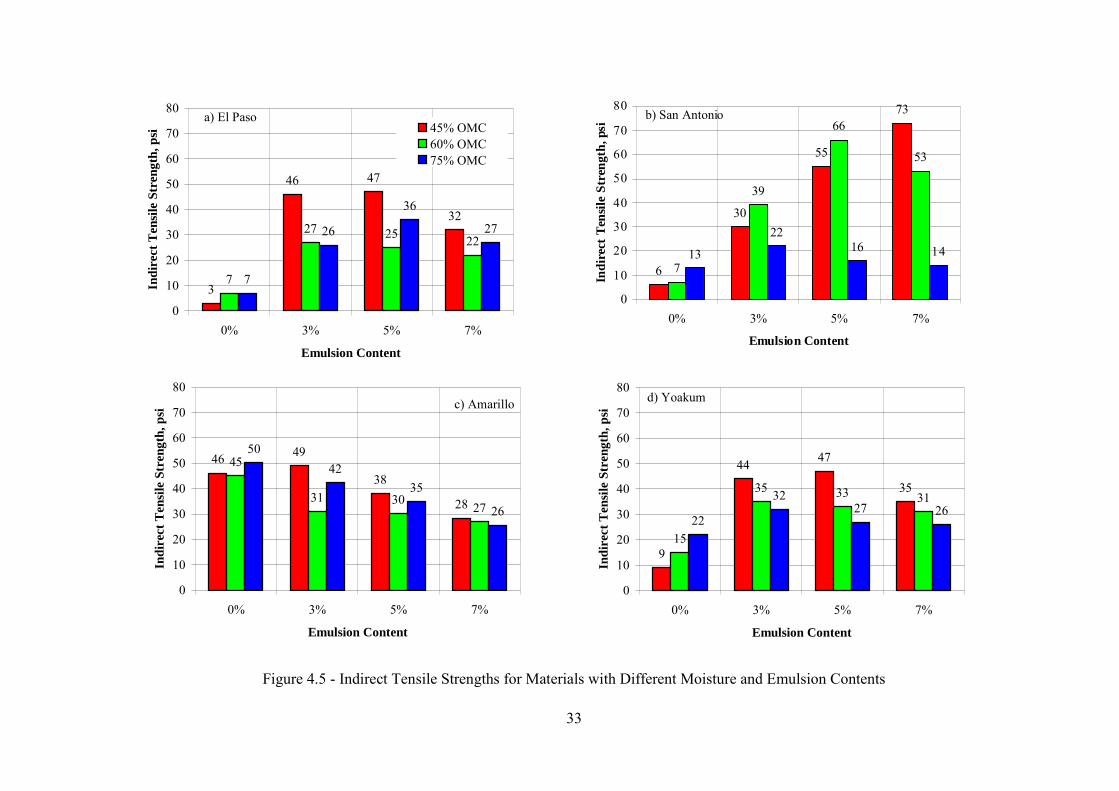
33
Figure 4.5 - Indirect Tensile Strengths for Materials with Different Moisture and Emulsion Contents
3
46 47
32
7
27 25 22
7
26
36
27
0
10
20
30
40
50
60
70
80
0% 3% 5% 7%
Emulsion Content
Indi
rect
Ten
sile
Str
engt
h, p
si 45% OMC60% OMC75% OMC
a) El Paso
6
30
55
73
7
39
66
53
13
2216 14
0
10
20
30
40
50
60
70
80
0% 3% 5% 7%
Emulsion Content
Indi
rect
Ten
sile
Str
engt
h, p
si
b) San Antonio
46 49
38
28
45
31 30 27
5042
35
26
0
10
20
30
40
50
60
70
80
0% 3% 5% 7%
Emulsion Content
Indi
rect
Ten
sile
Str
engt
h, p
si
9
44 47
35
15
35 33 31
22
3227 26
0
10
20
30
40
50
60
70
80
0% 3% 5% 7%
Emulsion Content
Indi
rect
Ten
sile
Str
engt
h, p
si
d) Yoakumc) Amarillo
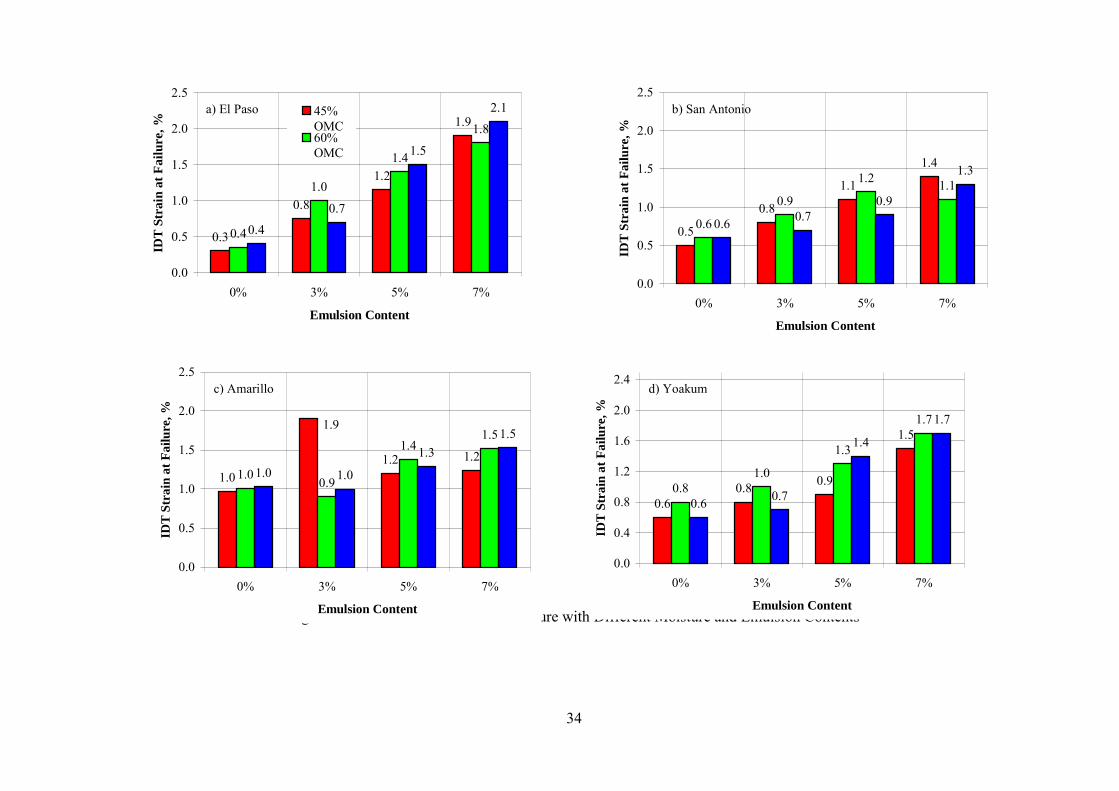
34
Figure 4.6 – Variations in Strains at Failure with Different Moisture and Emulsion Contents
0.3
0.8
1.2
1.9
0.4
1.0
1.4
1.8
0.40.7
1.5
2.1
0.0
0.5
1.0
1.5
2.0
2.5
0% 3% 5% 7%
Emulsion Content
IDT
Str
ain
at F
ailu
re,
%
45%OMC60%OMC75%
0.5
0.8
1.1
1.4
0.6
0.9
1.2 1.1
0.6 0.70.9
1.3
0.0
0.5
1.0
1.5
2.0
2.5
0% 3% 5% 7%
Emulsion Content
IDT
Str
ain
at F
ailu
re, %
1.01.2 1.2
1.0 0.9
1.41.5
1.0 1.0
1.31.5
1.9
0.0
0.5
1.0
1.5
2.0
2.5
0% 3% 5% 7%
Emulsion Content
IDT
Str
ain
at F
ailu
re, %
0.60.8 0.9
1.5
0.81.0
1.3
1.7
0.6 0.7
1.4
1.7
0.0
0.4
0.8
1.2
1.6
2.0
2.4
0% 3% 5% 7%
Emulsion ContentID
T S
trai
n at
Fai
lure
, %
a) El Paso
b) San Antonio
c) Amarillo d) Yoakum
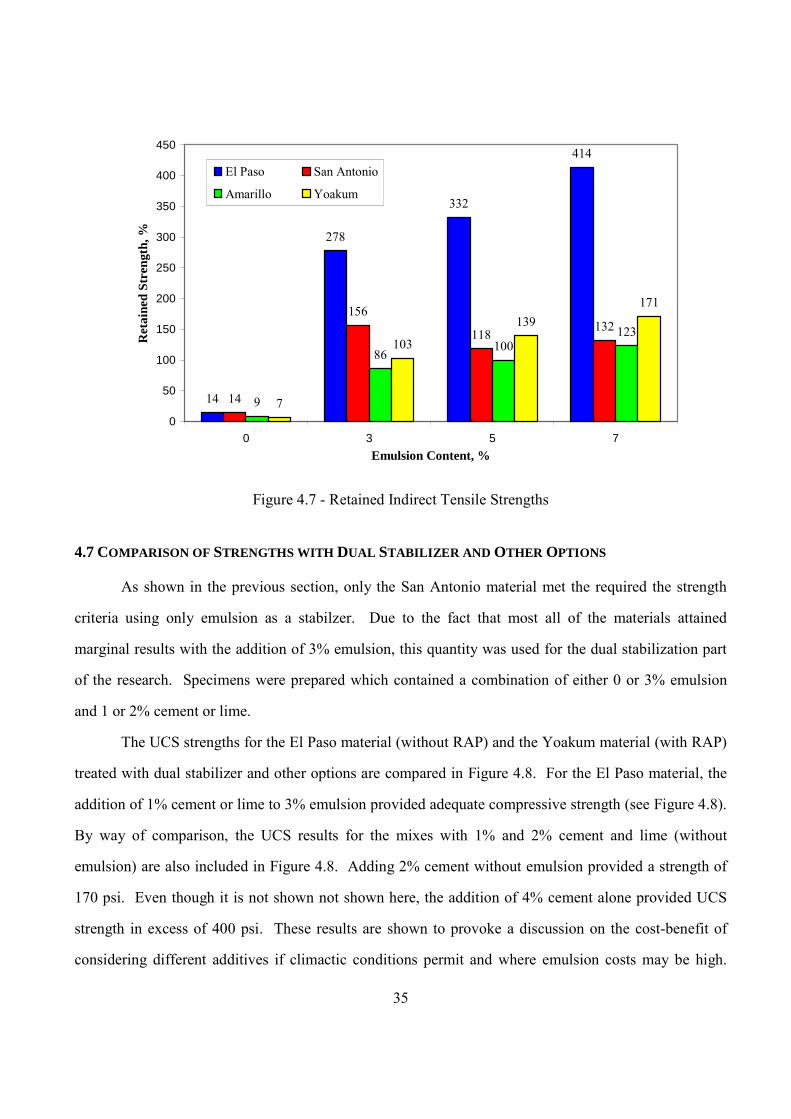
35
14
278
332
414
14
156
118132
9
100123
7
103
139171
86
0
50
100
150
200
250
300
350
400
450
0 3 5 7
Emulsion Content, %
Ret
aine
d S
tren
gth,
%
El Paso San Antonio
Amarillo Yoakum
Figure 4.7 - Retained Indirect Tensile Strengths
4.7 COMPARISON OF STRENGTHS WITH DUAL STABILIZER AND OTHER OPTIONS
As shown in the previous section, only the San Antonio material met the required the strength
criteria using only emulsion as a stabilzer. Due to the fact that most all of the materials attained
marginal results with the addition of 3% emulsion, this quantity was used for the dual stabilization part
of the research. Specimens were prepared which contained a combination of either 0 or 3% emulsion
and 1 or 2% cement or lime.
The UCS strengths for the El Paso material (without RAP) and the Yoakum material (with RAP)
treated with dual stabilizer and other options are compared in Figure 4.8. For the El Paso material, the
addition of 1% cement or lime to 3% emulsion provided adequate compressive strength (see Figure 4.8).
By way of comparison, the UCS results for the mixes with 1% and 2% cement and lime (without
emulsion) are also included in Figure 4.8. Adding 2% cement without emulsion provided a strength of
170 psi. Even though it is not shown not shown here, the addition of 4% cement alone provided UCS
strength in excess of 400 psi. These results are shown to provoke a discussion on the cost-benefit of
considering different additives if climactic conditions permit and where emulsion costs may be high.

36
UCS results for the Yoakum material with different additives are shown in Figure 4.8 as well. The UCS
values of all mixes are greater than 150 psi.
Similarly, the IDTS values for the mixes with different additives or their combinations are shown
in Figure 4.9. For the El Paso material, only the mix with 2% cement satisfied the 50 psi value as
required by the TxDOT Special Specification. Of the Yoakum specimens, either 2% cement or 3%
emulsion plus 1% lime met the requirement. For the Amarillo material, the optimum combination of
additives consisted of 1% cement and 3% emulsion. With such a treatment, the UCS and IDT values are
195 psi and 63 psi, respectively, as compared to the highest values of 140 psi and 49 psi obtained for the
specimens treated with emulsion only.

37
6146
98 88
170194
152
0
50
100
150
200
250
Raw M
ateria
ls
1% Lim
e
2% Lim
e
1% C
emen
t
2% C
emen
t
1% Cem
ent 3
% Emulsion
1% Lim
e 3% Emuls
ion
Additive Type and Amount
Unc
onfin
ed C
ompr
essi
ve S
tren
gth,
psi
Required Value=150 psi forEmulsion-Treated Base
a) El Paso
Figure 4.8- Unconfined Compressive Strengths for El Paso and Yoakum Materials
23
166
273
194
168
0
50
100
150
200
250
300
Raw materials 2%Lime 2%Cement 1% Lime 3%emulsion
1% Cement 3%emulsion
Additive Type and Amount
Unc
onfin
ed C
ompr
essi
ve S
tren
gth,
psi
Required Value = 150 psi for Emulsion-Treated Base
b) Yoakum

38
Figure 4.9- Indirect Tensile Strengths for El Paso and Yoakum Materials
1 1
17
57
40
28
0
10
20
30
40
50
60
1% Lime 2% Lime 1% Cement 2% Cement 1% Cement 3%Emulsion
1% Lime 3%Emulsion
Additive Type and Amount
Indi
rect
Ten
sile
Str
engt
h
Required Value = 50 psi forEmulsion-Treated Base
a) El Paso
32
52
57
36
0
10
20
30
40
50
60
2%Lime 2%Cement 1% Lime 3% emulsion 1% Cement 3% emulsion
Additive Type and Amount
Indi
rect
Te
nsile
Str
eng
th,
psi
Required Value = 50 psi forEmulsion-Treated Base
b) Yoakum
39
4.8 MOISTURE CONDITIONING TESTING
As stated earlier, moisture conditioning testing was performed on the materials using Tex-144-E
“Tube Suction Test” This test provides two major parameters: the dielectric constant and retained
strength. During this process, the dielectric constant is measured on a daily basis and recorded.
Typically, a dielectric value of ten or less is desirable (the dielectric constant of water is 80). As
reflected in Figure 4.10, for all mixes and emulsion contents, the dielectric values are less than 10.
Whereas, the dielectric values from the materials without emulsion are greater. Soil suction,
permeability and the state of bonding of water that accumulates within the aggregate matrix are the most
important parameters impacting the dielectric constant. Preliminarily, a decrease in permeability will
normally result in a reduction in dielectric constant. These results confirm that the moisture
susceptibility of these materials is decreased with the addition of emulsion.
The retained strength is actually the ratio of the UCS values from moisture conditioned and
unconditioned specimens. As reflected in Figure 4.11, all retained strengths were above 100% for mixes
with 5% and 7% emulsions. However, for the San Antonio material with 3% emulsion, the retained
strength is below 80%, required by the specification. This occurs because of the excess fine content in
the San Antonio mix which may provide adequate suction and permeability to allow moisture to be
absorbed by the specimens with low emulsion content. With respect to the Amarillo material, the entire
matrix of test specimens attained adequate retained compressive strength values with the exception of
those which did not contain emulsion. Once again without any additives, the retained strengths of all
materials are substantially lower than mixes with added emulsion.
The FFRC tests were performed shortly prior to carrying out compression testing for all
specimens and the results are shown in Figure 4.12. Similar to the retained strength, the retained
modulus is defined as the ratio of the modulus values from moisture conditioned and non-moisture
conditioned specimens. The retained moduli from the TST specimens are shown in Figure 4.13. It can
be seen that the mixes with emulsion generally yield a value greater than 100%. The mixes without
emulsion perform quite poorly under the moisture conditioning circumstance with retained moduli of
less than 15%..

40
Figure 4.10 – Dielectric Constants for Materials with Different Moisture and Emulsion Contents from TST Specimens
12
54 4
10
4 4 4
11
45 5
0
2
4
6
8
10
12
14
0% 3% 5% 7%
Emulsion Content
Die
letr
ic C
onst
ant
45% OMC60% OMC75% OMC
a) El Paso
9
7
4 4
13
34 4
11
5 54
0
2
4
6
8
10
12
14
0% 3% 5% 7%
Emulsion Content
Die
lecr
ic C
onst
ant
b) San Antonio
6
3 3 3
4 4 4
5
3
4 4 4
0
1
2
3
4
5
6
7
0% 3% 5% 7%
Emulsion Content
Die
lect
ric
Co
nsta
nt
7
34 4
0
1
2
3
4
5
6
7
8
0% 3% 5% 7%
Emulsion ContentD
iele
ctri
c C
ons
tant
d) Yoakum
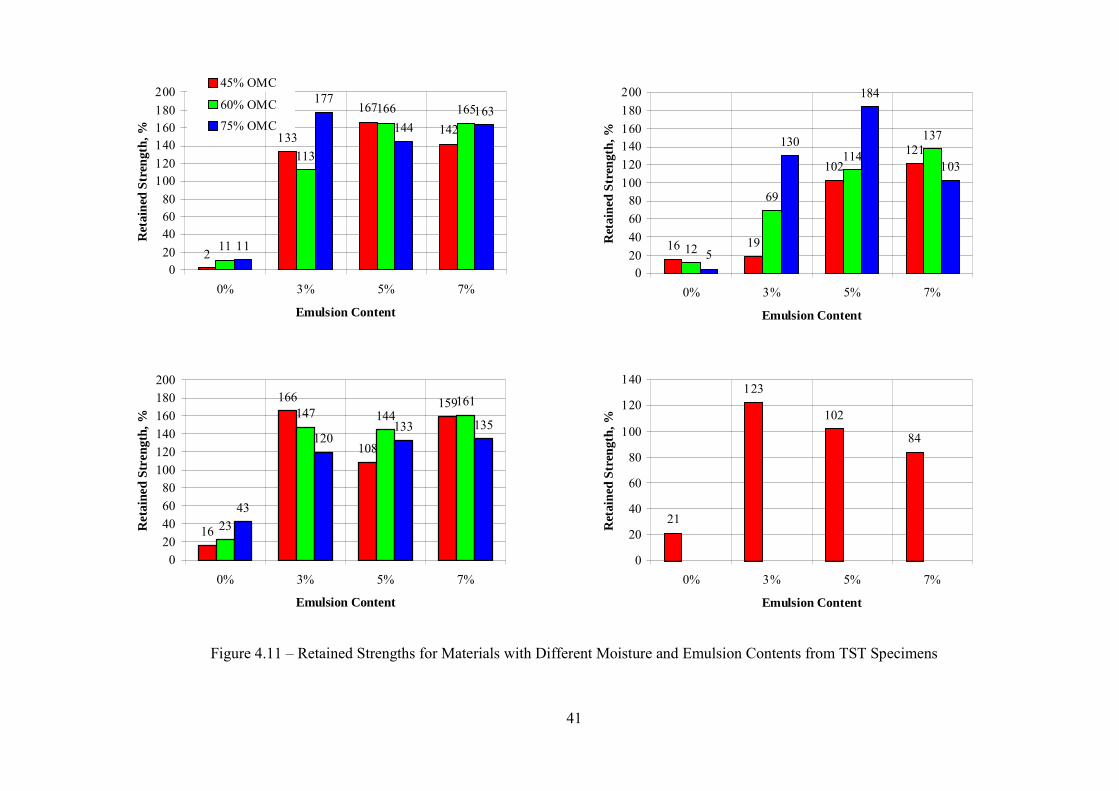
41
Figure 4.11 – Retained Strengths for Materials with Different Moisture and Emulsion Contents from TST Specimens
2
133
167
142
11
113
166 165
11
177
144163
020406080
100120140160180200
0% 3% 5% 7%
Emulsion Content
Ret
aine
d S
tren
gth,
%
45% OMC
60% OMC75% OMC
16 19
102121
12
69
114
137
5
130
184
103
020406080
100120140160180200
0% 3% 5% 7%
Emulsion Content
Ret
aine
d S
tren
gth,
%
16
166
108
159
23
147 144161
43
120133 135
020406080
100120140160180200
0% 3% 5% 7%
Emulsion Content
Ret
aine
d S
tren
gth,
%
21
123
102
84
0
20
40
60
80
100
120
140
0% 3% 5% 7%
Emulsion ContentR
etai
ned
Str
engt
h, %

42
Figure 4.12 - Seismic Moduli for Materials with Different Moisture and Emulsion Contents from UCS Specimens
143
204178
305
131
342
244
312
163
275304
193
0
50
100
150
200
250
300
350
400
0% 3% 5% 7%
Emulsion Content
FFR
C M
odul
us, k
si
16
143
183
124
163 174146
217
260227
156174
0
50
100
150
200
250
300
0% 3% 5% 7%
Emulsion Content
FFR
C M
odul
us, k
si
d) Yoakum
379
782690
573607545
486385
893835
682637
0100200300400500600700800900
1000
0% 3% 5% 7%
Emulsion Content
FFR
C M
odul
us, k
si
45% OMC60% OMC75% OMC
a) El Paso
102
187 177
304285
582
339 361385435
347
243
0
100
200
300
400
500
600
700
0% 3% 5% 7%
Emulsion Content
FFR
C M
odul
us, k
si
b) San Antonio

43
Figure 4.13 - Retained Moduli for Materials with Different Moisture and Emulsion Contents from TST
3
100
143
200
8
184 189
251
8
134
95
189
0
50
100
150
200
250
300
0% 3% 5% 7%
Emulsion Content
Ret
aine
d M
odul
us, %
45% OMC60% OMC75% OMC
15
81
165
112
5
94
162
120
4
101
143
277
0
50
100
150
200
250
300
0% 3% 5% 7%
Emulsion Content
Mod
ulus
, ksi
, %59
136
96
58
135
77
175
71
140 130
67
136
020406080
100120140160180200
0% 3% 5% 7%
Emulsion Content
Ret
aine
d M
odul
us, %
192
104 106 105
0
50
100
150
200
250
0% 3% 5% 7%
Emulsion Content
Ret
aine
d M
odul
us, %

44
4.9 RESILIENT MODULUS TEST
The resilient modulus test is advocated in almost all mechanistic-empirical design methods.
TxDOT currently does not have a protocol for performing resilient modulus tests on base materials.
AASHTO T-307 protocol describes the test procedure for the determination of resilient modulus. The
step-by-step procedure used to determine the resilient moduli of different materials can be found in
Nazarian et al. (1999). The setup required to carry out the tests is shown in Figure 4.14. A repeated
axial cyclic stress of fixed magnitude, load duration, and cycle duration is applied to a test specimen.
During testing, the specimen is subjected to a dynamic cyclic stress and a static-confining pressure
provided by means of a triaxial pressure chamber. The total resilient (recoverable) axial deformation
response of the specimen is measured and used to calculate the resilient modulus. The sequence used in
this project is a modified version of the sequence provided in AASTHO T-307. The test is begun by
applying 1000 repetitions of a load equivalent to a maximum axial stress of 15 psi at a confining
pressure of 15 psi. This is followed by a sequence of loadings with varying confining pressures and
deviator stresses. In this study a combination of confining pressures of 3, 5, 10, 15 and 20 psi and
deviatoric stresses of 1, 2, 3, 5, 6, 9, 10, 15, 20, 30, and 40 psi were used. To utilize the results in
design, the resilient modulus is given by a nonlinear relationship in the form of
32
1k
dk
ckE σσ= (4.2)
where:
k1, k2 and k3 are coefficients determined from laboratory resilient modulus tests
σc and σd are the confining pressure and deviatoric stress, respectively
The advantage of this type of model is that it is universally applicable to fine-grained and coarse-
grained base and subgrade materials. Typical results from two tests are shown in Figure 4.15. The
resilient modulus results on stabilized materials should be independent of the confining pressure and
deviatoric stress. The results from the two tests, shown below, deviate from this trend. This might be

45
due to the fact that the specimens are too stiff for reliable resilient modulus tests as per AASHTO T-307.
Based on these results and the fact that the resilient modulus tests are very time consuming and may not
be suitable for day-to-day use of TxDOT, it is recommended that FFRC tests be performed instead of the
resilient modulus test..
Load Cell
Non-contact Proximitor
Sensors
Pressurized Triaxial Chamber
Soil Specimen
Platen
Load Piston
Figure 4.14 – Resilient Modulus Test Device and Setup

46
Figure 4.15 – Resilient Moduli of El Paso and San Antonio Materials from Specimens Prepared at Designed Total Liquid Contents
0
200
400
600
800
1000
1200
0 5 10 15 20 25 30 35 40 45
Deviatoric Stress (psi)
Res
ilien
t M
od
ulu
s (k
si)
3 psi 5 psi 10 psi 15 psi 20 psi
a) El Paso
0
200
400
600
800
1000
0 5 10 15 20 25 30 35 40 45
Deviatoric Stress (psi)
Res
ilien
t M
odu
lus
(ksi
)
b) San Antonio

47
4.10 OPTIMUM M IX DESIGNS
Based on the results from the two phases of initial testing (with and without lime or cement) the
final mix designs determined for the four materials used in the parametric study are summarized in
Table 4.5 below. These designs fulfill all the design requirements of the current specifications except
for the indirect tensile strength for the El Paso material.
Table 4.5 - Final Mix Designs and Properties for Materials under Study
Parameter El Paso San Antonio Amarillo Yoakum Asphalt Emulsion 3% 5% 3% 3%
Calcium-Based Additive 1% Cement None 1% Cement 1% Lime Mixing Water 60% of OMC 60% of OMC 75% of OMC 60% of OMC
Unconfined Compressive Strength 194 psi 154 psi 195 psi 194 psi
Indirect Tensile Strength 40 psi 55 psi 63 psi 57 psi Retained Strength 122% 114% 115% 96%
Dielectric Constant 3 4 4 4 Resilient Modulus 863 673 N/A N/A
FFRC Seismic Modulus 585 ksi 339 ksi 250 ksi 322 ksi Retained Modulus 130% 162% 85% 92%

48
Chapter 5 - Laboratory Testing – Parametric Studies
5.1 INTRODUCTION
One of the goals of this study was to document the impact of construction-related factors on mix
design results. As such, changes in mix design-related parameters were evaluated during the course of
this research. Gradation changes and how they affect the overall accuracy of the mix design were
looked at. Compaction of the material in the laboratory is a parameter that has not fully been explored
with regards to type of equipment used and was explored more in this study. Emulsion type and its
impact on the strength parameters of stabilized bases is another parameter which was taken into account
during the course of these investigations. Lastly, in order to look at aggregate coating properties, the
effect of initial mixing apparatus on these types of mixes was evaluated.
A number of parametric studies were carried out so that the significant variables that impact the
mix design and in turn the long-term durability of the mixes could be identified. Specimens were made
according to the optimum mix design and subjected to a number of strength tests similar to those used in
the first phase of testing. Due to time constraints, not all tests were carried out on all of the mixes.
5.2 IMPACT OF GRADATION
FDR for road rehabilitation is routinely carried out through the pulverization process which has
the ability to cause changes to the materials gradation. Usually, the change in gradation is an increase in
either sands or fines or both. To test the impact of gradation, besides the natural gradation of the El Paso
material and the San Antonio material, the mixes of three additional gradations made from each of those
two materials were considered. In one mix, it was assumed that the coarse aggregates will be crushed to
the aggregates of sand size; Excess Sand or ES. In the “Excess Fine or EF” gradation, it is assumed that
the coarser aggregates will be crushed to fines. Finally, in the last mix it is assumed that the coarse
aggregates will be crushed to produce both fines and sands; Excess Fine and Sand or ESF. As an
example, the four gradations for the El Paso material are shown in Table 5.1 and graphically in Figure
5.1.

49
Table 5.1 - Gradations Used in This Study
Percent Passing per Sieve Sieve No. Size, mm Natural Excess Sand
(ES) Excess Fines
(EF)
Excess Sand and Fines
(ESF) 13/4 in 44.450 100 100 100 100 7/8 in 22.225 78 78 78 82 3/8 in 9.525 60 60 60 65 No. 4 4.750 45 52 45 54
No. 40 .425 23 27 28 29 No. 100 .150 12 15 23 23 No. 200 .075 5 5 20 20
Figure 5.1 - Gradation Curves of Four Mixes from El Paso Material
The unconfined compressive strengths of the specimens after two days of dry curing and after
moisture conditioning, as well as the tensile strengths of the specimens after two days of dry curing for
all gradations are shown in Figure 5.2. For the El Paso material, the addition of the excess sand or
0
10
20
30
40
50
60
70
80
90
100
0.010.101.0010.00100.00Sieve size, mm
Per
cen
t Pas
sin
g
Avg 247
ES
EF
ESF
Item 247 Min
Item 247 Max
#4 #40 #200FinesGravel Sand

50
excess fine improved the UCS but adversely impacted the IDT. For the San Antonio material, the
addition of excess fines is detrimental to the quality of the mix. The variations in modulus for the same
UCS specimens are shown in Figure 5.3. Similar trends in those values were observed.
This study indicates the importance of considering the change in gradation due to the effect of
pulverization process for the mix design. The design should be carried out on a gradation that considers
the change in gradation during pulverization.
5.3 IMPACT OF EMULSION TYPE
Besides the rate of residual asphalt, a number of other well known factors impact the quality of
an emulsion, and as a result, emulsion mixes. Almost all emulsion projects in the state of Texas
currently utilize a proprietary emulsion. For this reason it (the proprietary emulsion) was one of the
emulsions chosen to be incorporated in this study. Another emulsion provided by Gulf States Asphalt
(GSA) that meets the requirements of TxDOT was also used. Both of these emulsions are ionic in
nature. Although several attempts were made, we could not locate a source of cationic emulsion within
the surrounding area. The results from this study were mixed; as shown in Figure 5.4. For the El Paso
material, the proprietary emulsion provided higher strengths, especially for IDT. With regards to the
San Antonio and Amarillo materials, the GSA emulsion yielded higher dry compressive strengths but
lower tensile strengths. The Yoakum material did not perform as well with the introduction of the
generic emulsion. The results for all strength tests (UCS, IDT and moisture conditioning) showed lower
values than with that of the proprietary emulsion. For all of the materials used in this study, with the
exception of the Yoakum specimens, the moisture conditioned samples with the proprietary emulsion
exhibited higher strengths than the dry-cured specimens; whereas the GSA mixes exhibited some
moisture susceptibility by yielding lower strengths for moisture-conditioned specimens.

51
Figure 5.2 – Impact of Gradation on Strength of Different El Paso and San Antonio Mixes
194
247233 232237
253
189
260
4032 29
50
50
100
150
200
250
300
Ideal Excess Sand Excess Fines Excess Sand & Fines
Gradation
Str
engt
h, p
si
UCS DryUCS Moisture ConditionedIDTS
a) El Paso
154 152
116
174176
197
156
126
66 62
4453
0
50
100
150
200
250
Ideal Excess Sand Excess Fines Excess Sand & Fines
Gradation
Str
eng
th, p
si
b) San Antonio

52
Figure 5.3 – Impact of Gradation on FFRC Modulus of Different El Paso and San Antonio Mixes
585546
825
590
767
670635
603
0
100
200
300
400
500
600
700
800
900
1000
Ideal Excess Sand Excess Fines Excess Sand & Fines
Gradation
Mod
ulus
, ksi
UCS Dry
UCS Moisture Conditioned
a) El Paso
339
914
495
686
550
814
477411
0
100
200
300
400
500
600
700
800
900
1000
Ideal Excess Sand Excess Fines Excess Sand & Fines
Gradation
Mod
ulus
, ksi
b) San Antonio

53
Figure 5.4 - Impact of Emulsion Type on Strength Parameters
194
155
237
143
4022
0
50
100
150
200
250
Proprietary Generic
Emulsion Type
Str
engt
h, p
si
UCS Dry
UCS MoistureConditionedIDTS
a) El Paso 154
194176
155
66 59
0
50
100
150
200
250
Proprietary Generic
Emulsion Type
Str
engt
h, p
si
b) San Antonio
195
242225
197
63 50
0
50
100
150
200
250
300
Propreitary Generic
Emulsion Type
Str
engt
h, p
si
194
155
187
93
57 45
0
50
100
150
200
250
Proprietary Generic
Emulsion TypeS
tren
gth,
psi
d)

54
5.4 IMPACT OF M IXING METHOD
The current TxDOT Special Specification does not stipulate one single mixing method to be used
for these types of materials. However, most mix designs are carried out using a new type of mixer
known as a high-shear mixer. The goal of this portion of the study was to determine whether the quality
of a mix is impacted by not using the high-shear mixer. Two alternatives, namely hand mixing and a
small portable concrete mixer were alsoused to prepare specimens.
The variations in strength for specimens prepared with different mixing methods are shown in
Figure 5.5. The strengths of the mixes with the high-shear mixer are greater than those obtained with
the other two methods for all materials except for one case. The Amarillo and Yoakum specimens seem
to be affected less by the type of mixing method used because they contained RAP. The moduli of the
mixes are shown in Figure 5.6. The loss of stiffness is less pronounced for the El Paso materials for the
two alternative methods perhaps because of the addition of cement. Similar to the strength results for
the Amarillo material, the modulus remained relatively consistent despite the variations in mixing
methods. In general, the hand-mixed specimens provided strengths that are closer to the high-shear
mixer. In the absence of a high-shear mixer, the hand-mixing process is preferable to the use of a
concrete mixer
Figure 5.7 shows a comparison of specimens prepared with the high-shear mixer and the
concrete mixer. Although not shown here, the specimens mixed by hand appeared very similar to those
mixed with the concrete mixer. The materials prepared with the high-shear mixer appear to be uniform
with respect to asphalt coating of the aggregates. The specimens which were mixed utilizing the other
two methods appeared “spotty” where the fine aggregates seem to absorb most of the emulsion.
However, the cases mixed with the high-shear mixer tended to clump together.
The impact which mixing has on the gradation of the material was also looked at during this
portion of the study. In order to develop a baseline for gradation changes after mixing, a sample of each
material, batched according to its respective global gradation (see Figure 4.1) was placed in a high-shear
mixer and was then mixed for 60 seconds. The gradations of the materials before and after this activity
are shown in Table 5.2. The gradations of the El Paso materials before and after mixing are similar,

55
whereas the San Antonio mix generated about % fines after mixing. The Yoakum mix does not exhibit
much change in the gradation; but some of the gravel-sized materials in Amarillo mix changed to fine
sands.

56
Figure 5.5 – Impact of Mixing Method on Strength Parameters
194
131 125
237
135150
40 44 33
0
50
100
150
200
250
High Shear Hand Concrete Mixer
Mixing Method
Str
engt
h, p
si
UCS DryUCS Moisture ConditionedIDTSa) El Paso
154
11293
176
27
6766
41
12
0
50
100
150
200
250
High Shear Hand Concrete Mixer
Mixing Method
Str
engt
h, p
si
195174 180
225
162
230
6343 55
0
50
100
150
200
250
High Shear Hand Concrete Mixer
Mixing Method
Str
engt
h, p
si
194 185
153
187
101 105
5739 36
0
50
100
150
200
250
High Shear Hand Concrete Mixer
Mixing MethodS
tren
gth,
psi
d) Yoakum

57
Figure 5.6 – Impact of Mixing Method on FFRC Modulus
585 579
751767
427502
0100200300400500600700
800900
High Shear Hand Concrete Mixer
Mixing Method
Mod
ulus
, ks
i
UCS DryUCS Moisture Conditioned
a) El Paso
339
125 123
550
437
262
0
100
200
300
400
500
600
High Shear Hand Concrete Mixer
Mixing Method
Mod
ulus
, ksi
b) San Antonio
261
169
236250272
328
0
50
100
150
200
250
300
350
High Shear Hand Concrete MixerMixing Method
Mod
ulu
s, k
si
149
314283
322
174
229
0
50
100
150
200
250
300
350
High Shear Hand Concrete MixerMixing Method
Mod
ulus
, ksi
d) Yoakum

58
Table 5.2 – Changes in Gradation due to High-Shear Mixing
Figure 5.7 – Appearances of Specimens Mixed with High-Shear Mixer (Left) and
Concrete Mixer (Right)
Gradation, Individual Retained (%) Material Condition
Gravel Coarse Sand Fine Sand Fines
Before 55 23 18 5 El Paso After 55 21 17 7
Before 52 24 23 1 San Antonio After 50 21 19 10
Before 53 29 16 2 Yoakum After 53 28 17 3
Before 63 25 9 4 Amarillo
After 59 25 12 5

59
5.5 IMPACT OF COMPACTION METHOD
Another contributing factor to strength and durability is the method of compaction. In this
parametric study, three different methods of compaction were investigated. The standard Tex-113-E, a
SGC with 30 gyrations as well as a SGC with 50 gyrations were utilized.
In general, specimens prepared with the gyratory compactor were more uniform than those
prepared with the Tex-113-E. One complication with the gyratory compactor is that some of the liquid
is lost during the compaction process. Typical dry densities obtained from the three methods of
compaction are shown in Figure 5.8. For the UCS specimens, the dry density increases by using the
gyratory compactor and by increasing the number of gyrations. This pattern is more pronounced for the
El Paso materials where the aggregates are harder. For the IDTS specimens, the trend is mixed.
The differences in the strength parameters amongst compaction method are shown in Figure 5.9.
The specimens prepared with the gyratory compactor were stronger than those prepared with the Proctor
method. Specimens prepared with 50 gyrations yielded higher strengths than those with 30 gyrations.
The differences were especially pronounced for the indirect tensile tests. The variations in modulus with
the compaction method, as shown in Figure 5.10, were similar to the trends for the strength tests.

60
Figure 5.8 – Impact of Compaction Method on Dry Density
136
143
134
140
132
139
120
125
130
135
140
145
150
Proctor Superpave 30Gyrations
Superpave 50Gyrations
Compaction Method
Dry
Den
sity
, pcf
UCSIDTS
125 125126
119
128126
114116118120122124126128130
Proctor Superpave 30Gyrations
Superpave 50Gyrations
Compaction Method
Dry
Den
sity
, pc
f
126
118
122122 123 123
114116118
120122124
126128
Proctor Superpave 30Gyrations
Superpave 50Gyrations
Compaction Method
Dry
Den
sity
, pc
f
120121
125
116
121122
112
114116
118120
122124
126
Proctor Superpave 30Gyrations
Superpave 50Gyrations
Compaction MethodD
ry D
ensi
ty, p
cf

61
Figure 5.9 – Impact of Compaction Method on Strength Parameters
194
259285
237
296 289
25 40 45
050
100150200250300350400450
Proctor Superpave 30Gyrations
Superpave 50Gyrations
Compaction Method
Str
engt
h, p
si
UCS DryUCS Moisture ConditionedIDTSa) El Paso
154204
392
176
283327
12
66 44
050
100150200250300350400450
Proctor Superpave 30Gyrations
Superpave 50Gyrations
Compaction Method
Str
eng
th, p
si
b) San Antonio
195230
263225 241
328
3363 55
050
100150200250300350400450
Proctor Superpave 30Gyrations
Superpave 50Gyrations
Compaction Method
Str
engt
h, p
si
194235 260
187
260 264
3057 59
050
100150200250300350400450
Proctor Superpave 30Gyrations
Superpave 50Gyrations
Compaction Method
Str
engt
h,
psi
d) Yoakum

62
Figure 5.10 – Impact of Compaction Method on FFRC Modulus
585 560 615767
601689
0
200
400
600
800
1000
1200
Proctor Superpave 30Gyrations
Superpave 50Gyrations
Compaction Method
Mod
ulus
, ksi
UCS DryUCS Moisture Conditioned a) El Paso
339
489
1031
550422
901
0
200
400
600
800
1000
1200
Proctor Superpave 30Gyrations
Superpave 50Gyrations
Compaction Method
Mod
ulus
, ksi
b) San Antonio
261 207127
250
419
178
0
200
400
600
800
1000
1200
Proctor Superpave 30Gyrations
Superpave 50Gyrations
Compaction Method
Mod
ulus
, ksi
149
356 383322428 423
0
200
400
600
800
1000
1200
Proctor Superpave 30Gyrations
Superpave 50Gyrations
Compaction Method
Mod
ulus
, ks
i
d) Yoakum

63
Chapter 6 - Preliminary Guideline
6.1 INTRODUCTION
As part of this study, researchers at UTEP have developed and evaluated a preliminary protocol
for mix design and required tests for emulsion-treated base materials. The preliminary guideline was
based on the results from both phases of laboratory testing and can be viewed in its entirety in Appendix
C. However, a description of how the guideline came about based on the findings of the research is
given in this chapter. As a reference for understanding the basic steps given in this chapter, a mix
design flow chart is given in Appendix D of this report.
6.2 SAMPLING AND PREPARATION OF MATERIAL
The existing base material and add-rock are to be oven-dried. Once these materials reach a
constant moisture content, sieve analysis and index tests are performed on them. RAP materials should
be dried outside under direct sunlight since even a relatively low oven temperature may lead to clumping
of what little fines that may be present in the RAP. After drying, the RAP it should be freezer before
crushing to facilitate the breaking of the material. A sieve analysis is then performed on the RAP. For
all sieve analyses, a No. 200 sieve should be included in the sieve stack. After obtaining the gradations
of the individual materials being used in the mixture, they are to be combined into a “batch mix”
according to their proportions identified from the field data. This global gradation is then used for
preparing all specimens required for testing.
6.3 DETERMINATION OF OMC AND TLC
The steps outlined in Tex-113-E are to be followed to obtain the OMC as well as the maximum
dry density (MDD). An optimum amount of mixing water (water not already included in emulsion) is
required in order to achieve good blending of both emulsion and aggregate. The adequate emulsion
content is controlled by two parameters: strength and constructability. On one hand, increasing
emulsion content in a mix should ideally increase the minimum strength of the mix. On the other hand,
if for a given mixing water content, an excessive amount of emulsion is added, the air voids will be
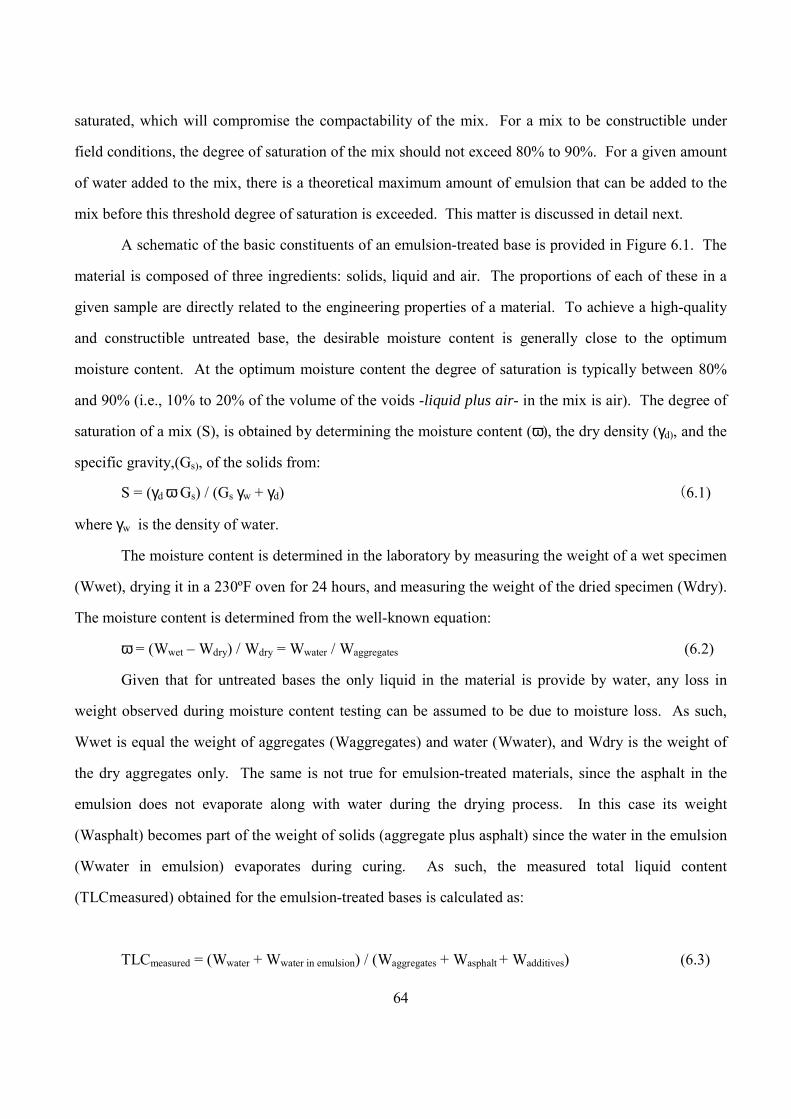
64
saturated, which will compromise the compactability of the mix. For a mix to be constructible under
field conditions, the degree of saturation of the mix should not exceed 80% to 90%. For a given amount
of water added to the mix, there is a theoretical maximum amount of emulsion that can be added to the
mix before this threshold degree of saturation is exceeded. This matter is discussed in detail next.
A schematic of the basic constituents of an emulsion-treated base is provided in Figure 6.1. The
material is composed of three ingredients: solids, liquid and air. The proportions of each of these in a
given sample are directly related to the engineering properties of a material. To achieve a high-quality
and constructible untreated base, the desirable moisture content is generally close to the optimum
moisture content. At the optimum moisture content the degree of saturation is typically between 80%
and 90% (i.e., 10% to 20% of the volume of the voids -liquid plus air- in the mix is air). The degree of
saturation of a mix (S), is obtained by determining the moisture content (ω), the dry density (γd), and the
specific gravity,(Gs), of the solids from:
S = (γd ω Gs) / (Gs γw + γd) (6.1)
where γw is the density of water.
The moisture content is determined in the laboratory by measuring the weight of a wet specimen
(Wwet), drying it in a 230ºF oven for 24 hours, and measuring the weight of the dried specimen (Wdry).
The moisture content is determined from the well-known equation:
ω = (Wwet – Wdry) / Wdry = Wwater / Waggregates (6.2)
Given that for untreated bases the only liquid in the material is provide by water, any loss in
weight observed during moisture content testing can be assumed to be due to moisture loss. As such,
Wwet is equal the weight of aggregates (Waggregates) and water (Wwater), and Wdry is the weight of
the dry aggregates only. The same is not true for emulsion-treated materials, since the asphalt in the
emulsion does not evaporate along with water during the drying process. In this case its weight
(Wasphalt) becomes part of the weight of solids (aggregate plus asphalt) since the water in the emulsion
(Wwater in emulsion) evaporates during curing. As such, the measured total liquid content
(TLCmeasured) obtained for the emulsion-treated bases is calculated as:
TLCmeasured = (Wwater + Wwater in emulsion) / (Waggregates + Wasphalt + Wadditives) (6.3)

65
which is typically lower than the assumed (TLCassumed), which is calculated from:
TLCassumed = (Wwater + Wwater in emulsion + Wasphalt) / (Waggregates + Wadditives) (6.4)
The difference between the assumed and measured TLC has several significant implications in
the mix design as well as the construction quality control. The first implication is demonstrated in
Figure 4.4 where the MD curves from the emulsion-treated materials are significantly different than
those from the untreated materials. The dry density is also required to estimate the degree of saturation
in Equation 6.1. The dry density is typically estimated from the total density (γtotal)and the moisture
content using:
γdry = γtotal / (1 + TLCmeasured) (6.5)
The specific gravity of the emulsion-treated bases can either be estimated or preferably
measured. The values of the TLCmeasured (from Equation 6.3), dry density (from Equation 6.5) and
the specific gravity of the mix can be used in Equation 6.1 to estimate the degree of saturation of the
mix. However, as indicated before, the goal is to limit the emulsion content for a given mixing water
content to ensure that the degree of saturation of the emulsion-treated mixes would not exceed a
threshold value for constructability (say 85%). As such, Equation 6.1 can be rewritten in the form of:
TLCmax = [(γw / γd) + (1 / Gs)] Sthreshold (6.6)
Knowing the TLCmax, and the assumed mixing moisture content (MMC), the maximum
allowable emulsion content (ECmax), can be determined from:
ECmax = TLCmax – MMC (6.7)

66
Figure 6.1 –Constituents of an Emulsion Treated Base

67
Based on this study, it seems that the addition of about 60% of the OMC as mixing water to the
dry aggregate is sufficient for optimum blending of most materials. These calculations are incorporated
into an excel worksheet as described in Appendix E. An example is shown in Figure 6.2. For a mixing
water content of 60% OMC, the maximum recommended emulsion content is 5.2%, whereas for initial
mixing water contents of 45% and 75% of OMC, the maximum recommended emulsion contents
are2.8% and 7.7%, respectively.
Figure 6.2 – Example Variation in Mixing Moisture Content with Maximum Allowable Emulsion Content
2.8%
5.2%
7.7%
0%
2%
4%
6%
8%
10%
12%
14%
16%
0% 20% 40% 60% 80% 100%
Water Content as Percentage of OMC
Max
imum
Em
ulsi
on C
onte
nt

68
6.4 OPTIMUM EMULSION CONTENT FOR STRENGTH
Based on this criteria, the optimum emulsion content is determined by preparing specimens at
different emulsion contents and subjecting them to IDT testing. The minimum emulsion content is 0%
(no emulsion) and the maximum emulsion content is obtained from an excel sheet which incorporates
the previous equations. Two intermediate emulsion contents are also proposed. After being subjected to
IDT testing, the results are analyzed to ensure that the minimum strength requirement is met. The
specimen with the lowest emulsion content that did reach a value of at least 50 psi is then further
evaluated to ensure that the other strength and stiffness parameters in the provision are met as discussed
below. Adequate numbers of specimens of the mix design that met the IDT requirements are prepared
for UCS and moisture susceptibility related tests. If the test results for a given material indicate that no
specimens meet the requirements specified; dual-stabilization (asphalt emulsion plus calcium-based
additive) should be considered.
6.5 ADDITION OF CALCIUM -BASED ADDITIVE
The addition of calcium-based additive to asphalt emulsion-treated base materials is for the
following two major reasons:
• To ensure that the strength/stiffness criteria are met for mixes that do not pass the
requirements even with the maximum allowable emulsion content
• To minimize the use of emulsion which is much more expensive than cement or lime
According to the TxDOT Special Specification, no more than 1% by weight of either cement or
lime should be used in the mix design for emulsion-treated base materials. In the case of Fly Ash, no
more than 2.5% should be added to the material. After determining the optimum emulsion content for a
given material, two more specimens are prepared with their emulsion content reduced by a percentage
equivalent to that of added cement or lime. These specimens are then subjected to IDT testing to ensure
that the minimum strength requirement is met. If the requirement is met, this becomes the new mix
design of the dual-stabilized material after verified with other required tests. During the course of this
research project, it was found that any mix design which passed the minimum IDT requirement, usually
also met the UCS requirement.

69
It should be noted that the addition of calcium-based additives did not always yield positive
effects. In those cases, the possibility of utilizing calcium-based additives alone should be explored.

70
Chapter 7 - Observations and Recommendations
7.1 INTRODUCTION
The goal of this study was to evaluate the current design specifications as outlined by TxDOT
with regards to stabilization of base materials using asphalt emulsion. The end goal was to develop a
laboratory test protocol for selecting the correct combination of additives for dual stabilization of base
materials and draft a guideline for the construction of bases with dual stabilization. As part of this study,
several different materials were sampled and subjected to various forms of testing in order to document
the effects of several parameters on the engineering properties of dual stabilized bases. Parametric
studies were also performed on all of the materials used in this study. In this chapter, recommendations
on all aspects of emulsion only as well as dual stabilized base materials are included.
7.2 M IX DESIGN SELECTION BASED ON RESULTS FROM IDT TESTING
The TxDOT Trial Specification specifies the UCS value as one of the main criteria for selecting
the amount of emulsion to be added to the material. After performing an entire matrix of testing using
both the UCS and IDT, it was observed that the IDT test results are more sensitive to the amount of
emulsion added. Also, the strain at failure of the mixes with emulsion tested under IDT increased
significantly as compared to mixes without emulsion. This demonstrated one of the value added
benefits of the emulsion that should be evaluated during mix design. Due to the fact that soils can not
hold tension, the increased strain which is seen by emulsion stabilized bases could have significant
effects in reducing the cracking of the pavement. As such, it is proposed that the main strength criteria
for mix design to be based on the IDT strength as opposed to the UCS strength. Additionally, using IDT
as the first line of testing will inherently require less material.
7.3 MOISTURE SUSCEPTIBILITY TESTING
Under the current specification, the retained strength in compression is the main indicator of the
moisture susceptibility of the mixes, with the dielectric constant value from TST tests to be reported in
the final mix design. The retained strength in compression was typically acceptable for almost all mixes

71
in tension. This is partly because of the lack of penetration of moisture into the specimen during
moisture conditioning. The lack of penetration of moisture also caused reasonably small values of
dielectric constant. However, in several cases, the retained IDT strengths were less than 80%. This
could be due to the method of compaction; using a gyratory compactor instead of the kneading method
as is the case for UCS specimens. Specimen height may have played a role as well. The UCS specimens
are generally larger and require more time for moisture to fully penetrate them. As such, it is
recommended that the retained IDT be considered as the main criterion for moisture susceptibility.
7.4 INITIAL M IXING WATER CONTENT
During the course of this study, it was observed that an initial mixing water content of 60% of
the OMC was sufficient for adequate compaction. Most materials used in this study followed this rule.
It would be important to look at the index properties of the material or perhaps the RAP content in order
to see why this is so. These could be topics for further research.
7.5 M ISLEADING MODULUS RESULTS
As noted during the course of testing, materials which contained higher RAP contents and no
emulsion what so ever generally reported high FFRC Modulus values. However, the retained strength
values of these specimens after undergoing mechanical testing did not follow the same trend. Non-
emulsion stabilized bases showed very low retained strength values. This modulus phenomenon could
be a direct result of the temperature at which the specimens are initially cured (140ºF). At this high
temperature it may be that the asphalt in the RAP is being “melted” and then cooled again before testing;
allowing for the re-cementation of the asphalt particles in the mix. Hence, the specimens show higher
stiffness values yet do not achieve the strength required.
7.6 PARAMETRIC STUDY RESULTS
After reviewing the results of the various parametric studies performed on a number of materials,
the following conclusions were drawn:
• Changes in gradation of the material have a minimal effect on the strength and stiffness
of the specimens but do impact their retained strengths.
72
• Emulsion type (proprietary or generic) has no significant effect on the final strength
results of these types of stabilized bases. However, the retained strengths with the generic emulsion
were generally lower.
• The use of the high shear mixer as opposed to other means does significantly affect the
strength of these materials, especially in the case of materials with higher fine contents. A more uniform
mix is supplied by the high shear mixer.
• Compaction method does affect the strength/stiffness parameters of emulsion stabilized
bases. The mixes with the gyratory compactor exhibit higher strengths and moduli. The number of
gyrations (30 and 50) also significantly impacts the moduli and strength.

73
References
Asphalt Emulsion Manufacturers Association and the Asphalt Institute (1997), “A Basic Asphalt Emulsion Manual”. Series No.19
Brown, S.F. and D. Needham (2000), “A Study of Cement Modified Bituminous Emulsion Mixtures”, Journal of the Association of Asphalt Paving Technologists, Volume 69. White Bear Lake, MN, pp. 92-121
Cross, S.A. (2000), “Evaluation of Cold In-Place Mixtures on US-283.” Report No. KS-99-4. Final Report. Kansas Department of Transportation. Topeka, Kansas.
Cross, S.A. and D.A. Young (1997), D.A. “Evaluation of Type C Fly Ash in Cold In-Place Recycling”, Journal of the Transportation Research Board, No. 1583, TRB, National Research Council, Washington, DC., pp 82-90.
Epps, J.A. (1990), “Cold Recycled Bituminous Concrete Using Bituminous Materials”, NCHRP Synthesis of Highway Practice 160, TRB, National Research Council, Washington, DC.
Garibay, J.L.,Yuan D., Nazarian, S., and Abdallah, (2007), “Guidelines for Pulverization of Stabilized Bases”, Report TX 0-5223-2, October 2007, El Paso, Texas
Ibrahim, H. (1998), “Assessment and Design of Emulsion-Aggregate Mixtures for Use in Pavements” PhD Dissertation, University of Nottingham, England.
James, A.D., D. Needham and S.F. Brown (1996), “The Benefits of Using Ordinary Portland cement in Solvent Free Dense Graded Bituminous Emulsion Mixtures”. Paper Presented at the International Symposium on Asphalt Technology, Washington.
Johnston, A.G., B. Hogeweide and M. Bellamy (2003) “Environmental and Economic Benefits of Full Depth Reclamation Process in the Urban Context.” In the Transportation Factor 2003. Annual Conference and Exhibition of the Transportation Association of Canada., Ottawa, Canada
Kandahl, P.S. and R.B. Mallick (1997), “Pavement Recycling Guidelines for State and Local Governments”. Report No. FHWA-SA-98-042. Federal Highway Administration. Washington, DC.
Kearney, E.J. and J.E. Huffman (1999) “The Full Depth Reclamation Process.” Journal of the Transportation Research Board, No. No. 1684, TRB, National Research Council, Washington, DC, pp. 203-209.
Mallick, R.B., P.S. Kandahl, E.R. Brown, M.R. Teto, R.L. Bradbury, and E.J. Kearney (2001) “Development of a Rational and Practical Mix Design Method for Full Depth Reclamation.”. Journal of the Association of Asphalt Paving Technologists, Volume 70. White Bear Lake, MN, pp.176-205
Mallick, R.B., S.D. Bonner, R.L. Bradbury, J.O. Andrews, P.S. Kandahl, and J.E. Kearney (2002) “Evaluation of Performance of Full Depth Reclamation Mixes.” Journal of the Transportation Research Board, No. 1809, TRB, National Research Council, Washington, DC., pp 199-208.
74
Parsons, R.L., and J.P. Milburn (2003) “Engineering Behavior of Stabilized Soils.” Journal of the Transportation Research Board, No. 1837, TRB, National Research Council, Washington, DC., pp 20-29.
Pouliot, N, J Marchand, Pigeon, M (2003), Hydration Mechanisms, Microstructure, and Mechanical Properties of Mortars Prepared with Mixed Binder Cement Slurry-Asphalt Emulsion,” Journal of Materials in Civil Engineering, Vol. 15, No. 1, American Society of Civil Engineers.
Salomon, A. and D.E. Newcomb (2001), “Cold In-Place Recycling Literature Review and Preliminary Mixture Design Procedure”. Minnesota Department of Transportation. MN/RC-2000-21.
Rogue, D.F., R.G. Hicks, T.V. Scholz, and D.D. Allen (1992) “Use of Asphalt Emulsions in Cold In-Place Recycling: Oregon Experience” Journal of the Transportation Research Board, No. 1342, TRB, National Research Council, Washington, DC.
Scullion, T., S. Guthrie, and S. Sebesta (2003) “Field performance and design recommendations for full-depth recycling in Texas”. Research Report 4182-3, Texas Transportation Institute, College Station, TX, AugustCampbell, W. G. 1990.

75
Appendix A: Special Specification Emulsion Treatment Road Mixed (by TxDOT)

76

77

78
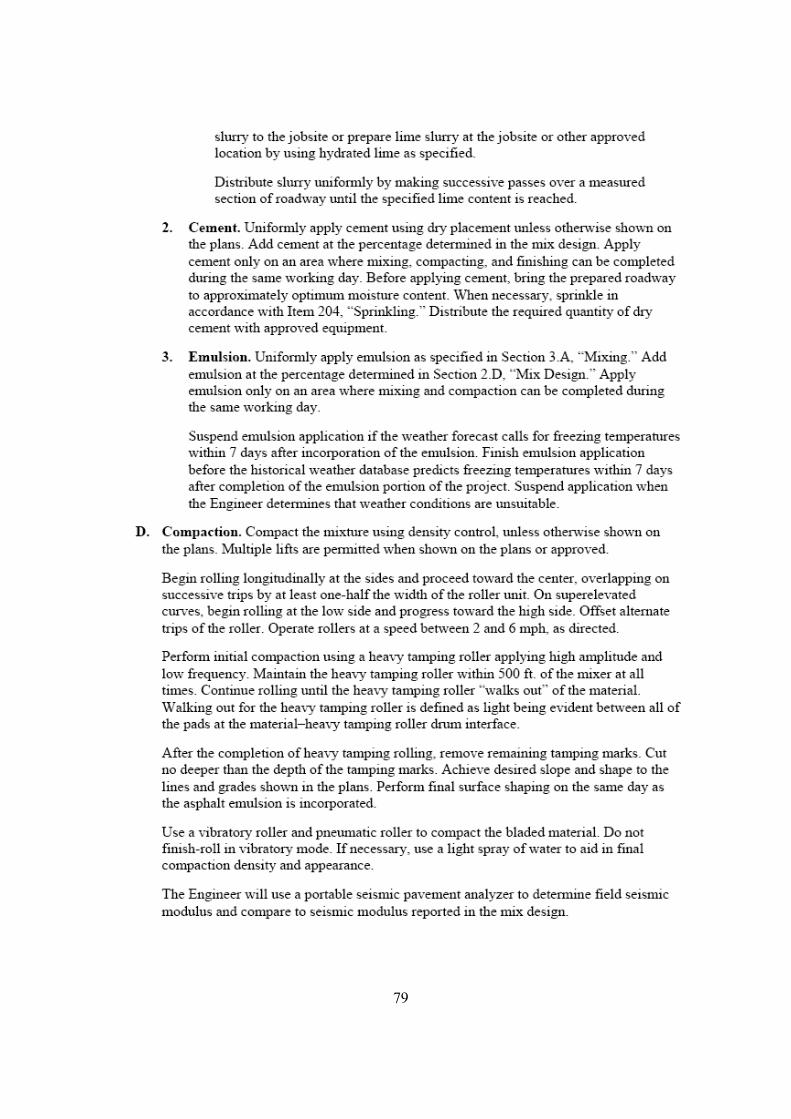
79

80

81
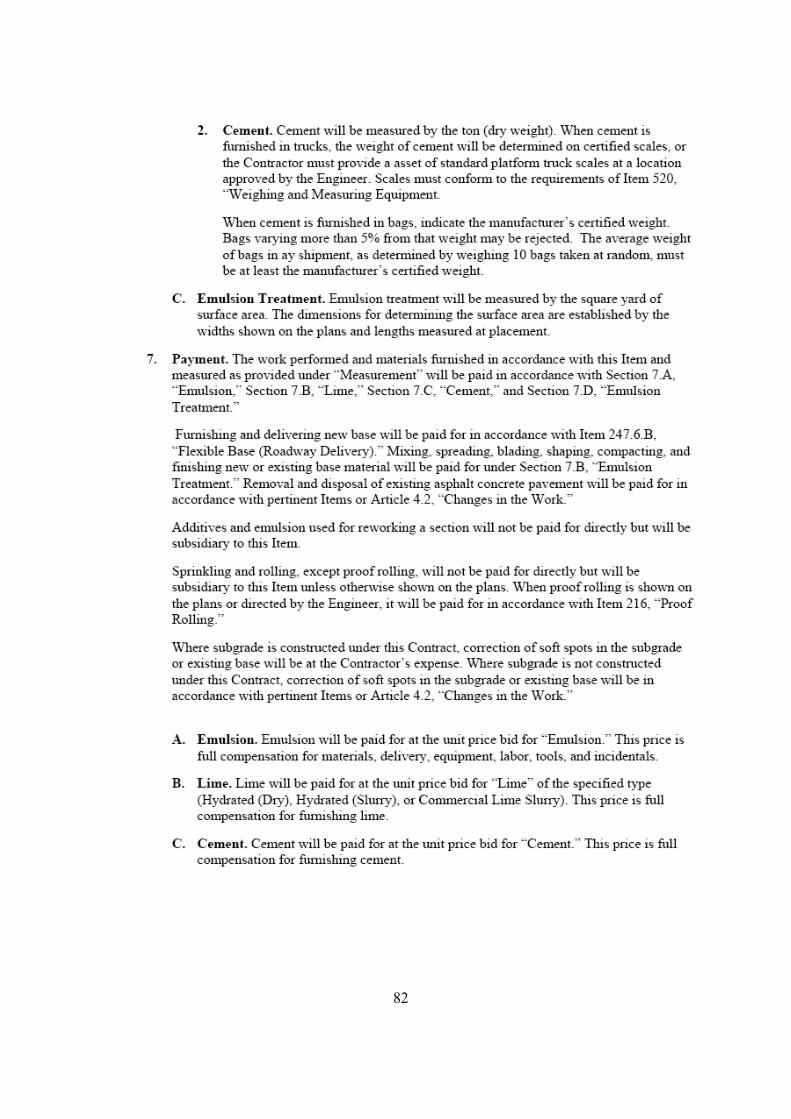
82

83

84
Appendix B: Mix design Procedure – Emulsion Treatment Road Mixed (By Sem Materials)

85

86
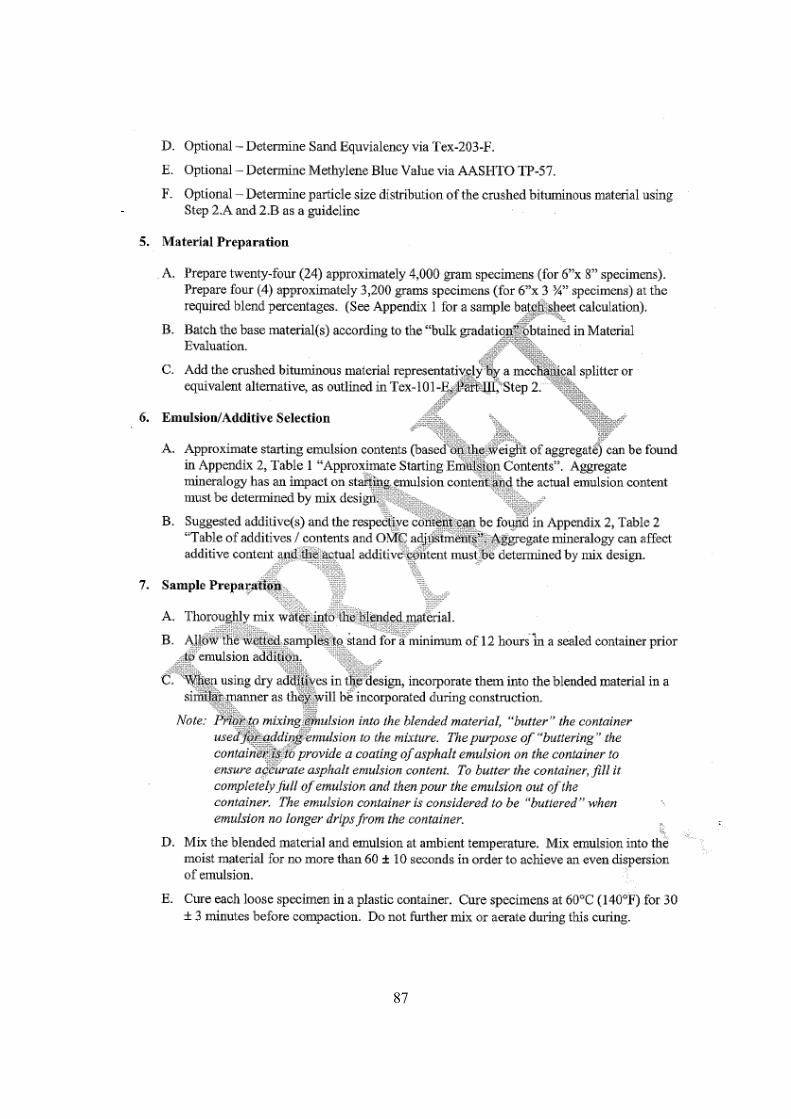
87

88

89

90

91

92

93
Appendix C: Preliminary Guideline for Mix Design and Lab Testing of Dual Stabilized Bases

94
1) Scope This guideline provides the lab procedures for determining the optimum amounts of water, asphalt emulsion and calcium-based additive (if required) for emulsion-treated base materials. 2) Material Preparation Prepare the non-RAP materials (the old granular base and add-rock) as per procedure Tex-101-E, Part II. If RAP is used, the RAP should be crushed and dried to a constant mass without the use of an oven. 3) Blending of Aggregates Blend the materials according to their percentages that will be mixed and used in road mixing. Perform sieve analysis on the base, RAP and add-rock as per Tex-110-E. A No. 200 sieve should be added to the sieve stack. Develop the mixture gradation by combining the gradations of the individual constituents according to their percentages that will be used in road mixing.
4) Determination of OMC and MDD Determine the OMC and MDD of the blended material as per Tex-113-E. 5) Determination of TLC and Emulsion Content A) Estimate the moisture content in the mix (preliminary 60% of OMC). B) Estimate the maximum allowable emulsion content to ensure constructability (based on the
volumetric calculations from the excel spreadsheet). C) Prepare and test four specimens for indirect tensile strength (IDTS) tests. The nominal emulsion
contents of the four specimens are zero (no emulsion), 1/3 of maximum allowable emulsion content, 2/3 of maximum allowable emulsion content and maximum allowable emulsion content, respectively.
D) Determine the optimum emulsion content as the minimum amount of emulsion added to the material
which meets or is closest to the minimum requirements by the TxDOT Special Specification.
Preparation of IDTS Specimens
a) Prepare the material of approximately 12 lbs for each specimen of 6 in. in diameter and 4.5 in. in length.
b) Thoroughly add mixing water (preliminarily 60% of the OMC) to the material c) Allow the wet material to cure for a minimum of 12 hours in a sealed container at ambient
temperature. d) Mix the material and emulsion of the given amount as described in step 5C for 60 seconds (+- 10
seconds) at ambient temperature using a high-shear mixer. In the absence of a high-shear mixer, hand mixing is recommended.

95
Note: The emulsion shall be added to each mixture only after the entire sample is placed in a
high-shear mixing bowl. Failure to do so may result in loss of emulsion e) Transfer the mixture to a plastic container with a diameter of no more than 6 in. and place the
container in an oven set to 140°F for about 30 minutes (+- 3 min). f) Remove the mixture from the container and compact the mixture as per Tex-241-F, Section 5
“Compaction”.
Note: Given that the density varies with the type of material and moisture content, a number of trial and error specimens may be needed, varying the amount of material placed into the gyratory mold, in order to ensure the proper specimen height is achieved.
IDTS Testing
a) After compaction, allow each specimen to cure in an oven set to 104°F for 72 hours, depending
on the requirement by individual mix designs.
b) Cool down the specimen to ambient temperature (about 77°F)
c) Perform IDTS testing on each specimen as per procedure Tex-226-F. Perform modulus testing on each specimen with a V-meter (if available) shortly before IDTS testing.
Addition of Calcium-Based Additive
Prepare and test two additional 6” by 4.5” specimens following the procedure described in “Preparation of IDTS Specimens”: one with 1% cement and another with 1% lime. Each of them contains the emulsion content predetermined.
Note: The addition of calcium-based additive may not always yield positive results. In that case, the final mix design is the minimum amount of emulsion which yields the closest results in accordance with the TxDOT Special Specification.
6) Verification by UCS Testing A) Prepare two 6” by 8” specimens with the amounts of emulsion and calcium-based additive (if
applicable) determined previously from IDTS tests following the procedure described in “Preparation of IDTS Specimens” except for compaction. Procedure Tex-113-E should be used for compaction.
B) Allow each specimen to cure in an oven set to 140°F for 48 hours. C) Perform UCS testing on each specimen using the procedure described in Tex-117-E. Perform
modulus testing on each specimen with a FFRC device (if available) shortly before UCS testing. D) Ensure the mix design yields satisfactory results in accordance with the TxDOT Special
Specification. 7) Verification by Moisture Susceptibility Testing

96
A) For each mixture, prepare two specimens in manner similar to that as described for UCS testing. B) Cure the specimens at 140°F for 48 hours. C) Perform UCS testing on one specimen as per procedure Tex-117-E after the specimen is cooled down
to ambient temperature (about 77°F). D) Put the rest specimen under moisture-conditioning for eight days in manner similar to that described
in procedure Tex-144-E (Tube Suction Test). Note: During this time period the specimens are monitored daily for changes in dielectric constant and modulus using a FFRC device (if available). E) After final readings for modulus and dielectric constant, perform UCS testing on the specimen after
eight-day moisture conditioning using the procedure described in Tex-117-E. F) Calculate the retained UCS strength and the retained modulus (if modulus tests are performed) in
manner similar to that as described in procedure Tex-144-E, ensure the mix design yields satisfactory results in accordance with the TxDOT Special Specification.
8) Report 1. Blend percentages used and percent passing of material 2. Max Dry Density of material with emulsion to nearest 0.1 pcf 3. Optimum Moisture Content to nearest 0.1% 4. Optimum Emulsion Content to nearest 0.1% 5. Amount of calcium-based additive (if required) to nearest 0.1% 6. Unconfined Compressive Strength to nearest 1 psi 7. Indirect Tensile Strength to nearest 1 psi 8. FFRC Modulus to nearest 1 ksi 9. Retained UCS and modulus to nearest 1%

97
Appendix D: Mix Design Flowchart

98
Sieve Analysis
MD Curve of Raw Material
Estimate Initial Emulsion Content
Test for IDTS
No Yes
Add Calcium Based Additive
No Yes
Verify with UCS * *
Report final mix design
Run Emulsion Density Curve
Pass Min Strength*
Change Additive – Consider Cement or
Lime stabilization only
Pass Min Strength

99
Appendix E: Emulsion Analysis Tool Manual

100
This spreadsheet was designed to give TxDOT personnel a more precise starting point for
emulsion selection when deciding the initial amount to be added to stabilized base materials. With some
basic knowledge of the material in question, the engineer can make an educated decision as far as the
quantity of emulsion to be used in their initial mix design considerations; in turn saving time going
through a costly trial and error process. The analysis can also be run for dual stabilized materials.
Note: This is a multi-part spreadsheet, only those sections which pertain to emulsion stabilized
materials are included in this text.
Material Specific Gravity
This section of the sheet requires the user to input mixture specific information. The specific
gravity of the material is to be determined for each separately and then entered into their corresponding
cells. The value for "Percentage used in Mixture" should be calculated based on the volumes to be used
during construction. A brief description of how to do so is shown in the following figure.
Example calculations for material proportioning if not being used in combination with Blending
Analysis Tool

101
Emulsion Information
A basic knowledge of the emulsion to be used during actual construction is required for this
section of the sheet. The user is asked to input the amount of residual asphalt within the emulsion itself.
This value is the amount of asphalt that the emulsion is comprised of expressed as a percentage.
Note: Although the user is free to assign a value for specific gravity of the emulsion, the
recommended value is 1.02.
Cementitious Additive
For this section of the sheet the user is asked to choose between two different types of
cementitious additives to used (cement or lime). It is recommended that the user first run the analysis
with no cementitious additive and then perform the analysis with the addition of a dual stabilizing agent
to compare the results. Default values of specific gravity for both lime and cement (1.2 and 3.15,
respectively) are used for any calculations if one or the other is chosen to be included in the mix.
Desired Degree of Saturation
The user can vary the degree of saturation in order to compare results of moisture within the
mixture. It is recommended however that the analysis be run with a value of 90% saturation in order to
optimize compaction of the material.
Moisture Density Curve Data
In order to ensure accurate analysis of the mixture properties, the user must first perform
moisture-density testing on the material in question. It is important that this testing is performed on the
material according to the gradation percentages previously found so as to accurately represent field
conditions. The moisture content of the material is to be entered in integer form and not as a percentage.
Run Emulsion Analysis
After entering all of the values required, the user is then ready to run the analysis. The emulsion
analysis will run automatically. Afterwards, a graph of the maximum possible emulsion content vs.
initial mixing water content will be generated. This graph gives the user a general idea of what
emulsion content to start off with during the initial mix design. The initial moisture contents are
expressed as percentages of the optimum moisture content for the material.
102
Note: It is important to state that the percentage of emulsion required as shown on the
spreadsheet is based on the maximum amount of emulsion that can be introduced into the mixture in
order to optimize compaction for a given degree of saturation. These values are calculated based on the
optimum total liquid content of the emulsion stabilized base.
What if analysis (Maximum Recommended Emulsion)
After performing the analysis, the user can vary the initial percentage of OMC in order to
compare its effect on the maximum recommended emulsion content. Once a desired emulsion content
has been entered into the required field, the analysis is performed by clicking on the button labeled
“Calculate” (see Figure 16). The black line on the graph is the maximum amount of emulsion that can
be used in the mixture for the desired degree of saturation. The blue line on the graph represents the
same values, however is limited to a value of 6% emulsion.
MD Characteristics
This portion of the analysis is intended for use after the final mix design has been decided upon
by the user. The percentage of emulsion is entered in the required field and the top button labeled
“Update Graph” (see Figure 16) is then clicked. After which a graph of TLC vs Dry Density will be
generated (red line on top graph in blue section). The two curves can then be compared against each
other in order to evaluate the effects of emulsion on the density of the material.
The bottom graph in the orange section illustrates the total liquid content for the material based
on varying initial moisture contents. This graph is generated by clicking on the bottom button labeled
“Update Graph” (see Figure 16) after initial mixing water content is entered into the required field. The
final output gives the designer a general idea of the apparent moisture content which can be anticipated
during field testing.
Note: This section of the analysis is intended for reference use only.

103
Example of Report Sheet

104
Curriculum Vita
Samuel Franco is a native of Clint, Texas but was born in El Paso on March 26th 1980. He
attended Clint public schools all of his life and graduated from Clint High School in 1998. After
graduating from The University of Texas at El Paso in December of 2006 with a Bachelors of Science in
Civil Engineering he stayed at UTEP to fulfill his goal of attaining a Masters degree in the same subject
area. For the past three years has called Austin his home. He currently works for Ferrovial-Agroman
US Corp. as a Project Engineer in their infrastructure and highway construction division. The company
is a world leader in public-private partnerships and design-build projects. Samuel served in the United
States Air Force Reserves as a C-130 engine mechanic from the years of 2001 to 2007. Mr. Franco is an
active member of the Austin community as well as many local organizations in the central Texas area.
Permanent address: Samuel Franco
217 Main St.
Clint, Tx. 79836
This thesis/dissertation was typed by Samuel Franco.