Evaluation and modeling of the size fractionated aerosol ...
15
HAL Id: hal-00296305 https://hal.archives-ouvertes.fr/hal-00296305 Submitted on 3 Aug 2007 HAL is a multi-disciplinary open access archive for the deposit and dissemination of sci- entific research documents, whether they are pub- lished or not. The documents may come from teaching and research institutions in France or abroad, or from public or private research centers. L’archive ouverte pluridisciplinaire HAL, est destinée au dépôt et à la diffusion de documents scientifiques de niveau recherche, publiés ou non, émanant des établissements d’enseignement et de recherche français ou étrangers, des laboratoires publics ou privés. Evaluation and modeling of the size fractionated aerosol particle number concentration measurements nearby a major road in Helsinki ? Part II: Aerosol measurements within the SAPPHIRE project T. Hussein, J. Kukkonen, H. Korhonen, M. Pohjola, L. Pirjola, D. Wraith, J. Härkönen, K. Teinilä, I. K. Koponen, A. Karppinen, et al. To cite this version: T. Hussein, J. Kukkonen, H. Korhonen, M. Pohjola, L. Pirjola, et al.. Evaluation and modeling of the size fractionated aerosol particle number concentration measurements nearby a major road in Helsinki ? Part II: Aerosol measurements within the SAPPHIRE project. Atmospheric Chemistry and Physics, European Geosciences Union, 2007, 7 (15), pp.4081-4094. hal-00296305
Transcript of Evaluation and modeling of the size fractionated aerosol ...

HAL Id: hal-00296305https://hal.archives-ouvertes.fr/hal-00296305
Submitted on 3 Aug 2007
HAL is a multi-disciplinary open accessarchive for the deposit and dissemination of sci-entific research documents, whether they are pub-lished or not. The documents may come fromteaching and research institutions in France orabroad, or from public or private research centers.
L’archive ouverte pluridisciplinaire HAL, estdestinée au dépôt et à la diffusion de documentsscientifiques de niveau recherche, publiés ou non,émanant des établissements d’enseignement et derecherche français ou étrangers, des laboratoirespublics ou privés.
Evaluation and modeling of the size fractionated aerosolparticle number concentration measurements nearby a
major road in Helsinki ? Part II: Aerosol measurementswithin the SAPPHIRE project
T. Hussein, J. Kukkonen, H. Korhonen, M. Pohjola, L. Pirjola, D. Wraith, J.Härkönen, K. Teinilä, I. K. Koponen, A. Karppinen, et al.
To cite this version:T. Hussein, J. Kukkonen, H. Korhonen, M. Pohjola, L. Pirjola, et al.. Evaluation and modeling ofthe size fractionated aerosol particle number concentration measurements nearby a major road inHelsinki ? Part II: Aerosol measurements within the SAPPHIRE project. Atmospheric Chemistryand Physics, European Geosciences Union, 2007, 7 (15), pp.4081-4094. �hal-00296305�

Atmos. Chem. Phys., 7, 4081–4094, 2007www.atmos-chem-phys.net/7/4081/2007/© Author(s) 2007. This work is licensedunder a Creative Commons License.
AtmosphericChemistry
and Physics
Evaluation and modeling of the size fractionated aerosol particlenumber concentration measurements nearby a major road inHelsinki – Part II: Aerosol measurements within the SAPPHIREproject
T. Hussein1,2, J. Kukkonen3, H. Korhonen3,4, M. Pohjola3, L. Pirjola 1,5, D. Wraith 6, J. Hark onen3, K. Teinil a3,I. K. Koponen1,7, A. Karppinen3, R. Hillamo3, and M. Kulmala1
1University of Helsinki, Department of Physical Sciences, Finland2Stockholm University, Department of Applied Environmental Science, Sweden3Finnish Meteorological Institute, Air Quality Research, Finland4Institute for Atmospheric Science, School of Earth and Environment, University of Leeds, UK5Helsinki Polytechnic, Department of Technology, Finland6School of Mathematical Science, Queensland University of Technology, Brisbane, Australia7Department of Chemistry, University of Copenhagen, Denmark
Received: 19 December 2006 – Published in Atmos. Chem. Phys. Discuss.: 23 March 2007Revised: 28 June 2007 – Accepted: 29 June 2007 – Published: 3 August 2007
Abstract. This study presents an evaluation and modelingexercise of the size fractionated aerosol particle number con-centrations measured nearby a major road in Helsinki during23 August–19 September 2003 and 14 January–11 Febru-ary 2004. The available information also included electronictraffic counts, on-site meteorological measurements, and ur-ban background particle number size distribution measure-ment. The ultrafine particle (UFP, diameter<100 nm) num-ber concentrations at the roadside site were approximatelyan order of magnitude higher than those at the urban back-ground site during daytime and downwind conditions. Boththe modal structure analysis of the particle number size dis-tributions and the statistical correlation between the trafficdensity and the UFP number concentrations indicate that theUFP were evidently from traffic related emissions. The mod-eling exercise included the evolution of the particle numbersize distribution nearby the road during downwind condi-tions. The model simulation results revealed that the eval-uation of the emission factors of aerosol particles might notbe valid for the same site during different time.
Correspondence to: T. Hussein([email protected])
1 Introduction
There is a strong indication that adverse health effects ofparticulate matter (PM) are not related only to aerosol par-ticle mass concentration, but instead, related to many otheraerosol properties including particle number concentrationand chemical composition (e.g. Penttinen et al., 2001; Os-unsanya et al., 2001). In addition, the state (liquid or solid),volatility, hygroscopicity, morphology, and density of parti-cles can be considered important.
Regionally, new particle formation contributes a majorpart to ultrafine particle (UFP, diameter<100 nm) numberconcentrations (Kulmala et al., 2004). In Nordic countries,long-range transport (LRT) of aerosol particles constitutesan important part of the total urban background PM2.5 (e.g.Karppinen et al., 2004; Johansson et al., 1999). In additionto LRT, aerosol particles in urban areas are originated fromseveral local sources, most frequently vehicular traffic andindustrial emissions. In urban areas, the temporal and spatialvariation of both the particle number and PM10 concentra-tions are commonly closely related to local meteorology andtraffic flows. These dependencies are moderate for PM2.5 asthey are caused mainly by the substantial LRT background(e.g. Pohjola et al., 2000, 2002, 2003; Laakso et al., 2003).
Vehicular dispersion models are essential computationaltools in modern municipal and urban planning. For model
Published by Copernicus Publications on behalf of the European Geosciences Union.
4082 T. Hussein et al.: Part II – roadside versus urban background
evaluation, air quality data have to be combined with simul-taneous measurements of traffic flow and meteorological pa-rameters as well as information about local topography andbuildings (Luhar and Patil, 1989; Benson, 1992; Kukkonenet al., 2001; Oettl et al., 2001; Tiitta et al., 2002; Levitin etal., 2005). Evaluation of roadside dispersion models is se-riously hindered by the scarcity of appropriate good-qualityexperimental datasets (e.g. Kukkonen et al., 2001). However,few studies addressed size-fractionated aerosol particles suchas Wahlin et al. (2001) and Ketzel et al. (2003) who devel-oped inverse modeling tools to evaluate the emission factorsof UFP originating from various pollution sources at variousurban and rural locations in Denmark. Pohjola et al. (2003)and Vignati et al. (1999) combined vehicular plume modelswith particle transformation models (i.e. aerosol dynamicsmodels) in order to assess the impacts of coagulation, con-densation of water vapour, and plume dilution on the particlenumber size distribution. Pohjola et al. (2003) also used asimple plume model combined with a monodisperse aerosoldynamic model that included chemical composition of par-ticles in order to study the importance of aerosol processesduring dispersion near a road. Dilution ratios of aerosol par-ticles can be also obtained from empirical CO dilution ratioswhen the evolution of aerosol particles is dominated by dilu-tion, condensation, and evaporation processes and the effectsof coagulation and deposition are minor (Zhang and Wexler,2004).
The main objectives of this study (Part II) are to investi-gate, evaluate, and simulate size-fractionated aerosol parti-cle number concentrations measured within the SAPPHIRE(“Source Apportionment of Airborne Particulate Matter andPolycyclic Aromatic Hydrocarbons in Urban Regions of Eu-rope”, 2003–2006) project in Helsinki. The size-fractionatedaerosol measurements were performed simultaneously at aroadside site and a background site during 23 August–19September 2003 and 14 January–11 February 2004. Traf-fic densities were also measured electronically and meteo-rological parameters were measured on-site. The measureddata sets can be utilized to investigate the physical charac-teristics of fine particulate matter originating from vehiculartraffic combustion emissions. We also used these data setsto perform a model exercise, which included an aerosol dy-namics model (UHMA, Korhonen et al., 2004) and disper-sion model, to simulate the particle number size distributionnearby a road. Part I of this study discussed the model per-formance and development in more details (Pohjola et al.,2007).
2 Materials and methods
2.1 Measurement sites
Helsinki Metropolitan Area and its surrounding regions aresituated on a fairly flat coastal area by the Baltic Sea at thelatitude of 60◦ N. The climate is relatively mild comparedwith many other regions of the same latitudes, mainly due tothe prevailing global atmospheric circulation and the GulfStream. The Helsinki Metropolitan Area comprises fourcities (Helsinki, Espoo, Vantaa and Kauniainen) with a totalarea of 743 km2 and population of approximately one mil-lion.
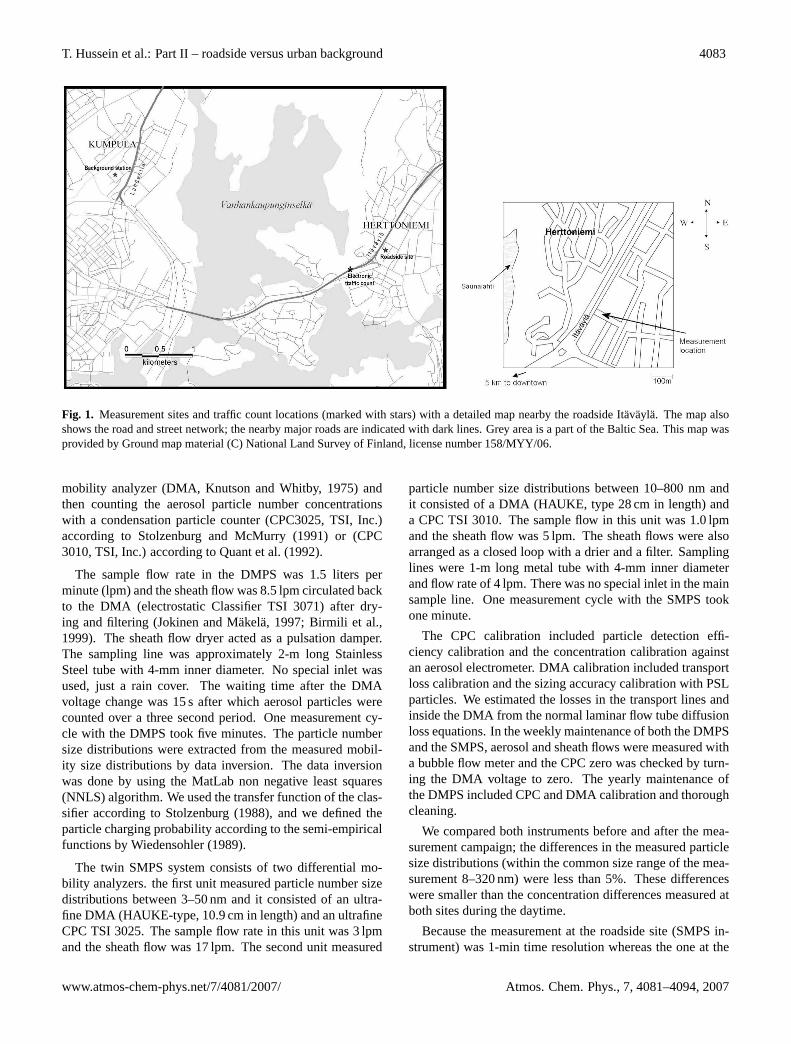
The measurements were performed simultaneously at twolocations: an urban background station (Kumpula) and aroadside site (Herttoniemi), as presented in Fig. 1. Theroadside site was located about 6 km east of the centre ofHelsinki. The surrounding area was suburban, with substan-tial local traffic. In the vicinity of the site, there was a majorhighway (Itavayla) at a distance of 65 m, as measured fromthe center line of the road (Fig. 1). The measurement site waslocated in a fairly flat homogeneous terrain; there were noobstacles towards the direction of the major road (Itavayla)except for few low buildings (including a plastic factory) andtrees that shielded a part of the major road. The plastic fac-tory occasionally provided emissions of aerosol particles dur-ing some time periods, and consequently, these time periodswere excluded from the analysis when the prevailing windwas from that direction.
for comparison purposes, we utilized a part of the contin-uous measurements at the urban background measurementstation that was located on the third floor of the Departmentof Physical sciences (University of Helsinki). The depart-ment building was located on a hilltop of approximately 20 mheight from a nearby Major road (Lahdentie, about 200 m tothe east). The area between this highway and the measure-ment site is forested (∼10 m high); this partly prevents thetransport of the traffic emissions to this direction. The de-partment building was located 5 km northeast the centre ofHelsinki and it was surrounded by residential and universitybuildings situated on the northeastern side.
2.2 Measurements of particle number size distributions
The aerosol particle measurements consisted of high-timeresolution of particle number size distributions (dry size be-tween 8–320 nm at the urban background station and be-tween 3–800 nm at the roadside site). The aerosol measure-ments at the background station were performed with a dif-ferential mobility particle sizer (DMPS, Aalto et al., 2001)and a twin scanning mobility particle sizer (SMPS) at theroadside site. The differential mobility analysis of aerosolparticles relies on bipolar charging of aerosol particles (Liuand Pui, 1974) followed by classification of aerosol parti-cles according to their electrical mobility by a differential
Atmos. Chem. Phys., 7, 4081–4094, 2007 www.atmos-chem-phys.net/7/4081/2007/
T. Hussein et al.: Part II – roadside versus urban background 4083
Fig. 1. Measurement sites and traffic count locations (marked with stars) with a detailed map nearby the roadside Itavayla. The map alsoshows the road and street network; the nearby major roads are indicated with dark lines. Grey area is a part of the Baltic Sea. This map wasprovided by Ground map material (C) National Land Survey of Finland, license number 158/MYY/06.
mobility analyzer (DMA, Knutson and Whitby, 1975) andthen counting the aerosol particle number concentrationswith a condensation particle counter (CPC3025, TSI, Inc.)according to Stolzenburg and McMurry (1991) or (CPC3010, TSI, Inc.) according to Quant et al. (1992).
The sample flow rate in the DMPS was 1.5 liters perminute (lpm) and the sheath flow was 8.5 lpm circulated backto the DMA (electrostatic Classifier TSI 3071) after dry-ing and filtering (Jokinen and Makela, 1997; Birmili et al.,1999). The sheath flow dryer acted as a pulsation damper.The sampling line was approximately 2-m long StainlessSteel tube with 4-mm inner diameter. No special inlet wasused, just a rain cover. The waiting time after the DMAvoltage change was 15 s after which aerosol particles werecounted over a three second period. One measurement cy-cle with the DMPS took five minutes. The particle numbersize distributions were extracted from the measured mobil-ity size distributions by data inversion. The data inversionwas done by using the MatLab non negative least squares(NNLS) algorithm. We used the transfer function of the clas-sifier according to Stolzenburg (1988), and we defined theparticle charging probability according to the semi-empiricalfunctions by Wiedensohler (1989).
The twin SMPS system consists of two differential mo-bility analyzers. the first unit measured particle number sizedistributions between 3–50 nm and it consisted of an ultra-fine DMA (HAUKE-type, 10.9 cm in length) and an ultrafineCPC TSI 3025. The sample flow rate in this unit was 3 lpmand the sheath flow was 17 lpm. The second unit measured
particle number size distributions between 10–800 nm andit consisted of a DMA (HAUKE, type 28 cm in length) anda CPC TSI 3010. The sample flow in this unit was 1.0 lpmand the sheath flow was 5 lpm. The sheath flows were alsoarranged as a closed loop with a drier and a filter. Samplinglines were 1-m long metal tube with 4-mm inner diameterand flow rate of 4 lpm. There was no special inlet in the mainsample line. One measurement cycle with the SMPS tookone minute.
The CPC calibration included particle detection effi-ciency calibration and the concentration calibration againstan aerosol electrometer. DMA calibration included transportloss calibration and the sizing accuracy calibration with PSLparticles. We estimated the losses in the transport lines andinside the DMA from the normal laminar flow tube diffusionloss equations. In the weekly maintenance of both the DMPSand the SMPS, aerosol and sheath flows were measured witha bubble flow meter and the CPC zero was checked by turn-ing the DMA voltage to zero. The yearly maintenance ofthe DMPS included CPC and DMA calibration and thoroughcleaning.
We compared both instruments before and after the mea-surement campaign; the differences in the measured particlesize distributions (within the common size range of the mea-surement 8–320 nm) were less than 5%. These differenceswere smaller than the concentration differences measured atboth sites during the daytime.
Because the measurement at the roadside site (SMPS in-strument) was 1-min time resolution whereas the one at the
www.atmos-chem-phys.net/7/4081/2007/ Atmos. Chem. Phys., 7, 4081–4094, 2007
4084 T. Hussein et al.: Part II – roadside versus urban background
background site (DMPS instrument) was 5-min time resolu-tion, we calculated the 5-min averages of the particle numbersize distributions measured at the roadside site. We also con-sidered the particle size range between 8–320 nm for com-parison purposes.
2.3 Meteorology
The on-site meteorological measurements at the roadside sta-tion (Herttoniemi) included temperature, relative humidity,and wind speed and direction. We measured the meteoro-logical parameters (1-min time resolution) with MILOS500(Vaisala) automatic weather station. Temperature and rela-tive humidity were measured at 5 m height from the groundwhereas wind speed and direction along with temperaturewere measured at 8 m height from the ground. We used thison-site meteorological data for the wind sector analysis todefine the downwind and upwind cases.
2.4 Traffic density
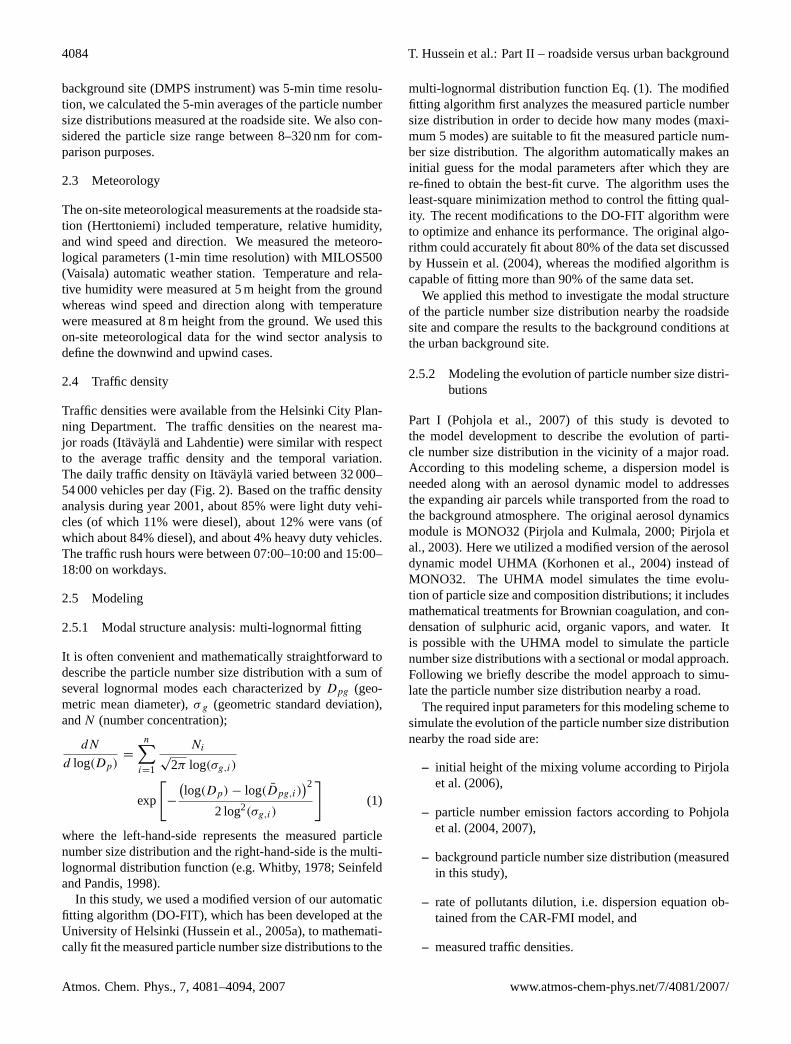
Traffic densities were available from the Helsinki City Plan-ning Department. The traffic densities on the nearest ma-jor roads (Itavayla and Lahdentie) were similar with respectto the average traffic density and the temporal variation.The daily traffic density on Itavayla varied between 32 000–54 000 vehicles per day (Fig. 2). Based on the traffic densityanalysis during year 2001, about 85% were light duty vehi-cles (of which 11% were diesel), about 12% were vans (ofwhich about 84% diesel), and about 4% heavy duty vehicles.The traffic rush hours were between 07:00–10:00 and 15:00–18:00 on workdays.
2.5 Modeling
2.5.1 Modal structure analysis: multi-lognormal fitting
It is often convenient and mathematically straightforward todescribe the particle number size distribution with a sum ofseveral lognormal modes each characterized byDpg (geo-metric mean diameter),σ g (geometric standard deviation),andN (number concentration);
dN
d log(Dp)=
n∑
i=1
Ni√2π log(σg,i)
exp
[
−(
log(Dp) − log(Dpg,i))2
2 log2(σg,i)
]
(1)
where the left-hand-side represents the measured particlenumber size distribution and the right-hand-side is the multi-lognormal distribution function (e.g. Whitby, 1978; Seinfeldand Pandis, 1998).
In this study, we used a modified version of our automaticfitting algorithm (DO-FIT), which has been developed at theUniversity of Helsinki (Hussein et al., 2005a), to mathemati-cally fit the measured particle number size distributions to the
multi-lognormal distribution function Eq. (1). The modifiedfitting algorithm first analyzes the measured particle numbersize distribution in order to decide how many modes (maxi-mum 5 modes) are suitable to fit the measured particle num-ber size distribution. The algorithm automatically makes aninitial guess for the modal parameters after which they arere-fined to obtain the best-fit curve. The algorithm uses theleast-square minimization method to control the fitting qual-ity. The recent modifications to the DO-FIT algorithm wereto optimize and enhance its performance. The original algo-rithm could accurately fit about 80% of the data set discussedby Hussein et al. (2004), whereas the modified algorithm iscapable of fitting more than 90% of the same data set.
We applied this method to investigate the modal structureof the particle number size distribution nearby the roadsidesite and compare the results to the background conditions atthe urban background site.
2.5.2 Modeling the evolution of particle number size distri-butions
Part I (Pohjola et al., 2007) of this study is devoted tothe model development to describe the evolution of parti-cle number size distribution in the vicinity of a major road.According to this modeling scheme, a dispersion model isneeded along with an aerosol dynamic model to addressesthe expanding air parcels while transported from the road tothe background atmosphere. The original aerosol dynamicsmodule is MONO32 (Pirjola and Kulmala, 2000; Pirjola etal., 2003). Here we utilized a modified version of the aerosoldynamic model UHMA (Korhonen et al., 2004) instead ofMONO32. The UHMA model simulates the time evolu-tion of particle size and composition distributions; it includesmathematical treatments for Brownian coagulation, and con-densation of sulphuric acid, organic vapors, and water. Itis possible with the UHMA model to simulate the particlenumber size distributions with a sectional or modal approach.Following we briefly describe the model approach to simu-late the particle number size distribution nearby a road.
The required input parameters for this modeling scheme tosimulate the evolution of the particle number size distributionnearby the road side are:
– initial height of the mixing volume according to Pirjolaet al. (2006),
– particle number emission factors according to Pohjolaet al. (2004, 2007),
– background particle number size distribution (measuredin this study),
– rate of pollutants dilution, i.e. dispersion equation ob-tained from the CAR-FMI model, and
– measured traffic densities.
Atmos. Chem. Phys., 7, 4081–4094, 2007 www.atmos-chem-phys.net/7/4081/2007/
T. Hussein et al.: Part II – roadside versus urban background 4085
Fig. 2. Traffic densities on the major road in the vicinity of the roadside site at Herttoniemi. The time periods correspond to the selectedcases I–V.
Here, the initial height of the mixing volume correspondsto the situation where vehicular exhaust gases and particlesare initially diluted in a time scale of approximately 0.5 safter their discharge from the tailpipe (Pirjola et al., 2006).The initial mixing of aerosol particles is assumed to be de-pendent on traffic-induced turbulence. Traffic-induced turbu-lence can be obtained from the CAR-FMI model that utilizesa semi-empirical treatment based on the General Motors ex-periments (Petersen, 1980).
No emission measurements or modeling were performedwithin the SAPPHIRE campaign, which is presented and dis-cussed in this article. However, the emissions factor of theparticle number concentration from vehicular traffic was pre-viously evaluated, but during different time periods, in Part I(Pohjola et al., 2007) within the LIPIKA campaign that wasconducted on the same site (e.g. Pirjola et al., 2004). Theseevaluations were performed by using measured concentra-tions and inverse dispersion modeling. Due to the availabil-ity of the particle number concentrations from the LIPIKAstudies for this site, the model simulations in this study werelimited to the winter cases. Although the LIPIKA campaign
was not conducted during the same period as the cases con-sidered in this study, the emission factors of aerosol particleswere used here after scaling them with respect to the mea-sured traffic densities.
The nocturnal time period between 01:00 and 03:30 wasassumed to be representative for the urban background parti-cle number size distribution because the local traffic densitywas lowest during that time (Hussein et al., 2005b).
The dispersion equation of aerosol particles from traf-fic exhaust was first extracted from the CAR-FMI model.The CAR-FMI model includes an emission model, a dis-persion model, and statistical analysis of the computed timeseries of concentrations. The CAR-FMI model utilizes themeteorological input data evaluated with the meteorologicalpre-processing model MPP-FMI. The dispersion equation isbased on a semi-analytical solution of the Gaussian diffu-sion equation for a finite line source (Luhar and Patil, 1989).For a more detailed description of these models, the readeris referred to, e.g., Harkonen et al. (2002) and Karppinen etal. (2000a, b).
www.atmos-chem-phys.net/7/4081/2007/ Atmos. Chem. Phys., 7, 4081–4094, 2007
4086 T. Hussein et al.: Part II – roadside versus urban background
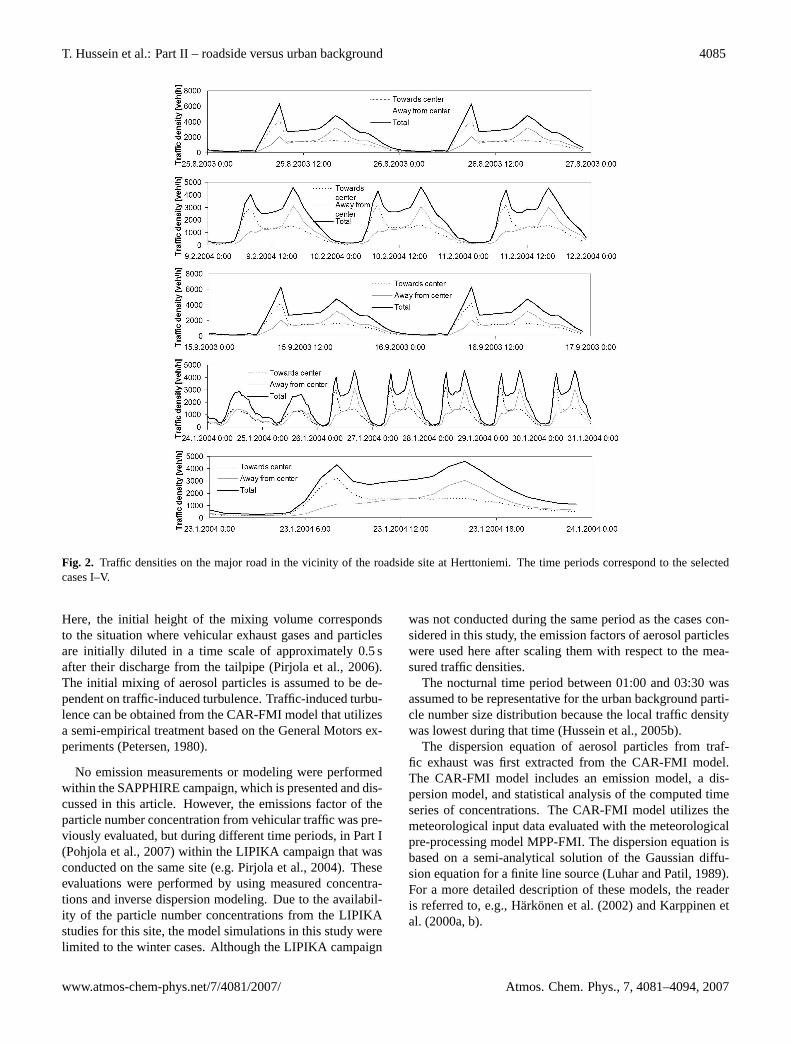
Fig. 3. Cases I and III during the autumn season: downwind condition (left panel) and upwind condition (right panel) at the roadside site(Herttoniemi). (a–d) Relevant weather conditions,(e–f) particle number size distributions at the urban background site (Kupula),(g–h)particle number size distributions at the roadside site (Herttoniemi), and(i–j) particle number concentrations between 8–320 nm.
Table 1. Selected cases of downwind and upwind conditions at the roadside site. WD = wind direction, WS = wind speed, T = ambienttemperature, and RH = relative humidity.
Time period WD WS [m/s] T [◦C] RH%
Case I 23–28 Aug 2003 −90–30 <4 10–15 60–95 DownwindCase II 9–11 Feb 2004 −90–0 <5 −15–−4 55–92 DownwindCase III 14–16 Sep 2003 170–235<4 14–17 70–95 UpwindCase IV 24–30 Jan 2004 45–270 <5 −7.5–−2.5 75–95 Upwind
3 Results and discussion
3.1 Downwind versus upwind nearby a roadside
Based on the wind sector analysis (not shown in this arti-cle), we considered time periods when the prevailing windwas either downwind or upwind at the roadside site. Furthermore, in order to eliminate the wind direction parameter, weconstrained these time periods for rather constant wind direc-tion. As a result, we obtained four time periods: two upwind
cases and two downwind cases. Table 1 presents the averageweather conditions as measured at the roadside site. Cases Iand III were in the autumn season (Fig. 3) whereas cases IIand IV were in the winter season (Fig. 4).
As expected, the daily pattern of the total particle num-ber concentrations at the roadside site was closely similar tothat of the traffic density and the relationship was more pro-nounced during downwind conditions. Furthermore, the totalparticle number concentrations at the roadside site were, ingeneral, comparable to those at the background site during
Atmos. Chem. Phys., 7, 4081–4094, 2007 www.atmos-chem-phys.net/7/4081/2007/
T. Hussein et al.: Part II – roadside versus urban background 4087
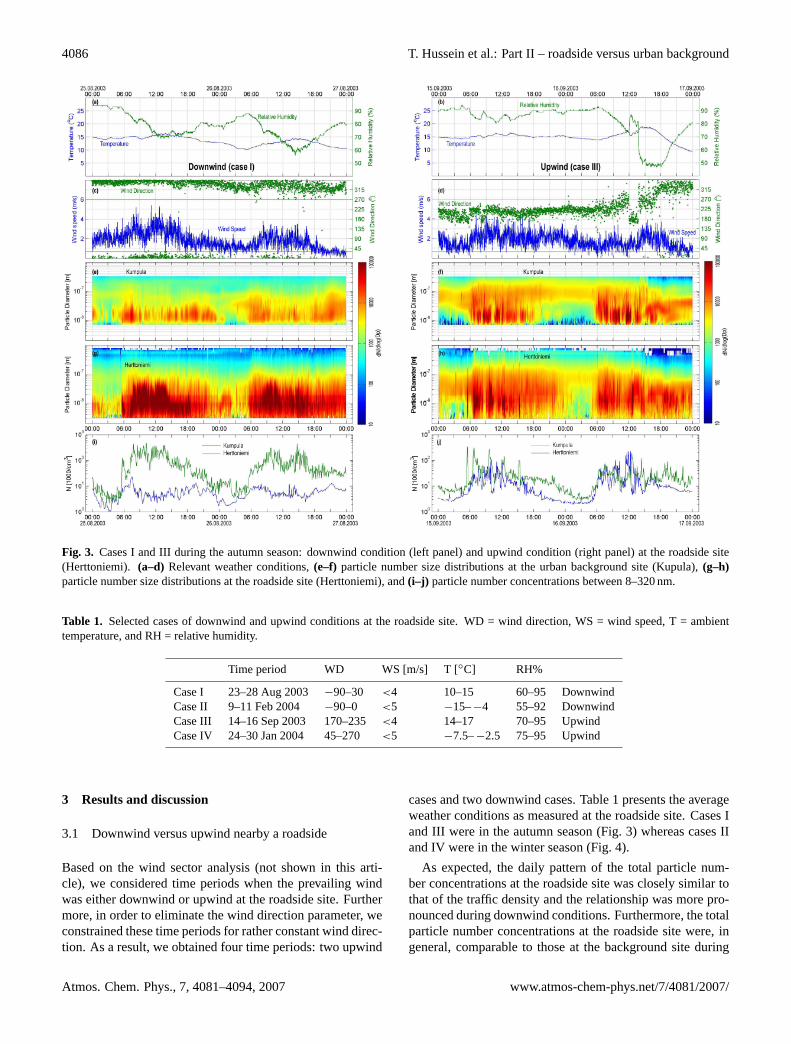
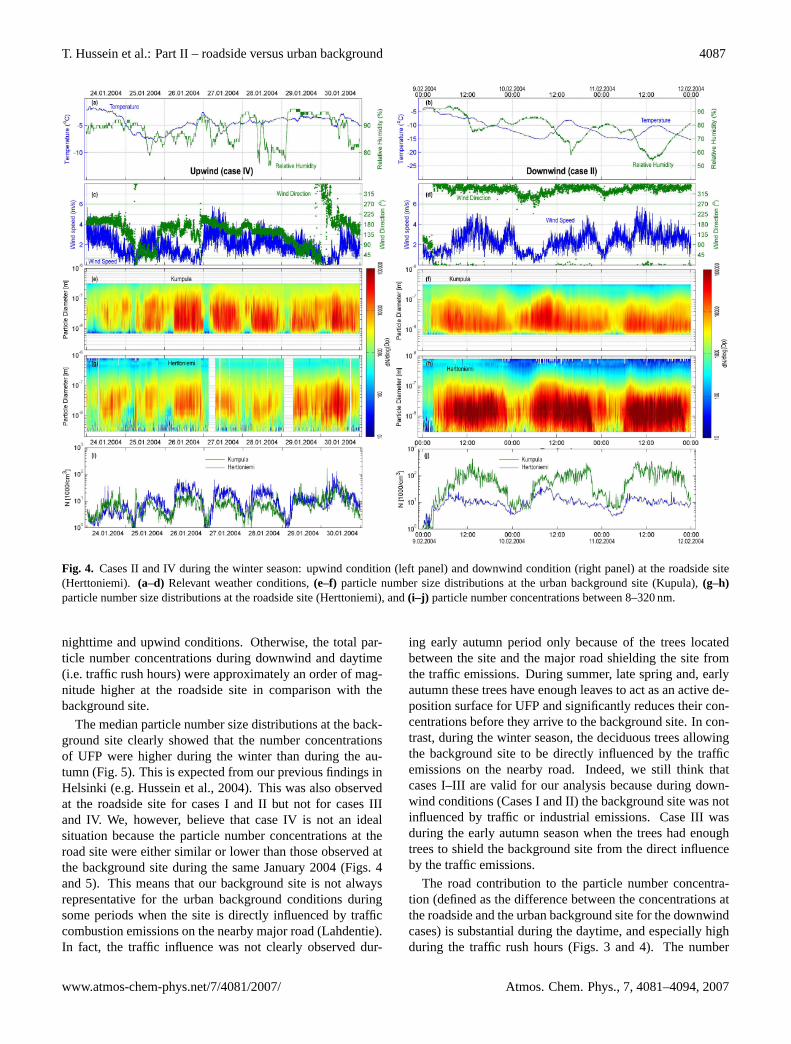
Fig. 4. Cases II and IV during the winter season: upwind condition (left panel) and downwind condition (right panel) at the roadside site(Herttoniemi). (a–d) Relevant weather conditions,(e–f) particle number size distributions at the urban background site (Kupula),(g–h)particle number size distributions at the roadside site (Herttoniemi), and(i–j) particle number concentrations between 8–320 nm.
nighttime and upwind conditions. Otherwise, the total par-ticle number concentrations during downwind and daytime(i.e. traffic rush hours) were approximately an order of mag-nitude higher at the roadside site in comparison with thebackground site.
The median particle number size distributions at the back-ground site clearly showed that the number concentrationsof UFP were higher during the winter than during the au-tumn (Fig. 5). This is expected from our previous findings inHelsinki (e.g. Hussein et al., 2004). This was also observedat the roadside site for cases I and II but not for cases IIIand IV. We, however, believe that case IV is not an idealsituation because the particle number concentrations at theroad site were either similar or lower than those observed atthe background site during the same January 2004 (Figs. 4and 5). This means that our background site is not alwaysrepresentative for the urban background conditions duringsome periods when the site is directly influenced by trafficcombustion emissions on the nearby major road (Lahdentie).In fact, the traffic influence was not clearly observed dur-
ing early autumn period only because of the trees locatedbetween the site and the major road shielding the site fromthe traffic emissions. During summer, late spring and, earlyautumn these trees have enough leaves to act as an active de-position surface for UFP and significantly reduces their con-centrations before they arrive to the background site. In con-trast, during the winter season, the deciduous trees allowingthe background site to be directly influenced by the trafficemissions on the nearby road. Indeed, we still think thatcases I–III are valid for our analysis because during down-wind conditions (Cases I and II) the background site was notinfluenced by traffic or industrial emissions. Case III wasduring the early autumn season when the trees had enoughtrees to shield the background site from the direct influenceby the traffic emissions.
The road contribution to the particle number concentra-tion (defined as the difference between the concentrations atthe roadside and the urban background site for the downwindcases) is substantial during the daytime, and especially highduring the traffic rush hours (Figs. 3 and 4). The number
www.atmos-chem-phys.net/7/4081/2007/ Atmos. Chem. Phys., 7, 4081–4094, 2007
4088 T. Hussein et al.: Part II – roadside versus urban background
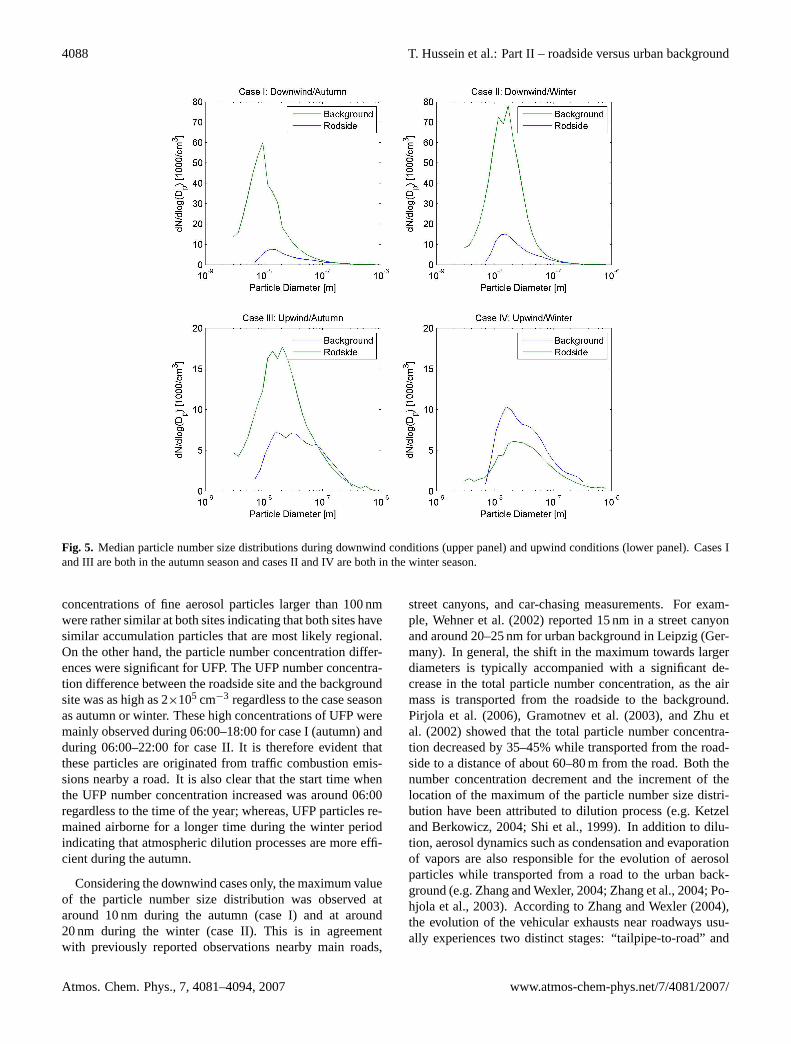
Fig. 5. Median particle number size distributions during downwind conditions (upper panel) and upwind conditions (lower panel). Cases Iand III are both in the autumn season and cases II and IV are both in the winter season.
concentrations of fine aerosol particles larger than 100 nmwere rather similar at both sites indicating that both sites havesimilar accumulation particles that are most likely regional.On the other hand, the particle number concentration differ-ences were significant for UFP. The UFP number concentra-tion difference between the roadside site and the backgroundsite was as high as 2×105 cm−3 regardless to the case seasonas autumn or winter. These high concentrations of UFP weremainly observed during 06:00–18:00 for case I (autumn) andduring 06:00–22:00 for case II. It is therefore evident thatthese particles are originated from traffic combustion emis-sions nearby a road. It is also clear that the start time whenthe UFP number concentration increased was around 06:00regardless to the time of the year; whereas, UFP particles re-mained airborne for a longer time during the winter periodindicating that atmospheric dilution processes are more effi-cient during the autumn.
Considering the downwind cases only, the maximum valueof the particle number size distribution was observed ataround 10 nm during the autumn (case I) and at around20 nm during the winter (case II). This is in agreementwith previously reported observations nearby main roads,
street canyons, and car-chasing measurements. For exam-ple, Wehner et al. (2002) reported 15 nm in a street canyonand around 20–25 nm for urban background in Leipzig (Ger-many). In general, the shift in the maximum towards largerdiameters is typically accompanied with a significant de-crease in the total particle number concentration, as the airmass is transported from the roadside to the background.Pirjola et al. (2006), Gramotnev et al. (2003), and Zhu etal. (2002) showed that the total particle number concentra-tion decreased by 35–45% while transported from the road-side to a distance of about 60–80 m from the road. Both thenumber concentration decrement and the increment of thelocation of the maximum of the particle number size distri-bution have been attributed to dilution process (e.g. Ketzeland Berkowicz, 2004; Shi et al., 1999). In addition to dilu-tion, aerosol dynamics such as condensation and evaporationof vapors are also responsible for the evolution of aerosolparticles while transported from a road to the urban back-ground (e.g. Zhang and Wexler, 2004; Zhang et al., 2004; Po-hjola et al., 2003). According to Zhang and Wexler (2004),the evolution of the vehicular exhausts near roadways usu-ally experiences two distinct stages: “tailpipe-to-road” and
Atmos. Chem. Phys., 7, 4081–4094, 2007 www.atmos-chem-phys.net/7/4081/2007/
T. Hussein et al.: Part II – roadside versus urban background 4089
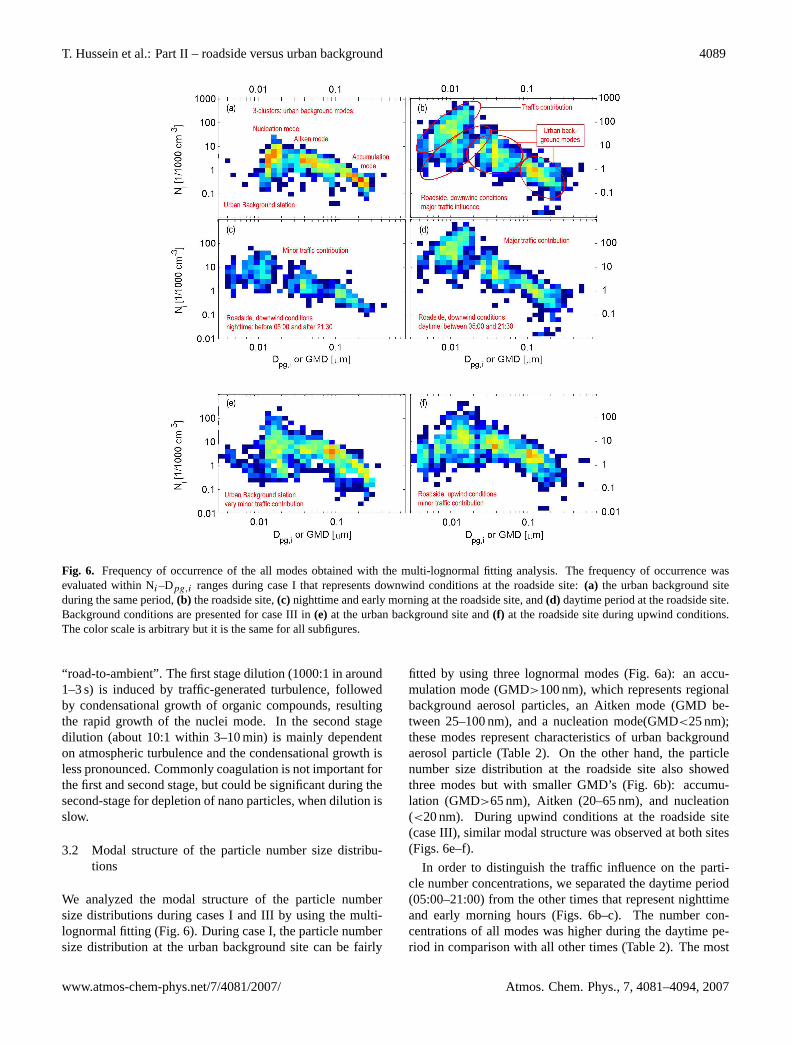
Fig. 6. Frequency of occurrence of the all modes obtained with the multi-lognormal fitting analysis. The frequency of occurrence wasevaluated within Ni–Dpg,i ranges during case I that represents downwind conditions at the roadside site:(a) the urban background siteduring the same period,(b) the roadside site,(c) nighttime and early morning at the roadside site, and(d) daytime period at the roadside site.Background conditions are presented for case III in(e) at the urban background site and(f) at the roadside site during upwind conditions.The color scale is arbitrary but it is the same for all subfigures.
“road-to-ambient”. The first stage dilution (1000:1 in around1–3 s) is induced by traffic-generated turbulence, followedby condensational growth of organic compounds, resultingthe rapid growth of the nuclei mode. In the second stagedilution (about 10:1 within 3–10 min) is mainly dependenton atmospheric turbulence and the condensational growth isless pronounced. Commonly coagulation is not important forthe first and second stage, but could be significant during thesecond-stage for depletion of nano particles, when dilution isslow.
3.2 Modal structure of the particle number size distribu-tions
We analyzed the modal structure of the particle numbersize distributions during cases I and III by using the multi-lognormal fitting (Fig. 6). During case I, the particle numbersize distribution at the urban background site can be fairly
fitted by using three lognormal modes (Fig. 6a): an accu-mulation mode (GMD>100 nm), which represents regionalbackground aerosol particles, an Aitken mode (GMD be-tween 25–100 nm), and a nucleation mode(GMD<25 nm);these modes represent characteristics of urban backgroundaerosol particle (Table 2). On the other hand, the particlenumber size distribution at the roadside site also showedthree modes but with smaller GMD’s (Fig. 6b): accumu-lation (GMD>65 nm), Aitken (20–65 nm), and nucleation(<20 nm). During upwind conditions at the roadside site(case III), similar modal structure was observed at both sites(Figs. 6e–f).
In order to distinguish the traffic influence on the parti-cle number concentrations, we separated the daytime period(05:00–21:00) from the other times that represent nighttimeand early morning hours (Figs. 6b–c). The number con-centrations of all modes was higher during the daytime pe-riod in comparison with all other times (Table 2). The most
www.atmos-chem-phys.net/7/4081/2007/ Atmos. Chem. Phys., 7, 4081–4094, 2007
4090 T. Hussein et al.: Part II – roadside versus urban background
Table 2. Modal structure analysis results of the particle number size distribution showing the variation of the individual mode geometricmean diameter and number concentrations during case I (downwind) at the roadside site and the background site.
Mode-1 Mode-2 Mode-3Site Time GMD Concentration GMD Concentration GMD Concentration
Roadside All <20 7000–1 000 000 20–65 6000–50 000 >65 100–4000>21:30and<05:00
<20 10 000–70 000 20–65 6000–10 000 >65 100–3000
05:00–21:30 <20 7000–1 000 000 20–65 1000–50 000 >65 100–4000
Background All <25 500–50 000 25–100 500–90 000 >100 100–2000
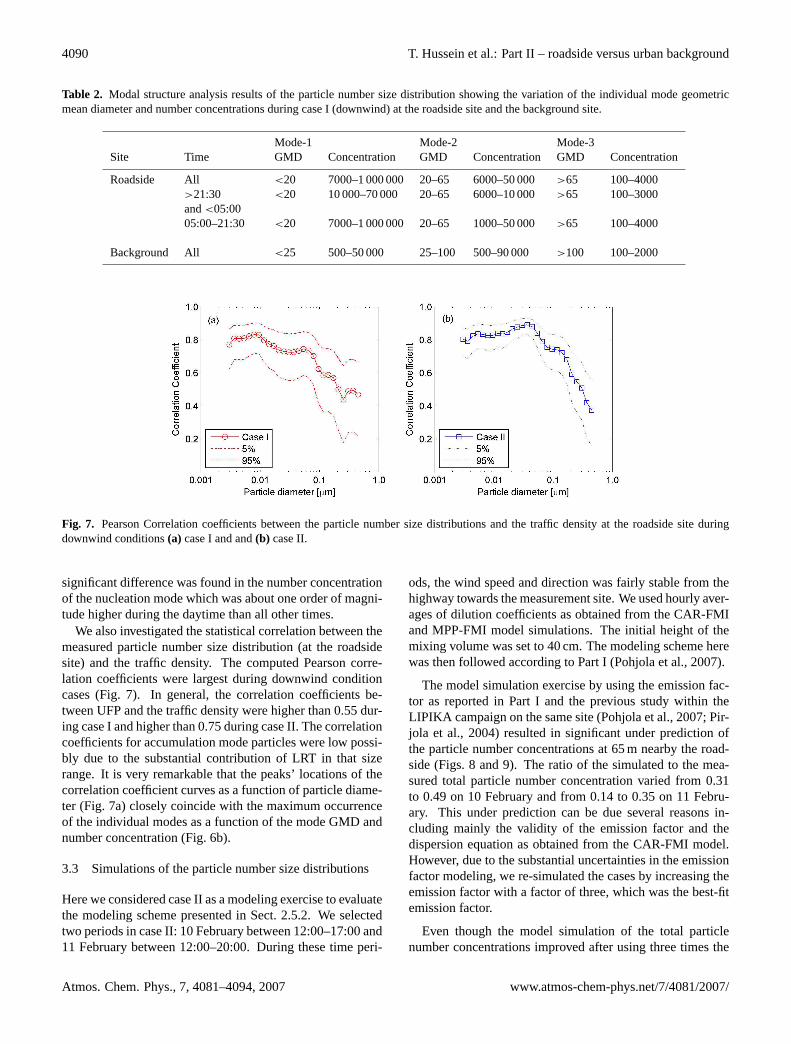
Fig. 7. Pearson Correlation coefficients between the particle number size distributions and the traffic density at the roadside site duringdownwind conditions(a) case I and and(b) case II.
significant difference was found in the number concentrationof the nucleation mode which was about one order of magni-tude higher during the daytime than all other times.
We also investigated the statistical correlation between themeasured particle number size distribution (at the roadsidesite) and the traffic density. The computed Pearson corre-lation coefficients were largest during downwind conditioncases (Fig. 7). In general, the correlation coefficients be-tween UFP and the traffic density were higher than 0.55 dur-ing case I and higher than 0.75 during case II. The correlationcoefficients for accumulation mode particles were low possi-bly due to the substantial contribution of LRT in that sizerange. It is very remarkable that the peaks’ locations of thecorrelation coefficient curves as a function of particle diame-ter (Fig. 7a) closely coincide with the maximum occurrenceof the individual modes as a function of the mode GMD andnumber concentration (Fig. 6b).
3.3 Simulations of the particle number size distributions
Here we considered case II as a modeling exercise to evaluatethe modeling scheme presented in Sect. 2.5.2. We selectedtwo periods in case II: 10 February between 12:00–17:00 and11 February between 12:00–20:00. During these time peri-
ods, the wind speed and direction was fairly stable from thehighway towards the measurement site. We used hourly aver-ages of dilution coefficients as obtained from the CAR-FMIand MPP-FMI model simulations. The initial height of themixing volume was set to 40 cm. The modeling scheme herewas then followed according to Part I (Pohjola et al., 2007).
The model simulation exercise by using the emission fac-tor as reported in Part I and the previous study within theLIPIKA campaign on the same site (Pohjola et al., 2007; Pir-jola et al., 2004) resulted in significant under prediction ofthe particle number concentrations at 65 m nearby the road-side (Figs. 8 and 9). The ratio of the simulated to the mea-sured total particle number concentration varied from 0.31to 0.49 on 10 February and from 0.14 to 0.35 on 11 Febru-ary. This under prediction can be due several reasons in-cluding mainly the validity of the emission factor and thedispersion equation as obtained from the CAR-FMI model.However, due to the substantial uncertainties in the emissionfactor modeling, we re-simulated the cases by increasing theemission factor with a factor of three, which was the best-fitemission factor.
Even though the model simulation of the total particlenumber concentrations improved after using three times the
Atmos. Chem. Phys., 7, 4081–4094, 2007 www.atmos-chem-phys.net/7/4081/2007/

T. Hussein et al.: Part II – roadside versus urban background 4091
Fig. 8. Model simulation exercise for the particle number concentration and size distribution (at 65 m) nearby the road on 10 February 2004:(a) and(c) during 14:00–15:00 and(b) and(d) during 17:00–18:00. The reference distance (0 m) was assumed at the roadside, road-lanewidth was assumed 4 m (3 lanes in each direction), and 6 m grass area in between both directions.
emission factor, the particle number size distribution was notwell predicted most of the time (Figs. 8c–d and 9c–d). It istherefore clear that the model simulation failed for the se-lected cases in this study because the emission factors do notseem very well representative for the selected time period.Though the particle number size distributions and the emis-sion factors were previously evaluated for the same site ac-cording to Pohjola et al. (2007) for a different year (winter of2003–2004). Most likely, the evaluation of the emission fac-tors of aerosol particles from traffic combustion are sensitiveto the ambient conditions, for example the currently avail-able estimates for the detailed aerosol emission characteris-tics vary widely (e.g. Ketzel and Berkowicz, 2004; Pohjolaet al., 2003).
The above mentioned model simulations represent onlya couple of example cases, and the numerical results werecompared with data from a single measurement location.These comparisons should therefore be considered as a testof the modeling approach against the available measurementrather than model evaluation.
4 Summary and conclusions
This work was a part of the SAPPHIRE (“Source Appor-tionment of Airborne Particulate Matter and Polycyclic Aro-matic Hydrocarbons in Urban Regions of Europe”, 2003–2006) project. Measurement campaigns were conducted in
several major European cities, such as Athens, Birmingham,Copenhagen, Helsinki, and Oporto.
In this study we investigated the traffic related size frac-tionated aerosol particle number concentrations and size dis-tributions measured nearby a major road in Helsinki. We alsoperformed a model exercise to simulate the particle numberconcentration and size distribution nearby a major road dur-ing downwind conditions. The available data and informa-tion also included electronic traffic counts, on-site meteoro-logical measurements, and urban background particle num-ber concentration and size distributions.
The contribution of traffic combustion emissions to theparticle number size distribution, mainly ultrafine particles(UFP, diameter<100 nm), was substantial during daytime(downwind conditions) and especially high during the trafficrush hours. The UFP number concentrations at the roadsidesite were approximately an order of magnitude higher thanthose at the urban background site during these periods. Dur-ing upwind conditions, the particle number concentrations atthe roadside site were comparable to those at the urban back-ground site. On the other hand, the accumulation mode parti-cle number concentrations were only slightly affected by theroad contribution.
We also evaluated the statistical correlations between theparticle number size distributions and the traffic densities atthe roadside site. The computed Pearson correlation coef-ficients during the downwind cases were (>0.6) for UFP’s.
www.atmos-chem-phys.net/7/4081/2007/ Atmos. Chem. Phys., 7, 4081–4094, 2007

4092 T. Hussein et al.: Part II – roadside versus urban background
Fig. 9. Model simulation exercise for the particle number concentration and size distribution (at 65 m) nearby the road on 11 February 2004:(a) and(c) during 14:00–15:00 and(b) and(d) during 18:00–19:00. The reference distance (0 m) was assumed at the roadside, road-lanewidth was assumed 4 m (3 lanes in each direction), and 6 m grass area in between both directions.
Along with the modal structure analysis of the particle num-ber size distributions at the roadside site, the UFP are mainlyoriginated from traffic combustion emissions whereas the ac-cumulation mode particles are mainly regional.
The modeling exercise included a dispersion model alongwith an aerosol dynamic model (UHMA, Korhonen et al.,2004) to simulate the particle number size distribution nearbya road. The main results of this modeling exercise showedthat the emission factors of aerosol particles might not bevalid for the same site during similar season but differentyear.
Acknowledgements. This study is a part of the EC-FP5 projectSAPPHIRE (Source Apportionment of Airborne Particulate Matterand Polycyclic Aromatic Hydrocarbons in Urban Regions ofEurope; project number: EVK4-2002-00089). This work was alsoa part of the KOPRA project and co-operation with the LIPIKAproject (629/31/02), both funded by the National TechnologyAgency (TEKES). We also acknowledge the funding from theMinistry of the Environment and the Ministry of Trade andCommunications. We would like to thank H. Seppala of the TrafficPlanning Division at the Helsinki City Planning Department andK. Makela of the Technical Research Center (VTT) for the trafficdensity data.
Edited by: J. Curtius
References
Aalto, P., Hameri, K., Becker, E., Weber, R., Salm, J., Makela,J. M., Hoell, C., O’Dowd, C., Karlsson, H., Hansson, H.-C.,Vakeva, M., Koponen, I. K., Buzorius, G., and Kulmala, M.:Physical characterization of aerosol particles during nucleationevents, Tellus, 53B, 344–358, 2001.
Benson, P.: A review of the development and application of the CA-LINE3 and 4 models, Atmos. Environ., 26B(3), 379–390, 1992.
Birmili, W., Stratmann, F., and Wiedensohler, A.: Design of aDMA-based size spectrometer for large particle size range andstable operation, J. Aerosol Sci., 30, 549–553, 1999.
Gramotnev, G., Brown, R., Ristovski, Z., Hitchins, J., andMorawska, L.: Determination of average emission factors for ve-hicles on a busy road, Atmos. Environ., 37, 465–474, 2003.
Harkonen, J.: Regulatory dispersion modelling of traffic-originatedpollution. Finnish Meteorological Institute, Contributions No.38, FMI-CONT-38, ISSN 0782-6117, University Press, Helsinki,103 p., 2002.
Hussein, T., Dal Maso, M., Petaja, T., Koponen, I. K., Paatero, P.,Aalto, P. P., Hameri, K., and Kulmala, M.: Evaluation of an auto-matic algorithm for fitting the particle number size distributions,Boreal Environ. Res., 10, 337–355, 2005a.
Hussein, T., Hameri, K., Aalto, P. P., and Kulmala, M.: Modalstructure and spatial-temporal variations of urban and subur-ban aerosols in Helsinki area, Atmos. Environ., 39, 1655–1668,2005b.
Hussein, T., Puustinen, A., Aalto, P. P., Makela, J. M., Hameri, K.,and Kulmala, M.: Urban aerosol number size distributions, At-mos. Chem. Phys., 4, 391–411, 2004,
Atmos. Chem. Phys., 7, 4081–4094, 2007 www.atmos-chem-phys.net/7/4081/2007/
T. Hussein et al.: Part II – roadside versus urban background 4093
http://www.atmos-chem-phys.net/4/391/2004/.Johansson, C., Hadenius, A., Johansson, P.A., and Jonson, T.: NO2
and Particulate matter in Stockholm – Concentrations and pop-ulation exposure. The Stockholm Study on Health effects of AirPollution and their Economic Consequences. Swedish NationalRoad Administration. Borlange, Sweden, http://www.slb.nu/lvf,1999.
Jokinen, V. and Makela, J. M.: Closed-loop arrangement with crit-ical orifice for DMA sheath/excess flow system, J. Aerosol Sci.,28, 643–648, 1997.
Karppinen, A, Kukkonen, J., Elolahde, T., Konttinen, M., Kosken-talo, T. and Rantakrans, E.: A modelling system for predict-ing urban air pollution, Model description and applications inthe Helsinki metropolitan area, Atmos. Environ. 34, 3723–3733,2000a.
Karppinen, A., Joffre, S. M., and Kukkonen, J.: The refinement ofa meteorological preprocessor for the urban environment, Int. J.Environ. Pollut., 14, 565–572, 2000b.
Karppinen, A., Harkonen, J., Kukkonen, J., Aarnio, P., and Kosken-talo, T.: Statistical model for assessing the portion of fine partic-ulate matter transported regionally and long-range to urban air,Scand. J. Work Environ. Health, 30 (suppl. 2), 47–53, 2004.
Ketzel, M. and Berkowicz, R.: Modelling the fate of ultrafine parti-cles from exhaust pipe to rural background: an analysis of timescales for dilution, coagulation and deposition, Atmos. Environ.,38, 2639–2652, 2004.
Ketzel, M., Wahlin, P., Berkowicz, R., and Palmgren, F.: Particleand trace gas emission factors under urban driving conditions inCopenhagen based on street and roof-level observations, Atmos.Environ., 37, 2735–2749, 2003.
Knutson, E. O. and Whitby, K. T.: Aerosol classification by electricmobility: apparatus, theory and applications, J. Aerosol Sci., 6,443–451, 1975.
Korhonen, H., Lehtinen, K. E. J., and Kulmala, M.: Aerosol dy-namic model UHMA: Model development and validation, At-mos. Chem. Phys., 4, 757–771, 2004,http://www.atmos-chem-phys.net/4/757/2004/.
Kukkonen, J., Harkonen, J., Karppinen, A., Pohjola, M., Pietar-ila, H., and Koskentalo, T.: A semi-empirical model for urbanPM10 concentrations, and its evaluation against data from anurban measurement network, Atmos. Environ., 35, 4433–4442,2001.
Kulmala, M., Vehkamaki, H., Petaja, T. Dal Maso, M., Lauri, A.,Kerminen, V.-M., Birmili, W., and McMurry, P. H.: Formationand growth rates of ultrafine atmospheric particles: a review ofobservations, J. Aerosol Sci., 35, 143–176, 2004.
Laakso, L., Hussein, T., Aarnio, P., Komppula, M., Hiltunen, V.,Viisanen, Y., and Kulmala, M.: Diurnal and annual characteris-tics of particle mass and number concentrations in urban, ruraland Arctic environments in Finland, Atmos. Environ., 37, 2629–2641, 2003.
Levitin, J., Harkonen, J., Kukkonen, J., and Nikmo, J.:. Evaluationof the CALINE4 and CAR-FMI models against measurementsnear a major road, Atmos. Environ., 39, 4439–4452, 2005.
Liu, B. Y. H. and Pui, D. Y. H.: Electrical neutralization of aerosols,J. Aerosol Sci., 5, 465–472, 1974.
Luhar, A, K. and Patil, R., S.: A General finite line source model forvehicular pollution prediction, Atmos. Environ., 23(3), 555–562,1989.
Oettl, D., Kukkonen, J., Almbauer, R. A., Strum, P. J., Pohjola,M., and Harkonen, J.: Evaluation of a gaussian and lagrangianmodel against a roadside data set, with emphasis on low speedconditions, Atmos. Environ., 35, 2123–2132, 2001.
Osunsanya, T., Prescott, G., and Seaton, A.: Acute respiratory ef-fects of ultrafine particles: mass or number?, Occup. Environ.Med., 58, 154–159, 2001.
Penttinen, P., Timonen, K. L., Tiittanen, P., Mirme, A., Ruuskanen,J., and Pekkanen, J.: Number concentration and size of particlesin urban air: Effects on spirometric lung function in adult asth-matic subjects, Environ. Health Persp., 109, 319–323, 2001.
Petersen, W.: User’s guide for HIWAY2, a highway air pollu-tion model. EPA-600/8-80-018. US Environmental ProtectionAgency, Research Triangle Park, NC, 69 pp, 1980.
Pirjola, L. and Kulmala, M.: Aerosol dynamical model MULTI-MONO, Boreal Environ. Res., 5, 361–374, 2000.
Pirjola, L., Parviainen, H., Hussein, T., Valli, A., Hameri, K., Aalto,P., Virtanen, A., Keskinen, J., Pakkanen, T., Makela, T., andHillamo, R.: “Sniffer” – a novel tools for chasing vehicles andmeasuring traffic pollutants, Atmos. Environ., 38, 3625–3635,2004.
Pirjola, L., Paasonen, P., Pfeiffer, D., Hussein, T., Hameri, K.,Koskentalo, T., Virtanen, A., Ronkko, T., Keskinen, J., Pakka-nen, T.A., and Hillamo, R.: Dispersion of particles and tracegases nearby a city highway: mobile laboratory measurementsin Finland, Atmos. Environ., 40, 867–879, 2006.
Pirjola, L., Tsyro, S., Tarrason, L., and Kulmala, M.: A monodis-perse aerosol dynamics module – a promising candidate for usein the Eulerian long-range transport model, J. Geophys. Res.,108(D9), 4258, doi:10.1029/2002JD002867, 2003.
Pohjola, M., Kousa, A., Aarnio, P., Koskentalo, T., Kukkonen,J., Harkonen, J., and Karppinen, A.: Meteorological interpre-tation of measured urban PM2.5 and PM10 concentrations in theHelsinki Metropolitan Area, in: Air Pollution VIII, edited by:Longhurst, J. W. S., Brebbia, C. A., and Power, H., Wessex In-stitute of Technology Press, 689–698, 2000.
Pohjola, M. A., Kousa, A., Kukkonen, J., Harkonen, J., Karppinen,A., Aarnio, P., and Koskentalo, T.: The Spatial and TemporalVariation of Measured Urban PM10 and PM2.5 concentrations inthe Helsinki Metropolitan Area, Int. J. Water, Air Soil Pollut.,Focus, 2(5–6), 189–201, 2002.
Pohjola, M., Pirjola, L., Kukkonen, J., and Kulmala, M.: Modellingof the influence of aerosol processes for the dispersion of vehic-ular exhaust plumes in street environment, Atmos. Environ., 3,339–351, 2003.
Pohjola, M., Pirjola, L., Karppinen, A., Harkonen, J., Ketzel, M.,and Kukkonen, J.: Evaluation of a coupled dispersion and aerosolprocess model against measurements near a major road, Atmos.Chem. Phys., 7, 4065–4080, 2007,http://www.atmos-chem-phys.net/7/4065/2007/.
Quant, F. R., Caldow, R., Sem, G. J., and Addison, T. J.: Perfor-mance of condensation particle counters with three continuous-flow designs, J. Aerosol Sci., 23, S405–S408, 1992.
Seinfeld, J. H. and Pandis, S. N.: Atmospheric chemistry andphysics: from air pollution to climate change, John Wiley &Sons, New York, 1998.
Shi, J. P., Khan, A. A., and Harrison, R. M.: Measurements of ul-trafine particle concentration and size distribution in the urbanatmosphere, Sci. Total Environ., 235, 51–64, 1999.
www.atmos-chem-phys.net/7/4081/2007/ Atmos. Chem. Phys., 7, 4081–4094, 2007
4094 T. Hussein et al.: Part II – roadside versus urban background
Stolzenburg, M. R.: An Ultrafine Aerosol Size distribution system,Ph.D. thesis, University of Minnesota, Minneapolis, MN, 1988.
Stolzenburg, M. R. and McMurry, P. H.: An ultrafine aerosol con-densation nucleus counter, Aerosol Sci. Technol., 14, 48–65,1991.
Tiitta, P., Raunemaa, T., Tissari, J., Yli-Tuomi, T., Leskinen, A.,Kukkonen, J., Harkonen, J., and Karppinen, A.: Measurementsand modelling of PM2.5 concentrations near a major road inKuopio, Finland, Atmos. Environ., 36, 4057–4068, 2002.
Vignati, E., Berkowicz, R., Palmgren, F., Lyck, E., and Hum-melshøj, P.: Transformations of size distributions of emitted par-ticles in streets, Sci. Total Environ., 235, 37–49, 1999.
Wehner, B., Birmili, W., Gnuak, T., and Wiedensohler, A.: Particlenumber size distributions in a street canyon and their transforma-tion into the urban-air background: measurements and a simplemodel study, Atmos. Environ., 36, 2215–2223, 2002.
Whitby, K. H.: The physical characteristics of sulfur aerosols, At-mos. Environ., 12, 135–159, 1978.
Wiedensohler, A.: An approximation of the bipolar charge distribu-tion for particles in the submicron size range, J. Aerosol Sci., 19,387–389, 1988.
Wahlin, P., Palmgren, F., and van Dingenen, R.: Experimental stud-ies of ultrafine particles in streets and the relationship to traffic,Atmos. Environ., 35, 63–69, 2001.
Zhang, K. M. and Wexler, A. S.: Evolution of particle number dis-tribution near roadways—Part I: analysis of aerosol dynamicsand its implications for engine emission measurement, Atmos.Environ., 38, 6643–6653, 2004.
Zhang, K. M., Wexler, A. S., Zhu, Y. F., Hinds, W. C., and Sioutas,C.: Evolution of particle number distribution near roadways –Part II: the ‘Road-to-Ambient’ process, Atmos. Environ., 38,6655–6665, 2004.
Zhu, Y., Hinds, W. C., Kim, S., and Shen, S.: Study of ultrafineparticles near a major highway with heavy-duty diesel traffic, At-mos. Environ., 36, 4323–4335, 2002.
Atmos. Chem. Phys., 7, 4081–4094, 2007 www.atmos-chem-phys.net/7/4081/2007/