

Evaluation and Modeling of a Coastal Community’s Storm ... · in CivilStorm utilizing the EPA...
24
Jeff Riling | GHD November 2016 Let’s Go to the Beach Evaluation and Modeling of a Coastal Community’s Storm Drain System and Outfalls
-
Upload
truongxuyen -
Category
Documents
-
view
218 -
download
0
Transcript of Evaluation and Modeling of a Coastal Community’s Storm ... · in CivilStorm utilizing the EPA...
Jeff Riling | GHDNovember 2016
Let’s Go to the BeachEvaluation and Modeling of a Coastal Community’s Storm Drain System and Outfalls

Acknowledgments
City of Rehoboth Beach• Mayor Sam Cooper • Sharon Lynn• Bob Stenger • Bill Woods
GHD• Jeff Sturdevant• Maureen Wingfield• Ross Fryar• Ivan Botev
Presenter
Presentation Notes
Sharon Lynn = City Manager
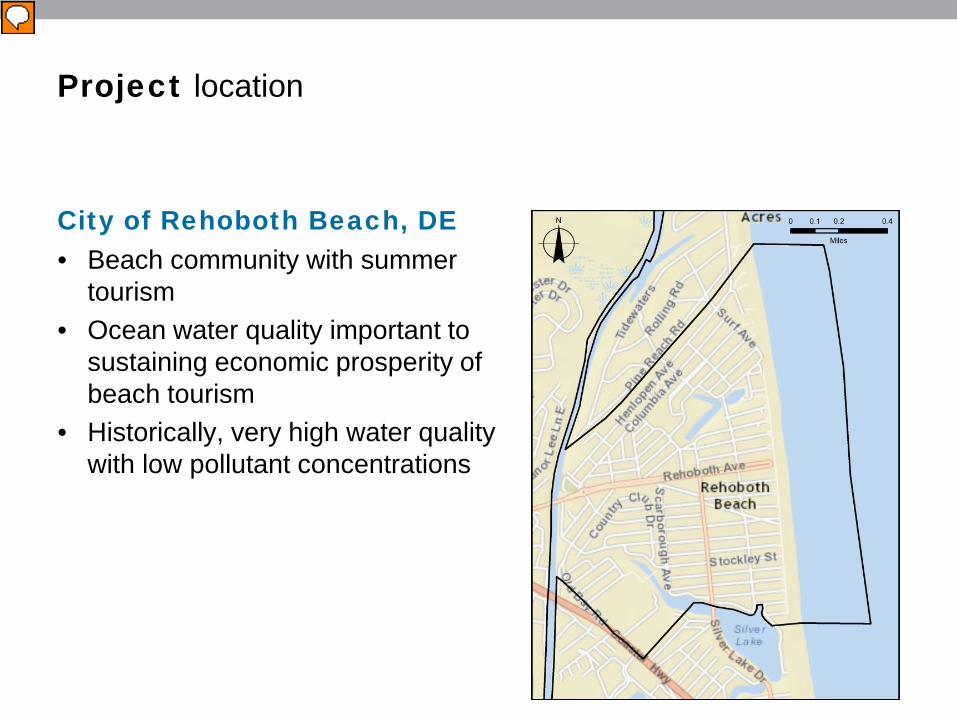
City of Rehoboth Beach, DE• Beach community with summer
tourism• Ocean water quality important to
sustaining economic prosperity of beach tourism
• Historically, very high water quality with low pollutant concentrations
Project location
Presenter
Presentation Notes
Rehoboth beach – 45 min / 25 mi north of Ocean City

Project background and driver
DNREC published TMDL for Rehoboth Bay – all point sources into Bay must be eliminated
RoD issued by DNREC - Stormwater evaluationrequired as a condition for effluent outfall construction
EIS developed for Rehoboth Beach WWTP Effluent Disposial – Ocean Outfall Recommended Alternative
Stormwater evaluation and preliminary modeling developed
1998 2010 to 2013
Jan 2015
2015 to 2016
Presenter
Presentation Notes
DNREC = Delaware Department of Natural Resources and Environmental Control TMDL = Total Maximum Daily Load RoD = Record of Decision
Project goal and scope
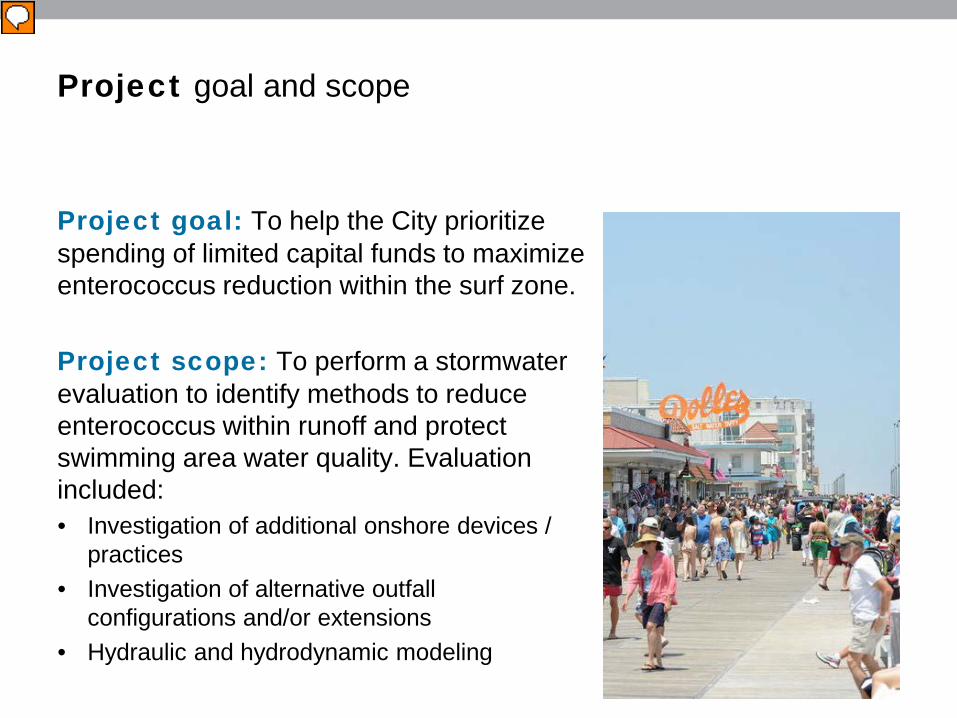
Project goal: To help the City prioritize spending of limited capital funds to maximize enterococcus reduction within the surf zone.
Project scope: To perform a stormwater evaluation to identify methods to reduce enterococcus within runoff and protect swimming area water quality. Evaluation included:• Investigation of additional onshore devices /
practices• Investigation of alternative outfall
configurations and/or extensions• Hydraulic and hydrodynamic modeling
Presenter
Presentation Notes
Don’t want to spend capital funds on projects that don’t help reduce entero Two approaches to reduce Entero in swim zone – add devices to reduce entero in runoff and reconfigure ocean outfalls to improve dilution and impact to swim zone Both methods have associated modeling

Enterococcus as the Fecal Indicator Bacteria
Fecal indicator bacteria (FIB) • Predictive of the potential for human
infectious disease
Enterococcus: FIB for marine waters • Found in guts of warm-blooded animals• Widely distributed in a variety of
environmental habitats
Water Quality Criteria• Currently 104 cfu/100 mL• BAV of 60 cfu/100 mL to be adopted in 2017
Photo Courtesy of Bacteria in Photos
Presenter
Presentation Notes
Infeasible to monitor for all disease-causing microorganisms from fecal contamination , therefore protection of public health for those using recreational waters has been accomplished through the use of fecal indicator bacteria (FIB) such as E. coli and enterococcus. The presence of FIBs have been shown in numerous epidemiology studies to be predictive of the potential for human infectious disease, especially gastrointestinal illness. However, extensive research has also shown enterococcus widely distributed in a variety of environmental habitats, such as soil and sediments, beach sand, aquatic and terrestrial vegetation, and ambient waters (rivers, streams, and creeks), even when there is little or no input from human and/or animal fecal sources Marine water, the EPA has recommended since 1986 enterococcus as indicator of fecal contamination - assessment of water based on enterococcus concentration Exceedance of criteria could result in advisory or closure. http://www.bacteriainphotos.com/Enterococcus%20faecalis%20electron%20microscopy.html

City-wide stormwater management evaluation
Existing storm drain system
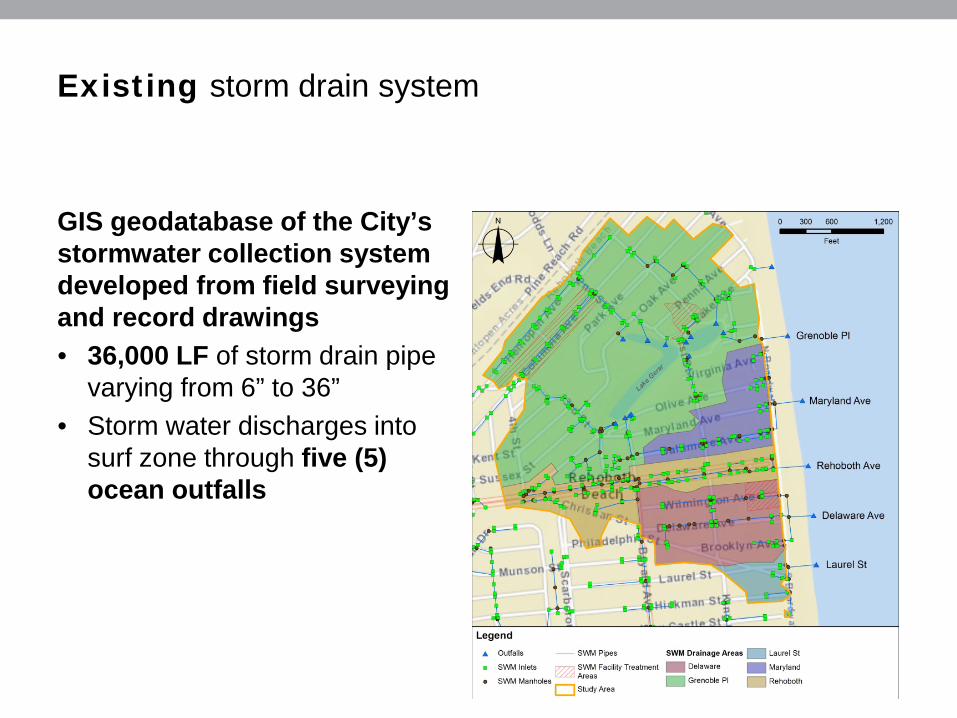
GIS geodatabase of the City’s stormwater collection system developed from field surveying and record drawings• 36,000 LF of storm drain pipe
varying from 6” to 36”• Storm water discharges into
surf zone through five (5) ocean outfalls
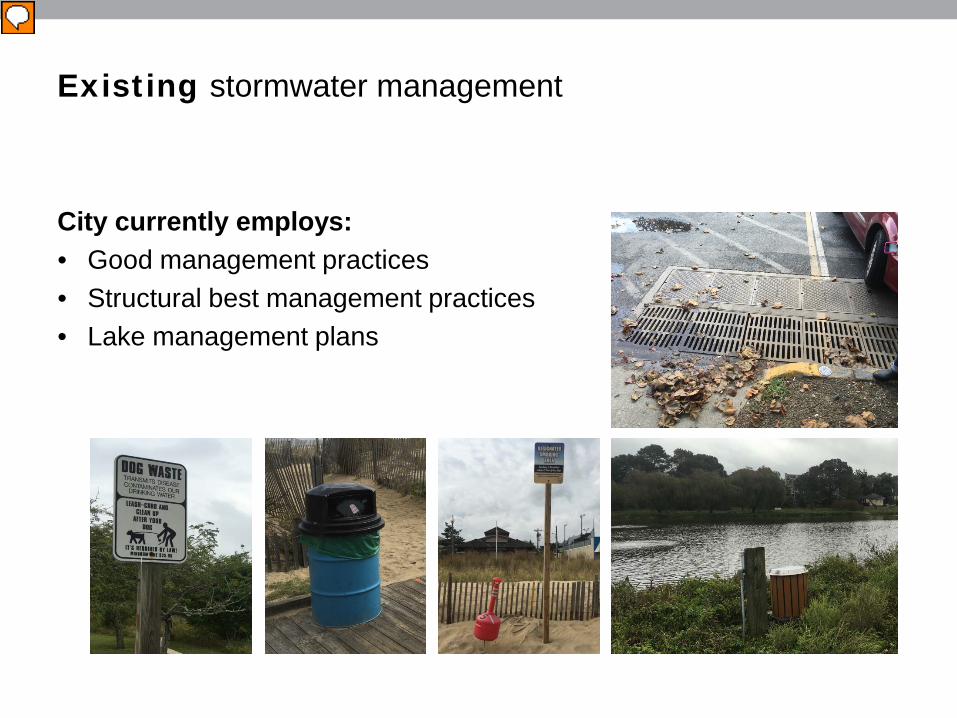
Existing stormwater management
City currently employs:• Good management practices • Structural best management practices• Lake management plans
Presenter
Presentation Notes
Good management practices and policies Pet Waste Management (Pet waste – source of entero) Trash and Debris Management (covered trash cans) Street Sweeping (every day in summer, every other day in off-season) Structural best management practices Sand Filters (settling chamber under grate, overflows into adjacent channel and filters through sand) Perforated Pipe Infiltration Sediment / Trash Traps (collect debris, oil, and other large pollutants, bacteria removal is minimal to nonexistent) Lake management plans Lake Gerar – riparian buffer, water quality enhancement plan w/ air diffusion system, monofilament for geese, educational outreach (signs) Silver Lake - Similar plan forthcoming as joint venture between City and State CITY HAS BEEN PROACTIVE - LOW HANGING FRUIT ADDRESSED

Additional best management practices evaluation
Opportunities for additional stormwater management were investigated:• Non-structural practices• Structural practices
Photo Courtesy of Filterra
Presenter
Presentation Notes
Create a menu of options available to the City Non-Structural Alternatives Public Education & Outreach - No Dumping Storm Drain Marking - Storm Drain System Cleaning / Flushing - prevents regrowth Structural Alternatives At-grade Infiltration and Bioretention Practices - Limited land, especially in commercial area. Incentive programs to encourage development on private land Delaware Sand Filters - ~ 70% removal Engineered Biofiltration Devices - tree in a box - limited land, but some areas have inlets between sidewalk and road Perforated Pipe Infiltration - primarily will be installed as aging SW pipes need replacing Permeable Pavement – can match existing aesthetics To be most cost effective – need to know what part of the City to focus on
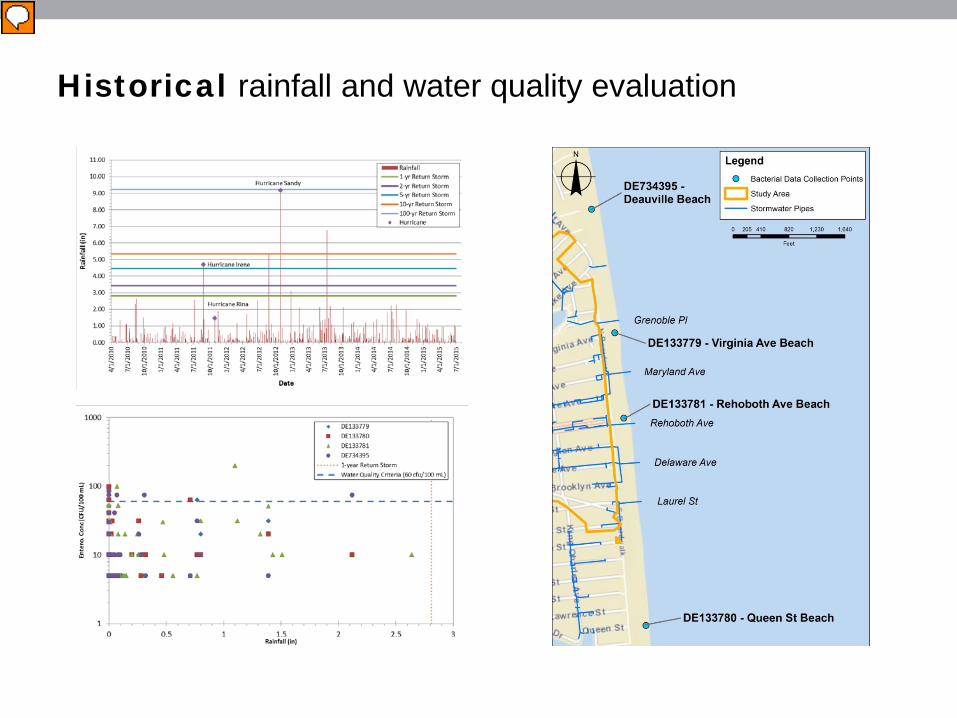
Historical rainfall and water quality evaluation
Presenter
Presentation Notes
Water quality data from May 2010 to early June 2015 collected by DNREC in surf zone Grab samples taken once or twice per week at each location throughout the summer months (May to September). Daily rainfall compared to enterococcus in surf zone – no correlation – BIG DEAL Why no correlation? Random events on shore like dirty diapers being thrown under cars? Random events offshore like a pod of whales? Plume from other areas to North and South? WE DON’T KNOW
Hydraulic and hydrodynamic modeling
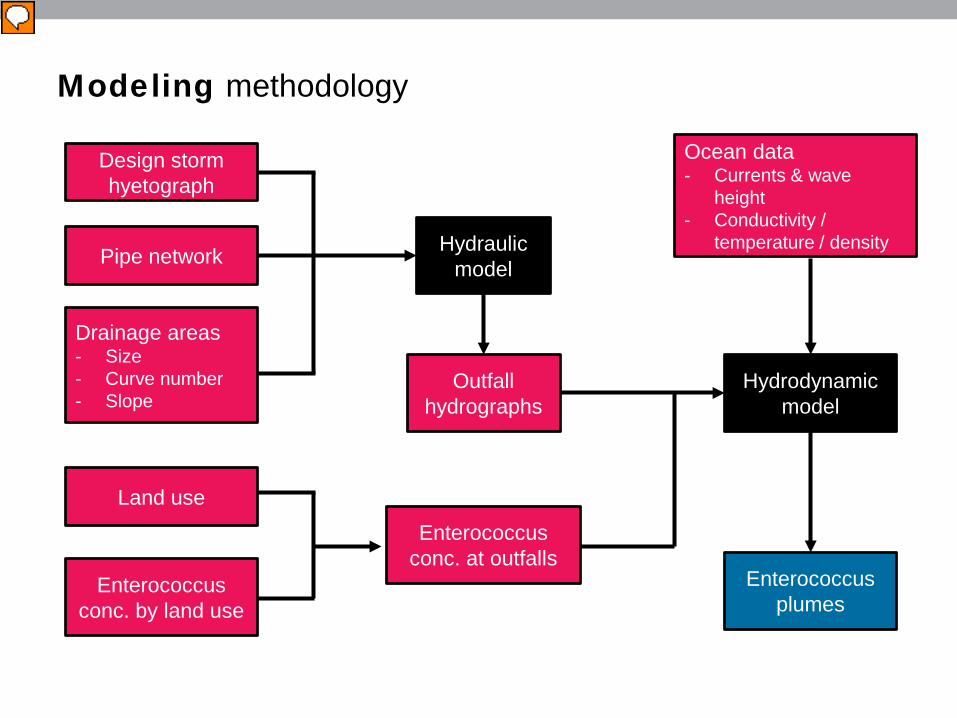
Modeling methodology
Hydraulic model
Hydrodynamic model
Enterococcus plumes
Design storm hyetograph
Pipe network
Drainage areas- Size- Curve number- Slope
Land use
Enterococcus conc. by land use
Ocean data- Currents & wave
height- Conductivity /
temperature / density
Outfall hydrographs
Enterococcus conc. at outfalls
Presenter
Presentation Notes
Hydraulic Model – land-side, included CBs, MHs, pipes, etc Two parts – determine load into ocean. Determine dilution and dispersion of load within the ocean
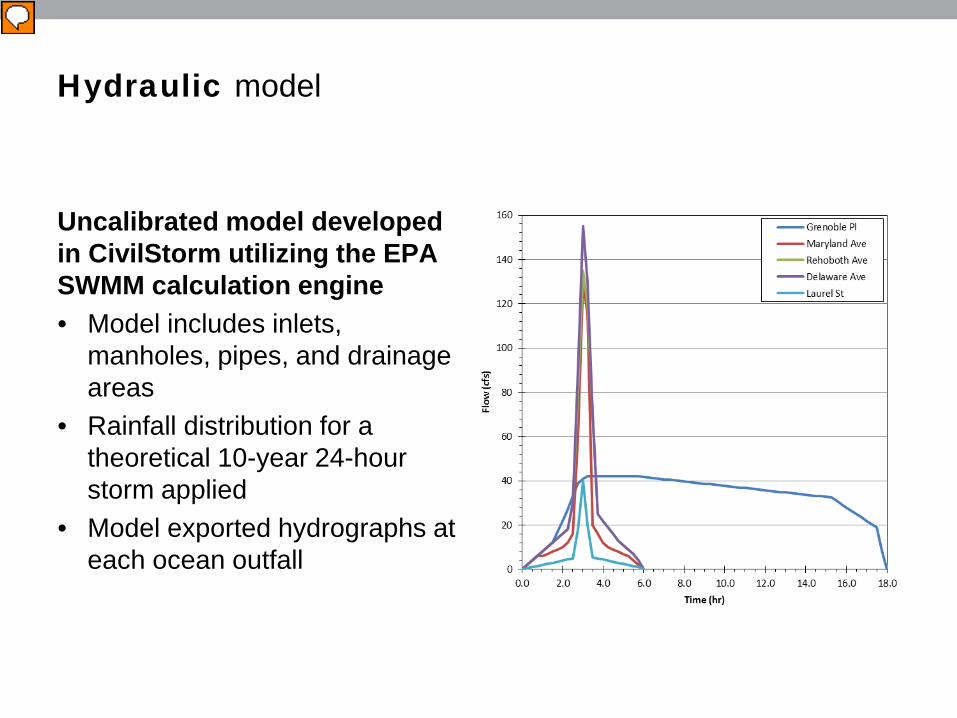
Hydraulic model
Uncalibrated model developed in CivilStorm utilizing the EPA SWMM calculation engine• Model includes inlets,
manholes, pipes, and drainage areas
• Rainfall distribution for a theoretical 10-year 24-hour storm applied
• Model exported hydrographs at each ocean outfall
Presenter
Presentation Notes
Uncalibrated
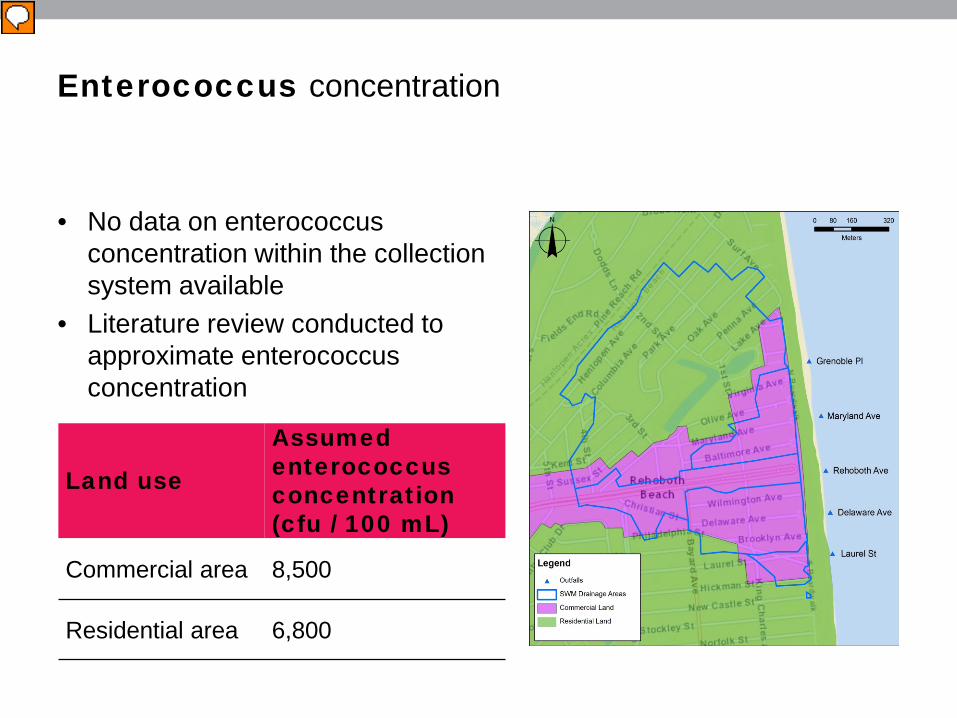
Enterococcus concentration
• No data on enterococcus concentration within the collection system available
• Literature review conducted to approximate enterococcus concentration
Land use
Assumed enterococcus concentration(cfu / 100 mL)
Commercial area 8,500
Residential area 6,800
Presenter
Presentation Notes
DETAILED LITERATURE REVIEW DNREC wanted us to use conc from Baltimore of 20,000 and 120,000 cfu /100 mL. GHD advocated for client Entero conc. for a given DA determined by weighted average Still a conservative assumption – assumes Constant concentration (not likely due to first flush) Used highest of range of concentrations from study Assumed consistent concentration for each different type of land use
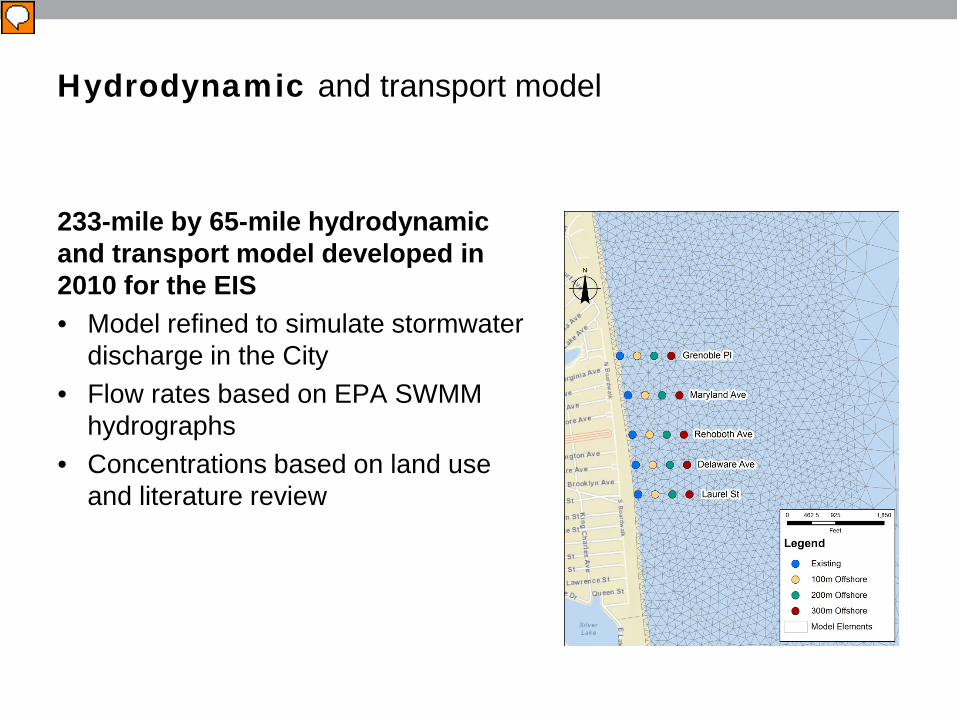
Hydrodynamic and transport model
233-mile by 65-mile hydrodynamic and transport model developed in 2010 for the EIS• Model refined to simulate stormwater
discharge in the City • Flow rates based on EPA SWMM
hydrographs • Concentrations based on land use
and literature review
Presenter
Presentation Notes
Model developed by our ocean modeling group Model goes from New Jersey down to Virginia More nodes / triangles added closer to shore for this analysis Points of analysis were selected at existing outfalls, 100 m offshore, 200 m offshore, and 300 m offshore

Outfall reconfiguration alternativesAlternative 1:
Existing Outfalls Alternative 2:
Rehoboth Avenue Extension
Alternative 3: Combined Outfall
Extension
Presenter
Presentation Notes
1) Existing Outfalls – approximately 300 feet offshore from the closest manhole. 2) Rehoboth Ave Extension –Rehoboth Ave drainage area moved an additional 1,000 feet (300 meters) offshore. Done b/c Rehoboth Ave in middle of commercial district 3) Combined Outfall Extension – Discharge from Grenoble Pl drainage area moved an additional 1,000 feet (300 meters) offshore, approximately 1,300 feet offshore from the nearest manhole. Discharge from Maryland Ave, Rehoboth Ave, Delaware Ave, and Laurel St combined and loaded into the model 1,000 feet (300 meters) offshore from the existing Rehoboth Ave outfall, approximately 1,300 feet offshore from the nearest manhole. Then, model was run
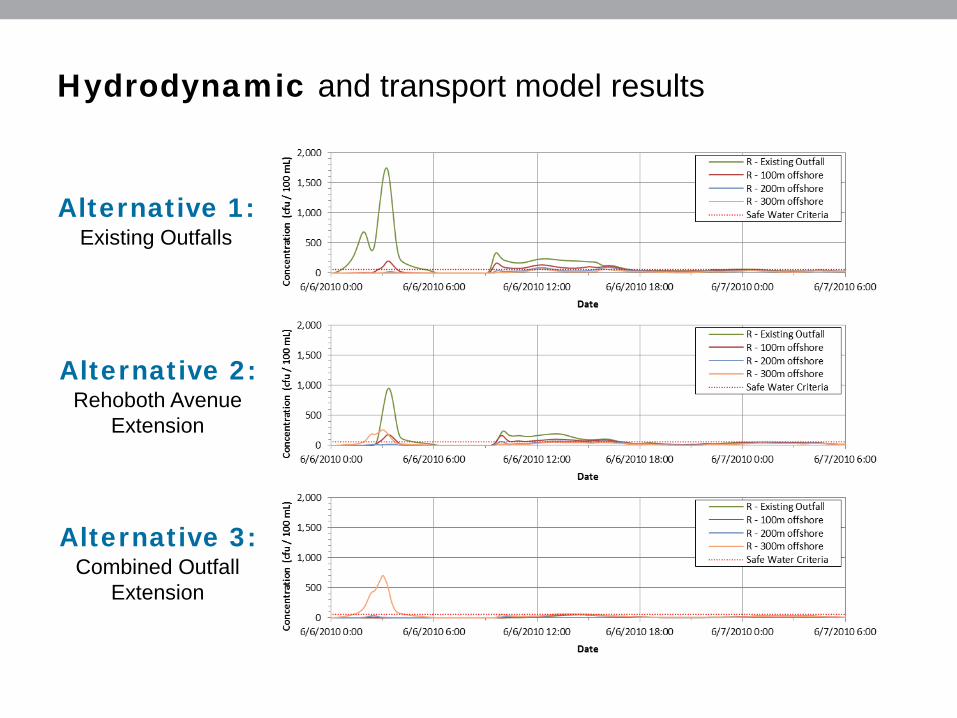
Hydrodynamic and transport model results
Alternative 1: Existing Outfalls
Alternative 2:Rehoboth Avenue
Extension
Alternative 3: Combined Outfall
Extension
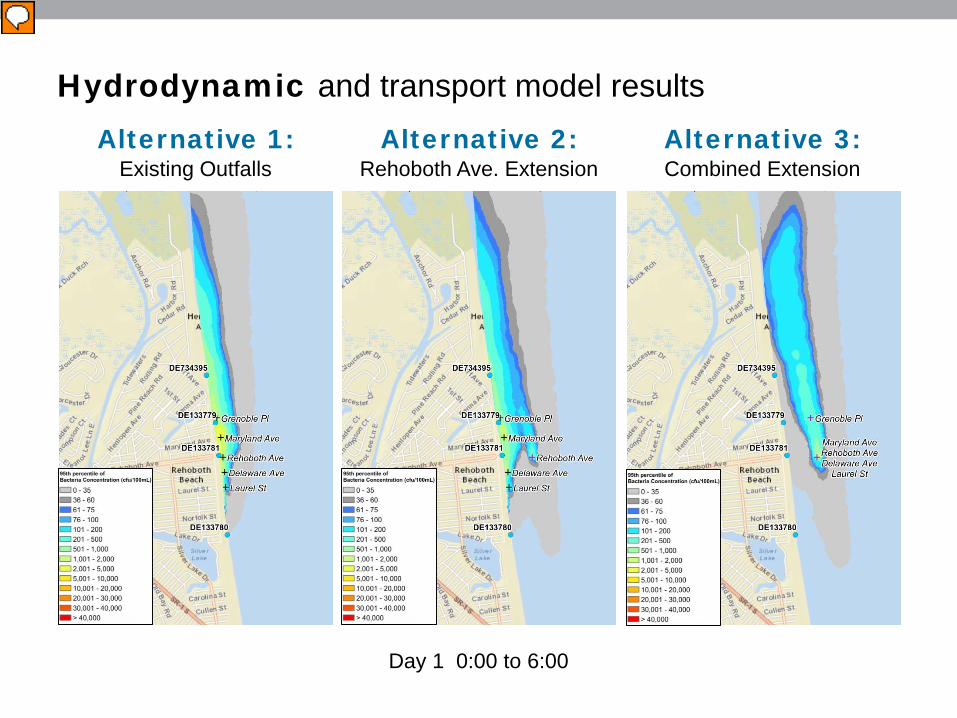
Hydrodynamic and transport model resultsAlternative 1:
Existing Outfalls Alternative 2:
Rehoboth Ave. Extension Alternative 3: Combined Extension
Day 1 0:00 to 6:00
Presenter
Presentation Notes
95th percentile maps of first 6 hours, starting at start of discharge
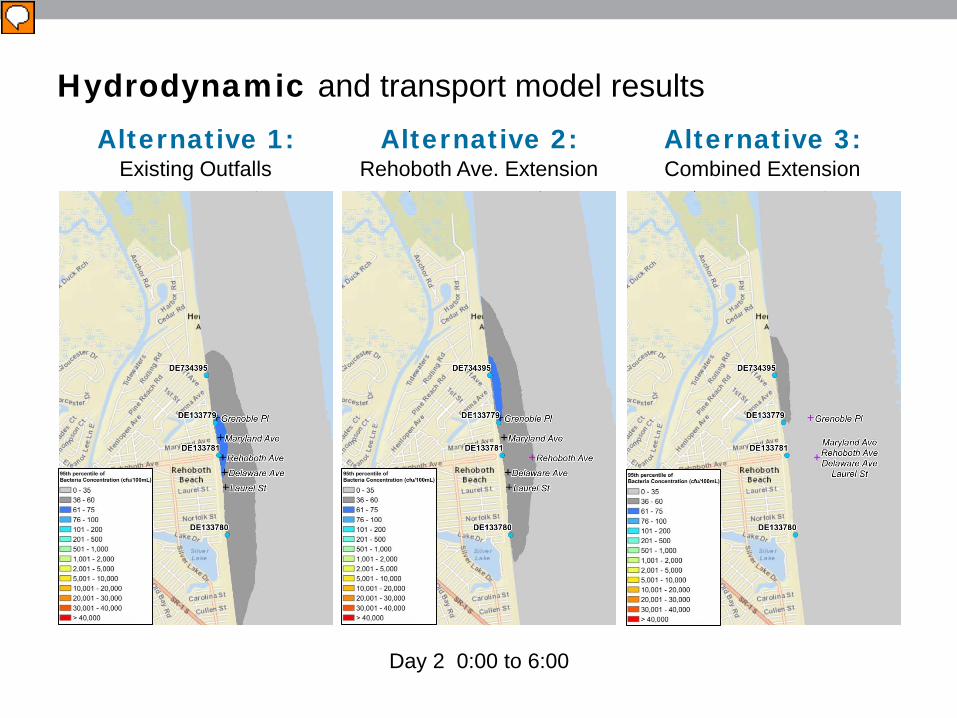
Hydrodynamic and transport model resultsAlternative 1:
Existing Outfalls Alternative 2:
Rehoboth Ave. Extension Alternative 3: Combined Extension
Day 2 0:00 to 6:00
Presenter
Presentation Notes
95th percentile maps of first 6 hours, starting at start of discharge
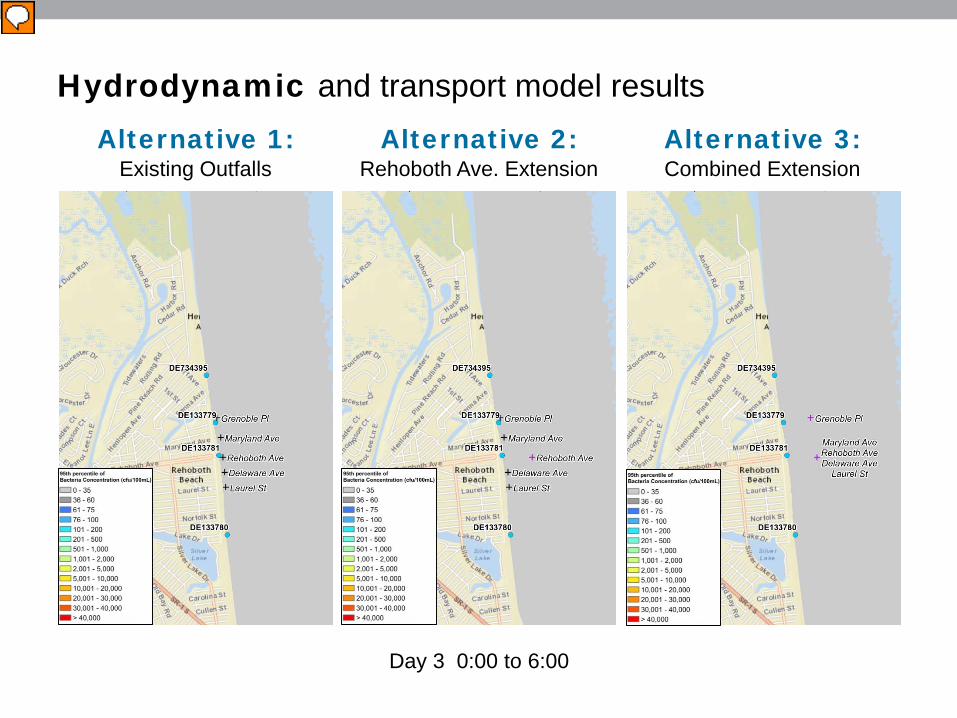
Day 3 0:00 to 6:00
Hydrodynamic and transport model resultsAlternative 1:
Existing Outfalls Alternative 2:
Rehoboth Ave. Extension Alternative 3: Combined Extension
Presenter
Presentation Notes
95th percentile maps of first 6 hours, starting at start of discharge

Hydrodynamic and transport model conclusions
Model Conclusions• Concentrations greatly reduced by beginning of second day• No observable benefit of single outfall extension• Substantial reduction in predicted peak concentrations at the beach
with a combined outfall extension
Current Model Limitations:• Hydraulic model uncalibrated• Extremely conservative - Concentrations obtained from literature
and assumed to be constant
Presenter
Presentation Notes
Beneficial impacts gone by Day 3 due to dilution and die-off Limitations Could be hot spots in one DA DON’T KNOW FOR CERTAIN THAT ENTERO IS COMING FROM CITY Do we want to spend capital money (either BMPs or outfall extensions) at this time? NO.

Next steps
• Detailed stormwater data collection, including:– Flow monitoring– Enterococcus sampling
• Hydraulic Model Calibration• Identification of priority drainage areas
and optimum BMP locations• Analysis of ocean enterococcus
concentration during theoretical return period storms Photo Courtesy of Teledyne ISCO
Presenter
Presentation Notes
Lot of assumptions made – need to confirm assumptions – prove that entero observed in surf zone is from SW runoff