Evaluation and Improvement of Distribution System ...
18
ADBU Journal of Electrical and Electronics Engineering (AJEEE) | Volume 3, Issue 2 | November 2019 www.tinyurl.com/ajeee-adbu | ISSN: 2582-0257 Page | 19 Evaluation and Improvement of Distribution System Reliability Indices using ETAP Software K. Raju 1 , P. Praveen Kumar 2 , G.N. Srinivas 3 1,2 Department of Electrical and Electronics Engineering, TKR College of Engineering and Technology, Meerpet, Balapur, Hyderabad. 1 [email protected]*, [email protected] 2 3 Department of Electrical and Electronics Engineering, JNTUH College of Engineering, Hyderabad. 3 [email protected] Abstract: Reliability assessment is the most important factor in designing and planning of distribution system that should operate in an economical manner with minimal interruption of customer loads. This is due to the fact that the distribution system provides the final link between a utility transmission system and its customers. It is observed that more than 80% of all customer interruptions occur (i.e., power quality issues) due to component failures in the distribution system. That report quantifies the expected reliability indices such as interruption frequency and interruption duration during the entire year. Many research findings are out there to assess the reliability of the power system. Further, due to the wide growth of distributed generation in electrical power, investigating their impact on system reliability, it becomes an attractive area of research. In this paper, the reliability evaluation of distribution system using a minimal cut set method based on the FMEA technique is described and applied to the IEEE RBTS Bus-2 and Indian practical distribution system (33/11 kV). Development of ETAP software is presented for calculating reliability indices. Further, improvement of reliability with introducing of Distributed Generation is presented. Reliability indices are load point indices and system indices which includes, System Average Interruption Frequency Indices (SAIFI), System Average Interruption Duration Indices (SAIDI), Customer Average Interruption Frequency Indices (CAIFI), Customer Average Interruption Duration Indices (CAIDI), Energy Not Supplied (ENS), Average Energy Not Supplied (AENS), etc. These indices are shows the reliability performance of the system. Keywords: Distributed Generation; IEEE RBTS BUS 2; Indian practical Parigi distribution system (33/11 kV); Reliability indices of Distribution System. 1. Introduction The distribution device is a hyperlink related among to the transmission line and load point. The energy failure occurs came about due to the supply system failure and cargo point customers failures. In beyond years distribution device turned into supplied less and terrible strength to the patron's call for the environment and society maximum impact due to the generated energy. The electricity system has a purpose of supplying the electricity without any interruption, satisfactory energy, customers fulfil, users demand and customers proper price. The unavailability of the purchaser delivers within the distribution of system failure. The updated, new generation, improvement, financial growth inside the electricity system many countries are targeted at the distribution device reliability. The transmission and distribution structures are the generated strength is supplied to the reliable strength to customers call for pride and with none running price. The many cases deliver failure, bad energy best, and client interruption passed off because of the distribution system are imparting the unreliable energy to customers; then purchaser was given much less satisfactory electricity. Energy outage is impacting at the monetary and software of the customers. The unreliable energy supply without delay effects on the energy nice, environments, economic and customers. The distribution reliable strength development many authors were investigated and plenty of one of a kind technic using many software programs, loss of equipment, manipulate and hold the reliable power and energy high- quality. In view of the above problems, distributed generation is introduced in the distribution system. The distribution reliability indices of the electric power distribution device reliability Open Access. Copyright ©Authors(s). Distributed under Creative Commons Attribution 4.0 International License (CC-BY). Article history- Received: 16 August 2019 and Accepted: 11 October 2019.
Transcript of Evaluation and Improvement of Distribution System ...

ADBU Journal of Electrical and Electronics Engineering (AJEEE) | Volume 3, Issue 2 | November 2019
www.tinyurl.com/ajeee-adbu | ISSN: 2582-0257 Page | 19
Evaluation and Improvement of Distribution System
Reliability Indices using ETAP Software
K. Raju1, P. Praveen Kumar
2, G.N. Srinivas
3
1,2Department of Electrical and Electronics Engineering, TKR College of Engineering and Technology,
Meerpet, Balapur, Hyderabad. [email protected]*, [email protected]
3Department of Electrical and Electronics Engineering, JNTUH College of Engineering, Hyderabad. [email protected]
Abstract: Reliability assessment is the most important factor in designing and planning of
distribution system that should operate in an economical manner with minimal interruption
of customer loads. This is due to the fact that the distribution system provides the final link
between a utility transmission system and its customers. It is observed that more than 80%
of all customer interruptions occur (i.e., power quality issues) due to component failures in
the distribution system. That report quantifies the expected reliability indices such as
interruption frequency and interruption duration during the entire year. Many research
findings are out there to assess the reliability of the power system. Further, due to the wide
growth of distributed generation in electrical power, investigating their impact on system
reliability, it becomes an attractive area of research. In this paper, the reliability evaluation
of distribution system using a minimal cut set method based on the FMEA technique is
described and applied to the IEEE RBTS Bus-2 and Indian practical distribution system
(33/11 kV). Development of ETAP software is presented for calculating reliability indices.
Further, improvement of reliability with introducing of Distributed Generation is presented.
Reliability indices are load point indices and system indices which includes, System Average
Interruption Frequency Indices (SAIFI), System Average Interruption Duration Indices
(SAIDI), Customer Average Interruption Frequency Indices (CAIFI), Customer Average
Interruption Duration Indices (CAIDI), Energy Not Supplied (ENS), Average Energy Not
Supplied (AENS), etc. These indices are shows the reliability performance of the system.
Keywords: Distributed Generation; IEEE RBTS BUS 2; Indian practical Parigi distribution
system (33/11 kV); Reliability indices of Distribution System.
1. Introduction
The distribution device is a hyperlink related
among to the transmission line and load point. The
energy failure occurs came about due to the supply
system failure and cargo point customers failures.
In beyond years distribution device turned into
supplied less and terrible strength to the patron's
call for the environment and society maximum
impact due to the generated energy. The electricity
system has a purpose of supplying the electricity
without any interruption, satisfactory energy,
customers fulfil, users demand and customers
proper price. The unavailability of the purchaser
delivers within the distribution of system failure.
The updated, new generation, improvement,
financial growth inside the electricity system many
countries are targeted at the distribution device
reliability. The transmission and distribution
structures are the generated strength is supplied to
the reliable strength to customers call for pride and
with none running price. The many cases deliver
failure, bad energy best, and client interruption
passed off because of the distribution system are
imparting the unreliable energy to customers; then
purchaser was given much less satisfactory
electricity.
Energy outage is impacting at the
monetary and software of the customers. The
unreliable energy supply without delay effects on
the energy nice, environments, economic and
customers. The distribution reliable strength
development many authors were investigated and
plenty of one of a kind technic using many
software programs, loss of equipment, manipulate
and hold the reliable power and energy high-
quality. In view of the above problems, distributed
generation is introduced in the distribution system.
The distribution reliability indices of the
electric power distribution device reliability
Open Access. Copyright ©Authors(s). Distributed under Creative Commons Attribution 4.0 International License (CC-BY).
Article history- Received: 16 August 2019 and Accepted: 11 October 2019.

ADBU Journal of Electrical and Electronics Engineering (AJEEE) | www.tinyurl.com/ajeee-adbu
Raju et al., AJEEE, ISSN: 2582-0257, Vol.3 , Issue 2, November 2019, pp. 19-36 | Page | 20
strength carried out by using the distribution device
strength and distribution automation system it’s
supplied the device-extensive status and health
tracking [1]. This implement using the (R-APDRP)
restructured extended power improvement and
reforms program and (IPDS) incorporated energy
improvement scheme by means of the usage of this
distribution system networks utility of electrical
non-compulsory issues have been the reduced. This
implements the managed exceptional and reliable
of the delivery. The drawbacks of previous work
based totally on that used software for calculating
reliability indices. The interruption amassed from
the log e-book of the feeder Indian Electrical
application and modelled the CYMDIST software
program. Using this software program discussed
the effects analyzed.
Based on the climate circumstance of the
substation modelled the reliability, the reliability of
substation parameters operating weather situations
[2]. In this the low voltage, the feeder becomes
converted to the excessive voltage feeder and it
turned into reliability overall performance became
evaluated. In this FMEA technique was used to
assess the load factor and system overall
performance reliability indices.
The distribution system reliability impacts
the clients [3]. Each consumer scattering case
becomes analyzed for determined reliability indices
using the device with distribution generators and
the system without distribution generator and the
outcomes had been compared. The outcomes
confirmed that point changed into laid low with the
optimum region of distribution generator hooked
up various client scattering and recuperation. In
this, reliability assessment taken into consideration
time calculated each load point with distribution
generator and circle of relatives positioned. The
fault befell in a segment of the feeder the circuit
breaker changed into mechanically opened.
Improve the system reliability in electrical
distribution networks approached the most useful
allocation of distribution generator, genetic set of
the rule’s optimization approach. The interruption
fee supply electricity to the customers that
considered distinctive consuming devices.
The fundamentals of the electric
distribution system for training purposes, educate
the energy system reliability indices assessment
[4]. This was applied a sensible system of
fundamental elements of the device, reliability
checking out device is nearly carried out to the
substation system modelled and evaluated the
reliability indices, the effects discussed and
analyzed.
The modern electricity system improves
the reliability energy with the aid of adding the
distribution generator at load it's far minimized
some of the interruptions inside the distribution
device network [5]. The distribution generator is
the opportunity supply of distributed system
network and load factor, the interruption time of
system distribution generator supply to loads. The
distribution issue of system fuses, disconnectors,
and distribution generators brought to the device to
enhance the reliability of electricity. Performance
measure reliability, keep cash accurately and
purchaser election. The electrical enterprise
evolved to degree device and reliability overall
performance of the system. This is mentioned
distribution system reliability indices observe and
analysis.
Reliability indices of electrical distribution
network system assessment dependability
evaluation of appropriation foundation based
unwavering quality measurements on being
registered in accordance with the field information
accumulated for an investigation period [6]. Both
account and quantitative unwavering quality
portrayals of dispersion infrastructural expenses
ought to be utilized so as to proffer sound
operational methods of reasoning went for
protecting productive, secure, solid and amazing
power conveyance to purchasers.We along these
lines emphasize the significant centrality of a
dependable dispersion system tied down on sound
arranging theory and usage procedure just as the
appropriation of present-day dissemination
computerization framework.
Electricity Act 2003 / Electricity
(Amendment) Act, 2014, Government of India,
Ministry of Law and justice accompanying
Demonstration of Parliament got the consent of the
President on the 26th May 2003 and is thus
distributed for general data [7]. A Demonstration to
solidify the laws identifying with age, transmission,
appropriation, exchanging and utilization of power
and for the most part for taking estimates helpful
for advancement of power industry, advancing
challenge in that, securing enthusiasm of
purchasers and supply of power to all regions,
legitimization of power duty, guaranteeing
straightforward arrangements with respect to
endowments, advancement of effective and
ecologically generous strategies, constitution of
Focal Power Specialist, Administrative
Commissions and foundation of Redrafting Council
what's more, for issues associated therewith or
coincidental.
Predicting distribution system
performance So as to guarantee that the changing
utility condition does not unfavourably influence

ADBU Journal of Electrical and Electronics Engineering (AJEEE) | www.tinyurl.com/ajeee-adbu
Raju et al., AJEEE, ISSN: 2582-0257, Vol.3 , Issue 2, November 2019, pp. 19-36 | Page | 21
the unwavering quality of electric power provided
to clients, a few state administrative offices have
begun to endorse unwavering quality measures
least dependability levels to be kept up by electric
power dispersion organizations [8]. The gauges
depend on unwavering quality files registered from
authentic blackout information. The unwavering
quality files shift from year to year on the grounds
that of the factual variety in the number of client
intrusion, what's more, the length of such
intrusions. To be successful, the unwavering
quality models embraced must distinguish feeders
that reliably perform inadequately, while being
obtuse toward those that infrequently have poor
dependability. In this utilizes a term-based Monte
Carlo recreation to investigate the anticipated effect
of different unwavering quality benchmarks on a
huge down to earth dissemination framework. The
affectability of various guidelines to contrasts in
framework size and segment disappointment rate is
likewise investigated.
Modeling and Analysis of Distribution
Reliability Indices Evaluation of client power
supply unwavering quality is a significant piece of
conveyance framework activity and arranging [9].
Monte Carlo reenactments can be utilized to locate
the factual conveyance of the unwavering quality
files, alongside their mean and standard deviation.
The standard deviation of the unwavering quality
records furnishes circulation engineers with data on
the normal scope of the yearly qualities. Be that as
it may, the Monte Carlo recreation more often than
not is a tedious calculation. Further, a productive
Monte Carlo recreation technique for appropriation
framework unwavering quality evaluation is
introduced. Examination of blackout information
from a handy dispersion framework is performed to
decide the disappointment and fix models proper
for use in the Monte Carlo recreation. The
affectability of the unwavering quality lists to the
decision of model is displayed. At long last, the
effect of insurance systems on the factual
dissemination of Framework Normal Intrusion
Recurrence Record (SAIFI) for a down to earth
conveyance feeder is introduced.
System Reliability Concept Framework
approach to demonstrating and examination has
been increasing much significance in the course of
recent decades [10]. Frameworks Society of India
has likewise been started long back and the creator
is additionally an individual from the general
public. The creator has done his exploration work
in the region of framework unwavering quality
applications to control framework systems. He has
the chance to broaden the work to different fields
of utilizations like Mechanical Designing, Software
engineering, Transportations issues, and so on. In
mechanical building issues, the maximal-stream
insignificant cut hypothesis has been utilized which
depends on the cut sets of systems. Cut sets are
widely utilized in creating hypotheses of electrical
circuit examination at first. Cut sets are likewise
valuable in framework examination of the
likelihood of disappointment. Further, real points
of interest of the cutest approach are that they
legitimately speak to the disappointment methods
of the frameworks. In this way, not just
frameworks can be dissected utilizing cut set, and
criticality examination can likewise be managed.
Assessment of Reliability in the power
distribution system it is a calculation accessible to
assess the circulation arrange dependability in the
downtown region as per the present activity
conditions [11]. New sensible records are displayed
to compute the circulation arrange dependability
and an appraisal result is given remove a portion of
Beijing downtown zone for instance. A quick and
compelling strategy to pass judgment on the
feeders' extra limits and to improve the
administration reclamation is given, which prompts
discover the frail focuses in the dispersion arrange
and gives the advisers for the improvement of the
power supply security and unwavering quality.
The impact of distributed energy resources
on the reliability of smart distribution system the
incorporation of Disseminated Vitality Assets
(DER) in power frameworks can give the chance to
supply power to clients all the more proficiently
and viably [12]. The DER incorporates
Disseminated Age (DG) and Request Side
Administration (DSM). In a keen framework
consolidating computerized control and
appropriated vitality frameworks, a successful
DSM can ease the pinnacle burden and move some
portion of the interest to off-crest hours. The point
of this exploration is to evaluate the effect of the
DG and the DSM on the dependability of a brilliant
appropriation framework by breaking down various
Contextual investigations. Roy Billinton test
framework RBTS Bus2 is utilized to approve
contextual analyses which are executed as a piece
of this paper. For progressively down to earth
contemplations a change of the RBTS Bus2 model
is created to survey the framework unwavering
quality.
The appropriation framework is inclined
to disappointments and unsettling influences due to
component disappointments [13]. Disseminated age
(DG) goes about as a reinforcement source to
guarantee the unwavering quality of electric power
supplies. In this research, the authors proposed an
investigative technique, which is a restrictive
likelihood approach. This method used to and the
unwavering quality lists of RBTS Transport with
various DGs. The estimation of DG situating as a

ADBU Journal of Electrical and Electronics Engineering (AJEEE) | www.tinyurl.com/ajeee-adbu
Raju et al., AJEEE, ISSN: 2582-0257, Vol.3 , Issue 2, November 2019, pp. 19-36 | Page | 22
reinforcement generator is measured as far as its
commitment to the unwavering quality
improvement in a circulation organize. The
unwavering quality improvement is watched
dependent on dependability lists that incorporate
SAIFI, SAIDI, CAIDI, and ENS. Furthermore, the
estimation of DG installed at different areas on the
feeder from the substation, just as the effects of
introducing, accumulated DGs and numerous DGs
are presented.
In this paper, we determine the reliability
indices of distribution systems with distributed
generation using FMEA method and ETAP
software. This paper can be summarized in the
following way: section 2 discusses the reliability
indices. Section 3 describes the IEEE RBTS Bus 2
model and Indian PARIGI Distribution system
research system model that is used in case studies
in this research. Section 4 summarizes the results of
the different case studies that all conduct in this
paper. Section 5 presents the conclusion.
2. Reliability indices
The system reliability indices evaluation is classed
into 3 types they're; sections, lateral distribution
and load points. The distribution system
community consists of the extraordinary
components, deliver, busbars, circuit breakers,
transformers, switches, disconnectors, reclosers and
fuses; all components are required to connect
system [14].
2.1 Reliability Indices of Distribution
System
2.1.1 Load Point Indices
Annual foundation or normally determine the load
point indices. The calculating indices took any
particular year values or random values, and
features of the failure of the component quote
repair time, switching time and restoration time in
the 12 months. The load point indices are three
parts load factor average failure rate (λs), common
annual outage time (Us)and common outage time
(rs).
A. Average failure rate (λs)
The average failure rate is calculated by means of
the all phase failure price of distribution system
feeders.
ailure rate ( = Total sum of section
failure rate
Average failure rate ( ) = i
i (failure/year)
(2.1)
B. Average annual outage time (us)
The common failure charge is calculated through
the all segment failure rate and repair of time of
distribution system feeders.
era e annual outa e time (
ection ailure rate epair o time
annual outa e time (
( hours ear (2.2)
C. Average outage time (rs)
The average outage time is calculated through the
ratio of the Average annual outage time (Us) and
Average failure rate (λs) of distribution system
feeders.
era e outa e time (r
annual outa e time (
ailure rate (
Average outage time (rs) =
(hours/
interruption) (2.3)
2.1.2 System Reliability Indices
The customer factor of distribution system indices
affected by the overall system supply, overall
performance, responses, and behaviour. The
distribution system primary reliability indices are
the following:
D. System average interruption frequency
index (SAIFI)
The index constitutes the common value of
interruption frequency within the distribution
system that consequences customers inside the 12
months. In a location modified in the enclosed the
variety of purchasers and interruption revel in.
SAIFI is the average fee of interruption frequency
inside the system that affects clients all through the
yr. The equation is shown system common
interruption frequency index.
num er o customers interrptions
num er o customers ser e
(interruptions/customer year) (2.4)
E. System average interruption duration
index (SAIDI)
The index represents the device average
interruption of consumer period in a year. SAIDI
is the common fee of outage length inside the
system that affects customers at some stage in the
year. The equation for the system average
interruption duration index is

ADBU Journal of Electrical and Electronics Engineering (AJEEE) | www.tinyurl.com/ajeee-adbu
Raju et al., AJEEE, ISSN: 2582-0257, Vol.3 , Issue 2, November 2019, pp. 19-36 | Page | 23
Total sum o customer interrptions urations
Total num er o customer
(hours/ customers year) (2.5)
where Ni is the number of customers and Ui is the
annual outage time for location i, and NT is the total
number of customers served.
F. Customer average interruption
duration index (CAIDI)
The index represents the system customer common
interruption duration in a year. CAIDI is the ratio
of the SAIDI and SAIFI. CAIDI is the average
price of outage length time in the system that
affects customers in step with interruption. The
equation is shown the patron common interruption
duration index.
um o customer interruptions urations
num er o customer interruptions
(hrs/customer interruption) (2.6)
G. Average service availability index
(ASAI)
The index represents the common service
availability index. The Average Service
Availability Index (ASAI) is a reliability index
commonly used by electric power utilities. ASAI is
calculated as
hours o a alia le ser ice
hours eman e
(hr/customer yr) (2.7)
where Ni is the number of customers and Ui is the
annual outage time (in hours) for location i.
H. Average service unavailability index
(ASUI)
The index represents the average service
unavailability index. To calculate the ASUI, the
equation below provides the unavailability index.
ustomer hours o una aila le ser ice
ustomer hours eman e
(hours/customer year) (2.8)
I. Energy is not supplied index (ENS)
The index constitutes the energy isn't provided with
the aid of the system, the calculation of ENS is
proven equation energy no longer supplied.
Total ener not supplie the s stem
(KWH/ year) (2.9)
J. Average energy not supplied (AENS)
The index represents the average strength now not
furnished by means of the system, the calculation
of AENS is proven equation average energy not
supplied.
ener not supplie
Total num er o customers ser e
(KWH/ customer year) (2.10)
3. Case Studies
In all the case studies consider IEEE RBTS BUS2
and PARGI distribution system with disconnects-
with fuse- with alternative supply- with the repair
of the transformer. The following case studies have
been conducted.
Case study-1: IEEE RBTS BUS2, with
disconnects- with fuse- with alternative
supply- with the repair of the transformer.
Case Study-2: Modeling of IEEE RBTS
Bus2 Using ETAP Software.
Case Study-3: Reliability Indices of
PARGI Distribution System, with
disconnects- with fuse- with alternative
supply- with the repair of the transformer.
Case Study-4: Modeling of PARGI
Distribution System Using ETAP
Software.
Case Study-5: IEEE RBTS BUS-2
Feeders with Distributed Generation
Using ETAP Software
Case Study-6: PARGI Distribution
System with Distributed Generation Using
ETAP Software

ADBU Journal of Electrical and Electronics Engineering (AJEEE) | www.tinyurl.com/ajeee-adbu
Raju et al., AJEEE, ISSN: 2582-0257, Vol.3 , Issue 2, November 2019, pp. 19-36 | Page | 24
Figure 1: Flow chart for Evaluation of reliability
indices of IEEE RBTS BUS2 and
PARGI distribution system without and
with distributed Generator.
3.1 Development of algorithm for
calculating IEEE RBTS BUS2 and
PARGI DISTRIBUTION SYSTEM
Reliabilty indices
Step1: Select the community system to a check.
Step2: Identification of feeders, urban feeder,
commercial feeder, Rural feeder,
agriculture feeder, industrial feeder and
residential feeder from the network
system.
Step3: Survey of the network system.
Step4: Collect the interruption records, failure
rate, restore time and additives
information.
Step5: Model the single line diagram of the
network system.
Step6: Reliability indices are calculated using the
FMEA method.
Step7: System network is modeled in ETAP
software, Enter the failure rate, repair
time, switch time, duration of feeder,
score values of additives in the ETAP
software program.
Step8: Run the reliability assessment in the
ETAP software.
Step9: Calculation of reliability indices the usage
of the ETAP software program.
Step10: Reliability indices are calculated with
distributed generation using FMEA
method and ETAP software.
Step11: Calculate all feeder reliability indices of
the network system.
Step12: The results of the reliability indices of the
FMEA method compared to ETAP
software results all feeder network system.
3.2 Case study-1 IEEE RBTS BUS2,with
disconnects-with fuse-with alternative
supply-with the repair of the
transformer
Results obtained are tabulated in Tables 3 and 4.
Start
Select a network system to test
Identification of type of feeder the network system
(rural, urban, commercial, agriculture, residential)
Survey the network system
Collect the interruption records, failure rate, restore
time and additives information.
Modelling the single line diagram of network system
Reliability indices are calculated using FMEA
method.
System network is modeled in ETAP software,
Enter the failure rate, repair time, switch time,
duration of feeder, score values of additives in the
ETAP software program.
Run the reliability assessment in ETAP software
Calculation of reliability indices using ETAP
software
Reliability indices are
calculated with
distributed generation
using FMEA method
and ETAP software.
Reliability indices are
calculated without
distributed generation
using FMEA method
and ETAP software.
calculate all feeder
reliability indices of
the network system.
calculate all feeder
reliability indices of
the network system.
The results of the reliability indices of the FMEA
method compared to ETAP software results all
feeder network system.
Stop

ADBU Journal of Electrical and Electronics Engineering (AJEEE) | www.tinyurl.com/ajeee-adbu
Raju et al., AJEEE, ISSN: 2582-0257, Vol.3 , Issue 2, November 2019, pp. 19-36 | Page | 25
Figure 2: Single line diagram of RBTS BUS2
system.
Table 1: Results of load point indices RBTS BUS-
2 FEEDER-4
S. No. LOAD
POINT
λLpi ULPi rLpi
1 1 0.240 3.58 14.90
2 2 0.253 3.64 14.40
3 3 0.253 3.64 14.40
4 4 0.240 3.58 14.90
5 5 0.253 3.64 14.40
6 6 0.250 3.63 14.51
7 7 0.253 3.60 14.24
8 8 0.140 0.542 3.890
9 9 0.140 0.503 3.604
10 10 0.243 3.58 14.73
11 11 0.253 3.64 14.40
12 12 0.256 3.66 14.29
13 13 0.253 3.59 14.19
14 14 0.256 3.61 14.08
15 15 0.243 3.58 14.73
16 16 0.253 3.64 14.40
17 17 0.243 3.59 14.78
18 18 0.243 3.58 14.73
19 19 0.256 3.65 14.24
20 20 0.256 3.65 14.24
21 21 0.253 3.59 14.19
22 22 0.256 3.61 14.08
Table 2: Results of system performance indices of
IEEE RBTS BUS2
S.N
0.
FE
ED
ER
NA
ME
SA
IFI
(in
terr
up
tion/
yea
r)
SA
IDI
(hou
rs/
yea
r)
CA
IDI
(hou
rs/i
nte
rru
pti
on
)
AS
AI
(hou
rs/
yea
r)
AS
UI
(hou
rs/
yea
r)
EN
S (
KW
H/
yea
r)
AE
N (
KW
H/
yea
r)
1 F1 0.248 3.62 14.5349 0.999
587
0.000
412
1.31
94
0.20
23
2 F2 0.140 0.523
3.7375 0.999402
0.000597
1.1249
0.5624
3 F3 0.250 3.62 14.4667 0.999
586
0.000
414
11.2
12
0.01
77
4 F4 0.247 3.61 14.38 0.999587
0.000412
12.237
0.0916
Table 2 shows that, the system
performance of IEEE RBTS BUS2, F1, F2, F3 and
F4. Indices are calculated using the FMEA
technique.
3.3 Case Study-2 : Modelling of IEEE
RBTS BUS2 USING ETAP software
Development of reliability modeling of IEEE
RBTS BUS2, feeder1, feeder2, feeder3 and feeder4
are developed using ETAP software as shown in
Fig. 3. The obtained results are tabulated in Table3.
Figure 3: IEEE RBTS BUS-2 FEEDER-2
modeled in ETAP software

ADBU Journal of Electrical and Electronics Engineering (AJEEE) | www.tinyurl.com/ajeee-adbu
Raju et al., AJEEE, ISSN: 2582-0257, Vol.3 , Issue 2, November 2019, pp. 19-36 | Page | 26
Table 3: Results of performance indices of IEEE
RBTS BUS2
S
.
N
FE
ED
ER
NA
M
E
SAI
FI
(inte
rrupt
ion/
yr)
SA
ID
I
(ho
urs
/
yr)
CAI
DI
(hour
s/inte
rrupti
on)
AS
AI
(ho
urs
/
yr)
AS
UI
(ho
urs/
yr)
E
NS
(K
W
H/
yr)
A
E
N
(K
W
H/
yr)
1 F1 0.24
8
3.6
2
14.53
49
0.9
99
58
7
0.00
041
2
1.3
19
4
0.2
02
3
2 F2 0.14
0
0.5
23
3.737
5
0.9
99
40
2
0.00
059
7
1.1
24
9
0.5
62
4
3 F3 0.25
0
3.6
2
14.46
67
0.9
99
58
6
0.00
041
4
11.
21
2
0.0
17
7
4 F4 0.24
7
3.6
1
14.38 0.9
99
58
7
0.00
041
2
12.
23
7
0.0
91
6
Table 3 shows that the performance
indices of IEEE RBTS BUS2, F1, F2, F3, and F4
are calculated using ETAP software they obtained
results are compared with FMEA technique, these
results are the same.
3.4 Case Study-3: Reliability indices of
PARGI distribution system
Consider PARGI distribution system (33/11KV)
with disconnects- with fuse- with alternative
supply- consider the repair of the transformer. The
practical PARGI distribution sub-station length of
the 11 kV feeder sections and 0.4 kV distribution
component data are shown in Table 23. Calculated
the reliability indices of the PARGI distribution
system in the PARGI distribution system, 33/11KV
it has the 154 no. of distribution transformer,
154no. of loads, 154 no. of fuses. PARGI
distribution system has six feeders. The PARGI
distribution system reliability indices calculated
using the FMEA method. The obtained results are
tabulated in table 4.
Table 4: Results of Reliability indices the PARGI
distribution system including F1, F2, F3,
F4, F5, and F6.
S
.
N
FEE
DER
NAM
E
SA
IFI
(int
erru
ptio
n/
yr)
SAI
DI
(hou
rs/
yr)
CAI
DI
(hou
rs/in
terru
ptio
n)
AS
AI
(h
ou
rs/
yr)
AS
UI
(h
ou
rs/
yr)
E
NS
(K
W
H/
yr)
AE
N
(K
WH
/ yr)
1 F1,
IND
UST
ERIA
L
0.1
791
3.42
88
19.1
41
0.9
99
6
0.0
00
39
18.
85
84
0.00
606
95
2 F2,
AGR
ICUL
TUR
AL
0.4
640
3.99
47
8.60
9
0.9
99
5
0.0
04
6
24
3.6
76
7
0.09
153
47
3 F3,
COM
MER
CIAL
0.5
370
4.19
05
7.80
3
0.9
99
5
0.0
04
8
18
4.3
82
0.15
718
841
4 F4,
RUR
AL
0.7
408
4.46
96
6.03
4
0.9
99
5
0.0
00
51
21
4.5
40
8
0.17
789
453
5 F5,
URB
AN
0.6
005
4.17
35
6.95
0
0.9
99
5
0.0
04
8
37
1.4
41
5
0.13
033
035
6 F6,
RESI
NDE
TIAL
0.5
053
4.13
19
8.17
7
0.9
99
5
0.0
00
47
21
0.7
26
9
0.18
166
112
3.5 Case study-4: Modelling of PARGI
distribution system using ETAP
software
Development of reliability modeling of PARGI
distribution system with disconnects, with fuses,
with alternative supply and repair of the
transformer using ETAP software. The obtained
results are tabulated in Table 5.
Table 5: Results of PARGI distribution system
Performance indices using ETAP
S
.
N
FEE
DER
NA
ME
SAI
FI
(int
erru
ptio
n/
yr)
SA
ID
I
(h
ou
rs/
yr)
CA
IDI
(ho
urs/i
nter
rupt
ion)
AS
AI
(ho
urs
/
yr)
AS
UI
(h
ou
rs/
yr)
E
NS
(K
W
H/
yr)
A
E
N
(K
W
H/
yr)
1 F1,
IND
UST
ERI
AL
0.17
91
3.4
28
8
19.1
41
0.9
99
6
0.0
00
39
18.
85
84
0.0
06
06
95

ADBU Journal of Electrical and Electronics Engineering (AJEEE) | www.tinyurl.com/ajeee-adbu
Raju et al., AJEEE, ISSN: 2582-0257, Vol.3 , Issue 2, November 2019, pp. 19-36 | Page | 27
2 F2,
AGR
ICU
LTU
RAL
0.46
40
3.9
94
7
8.60
9
0.9
99
5
0.0
04
6
24
3.6
76
7
0.0
91
53
47
3 F3,
CO
MM
ERC
IAL
0.53
70
4.1
90
5
7.80
3
0.9
99
5
0.0
04
8
18
4.3
82
0.1
57
18
84
1
4 F4,
RUR
AL
0.74
08
4.4
69
6
6.03
4
0.9
99
5
0.0
00
51
21
4.5
40
8
0.1
77
89
45
3
5 F5,
URB
AN
0.60
05
4.1
73
5
6.95
0
0.9
99
5
0.0
04
8
37
1.4
41
5
0.1
30
33
03
5
6 F6,
RESI
NDE
TIA
L
0.50
53
4.1
31
9
8.17
7
0.9
99
5
0.0
00
47
21
0.7
26
9
0.1
81
66
11
2
The PARGI distribution system F1, F2, F3, F4, F5,
and F6 are calculated using ETAP software. The
obtained results are compared with the FMEA
method and the results are the same.
3.6 Case Study-5: IEEE RBTS BUS-2 Feeders
with Distributed Generation Using ETAP
Software
Improvement of reliability IEEE RBTS BUS-2
feeders with distributed generation using ETAP
software is presented. The capacity of DG is 1MW
and its working 100% reliable. The DG is
connected to IEEE RBTS BUS2 and DG location
at A, B, C, and D. The system is shown in Fig 4.
The obtained results are tabulated in Tables 6, 7, 8
and 9.
Figure 4: Improvement of reliability indices of
IEEE RBTS BUS-2 FEEDER-1 with
DG at location A, B, C and D modeled
in ETAP software
A
B
C
D

ADBU Journal of Electrical and Electronics Engineering (AJEEE) | www.tinyurl.com/ajeee-adbu
Raju et al., AJEEE, ISSN: 2582-0257, Vol.3 , Issue 2, November 2019, pp. 19-36 | Page | 28
Table 6: Improvement of reliability indices of
IEEE RETS BUS 2 feeder1 with DG
S
.
N
DG
LO
CA
TIO
N
DI
S
T
A
N
C
E
SAIF
I
(inter
rupti
on/
yr)
SAI
DI
(hou
rs/
yr)
CAI
DI
(hour
s/inte
rrupti
on)
AS
AI
(ho
urs/
yr)
AS
UI
(ho
urs
/
yr)
1 A 0.
75 0.239
6 3.65
53 15.25
3 0.99
96 0.0
00
42 2 B 1.
5 0.239
6 3.58
59 14.96
4 0.99
96 0.0
00
41 3 C 2.
25 0.239
6 3.57
96 14.93
7 0.99
96 0.0
00
41 4 D 2.
85 0.239
6 3.57
66 14.92
5 0.99
96 0.0
00
41
Table 7: Improvement of reliability indices of
IEEE RETS BUS 2 feeder2 with DG
S
.
N
DG
LOC
ATI
ON
DIS
TAN
CE
SAIF
I
(inter
rupti
on/
year)
S
AI
DI
(h
ou
rs/
ye
ar)
CAIDI
(hours/i
nterrupti
on)
A
S
AI
(h
ou
rs/
ye
ar)
AS
UI
(ho
urs
/
yea
r)
1 A 0.75 0.139
8 0.
62
08
4.442 0.
99
99
0.0
00
07 2 B 1.35 0.139
8 0.
52
33
3.744 0.
99
99
0.0
00
06
Table 8 Improvement of reliability indices of
IEEE RETS BUS 2 feeder3 with DG
S
.
N
DG
LOC
ATI
ON
DIS
TAN
CE
SAIF
I
(inter
rupti
on/
yr)
S
AI
DI
(h
ou
rs/
yr)
CAIDI
(hours/i
nterrupti
on)
A
S
AI
(h
ou
rs/
yr)
AS
UI
(ho
urs
/
yr)
1 A 0.75 0.249
9 3.
76
36
15.059 0.
99
96
0.0
00
43 2 B 1.55 0.249
9 3.
63
25
14.535 0.
99
96
0.0
00
41 3 C 2.15 0.249
9 3.
62
57
14.507 0.
99
96
0.0
00
41 4 D 2.9 0.249
9 3.
62
23
14.498 0.
99
96
0.0
00
41
Table 9: Improvement of reliability indices of
IEEE RETS BUS 2 feeder4 with DG
S
.
N
DG
LOC
ATI
ON
DIS
TAN
CE
SAIF
I
(inter
rupti
on/
yr)
S
AI
DI
(h
ou
rs/
yr)
CAIDI
(hours/i
nterrupti
on)
A
S
AI
(h
ou
rs/
yr)
AS
UI
(ho
urs
/
yr)
1 A 0.8 0.247
0 3.
61
30
15.179 0.
99
96
0.0
00
43 2 B 1.55 0.247
0 3.
47
52
14.622 0.
99
96
0.0
00
41 3 C 2.3 0.247
0 3.
47
14
14.607 0.
99
96
0.0
00
41 4 D 2.9 0.247
0 3.
46
80
14.593 0.
99
96
0.0
00
41
3.7 Case Study-6: PARGI Distribution
System with Distributed Generation
Using ETAP Software
Improvement of reliability PARGI distribution
system feeders such as industrial, agricultural,
commercial, rural, urban, residential feeders with
distributed generation using ETAP software is
presented. The capacity of DG is 1MW and its
working 100% reliable. The DG is connected to
PARGI distribution system with DG at location A,
B, C, D, E and F the system shown in Fig 5. The
obtained results are tabulated in Tables 10, 11, 12,
13, 14 and 15.

ADBU Journal of Electrical and Electronics Engineering (AJEEE) | www.tinyurl.com/ajeee-adbu
Raju et al., AJEEE, ISSN: 2582-0257, Vol.3 , Issue 2, November 2019, pp. 19-36 | Page | 29
Figure 5: Improvement of reliability indices of
PARGI distribution industrial feeder
with DG at location A,B,C,D,E and
Fmodeled in ETAP software
Table 10: Improvement of reliability indices of
PARGI distribution system industrial
feeder with DG at location A,B,C,D,E
and F.
S
.
N
DG
LO
CA
TI
ON
DIS
TA
NC
E
SAIF
I
(inte
rrup
tion/
yr)
SAI
DI
(ho
urs/
yr)
CAID
I
(hours
/interr
uption
)
AS
AI
(h
ou
rs/
yr)
ASUI
(hour
s/ yr)
1 A 0.3 0.179
1 3.42
88 19.141 0.9
99
6
0.000
39
2 B 0.9 0.179
1 3.38
48 18.896 0.9
99
6
0.000
39
3 C 0.4 0.179
1 3.36
96 18.811 0.9
99
6
0.000
38
4 D 0.5 0.179
1 3.35
28 18.717 0.9
99
6
0.000
38
5 E 0.95 0.179
1 3.33
23 18.603 0.9
99
6
0.000
38
6 F 1.55 0.179
1 3.31
17 18.488 0.9
99
6
0.000
38
Table 11: Improvement of reliability indices of
PARGI distribution system Agricultural with DG
at location A,B,C,D,E and F.
S
.
N
DG
LO
CA
TIO
N
DIS
TA
NC
E
SAI
FI
(inte
rrup
tion/
year)
SAI
DI
(ho
urs/
yr)
CA
IDI
(ho
urs/
inte
rru
ptio
n)
AS
AI
(h
ou
rs/
yr)
ASUI
(hours
/ yr)
1 A 0.4 0.46
40 3.99
47 8.60
9 0.9
99
6
0.0004
6
2 B 0.6 0.46
40 3.89
49 8.39
4 0.9
99
6
0.0004
4
3 C 0.9 0.46
40 3.84
86 8.29
4 0.9
99
6
0.0004
4
4 D 1.2 0.46
40 3.78
74 8.16
2 0.9
99
6
0.0004
3
5 E 1.4 0.46
40 3.75
24 8.08
7 0.9
99
6
0.0004
3
6 F 1.9 0.46
40 3.74
01 8.06
0 0.9
99
6
0.0004
3
Table 12: Improvement of reliability indices of
PARGI distribution system Commercial
feeder with DG at A,B,C,D,E and G.
S
.
N
DG
LOC
ATI
ON
DIS
TAN
CE
SAIF
I
(inter
rupti
on/
year)
S
AI
DI
(h
ou
rs/
yr)
CAIDI
(hours/i
nterrupti
on)
A
S
AI
(h
ou
rs/
yr)
AS
UI
(ho
urs
/
yr)
1 A 0.3 0.537
0 4.
19
05
7.803 0.
99
95
0.0
00
48 2 B 0.8 0.537
0
4.
11
58
7.664 0.
99
95
0.0
00
48
3 C 1.3 0.537
0 3.
94
21
7.340 0.
99
96
0.0
00
45
A B
C
D
E
F

ADBU Journal of Electrical and Electronics Engineering (AJEEE) | www.tinyurl.com/ajeee-adbu
Raju et al., AJEEE, ISSN: 2582-0257, Vol.3 , Issue 2, November 2019, pp. 19-36 | Page | 30
4 D 1.9 0.537
0 3.
92
68
7.312 0.
99
96
0.0
00
45 5 E 2.8 0.537
0 3.
83
61
7.143 0.
99
96
0.0
00
44 6 F 3.3 0.537
0
3.
80
35
7.082 0.
99
96
0.0
00
43
7 G 3.7 0.537
0
3.
78
44
7.047 0.
99
96
0.0
00
43
Table 13: Improvement of reliability indices of
PARGI distribution system rural feeder
with DG at location A,B,C,D,E,F,G and
H.
S
.
N
DG
LOC
ATI
ON
DIS
TA
NC
E
SA
IFI
(int
err
upti
on/
yr)
SAI
DI
(ho
urs/
yr)
CAI
DI
(hou
rs/in
terru
ptio
n)
AS
AI
(ho
urs/
yr)
AS
UI
(ho
urs/
yr)
1 A 0.5 0.7
408 4.46
96 6.03
4 0.99
95 0.0
005
1 2 B 0.9 0.7
408 4.35
56 5.88
0 0.99
95 0.0
005
0 3 C 1.3 0.7
408 4.28
53 5.78
5 0.99
95 0.0
004
9 4 D 1.8 0.7
408 4.22
85 5.70
8 0.99
95 0.0
004
8 5 E 2.4 0.7
408 4.17
43 5.63
5 0.99
95 0.0
004
8 6 F 2.9 0.7
408 4.12
53 5.56
9 0.99
95 0.0
004
7 7 G 3.3 0.7
408 4.10
10 5.53
6 0.99
95 0.0
004
7 8 H 4.1 0.7
408 4.08
51 5.51
4 0.99
95 0.0
004
7
Table 14: Improvement of reliability indices of
PARGI distribution system urban feeder
with DG at location A,B,C,D,E,F,G and
H.
S
.
N
DG
LOC
ATI
ON
DIS
TA
NC
E
SA
IFI
(int
err
upti
on/
yr)
SA
ID
I
(ho
urs
/
yr)
CAI
DI
(hour
s/inte
rrupti
on)
A
S
AI
(h
ou
rs/
yr)
ASU
I
(hour
s/ yr)
1 A 0.6 0.6
005 4.1
73 6.950 0.
99
95
0.000
48
2 B 0.9 0.6
005 4.1
26
67
6.872 0.
99
95
0.000
47
3 C 1.2 0.6
005 4.0
64
1
6.768 0.
99
95
0.000
46
4 D 1.6 0.6
005 4.0
09
3
6.677 0.
99
95
0.000
46
5 E 2.1 0.6
005 3.9
55
9
6.588 0.
99
95
0.000
45
6 F 2.3 0.6
005 3.9
01
6
6.498 0.
99
95
0.000
45
7 G 2.5 0.6
005 3.8
86
7
6.473 0.
99
96
0.000
44
8 H 2.75 0.6
005 3.8
73
2
6.450 0.
99
96
0.000
44
Table 15: Improvement of reliability indices of
PARGI distribution system Residential
type feeder with DG at location
A,B,C,D,E,F,G,H,I and J.
S
.
N
DG
LOC
ATI
ON
DIS
TA
NC
E
SA
IFI
(int
err
upti
on/
yr)
SAI
DI
(ho
urs/
yr)
CAI
DI
(hou
rs/in
terru
ptio
n)
AS
AI
(ho
urs/
yr)
AS
UI
(ho
urs/
yr)
1 A 0.5 0.5
053 4.13
19 8.17
7 0.99
95 0.0
004
7 2 B 0.8 0.5
053 4.11
78 8.14
9 0.99
95 0.0
004
7 3 C 0.9 0.5
053 4.02
20 7.95
9 0.99
95 0.0
004
6 4 D 1.2 0.5
053 3.94
31 7.80
3 0.99
95 0.0
004
5 5 E 1.6 0.5
053 3.89
82 7.71
4 0.99
96 0.0
004
5 6 F 2.1 0.5
053 3.84
98 7.61
8 0.99
96 0.0
004
4 7 G 2.4 0.5
053 3.79
81 7.51
6 0.99
96 0.0
004
3 8 H 3.3 0.5
053 3.77
69 7.47
4 0.99
96 0.0
004
3 9 I 3.2 0.5
053
3.74
76
7.41
6
0.99
96
0.0
004
3
1
0
J 4.1 0.5
053
3.72
75
7.37
6
0.99
96
0.0
004
3
ADBU Journal of Electrical and Electronics Engineering (AJEEE) | www.tinyurl.com/ajeee-adbu
Raju et al., AJEEE, ISSN: 2582-0257, Vol.3 , Issue 2, November 2019, pp. 19-36 | Page | 31
4. Results of different case studies
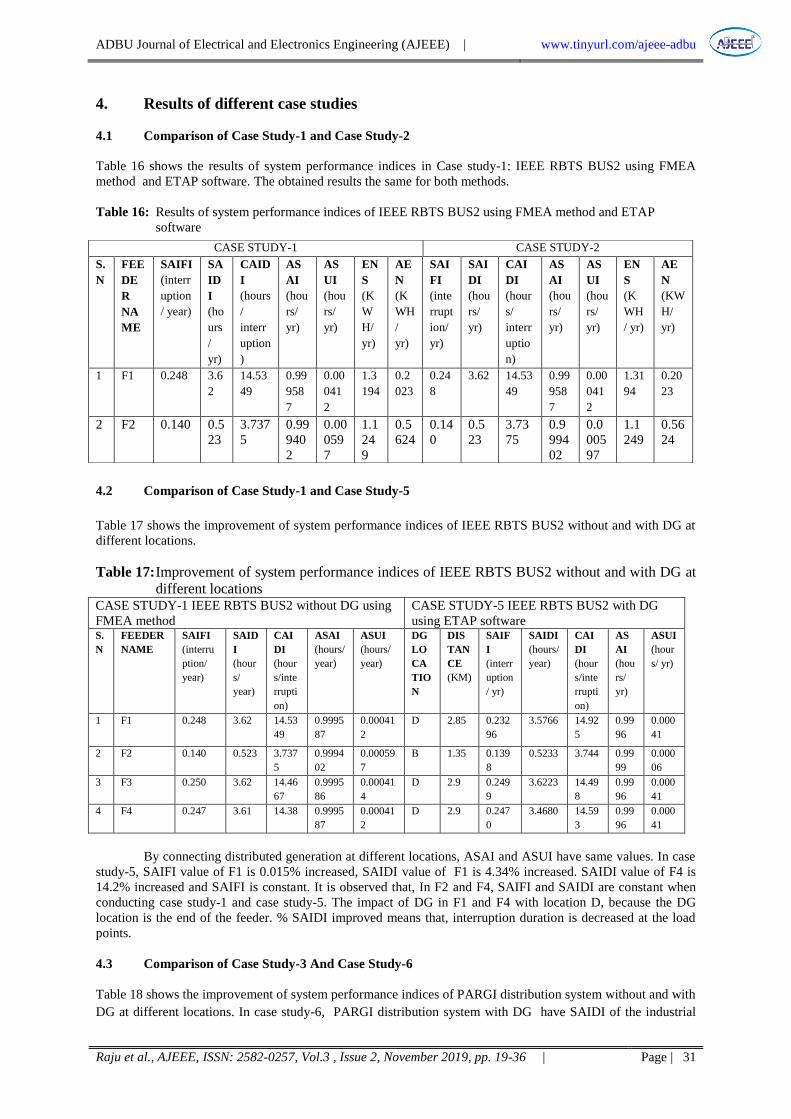
4.1 Comparison of Case Study-1 and Case Study-2
Table 16 shows the results of system performance indices in Case study-1: IEEE RBTS BUS2 using FMEA
method and ETAP software. The obtained results the same for both methods.
Table 16: Results of system performance indices of IEEE RBTS BUS2 using FMEA method and ETAP
software
4.2 Comparison of Case Study-1 and Case Study-5
Table 17 shows the improvement of system performance indices of IEEE RBTS BUS2 without and with DG at
different locations.
Table 17: Improvement of system performance indices of IEEE RBTS BUS2 without and with DG at
different locations
CASE STUDY-1 IEEE RBTS BUS2 without DG using
FMEA method
CASE STUDY-5 IEEE RBTS BUS2 with DG
using ETAP software S.
N
FEEDER
NAME
SAIFI
(interru
ption/
year)
SAID
I
(hour
s/
year)
CAI
DI
(hour
s/inte
rrupti
on)
ASAI
(hours/
year)
ASUI
(hours/
year)
DG
LO
CA
TIO
N
DIS
TAN
CE
(KM)
SAIF
I
(interr
uption
/ yr)
SAIDI
(hours/
year)
CAI
DI
(hour
s/inte
rrupti
on)
AS
AI
(hou
rs/
yr)
ASUI
(hour
s/ yr)
1 F1 0.248 3.62 14.53
49
0.9995
87
0.00041
2
D 2.85 0.232
96
3.5766 14.92
5
0.99
96
0.000
41
2 F2 0.140 0.523 3.737
5
0.9994
02
0.00059
7
B 1.35 0.139
8
0.5233 3.744 0.99
99
0.000
06
3 F3 0.250 3.62 14.46
67
0.9995
86
0.00041
4
D 2.9 0.249
9
3.6223 14.49
8
0.99
96
0.000
41
4 F4 0.247 3.61 14.38 0.9995
87
0.00041
2
D 2.9 0.247
0
3.4680 14.59
3
0.99
96
0.000
41
By connecting distributed generation at different locations, ASAI and ASUI have same values. In case
study-5, SAIFI value of F1 is 0.015% increased, SAIDI value of F1 is 4.34% increased. SAIDI value of F4 is
14.2% increased and SAIFI is constant. It is observed that, In F2 and F4, SAIFI and SAIDI are constant when
conducting case study-1 and case study-5. The impact of DG in F1 and F4 with location D, because the DG
location is the end of the feeder. % SAIDI improved means that, interruption duration is decreased at the load
points.
4.3 Comparison of Case Study-3 And Case Study-6
Table 18 shows the improvement of system performance indices of PARGI distribution system without and with
DG at different locations. In case study-6, PARGI distribution system with DG have SAIDI of the industrial
CASE STUDY-1 CASE STUDY-2
S.
N
FEE
DE
R
NA
ME
SAIFI
(interr
uption
/ year)
SA
ID
I
(ho
urs
/
yr)
CAID
I
(hours
/
interr
uption
)
AS
AI
(hou
rs/
yr)
AS
UI
(hou
rs/
yr)
EN
S
(K
W
H/
yr)
AE
N
(K
WH
/
yr)
SAI
FI
(inte
rrupt
ion/
yr)
SAI
DI
(hou
rs/
yr)
CAI
DI
(hour
s/
interr
uptio
n)
AS
AI
(hou
rs/
yr)
AS
UI
(hou
rs/
yr)
EN
S
(K
WH
/ yr)
AE
N
(KW
H/
yr)
1 F1 0.248 3.6
2
14.53
49
0.99
958
7
0.00
041
2
1.3
194
0.2
023
0.24
8
3.62 14.53
49
0.99
958
7
0.00
041
2
1.31
94
0.20
23
2 F2 0.140 0.5
23
3.737
5
0.99
940
2
0.00
059
7
1.1
24
9
0.5
624
0.14
0
0.5
23
3.73
75
0.9
994
02
0.0
005
97
1.1
249
0.56
24

ADBU Journal of Electrical and Electronics Engineering (AJEEE) | www.tinyurl.com/ajeee-adbu
Raju et al., AJEEE, ISSN: 2582-0257, Vol.3 , Issue 2, November 2019, pp. 19-36 | Page | 32
feeder at 11.71 %, the agricultural feeder is 25.46%, the commercial feeder is 40.61% the rural feeder is 38.45
%, the urban feeder is 34.1%, the residential feeder is 40.44% are improved as DG location changed, i.e., near to
end of load points. % SAIDI improved means that, interruption duration at the load points is decreased. Once
interruption duration is decreased, then the reliability can be improved at the customer load points. This
improvement of reliability indices can be compared without DG of PARGI distribution system.
Table 18: Improvement of system performance indices of PARGI distribution system without and with DG at
different locations
5. Conclusion
In this paper, IEEE RBTS Bus 2 and Indian
practical PARGI distribution system (33/11 kV)
reliability indices are evaluated. An analytical
method for reliability evaluation of a distribution
system with distribution generation has been
presented. Development of reliability modeling
through ETAP software is used to compare with
the FMEA method. The study of the case-5 and
case-6 of the research work proved that the
Distributed Generation could enhance the
reliability of IEEE RBTS Bus2 and Indian practical
PARIGI distribution system. The impact of
Distributed generation on distribution systems can
decrease the interruption duration time greatly, and
the distribution systems reliability was improved to
a large extent.
References
[1] P. C. Sekhar, R. A. Deshpande and V.
Sankar, “Evaluation and improvement of
reliability indices of electrical power
distribution system,” National Power
Systems Conference (NPSC),
Bhubaneswar, 2016, pp. 1-6. doi:
10.1109/NPSC.2016.7858838.
[2] E. VidyaSagar, T. Kavitha, S. Deepti
and A. P. Chan ar, “Reliability
Modeling and Analysis of Distribution
System Considering Weather Effects On
Substation and HVDC Concept On
Feeder,” International Journal of
advanced engineering and research
development (IJAERD), vol. 4, no. 12.
pp. 398-404, December 2017. Available:
http://www.ijaerd.com/papers/finished_
papers/Reliability%20Modelling%20and
%20Analysis%20of%20Distribution%2
0System%20Considering%20Weather%
20Effects%20on%20Substation%20and
%20HVDS%20Concept%20on%20Feed
er-IJAERDV04I1217706.pdf
[3] N. Chaiyabut and P.
Damrongkulkamjorn, “Impact of
customer scattering on distribution
system reliability with distributed
generation,” TENCON 2010 - 2010
IEEE Region 10 Conference, Fukuoka,
CASE STUDY-3 of PARGI distribution system without
and with DG
CASE STUDY-6 of PARGI distribution system without
and with DG
FEED
ER
NAM
E
SAIFI
(interru
ption/
year)
SAIDI
(hours/
year)
CAIDI
(hours/in
terruptio
n)
ASAI
(hours
/ year)
ASUI
(hours/
year)
DG
LO
CA
TIO
N
DIS
TA
NC
E
(KM
)
SAIFI
(interr
uption
/ year)
SAIDI
(hours
/ year)
CAIDI
(hours
/interr
uption
)
ASAI
(hour
s/
year)
ASUI
(hours/
year)
Indust
erial
0.1791 3.4288 19.141 0.9996 0.00039 F 1.55 0.1791 3.3117 18.488 0.999
6
0.0003
8
Agricu
ltral
0.4640 3.9947 8.609 0.9995 0.0046 F 1.9 0.4640 3.7401 8.060 0.999
96
0.0004
3
Comm
ercial
0.5370 4.1905 7.803 0.9995 0.0048 G 3.7 0.5370 3.7844 7.047 0.999
96
0.0004
3
Rural 0.7408 4.4696 6.034 0.9995 0.00051 H 4.1 0.7408 4.0851 5.514 0.999
5
0.0004
7
Urban 0.6005 4.1735 6.950 0.9995 0.0048 I 3.7 0.6005 3.8325 6.382 0.999
6
0.0004
4
Reside
ntial
0.5053 4.1319 8.177 0.9995 0.00047 J 4.1 0.5053 3.7275 7.376 0.999
6
0.0004
3

ADBU Journal of Electrical and Electronics Engineering (AJEEE) | www.tinyurl.com/ajeee-adbu
Raju et al., AJEEE, ISSN: 2582-0257, Vol.3 , Issue 2, November 2019, pp. 19-36 | Page | 33
2010, pp. 568-573. doi:
10.1109/TENCON.2010.5686745
[4] R. N. Allan, R. Billinton, I. Sjarief, L.
Goel and K. S. So, “A reliability test
system for educational purposes-basic
distribution system data and results,” in
IEEE Transactions on Power Systems,
vol. 6, no. 2, pp. 813-820, May 1991.
doi: 10.1109/59.76730.
[5] P. Mazidi and G. N. Sreenivas,
“Reliability Analysis Of Radial
Distributed Generation Distribution
stem,” International Journal Of
Electrical And Electronics Engineering
(IJEEE), vol. 3, no. 2, pp. 82-88, 2003.
Available:
https://pdfs.semanticscholar.org/1fe0/7b
584fb1d7e829db51425c3648e577ae1c1
1.pdf
[6] P. U. Okorie, U.O. Aliyu, B. Jimoh, S.
M. ani, “ elia ilit in ices o electrical
distribution networks system
assessment,” Journal of Electronics and
Communication Engineering Research,
vol. 3, no. 1, pp. 1-6, 2015. Available:
https://pdfs.semanticscholar.org/f6b3/a4
ae85729043d04da3b9ad7aba09502aca8
8.pdf
[7] “The Electricity Act 2003”, Ministry of
Law and Justice (Legislative
Department), Government of India, 26
May 2003. [Online]. Available:
http://www.cercind.gov.in/Act-with-
amendment.pdf [Accessed: 18 June
2019]
[8] N. Balijepalli, S. S. Venkata and R. D.
Christie, “Predicting distribution system
performance against regulatory
reliability standards,” in IEEE
Transactions on Power Delivery, vol.
19, no. 1, pp. 350-356, Jan. 2004. doi:
10.1109/TPWRD.2003.820192
[9] N. Balijepalli, S. S. Venkata and R. D.
Christie, “Modeling and analysis of
distribution reliability indices,” in IEEE
Transactions on Power Delivery, vol.
19, no. 4, pp. 1950-1955, Oct. 2004. doi:
10.1109/TPWRD.2004.829144
[10] V. Sankar, System Reliability Concepts,
1st ed., Bombay, India, Himalaya
Publishing House Pvt Ltd, 2015.
[11] K. V. Harikrishna, V. Ashok, P.
Chandrasekhar, T. Raghunatha and V.
Bharathi “ ssessment o elia ilit in
Power Distribution System,” in National
Conference on Power Distribution
(NCPD-2012), CPRI, Bangalore, 8-9
Nov. 2012.
[12] M. M. Mahmoud, M. Elshahed and M.
S. Elsobki, “The mpact o Distri ute
Energy Resources on the Reliability of
mart Distri ution stem,” Majlesi
Journal of Electrical Engineering, vol.
12, no. 4, pp. 1-14, 2018. Available:
http://mjee.iaumajlesi.ac.ir/index/index.
php/ee/article/view/2708
[13] K. Raju and G. N. Srinivas, “ aluation
of Distribution system Reliability in the
presence o multiple DGs,”
Mediterranean Journal of Modeling and
Simulation, vol. 10, pp. 17-28, 2018.
Available:
http://oaji.net/articles/2017/1983-
1538373404.pdf
[14] IEEE Power and Energy Society, “
for Electric Power Distribution
Reliability In ices”, IEEE Standard
1366 (2012).
[15] R. N. Allan, R. Billinton, I. Sjarief, L.
Goel and K. S. So, “A reliability test
system for educational purposes-basic
distribution system data and results,” in
IEEE Transactions on Power Systems,
vol. 6, no. 2, pp. 813-820, May 1991.
doi: 10.1109/59.76730

ADBU Journal of Electrical and Electronics Engineering (AJEEE) | www.tinyurl.com/ajeee-adbu
Raju et al., AJEEE, ISSN: 2582-0257, Vol.3 , Issue 2, November 2019, pp. 19-36 | Page | 34
Authors’ Profiles
Raju KADURU was born in
India, in 1985. He received the
B.Tech. degree from Jawaharlal
Nehru Technological University
Hyderabad, India in 2007, the
M.Tech. and a Ph.D. degree
from Jawaharlal Nehru Technological University
Hyderabad College of Engineering, Hyderabad,
India in 2011 and 2018. His area of interest
includes power system, FACT, and distribution
system reliability.
PENTAMALLA PRAVEEN
KUMAR was born in India, in
1996. He received the B.Tech.
degree from Jawaharlal Nehru
Technological University
Hyderabad 2017, and is
currently pursuing M.Tech at
TKR College of Engineering Technology
Hyderabad, Telangana, India.
G. N. SRINIVAS was born in
India, in 1973. He received the
Bachelor Technical degree from
Jawaharlal Nehru Technological
University College of
Engineering, Hyderabad, India
in 1995, the M.E. degree from
Osmania University, Hyderabad, India. In 2001,
and the Ph.D. degree in Electrical Engineering
from Jawaharlal Nehru Technological University,
Hyderabad, India in 2009. He has teaching and
research experiences of about 19 years,
published/presented more than 20 papers at
National and International levels. Chaired technical
sessions at National and International Conferences.
Currently, he is a Professor in the Electrical
Engineering Department, vice-principal JNTUH
College of Engineering Hyderabad. His research
interest includes Power quality and evaluation of
distribution system reliability.

ADBU Journal of Electrical and Electronics Engineering (AJEEE) | www.tinyurl.com/ajeee-adbu
Raju et al., AJEEE, ISSN: 2582-0257, Vol.3 , Issue 2, November 2019, pp. 19-36 | Page | 35
APPENDIX
Table 19: PARGI distribution substation system reliability data
Table 20: PARGI distribution substation system customer data
Table 21: PARGI distribution substation system components data
S.
N
Feeder Name Length
in KM
Feeder Section Number
1 F1,
INDUSTRIAL
0.1
0.2
0.25
0.3
0.35
0.4
0.6
5,6,9
3,8
12
1,4,7
10
2
11
2
F2,
AGRICULTURAL
0.1
0.2
0.3
0.4
0.5
31,33,35
14,15,17,18,20,23,26,27,28,32,36,37,38,40,
42,43,44,46,51,52,54,57,58,59,60
16,19,21,22,24,25,29,30,34,39,45,48,49,53
13,47,50,56,61
41,55
3 F3,
COMMERCIAL
0.1
0.2
0.3
0.4
0.5
0.6
74,75,86
63,68,69,70,71,76,79,85,100,103
62,65,66,72,77,78,80,87,89,92,93,95,96,99,
101,104,105
67,73,82,83,84,88,102,106
64,90,91,94,97,98
81
COMPONENT RATING OF
COMPONENT
AVERAGE
FAILURE RATE
(f/yr)
AVERAGE REPAIR
TIME (hr)
TRANSFORMER 33/11KV
11/0.415 KV
0.015
0.0150
0
200
CIRCUIT BREAKER 33
11
0.0015
0.004
4
4
BUS BAR 33
11
0.001
0.001
2
2
LINES 33
11
0.0460
0.0650
2
2
S.
N
NAME OF THE
FEEDER
TYPE OF
FEEDER
NUMBER
OF DT’S
AVERAGE
LOAD
PEAK
LOAD
NUMBER OF
CUSTOMERS
SECTION
NUMBERS
LENGTH
OF
FEEDER
1 URBAN Industrial 9 0.0066 0.0055 3107 1-9 3.2
2 AGRICULTURAL Agriculture 29 0.061 0.12 2650 10-38 12.5
3 COMMERCIAL Commercial 28 0.044 0.072 1173 39-66 14.2
4 GADISINAPIR Rural 31 0.048 0.128 1206 67-97 18.5
5 URBAN Urban 31 0.089 0.118 2850 98-128 14.85
6 NASKAL Residential 26 0.51 0.078 1160 129-154 13.65

ADBU Journal of Electrical and Electronics Engineering (AJEEE) | www.tinyurl.com/ajeee-adbu
Raju et al., AJEEE, ISSN: 2582-0257, Vol.3 , Issue 2, November 2019, pp. 19-36 | Page | 36
4
F4,
RURAL
0.2
0.3
0.4
0.5
0.6
117,119,125,127,128,135,137,138,
144,145,150,151,156,158,162,163
109,111,113,116,118,122,124,130,
131,134,136,139,143,148,152,155,157, 159, 161,
108,110,112,114,115,120,121,123,126,
132,142,147,149,153,154
107,129,133,140,146,160
141
5 F5,
URBAN
0.05
0.1
0.2
0.25
0.3
0.4
0.5
0.6
210,212
165,215
166,168,169,174,175,177,178,180,182183,
187,188,189, 190,191,197,202,203,208,209, 211
167
170,171,172,176,184,185,186,199,201,204,
206,207
164,173,181,193,194,195,196,198,200,213,
214
179,192,205
216
6 F6,
RESIDENTIAL
0.05
0.1
0.2
0.3
0.4
0.5
0.6
220
247
225,230,232,237,238,239,242,245,246,255,
258
219,222,226,228,234,243,244,250,251,252,253,256,257
218,221,223,224,227,233,236,241,248,259
217,229,235,240,249
254