Evaluation and Extension Of Code Metrics In Microsoft Visual Studio
119
Final Thesis Evaluation and Extension of Code Metrics in Microsoft Visual Studio Team System and Team Foundation Server 2008 by Tommie Haag Magnus Holm LITH-IDA-EX-08/007-SE 2008-02-11
Transcript of Evaluation and Extension Of Code Metrics In Microsoft Visual Studio

Final Thesis
Evaluation and Extension of Code Metrics
in Microsoft Visual Studio Team System
and Team Foundation Server 2008
by
Tommie Haag
Magnus Holm
LITH-IDA-EX-08/007-SE
2008-02-11


Linköpings universitet
Department of Computer and Information Science
Final Thesis
Evaluation and Extension of Code Metrics
in Microsoft Visual Studio Team System
and Team Foundation Server 2008
by
Tommie Haag
Magnus Holm
LITH-IDA-EX-08/007-SE
2008-02-11
Supervisor: Kristian Sandahl IDA, Linköpings universitet Dag König Microsoft
Nils Stadling Microsoft
Examiner: Kristian Sandahl IDA, Linköpings universitet
Rapporttyp Report category
Licentiatavhandling
Examensarbete
C-uppsats
D-uppsats
Övrig rapport
Språk Language
Svenska/Swedish
Engelska/English
Titel Title
Författare Author
Sammanfattning Abstract
ISBN
ISRN LITH-IDA-EX-08/007-SE
Serietitel och serienummer ISSN Title of series, numbering
Nyckelord Keywords
Datum Date
URL för elektronisk version
X
Avdelning, institution Division, department
Institutionen för datavetenskap
Department of Computer
and Information Science
Evaluation and Extension of Code Metrics in Microsoft Visual Studio Team System and Team Foundation Server
2008
Tommie Haag
Magnus Holm
Measurement is a necessity in software engineering if it is to be considered an engineering discipline. As a response
to an increased demand on measurement from the industry, Microsoft has implemented a code metrics feature in
their new release of Visual Studio. On behalf of the Microsoft Corporation this master thesis evaluated the
usefulness and relevance of the five code metrics implemented in Visual Studio 2008 for software engineering
projects. This purpose is further divided into five research questions:
In what contexts are the code metrics in Visual Studio 2008 relevant and useful (if any)?
What are the usage areas for the code metrics implemented in Visual Studio 2008?
What are reasonable thresholds on the implemented code metrics in Visual Studio 2008?
How should one remedy poor values of the code metrics implemented in Visual Studio 2008?
Is historical code metrics data of any importance?
This master thesis also included a practical part, consisting of extending both Microsoft Team Foundation Server
and Visual Studio to allow historical code metrics data to be stored and analyzed. The evaluation was performed by
both a theoretical and an empirical approach. Most of the theoretical material has been collected from well-known
scientific sources. The empirical part consists of interviews of software managers at five different companies,
gathering experience from quality assurance work. Four out of five code metrics in Visual Studio 2008 were found
to be relevant and useful in most contexts. Lines of code was the only code metric concluded to be obsolete.
Recommended thresholds and remedies against bad values (although not standardized) on these five code metrics
were found. These are presented and described in this report.
Software Engineering, Code Metrics, Visual Studio Team System, Team Foundation Server, Maintainability Index,
Cyclomatic Complexity, Depth of Inheritance, Class Coupling, Lines of Code, Quality Assurance, Microsoft
2008-02-11
Linköpings universitet
X
EVALUATION AND EXTENSION
OF CODE METRICS IN
MICROSOFT VISUAL STUDIO
TEAM SYSTEM AND TEAM
FOUNDATION SERVER 2008 A Theoretical and Empirical Investigation
15 February 2008
Tommie Haag & Magnus Holm

I
Dedicated to my beloved parents and
grandparents. This one is for you.
Tommie
Dedication to my family who
supported me during my graduation.
Magnus
II
Acknowledgements
Falënderim, , hvala, kiitos, ευχαριστία, sipas, спасибо, mahadsanid, agradecimiento, ,
teşekkür, danke schön, merci and tack are all words for thank you in 14 different languages. We
would like to dedicate this page to those who have helped and supported us during the fall of 2007.
We would like to start thanking Dag König, Conor Morrison and Nils Stadling at Microsoft for their
support and technical expertise. Without their contributions this master thesis would have never
become what it actually is.
Furthermore we would like to show our greatest gratitude towards our examiner and tutor Kristian
Sandahl at Linköpings Universitet. His theoretical expertise has helped us very much, and we are
especially grateful for the time taken guiding us in our work.
We would also like to thank all those people who participated in the interviews. Without your clear
and detailed answers our master thesis had been very thin and void of practical experience.
Last but by no means least we would like to thank our families for their love and support.
Norrköping, December 17, 2007
Tommie Haag Magnus Holm

III
Abstract
Measurement is a necessity in software engineering if it is to be considered an engineering discipline.
As a response to an increased demand for measurement from the industry, Microsoft has
implemented a code metrics feature in their new release of Visual Studio. On behalf of the Microsoft
Corporation this master thesis evaluated the usefulness and relevance of the five code metrics
implemented in Visual Studio 2008 for software engineering projects.
This purpose is further divided into five research questions:
In what contexts are the code metrics in Visual Studio 2008 relevant and useful (if any)?
What are the usage areas for the code metrics implemented in Visual Studio 2008?
What are reasonable thresholds on the implemented code metrics in Visual Studio 2008?
How should one remedy poor values of the code metrics implemented in Visual Studio 2008?
Is historical code metrics data of any importance?
This master thesis also included a practical part, consisting of extending both Microsoft Team
Foundation Server and Visual Studio to allow historical code metrics data to be stored and analyzed.
The evaluation was performed by both a theoretical and an empirical approach. Most of the
theoretical material has been collected from well-known scientific sources. The empirical part
consists of interviews of software managers at five different companies, gathering experience from
quality assurance work.
Four out of five code metrics in Visual Studio 2008 were found to be relevant and useful in most
contexts. Lines of code was the only code metric concluded to be obsolete. Recommended
thresholds and remedies against bad values (although not standardized) on these five code metrics
were found. These are presented and described in this report.

IV
Table of Contents
ACKNOWLEDGEMENTS .................................................................................................................................... II
ABSTRACT ....................................................................................................................................................... III
TABLE OF CONTENTS ....................................................................................................................................... IV
LIST OF FIGURES ............................................................................................................................................. VII
LIST OF TABLES .............................................................................................................................................. VIII
1 PREFACE................................................................................................................................................. 11
1.1 BACKGROUND .......................................................................................................................................... 11
1.2 TARGET GROUPS ...................................................................................................................................... 13
1.3 PURPOSE AND RESEARCH QUESTIONS ........................................................................................................... 13
1.3.1 Scientific Purpose ............................................................................................................................ 13
1.3.2 Practical Purpose ............................................................................................................................. 14
1.4 SCOPE .................................................................................................................................................... 14
1.5 METHOD ................................................................................................................................................ 15
1.6 CRITICISM OF THE METHOD ........................................................................................................................ 15
1.7 DISPOSITION ............................................................................................................................................ 16
2 THEORETICAL FRAMEWORK ..................................................................................................................... 3
2.1 QUALITY ATTRIBUTES .................................................................................................................................. 3
2.2 QUALITY MODELS ....................................................................................................................................... 3
2.2.1 McCall’s Quality Model ..................................................................................................................... 4
2.2.2 Boehm’s Software Quality Model ...................................................................................................... 6
2.2.3 ISO/IEC 9126 Quality Model .............................................................................................................. 7
2.3 SOFTWARE METRICS ................................................................................................................................... 8
2.3.1 Definition of Software Metrics .......................................................................................................... 9
2.3.2 Classification of Software Metrics ................................................................................................... 11
2.3.3 Purpose and Use of Software Metrics ............................................................................................. 13
2.3.4 Requirements on Software Metrics ................................................................................................. 15
2.3.5 Limitations of Software Metrics ...................................................................................................... 17
2.4 CODE METRICS ........................................................................................................................................ 19
2.4.1 Existing Code Metrics ...................................................................................................................... 19 2.4.1.1 Halstead Metrics (Measuring Length) .................................................................................................... 20 2.4.1.2 Maintainability Index .............................................................................................................................. 21 2.4.1.3 Tree Impurity (Measuring Data/Information Flow) ................................................................................ 21 2.4.1.4 DATA (Measuring Data Structure) .......................................................................................................... 23 2.4.1.5 Object-Oriented Code Metrics ............................................................................................................... 23 2.4.1.6 Complexity Code Metrics........................................................................................................................ 25 2.4.1.7 Quantitative Code Metrics ..................................................................................................................... 26
2.4.2 Thresholds for Code Metrics and Remedies for Poor Values ........................................................... 26 2.4.2.1 Maintainability Index .............................................................................................................................. 27 2.4.2.2 Cyclomatic Complexity ........................................................................................................................... 27 2.4.2.3 Depth of Inheritance .............................................................................................................................. 28 2.4.2.4 Class Coupling ......................................................................................................................................... 29 2.4.2.5 Lines of Code .......................................................................................................................................... 29
3 EMPIRICAL RESEARCH ............................................................................................................................ 32
V
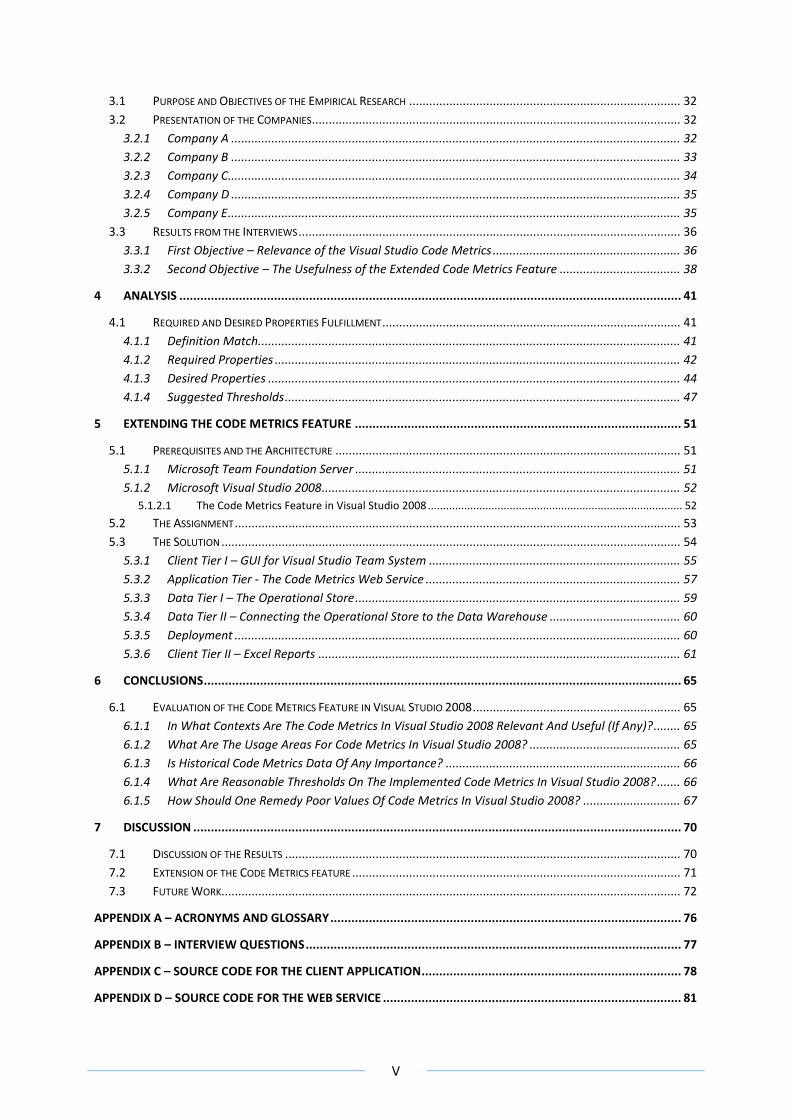
3.1 PURPOSE AND OBJECTIVES OF THE EMPIRICAL RESEARCH ................................................................................. 32
3.2 PRESENTATION OF THE COMPANIES .............................................................................................................. 32
3.2.1 Company A ...................................................................................................................................... 32
3.2.2 Company B ...................................................................................................................................... 33
3.2.3 Company C....................................................................................................................................... 34
3.2.4 Company D ...................................................................................................................................... 35
3.2.5 Company E ....................................................................................................................................... 35
3.3 RESULTS FROM THE INTERVIEWS .................................................................................................................. 36
3.3.1 First Objective – Relevance of the Visual Studio Code Metrics ........................................................ 36
3.3.2 Second Objective – The Usefulness of the Extended Code Metrics Feature .................................... 38
4 ANALYSIS ............................................................................................................................................... 41
4.1 REQUIRED AND DESIRED PROPERTIES FULFILLMENT ......................................................................................... 41
4.1.1 Definition Match.............................................................................................................................. 41
4.1.2 Required Properties ......................................................................................................................... 42
4.1.3 Desired Properties ........................................................................................................................... 44
4.1.4 Suggested Thresholds ...................................................................................................................... 47
5 EXTENDING THE CODE METRICS FEATURE ............................................................................................. 51
5.1 PREREQUISITES AND THE ARCHITECTURE ....................................................................................................... 51
5.1.1 Microsoft Team Foundation Server ................................................................................................. 51
5.1.2 Microsoft Visual Studio 2008 ........................................................................................................... 52 5.1.2.1 The Code Metrics Feature in Visual Studio 2008 .................................................................................... 52
5.2 THE ASSIGNMENT ..................................................................................................................................... 53
5.3 THE SOLUTION ......................................................................................................................................... 54
5.3.1 Client Tier I – GUI for Visual Studio Team System ........................................................................... 55
5.3.2 Application Tier - The Code Metrics Web Service ............................................................................ 57
5.3.3 Data Tier I – The Operational Store ................................................................................................. 59
5.3.4 Data Tier II – Connecting the Operational Store to the Data Warehouse ....................................... 60
5.3.5 Deployment ..................................................................................................................................... 60
5.3.6 Client Tier II – Excel Reports ............................................................................................................ 61
6 CONCLUSIONS ........................................................................................................................................ 65
6.1 EVALUATION OF THE CODE METRICS FEATURE IN VISUAL STUDIO 2008 .............................................................. 65
6.1.1 In What Contexts Are The Code Metrics In Visual Studio 2008 Relevant And Useful (If Any)? ........ 65
6.1.2 What Are The Usage Areas For Code Metrics In Visual Studio 2008? ............................................. 65
6.1.3 Is Historical Code Metrics Data Of Any Importance? ...................................................................... 66
6.1.4 What Are Reasonable Thresholds On The Implemented Code Metrics In Visual Studio 2008? ....... 66
6.1.5 How Should One Remedy Poor Values Of Code Metrics In Visual Studio 2008? ............................. 67
7 DISCUSSION ........................................................................................................................................... 70
7.1 DISCUSSION OF THE RESULTS ...................................................................................................................... 70
7.2 EXTENSION OF THE CODE METRICS FEATURE .................................................................................................. 71
7.3 FUTURE WORK......................................................................................................................................... 72
APPENDIX A – ACRONYMS AND GLOSSARY .................................................................................................... 76
APPENDIX B – INTERVIEW QUESTIONS ........................................................................................................... 77
APPENDIX C – SOURCE CODE FOR THE CLIENT APPLICATION .......................................................................... 78
APPENDIX D – SOURCE CODE FOR THE WEB SERVICE ..................................................................................... 81
VI
ICODEMETRICSSERVICE.CS ...................................................................................................................................... 81
CODEMETRICSSERVICE.CS ....................................................................................................................................... 82
WEB.CONFIG ........................................................................................................................................................ 84
SERVICE.SVC ......................................................................................................................................................... 87
APPENDIX E – SOURCE CODE FOR THE OPERATIONAL STORE ......................................................................... 88
TABLES ................................................................................................................................................................ 88
MetricsData .................................................................................................................................................. 88
SavedEntries ................................................................................................................................................. 88
STORED PROCEDURES ............................................................................................................................................. 89
HarvestCodeMetrics ..................................................................................................................................... 89
InsertCodeMetrics ........................................................................................................................................ 89
APPENDIX F – SOURCE CODE FOR THE ADAPTER ............................................................................................ 91
THE XML SCHEMA ................................................................................................................................................ 91
THE ADAPTER ....................................................................................................................................................... 92
ANNOTATED BIBLIOGRAPHY .......................................................................................................................... 95

VII
List of Figures
FIGURE 1. FROM (FENTON & PFLEEGER, 1998). MCCALL'S SOFTWARE QUALITY MODEL DESCRIBED BY THREE LEVELS OF ABSTRACTION;
USE, FACTOR AND CRITERIA. METRICS ARE THE TOOLS NEEDED TO MEASURE THE CRITERIA. ............................................... 6
FIGURE 2. FROM (CÔTÉ, SYRUN, & GEORGIADOU, 2006). BOEHM'S QUALITY MODEL. ............................................................. 7
FIGURE 3. FROM (MILICIC, 2005).THE ISO/IEC 9126 QUALITY MODEL. SIX QUALITY CHARACTERISTICS ARE THE BUILDING BLOCKS
FOR THIS MODEL. ................................................................................................................................................. 8
FIGURE 4. AFTER (FENTON & PFLEEGER, 1998). DECOMPOSITION OF MAINTAINABILITY. METRICS ARE USED TO QUANTIFY CRITERIA,
WHICH IN TURN IS USED TO ESTABLISH A FACT ABOUT A QUALITY FACTOR. ..................................................................... 11
FIGURE 5. REQUIRED AND DESIRED PROPERTIES OF SOFTWARE METRICS. THE SOLID LINES REPRESENT REQUIRED PROPERTIES WHILE
DASHED LINES REPRESENT DESIRED PROPERTIES. ...................................................................................................... 17
FIGURE 6. DEPENDENCY GRAPHS REPRESENTING THE SAME PROGRAM MODULE, BUT WITH DIFFERENT DEGREES OF TREE IMPURITY .. 22
FIGURE 7. A SIMPLE EXAMPLE SHOWING RELATIONSHIPS BETWEEN FICTIONAL CLASSES. THE CLASS COMPUTER HAS A COMPONENT
OBJECT AS A CLASS MEMBER, WHILE HARDDRIVE, MEMORY AND PROCESSOR INHERITS FROM THE COMPONENT CLASS. ........ 24
FIGURE 8. A CODE SNIPPET AND ITS FLOWGRAPH REPRESENTATION. ..................................................................................... 25
FIGURE 9. TEAM FOUNDATION SERVER THREE-TIER ARCHITECTURE. ..................................................................................... 52
FIGURE 10. CODE METRICS GENERATED IN VISUAL STUDIO 2008 FOR THE AUTHORS’ CLIENT APPLICATION INSTALLATION PACKAGE. . 53
FIGURE 11. AFTER (MICROSOFT, 2007). AN OVERVIEW OF THE INTENDED ARCHITECTURE TO SOLVE THE ASSIGNED TASK OF
EXTENSION. ...................................................................................................................................................... 55
FIGURE 12. A SCREENSHOT WHICH SHOWS WHERE TO FIND OUR CLIENT PACKAGE IMPLEMENTATION IN VISUAL STUDIO 2008. ...... 56
FIGURE 13. THE GUI IN THE CLIENT APPLICATION. THIS WINDOW IS LAUNCHED FROM INSIDE VISUAL STUDIO 2008. .................... 56
FIGURE 14. (AFTER (WIKIPEDIA, 2007)) THE .NET 3.0 STACK. WCF IS ONE OF FOUR APIS USED IN THE FRAMEWORK. ............... 57
FIGURE 15. MICROSOFT EXCEL 2007 REPORT EXAMPLE. ................................................................................................... 62

VIII
List of Tables
TABLE 1. TERMINOLOGY USED IN MCCALL, BOEHM AND ISO/IEC 9126 QUALITY MODELS ........................................................ 4
TABLE 2. DESCRIPTION OF EACH QUALITY CHARACTERISTIC IN ISO/IEC 9126. ......................................................................... 8
TABLE 3. CLASSIFICATION AND THRESHOLDS FOR MAINTAINABILITY INDEX USED BY MICROSOFT. ................................................ 21
TABLE 4. HEWLETT PACKARD’S THRESHOLDS FOR MI. ....................................................................................................... 27
TABLE 5. MICROSOFT’S THRESHOLDS FOR MI. ................................................................................................................. 27
TABLE 6. AFTER (VANDOREN, SOFTWARE TECHNOLOGY ROADMAP - CYCLOMATIC COMPLEXITY, 2007). RECOMMENDED
THRESHOLDS FOR CYCLOMATIC COMPLEXITY. .......................................................................................................... 28
TABLE 7. THE INTERVIEWED COMPANIES’ POSITIONS ON THE RELEVANCE AND USEFULNESS OF THE IMPLEMENTED CODE METRICS IN
VSTS. NOTE THAT PURE OBJECT-ORIENTED METRICS IS NOT APPLICABLE ON COMPANY B, C OR E...................................... 37
TABLE 8. FULFILLMENT OF REQUIRED PROPERTIES FOR EACH CODE METRIC PROVIDED BY MICROSOFT. THE MAPPING BETWEEN
PROPERTY AND PROPERTY NUMBER IS GIVEN IN THE BEGINNING OF THIS CHAPTER........................................................... 44
TABLE 9. FULFILLMENT OF DESIRED PROPERTIES FOR EACH CODE METRIC PROVIDED BY MICROSOFT. THE MAPPING BETWEEN PROPERTY
NUMBER AND NAME IS GIVEN AT THE BEGINNING OF THIS SUBCHAPTER. ....................................................................... 47
TABLE 10. SAVEDENTRIES TABLE COLUMNS IN THE LOCAL OPERATIONAL STORE ...................................................................... 59
TABLE 11. METRICSDATA TABLE COLUMNS IN THE LOCAL OPERATIONAL STORE. ..................................................................... 59
TABLE 12. RECOMMENDED THRESHOLDS FOR THE CODE METRICS IN VISUAL STUDIO 2008 ...................................................... 66


PART 0 - PROLOGUE
Chapter 1 – Preface
This report, by its very length, defends itself
against the risk of being read
- Winston Churchill
(1874-1965)
Chapter 1 – Preface
11
1 Preface
This chapter serves as a prologue to the report. First the background is presented which presents the
problem followed by a description of the target groups, purpose and research questions. The scope is
presented and delimited, where after the method is described. Lastly the disposition of the rest of the
report is presented.
1.1 Background Consider the notion of software engineering. The concept implies that there should be an
engineering approach to construction or support of software products. This includes activities as
planning, analyzing, maintaining, implementing, testing, developing, designing, specifying and so
forth. By having an engineering approach, you ensure that each activity in the process is controlled
and understood, to minimize the number of surprises for the project members during the life-cycle of
the project. Compare this to the concept of computer science. The latter provides the theoretical
foundation for building software, whereas software engineering is concerned with implementation
of the software in a scientific and controlled way (Fenton & Pfleeger, 1998, p. 9).
To enforce a scientific approach, you have to be able to control the software engineering project.
Control is in turn gained by knowledge about the status of the project and the project’s properties.
Knowledge, in turn, is gained by observing and measuring these properties and their alterations
through time. It is here software metrics come into play. Software metrics are the tools necessary to
extract the knowledge needed for project control.
It is important to control the software projects – not just run them. First of all, if you do not control
your projects you will have hard time learning for future projects. Measurements on completed
projects act as a foundation for planning and estimating resources for upcoming projects. Secondly, if
you cannot measure a project, how do you know if it is healthy or not? How do you know that the
project is on track and meets the targeted quality properties? Tom DeMarco, a renowned speaker
and author on software engineering topics and an advocate of software measurement makes it
perfectly clear in his book Controlling Software Projects:
“You cannot control what you cannot measure.” (DeMarco, 1982)
Of course, just measuring is not enough. You have to have clear goals for the measurements too. The
goals have to be specific and correlated to information necessary for management and developers.
Both developers as well as customers rely on measurements to aid them in deciding if specified
quality goals are met and if the project is on track. (Fenton & Pfleeger, 1998, p. 18)
The methods and processes used in software engineering have been greatly improved during the last
decades, but just improving the methodological foundation of the profession does not make it an
engineering discipline. Metrics as a quality assurance tool has unfortunately not been applied at an
adequate level in the software industry (Galin, 2004, p. 413). The lack of use of measurement
undermines, or even disqualifies, the software industry as an engineering field (Fenton & Pfleeger, 1998,
p. 11). Measurement has a central role in for example mechanical, electrical and civil engineering. It is

Chapter 1 – Preface
12
hard to imagine these areas without the robust foundation of measurement. Neither science nor
engineering can be effective or practical without measurement (Fenton & Pfleeger, 1998, p. 10). Software
metrics are nothing new; they have been used more or less in the software industry since decades
ago. However, measurement programs in software engineering have been regarded as more of a
luxury than a requirement. This is peculiar since software products are commonly regarded as more
complex than other engineering products, which means that there is a significant need for control.
Metrics on software could also help team members in a software project to discover problems or
errors early in the development process, which allows for less expensive corrections than it would
have been later in the project life-cycle (Svahn & Österlund, 1997). The use of software metrics is an
attempt to tackle the problems the software engineering industry has struggled with for long
regarding failed projects and delays in project plans, including missed deadlines and project time
overruns (Svahn & Österlund, 1997).
Thus, software metrics are useful (and even necessary) tools if the software engineering industry is
to be considered a true engineering discipline. While practically all other engineering branches rely
on metrics and measurements to be scientifically accurate, the software industry as a whole does
not. What Lord Kelvin stated in 1891 is just as applicable in the software engineering industry now as
it was in the physics area back then:
“When you can measure what you are speaking about, and express it in numbers, you
know something about it; but when you cannot measure it, when you cannot express it
in numbers, your knowledge is a meager and unsatisfactory kind; it may be the
beginning of knowledge, but you have scarcely, in your thoughts, advanced to the
stage of science.” (Gaffney Jr, 1981)
Fenton and Pfleeger (1998, p. 11) summarize the necessity of measurement in the software
engineering industry:
“It is clear from other engineering disciplines that measurement can be effective, if not
essential, in making characteristics and relationships more visible, in assessing the
magnitude of problems, and in fashioning a solution to problems.”
This demand for measurements emerging from the software industry was one of the reasons why
Microsoft implemented a code metrics feature in their 2008 release of Visual Studio. Five code
metrics were introduced in this feature; maintainability index, cyclomatic complexity, class coupling,
depth of inheritance and lines of code. According to Conor Morrison (2007), these code metrics were
chosen based on papers from Microsoft Research1. In particular, the maintainability index and
cyclomatic complexity showed strong correlations to real defects found.
Microsoft was interested in finding out how relevant the chosen set of code metrics really were for
the industry. Thus, the authors gladly accepted the task. It consisted of two parts. The first part was
to evaluate the implemented code metrics, while the second part consisted of extending the existing
implementation with functionality that allows historical code metrics data for a given software
project to be saved.
1 The papers can be found at
http://research.microsoft.com/users/nachin/Research%20and%20Publications.htm

Chapter 1 – Preface
13
In this report you will be able to read about what the authors discovered and the final
implementation they have made. We would like to share a quote which captures the fundamental
nature of the report; a clear message to the software industry:
“If you can’t measure it, you can’t manage it.” (Gaffney Jr, 1981)
1.2 Target Groups The intended audience of this report is people with a technical background, e.g., having a Master of
Science degree or similar (or is underway taking one). The authors also assume that the reader has
some basic knowledge of computers, programming and software engineering. It is assumed that the
reader is familiar with most of the common notions in these areas. Even so, some of the perhaps
unfamiliar acronyms and terms are explained in Appendix A. It is not assumed that the reader is
familiar with concepts and terminology used in software quality assurance.
1.3 Purpose and Research Questions There are two purposes with this master thesis project; a scientific and a practical purpose.
1.3.1 Scientific Purpose As mentioned in the background chapter, Microsoft has implemented five code metrics in Visual
Studio 2008. The first vision was to investigate if this set of code metrics were complete. That is,
given a certain domain of the target audience for the metrics and delimitations on other inflicting
variables (such as size of project team, process model and programming language used), is there any
code metric missing? The domain was supposed to be typical Microsoft customers using Visual
Studio Team System and Team Foundation Server, and the target role was supposed to be the
project manager. If we were to conclude that the set of code metrics were not complete, we were
supposed to add the metric(s) that was/were missing to satisfy the completeness property.
This vision showed to be rather wide though. Even with assistance from our tutors, the purpose had
to be changed rather late in the project phase. Neither literature on aforementioned products nor
contacts at companies fitting the typical Microsoft customer were possible to bring forth in proper
time, due to some unfortunate circumstances. These two hindrances led to a severe reduction of the
scope since so much time already had been spent on learning the systems and performing literature
studies on metrics. In combination with the fact that it was not possible to produce a list of Microsoft
customers using these products in development it made such an empirical investigation impossible.
Thus, with regard to the calendar time left some changes to the scientific purpose were proposed.
Instead of figuring out if this set of metrics were complete, the authors got the task of evaluating the
relevance and usefulness of these existing code metrics for a software engineering project. This
purpose is further divided into the following research questions:
In what contexts are the code metrics in Visual Studio 2008 relevant and useful (if any)?
What are the usage areas for the code metrics implemented in Visual Studio 2008?
What are reasonable thresholds on the implemented code metrics in Visual Studio 2008?
How should one remedy poor values of the code metrics implemented in Visual Studio 2008?

Chapter 1 – Preface
14
Is historical code metrics data of any importance?
The last research question is tightly connected to the practical purpose of the project, which is
described next.
1.3.2 Practical Purpose Team Foundation Server (TFS) is a three-tiered architecture from Microsoft which provides data
collection, reporting, project tracking, source control and more for software development –
components that are useful when running a software engineering project. One of these components
is a data warehouse which stores all kinds of data regarding existing and previous software projects.
Chapter 5.1.1 describes TFS in more detail. The aforementioned software metrics that Microsoft
implemented in Visual Studio 2008 suffers from a weakness undermining their usefulness; the code
metrics generated by Visual Studio are just generated for local projects on client stations. Thus, it has
no connectivity whatsoever with the Team Foundation Server, which is the central “heart” when
developing software projects using the Team System suite from Microsoft.
If one were able to store the software metrics in the data warehouse, one could see trends and
quality changes by analyzing historical data. Thus, the practical purpose assigned to the authors was
to implement a proof of concept which shall show if and how it is possible to store historical metrics
data in the data warehouse on Team Foundation Server. This purpose can be pinned down to the
following tasks:
Create a client application which sends the generated metrics to the server.
Build a web service which handles communication between the client and the server.
Implement a device which stores the metrics data in the TFS data warehouse.
Design a report template which extracts the metrics data from the data warehouse and
presents it in a useful manner to, e.g., a project manager.
Originally, there was an additional task included in the scope of the practical purpose; to design a
dashboard for the project portal included in TFS. But the impediments described in chapter 1.3.1
made it impossible to fit this into the project.
1.4 Scope A measurement program can be utilized for different purposes and in several ways depending on
who the intended end user of the measurement outcome really is. A project manager will probably
use the metrics data to control the software project, while a developer is more likely to use the data
for improving his or her own code. Thus, depending on the goals of the measurement program,
metrics used may differ greatly.
With this in mind it is important to establish certain delimitations on the intended user and other
factors affecting the choice of code metrics. This is to avoid ambiguous results. However, a too
narrow scope will severely reduce the usefulness of the results.
The scope of the project has thus been limited to pertain to software project managers as target
audience of the measurement reports. This does not necessarily mean that the results are
inapplicable to other roles in a software engineering project, but no such guarantee is given.

Chapter 1 – Preface
15
Since the Visual Studio 2008 metrics feature the authors are supposed to evaluate only concerns
code metrics (i.e., measurements on source code), this master thesis will have its main focus on this
class of software metrics. This delimitation is necessary, since the area of software metrics is colossal
– it would not be possible to cover all classes of software metrics in the scope of a master thesis at
this level.
No delimitations on business sector, process model, project size or programming languages have
been made, but remarks on these factors are mentioned throughout the report. The scope could of
course have been narrowed down by restricting these four variables, but the authors decided not to
since one of the research questions was to discover which contexts the code metrics were useful and
relevant in.
Since the practical scope of the project was formulated as a proof of concept, some limitations on
the final product’s scope have been made. The purpose was to show if and how a practical solution
works. Thus, emphases have not been on security or performance issues (except the most
fundamental) but on development of a functioning solution.
1.5 Method The authors have studied scientific material during nine weeks to establish a theoretical foundation
about the topic to draw conclusions from. Besides published books on the topic of code metrics or
quality assurance, much of the literature has been collected from recognized and trustworthy
sources such as IEEE Xplore and NASA’s online resources. They have both served as excellent sources
to get hold on scientific articles on the subject of software metrics. Especially NASA’s resources have
proved rich of code metrics information. Some additional sources on the Internet have been used for
complementary reasons.
After the theoretical studies had been completed, the authors performed an empirical investigation
to see how well the theory matched the real world. This investigation consisted of interviewing
software project managers at five companies, where after the results were summarized. The
theoretical foundation and the empirical results were correlated and analyzed to find answers to the
research questions.
The practical implementation has been performed in parallel with the theoretical and empirical
research throughout the whole project. The authors divided the practical parts between themselves
(although the work inevitably crossed borders several times); Mr. Haag constructed the web service
and the server part of the solution, while Mr. Holm constructed the client and designed the code
metrics report template. Online resources were used to learn how the system was designed and
what was needed to implement. Documentation of the API to be used was very sparse, so a great
deal of the implemented artifacts has been developed according to a trial-and-error approach.
1.6 Criticism of the Method Much of the theoretical framework is based on reports and conference proceedings from the
software community. There are two main reasons why the theoretical foundation is based on more
reports than books if considering the amount of each category. First of all, books are widely accepted

Chapter 1 – Preface
16
and used in the industry, but scientific reports often go through more critical reviews, giving them a
slightly higher credibility. Secondly, the variation among the reports gave us a good opportunity to
gather different disparate perspectives from various authors and professionals. Even though all this is
good, the report may have benefitted from more published books as reference material.
Some of the published material referenced throughout the report is quite old, dating more than 20
years back in time. One could question if that kind of material still is valid; especially since we are
dealing with software engineering – an industry that is rapidly evolving. But most of the old material
is still reused in new material the authors have stumbled upon. This in combination with the fact that
it was hard to come by newly published resources which give independent general impressions on
software metrics forced the authors to rely on the old material to a wider extent than was originally
premeditated.
The objectives and purposes of this master thesis project have changed several times, even at late
phases in the process. This has had some serious impact on the end product. For example, the
authors were not able to do further delimitations on the scope of the project since the empirical
material would be too complicated to collect. To delimitate factors like business sector, company size
or project size has both pros and cons. However, due to circumstances we have not been able to
constrain any of these factors from the beginning. The authors believe that if these delimitations
would have been set from the start and kept until the end, the results may have been stronger, more
confident and unequivocal.
The trial-and-error approach used for implementing the product was educational in its character, but
very time-consuming. The lack of documentation (both online resources and published material)
though made it impossible to do it in another way.
1.7 Disposition This document is divided into seven chapters. An overview of the structure of the report is provided
here to the reader so relevant chapters can be found easily.
PART 0 – PROLOGUE
Chapter 1 – Preface introduces the background, the problem, the scope, the structure, and
the method used. You are reading this part now.
PART I – EVALUATION
Chapter 2 – Theoretical Framework consists of the theoretical foundation of code metrics. To
give the overall picture of code metrics, the chapter starts with a description of quality
models. It continues to describe software metrics and their properties.
Chapter 3 – Empirical Research summarizes the authors’ empirical investigation. First the
companies are described, followed by a summary of concluded answers from the performed
interviews.
Chapter 4 – Analysis contains the analysis made, where the authors have tried to correlate
the empirical data from chapter 3 with the theoretical foundation in chapter 2.

Chapter 1 – Preface
17
PART II – EXTENSION
Chapter 5 – Implementation describes the master thesis project’s practical part, i.e., the
actual implementation of the code metrics extension. First the overall architecture is
described followed by details for the server and client parts.
PART III – RESULTS
Chapter 6 – Conclusions contains the results and conclusions to be drawn from the analysis in
chapter 4.
Chapter 7 – Discussion contains some words about the relevance and correctness of the
results concluded in chapter 6. Things left unclear are also debated in this chapter. Finally,
some propositions on future work are presented.
PART IV – EPILOGUE
Appendices are found at the end of the report. Here the reader will find:
o Acronyms and Glossary,
o Interview questions,
o Source code for the implemented components, each part in its own appendix.
Annotated Bibliography lists all references used throughout the report.

PART I – EVALUATION
Chapter 2 – Theoretical Framework
I want to know God's thoughts;
the rest are details.
- Albert Einstein
(1879 - 1955)
Chapter 2 – Theoretical Framework
3
2 Theoretical Framework
This chapter will lay the theoretical foundation of code metrics and their usage areas. It is written
with a top-down approach starting with explaining the concept of quality attributes and some of the
most common quality models. Software metrics are introduced after that, giving a definition,
classification, purpose and use, requirements and finally limitations. The last part of this chapter deals
with code metrics by giving some examples and recommended thresholds.
2.1 Quality Attributes When a software product is developed, it is necessary to estimate the status of the ongoing project
to provide the project manager with sufficient information for control. To perform this estimation of
project status and health it is of greatest importance to select quality attributes (also known as
quality factors) relevant to the project, since it in terms of these attributes the health and status of
the project is described. These attributes are divided into two classes; internal and external
attributes.
Internal attributes can be measured by examining the product, process or resource on its own,
separate from its behavior. Thus, an internal attribute is not dependent on the context where the
artifact resides. The internal attributes are often available for measurement early in the project life
cycle. Many developers believe that the internal attributes affect the external quality attributes. So if
the internal attributes are good, many developers think it will be easier to reach good values for the
external attributes. (Fenton & Pfleeger, 1998)
External attributes are those that can only be measured with respect to how the product, process or
resource relates to its environment. It is the behavior of the artifact that is important rather than the
artifact itself. External attributes can almost only be measured when the product is nearly or fully
completed.
For example, if you measure code (an artifact) then internal attributes are (among others) size,
degree of reuse, modularity, coupling, functionality and algorithmic complexity. These attributes
remain static when the environment changes. External attributes might for example be reliability,
usability, maintainability, and so forth; attributes dependent on the context the artifact is executed.
To assert how attributes relate to each other and what effects they have on the properties of the
software, quality models are defined. This concept is described next.
2.2 Quality Models A quality model can be defined as “the set of characteristics and the relationships between them
which provide the basis for specifying quality requirements and evaluating quality” or as “a structured
set of properties required for an object of a class to meet defined purposes” (Buglione & Abran, 1999).

Chapter 2 – Theoretical Framework
4
A quality model is built up by quality factors. When a quality model is constructed the focus is on the
final product and to find the key quality attributes from the user’s perspective. These key attributes
are called quality factors. Quality factors are normally high-level external attributes.
A quality factor can be further decomposed to a lower level of attributes - attributes called quality
criteria. These criteria are often internal attributes. Quality criteria could be for example traceability,
completeness or modularity.
Quality criteria in turn are further decomposed into another level of attributes, called metrics.
Metrics are the lowest level of attributes and can be measured directly. Examples of quality metrics
are lines of code, faults found, code coverage and class coupling.
When a new software project is started, it is important to take into account different perspectives of
quality such as:
The managers’ view: Managers are not interested in a specific quality factor, rather in the
overall quality and need to balance the quality improvement with management criteria.
The users’ view: Users are often just interested to know if features satisfy their needs and
how complicated it is to handle the program. These quality factors are often external
attributes.
The Developers’ view: This category is interested in software quality that confirms the
functional and performance requirements. These quality factors are often internal
attributes.
Three well-known software quality models are McCall, Boehm and ISO/IEC 9126. They are quite
similar, but they use different terminology. Table 1 clarifies the relationship in terminology used.
Layer describes at which abstraction level the term describes quality; lower number means higher
abstraction.
Layer McCall Boehm ISO/IEC 9126
1 Factor High-level characteristic Characteristic
2 Criterion Primitive characteristic Subcharacteristic
3 Metric Metric Metric Table 1. Terminology used in McCall, Boehm and ISO/IEC 9126 quality models
The benefits of quality models are that developers can decompose attributes into several levels. This
makes it much easier to measure and draw conclusions from a software project. If a quality model is
well defined you should be able to predict, assure and verify the achievement of a defined goal
before, during and after production. (Buglione & Abran, 1999)
2.2.1 McCall’s Quality Model In 1977 Jim McCall developed one of the first published quality models. He attempted to link the gap
between users’ and developers’ quality needs by focusing on a number of software quality factors
that reflect both camps’ views. McCall’s quality model has, as shown in Figure 1, three major
perspectives for defining and identifying the quality of a software product:
Product operations (its operation characteristics)
Chapter 2 – Theoretical Framework
5
Product revision (ability to make changes without influencing the entire product)
Product transition (adaptability to new environments)
Quality of product operations depends on:
Usability (the ease of the software)
Integrity (the protection of the program from unauthorized access)
Efficiency (how well operations perform and storage efficiency)
Correctness (the extent to which a program fulfils its specification)
Reliability (the systems’ ability to not fail)
Product revision includes:
Maintainability (the effort required to locate and fix a fault in the program within its
operating environment)
Testability (the ease of testing the program, to ensure that it is error-free and meets its
specification)
Flexibility (the ease of making changes required by changes in the operating environment)
Product transition includes:
Reusability (the ease of reusing software in a different context)
Portability (the effort required to transfer a program from one environment to another)
Interoperability (the effort required to couple the system to another system)
The quality factors (in the middle of Figure 1) cannot be measured directly. The factors can only be
determined when the criteria have been measured. The criteria can be measured directly by using
metrics in order to quantify the quality in terms of the factors. McCall proposes a subjective grading
scheme ranging from 0 (low) to 10 (high). (Côté, Syrun, & Georgiadou, 2006)
A disadvantage with McCall’s quality model is that some of the factors and measurable properties
(e.g., traceability and self-documentation) are not really definable or even meaningful. According to
Marc-Alexis Côté et.al (2006) McCall’s model is not applicable with respect to the criteria outlined in
the IEEE Standard for a Software Quality Metrics Methodology for a top to bottom approach to
quality engineering.
Chapter 2 – Theoretical Framework
6
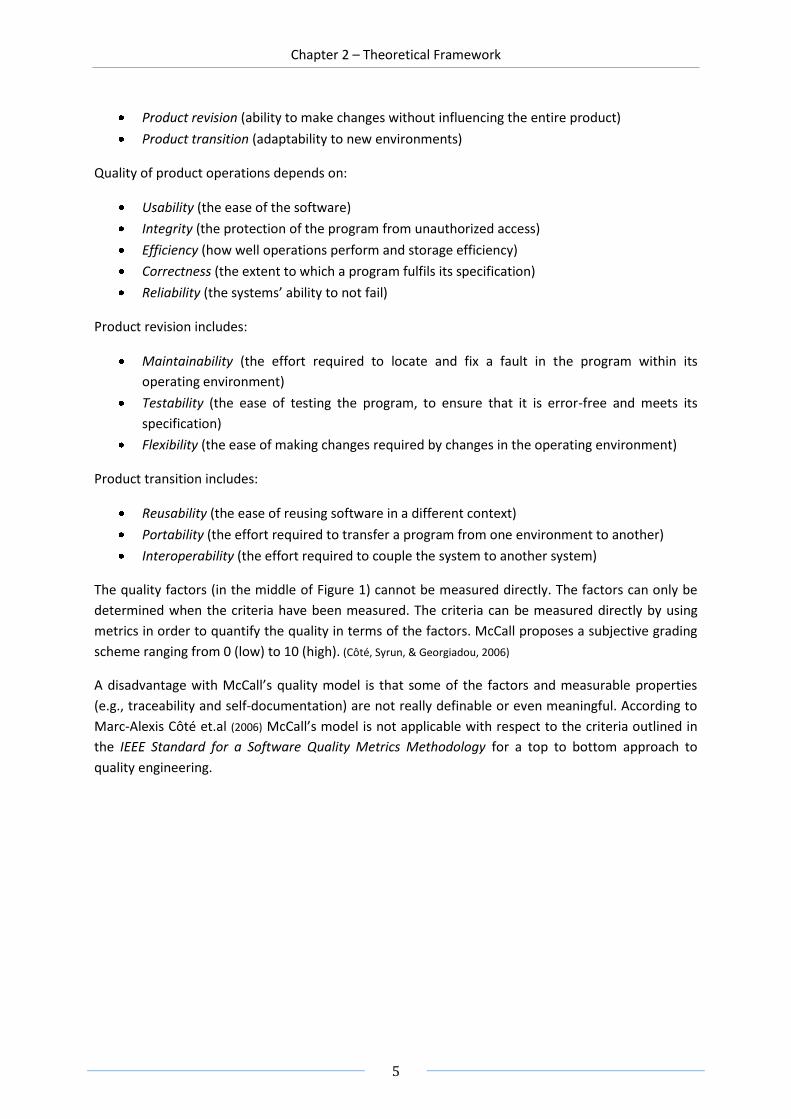
Figure 1. From (Fenton & Pfleeger, 1998). McCall's software quality model described by three levels of abstraction; Use, Factor and Criteria. Metrics are the tools needed to measure the Criteria.
Note in Figure 1 that the metrics serve as a foundation for the whole quality model.
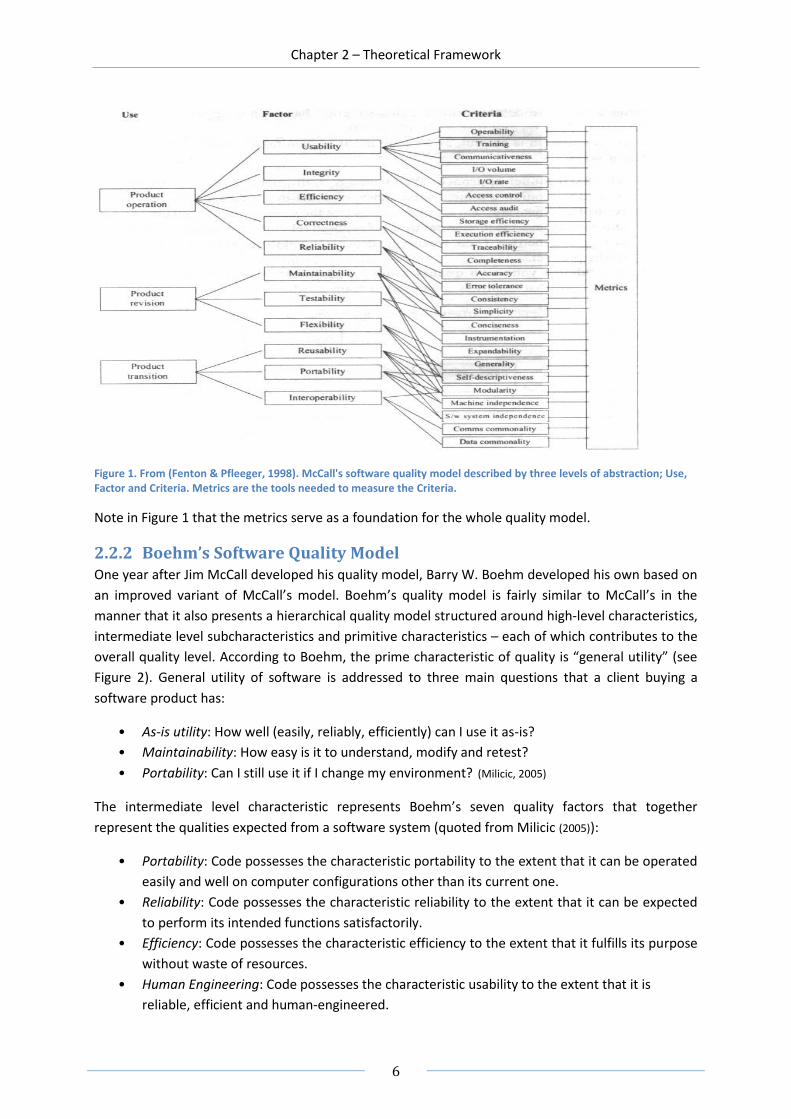
2.2.2 Boehm’s Software Quality Model One year after Jim McCall developed his quality model, Barry W. Boehm developed his own based on
an improved variant of McCall’s model. Boehm’s quality model is fairly similar to McCall’s in the
manner that it also presents a hierarchical quality model structured around high-level characteristics,
intermediate level subcharacteristics and primitive characteristics – each of which contributes to the
overall quality level. According to Boehm, the prime characteristic of quality is “general utility” (see
Figure 2). General utility of software is addressed to three main questions that a client buying a
software product has:
• As-is utility: How well (easily, reliably, efficiently) can I use it as-is?
• Maintainability: How easy is it to understand, modify and retest?
• Portability: Can I still use it if I change my environment? (Milicic, 2005)
The intermediate level characteristic represents Boehm’s seven quality factors that together
represent the qualities expected from a software system (quoted from Milicic (2005)):
• Portability: Code possesses the characteristic portability to the extent that it can be operated
easily and well on computer configurations other than its current one.
• Reliability: Code possesses the characteristic reliability to the extent that it can be expected
to perform its intended functions satisfactorily.
• Efficiency: Code possesses the characteristic efficiency to the extent that it fulfills its purpose
without waste of resources.
• Human Engineering: Code possesses the characteristic usability to the extent that it is
reliable, efficient and human-engineered.

Chapter 2 – Theoretical Framework
7
• Testability: Code possesses the characteristic testability to the extent that it facilitates the
establishment of verification criteria and supports evaluation of its performance.
• Understandability: Code possesses the characteristic understandability to the extent that its
purpose is clear to the inspector.
• Flexibility: Code possesses the characteristic modifiability to the extent that it facilitates the
incorporation of changes, once the nature of the desired change has been determined.
Figure 2. From (Côté, Syrun, & Georgiadou, 2006). Boehm's quality model.
Boehm’s and McCall’s models may appear to be very similar. The main difference between the two
models is that McCall’s model primarily focuses on measurement of the high-level characteristics
“As-is utility”, while Boehm’s quality model is based on a wider range of characteristics with an
extended and detailed focus on primarily maintainability.
One drawback with Boehm’s model is that it does not tell us how to measure characteristics such as
security, accuracy or interoperability. (Milicic, 2005)
2.2.3 ISO/IEC 9126 Quality Model The International Organization for Standardization (ISO) derived 1992 a standard for software quality
measurements based on McCall’s and Boehm’s software quality models. They called the software
quality model “Software Product Evaluation: Quality Characteristics and Guidelines for their use”
(Fenton & Pfleeger, 1998). This standard is known under the name ISO/IEC 9126. ISO/IEC 9126 has six
quality characteristics as Figure 3 depicts.

Chapter 2 – Theoretical Framework
8
Figure 3. From (Milicic, 2005).The ISO/IEC 9126 Quality Model. Six quality characteristics are the building blocks for this model.
ISO claims that these six quality factors are all-round, which means that they manage to describe any
component of software quality in terms of some aspect of one or more of the six factors. Basically it
is constructed in the same manner as the two previous models described, but ISO/IEC 9126 adds
functionality as a parameter. Table 2 gives a short description of each quality characteristic that is
used in the ISO/ICE 9126 quality model. (Milicic, 2005)
Quality characteristic Description
Functionality Are the required functions available in the software?
Reliability How reliable is the software?
Efficiency How efficient is the software?
Usability Is the software easy to use?
Maintainability How easy is to modify the software?
Portability How easy is to transfer the software to another environment? Table 2. Description of each quality characteristic in ISO/IEC 9126.
Some serious teething troubles were reported with ISO/ICE 9126. The quality model has been
updated four times. The updates have included an improved quality model, definition of external and
internal measures and definition of quality in use measures (by “quality in use” ISO refers to the
user's view of the quality of the software product when it is used in a specific environment and
context) (Côté, Syrun, & Georgiadou, 2006).
Now, as the reader hopefully has obtained at least a basic understanding of quality models, let
us move on to the foundation of all quality models; software metrics.
2.3 Software Metrics Fenton & Pfleeger (1998, p. 10) mentions four areas were software organizations often fail:

Chapter 2 – Theoretical Framework
9
Measurable targets for software products are not set correctly. A common mistake is to
promise a property of a product without objectively and clearly stating what the terms mean.
This has the ramification that when the project is completed, the company cannot tell
whether they have met their goals with the product or not.
No quantification or prediction of the quality of the products produced is made. This means
that the end user of the product is not able to establish an opinion about any property (e.g.,
the reliability of the product or how much work will be needed when porting the product
from one environment to another).
Software project component costs are not understood or quantified. Companies are unable
to differentiate costs associated with design from, e.g., coding or testing. A company cannot
control its costs if it is not able to pin down where the costs are emerging from.
Anecdotal evidence plays a too big role when deciding what development technology to use.
Companies simply rely on anecdotal evidence too much without having any real scientific
basis on how effective these technologies really are. Trusting these kinds of ‘success stories’
without any scientific foundation to back it up might prove to be a big mistake.
Software metrics which are scientifically correct and used in a correct manner tries to remedy these
four shortcomings.
Regardless of which quality model used, they all rely on software metrics to establish the quality
attributes of a software product. Software metrics are in other words the core foundation for the
quality attributes and – in fact – the whole quality model. It is the software metrics that are the
building blocks the models rely on to being accurate and meaningful. Since software metrics are such
a fundamental part of establishing the quality of a software product, it is important that there exists
a common notion of what they are and how they are defined. This is not the case in the industry
today. Almost every other company, author or organization has specified their own software metrics
in their own way, not giving room for standardization.
2.3.1 Definition of Software Metrics IEEE defines in their Standard Glossary of Software Engineering Terminology (1990) a (software)
quality metric as:
(1) A quantitative measure of the degree to which a system, component, or process
possesses a given attribute”, and
(2) A function whose inputs are software data and whose output is a single numerical
value that can be interpreted as the degree to which the software possesses a given
quality attribute”.
The first one refers to the outcome of a process that produces quality metrics, while the second
definition refers to the process itself (IEEE Standards Board, 1990).
Fenton & Pfleeger (1998) takes the approach to first define the concept of measurement and then
define what a measure is. Measurement is defined according to them as “a mapping from the
empirical world to the formal, relational world”. A measure is then defined as “the number or symbol
assigned to an entity by this mapping in order to characterize an attribute” (Fenton & Pfleeger, 1998, p.

Chapter 2 – Theoretical Framework
10
28). Furthermore, they state that it is important to identify the entities and attributes that should be
measured. Three classes are identified for this in software:
Processes
Products
Resources
Each of these classes is then further divided into either internal or external attributes, as discussed
earlier. (Fenton & Pfleeger, 1998, p. 74)
In an Association for Computing Machinery (ACM) paper from 1981, J.E Gaffney Jr. defines software
metric as “…an objective, mathematical measure of software that is sensitive to differences in
software characteristics. It provides a quantitative measure of an attribute which the body of
software exhibits.” (Gaffney Jr, 1981)
Robert B. Grady at Hewlett-Packard states in a paper that software metrics “… measure specific
attributes of a software product or a software-development process. In other words, they are
measurement of success.” (Grady, 1994)
Two vague definitions of software metrics are found in an ACM paper from D.C Ince and from Ian
Fleming on his website www.sqa.net, respectively: “Software metrics are an attempt to quantify
some aspect of a product generated during a software project.” (Ince, 1990) and “a measure of some
property of a piece of software or its specifications.” (Fleming). Fleming also mentions on his website
that software metrics (as applied to a software product) measures (or quantifies) characteristics of
the software.
NASA has a rigorous metrics program where they define (software) metrics as “…measurements of
software attribute.” (Fisher, NASA IV&V MDP - Glossary and Definitions, 2007). NASA does not explicitly define
what they regard as software attributes, but the metrics used by the organization are well-defined in
the documentation.
As the reader hopefully sees in the definitions mentioned above, software metrics can be defined in
several ways. However, they all boil down to one single definition that the authors of this paper will
use throughout the rest of the thesis:
There are some things to note in our definition of software metrics mentioned above. Two concepts
have to be explained and defined – namely artifact and attribute:
An artifact is a measurable part of a software engineering project (e.g., the requirement
specification, a source code document, a class, a method, a use case, a milestone, a team
A software metric is a direct or indirect
measurement, a quantification of an
attribute that an artifact in a software
project possesses.

Chapter 2 – Theoretical Framework
11
member, the project plan, and so forth). The artifact can be both tangible as well as
intangible.
A (quality) attribute is a criterion that determines a software quality factor (e.g., accuracy,
readability, operability consistency, simplicity, expandability, modularity and traceability).
An example is in place to illustrate the concepts. Take a look at Figure 4 and consider the quality
factor maintainability. Maintainability can be described by three attributes (criteria): Correctability,
testability and expandability, where:
Correctability is quantified by using the metrics fault counts and effort.
Testability is quantified by using the metrics degree of testing and effort.
Expandability is quantified by using the metrics change counts and effort.
Figure 4 below depicts this relationship.
The fault counts metric can be measured by closure time, isolate/fix time or fault rate. Degree of
testing can be measured by statement coverage, branch coverage or test plan completeness. Change
counts can be measured by change effort, change size, or change rate. Effort can be measured by
resource prediction or effort expenditure. In this example fault counts, degree of testing, change
counts and effort are software metrics (actually, they are composite software metrics composed of
several other metrics, as shown in Figure 4).
2.3.2 Classification of Software Metrics As mentioned earlier, Fenton and Pfleeger (1998, p. 74) classify software metrics into three categories
(or classes):
Figure 4. After (Fenton & Pfleeger, 1998). Decomposition of maintainability. Metrics are used to quantify criteria, which in turn is used to establish a fact about a quality factor.
Maintainability
Correctability
Testability
Expandability
Fault counts
Degree of testing
Effort
Change counts
Factor Criteria (Composite) Metric
Closure time
Isolate/fix time
Fault rate
Statement coverage
Branch coverage
Test plan completeness
Resource prediction
Effort expenditure
Change effort
Change size
Change rate
(Simple) Metric
Chapter 2 – Theoretical Framework
12
Processes – collections of software-related activities.
Products – any deliverables or documents that result from a process activity.
Resources – entities required by a process activity.
In an IEEE article Liu and Viswanathan (1999) categorize software metrics and attributes into three
broad categories, namely metrics relating to:
The organization,
The processes, and
The products
Liu and Viswanathan continue to describe the organization class of metrics as a hierarchy. One
thread in the hierarchy deals with projects, and delves down to phases and tasks (which in turn
includes resources). Liu and Viswanathan write in their paper that this thread tracks the metrics that
are related to the processes that create the products (Liu & Viswanathan, 1999). Hence, Fenton and
Pfleeger’s and Liu and Viswanathan’s classification of software metrics resemble each other.
The Software Assurance Technology Center (SATC) which is a part of the Systems Reliability and
Safety Office at NASA Goddard Space Flight Center has been collecting code metrics data for over
seven years, for seven programming languages. They have divided code metrics (i.e., metrics just
pertaining to code – not any other software artifacts like documentation) into two main categories,
object oriented code metrics and non object oriented code metrics. (NASA SATC, 2002)
Furthermore, the NASA Metrics Data Program (MDP) has a wider classification of code metrics. MDP
uses the object oriented contra non object-oriented classification too but adds additional categories:
requirement metrics, error metrics, Halstead metrics, complexity metrics and a “leftover” category
called miscellaneous metrics. (NASA IV&V, 2007)
Galin uses another approach when categorizing software quality metrics; a two-level system. The
first category distinguishes between the life cycle and other phases of the software system. This
category includes two classes, process metrics (related to the software development process) and
product metrics (related to software maintenance). The second category refers to the subjects of the
measurement: Quality, Timetable, Effectiveness (of error removal and maintenance services) and
Productivity (Galin, 2004).
When correlating against other authors, Galin’s categorization of metrics does not really include code
metrics as defined by others. Rather, they are more in the line of process, resources or functional
metrics. Galin’s notion of product metrics just refer to the system’s operational phase – it does not
refer to the development phase at all (Galin, 2004). Galin states though in his book that “Software
quality metrics can fall into a number of categories” (Galin, 2004, p. 415). His classification is not an
absolute truth; it is one classification among many.
Thus, no classification of code metrics is universal. Still, we have to define a classification to justify
exactly what kind of software metrics this master thesis will take into account. Considering the
theoretical findings, most of them seem to converge to the definition given by Fenton and Pfleeger in
one way or another. There are no significant differences in how people in the industry choose to
classify the software metrics except of course minor alterations in the terminology used. The authors
Chapter 2 – Theoretical Framework
13
of this paper agree upon the following classification of software metrics, and thus will use it
throughout the thesis:
Process metrics – metrics used to measure processes.
Product metrics – metrics used to measure tangible products.
o Code metrics – a subcategory pertaining source code only (including test cases).
Object oriented metrics
Non-object-oriented metrics
Complexity metrics
Quantitative metrics
Halstead metrics
o Functional metrics – a subcategory pertaining tangible products not being code.
Requirement metrics
Resource metrics – metrics to measure human resources, time, capital, and other resources
in the organization.
The mission assigned from Microsoft involves evaluation of code metrics only. Therefore the authors
will concentrate solely on code metrics, which is classified under the Product metrics class above.
One thing to note is that there certainly exist more subcategories you might divide functional
metrics, resource metrics and process metrics into. But since these metric types are out of the scope
of this master thesis, no attempts to further subcategorize these categories have been made. The
following subchapters are presented at the level of software metrics, including code metrics.
2.3.3 Purpose and Use of Software Metrics Fenton and Pfleeger state that software metrics are important for three main categories:
understanding, control and improvement. (Fenton & Pfleeger, 1998, p. 13)
When you measure the activities performed and artifacts produced in a project, you get an
understanding of what is happening during development and maintenance. The metrics visualize the
attributes of the project’s artifacts, which in turn leads to a better understanding of relationships
between artifacts and their mutual effects. (Fenton & Pfleeger, 1998, p. 13)
Control is provided by software metrics in the sense that they form a baseline of facts to predict
possible outcomes, which helps the project team to make decisions so project goals can be achieved.
For example, if a module is measured to exhibit high complexity (of some kind) then resources can be
focused on testing that specific module. (Fenton & Pfleeger, 1998, p. 13)
Finally, software metrics also encourages improvement of processes and products (as an example
Fenton and Pfleeger mention that you may increase the number or type of design reviews based on
measures of specification quality and predictions of likely design quality. This would imply a change
of the process the project is using under development). (Fenton & Pfleeger, 1998, p. 13)
There are many questions that can be answered by using software metrics according to Fenton and
Pfleeger (1998, pp. 12-13). For example, managers can find answers to questions like:
What does each process cost?
How productive is the staff?
Chapter 2 – Theoretical Framework
14
How good is the code being developed?
Will the user be satisfied with the product?
How can we improve?
Engineers can find answers to questions like:
Are the requirements testable?
Have we found all the faults?
Have we met our product or process goals?
What will happen in the future?
A simple purpose of software metrics is given by Li and Cheung. They state that software metrics are
computed for the purpose of evaluating certain characteristics of the software developed. (Li & Cheung,
1987)
Galin supports the view of Fenton and Pfleeger in that software metrics serve to assist management
in three basic areas; control of software development projects and software maintenance, support of
decision taking, and initiation of corrective actions (Galin, 2004). They all relate exactly to Fenton and
Pfleeger’s three main categories: control, understanding and improvement respectively.
Galin (2004, p. 414) writes about two main objectives of quality measurement. These objectives are:
1. “To facilitate management control as well as planning and execution of the appropriate
managerial interventions.”
2. “To identify situations that require or enable development or maintenance process
improvement in the form of preventive or corrective actions introduced throughout the
organization.”
The first objective is achieved based on metrics regarding deviations of actual functional (quality)
performance from planned performance and deviation of actual timetable and budget performance
from planned performance. The second objective is achieved based on accumulation of metrics
information regarding the performance of teams, units, and the like. (Galin, 2004, p. 414)
Gaffney Jr. (1981) writes in his article Metrics In Software Quality Assurance that software metrics are
of interest for several reasons. One is that metrics on the product can be transformed to indicators
(quality factors) of interest to the management, developers and even users (correlates to Fenton and
Pfleeger’s category Understanding mentioned above). Another reason mentioned is that the
software metrics might suggest modification to the software development process. This correlates to
Fenton and Pfleeger’s category of Improvement.
DeToma and Perry (1994) give a short but satisfying description of what the ultimate purpose of
software metrics is: “Software metrics are used to obtain data to support the software goals for the
project, for the divisions and, ultimately, the business goals of the corporation.” Furthermore they
explain that metrics data is collected during a project’s life cycle to track status and progress. The
data collected is used to avoid problems by comparing with the estimates made for the project
(DeToma & Perry, 1994). They also state the goal of software metrics at the project level is “…to
provide data to management for controlling software development” (DeToma & Perry, 1994).
Chapter 2 – Theoretical Framework
15
Gaffney Jr. also mentions the relationship between quality factors and software metrics. He writes
that quality is concerned partially with meeting the user’s needs, but it is also concerned with the
“goodness” of the implementation. The “goodness” should be quantifiable, and the software metrics
serve as the tool as which to assign values to the criteria that determine this “goodness”.
Furthermore, the software metrics should relate to software quality factors of interest. (Gaffney Jr,
1981)
You could summarize all above to contain essentially four things as the purposes of software metrics:
Provide understanding,
Give control over the software engineering project,
Encourages improvement of project processes,
Provide means to see if goals have been met or not.
Tom DeMarco’s rule really says it all when finding out why should use software metrics:
“You cannot control what you cannot measure.” (DeMarco, 1982)
2.3.4 Requirements on Software Metrics Software metrics must qualify on some requirements to be useful. According to Fleming, software
metrics have to be measurable (you have to be able to assign the metric a value) and be related to
one or several quality factors (Fleming). If you cannot assign a value to the metric, it is not a measure
at all. If you are not able to relate the software metric to one or several quality factors, then there is
no need for that metric (i.e., it is not relevant). Every measurement must be motivated by a
particular goal or need that is both clearly defined and easily understandable. (Fenton & Pfleeger, 1998)
To be able to aid management in decision making, the information the software metrics provide
should also indicate its quality, generality and timeliness. Without the assurance of these three
properties, it is difficult for the management to assess the relevance of the metric data provided. (Hufton, 1994)
Galin (2004) suggests that five general requirements and three operative requirements have to be
satisfied on a software metric for it to be applicable and successful (Galin, 2004, p. 415). As for the
general requirements, software metrics should be:
Relevant
Valid
Reliable
Comprehensive
Mutually exclusive
Relevant means that the metric must be related to an attribute of substantial importance (i.e., a
relevant criterion to measure). Valid implies that the metric actually measures the required attribute
(criterion). Reliable means that the metric must not produce different results when applied under
similar conditions. Comprehensive states that the metric is applicable to a large variety of
implementations and situations (synonymous with general). Finally, mutually exclusive implies that
the metric does not measure attributes already measured by other metrics. (Galin, 2004, p. 415)

Chapter 2 – Theoretical Framework
16
For the operative requirements Galin (2004, p. 415) mentions these three:
Easy and simple
Does not require independent data collection
Immune to biased interventions by interested parties
Easy and simple means that the collection of metrics data should be performed with minimal
resources and the implementation should be simple. It is interesting that Fenton and Pfleeger (1998, p.
536) also mentions that a too complex metric may not be useful; if the metric is constructed by too
many individual parts it will be hard to know how to redesign the module to remedy a critical value.
Even more, when you introduce a measurement program at a company it is of greatest importance
to keep the metrics uncomplicated and easy to understand. If this is not adhered to, the metrics will
probably be more of a burden than help (Fenton & Pfleeger, 1998, p. 12). Does not require independent
data collection implies that the metrics collected should be integrated with other project data
collection systems (e.g., wages, cost accounting, employee attendance etc.). The reason, besides
being an efficient way of gathering metrics, is that it contributes to coordination of all information
systems serving the organization (Galin, 2004, p. 415). The final requirement, Immune to biased
interventions by interested parties, states that there should be no escape from the expected results
of the analysis of the metrics. Interested persons are expected to alter the data to improve their
record or visualize a biased picture of the reality. This requirement tries to stop this kind of behavior.
It is achieved mainly by choice of metrics and adequate procedures (Galin, 2004, p. 415).
In their master thesis, Fredrik Svahn & Magnus Österlund (1997) list 14 requirements that ideal
software metrics should preferably comply with. These ideal metrics should:
Be well defined
Be easy to calculate
Be easy to understand
Be easy to analyze
Be predictable
Be acceptable from a measurement theoretical point of view
Be objective
Be robust
Be able to be affected
Suggest a (quality) goal
Be a natural result from the development process
Provide historical data
Be supported by tools
Follow (eventual) existing standards
Another master thesis on the subject of software metrics by Eric Fugleseth states that metrics must
be well defined, practical, easy to use and accepted. They should also reflect the need of the customer
and concentrate on the important issues and those issues in need of improvement. (Fugleseth, 1992)
Metrics should not be used to measure and evaluate individual performance (Fugleseth, 1992). One
problem associated when measuring individual performance is that people may become suspicious
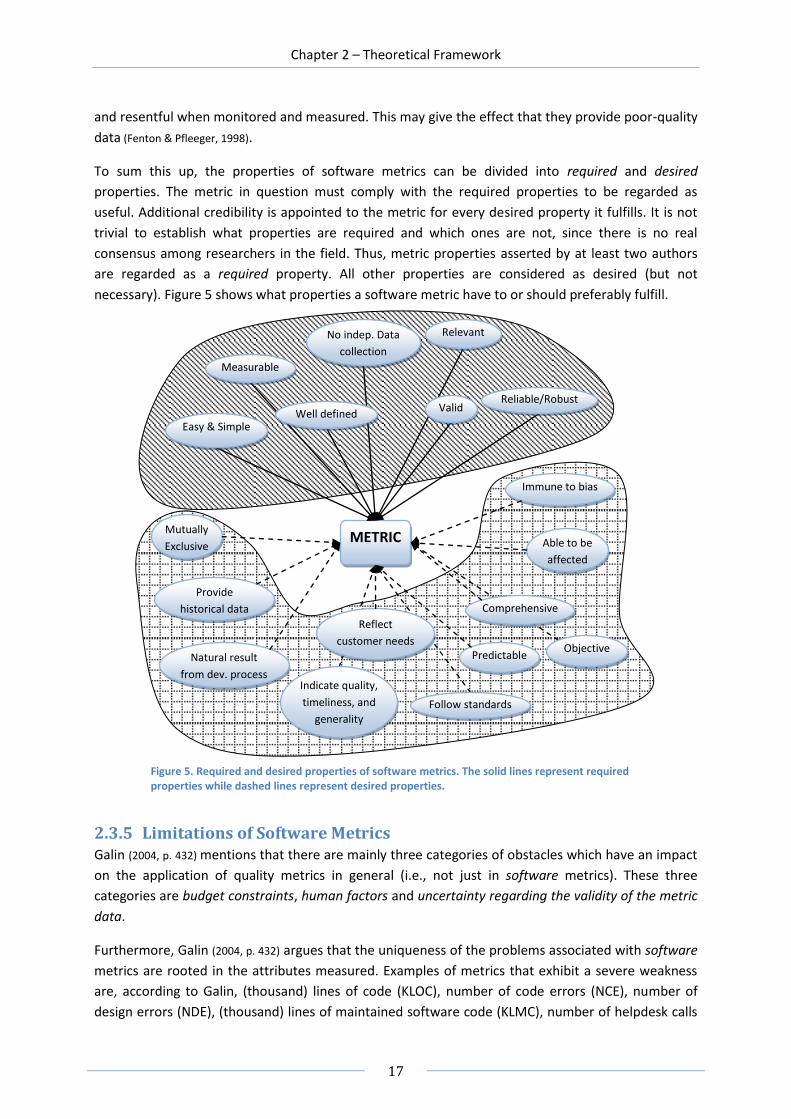
Chapter 2 – Theoretical Framework
17
and resentful when monitored and measured. This may give the effect that they provide poor-quality
data (Fenton & Pfleeger, 1998).
To sum this up, the properties of software metrics can be divided into required and desired
properties. The metric in question must comply with the required properties to be regarded as
useful. Additional credibility is appointed to the metric for every desired property it fulfills. It is not
trivial to establish what properties are required and which ones are not, since there is no real
consensus among researchers in the field. Thus, metric properties asserted by at least two authors
are regarded as a required property. All other properties are considered as desired (but not
necessary). Figure 5 shows what properties a software metric have to or should preferably fulfill.
2.3.5 Limitations of Software Metrics Galin (2004, p. 432) mentions that there are mainly three categories of obstacles which have an impact
on the application of quality metrics in general (i.e., not just in software metrics). These three
categories are budget constraints, human factors and uncertainty regarding the validity of the metric
data.
Furthermore, Galin (2004, p. 432) argues that the uniqueness of the problems associated with software
metrics are rooted in the attributes measured. Examples of metrics that exhibit a severe weakness
are, according to Galin, (thousand) lines of code (KLOC), number of code errors (NCE), number of
design errors (NDE), (thousand) lines of maintained software code (KLMC), number of helpdesk calls
Figure 5. Required and desired properties of software metrics. The solid lines represent required properties while dashed lines represent desired properties.
METRIC
Measurable
Relevant
Valid
No indep. Data
collection
Easy & Simple Well defined
Reliable/Robust
Indicate quality,
timeliness, and
generality
Able to be
affected
Reflect
customer needs
Follow standards
Provide
historical data Comprehensive
Natural result
from dev. process
Objective Predictable
Immune to bias
Mutually
Exclusive

Chapter 2 – Theoretical Framework
18
during a year of service (NHYC), and number of software failures detected during a year of
maintenance service (NYF).
For example, KLOC is affected by programming style where different styles may double the produced
code. How comments are used inside code also affects the KLOC metric severely. There are though
methods to adjust to this, for example by only calculating lines of code excluding all comments. The
complexity of the software affects both KLOC and NCE. NDE and NCE are both affected by how much
of the code that is reused. High values of reused code increases the volume of code produced per
day and lowers the number of defects detected in reviews, testing, etc. Another factor that affects
NCE and NDE heavily is the reporting style. Some teams produce small, concise reports that present
findings in a small number of items while other teams present a more elaborate report (and thus
increase the NCE and NDE drastically). (Galin, 2004, pp. 432-433)
KLMC is affected by programming style and volume of documentation comments in the code.
Wasteful coding and documentation may increase the value of KLMC remarkably. The percentage of
reused code affects NYF. The more reused code, the lower number of defects detected in regular use
as well as less corrective maintenance efforts required. Software complexity also affects NYC in the
way that more complex modules require more maintenance resources per line of code than simple
modules. This in conjunction with that complex modules suffer from more undetected defects during
development leads to a higher value of NYF. (Galin, 2004, pp. 432-433)
These factors distort the software product metrics on which they are based, according to Galin. The
result is that a large portion of software metrics does not reflect real productivity and quality
achievement of development or maintenance teams in a majority of situations. Galin suggests that
more research has to be done to find metrics that do not suffer from low validity and limited
comprehensiveness. The function point method, which is a way of quantifying how much
functionality an application provides, is mentioned as “a successful methodological development
aimed at replacing the problematic KLOC metric”. (Galin, 2004, p. 434)
In the article Software metrics: Good, bad, and missing, Capers Jones (1994) mentions some metrics
that do not work. He writes that lines of code (LOC), Halstead metrics and cost-per-defect metrics are
invalid under various conditions. LOC and Halstead metrics are invalid when used to compare
productivity or quality data across different programming languages (Jones, 1994). Especially the LOC
code metric penalizes high-level- and object-oriented programming languages as well as program
generators. Jones even goes so far as to say that “The widely used LOC metrics is one of the most
imprecise metrics ever used in scientific or engineering writing” (Jones, 1994) . Svahn and Österlund
(1997) came to the same conclusion regarding LOC; it is not a good metric to use by itself. There are
more problems with Halstead metrics that should be mentioned. There is no consensus on the
meaning of attributes such as difficulty, volume or program level (which all are parts of the Halstead
metrics). Halstead does not give any real indication of what relationships that exist among different
components of his theory (Fenton & Pfleeger, 1998). The cost-per-defect metric requires a careful
separation of variable and fixed costs to give valid information (Jones, 1994) .
As for metrics that do actually work, Jones mentions complexity metrics and function points.
Complexity metrics work according to Jones based on his own and his company’s experiences during
a period of 15 years. High complexity values have been correlated to lower than average quality and
Chapter 2 – Theoretical Framework
19
higher than average maintenance expenses. The main reason function point metrics work, according
to Jones, is that the function point total for an application does not change with the programming
language used. (Jones, 1994)
However, one should keep in mind that there are some problems with the function point metrics.
Fenton and Pfleeger (1998, pp. 262-265) mention eleven problems. These are
Problems with subjectivity in the technology factor
Problems with double-counting
Problems with counter-intuitive values
Problems with accuracy
Problems with early life-cycle use
Problems with changing requirements
Problems with differentiating specified items
Problems with technology dependence
Problems with application domain
Problems with subjective weighting
Problems with measurement theory
Function point metrics will not be discussed further in this thesis report. For a more detailed
description of the metrics and its problems, the reader may refer to Fenton and Pfleeger (1998).
2.4 Code Metrics As the reader has seen in chapter 2.3.2, the code metrics class is a subclass of software metrics. Code
metrics are concerned with the measurements of software products – more precisely source code.
This subchapter will describe the code metrics that exist in Visual Studio 2008 and how they relate to
the literature. Some other code metrics of importance are also discussed. The subchapter ends with
recommended thresholds for the five code metrics under investigation.
2.4.1 Existing Code Metrics The various code metrics are defined differently depending on whom you ask. Far from all code
metrics have a universally agreed definition. Therefore it is very important that whenever you talk
about a code metric, you have to explicitly define what it is. Not even such a simple code metric as
lines of code is universally defined. There are all kinds of variations on this metric. You could for
example include or exclude comments or white spaces (lines). Furthermore, you have to define if you
are counting a statement which is spread among several lines as just one line or multiple lines.
Fenton and Pfleeger (1998, p. 245) describe measurements of software size with three attributes:
Length
Functionality
Complexity
They do not mention any code metrics for measuring functionality or complexity, although the reader
should note that there are software metrics that can be used to measure these attributes (for
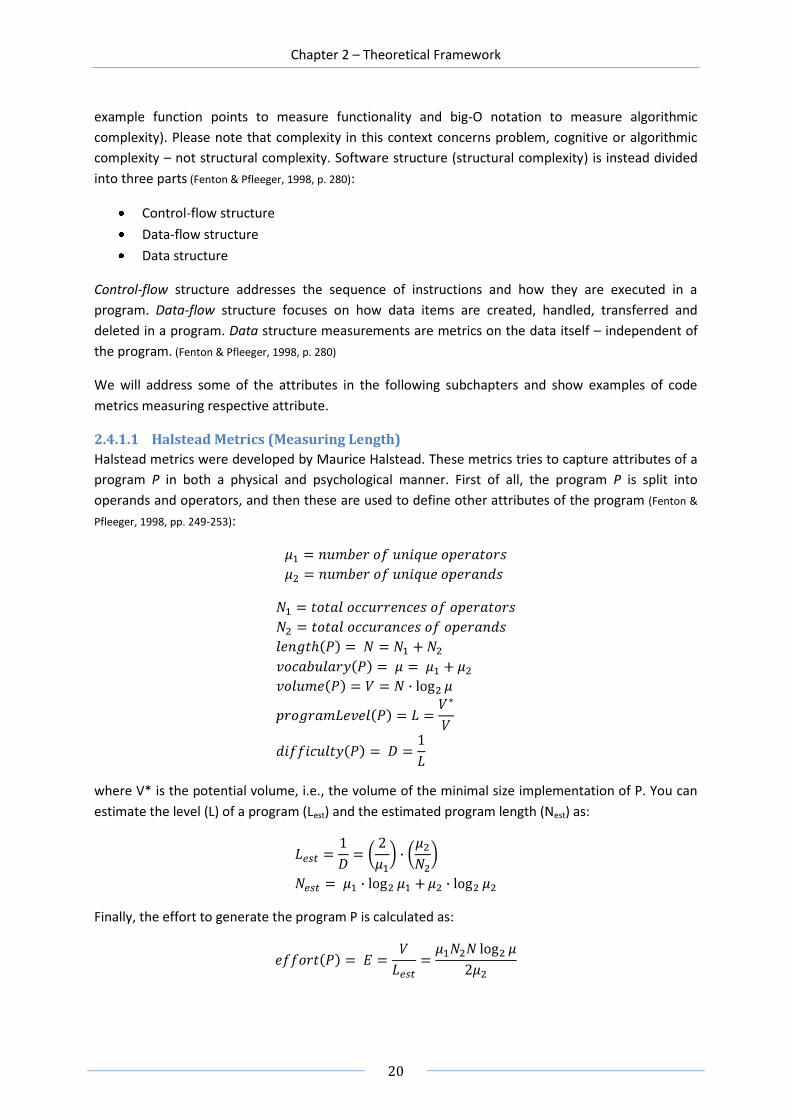
Chapter 2 – Theoretical Framework
20
example function points to measure functionality and big-O notation to measure algorithmic
complexity). Please note that complexity in this context concerns problem, cognitive or algorithmic
complexity – not structural complexity. Software structure (structural complexity) is instead divided
into three parts (Fenton & Pfleeger, 1998, p. 280):
Control-flow structure
Data-flow structure
Data structure
Control-flow structure addresses the sequence of instructions and how they are executed in a
program. Data-flow structure focuses on how data items are created, handled, transferred and
deleted in a program. Data structure measurements are metrics on the data itself – independent of
the program. (Fenton & Pfleeger, 1998, p. 280)
We will address some of the attributes in the following subchapters and show examples of code
metrics measuring respective attribute.
2.4.1.1 Halstead Metrics (Measuring Length)
Halstead metrics were developed by Maurice Halstead. These metrics tries to capture attributes of a
program P in both a physical and psychological manner. First of all, the program P is split into
operands and operators, and then these are used to define other attributes of the program (Fenton &
Pfleeger, 1998, pp. 249-253):
where V* is the potential volume, i.e., the volume of the minimal size implementation of P. You can
estimate the level (L) of a program (Lest) and the estimated program length (Nest) as:
Finally, the effort to generate the program P is calculated as:

Chapter 2 – Theoretical Framework
21
The unit of the effort needed to understand the program P is called “elementary mental
discriminations”. A psychologist named John Stroud claimed that a human mind is capable of
between 5 and 20 elementary mental discriminations per second. Halstead claimed that the actual
number of this is 18. Hence, the programming time required to develop a program P of effort E is
seconds according to Halstead. (Fenton & Pfleeger, 1998)
The maintainability index implemented in the code metrics feature in Visual Studio 2008 is partially
based on the Halstead volume V and will be discussed next. (Morrison, 2007)
2.4.1.2 Maintainability Index
The maintainability index is based (among others) on the Halstead volume, cyclomatic complexity
and lines of code. It is supposed to give an indication on how complex a code artifact is, and how
difficult it is to maintain.
According to Conor Morrison, senior programmer for Code Analysis Team System Developer Team
(i.e., the team that created the code metric feature in Visual Studio 2008), the maintainability index
(MI) is calculated as:
where
aveV = average Halstead volume V per module,
ave(g’) = average extended cyclomatic complexity per module,
aveLOC = the average count of lines of code (LOC) per module. (Morrison, 2007)
This formula was developed by a joint effort involving organizations such as the Software Engineering
Test Laboratory of the University of Idaho, the Idaho National Engineering Laboratory, Hewlett-
Packard and others. The coefficients are derived from actual usage at Hewlett-Packard. This metric
also classifies the index values into three categories; High, Moderate and Low maintainability. These
categories and their respective intervals are depicted in Table 3. Note that Microsoft has not adopted
the interval boundaries determined by the research results at Hewlett-Packard. (VanDoren, Software
Technolog Roadmap - Maintainability Index Technique for Measuring Program Maintainability, 2007; Liso, 2001)
Visual Studio Icon Level Range (Microsoft) Range (HP)
(green) High Maintainability 20 ≤ MI ≤ 100 85 < MI ≤ 100
(yellow) Moderate Maintainability 10 ≤ MI ≤ 19 65 ≤ MI ≤ 85
(red) Low Maintainability 0 ≤ MI ≤ 9 MI < 65
Table 3. Classification and thresholds for maintainability index used by Microsoft.
2.4.1.3 Tree Impurity (Measuring Data/Information Flow)
A good example of a metric to measure data flow is tree impurity, which is a measure of how much a
dependency graph of a program deviates from being a pure tree. The nodes in the graph represent
modules (at an abstraction layer of choice), and the edges (arcs) represent data flow. The more a
system deviates from being a pure tree structure towards being a graph structure, the worse the
design is. Apparently this metric is one of few design metrics that also has been validated on a real
project. (Fenton & Pfleeger, 1998, pp. 305-308)
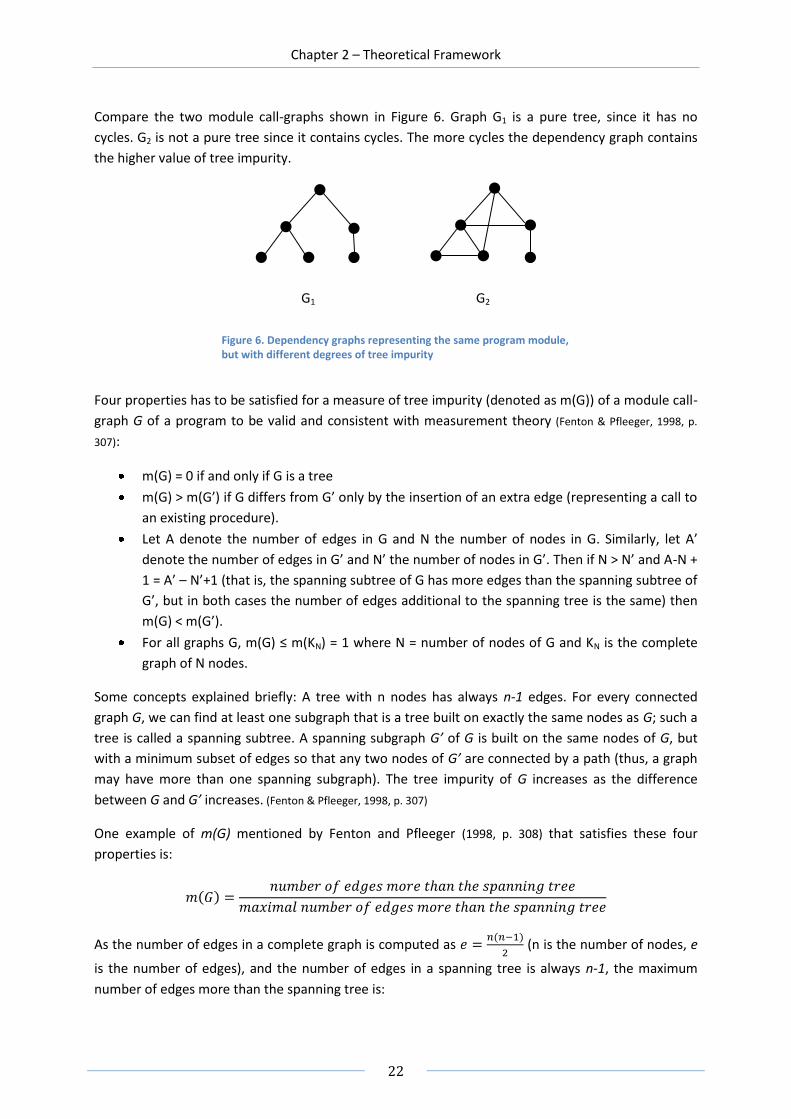
Chapter 2 – Theoretical Framework
22
Compare the two module call-graphs shown in Figure 6. Graph G1 is a pure tree, since it has no
cycles. G2 is not a pure tree since it contains cycles. The more cycles the dependency graph contains
the higher value of tree impurity.
Four properties has to be satisfied for a measure of tree impurity (denoted as m(G)) of a module call-
graph G of a program to be valid and consistent with measurement theory (Fenton & Pfleeger, 1998, p.
307):
m(G) = 0 if and only if G is a tree
m(G) > m(G’) if G differs from G’ only by the insertion of an extra edge (representing a call to
an existing procedure).
Let A denote the number of edges in G and N the number of nodes in G. Similarly, let A’
denote the number of edges in G’ and N’ the number of nodes in G’. Then if N > N’ and A-N +
1 = A’ – N’+1 (that is, the spanning subtree of G has more edges than the spanning subtree of
G’, but in both cases the number of edges additional to the spanning tree is the same) then
m(G) < m(G’).
For all graphs G, m(G) ≤ m(KN) = 1 where N = number of nodes of G and KN is the complete
graph of N nodes.
Some concepts explained briefly: A tree with n nodes has always n-1 edges. For every connected
graph G, we can find at least one subgraph that is a tree built on exactly the same nodes as G; such a
tree is called a spanning subtree. A spanning subgraph G’ of G is built on the same nodes of G, but
with a minimum subset of edges so that any two nodes of G’ are connected by a path (thus, a graph
may have more than one spanning subgraph). The tree impurity of G increases as the difference
between G and G’ increases. (Fenton & Pfleeger, 1998, p. 307)
One example of m(G) mentioned by Fenton and Pfleeger (1998, p. 308) that satisfies these four
properties is:
As the number of edges in a complete graph is computed as (n is the number of nodes, e
is the number of edges), and the number of edges in a spanning tree is always n-1, the maximum
number of edges more than the spanning tree is:
Figure 6. Dependency graphs representing the same program module, but with different degrees of tree impurity
G1 G2
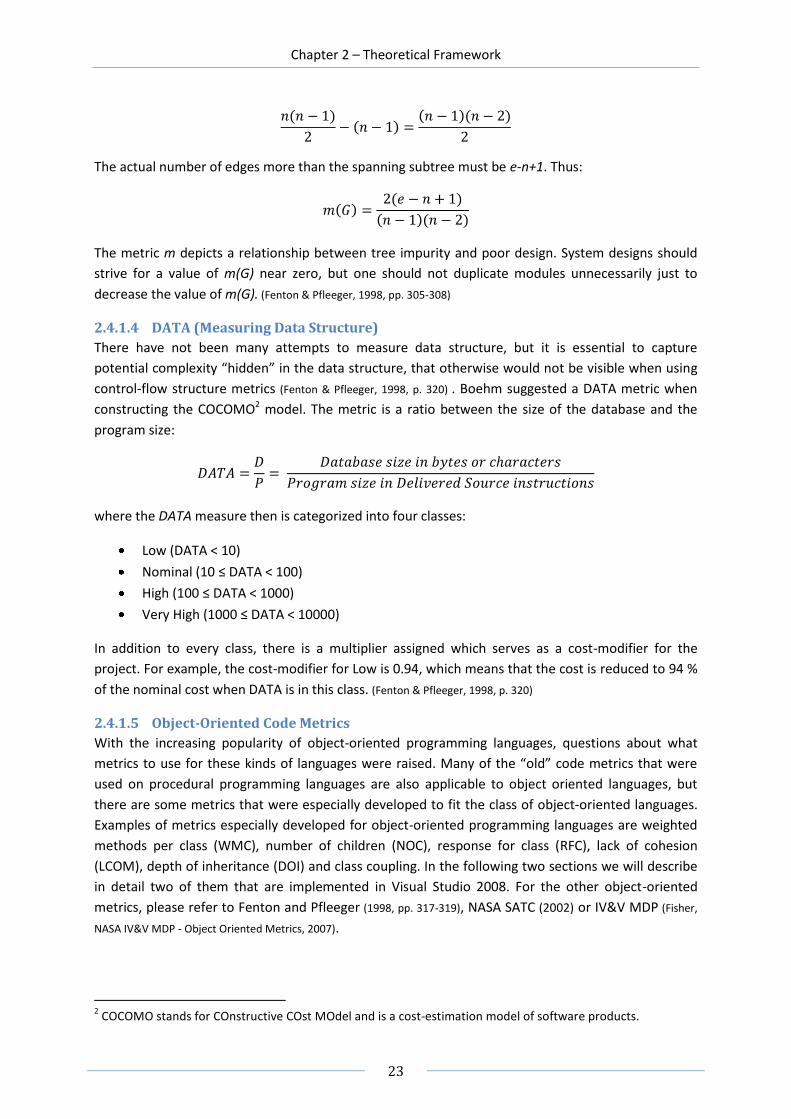
Chapter 2 – Theoretical Framework
23
The actual number of edges more than the spanning subtree must be e-n+1. Thus:
The metric m depicts a relationship between tree impurity and poor design. System designs should
strive for a value of m(G) near zero, but one should not duplicate modules unnecessarily just to
decrease the value of m(G). (Fenton & Pfleeger, 1998, pp. 305-308)
2.4.1.4 DATA (Measuring Data Structure)
There have not been many attempts to measure data structure, but it is essential to capture
potential complexity “hidden” in the data structure, that otherwise would not be visible when using
control-flow structure metrics (Fenton & Pfleeger, 1998, p. 320) . Boehm suggested a DATA metric when
constructing the COCOMO2 model. The metric is a ratio between the size of the database and the
program size:
where the DATA measure then is categorized into four classes:
Low (DATA < 10)
Nominal (10 ≤ DATA < 100)
High (100 ≤ DATA < 1000)
Very High (1000 ≤ DATA < 10000)
In addition to every class, there is a multiplier assigned which serves as a cost-modifier for the
project. For example, the cost-modifier for Low is 0.94, which means that the cost is reduced to 94 %
of the nominal cost when DATA is in this class. (Fenton & Pfleeger, 1998, p. 320)
2.4.1.5 Object-Oriented Code Metrics
With the increasing popularity of object-oriented programming languages, questions about what
metrics to use for these kinds of languages were raised. Many of the “old” code metrics that were
used on procedural programming languages are also applicable to object oriented languages, but
there are some metrics that were especially developed to fit the class of object-oriented languages.
Examples of metrics especially developed for object-oriented programming languages are weighted
methods per class (WMC), number of children (NOC), response for class (RFC), lack of cohesion
(LCOM), depth of inheritance (DOI) and class coupling. In the following two sections we will describe
in detail two of them that are implemented in Visual Studio 2008. For the other object-oriented
metrics, please refer to Fenton and Pfleeger (1998, pp. 317-319), NASA SATC (2002) or IV&V MDP (Fisher,
NASA IV&V MDP - Object Oriented Metrics, 2007).
2 COCOMO stands for COnstructive COst MOdel and is a cost-estimation model of software products.
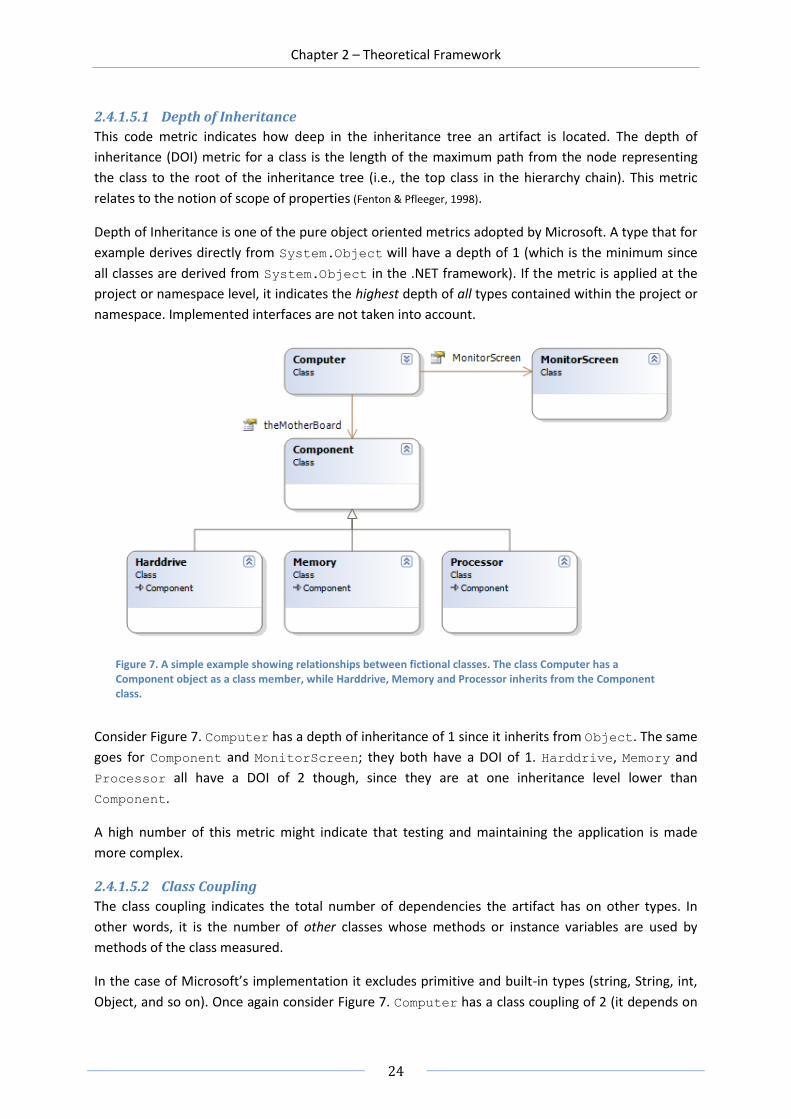
Chapter 2 – Theoretical Framework
24
2.4.1.5.1 Depth of Inheritance
This code metric indicates how deep in the inheritance tree an artifact is located. The depth of
inheritance (DOI) metric for a class is the length of the maximum path from the node representing
the class to the root of the inheritance tree (i.e., the top class in the hierarchy chain). This metric
relates to the notion of scope of properties (Fenton & Pfleeger, 1998).
Depth of Inheritance is one of the pure object oriented metrics adopted by Microsoft. A type that for
example derives directly from System.Object will have a depth of 1 (which is the minimum since
all classes are derived from System.Object in the .NET framework). If the metric is applied at the
project or namespace level, it indicates the highest depth of all types contained within the project or
namespace. Implemented interfaces are not taken into account.
Consider Figure 7. Computer has a depth of inheritance of 1 since it inherits from Object. The same
goes for Component and MonitorScreen; they both have a DOI of 1. Harddrive, Memory and
Processor all have a DOI of 2 though, since they are at one inheritance level lower than
Component.
A high number of this metric might indicate that testing and maintaining the application is made
more complex.
2.4.1.5.2 Class Coupling
The class coupling indicates the total number of dependencies the artifact has on other types. In
other words, it is the number of other classes whose methods or instance variables are used by
methods of the class measured.
In the case of Microsoft’s implementation it excludes primitive and built-in types (string, String, int,
Object, and so on). Once again consider Figure 7. Computer has a class coupling of 2 (it depends on
Figure 7. A simple example showing relationships between fictional classes. The class Computer has a Component object as a class member, while Harddrive, Memory and Processor inherits from the Component class.

Chapter 2 – Theoretical Framework
25
MonitorScreen and Component). Harddrive, Memory and Processor all have a class coupling of
1, because they depend on Component. Finally, MonitorScreen and Component both have a
class coupling of 0, since they do not depend on any other class or type.
A high value of class coupling on a type implies that changes in other types will affect this type.
2.4.1.6 Complexity Code Metrics
There are a lot of code metrics one can use to measure (logical/structural) complexity. Many of them
are related though; in fact most are just variations of one and another. These customized metrics
could however prove to be useful in certain contexts. Some examples are branch count, call pairs,
condition count, decision count, cyclomatic complexity, cyclomatic density, decision density and
global data density. Since the only metric on logical complexity implemented in Visual Studio 2008 is
McCabe’s cyclomatic complexity it will be the only one described in detail here. If the reader is
interested in knowing more about other complexity metrics please refer to NASA MDP (Fisher, NASA
IV&V MDP - Complexity Metrics, 2007).
2.4.1.6.1 McCabe’s Cyclomatic Complexity (Measuring Control-Flow Structure)
One of the most widely used metrics to quantify the control-flow structure is McCabe’s cyclomatic
complexity. It is defined as the number of linearly independent paths you can traverse in a program
(or more precisely; in a flowgraph representation of the program). The cyclomatic number is defined
as (Fenton & Pfleeger, 1998, p. 39; Fisher, NASA IV&V MDP - Complexity Metrics, 2007; Copeland, 2006, pp. 154-155):
where e is the number of edges (arcs) and n is the number of nodes in the flowgraph. This cyclomatic
number is a useful indicator of how difficult a program or module will be to test and maintain (Fenton
& Pfleeger, 1998). The cyclomatic complexity is often used as a hint to as many unit tests one have to
construct to fully test a module (Copeland, 2006, pp. 154-155). The cyclomatic complexity metrics
implemented in Visual Studio 2008 is defined exactly in the same way as McCabe defined it back in
1976 (Fenton & Pfleeger, 1998).
public bool someMethod(string[] args)
{
if (args.Length == 0) {
return false;
}
if (args[0] == "-T"){
methodCall();
}
return true; }
Figure 8. A code snippet and its flowgraph representation.
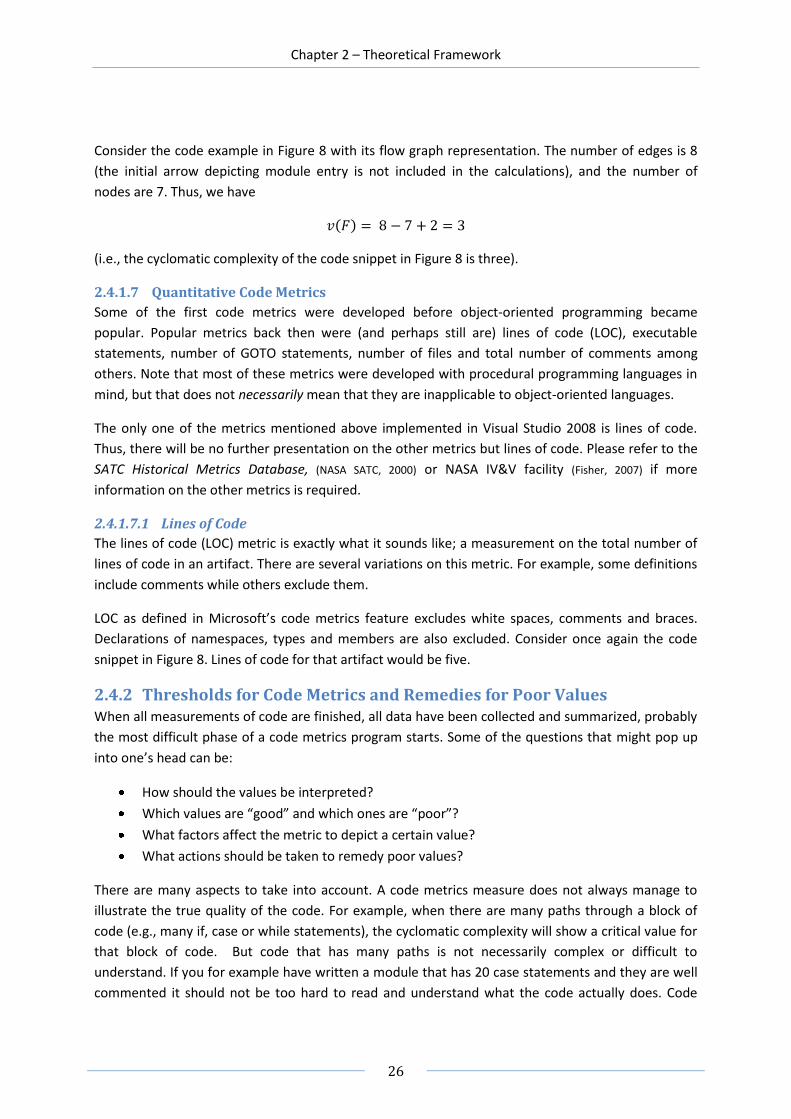
Chapter 2 – Theoretical Framework
26
Consider the code example in Figure 8 with its flow graph representation. The number of edges is 8
(the initial arrow depicting module entry is not included in the calculations), and the number of
nodes are 7. Thus, we have
(i.e., the cyclomatic complexity of the code snippet in Figure 8 is three).
2.4.1.7 Quantitative Code Metrics
Some of the first code metrics were developed before object-oriented programming became
popular. Popular metrics back then were (and perhaps still are) lines of code (LOC), executable
statements, number of GOTO statements, number of files and total number of comments among
others. Note that most of these metrics were developed with procedural programming languages in
mind, but that does not necessarily mean that they are inapplicable to object-oriented languages.
The only one of the metrics mentioned above implemented in Visual Studio 2008 is lines of code.
Thus, there will be no further presentation on the other metrics but lines of code. Please refer to the
SATC Historical Metrics Database, (NASA SATC, 2000) or NASA IV&V facility (Fisher, 2007) if more
information on the other metrics is required.
2.4.1.7.1 Lines of Code
The lines of code (LOC) metric is exactly what it sounds like; a measurement on the total number of
lines of code in an artifact. There are several variations on this metric. For example, some definitions
include comments while others exclude them.
LOC as defined in Microsoft’s code metrics feature excludes white spaces, comments and braces.
Declarations of namespaces, types and members are also excluded. Consider once again the code
snippet in Figure 8. Lines of code for that artifact would be five.
2.4.2 Thresholds for Code Metrics and Remedies for Poor Values When all measurements of code are finished, all data have been collected and summarized, probably
the most difficult phase of a code metrics program starts. Some of the questions that might pop up
into one’s head can be:
How should the values be interpreted?
Which values are “good” and which ones are “poor”?
What factors affect the metric to depict a certain value?
What actions should be taken to remedy poor values?
There are many aspects to take into account. A code metrics measure does not always manage to
illustrate the true quality of the code. For example, when there are many paths through a block of
code (e.g., many if, case or while statements), the cyclomatic complexity will show a critical value for
that block of code. But code that has many paths is not necessarily complex or difficult to
understand. If you for example have written a module that has 20 case statements and they are well
commented it should not be too hard to read and understand what the code actually does. Code

Chapter 2 – Theoretical Framework
27
metrics should be guidelines on how you should predict and maintain a good quality standard during
development and a tool that signal potential problems that could occur.
2.4.2.1 Maintainability Index
Maintainability index (MI) is usually graded on a scale between 0 and 100. It indicates how
maintainable your code is. A maintainability index of 100 means that the code has excellent
maintainability while a value of 0 means that the code has poor maintainability. The maintainability
index is sometimes thought of as the "magic number," meaning it is a calculation that contains
aggregate information from the cyclomatic complexity, lines of code and Halstead volume.
As mentioned earlier in this chapter, a joint venture between Hewlett Packard and some other
organizations made a major research effort (Liso, 2001) and found the thresholds shown in Table 4.
Maintainability Index Risk
0 ≤ MI < 65 Poor Maintainability
65 ≤ MI < 85 Fair Maintainability
85 ≤ MI ≤ 100 Excellent Maintainability Table 4. Hewlett Packard’s thresholds for MI.
Once again the thresholds chosen by Microsoft are shown in Table 5.
Maintainability Index Risk
0 ≤ MI < 10 Low Maintainability
10 ≤ MI < 20 Moderate Maintainability
20 ≤ MI ≤ 100 Excellent maintainability Table 5. Microsoft’s thresholds for MI.
According to Morrison, the reason why the interval for ‘Excellent maintainability’ in Table 5 is so wide
is that they do not want to signal false negatives – and therefore just warn about code that really is in
the danger zone of being difficult to maintain. (Morrison, 2007)
Since maintainability index is a complex metric consisting of several relatively simple metrics, it can
be difficult to analyze the root cause why one would get critical index values. To be able to improve
the maintainability index for a module, one would have to know how it is constructed and calculated.
Maintainability index in both the Hewlett-Packard and Microsoft example above uses a combination
of the Halstead volume, cyclomatic complexity and lines of code to calculate the value. Each of these
variables is weighted with a specific weight and logarithmic functions are also applied (chapter
2.4.1.2 gives a detailed description of how the index is calculated). This means that one or more of
these three variables would have to be altered if one wants to improve the maintainability index.
This shows that when dealing with complex metrics it is important to know which components they
consist of, and how they are calculated. Note that just because Microsoft and Hewlett-Packard have
defined the maintainability index in this way does not necessarily guarantee that other companies or
organizations are using the same definition.
2.4.2.2 Cyclomatic Complexity
Cyclomatic complexity has a big impact on the testability and maintainability of the code. To test a
block of code there should always be at least as many unit tests as there are paths through the block.
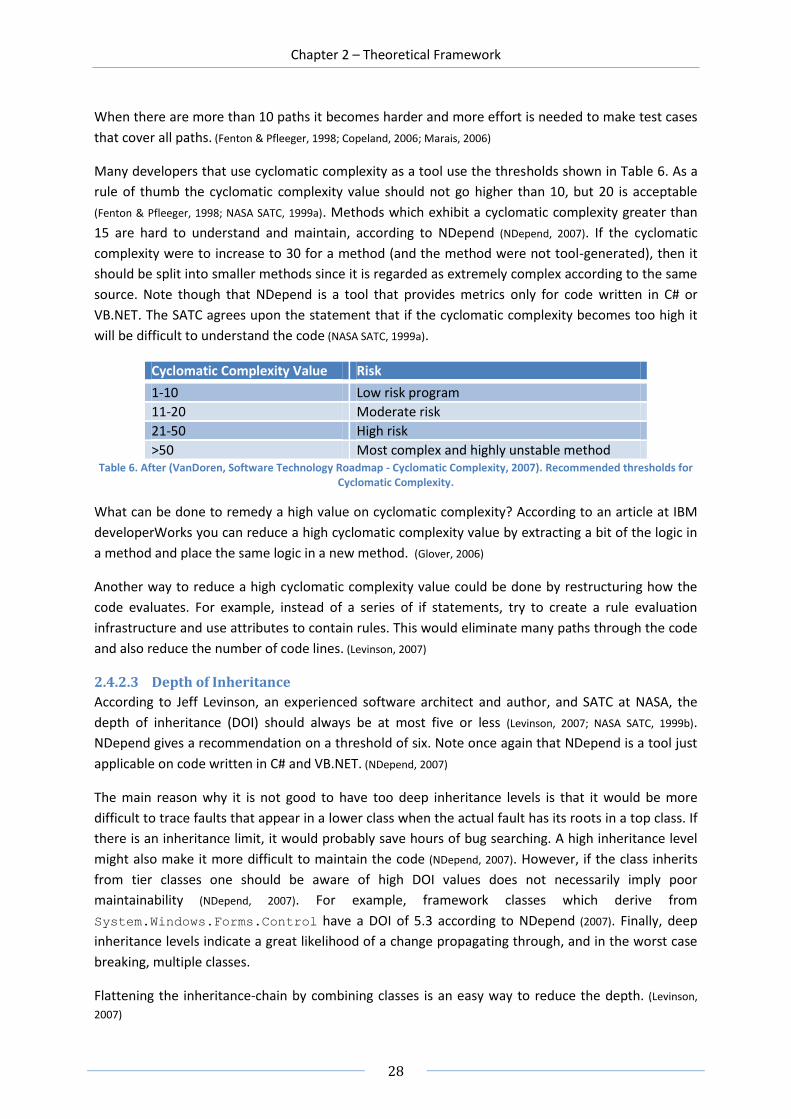
Chapter 2 – Theoretical Framework
28
When there are more than 10 paths it becomes harder and more effort is needed to make test cases
that cover all paths. (Fenton & Pfleeger, 1998; Copeland, 2006; Marais, 2006)
Many developers that use cyclomatic complexity as a tool use the thresholds shown in Table 6. As a
rule of thumb the cyclomatic complexity value should not go higher than 10, but 20 is acceptable
(Fenton & Pfleeger, 1998; NASA SATC, 1999a). Methods which exhibit a cyclomatic complexity greater than
15 are hard to understand and maintain, according to NDepend (NDepend, 2007). If the cyclomatic
complexity were to increase to 30 for a method (and the method were not tool-generated), then it
should be split into smaller methods since it is regarded as extremely complex according to the same
source. Note though that NDepend is a tool that provides metrics only for code written in C# or
VB.NET. The SATC agrees upon the statement that if the cyclomatic complexity becomes too high it
will be difficult to understand the code (NASA SATC, 1999a).
Cyclomatic Complexity Value Risk
1-10 Low risk program
11-20 Moderate risk
21-50 High risk
>50 Most complex and highly unstable method Table 6. After (VanDoren, Software Technology Roadmap - Cyclomatic Complexity, 2007). Recommended thresholds for
Cyclomatic Complexity.
What can be done to remedy a high value on cyclomatic complexity? According to an article at IBM
developerWorks you can reduce a high cyclomatic complexity value by extracting a bit of the logic in
a method and place the same logic in a new method. (Glover, 2006)
Another way to reduce a high cyclomatic complexity value could be done by restructuring how the
code evaluates. For example, instead of a series of if statements, try to create a rule evaluation
infrastructure and use attributes to contain rules. This would eliminate many paths through the code
and also reduce the number of code lines. (Levinson, 2007)
2.4.2.3 Depth of Inheritance
According to Jeff Levinson, an experienced software architect and author, and SATC at NASA, the
depth of inheritance (DOI) should always be at most five or less (Levinson, 2007; NASA SATC, 1999b).
NDepend gives a recommendation on a threshold of six. Note once again that NDepend is a tool just
applicable on code written in C# and VB.NET. (NDepend, 2007)
The main reason why it is not good to have too deep inheritance levels is that it would be more
difficult to trace faults that appear in a lower class when the actual fault has its roots in a top class. If
there is an inheritance limit, it would probably save hours of bug searching. A high inheritance level
might also make it more difficult to maintain the code (NDepend, 2007). However, if the class inherits
from tier classes one should be aware of high DOI values does not necessarily imply poor
maintainability (NDepend, 2007). For example, framework classes which derive from
System.Windows.Forms.Control have a DOI of 5.3 according to NDepend (2007). Finally, deep
inheritance levels indicate a great likelihood of a change propagating through, and in the worst case
breaking, multiple classes.
Flattening the inheritance-chain by combining classes is an easy way to reduce the depth. (Levinson,
2007)

Chapter 2 – Theoretical Framework
29
2.4.2.4 Class Coupling
A high class coupling indicates that there are classes that may be difficult to understand, reuse or
maintain. The larger the class coupling, the higher the sensitivity to changes in other parts of the
design. Therefore, maintenance is made more difficult. Low coupling makes the class easier to
understand, less prone to errors spawning, promotes encapsulation and improves modularity. (NASA
SATC, 1999b)
A good threshold value for class coupling according to NASA is 5 or less. (NASA SATC, 1999b)
2.4.2.5 Lines of Code
The lines of code (LOC) metric is probably one of the most widely used, perhaps since it is so simple
(Fenton & Pfleeger, 1998). The more lines of code you have, the more difficult the code is to maintain and
debug. According to two studies NASA conducted, it shows that values exceeding recommended
thresholds significantly increase errors (Fisher, NASA IV&V MDP - Line of Code Metrics, 2007).
NASA (1999a) proposes that a module should have at most 100 lines of code if blanks and comments
are excluded. If all lines counted includes blanks, comments and source code it should be at most 200
lines. (Fisher, NASA IV&V MDP - Line of Code Metrics, 2007)
NDepend sates that methods which have more than 20 LOC are hard to understand and maintain. If
the method should contain more than 40 LOC (and not generated by a tool) it is considered
extremely complex and should be split in smaller methods according to NDepend. Note first of all
that once again NDepend just is applicable to code written in C# or VB.NET. Secondly, the thresholds
of 20 LOC are not including comments, braces or declarations (NDepend, 2007).
What could be done when there are too many lines of code? Jeff Levinson suggests refactoring to be
the appropriate remedy. For example creating a base class (or procedure) and moving code into that
base class (procedure). He also adds that “generics provide a simple method for reducing the number
of code lines and increasing reusability.” (Levinson, 2007)


PART I - EVALUATION
Chapter 3 – Empirical Research
Experience is the name everyone gives to
their mistakes.
- Oscar Wilde, 1892
(Lady Windermere's Fan, Act III)
Chapter 3 – Empirical Research
32
3 Empirical Research
To correlate the theoretical findings with the industry today, the authors went to five companies to
interview software project managers. This chapter will report on what these project managers had to
say about quality assurance (QA) work and usage of code metrics.
3.1 Purpose and Objectives of the Empirical Research During a couple of weeks the authors interviewed project managers at four various software
companies and one IT department at an investment bank. The purpose of the interviews was first
and foremost to correlate the theoretical foundation to the reality. To this purpose there are two
objectives:
Conclude which ones of the code metrics in Visual Studio 2008 that are relevant in the
industry today (if any).
Find out if there is any market demand in the industry on the authors’ extended Code
Metrics feature.
All project managers the authors interviewed have long experience in the software engineering
industry. Some of the interviewed project managers were also department directors at their
respective companies.
The interviews were designed to be as open and free as possible, so each project manager could talk
about what he or she felt being important regarding quality assurance and code metrics. Although
the aim was to have open interviews, some questions were prepared as discussion material. In
Appendix A you will find these questions.
3.2 Presentation of the Companies This subchapter will present the companies where the interviewed project managers are working. It
will mainly concern the size of the company, the business sector they reside in, project types, and
their QA activities and routines.
Several companies requested to be anonymous if they were going to participate in the research.
With respect for the project managers and their companies no names will be public and each
company will just be addressed as “Company X”.
3.2.1 Company A Company A is a global company that develops business systems for the industry market, handling
everything from order intakes and economy to production and logistics. Their solutions are
developed in several different programming languages. The programming languages used frequently
are Centura, PL-SQL, C, C++, .NET (C#) and Java for the web projects. Most of their products are built
on a custom-made core framework.

Chapter 3 – Empirical Research
33
The average project in company A involves nearly 300 people and spans over one year. These
projects are usually divided in smaller subprojects, in groups of 50-60 people. It is in most cases
maintenance projects of existing products, rather than development of new products. The process
model used in company A is similar to the waterfall process model. However, the company is at the
time of writing adapting to an agile process model where prototyping and customer influence
becomes an important part of the development phase. Thus, the projects are becoming smaller and
spans over a shorter period of time. Approximately just 12 people are involved in these agile
projects.
The QA work starts in an early phase of the development process with well defined requirements and
active participation from customers. There are guidelines on how the programmer shall write their
code, and most of these guidelines are enforced through their core framework. Each programmer
makes unit tests for the modules they have written themselves. The company performs a range of
various measures to improve the products and processes. It is mainly bugs, faults, and the time it
takes to fix a bug that are measured. Statistical data on these measurements is stored for later
analysis. The company also stores statistical data regarding if delivery deadlines are kept. These data
are used to make improvements. Projects are evaluated when they are completed. The purpose of
the evaluation is to learn from previous projects at the prospect of future ones.
Another part of the QA work is the use of mentors. The company has a resource pool of experienced
programmers which aids the less experienced developers. These experienced programmers are not
bound to a specific project. Customers are involved throughout almost all testing processes – not just
the acceptance test in the end.
3.2.2 Company B Company B is also a global company that develops telecom solutions. The programming languages
used at the company are mostly C and an internal non-object-oriented programming language. Two
process models are used at the company; one is a waterfall-like process model and the other one is
an agile deviation of the previous one. The agile process model involves the customer to a wider
extent in the development process than the waterfall-like process. Most of the projects are large
projects involving around 300 people. These projects span over one to two years. Since they are so
large, the projects are usually divided into smaller subprojects, where each subproject consists of 15-
20 or 60-70 people. These type of projects almost always concerns development of new products.
This company invests a lot of resources on QA work to maintain a high quality level. One method
used is inspections, both for documentation and for code. The closer to the actual code the inspected
artifact is the bigger and more accurate inspection is performed. Therefore only smaller inspections
are performed in the early parts of the process, since inspections are very time consuming. Checklists
and milestones are used in the development process, which is a part of the waterfall-like process
model. Fault reports are measured (e.g., number of bugs found) because it is easy to automate these
kind of measurements.
The measure program used by the company today consists of counting faults and bugs. They also use
a measurement method called “stinker rating”. Stinker rating is a process to identify code blocks and
modules that exhibit high potential of being troublesome, and rates them on a five degree scale. This
is intentionally a subjective measure. The company has an overall big confidence in the use of
Chapter 3 – Empirical Research
34
subjective measures. For example, a big emphasis is put on the developers’ own opinions on their
implemented modules, since they probably know their own modules’ weaknesses best.
Each programmer runs unit tests on the code they have written themselves. There are programming
guidelines and design rules on how code should be written.
3.2.3 Company C This company also resides in the telecom business sector. The company utilizes both a waterfall-like
process model and an agile variant. Most of the projects are large and includes around 300 people.
These projects have a lifetime of 12, 18 or 24 months. Just as company B, this company divides the
large projects into smaller subprojects. The subprojects consist here too of 15-20 or 60-70 people
each. These projects almost always involve the development of a new product, in contrast to
maintaining an existing product.
Programming languages used at the company are all non-object-oriented, e.g. C. They use milestones
called “Design Check Points” (DCP) to evaluate every phase in the process. A DCP include tasks that
have to be completed before a new phase can start. During the ongoing process of a project, they try
to separate tasks that absolutely must be completed from tasks that are not required to be
completed - but advantageous if they are. Recently, they introduced a “thermometer” to measure
the level of completed QA tasks for each phase (at each DCP). This “thermometer” serves as an
indicator to show how confident the developers can be in the achieved quality level in every phase of
the project. When a majority of the QA tasks have been successfully performed the thermometer
displays a ‘cold temperature’ to indicate that this module will likely adhere to the quality standards
and not create any serious problems. On the other hand, if the thermometer displays a ‘hot
temperature’, it is an indication that not enough QA tasks have been performed - and the module
possesses a high risk to be of deficient quality. In other words, the thermometer serves as a
calculated ‘gut feeling’ for the project team members to refer to, while the DCPs tell them what must
be completed. Note that this thermometer measure is a subjective measurement.
The company has mature test processes where bugs and faults are traced to their root. Each bug and
fault found will result in a bug/fault report. Every test phase has a test plan. Before a test phase is
completed the test leader must verify that all test cases have been performed with expected results.
Each programmer writes function tests on their own code. The company also runs benchmark and
stabilization tests to test the product under ‘real’ circumstances because all tests cannot be
realistically recreated in a simulated environment. Builds are made every night to check that all code
blocks are compiling, collect code coverage on new code blocks, register the total number of
warnings, and more.
Fault reports are measured, as well as changes made in the code. Like company B, this company
relies much on subjective opinions, gut feeling and experience.
The programmers at the company must adhere to code rules stating how code should be written.
Stinker rating (as mentioned above in the presentation of Company B) is also used here to identify
modules that are prone to create problems. The measurement program is used as a kind of guideline
to indicate whether the project is on track or not, in combination with learning for future projects.
They also consult their senior, more experienced employees to find out if the measurements may be
Chapter 3 – Empirical Research
35
misleading. All in all, the measure program at the company serves as a complement to the gut feeling
of the employees.
3.2.4 Company D This company is not a pure software engineering company. The main business sector of the company
is investment banking: sales & trading, client transactions, analyzing companies, risk management,
and more. The project manager the authors interviewed works in the IT-department of Company D.
This IT-department develops internal solutions for the core business of the company. It concerns
both maintenance of old products and development of new ones. When developing their products
the department uses the agile Rapid Application Development (RAD) process model, which is an
iterative and agile model. The philosophy of the project leader is that the client should be involved as
much as possible during development – not just in the end when the acceptance test is to be run. A
customer is in this context equivalent to another department in the company.
In contrast to the other companies previously described, this company operates in small scale IT-
projects which involves up to ten people. A normal lifetime for a project is about three weeks, but
can be up to four months. The IT department uses a mixture of a lot of programming languages;
ASP.NET, Oracle 10g, Java, SQL Server 2005, Sybase, Access, Visual Basic, and more. They always try
to keep up with the technology and migrate to the latest version of all programming languages and
frameworks whenever possible.
All developers run unit tests on their own code. Spreadsheets are used to provide an overview of the
quality of the product under development. The project manager is responsible for the QA activities.
When the manager feels confident that the quality is at an acceptable level according to the
spreadsheets, it is released to the customer. Coding guidelines exists here too, especially design rules
regarding security.
No specific code metric is used at the IT department today. This is explained by IT not being the core
business of the company. The IT products developed is solely an aid to the core business, and the
solutions have to be delivered fast. Thus, the management does not regard code metrics as vital.
As stated earlier, the company wants to be close to the cutting edge technology, which means that
their code base often has to be migrated from old to newer development environments or
frameworks. If that means breaking the chain of inheritance among implemented classes, then so be
it. The prevailing philosophy at the department is that it is better to have a product based on new
technology than to be dependent upon classes or applications that may be obsolete or no longer
supported.
3.2.5 Company E This company is a consulting company that develops embedded systems in safety equipment, e.g.
airbags. They use a process model which is similar to the waterfall model for development, and
CMMI3 together with ISO 155044 are used for process improvements.
3 Capability Maturity Model Integration, a process improvement approach developed by the Software
Engineering Institute (SEI) and other members from government and industry.

Chapter 3 – Empirical Research
36
An average software project involves about five to fifteen people and lasts for about one to two
years. Programming languages normally used are non-object oriented like C and in some cases
assembler (when there are high performance requirements).
Measurements are made mostly on faults, where a fault is defined as a deviation from the
requirements. Faults and bugs that deviate from the requirements end up listed in a report. The
company has internal code rules based on MISRA (Motor Industry Software Reliability Association).
To check that the MISRA standard is followed, the programmers use peer-reviews. Since the
company develops solutions for hardware related products, they measure daily if and how the code
will fit into the RAM and ROM memory modules on the target hardware.
The QA activities performed at the company differed a lot from project to project. But one thing all
projects had in common was an evaluation when completed, where the bug and fault reports
became useful.
3.3 Results from the Interviews This part of the chapter will summarize the findings the authors made during the interviews
regarding the two objectives.
3.3.1 First Objective – Relevance of the Visual Studio Code Metrics All companies agreed that maintainability index (MI) is a useful and interesting tool to help them
keep track of the maintainability of the artifacts. However, there were some reservations. One
interesting thought from the project manager at company B was that it could be difficult to
understand why there is a bad value of MI when MI is based on several disparate code metrics. In
other words, the complexity of MI makes it difficult to isolate the root cause of poor maintainability
values. This has a serious impact on the usefulness of the MI as a metric. The project manager at
company C mentioned something similar; he reasoned that MI was generally speaking a good metric,
but it could be troublesome to pin down the root cause of a poor value due to the metric’s inherent
complexity – especially when it contradicts the ‘gut feeling’ of the observer. It is when the values
contradict the human intuition that problems with MI will occur, according to him.
All companies agreed that cyclomatic complexity (CC) was a useful code metric. None of the
interviewed project managers had any negative opinions on CC. The project manager at company B
emphasized though that you have to have clear guidelines on acceptable and non-acceptable values
if using this metric as quality indicator. The same project manager also noted that some solutions are
required to be complex; therefore a high value of CC does not necessarily imply a bad design. You
have to be aware of what you are using the metrics for, and what kind of application you are
implementing. At company C they did not really measure the CC in numbers, but they had some ‘gut
feelings’ on how big or small the complexity of the modules were. They would have use for a
measurement like CC since it would provide a more stable foundation to complement their intuitive
feelings for complexity.
4 This standard is also known as the SPICE project – Software Process Improvement and Capability
dEtermination. It is a framework for the assessment of software processes. It was developed by a cooperating committee consisting of ISO and IEC.

Chapter 3 – Empirical Research
37
Depth of inheritance and class coupling were only applicable to company A and D, since these two
code metrics are solely for object-oriented programming languages. Neither of the companies B, C or
E is using object-oriented languages. Company A considered depth of inheritance to be useful to base
design decisions on, since it gives feedback on how many classes that will be affected when changing
a top class in a class inheritance chain. Depth of inheritance is important for the developers,
according to company D. As applications gets older and older, things are getting obsolete. Thus, it
would perhaps be wiser to develop a new set of classes instead of inheriting from old, obsolete parts
(which may no longer be supported by the supplier). Company A already has tools to measure class
coupling. This was to make sure that when changing a particular module, no unexpected secondary
effects would occur in other modules. The project manager at Company D had no strong opinion on
class coupling, but he thought it would be useful as a good tool to evaluate the code.
Neither company A nor D found a purpose to use lines of code (LOC) because it would not contribute
anything of importance to their QA activities. The other companies (B, C and E) found it useful since it
could help them to set an upper limit of how big a module is allowed to be. It could also be useful to
enforce modules with fever lines of code because it would help to get a better overview of the
module. Furthermore, according to company B, such enforcement would probably decrease the
problems with merging source code documents that several developers has altered concurrently,
since it will be less likely that many of them are using the same files at the same time.
Company E had an interesting thought about code metrics in general. They did not think that there
was any code metrics that could be applied to all types of projects. They thought that code metrics
should be chosen after each project’s needs and properties to get the best outcome. Both company C
and E thought that all kind of measures is a good way to collect hard facts. They also had some
considerations on measuring code metrics when hard facts and the human ‘gut feeling’ mismatch.
How should one interpret the values and what actions should be taken?
The first objective of the interviews was, as mentioned earlier, to find out if (and which ones of) the
code metrics in Visual Studio 2008 are relevant, or even used, in the industry. In Table 7 you can see
a summary of the results.
Company Maintainability Index
Cyclomatic Complexity
Depth of Inheritance
Class Coupling Lines Of Code
A YES YES YES YES NO
B YES/NO5 YES -- -- YES
C YES/NO6 YES -- -- YES
D YES YES YES YES NO
E YES YES -- -- YES Table 7. The interviewed companies’ positions on the relevance and usefulness of the implemented code metrics in VSTS.
Note that pure object-oriented metrics is not applicable on company B, C or E.
The project managers interviewed at both company B and C emphasized that you should not neglect
subjective measurements (or rather opinions) in favor of solely using objective code metrics. Gut
5 Theoretically MI is good, but the inherent complexity of MI makes it less useful than the more simple code
metrics. 6 Generally speaking it is a yes, but just as the note above - the fact that MI is complex makes it hard to analyze
the root cause of a possible poor MI value.
Chapter 3 – Empirical Research
38
feeling and subjective assessments by the developers and testers are very important to pay attention
to, since people who have been working with the code most often knows – or at least are able to
suspect – where, what and how the quality of the code is deficient. For example, at company B they
regarded it as more valuable to have discussions between developers and testers from a functional
perspective than it was to measure, e.g., code coverage. These discussions, according to them,
reveals more about what has been done and what has not than just getting a percentage rating on
how much of the code that has been tested. A common remark made among the interviewed project
managers (especially by the one at company B) were that it was of utmost importance to have a clear
goal and purpose with the measurement program. If this is missing, the measurements will become
more of a burden instead of a helping hand.
3.3.2 Second Objective – The Usefulness of the Extended Code Metrics
Feature The second objective of the interviews was to discover if there was any market demand on the
authors’ extended code metrics feature.
This feature might be fairly to very useful at company A, C, D and E, according to the project
managers. The major reason was that it is important to be able to see trends and changes over time,
and to draw conclusions from these trends. This is very important when planning and estimating
resources for future projects, according to these companies. The product would increase the
understanding and gives you raw facts (and thus a more solid ground) to base your decisions on,
according to company A and C. However, such a feature that the authors have developed would not
be critical for company D since their QA work does not depend that much on code metrics, but it
would perhaps prove to be useful as an aid to the project manager.
Company C mentioned that it probably would be difficult to use the facts provided by the feature
under the development phase. Instead, it would be of more use for project evaluation. Furthermore,
company D and E said it would be useful, since it will provide material which can serve as a
foundation from which to evaluate a project and team performance.
However, the project manager at company B did not think that the product would be so useful. He
mentioned that looking at historical data has a limited value. It is difficult to make anything useful
from the feature. Furthermore it would probably consume more time trying to analyze the values
than help the developers, according to him. He adds, however, that it could be helpful to understand
what has happened in a specific code block, e.g., what ramifications a change has had on a specific
module. There are other aids though that would be more valuable or effective; design rules are one
example.
Another important note that most of the companies, in particular company C, considered important
was that measurements should preferably be automated as much as possible. Manually harvested
metrics tend to degrade work efficiency and gives a false picture of the reality.
All in all during the investigation, a genuine interest for code metrics were shown among most of the
interviewed project managers. Most considered the data they provide as good feedback to see that
code policies actually are abided, which is important to maintain a correct level of quality.


PART I - EVALUATION
Chapter 4 – Analysis
Who are you? Why am I here? I want
answers now or I want them eventually!
- Homer Simpson
Chapter 4 – Analysis
41
4 Analysis
This chapter correlates the theoretical foundation presented in chapter 2 with the empirical results
found in chapter 3. First are some general details observed, where after the authors try to see how
well the supplied code metrics in Microsoft’s new Visual Studio 2008 feature fulfills the definition of
software metrics. The chapter also contains an argumentation on how well the code metrics fulfills
the required and desired properties on software metrics.
4.1 Required and Desired Properties Fulfillment All of the interviewed project managers working at companies which has software engineering as
their core business has regarded code metrics as something of high importance. But company D
(which had not software engineering as the core business) did not put much weight in using these
kinds of metrics. Since we just had one of these types of companies, it is far too little to draw any
conclusions from. But one might note that the two facts of not having software engineering as core
business and running very short projects (in terms of calendar time) may imply that there are other
QA activities that are more important than keeping track of metrics on code. It may also be as simple
as larger projects have a greater need for control than these short-time projects.
4.1.1 Definition Match First of all, let us assert that the code metrics contained in Microsoft’s feature really are code metrics
by definition. Recall the definition of software metrics given in chapter 2.3.1:
A software metric is a direct or indirect measurement, a
quantification of an attribute that an artifact in a
software project possesses.
Remember that code metrics is a subcategory of software metrics containing all metrics that are
measurements of source code. The metrics included in the feature provided by Microsoft are, as the
reader may remember, the following:
Maintainability index
Cyclomatic complexity
Class coupling
Depth of inheritance
Lines of code
All of these metrics mentioned above are measurements. Maintainability index is the only indirect
measurement since it is a calculation using direct measurements. The remaining four metrics are all
direct measurements. Furthermore, they all manage to quantify an attribute of an artifact (the
artifact is in this case a Visual Studio project, a namespace, a class or a method). Maintainability
index quantifies the maintainability attribute of the artifact. Cyclomatic complexity quantifies the
(logical) complexity of the artifact. Class coupling is a metric that can be used to quantify the
modularity (high class coupling implies that the classes in an implementation act more as a “unity”
instead of modular entities), complexity (high values of class coupling means that the design
Chapter 4 – Analysis
42
complexity is increased since classes depend on each other to a high extent) or maintainability (low
class coupling implies easier maintenance since changes will not propagate to other classes to a great
extent) of an artifact. Depth of inheritance accomplishes to quantify design complexity. Lines of code
quantify the size of a given artifact.
4.1.2 Required Properties All five code metrics satisfy the fundamental definition of being software metrics. But how well do
they comply with the industry demands and the required properties of software metrics, as
discussed in chapter 2.3.4?
The required properties on software (code) metrics are the following. Code metrics must:
1. Be measurable,
2. Be relevant,
3. Be valid,
4. Be reliable/robust,
5. Be well defined,
6. Be easy and simple, and
7. Not require independent data collection.
The numbers are used for indexing purposes in Table 8, shown below.
All of the five metrics are measurable, since they manage to quantify attributes of the source code
and assign a value to these attributes. Furthermore they are all relevant in the sense of being related
to one or several quality factors as described in the previous subchapter. However, since the quality
factors used differ from organization to organization (or even from project to project), it is impossible
to establish if they are relevant in all cases and contexts. As one could see from the empirical
research, LOC was considered relevant for those companies using procedural programming
languages (3 of 5), e.g., to set limits on module size with the purpose to make testing, debugging and
maintenance easier. For the companies using object-oriented programming languages though the
LOC metric was considered almost useless. This correlates to Jones’ statement about the LOC metric
penalizing high-level programming languages. It also correlates to Svahn and Österlund’s statement
about LOC not being a useful metric per se.
Regarding depth of inheritance and class coupling; the project managers at company A and D both
saw the need for these kinds of metrics. The scientific community (e.g., (Levinson, 2007; NASA SATC, 2002;
NASA IV&V, 2007)) provides us with recommended thresholds on these – warning for severely increased
maintainability issues if not kept to a moderate level. Thus, both of these object-oriented metrics are
relevant in the context of object-oriented programming.
Most authors on the subject of software metrics agree on having a clear and understandable goal for
all measurements you perform. Company B asserted the same fact; a clear goal of the metrics
program has to be established, or else it will just become a burden.
Cyclomatic complexity, depth of inheritance and class coupling are valid, since they do measure the
respective quality attributes mentioned in the previous subchapter. However, as noted by both Jones
and Galin, LOC is invalid under various conditions, e.g., when used for comparison over different

Chapter 4 – Analysis
43
programming languages. This implies that maintainability index is not valid under the same
circumstances, since one of its main components when calculated is LOC. All this is also indicated by
the interviews; the project managers working with object-oriented programming languages
(company A and D) did not find LOC useful, while the other project managers working procedural
programming languages considered it a very useful metric indeed.
The metrics are reliable and robust, in the sense that they do not change when applied under similar
conditions. It is impossible for them to change, since they are calculated from static (internal) facts;
the code itself. Applying the same measurements on the same piece of code will result in the same
values again. As noted in the interviews though, one would have to be absolutely sure about what it
is one is measuring, or else the numbers may be misleading. The example regarding cyclomatic
complexity the project manager at company B presented shows this pretty well; if a product is by its
nature complex, a high value of cyclomatic complexity is not necessarily ‘bad’. Galin mentions though
that the LOC metric exhibits severe weaknesses where, e.g., programming styles or how comments
are used will inflict the measure severely. Microsoft has however attempted to remedy this by not
including comments, whitespaces, declarations or brackets when counting LOC.
All code metrics implemented in the Visual Studio feature are well defined. As the reader will see in
chapter 5.1.2.1, they are defined for each level in the project hierarchy for every artifact that they
are applicable on. That is, the metrics have defined interpretations when applied to the project,
namespace, type or method level. There is no room for any ambiguity about how the metrics are
calculated or measured. One could imagine that maintainability index would fail on being well
defined since it involves Halstead metrics which has been vastly criticized for its impreciseness (since
it contains components not really measurable, e.g., “elementary mental discriminations” or
“program level” mentioned in chapter 2.4.1.1). Microsoft has however successfully avoided this by
not using these controversial attributes of Halsted metrics.
Code metrics should be easy and simple, which mean that the collection of the data should be
performed with minimal resources (it should not require independent data collection), and the
implementation should be simple. This is confirmed both from the theoretical and the empirical
studies. Galin as well as Fenton and Pfleeger insist on keeping metrics simple. One could also see
some skepticism against composite code metrics from the performed interviews. Both project
managers at company B and C confirmed that it would be difficult and time-consuming to analyze the
root cause of a poor value of a composite metric (i.e., maintainability index) since it is complex.
While all of the five code metrics investigated are harvested with at least very few resources (it
requires just a couple of clicks with the mouse button), they are not all simple. Since maintainability
index is a composite metric with a rather complex formula, it cannot be accounted for as simple.
According to two of the interviewed project managers (company B and C), maintainability index is
neither easy to understand or analyze should it have a critical value. The other four code metrics in
the set are simple, though. The extended code metrics feature implemented by the authors do
require independent data collection by forcing the developer to manually enter the metric numbers.
This can, and should, be automated in the future to satisfy this last requirement; harvesting metrics
should not require independent data collection. Both the theory and the empirical investigation
confirm this.
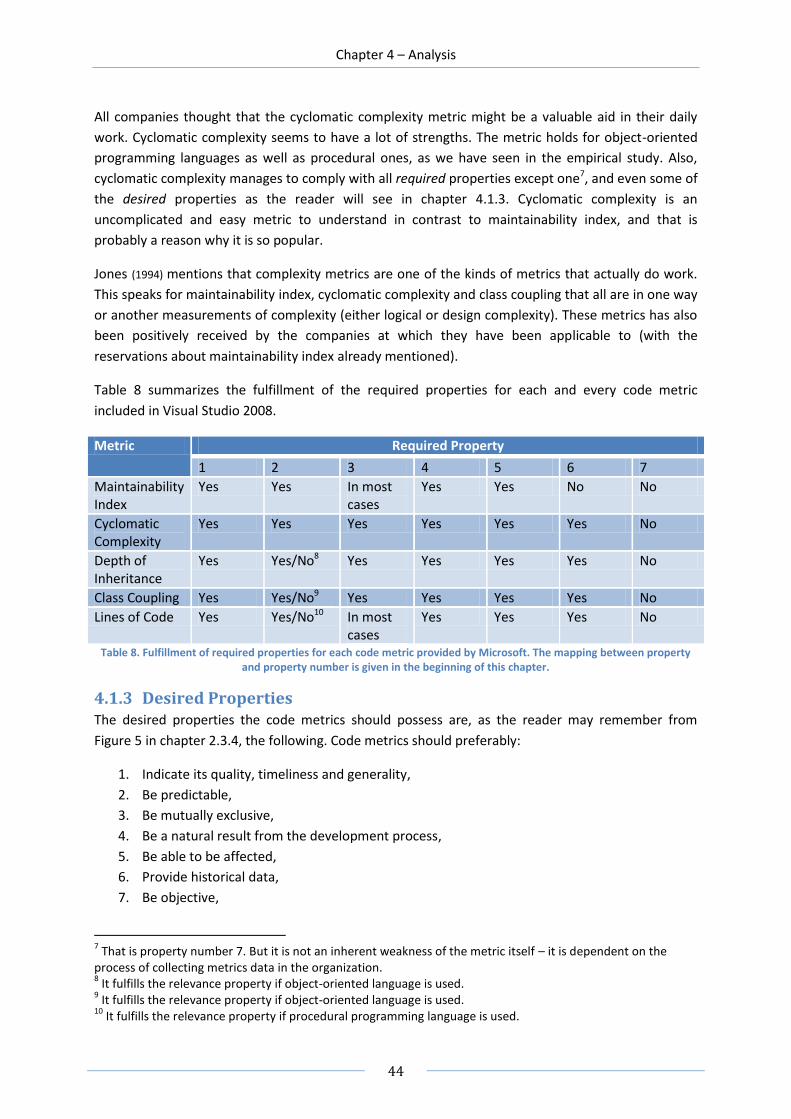
Chapter 4 – Analysis
44
All companies thought that the cyclomatic complexity metric might be a valuable aid in their daily
work. Cyclomatic complexity seems to have a lot of strengths. The metric holds for object-oriented
programming languages as well as procedural ones, as we have seen in the empirical study. Also,
cyclomatic complexity manages to comply with all required properties except one7, and even some of
the desired properties as the reader will see in chapter 4.1.3. Cyclomatic complexity is an
uncomplicated and easy metric to understand in contrast to maintainability index, and that is
probably a reason why it is so popular.
Jones (1994) mentions that complexity metrics are one of the kinds of metrics that actually do work.
This speaks for maintainability index, cyclomatic complexity and class coupling that all are in one way
or another measurements of complexity (either logical or design complexity). These metrics has also
been positively received by the companies at which they have been applicable to (with the
reservations about maintainability index already mentioned).
Table 8 summarizes the fulfillment of the required properties for each and every code metric
included in Visual Studio 2008.
Metric Required Property
1 2 3 4 5 6 7
Maintainability Index
Yes Yes In most cases
Yes Yes No No
Cyclomatic Complexity
Yes Yes Yes Yes Yes Yes No
Depth of Inheritance
Yes Yes/No8 Yes Yes Yes Yes No
Class Coupling Yes Yes/No9 Yes Yes Yes Yes No
Lines of Code Yes Yes/No10 In most cases
Yes Yes Yes No
Table 8. Fulfillment of required properties for each code metric provided by Microsoft. The mapping between property and property number is given in the beginning of this chapter.
4.1.3 Desired Properties The desired properties the code metrics should possess are, as the reader may remember from
Figure 5 in chapter 2.3.4, the following. Code metrics should preferably:
1. Indicate its quality, timeliness and generality,
2. Be predictable,
3. Be mutually exclusive,
4. Be a natural result from the development process,
5. Be able to be affected,
6. Provide historical data,
7. Be objective,
7 That is property number 7. But it is not an inherent weakness of the metric itself – it is dependent on the
process of collecting metrics data in the organization. 8 It fulfills the relevance property if object-oriented language is used.
9 It fulfills the relevance property if object-oriented language is used.
10 It fulfills the relevance property if procedural programming language is used.
Chapter 4 – Analysis
45
8. Reflect customer needs,
9. Follow standards,
10. Be immune to bias from interested parties, and
11. Be comprehensive.
The desired properties of metrics as Hufton (1994) mentioned in his paper about indicating their
quality, generality and timeliness sounds reasonable, but no further indication on what these three
properties really mean are mentioned. One could reason that as it is now, the code metrics feature
provided by Microsoft does not indicate their timeliness since they do not provide any timestamps
what so ever. However, the extension implemented as part of this master thesis project seeks to
remedy this flaw. The generality is indicated in a way, since the measurements are shown as a
hierarchy depicting at what level and for how many modules the values are applicable to. About
indicating the quality of information provided with the metrics it is unclear what is really meant by
quality. For example, quality is according to ISO 9000 (Wikipedia, 2008) the ”degree to which a set of
inherent characteristic fulfills requirements”, while other definitions include customer expectations in
the word quality – which may not necessarily be part of the requirements. If the first definition of
quality is used, they all certainly fulfill their requirements as concluded above; but if the other
definition is used (which include customer expectations), there is no way telling if the metrics
accomplishes this or not since it depends heavily on the customer type. Hence no certain conclusion
can be made about the indication of the quality of the provided code metrics unless the definition of
quality used in Hufton’s paper is made perfectly clear.
One can easily see that the simple metrics (i.e., lines of code, depth of inheritance, cyclomatic
complexity and class coupling) are predictable since they are direct measurements on the produced
code the developer himself has written. However, maintainability index (which is a composite metric)
may not be as intuitive or predictable as the simple ones. This is due to its inherent complexity;
although one knows that it is constructed by a combination of Halstead volume, cyclomatic
complexity and lines of code, it is difficult to predict the final value of this metric. This is one of the
reasons why there was some skepticism against composite metrics among the project managers.
The set of code metrics provided are not mutually exclusive. For example, both cyclomatic
complexity and maintainability index are two metrics one can use to quantify the maintainability of
the artifact. Furthermore, since maintainability index is a composite code metric consisting partially
of cyclomatic complexity and lines of code, it is easily understood that these three metrics are not
mutually exclusive.
One thing that is totally clear though is that all metrics are a natural result from the development
process. This is because they all are measured directly from the source code. No supplementary
artifacts or processes are needed to measure them.
They are all able to be affected. In fact, it is rather easy to affect them. Almost any alteration to the
source code or the design will have effect on the values shown by the code metrics.
As of now the code metrics provided do not supply any historical data. But the code metrics
extension the authors have implemented bestows the metrics with this property.
Chapter 4 – Analysis
46
The theory and the empirical results do not correlate when looking at the objectivity property of
code metrics. Svahn and Österlund mentions that code metrics should preferably be objective, but
the project managers at company B and C states that subjective measurements are just as valuable
as objective ones – if not even more. Nevertheless, all code metrics are as objective as they possibly
can be. No subjective opinions come into play in any of them, since they measure the code directly.
One should note that maintainability index is a calculation and not a direct measure, but it is still an
objective calculation. The fact that it is a complex metric has though some influence on its
comprehensiveness.
Trying to determine if the metrics satisfy the property of ‘reflecting customer needs’ is impossible
since it is highly dependent on who the customer is – a delimitation not included in the scope of this
project.
It is quite difficult to say if the code metrics follow existing standards since there are no real
standards to follow. Sure, some organizations have defined their metrics in one or another way and
they have thus become a de facto standard. For example, the formula to calculate maintainability
index (which was developed by the joint venture of several influential organizations, e.g., Hewlett-
Packard and the University of Idaho) became quite popular in the software engineering industry and
is now the prevailing definition of this index. Microsoft uses the same formula to calculate
maintainability index in their implementation. Lines of code (LOC) is defined in so many ways by so
many organizations that there are no real standard to follow. But the way Microsoft calculates LOC is
used by many other organizations too. As for class coupling, depth of inheritance and cyclomatic
complexity there are just one way to measure them, so in that way Microsoft is following the existing
‘standard’.
The code metrics are in a way not really immune to biased interventions from interested parties.
Since they are calculated from the source code itself, you cannot alter the values of the metrics
without altering the actual source code. But one could imagine a module with some additional
statements that really are not necessary per se, but exists because they increase the readability of
the module. A programmer could then transform this module by deleting the superfluous statements
and thus reducing the lines of code for the module. Thus, the code metric value has been affected
and has become biased; but has the quality of the module really increased?11 This could however be
remedied by intervening procedures or policies, e.g., not giving special credit to programmers which
implement functionality below a certain amount of lines of code. The other metrics in the set are
really difficult to affect since it requires a change to the architecture or design of the actual
application.
The code metrics are rather comprehensive to a certain extent, since all of them are applicable to a
large variety of applications and situations. With the empirical data gathered, one could argue
though that LOC just is relevant for non-object-oriented programming languages, and depth of
inheritance together with class coupling just are relevant for object oriented languages. While the
LOC metrics certainly does not seem to be very useful in object-oriented programming languages
according to the empirical data, it can still be used as a metric in that context. Depth of inheritance
11
The answer to the question depends on what quality attributes you take into account when defining quality. In this example, the quality attribute ‘readability’ stands in sharp contrast to ‘performance’.

Chapter 4 – Analysis
47
and class coupling, though, has limited comprehensiveness since they cannot be used for procedural
programming languages. Maintainability index consists of several factors weighted by a couple of
coefficients, as shown before. These coefficients were derived from actual usage at Hewlett-Packard.
It has been stated that these coefficients have been adjusted to fit other general industrial-sized
software systems, but it has been suggested that the coefficients should be tested to fit each major
system to which the metric is applied (VanDoren, Software Technolog Roadmap - Maintainability Index Technique
for Measuring Program Maintainability, 2007). It can also be debated how valuable this property of
comprehensiveness really is. According to company E, it was important to tailor the choice of metrics
for the specific project in question. They did not think that there was any ‘universal’ code metric that
was applicable to all kinds of projects.
In Table 9 below you can see the accumulated results for each metric and each desired property.
Metric Desired Property
1 2 3 4 5 612 713 8 9 10 11
Maintainability Index
Partially No No Yes Yes No Yes -- Yes Yes No14
Cyclomatic Complexity
Partially Yes No Yes Yes No Yes -- Yes Yes Yes
Depth of Inheritance
Partially Yes No Yes Yes No Yes -- Yes Yes Yes/No15
Class Coupling Partially Yes No Yes Yes No Yes -- Yes Yes Yes/No16
Lines of Code Partially Yes No Yes Yes No Yes -- Yes No Yes Table 9. Fulfillment of desired properties for each code metric provided by Microsoft. The mapping between property
number and name is given at the beginning of this subchapter.
4.1.4 Suggested Thresholds Only a minority of the interviewed companies used anything like the code metrics that exist in Visual
Studio 2008; but even those using similar code metrics did not store any statistical data or was not
able to provide us with information about what thresholds they had at their companies. Thus, this
chapter will be based mostly on the theoretical findings, but tries to take the empirical results into
account when recommending thresholds.
Most theoretical studies (Levinson, 2007; NASA SATC, 2002; NASA IV&V, 2007) support the view that the depth
of inheritance should not be too deep. A suggested threshold is a level of five. The project manager
at company D also did not think that the chain should be too long, since it will cause problems for the
future by, in the end, making the application dependent on old (legacy) classes which may be
obsolete.
12
The code metric system as of today does not satisfy this property, but it will be satisfied if and when the authors’ extension is applied. 13
The desirableness of this property is disputed. See argumentation in the text. 14
May not be comprehensive to a wider extent since the coefficients used in the formula may need to be recalibrated for each major software system developed. 15
This metric is just applicable to object-oriented programming languages, and thus limits its comprehensiveness. 16
This metric is just applicable to object-oriented programming languages, and thus limits its comprehensiveness.

Chapter 4 – Analysis
48
Class coupling also has a suggested threshold of five. One company used this metric but had no
standard threshold specified.
Cyclomatic complexity has no official standard threshold, but the ”inventor” of this metrics (Thomas
McCabe) and many others has a best practice set to around 10 as upper limit, but 20 is in some cases
acceptable as a critical upper threshold.
With the research effort made at Hewlett-Packard in mind, maintainability index has a recommended
threshold of 65. Microsoft has decreased that bound to 20 since they do not want to signal false
negatives. However, the threshold of 65 seems to have been used successfully while the altered
threshold of 20 is not tested to a wider extent.
We have not been able to conclude if there should be any limit on lines of code for object-oriented
programming languages. NDepend suggests that methods should only contain maximally 20 lines of
code. But the empirical investigation does not show any real need to limit the lines of code in this
context. However, for procedural languages we have been able to establish that limitations on lines
of code certainly are useful. A recommended threshold is given by NASA SATC to be around 100 lines
of code per module.
Chapter six will conclude the results and observations made in this analysis. Before proceeding to the
results though, remember that there also was another objective to this master thesis project; to
extend the code metrics feature. Next chapter will address this objective.


PART II - EXTENSION
Chapter 5 -Extending The Code Metrics Feature
The major difference between a thing that
might go wrong and a thing that cannot
possibly go wrong is that when a thing that
cannot possibly go wrong goes wrong it
usually turns out to be impossible to repair.
- Douglas Adams (1952-2001),
(From Mostly Harmless)
Chapter 5 – Implementation
51
5 Extending the Code Metrics Feature
Our master thesis is divided into two separate parts; one practical and one theoretical. This chapter
describes the practical part: what we have implemented and how. First the prerequisites are
described, followed by descriptions each component in the solution. The deployment of the
implementation, unfortunately, caused problems we were not able to resolve.
5.1 Prerequisites and the Architecture To get an understanding of exactly what have been implemented, where the parts are located and
how it has been done, it requires some basic knowledge of the prerequisites we have been working
with and knowledge of the existing architecture. If the reader already is familiar with Team
Foundation Server and Visual Studio, this subchapter may be skipped.
As stated in the introduction the implementation assignment consisted mainly of creating a client-
server solution, with some additional features in-between. The server architecture (Team Foundation
Server) will be described first, followed by the client environment (Visual Studio).
5.1.1 Microsoft Team Foundation Server Microsoft Team Foundation Server (TFS) is a three-tier architecture offering useful tools for software
engineering projects like source control, project tracking, reporting, data collection, automated
builds, project portals and more. The three tiers are the client, the application and the data tier (see
Figure 9). The client tier is used for creation and management of projects by accessing items stored
for a particular project. Visual Studio is an example of an application running at the client tier. TFS
exposes a set of web services in the application tier which is accessed by the clients to perform
actions, e.g., checking in code, reporting on completed work items and more. There is also a project
portal for each project hosted in the application tier facilitated by Windows SharePoint services.
Finally, at the lowest layer you have the data tier which essentially is a SQL Server 2005 installation. It
is possible, but not required, to run the application and data tiers at the same physical server. The
only requirement for both tiers is that the server runs the Windows Server 2003 operating system.
A software project in TFS is called a Team Project and all information about the project (e.g., builds,
source code, documents, work items, bug reports, test results) is stored and mapped to the project
accordingly. The product is highly customizable and allows you to define your own process model to
use (two models are delivered by default). When process model is chosen all necessary items like
reports, bug types, documents, milestones, roles and permissions are created automatically.

Chapter 5 – Implementation
52
There is a lot of interesting parts and features in TFS; too many to all be described in this thesis. Two
important parts of TFS for our assignment are located in the data tier; the data warehouse and the
operational stores. In the application tier the interesting parts are first and foremost the web services
and reporting services. Finally, our client application is, of course, located in the client tier. These
elements are all depicted in Figure 9. Remember this figure; it will be referenced frequently in
upcoming subchapters.
Statistical analysis of the data warehouse in TFS is enabled to allow a vast span of software metrics
pertaining to a project to be generated. For example, numbers on completed work items, bug
reports, test results, build information and code churn can easily be extracted from the warehouse
and generated as reports. Note however that no code metrics is available through this reporting
service. The code metrics feature is implemented in Visual Studio 2008, not Team Foundation Server.
In other words, TFS is the core, or the heart, of software engineering projects developed with
Microsoft tools.
5.1.2 Microsoft Visual Studio 2008 Visual Studio is a well-known software development product for software developers. It is an
integrated development environment (IDE). The first release came back in 1997 and has been
steadily developed and expanded since then. The latest version of Visual Studio went under the
codename Orcas, which is this 2008 version. One of the new features in Visual Studio 2008 were the
code metrics feature which the authors have evaluated and tried to extend in this master thesis
project.
Microsoft provides a suite of specialized versions of Visual Studio, including a Developer, Architect,
Tester and Database edition called Visual Studio Team System (VSTS). These specialized versions of
Visual Studio acts in the Client tier depicted in Figure 9. Team Foundation Server is the underpinning
architecture that Visual Studio Team System is using.
5.1.2.1 The Code Metrics Feature in Visual Studio 2008
Visual Studio 2008 contains five code metrics. The five code metrics are, as mentioned earlier:
TFS Client API Client Tier
Application
Tier
Data Tier
TFS Web Services
SharePoint Services
Reporting Services
Operational Stores Data Warehouse
Figure 9. Team Foundation Server three-tier architecture.

Chapter 5 – Implementation
53
Maintainability index
Cyclomatic complexity
Depth of inheritance
Class coupling
Lines of code
All metrics are averaged at the assembly, namespace and type levels except class coupling. Rather
than displaying the total number of type references, the class coupling metric displays the total
number of distinct types referenced at the type and method levels (Kean, 2007). Figure 10 shows a
screenshot of how the code metrics features looks like when applied to a Visual Studio project.
Figure 10. Code metrics generated in Visual Studio 2008 for the authors’ client application installation package.
The code metrics pane also allows you to filter a particular metric between specified intervals.
Maintainability index also contains a symbol showing green, yellow or red depending on the value of
the index. Red is low, yellow is moderate and green is high maintainability, as the reader might have
guessed. There is also a feature which exports the code metrics data into Microsoft Excel, allowing
the user to experiment with and analyze the data provided.
5.2 The Assignment Microsoft provides core foundation functionality for software engineering projects in TFS. The code
metrics feature provided in Visual Studio 2008 may also be useful these projects. The problem was
that no link between Visual Studio and Team Foundation Server exists. Thus, the development team
is unable to save any historical code metrics data and correlate it to other Team Project facts (e.g.,
work items, bug reports, test results and so forth).
The extension assignment was to investigate if it was possible to store code metric measures in the
Team Foundation Server (TFS) data warehouse and implement a solution performing this. If it was
possible we were also supposed to design a report template in Microsoft Excel which utilizes and
presents the code metrics data. This could prove to be useful when correlating the code metrics data
to the various team project statistics in the TFS data warehouse.
Our first objective was to create a communication link between Visual Studio Team System (VSTS)
and TFS. Note that VSTS is a specialized version of Visual Studio meant to be used in conjunction with
TFS. Therefore, the solution shall be customized for use in the Team System environment. To make
this link from VSTS to TFS three parts had to be implemented. First part was to create a client with a
Graphical User Interface (GUI) in VSTS so the developer can send code metrics data from the VSTS
environment. The second part was to create a web service that acts as a middle-layer between the

Chapter 5 – Implementation
54
VSTS interface and the data store. The third part we had to create was a data store where all code
metrics data can be stored.
Our second objective was to create a third-party adapter and a XML-schema to make a connection
between our data store and the data warehouse.
The third and final objective was to make a report template in Microsoft Excel which uses and
illustrates the stored metrics data from the Data Warehouse.
As an optional objective, we were supposed to make a dashboard that would show the project’s
health based on the code metrics data. But lack of time due to severe problems with getting the data
warehouse to recognize our implementation made it impossible to carry out that optional task.
5.3 The Solution In the following subchapters the reader will see how the authors solved the assigned tasks. As
mentioned in the preface, the solution consists of four parts:
Create a client application which sends the generated metrics to the server.
Build a web service which handles communication between the client and the server.
Implement a device which stores the metrics data in the TFS data warehouse.
Design a report template which extracts the metrics data from the data warehouse and
presents it in a useful manner to, e.g., the project manager.
Consider Figure 9 above once again. The client is located in the client tier, while the web service is
located among the other TFS web services in the application tier. This web service holds a connection
to a local operational store (in fact just a simple SQL Server 2005 database) which is located on the
data tier as shown in Figure 9. TFS consists of several operational stores which hold all kinds of data
on Team Projects. The operational stores are often SQL Server 2005 databases, but they do not
necessarily need to be of that format. The data warehouse located in the same tier stores data from
work items, builds, source control, testing tools, and more. This information is used by Team
Foundation Server for use in the built-in reporting functionality. The warehouse itself consists of a
relational and an Online Analytical Processing (OLAP) database, where the relational database is
organized approximately as a star schema. The OLAP database, in turn, is a data cube derived from
this relational database. Every tool in TFS contributes with one or more facts to the data warehouse,
where every fact has a primary relational table and a cube in the OLAP database that extracts
information from that table. The facts, in turn, are composed of dimensions, measures and details.
Facts are numerical data that you can use aggregate functions on, e.g., sum or average. Dimensions
are data that is not numerical, or aggregate functions are not applicable (e.g., data classified as ‘low’,
‘medium’ or ‘high’).
Examples of dimension tables in the data warehouse are Build, Date, File, Assembly, Person, Team
Project and Work Item. Existing fact tables are among others Build changeset, Build coverage, Build
details, Code churn, Load test counter, Run coverage and Test result.
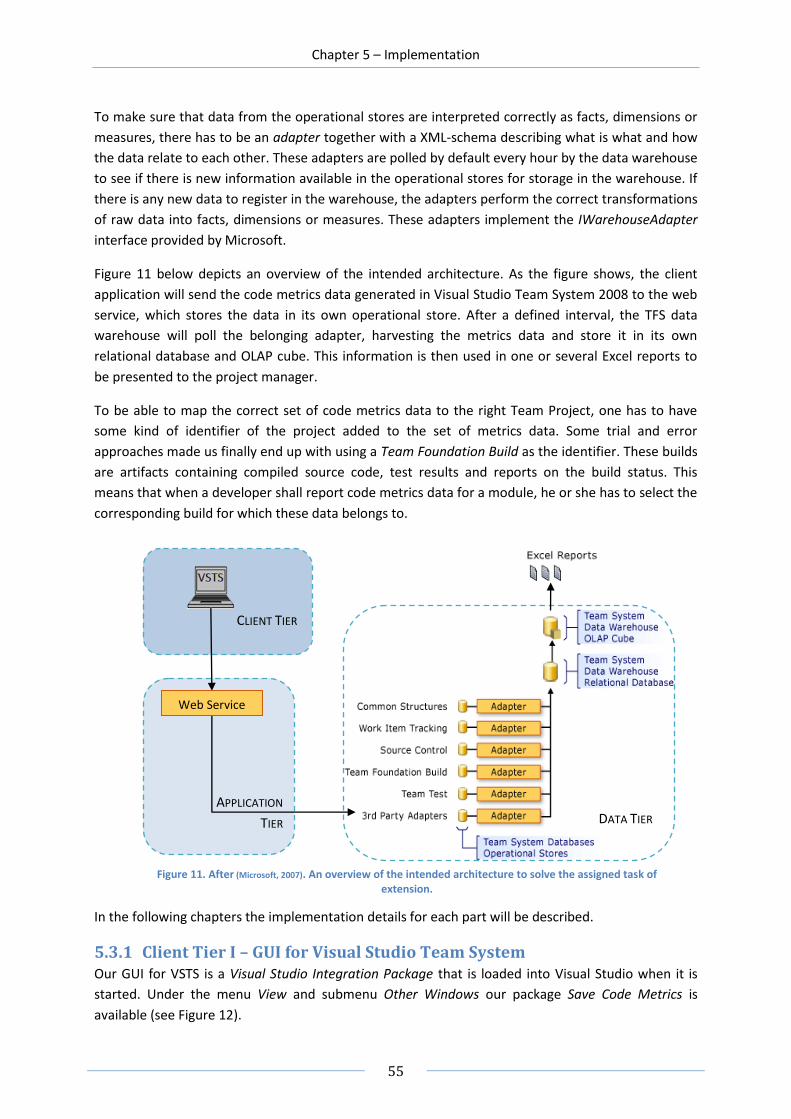
Chapter 5 – Implementation
55
To make sure that data from the operational stores are interpreted correctly as facts, dimensions or
measures, there has to be an adapter together with a XML-schema describing what is what and how
the data relate to each other. These adapters are polled by default every hour by the data warehouse
to see if there is new information available in the operational stores for storage in the warehouse. If
there is any new data to register in the warehouse, the adapters perform the correct transformations
of raw data into facts, dimensions or measures. These adapters implement the IWarehouseAdapter
interface provided by Microsoft.
Figure 11 below depicts an overview of the intended architecture. As the figure shows, the client
application will send the code metrics data generated in Visual Studio Team System 2008 to the web
service, which stores the data in its own operational store. After a defined interval, the TFS data
warehouse will poll the belonging adapter, harvesting the metrics data and store it in its own
relational database and OLAP cube. This information is then used in one or several Excel reports to
be presented to the project manager.
To be able to map the correct set of code metrics data to the right Team Project, one has to have
some kind of identifier of the project added to the set of metrics data. Some trial and error
approaches made us finally end up with using a Team Foundation Build as the identifier. These builds
are artifacts containing compiled source code, test results and reports on the build status. This
means that when a developer shall report code metrics data for a module, he or she has to select the
corresponding build for which these data belongs to.
In the following chapters the implementation details for each part will be described.
5.3.1 Client Tier I – GUI for Visual Studio Team System Our GUI for VSTS is a Visual Studio Integration Package that is loaded into Visual Studio when it is
started. Under the menu View and submenu Other Windows our package Save Code Metrics is
available (see Figure 12).
DATA TIER APPLICATION
TIER
CLIENT TIER
Web Service
Figure 11. After (Microsoft, 2007). An overview of the intended architecture to solve the assigned task of extension.

Chapter 5 – Implementation
56
Figure 12. A Screenshot which shows where to find our client package implementation in Visual Studio 2008.
When a new integration package is created, it is possible to select additional functionality to be
included in the package. We chose to include functionality that made our package act as a Tool
Window, like the Solution Explorer in VSTS. An integration package can be developed in two different
programming languages; C++ and C#. Since our other solutions were implemented in C# and
guidelines for making Visual Studio packages were shown in the same programming language, it
became a natural choice to pick C# as the implementing language for the package.
From the early beginning we tried to extract all necessary information like project name and code
metrics data through Visual Studio itself, with the Visual Studio IDE (VSIDE) API. However, as a third-
party developer you are not able to access code metrics data that Visual Studio 2008 creates through
a VSIDE object. Therefore, we had no choice but to create a client GUI where the developer
(unfortunately) has to write in the code metrics values manually (see Figure 13).
Figure 13. The GUI in the client application. This window is launched from inside Visual Studio 2008.
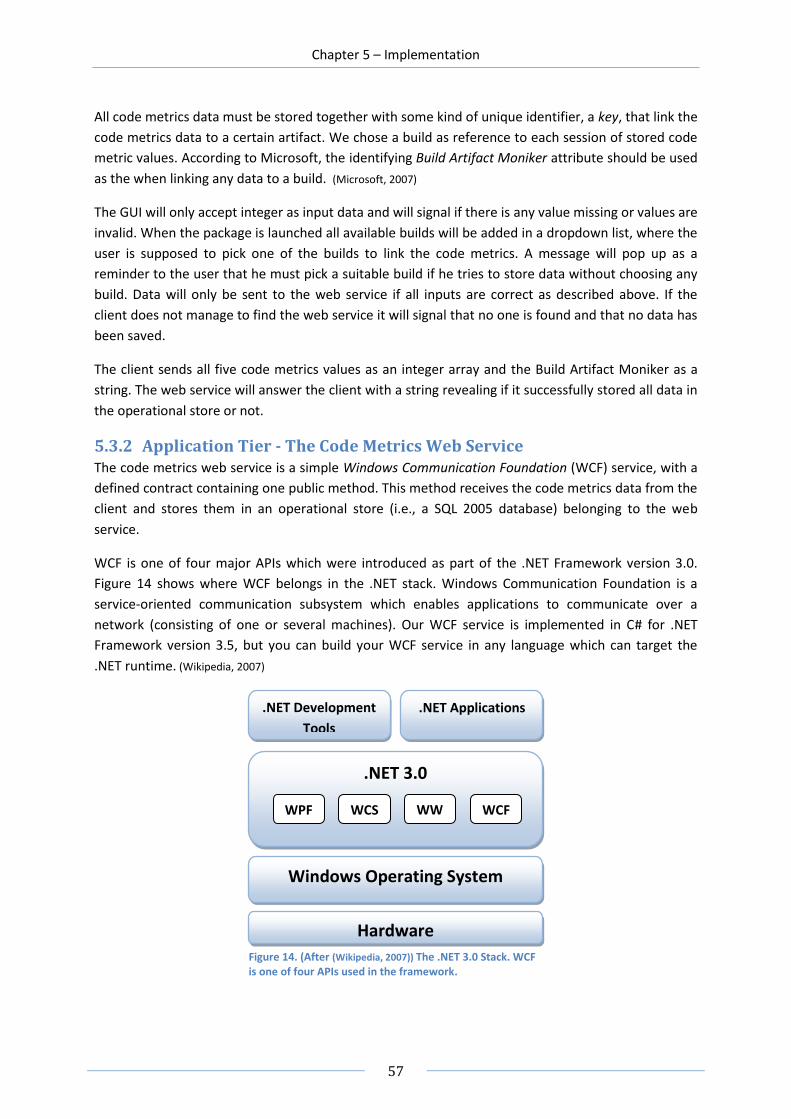
Chapter 5 – Implementation
57
All code metrics data must be stored together with some kind of unique identifier, a key, that link the
code metrics data to a certain artifact. We chose a build as reference to each session of stored code
metric values. According to Microsoft, the identifying Build Artifact Moniker attribute should be used
as the when linking any data to a build. (Microsoft, 2007)
The GUI will only accept integer as input data and will signal if there is any value missing or values are
invalid. When the package is launched all available builds will be added in a dropdown list, where the
user is supposed to pick one of the builds to link the code metrics. A message will pop up as a
reminder to the user that he must pick a suitable build if he tries to store data without choosing any
build. Data will only be sent to the web service if all inputs are correct as described above. If the
client does not manage to find the web service it will signal that no one is found and that no data has
been saved.
The client sends all five code metrics values as an integer array and the Build Artifact Moniker as a
string. The web service will answer the client with a string revealing if it successfully stored all data in
the operational store or not.
5.3.2 Application Tier - The Code Metrics Web Service The code metrics web service is a simple Windows Communication Foundation (WCF) service, with a
defined contract containing one public method. This method receives the code metrics data from the
client and stores them in an operational store (i.e., a SQL 2005 database) belonging to the web
service.
WCF is one of four major APIs which were introduced as part of the .NET Framework version 3.0.
Figure 14 shows where WCF belongs in the .NET stack. Windows Communication Foundation is a
service-oriented communication subsystem which enables applications to communicate over a
network (consisting of one or several machines). Our WCF service is implemented in C# for .NET
Framework version 3.5, but you can build your WCF service in any language which can target the
.NET runtime. (Wikipedia, 2007)
Hardware
Windows Operating System
.NET Development
Tools
.NET Applications
.NET 3.0
WCF WW
F
WCS WPF
Figure 14. (After (Wikipedia, 2007)) The .NET 3.0 Stack. WCF is one of four APIs used in the framework.
Chapter 5 – Implementation
58
The programming model WCF provides unifies several programming components such as service-
oriented programming, distributed transactions, web services, .NET remoting, message queues and
distributed computing. WCF provides the enhanced security model that all .NET applications provide,
and is run in a sandbox. (Wikipedia, 2007)
WCF uses SOAP messages for communication between processes. This makes WCF applications
interoperable with any other utility or application which uses SOAP as communication protocol. (Wikipedia, 2007)
A WCF service consists of three parts:
A service class
A host environment
One or more endpoints
The service class is the class which implements the service. The host environment is the environment
on which the web service resides (e.g., IIS). A WCF service must have at least one endpoint. It is the
endpoints that the clients utilize when communicating with WCF. One can regard the endpoint as the
WCF’s representative to the outer world.
The endpoints, in turn, specify a service contract which states what methods that are available to the
clients via that endpoint. The service contract is defined using .NET attributes. An address to the
service and information on what kind of binding (communication protocols, security mechanisms and
so forth) to be used by the clients are also specified at the endpoints. There are several ways to host
a WCF service. We host our web service on Microsoft Internet Information Services (IIS) so it can be
recognized and used by TFS.
To make a method publically available to clients, the method has to be marked with the .NET
attribute OperationContract.
The WCF web service consists of a directory containing two folders (App_Code and App_Data) and
two files (Service.svc and Web.config) in the root directory of the build. The Web.config contains
information about services provided (we are just using one service; CodeMetricsService), the
endpoints in use (in our case just one), and other configuration needed by IIS to manage the web
service correctly. The Service.svc file contains information about what language the service is
implemented in, if debugging is turned on or off, the name of the service and where the actual code
that performs the work is to be found.
The App_Data folder is not used by us, but could be used to store a local database. As for the folder
App_Code, it contains the source code files written in C#.
The folder containing all WCF files can be physically stored almost anywhere on the TFS installation
server, just as long as you give the folder appropriate permissions via the IIS control panel.
All metrics data is received in the web service and inserted into the operational store by using a
stored procedure called by C# code (see Appendix D for the C# code and Appendix E for the stored
procedure source code).
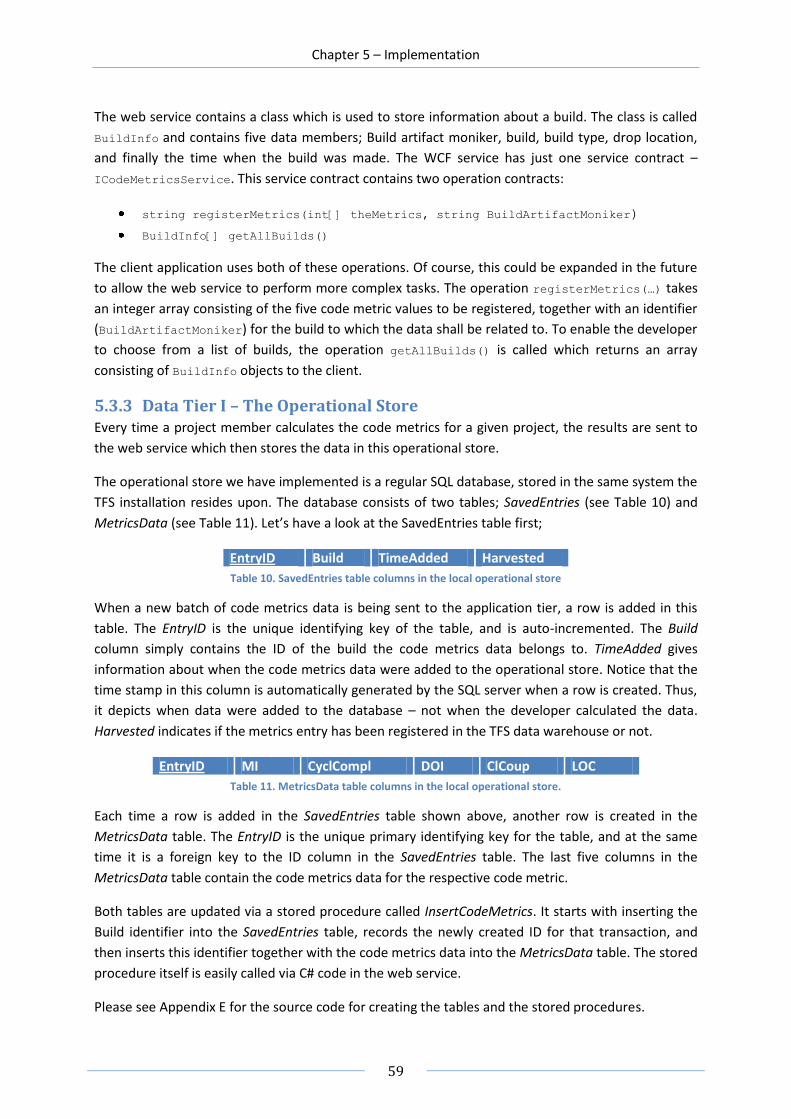
Chapter 5 – Implementation
59
The web service contains a class which is used to store information about a build. The class is called
BuildInfo and contains five data members; Build artifact moniker, build, build type, drop location,
and finally the time when the build was made. The WCF service has just one service contract –
ICodeMetricsService. This service contract contains two operation contracts:
string registerMetrics(int[] theMetrics, string BuildArtifactMoniker)
BuildInfo[] getAllBuilds()
The client application uses both of these operations. Of course, this could be expanded in the future
to allow the web service to perform more complex tasks. The operation registerMetrics(…) takes
an integer array consisting of the five code metric values to be registered, together with an identifier
(BuildArtifactMoniker) for the build to which the data shall be related to. To enable the developer
to choose from a list of builds, the operation getAllBuilds() is called which returns an array
consisting of BuildInfo objects to the client.
5.3.3 Data Tier I – The Operational Store Every time a project member calculates the code metrics for a given project, the results are sent to
the web service which then stores the data in this operational store.
The operational store we have implemented is a regular SQL database, stored in the same system the
TFS installation resides upon. The database consists of two tables; SavedEntries (see Table 10) and
MetricsData (see Table 11). Let’s have a look at the SavedEntries table first;
EntryID Build TimeAdded Harvested
Table 10. SavedEntries table columns in the local operational store
When a new batch of code metrics data is being sent to the application tier, a row is added in this
table. The EntryID is the unique identifying key of the table, and is auto-incremented. The Build
column simply contains the ID of the build the code metrics data belongs to. TimeAdded gives
information about when the code metrics data were added to the operational store. Notice that the
time stamp in this column is automatically generated by the SQL server when a row is created. Thus,
it depicts when data were added to the database – not when the developer calculated the data.
Harvested indicates if the metrics entry has been registered in the TFS data warehouse or not.
EntryID MI CyclCompl DOI ClCoup LOC
Table 11. MetricsData table columns in the local operational store.
Each time a row is added in the SavedEntries table shown above, another row is created in the
MetricsData table. The EntryID is the unique primary identifying key for the table, and at the same
time it is a foreign key to the ID column in the SavedEntries table. The last five columns in the
MetricsData table contain the code metrics data for the respective code metric.
Both tables are updated via a stored procedure called InsertCodeMetrics. It starts with inserting the
Build identifier into the SavedEntries table, records the newly created ID for that transaction, and
then inserts this identifier together with the code metrics data into the MetricsData table. The stored
procedure itself is easily called via C# code in the web service.
Please see Appendix E for the source code for creating the tables and the stored procedures.
Chapter 5 – Implementation
60
5.3.4 Data Tier II – Connecting the Operational Store to the Data Warehouse To extract the data from our operational store and insert it into the TFS data warehouse, there has to
be an adapter together with a XML-schema which describes and transforms the available data so it
will be useful in the OLAP database cube. As mentioned earlier, the data warehouse consists of
dimension and fact tables. As we are dealing with raw code metrics data that is supposed to be used
in statistical analysis, we are interested in objective facts. Therefore we have chosen to store all code
metrics data as a fact and not a dimension. In fact, we do not define any dimension at all.
We have one fact: Code Metrics. This fact has in turn five fields – one for every code metric in Visual
Studio 2008. Each field has a name, a type and an aggregate function; all types are integers and all
aggregate functions are sums. This is shown in the XML-schema depicted in Appendix F. Since the
code metrics data is designed to relate to a certain build, we have also defined a dimension use for
the fact. This can also be seen in Appendix F.
The adapter itself is a dynamic-link library (dll-file) that implements the IWarehouseAdapter
interface. It must implement four methods:
public void Initialize(IDataStore ds)
public SchemaChangesResult MakeSchemaChanges()
public DataChangesResult MakeDataChanges()
public void RequestStop()
The Initialize(…) method handles the connection to the Team Foundation Server, and initializes a
data store object which is used in the other three methods. MakeSchemaChanges() is a method that
is used to alter the XML-schema. It is this method that we use to alter the existing schema to add our
own fact table. To extract data from the operational store and into the data warehouse,
MakeDataChanges() is used. RequestStop() is a simple method which is called when the warehouse
needs to stop the adapters (e.g., to process the OLAP cube). Appendix F shows the source code for
the adapter.
5.3.5 Deployment The implementation has been performed in the environment of a virtual PC image (VPC) running
Windows Server 2003 with a full installation of Team Foundation Server and Visual Studio Team
System 2008. The implementation has been performed in parallel with the theoretical and empirical
research. All components have been tested and validated in isolation by themselves. However, the
full deployment of the whole solution has not succeeded. The main problem was to install the
adapter. It compiled well and even complied with the guidelines provided to us by Microsoft
professionals. Even so lack of time made it impossible for us to debug and trace the fault. The fact
that the API was very sparse made it even more difficult and time consuming to find the cause of the
error. In combination with the fact that the project calendar time were running short, we had to
concentrate our resources on finishing off this report (which were higher prioritized by all involved
parts) and thus had to stop the debugging.
However, we have seen other companies succeed with the installation of other adapters similar to
ours. Thus, we are certain that it is possible to deploy this solution.

Chapter 5 – Implementation
61
5.3.6 Client Tier II – Excel Reports Our goal with this practical part was that all code metrics data should be stored in the data
warehouse. To make use of the data in a tangible way for a project manager, the data has to be
processed and presented in some kind of report. Thus, we had the task to show how a Microsoft
Excel report template which illustrates the code metrics data might be implemented. In our case we
will illustrate how you could extract the code metrics data in data warehouse step by step. Since we
did not manage to deploy our solution, we will show the procedure of creating a report for Work
Items. Note that the steps taken would be exactly the same in the case of code metrics, with the
exception of other dimensions and fields being used.
To access the data one should perform the following instructions (this workflow is defined for
Microsoft Excel 2007, but it is rather similar to earlier versions of Excel):
1. Start Microsoft Excel 2007 and a new project.
2. Open the workbook where you want to create the PivotTable report.
3. On the Data tab, in the Get External Data group, click From Other Sources, and then click
From Analysis Services.
4. In Data Connection Wizard - Connect to Server, in the Server name box, type the name of
the Team Foundation Server data-tier server, and then click Next. You can either use
Windows Authentication or any other (valid) username and password to access the data.
5. In Data Connection Wizard - Select Database and Table, select the TFSWarehouse database,
select the Team System cube, and then click Next.
6. In Data Connection Wizard - Save Data Connection File and Finish, click Finish.
7. In Import Data, select PivotTable report, and click OK.
8. In the PivotTable Field List pane, in the Show fields related to: box, select a measure group
such as Current Work Item, and then select a measure such as Current Work item Count.
9. In the PivotTable Field List pane, drag a field such as Assigned To.Person to the Row Labels
box.
10. In the PivotTable Field List pane, drag a field such as Work Item.State to the Column Labels
box.
11. To filter the report, drag a field such as Area.Area into the Report Filter box, and then use
the dropdown that appears on the sheet to select the appropriate values.
12. Repeat steps 7, 8, and 9 until the worksheet is completed.
13. Save the workbook.
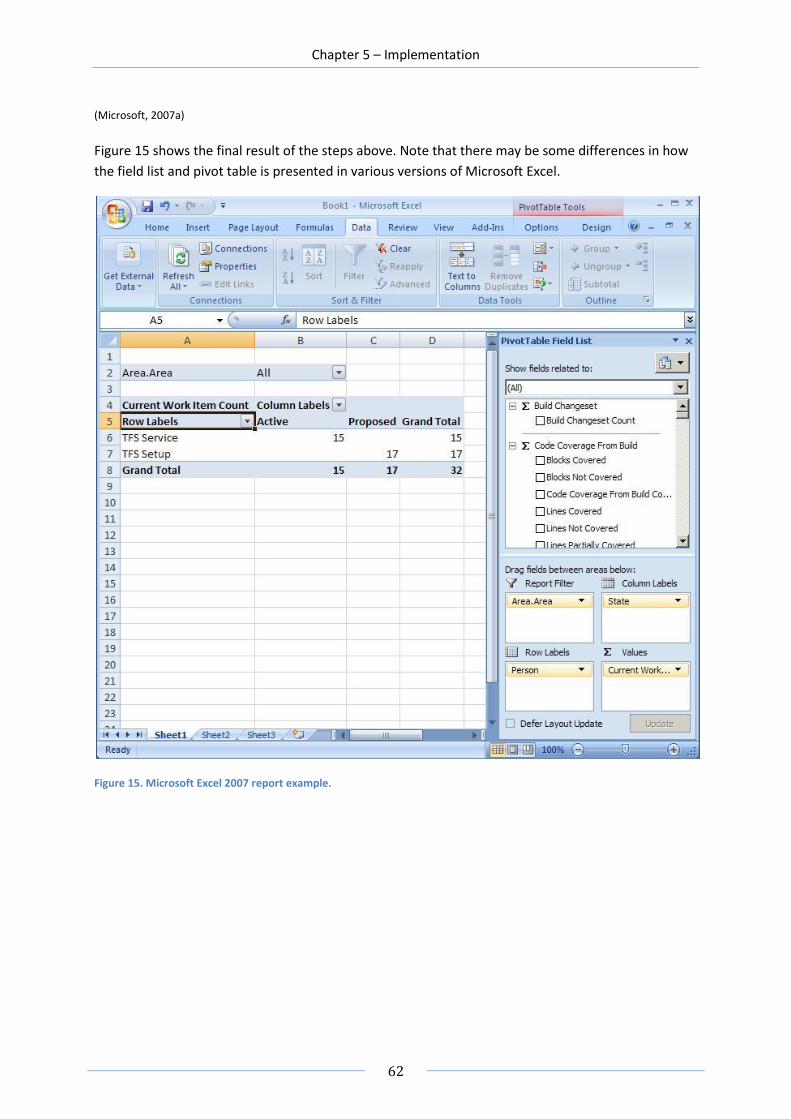
Chapter 5 – Implementation
62
(Microsoft, 2007a)
Figure 15 shows the final result of the steps above. Note that there may be some differences in how
the field list and pivot table is presented in various versions of Microsoft Excel.
Figure 15. Microsoft Excel 2007 report example.


PART III - RESULTS
Chapter 6 – Conclusions
Nothing travels faster than the speed of
light with the possible exception of bad
news, which obeys its own special laws.
- Douglas Adams,
The Hitchhiker’s Guide to the Galaxy
Chapter 6 – Conclusions
65
6 Conclusions
All good things must come to an end, so even this thesis project. After six months of intensive
research, empirical studies, and implementation it is time to wrap this master thesis up. This chapter
will summarize and conclude the findings in the analysis presented in chapter four.
6.1 Evaluation of the Code Metrics Feature in Visual Studio 2008 Results from the evaluation of the code metrics feature is presented in this part of the chapter. Every
research question is honored with its own subchapter.
6.1.1 In What Contexts Are The Code Metrics In Visual Studio 2008
Relevant And Useful (If Any)? Maintainability index is a code metrics that fit many contexts. Maintainability index is limited by
being a complex metric which requires experience to interpret. This code metric is best suited for
companies with a mature process model and experienced employees who are able to analyze and
deduce what possible poor values originates from.
Cyclomatic complexity is applicable in almost all contexts, because it is easy to interpret and improve.
Furthermore it is not restricted to programming languages. We think cyclomatic complexity is a
relevant code metric thanks to its broad usage area, theoretical affirmation, and its successful usage
during many years in the software industry.
Depth of inheritance and class coupling have a limitation. These are only applicable with projects that
use object-oriented languages, e.g., C# and C++. It is trivially obvious that these metrics are not
useful in projects where procedural programming languages are used.
According to the theory it is an invalid code metric in several contexts and not very useful per se. The
empirical result shows that if object-oriented programming languages are used then the LOC metric
is of no relevance at all. However, lines of code might prove to be useful when used as a policy
limiting the maximum allowed size of a module in the context of procedural programming languages.
This metric should however not be used by itself as a quality indicator.
6.1.2 What Are The Usage Areas For Code Metrics In Visual Studio 2008? We discovered some areas where the implemented code metrics could be useful and have a positive
effect on the QA work. For example, the metrics might be useful for a developer to analyze his own
implementation to establish how well-written his code actually is. Furthermore they can be used as
indicators aiding management in decision-making by providing solid facts on the properties of the
source code produced. Some companies relied on intuition to apprehend the code quality. In these
situations, the code metrics might assist by complementing with an objective point of view.
If one considered the extended code metrics feature implemented by the authors (i.e., allowing
historical code metrics data to be saved) it might prove very useful when evaluating earlier projects.
This was also considered the main usage area of code metrics according to the interviewed project
managers.

Chapter 6 – Conclusions
66
6.1.3 Is Historical Code Metrics Data Of Any Importance? We concluded that there is a market demand on keeping and viewing historical code metrics data. As
mentioned in the theoretical framework, one of the purposes with software metrics is to ‘Encourage
improvement of project processes’. Without historical data on code metrics, you are not able to map
poor (or for that matter positive) values to decisions made under the development process. This
implies that it is difficult to conclude what effects certain decisions have had on the quality of the
product without these historical facts. Thus, for the sake of evaluating earlier projects historical data
on code metrics is a necessity. Even analyzing current trends will be difficult (if not impossible)
without historical data available.
6.1.4 What Are Reasonable Thresholds On The Implemented Code Metrics
In Visual Studio 2008? Code metrics should be a complement to the team’s experience and ‘gut feelings’. Since none of the
interviewed companies kept any statistical data or documented thresholds on any of the
implemented code metrics, we had to rely solely on the theoretical findings to acquire recommended
thresholds and interpretations for each and every one of them. There are no industry standards on
threshold values for any of the code metrics except cyclomatic complexity which has an industry-
accepted threshold of 10. A cyclomatic complexity value of 20 is acceptable though, but higher values
might make the logical complexity of the artifact too great.
Maintainability index has a recommended lower limit of 65 (remember that the scale goes from 0-
100, where 0 is considered worst). Artifacts exhibiting maintainability index lower than 65 suffer
from poor maintainability. We believe the intervals developed by HP should be used since they rely
on a heavy basis of research and practical experience.
Depth of inheritance and class coupling should be at most 5. Finally, lines of code should be at most
100 lines per module if considering procedural programming languages only.
Table 12 below summarizes the recommended thresholds found for each code metric in Visual
Studio 2008.
Metric Recommended Threshold
Maintainability index 65
cyclomatic complexity 10
Depth of inheritance 5
Class coupling 5
(Lines of Code)/module 10017 Table 12. Recommended thresholds for the code metrics in Visual Studio 2008
17
Applicable to procedural programming languages only.
Chapter 6 – Conclusions
67
6.1.5 How Should One Remedy Poor Values Of Code Metrics In Visual Studio
2008? For each and every one of the code metrics in Visual Studio 2008, there are ways to remedy poor
values. It is obvious that all remedies require knowledge of how the metric in question is measured
or calculated. Without this knowledge, one cannot conclude the cause of poor values.
Maintainability index is a composite code metric, constructed by the use of cyclomatic complexity,
Halstead volume and lines of code. This index can be improved by altering any of these elements.
The Halstead volume is not trivial to improve since it depends on the total and distinct number of
operators and operands. The number of distinct operators and operands is static and depends on
programming language used. However, by minimizing the total number of occurrences of operands
and operators one is able to reduce the Halstead volume. A much easier way is to try to reduce the
cyclomatic complexity or lines of code.
Cyclomatic complexity is one of the simplest code metrics to improve. A basic idea is to extract logic
into a new function (module) and make calls to this function (module). Another way to reduce a high
cyclomatic complexity value can be accomplished by restructuring how the code evaluates, but it
may be rather hard to accomplish. Remedy for too high values of lines of code is to refactor the code
to reduce the number of lines.
We did not find any explicit recommended practices for decreasing class coupling, but our own
recommendations are to either redesign the architecture or (if possible) extract the necessary
functionality from the dependent module into the class under measurement.
The remedy for too deep inheritance levels is to either combine classes or cut the inheritance chain
entirely by creating an independent new class.
We would like to add that improving poor code metric values should not be a purpose in itself –
improvements should just be performed with the purpose of reaching a clearly stated quality goal.


PART III - RESULTS
Chapter 7 – Discussion
I disapprove of what you say, but I will
defend to the death your right to say it.
- Evelyn Beatrice Hall,
The Friends of Voltaire, 1906

Chapter 6 – Conclusions
70
7 Discussion
This chapter will discuss the relevance and validity of the result, concluded in chapter 6. It will also
provide the reader with the authors’ personal opinions regarding code metrics in general, and the
findings in particular.
7.1 Discussion of the Results To measure software quality in an automatic way from planning and design to a complete product is
a must for the software industry if it is to be regarded as a true engineering discipline. Software
metrics are a structured way to predict and maintain high quality on products and processes.
Microsoft has implemented some parts of the software metrics concepts like a rich test environment
and the new automated code metrics feature which is the core subject of this master thesis.
One has to consider that the metrics evaluated in this thesis is purely code metrics. It is important
not to neglect that there are other important software metrics in categories left untouched, e.g., for
measuring productivity, processes, requirements and more. To establish the right level of quality one
have to see the whole picture and not isolate ones perspective to just code metrics. QA work is much
more than measuring, but measurement is the building block for asserting correct quality.
Many of these other metrics are already available in TFS, e.g., number of changes to a module, code
churn, by whom and when changes have been made, test results and more. Perhaps one should
make use of subjective opinions too and allow these to be entered into the data warehouse. Then
these subjective measurements could be aggregated and weighted together with objective
measurements to indicate the project’s health.
Performing the correct measurements for a software engineering project is just the first step. The
difficult part is interpreting the results and taking the correct actions to assure a certain level of
quality (which in turn requires you to have some clear quality goals).
There are resources out there which try to interpret code metric values and set recommended
thresholds. For example, you have a rather popular tool called NDepend18 which is a tool that helps
you manage .NET source code. Code metrics is one of many features implemented in this tool. It not
only calculates the metrics for your code base, it also gives you recommended thresholds on most of
the metrics provided19. We think that guidelines like these can be good hints but should not be strict
rules for how you interpret the code metrics values. A good way to go would probably be to use the
recommended thresholds as a base and then calibrate them according to your current project and
your quality goals.
In most cases it is not just enough to measure code metrics to establish the health of a project. As
shown in earlier chapters it may be significantly useful to utilize subjective opinions as a complement
to the metrics, since one can extract valuable information from such sources. But what is one
supposed to do when the intuition of the developer deviates from what the code metrics are telling? 18
www.ndepend.com 19
http://www.ndepend.com/Metrics.aspx
Chapter 6 – Conclusions
71
In these cases it may be hard to trust the metrics, especially if they recently have been introduced
into the organization.
It seems like Microsoft has emphasized code metrics for object-oriented programming languages in
their code metrics feature, since all of them except LOC are useful for these kinds of languages
according to our conclusions. Two of them (class coupling and depth of inheritance) are even limited
to just these languages. If these types of languages were the ones Microsoft had in mind when
implementing the code metrics (which probably is the case since most projects developed in Visual
Studio are object-oriented, e.g., using C# or VB.NET) it is rather strange that LOC is one of the metrics
included since its usefulness in this context is very limited. We have a feeling with our research in
mind that LOC was included without a direct purpose, except showing some statistics – statistics
which are not very useful or helpful.
Since LOC is considered invalid under certain conditions, it will have an impact on other composite
metrics having LOC as a building factor, e.g., maintainability index as we have seen in chapter 4.1.
However, maintainability index calculated as described in chapter 2.4.1.2 has also been proved to
actually work. This means that when using composite metrics, one should be very observant to what
building blocks this composite metric consists of. You cannot blindly trust the code metrics without
assessing your current situation and what goals you have for your measurement program. One
reason why LOC is not applicable to a wider extent for object-oriented languages may be that these
languages encapsulates the code in a whole different manner than procedural programming
languages are able to do.
The QA management at the organization must make sure that there are clear goals with the
measurement program and that the correct code metrics are used. Just using metrics without stating
clear goals will not help the organization improve its quality on processes or products.
The code metrics feature would benefit, in our opinion, from a wider set of metrics. One metric that
we think would be useful is tree impurity (described in chapter 2.4.1.3). Since it apparently is one of
the few design metrics that has been verified on real projects it could definitely be of interest.
Since the purpose of the thesis changed drastically when rather long time already had passed, we
had to exclude some parts that we originally wished to perform. For example, we wanted to
interview more project managers at other companies to get a more solid foundation to the results of
the empirical study. The time was not sufficient though to allow this.
7.2 Extension of the Code Metrics feature The responses we got regarding our extension of the code metrics feature were varied among the
visited companies. While most of them thought the idea was good, some of them (company B and C)
had a hard time finding a useful area for such a feature. The rationale was that it is too difficult to
change an on-going development process based on this type of statistics. The other companies saw a
direct usefulness in such an extension – to view trends and changes under the development process.
We agree on both these issues. It is difficult to change an on-going process, especially if it is deeply
rooted in the organization. The historical metrics data will probably not help much in an ongoing
project (this is even more true nowadays since both monetary and time margins has decreased
Chapter 6 – Conclusions
72
considerably), but it will provide a solid foundation to evaluate earlier projects – and from there
perform appropriate process changes. How are you supposed to evaluate a project if you do not have
any measurements to look at?
As time ran short in combination with the fact that we did not have access to the source code of the
already existing code metrics feature in Visual Studio 2008, we were not able to fully automate the
harvesting of the code metrics data. If an automation would have been accomplished, an additional
required property would have been fulfilled for the whole set of metrics (No independent data
collection would not be a problem anymore).
We were not able to conclude why the deployment of our solution was unsuccessful. It may be due
to the fact that development was performed against a beta version of TFS 2008. The lack of API
documentation made it even harder to analyze possible shortcomings.
The implemented extension is important to make the code metrics feature more useful for project
analysis and quality control. However, it is not vital for software engineering projects developed in
the Team System environment. The solution should be regarded as an aiding tool.
7.3 Future Work As of today there is no automated historical code metrics data collection in Visual Studio. The beta
version of Visual Studio 2008 does not allow developers to extract generated code metrics data. This
was one of the problems we had when implementing our extended feature. Since there was no way
to get hold of the generated metrics data, we had to implement a solution which requires the
developer to manually enter the data in the client. This is not a preferred solution due to two facts:
metrics data need to be harvested automatically and the developer might enter incorrect data (the
human error is exceptionally present here). An automation of the harvesting procedure in the
extended code metrics feature is of great interest since it will satisfy one of the required properties
of the code metrics.
The original (now obsolete) purpose of this master thesis project was to evaluate which code metrics
were useful in a specific context. It requires a lot of experience to decide which quality factors that
should be used and also select adequate code metrics that actually measures these quality factors.
Another suggestion for future work is thus to evaluate which code metrics are suited for different
project types.
Since we were not able to determine if the set of code metrics provided in Visual Studio 2008 is
“reflecting the customers’ needs”, it could be of interest to investigate if they fulfill this property or
not.
Visual Studio 2008 has only five code metrics implemented, and two of them are solely applicable for
object-oriented languages. As far as we have understood, the purpose of not adding more was to not
overwhelm the developer with scores of various code metrics. But we think there might be a need to
choose among more code metrics to modify the metrics used after the current project’s needs.
While it sure is important to measure and verify the quality of software products, processes and
resources, it is just as important to interpret the values and take correct actions for quality

Chapter 6 – Conclusions
73
improvement. Thus, a suggestion for future work is to extend Visual Studio 2008 with tips and
automated mechanisms to remedy poor code metric values.
If someone were to continue our work in any way, the authors hope that the findings presented in
this thesis will be of assistance. There is still much research to do before the subject of code metrics
is exhausted.


PART IV - EPILOGUE
Appendices
The advantage of the emotions is that they
lead us astray, and the advantage of
science is that it is not emotional.
- Oscar Wilde,
The Picture of Dorian Gray, 1891
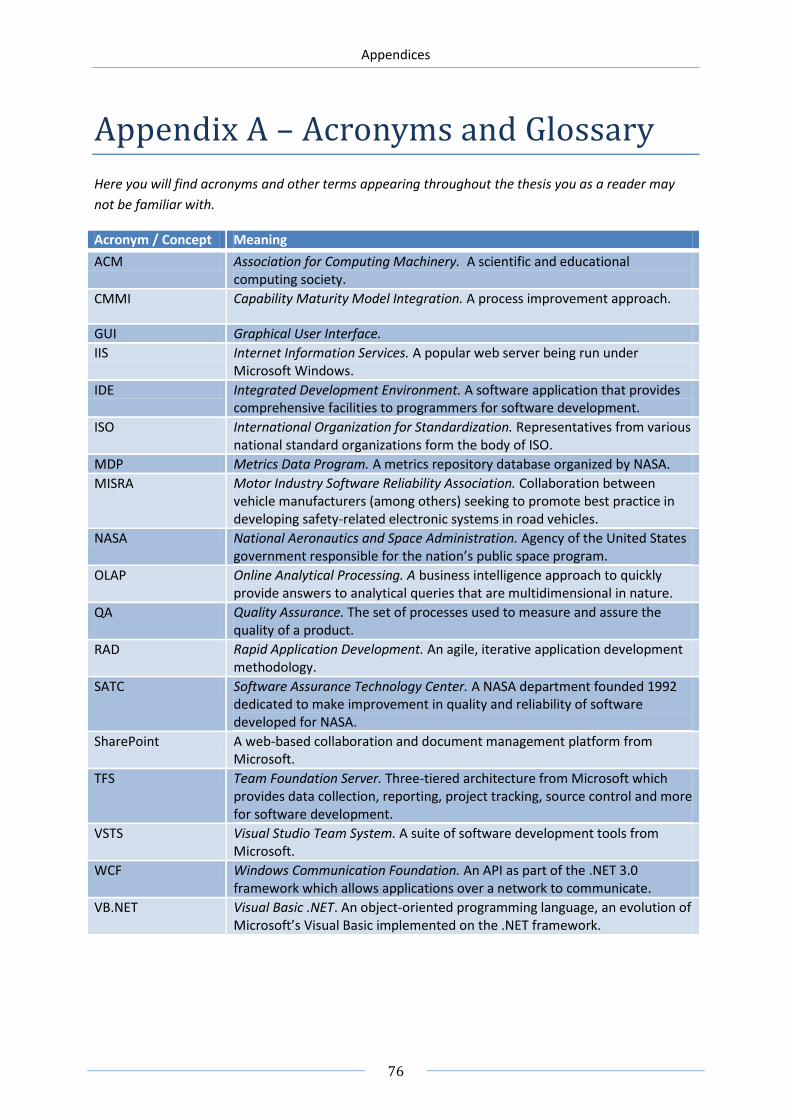
Appendices
76
Appendix A – Acronyms and Glossary
Here you will find acronyms and other terms appearing throughout the thesis you as a reader may
not be familiar with.
Acronym / Concept Meaning
ACM Association for Computing Machinery. A scientific and educational computing society.
CMMI Capability Maturity Model Integration. A process improvement approach.
GUI Graphical User Interface.
IIS Internet Information Services. A popular web server being run under Microsoft Windows.
IDE Integrated Development Environment. A software application that provides comprehensive facilities to programmers for software development.
ISO International Organization for Standardization. Representatives from various national standard organizations form the body of ISO.
MDP Metrics Data Program. A metrics repository database organized by NASA.
MISRA Motor Industry Software Reliability Association. Collaboration between vehicle manufacturers (among others) seeking to promote best practice in developing safety-related electronic systems in road vehicles.
NASA National Aeronautics and Space Administration. Agency of the United States government responsible for the nation’s public space program.
OLAP Online Analytical Processing. A business intelligence approach to quickly provide answers to analytical queries that are multidimensional in nature.
QA Quality Assurance. The set of processes used to measure and assure the quality of a product.
RAD Rapid Application Development. An agile, iterative application development methodology.
SATC Software Assurance Technology Center. A NASA department founded 1992 dedicated to make improvement in quality and reliability of software developed for NASA.
SharePoint A web-based collaboration and document management platform from Microsoft.
TFS Team Foundation Server. Three-tiered architecture from Microsoft which provides data collection, reporting, project tracking, source control and more for software development.
VSTS Visual Studio Team System. A suite of software development tools from Microsoft.
WCF Windows Communication Foundation. An API as part of the .NET 3.0 framework which allows applications over a network to communicate.
VB.NET Visual Basic .NET. An object-oriented programming language, an evolution of Microsoft’s Visual Basic implemented on the .NET framework.

Appendices
77
Appendix B – Interview questions
These are the questions the authors used during the interviews.
What business sector does your company operate in?
What type of applications do you develop?
Which is more common; projects for maintaining existing products or developing new ones?
How big is the company?
How large are the projects? (time, people involved, etc)
What process models do you use? (Agile, waterfall…)
What programming languages do you use?
Tell us about the quality assurance procedures you have at the company
o What do you do?
o How is it done?
o Do you have any thresholds on acceptable levels?
How do you manage process changes? Do you keep account of statistical data when the
processes changes? For example, how long it takes from that a change is proposed until the
proposer gets an answer?
Do you use any code metrics today in the company?
o If yes; which ones?
o What do you use them for? To what purpose?
o How do you do it? Automatically or manual?
Do you follow any coding standards, design rules or guidelines when coding?
Do you reuse old code? (Inheritance)
What do you think there are for pros and cons when using inheritance? (e.g. making new
modules inherit from old legacy modules)
When creating new classes / modules, do you have any programming policy that limits the
size of the module? For example, limiting the lines of code to make the module easier to
understand / read?
Do you find any of these code metrics useful:
o Maintainability Index
o Cyclomatic Complexity
o Depth of Inheritance
o Class Coupling
o Lines Of Code
Do you find any of those especially irrelevant or unnecessary?
Do you see any benefits from using a product that would be similar to ours? Can you think of
something that's missing for it to be useful in your organization?

Appendices
78
Appendix C – Source Code For The Client Application
using System;
using System.Collections;
using System.ComponentModel;
using System.Drawing;
using System.Data;
using System.Windows.Forms;
using System.Runtime.InteropServices;
namespace HolmHaag.cmPackage
{
public partial class MyControl : UserControl
{
//Connect to webService
ServiceReference.CodeMetricsServiceClient proxy = new
ServiceReference.CodeMetricsServiceClient();
public MyControl()
{
InitializeComponent();
//Set comboBox alternative
setComboBox();
}
protected override bool ProcessDialogChar(char charCode)
{
// If we're the top-level form or control, we need
to do the mnemonic handling
if (charCode != ' ' && ProcessMnemonic(charCode))
{
return true;
}
return base.ProcessDialogChar(charCode);
}
private void Button_Click(object sender, EventArgs e)
{
int[] message = new int[5];
string buildArtifactMonikar = "";
bool okToSendCodeMetrics = true;
//Parse Maintainablility value
try
{
message[0] = int.Parse(textBox1.Text);
}
catch
{
MessageBox.Show("Not a valid Maintainability Index value");
okToSendCodeMetrics = false;
}
//Parse Cyclomatic Complexity
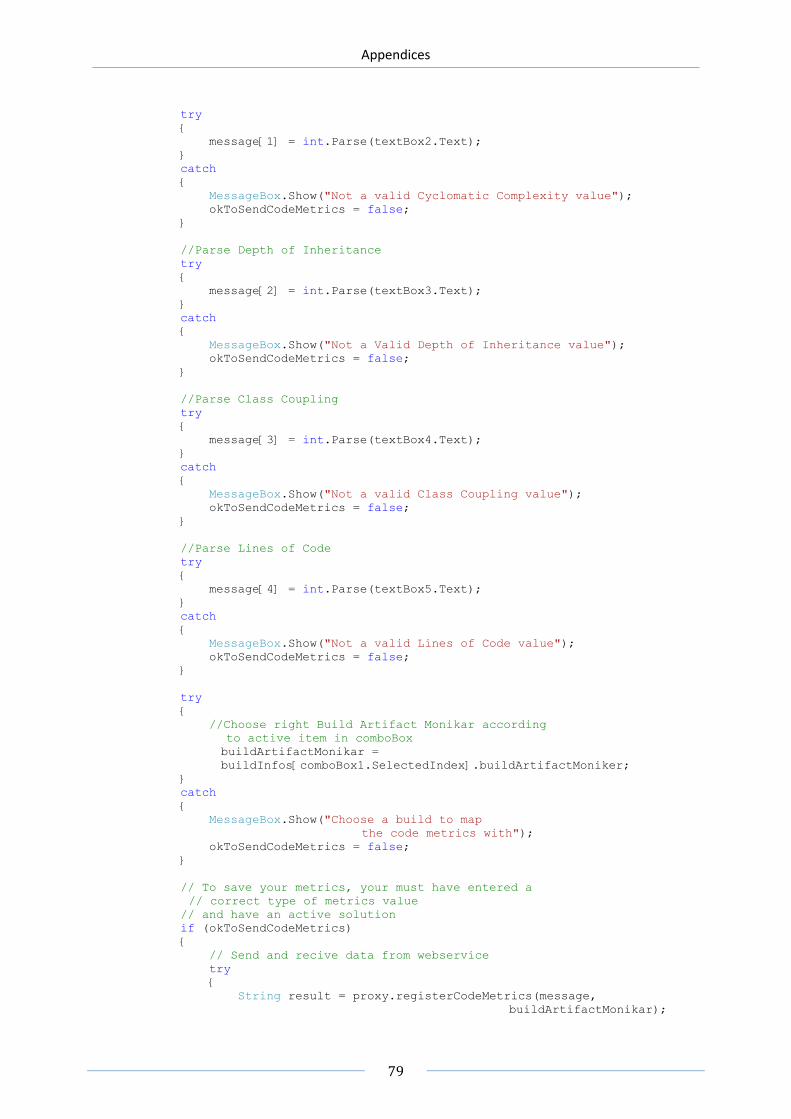
Appendices
79
try
{
message[1] = int.Parse(textBox2.Text);
}
catch
{
MessageBox.Show("Not a valid Cyclomatic Complexity value");
okToSendCodeMetrics = false;
}
//Parse Depth of Inheritance
try
{
message[2] = int.Parse(textBox3.Text);
}
catch
{
MessageBox.Show("Not a Valid Depth of Inheritance value");
okToSendCodeMetrics = false;
}
//Parse Class Coupling
try
{
message[3] = int.Parse(textBox4.Text);
}
catch
{
MessageBox.Show("Not a valid Class Coupling value");
okToSendCodeMetrics = false;
}
//Parse Lines of Code
try
{
message[4] = int.Parse(textBox5.Text);
}
catch
{
MessageBox.Show("Not a valid Lines of Code value");
okToSendCodeMetrics = false;
}
try
{
//Choose right Build Artifact Monikar according
to active item in comboBox
buildArtifactMonikar =
buildInfos[comboBox1.SelectedIndex].buildArtifactMoniker;
}
catch
{
MessageBox.Show("Choose a build to map
the code metrics with");
okToSendCodeMetrics = false;
}
// To save your metrics, your must have entered a
// correct type of metrics value
// and have an active solution
if (okToSendCodeMetrics)
{
// Send and recive data from webservice
try
{
String result = proxy.registerCodeMetrics(message,
buildArtifactMonikar);

Appendices
80
MessageBox.Show(result);
}
catch
{
MessageBox.Show("No web service is found
and no data has been stored!");
}
}
}
private void setComboBox()
{
try
{
//Add all buildId to comboBox
foreach (HolmHaag.cmPackage.localhost.BuildInfo
buildInfo in buildInfos)
{
comboBox1.Items.Add(buildInfo.build);
}
}
catch(Exception ex)
{
MessageBox.Show("No web service is found and no
data has been stored!");
}
}
private void textBox1_TextChanged(object sender, EventArgs e)
{
}
private void textBox2_TextChanged(object sender, EventArgs e)
{
}
private void textBox3_TextChanged(object sender, EventArgs e)
{
}
private void textBox4_TextChanged(object sender, EventArgs e)
{
}
private void textBox5_TextChanged(object sender, EventArgs e)
{
}
private void MyControl_Load(object sender, EventArgs e)
{
}
private void comboBox1_SelectedIndexChanged(object sender, EventArgs e)
{
}
}
}

Appendices
81
Appendix D – Source Code for the Web Service
ICodeMetricsService.cs using System;
using System.Collections.Generic;
using System.Linq;
using System.Runtime.Serialization;
using System.ServiceModel;
using System.Text;
// A WCF service consists of a contract (defined below as IService).
[ServiceContract]
public interface ICodeMetricsService
{
[OperationContract]
string registerCodeMetrics(int[] theMetrics, string buildArtifactMoniker);
[OperationContract]
BuildInfo[] getAllBuilds();
}
[DataContract]
public class BuildInfo
{
[DataMember]
private string buildArtifactMoniker;
[DataMember]
private string build;
[DataMember]
private string buildType;
[DataMember]
private string dropLocation;
[DataMember]
private string buildStartTime;
public string BuildArtifactMoniker
{
get { return buildArtifactMoniker; }
set { buildArtifactMoniker = value; }
}
public string Build
{
get { return build; }
set { build = value; }
}
public string BuildType
{
get { return buildType; }
set { buildType = value; }
}
public string DropLocation
{
get { return dropLocation; }
set { dropLocation = value; }
}

Appendices
82
public string BuildStartTime
{
get { return buildStartTime; }
set { buildStartTime = value; }
}
}
CodeMetricsService.cs using System;
using System.Collections.Generic;
using System.Linq;
using System.Runtime.Serialization;
using System.ServiceModel;
using System.Text;
using System.Data.SqlClient;
using System.Data; //To access the CodeMetricsDB
using System.Collections; //For ArrayList when getting a list of available Builds
/* a class which implements IService (see Service),
* and configuration entries that specify behaviors associated with
* that implementation (see <system.serviceModel> in web.config)*/
public class CodeMetricsService : ICodeMetricsService
{
// CHANGE TO FALSE WHEN DEPLOYING
private bool underDevelopment = false;
private string connstring;
//CONSRUCTOR
public CodeMetricsService()
{
if (underDevelopment)
{
connstring = "Data Source=.\\SQLEXPRESS;" +
"Database=CMDB;" +
"Integrated Security=true;";
}
else
{
connstring = "Data Source=TFSRTM08;" +
"Database=CMDB;" +
"Integrated Security=true;";
}
}
public string registerCodeMetrics(int[] theMetrics, string
buildArtifactMoniker)
{
if (true) //Here can checks for error be performed.
{
SqlConnection conn = new SqlConnection(connstring);
try
{
conn.Open();
}
catch (Exception e)
{
return "Couldn't connect: " + e.ToString();
}
// Try to insert the metrics into the DB
try
{
SqlCommand command = new SqlCommand("InsertCodeMetrics", conn);
command.CommandType = CommandType.StoredProcedure;

Appendices
83
command.Parameters.Add("@MI", SqlDbType.Int).Value = theMetrics[0];
command.Parameters.Add("@CyclComp", SqlDbType.Int).Value =
theMetrics[1];
command.Parameters.Add("@DoI", SqlDbType.Int).Value =
theMetrics[2];
command.Parameters.Add("@ClCoup", SqlDbType.Int).Value =
theMetrics[3];
command.Parameters.Add("@LOC", SqlDbType.Int).Value =
theMetrics[4];
command.Parameters.Add("@BuildArtifactMoniker",
SqlDbType.VarChar).Value = buildArtifactMoniker;
command.ExecuteNonQuery();
conn.Close();
return "OK"; //Values successfully added.
}
catch(Exception e)
{
return "Couldn't insert: " + e.ToString();
}
}
else
{
return "Something went wrong....";
}
}
public BuildInfo[] getAllBuilds()
{
connstring = "Data Source=TFSRTM08;" +
"Database=TfsWarehouse;" +
"Integrated Security=true;";
SqlConnection conn = new SqlConnection(connstring);
try
{
conn.Open();
}
catch (Exception e)
{
BuildInfo[] result = new BuildInfo[1];
result[0].Build = e.ToString();
return result;
}
//try to read from the DB
try
{
SqlDataReader myReader = null;
SqlCommand myCommand = new SqlCommand("select * from Build", conn);
myReader = myCommand.ExecuteReader();
ArrayList listOfBuilds = new ArrayList();
BuildInfo tempBuildObject;
while (myReader.Read())
{
tempBuildObject = new BuildInfo();
tempBuildObject.Build = myReader["Build"].ToString();
tempBuildObject.BuildArtifactMoniker = myReader["Build Artifact
Moniker"].ToString();
tempBuildObject.BuildStartTime = myReader["Build Start
Time"].ToString();
tempBuildObject.BuildType = myReader["Build Type"].ToString();
tempBuildObject.DropLocation = myReader["Drop
Location"].ToString();

Appendices
84
listOfBuilds.Add(tempBuildObject);
}
conn.Close();
int numberOfBuildsFound = listOfBuilds.Count;
BuildInfo[] result = new BuildInfo[numberOfBuildsFound];
for (int i = 0; i < numberOfBuildsFound; ++i)
{
result[i] = (BuildInfo)listOfBuilds[i];
}
return result;
}
catch (Exception e)
{
BuildInfo[] result = new BuildInfo[1];
result[0].Build = e.ToString();
return result;
}
}
}
Web.config <?xml version="1.0"?>
<!--
Note: As an alternative to hand editing this file you can use the
web admin tool to configure settings for your application. Use
the Website->Asp.Net Configuration option in Visual Studio.
A full list of settings and comments can be found in
machine.config.comments usually located in
\Windows\Microsoft.Net\Framework\v2.x\Config
-->
<configuration>
<configSections>
<sectionGroup name="system.web.extensions"
type="System.Web.Configuration.SystemWebExtensionsSectionGroup,
System.Web.Extensions, Version=3.5.0.0, Culture=neutral,
PublicKeyToken=31BF3856AD364E35">
<sectionGroup name="scripting"
type="System.Web.Configuration.ScriptingSectionGroup, System.Web.Extensions,
Version=3.5.0.0, Culture=neutral, PublicKeyToken=31BF3856AD364E35">
<section name="scriptResourceHandler"
type="System.Web.Configuration.ScriptingScriptResourceHandlerSection,
System.Web.Extensions, Version=3.5.0.0, Culture=neutral,
PublicKeyToken=31BF3856AD364E35" requirePermission="false"
allowDefinition="MachineToApplication"/>
<sectionGroup name="webServices"
type="System.Web.Configuration.ScriptingWebServicesSectionGroup,
System.Web.Extensions, Version=3.5.0.0, Culture=neutral,
PublicKeyToken=31BF3856AD364E35">
<section name="jsonSerialization"
type="System.Web.Configuration.ScriptingJsonSerializationSection,
System.Web.Extensions, Version=3.5.0.0, Culture=neutral,
PublicKeyToken=31BF3856AD364E35" requirePermission="false"
allowDefinition="Everywhere" />
<section name="profileService"
type="System.Web.Configuration.ScriptingProfileServiceSection,
System.Web.Extensions, Version=3.5.0.0, Culture=neutral,
PublicKeyToken=31BF3856AD364E35" requirePermission="false"
allowDefinition="MachineToApplication" />

Appendices
85
<section name="authenticationService"
type="System.Web.Configuration.ScriptingAuthenticationServiceSection,
System.Web.Extensions, Version=3.5.0.0, Culture=neutral,
PublicKeyToken=31BF3856AD364E35" requirePermission="false"
allowDefinition="MachineToApplication" />
<section name="roleService"
type="System.Web.Configuration.ScriptingRoleServiceSection, System.Web.Extensions,
Version=3.5.0.0, Culture=neutral, PublicKeyToken=31BF3856AD364E35"
requirePermission="false" allowDefinition="MachineToApplication" />
</sectionGroup>
</sectionGroup>
</sectionGroup>
</configSections>
<appSettings/>
<connectionStrings/>
<system.web>
<!--
Set compilation debug="true" to insert debugging
symbols into the compiled page. Because this
affects performance, set this value to true only
during development.
-->
<compilation debug="true">
<assemblies>
<add assembly="System.Core, Version=3.5.0.0, Culture=neutral,
PublicKeyToken=B77A5C561934E089"/>
<add assembly="System.Xml.Linq, Version=3.5.0.0, Culture=neutral,
PublicKeyToken=B77A5C561934E089"/>
<add assembly="System.Web.Extensions, Version=3.5.0.0, Culture=neutral,
PublicKeyToken=31BF3856AD364E35"/>
<add assembly="System.Data.DataSetExtensions, Version=2.0.0.0,
Culture=neutral, PublicKeyToken=B77A5C561934E089"/>
</assemblies>
</compilation>
<!--
The <authentication> section enables configuration
of the security authentication mode used by
ASP.NET to identify an incoming user.
-->
<authentication mode="Windows" />
<!--
The <customErrors> section enables configuration
of what to do if/when an unhandled error occurs
during the execution of a request. Specifically,
it enables developers to configure html error pages
to be displayed in place of a error stack trace.
<customErrors mode="RemoteOnly" defaultRedirect="GenericErrorPage.htm">
<error statusCode="403" redirect="NoAccess.htm" />
<error statusCode="404" redirect="FileNotFound.htm" />
</customErrors>
-->
<pages>
<controls>
<add tagPrefix="asp" namespace="System.Web.UI"
assembly="System.Web.Extensions, Version=3.5.0.0, Culture=neutral,
PublicKeyToken=31BF3856AD364E35"/>
</controls>
</pages>

Appendices
86
<httpHandlers>
<remove verb="*" path="*.asmx"/>
<add verb="*" path="*.asmx" validate="false"
type="System.Web.Script.Services.ScriptHandlerFactory, System.Web.Extensions,
Version=3.5.0.0, Culture=neutral, PublicKeyToken=31BF3856AD364E35"/>
<add verb="*" path="*_AppService.axd" validate="false"
type="System.Web.Script.Services.ScriptHandlerFactory, System.Web.Extensions,
Version=3.5.0.0, Culture=neutral, PublicKeyToken=31BF3856AD364E35"/>
<add verb="GET,HEAD" path="ScriptResource.axd"
type="System.Web.Handlers.ScriptResourceHandler, System.Web.Extensions,
Version=3.5.0.0, Culture=neutral, PublicKeyToken=31BF3856AD364E35"
validate="false"/>
</httpHandlers>
<httpModules>
<add name="ScriptModule" type="System.Web.Handlers.ScriptModule,
System.Web.Extensions, Version=3.5.0.0, Culture=neutral,
PublicKeyToken=31BF3856AD364E35"/>
</httpModules>
</system.web>
<system.codedom>
<compilers>
<compiler language="c#;cs;csharp" extension=".cs"
type="Microsoft.CSharp.CSharpCodeProvider, System, Version=2.0.0.0,
Culture=neutral, PublicKeyToken=b77a5c561934e089">
<providerOption name="CompilerVersion" value="v3.5"/>
</compiler>
<compiler language="vb;vbs;visualbasic;vbscript" extension=".vb"
compilerOptions="/optioninfer+"
type="Microsoft.VisualBasic.VBCodeProvider, System,
Version=2.0.0.0, Culture=neutral, PublicKeyToken=b77a5c561934e089">
<providerOption name="CompilerVersion" value="v3.5"/>
</compiler>
</compilers>
</system.codedom>
<!--
The system.webServer section is required for running ASP.NET AJAX under
Internet
Information Services 7.0. It is not necessary for previous version of IIS.
-->
<system.webServer>
<validation validateIntegratedModeConfiguration="false"/>
<modules>
<add name="ScriptModule" preCondition="integratedMode"
type="System.Web.Handlers.ScriptModule, System.Web.Extensions, Version=3.5.0.0,
Culture=neutral, PublicKeyToken=31BF3856AD364E35"/>
</modules>
<handlers>
<remove name="WebServiceHandlerFactory-Integrated"/>
<add name="ScriptHandlerFactory" verb="*" path="*.asmx"
preCondition="integratedMode"
type="System.Web.Script.Services.ScriptHandlerFactory,
System.Web.Extensions, Version=3.5.0.0, Culture=neutral,
PublicKeyToken=31BF3856AD364E35"/>
<add name="ScriptHandlerFactoryAppServices" verb="*" path="*_AppService.axd"
preCondition="integratedMode"
type="System.Web.Script.Services.ScriptHandlerFactory,
System.Web.Extensions, Version=3.5.0.0, Culture=neutral,
PublicKeyToken=31BF3856AD364E35"/>
<add name="ScriptResource" preCondition="integratedMode" verb="GET,HEAD"
path="ScriptResource.axd" type="System.Web.Handlers.ScriptResourceHandler,
System.Web.Extensions, Version=3.5.0.0, Culture=neutral,
PublicKeyToken=31BF3856AD364E35" />
</handlers>
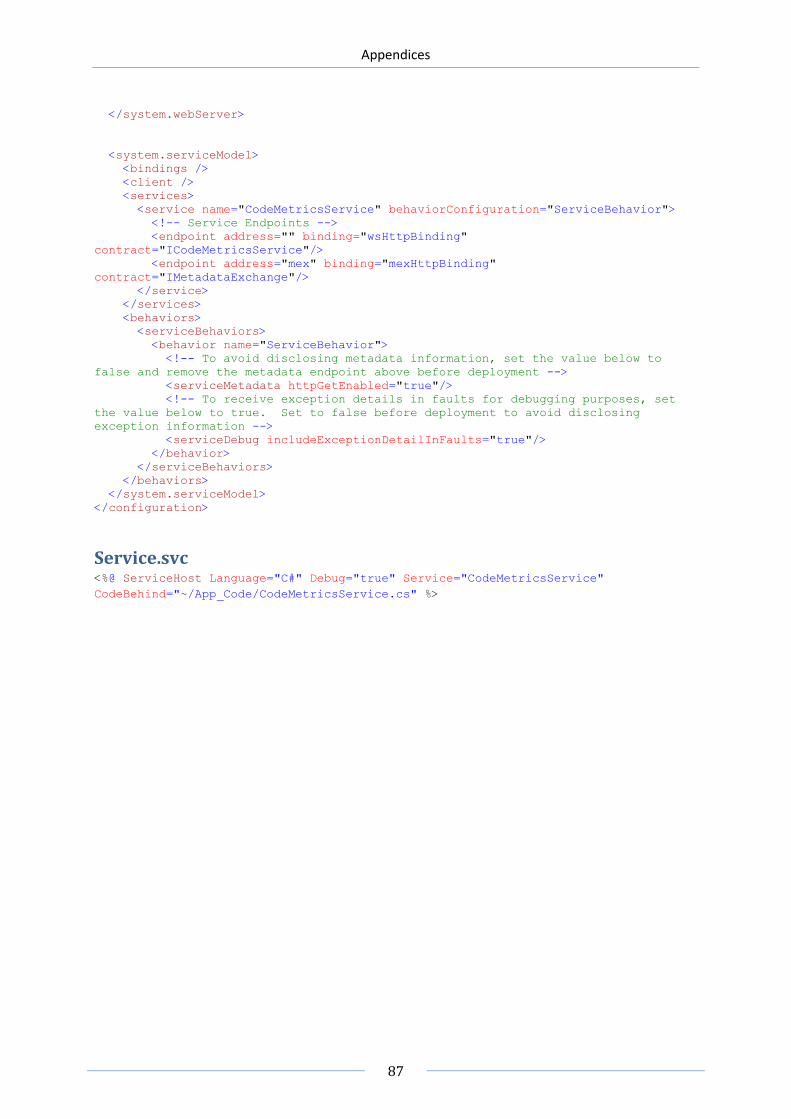
Appendices
87
</system.webServer>
<system.serviceModel>
<bindings />
<client />
<services>
<service name="CodeMetricsService" behaviorConfiguration="ServiceBehavior">
<!-- Service Endpoints -->
<endpoint address="" binding="wsHttpBinding"
contract="ICodeMetricsService"/>
<endpoint address="mex" binding="mexHttpBinding"
contract="IMetadataExchange"/>
</service>
</services>
<behaviors>
<serviceBehaviors>
<behavior name="ServiceBehavior">
<!-- To avoid disclosing metadata information, set the value below to
false and remove the metadata endpoint above before deployment -->
<serviceMetadata httpGetEnabled="true"/>
<!-- To receive exception details in faults for debugging purposes, set
the value below to true. Set to false before deployment to avoid disclosing
exception information -->
<serviceDebug includeExceptionDetailInFaults="true"/>
</behavior>
</serviceBehaviors>
</behaviors>
</system.serviceModel>
</configuration>
Service.svc <%@ ServiceHost Language="C#" Debug="true" Service="CodeMetricsService"
CodeBehind="~/App_Code/CodeMetricsService.cs" %>

Appendices
88
Appendix E – Source Code for the Operational Store
The operational store consists of two tables and two stored procedures.
Tables
MetricsData USE [CMDB]
GO
/****** Object: Table [dbo].[MetricsData] Script Date: 12/17/2007 02:02:46
******/
SET ANSI_NULLS ON
GO
SET QUOTED_IDENTIFIER ON
GO
CREATE TABLE [dbo].[MetricsData](
[EntryID] [int] NOT NULL,
[MaintainabilityIndex] [int] NOT NULL,
[CyclomaticComplexity] [int] NOT NULL,
[DepthOfInheritance] [int] NOT NULL,
[ClassCoupling] [int] NOT NULL,
[LinesOfCode] [int] NOT NULL,
CONSTRAINT [entryID_unique] UNIQUE NONCLUSTERED
(
[EntryID] ASC
)WITH (PAD_INDEX = OFF, IGNORE_DUP_KEY = OFF) ON [PRIMARY]
) ON [PRIMARY]
GO
ALTER TABLE [dbo].[MetricsData] WITH CHECK ADD CONSTRAINT
[FK_MetricsData_SavedEntries] FOREIGN KEY([EntryID])
REFERENCES [dbo].[SavedEntries] ([EntryID])
GO
ALTER TABLE [dbo].[MetricsData] CHECK CONSTRAINT [FK_MetricsData_SavedEntries]
SavedEntries USE [CMDB]
GO
/****** Object: Table [dbo].[SavedEntries] Script Date: 12/17/2007 02:06:45
******/
SET ANSI_NULLS ON
GO
SET QUOTED_IDENTIFIER ON
GO
CREATE TABLE [dbo].[SavedEntries](
[EntryID] [int] IDENTITY(1,1) NOT NULL,
[Build] [nvarchar](64) COLLATE Finnish_Swedish_CI_AS NOT NULL,
[TimeAdded] [datetime] NOT NULL CONSTRAINT [DF_SavedEntries_TimeStamp]
DEFAULT (getdate()),
[Harvested] [bit] NOT NULL CONSTRAINT [DF_SavedEntries_Harvested]
DEFAULT ((0)),
CONSTRAINT [PK_SavedEntries] PRIMARY KEY CLUSTERED
(
[EntryID] ASC
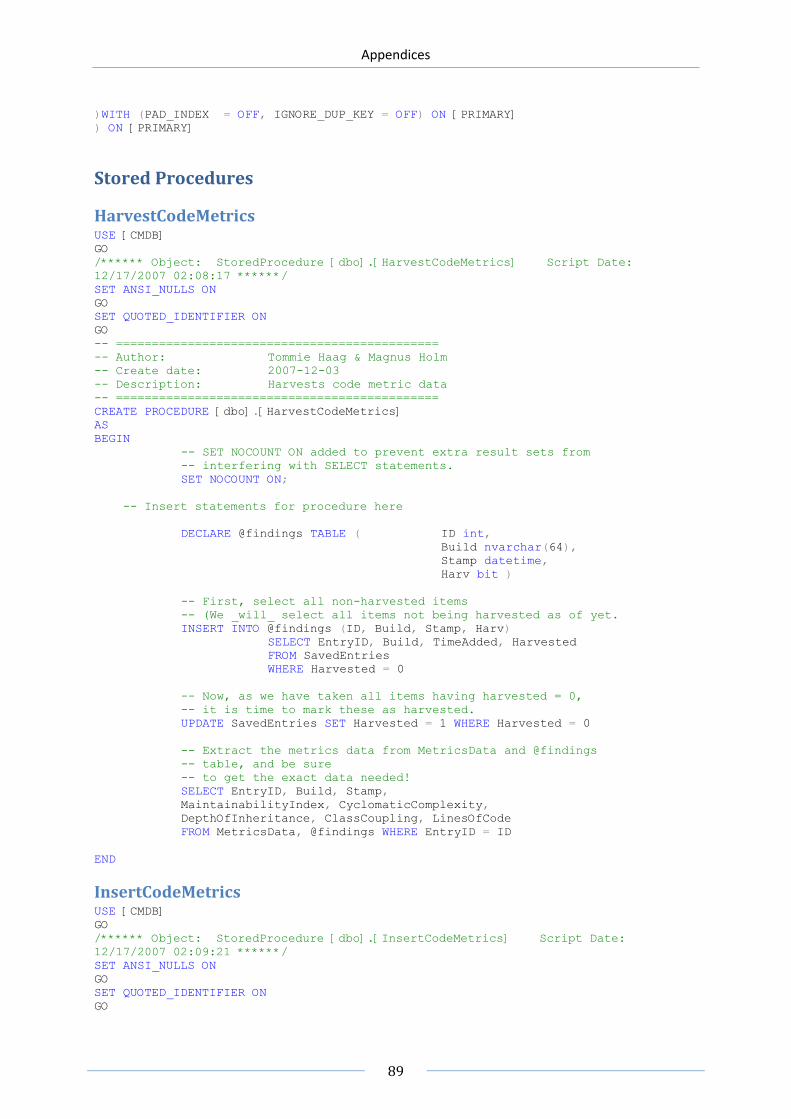
Appendices
89
)WITH (PAD_INDEX = OFF, IGNORE_DUP_KEY = OFF) ON [PRIMARY]
) ON [PRIMARY]
Stored Procedures
HarvestCodeMetrics USE [CMDB]
GO
/****** Object: StoredProcedure [dbo].[HarvestCodeMetrics] Script Date:
12/17/2007 02:08:17 ******/
SET ANSI_NULLS ON
GO
SET QUOTED_IDENTIFIER ON
GO
-- =============================================
-- Author: Tommie Haag & Magnus Holm
-- Create date: 2007-12-03
-- Description: Harvests code metric data
-- =============================================
CREATE PROCEDURE [dbo].[HarvestCodeMetrics]
AS
BEGIN
-- SET NOCOUNT ON added to prevent extra result sets from
-- interfering with SELECT statements.
SET NOCOUNT ON;
-- Insert statements for procedure here
DECLARE @findings TABLE ( ID int,
Build nvarchar(64),
Stamp datetime,
Harv bit )
-- First, select all non-harvested items
-- (We _will_ select all items not being harvested as of yet.
INSERT INTO @findings (ID, Build, Stamp, Harv)
SELECT EntryID, Build, TimeAdded, Harvested
FROM SavedEntries
WHERE Harvested = 0
-- Now, as we have taken all items having harvested = 0,
-- it is time to mark these as harvested.
UPDATE SavedEntries SET Harvested = 1 WHERE Harvested = 0
-- Extract the metrics data from MetricsData and @findings
-- table, and be sure
-- to get the exact data needed!
SELECT EntryID, Build, Stamp,
MaintainabilityIndex, CyclomaticComplexity,
DepthOfInheritance, ClassCoupling, LinesOfCode
FROM MetricsData, @findings WHERE EntryID = ID
END
InsertCodeMetrics USE [CMDB]
GO
/****** Object: StoredProcedure [dbo].[InsertCodeMetrics] Script Date:
12/17/2007 02:09:21 ******/
SET ANSI_NULLS ON
GO
SET QUOTED_IDENTIFIER ON
GO
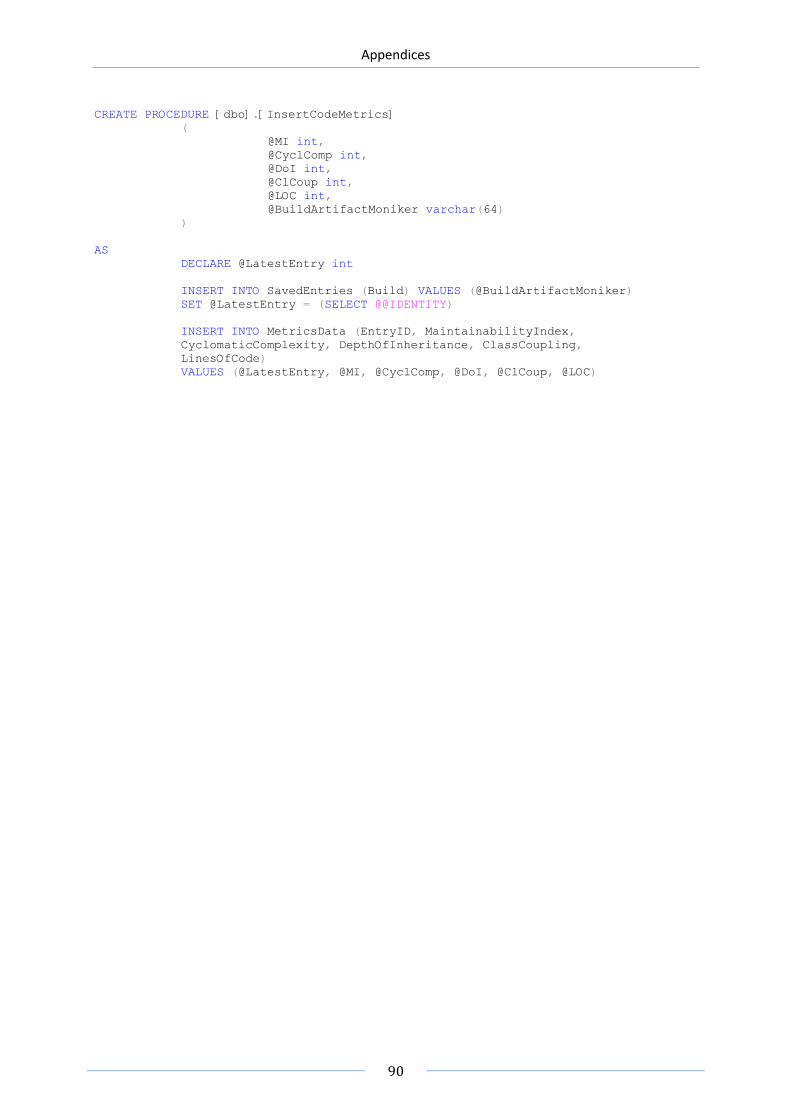
Appendices
90
CREATE PROCEDURE [dbo].[InsertCodeMetrics]
(
@MI int,
@CyclComp int,
@DoI int,
@ClCoup int,
@LOC int,
@BuildArtifactMoniker varchar(64)
)
AS
DECLARE @LatestEntry int
INSERT INTO SavedEntries (Build) VALUES (@BuildArtifactMoniker)
SET @LatestEntry = (SELECT @@IDENTITY)
INSERT INTO MetricsData (EntryID, MaintainabilityIndex,
CyclomaticComplexity, DepthOfInheritance, ClassCoupling,
LinesOfCode)
VALUES (@LatestEntry, @MI, @CyclComp, @DoI, @ClCoup, @LOC)

Appendices
91
Appendix F – Source code For the Adapter
The adapter consist of one dll-file and a descriptive XML schema. The dll file is written in C#.
The XML Schema <?xml version="1.0" encoding="utf-8" ?>
<WarehouseConfig>
<Facts>
<Fact>
<Name>Code Metrics</Name>
<Field>
<Name>Maintainability Index</Name>
<Type>int</Type>
<AggregationFunction>Sum</AggregationFunction>
</Field>
<Field>
<Name>Cyclomatic Complexity</Name>
<Type>int</Type>
<AggregationFunction>Sum</AggregationFunction>
</Field>
<Field>
<Name>Depth of Inheritance</Name>
<Type>int</Type>
<AggregationFunction>Sum</AggregationFunction>
</Field>
<Field>
<Name>Class Coupling</Name>
<Type>int</Type>
<AggregationFunction>Sum</AggregationFunction>
</Field>
<Field>
<Name>Lines of Code</Name>
<Type>int</Type>
<AggregationFunction>Sum</AggregationFunction>
</Field>
<DimensionUses>
<DimensionUse>
<FriendlyUseName>Build</FriendlyUseName>
<UseName>Build</UseName>
<DimensionName>Build</DimensionName>
</DimensionUse>
</DimensionUses>
</Fact>
</Facts>
</WarehouseConfig>

Appendices
92
The Adapter using System;
using System.Collections.Generic;
using System.Linq;
using System.Text;
using Microsoft.TeamFoundation;
using Microsoft.TeamFoundation.Adapter;
using Microsoft.TeamFoundation.Client;
using Microsoft.TeamFoundation.Warehouse;
using System.Data.SqlClient;
using System.Data;
using System.Diagnostics;
namespace CodeMetricsAdapter
{
public class CMAdapter : IWarehouseAdapter
{
private bool m_stopRequested = false;
private IDataStore m_dataStore;
public void Initialize(IDataStore ds)
{
// Check the data store
m_dataStore = ds;
if (m_dataStore == null)
{
throw new Exception("Null data store");
}
// Connect to the TFS Server
String url = "TFSRTM08";
TeamFoundationServer tfs = TeamFoundationServerFactory.GetServer(url);
if (tfs == null)
{
throw new Exception("TF Server instance not obtained for TFS url:"
+ url);
}
}
public SchemaChangesResult MakeSchemaChanges()
{
SchemaChangesResult result = SchemaChangesResult.NoChanges;
WarehouseConfig config = m_dataStore.GetWarehouseConfig();
// Check if the fact exists
Fact myFact = config.GetFact("Code Metrics");
if (myFact != null)
{
m_dataStore.LogEvent(AdapterEventLevel.Error, "Fact already
exists");
return SchemaChangesResult.NoChanges;
}
// If we got here, it means the fact did not already exist.
Fact codeMetricsFact = new Fact();
//Set the name of the fact
codeMetricsFact.Name = "Code Metrics";
// Set friendly name. This will be used in the OLAP cube in SQL
// Enterprise editions-
codeMetricsFact.FriendlyName = "Code Metrics";
// Create and add dimensionUse for Build to fact. This means that this
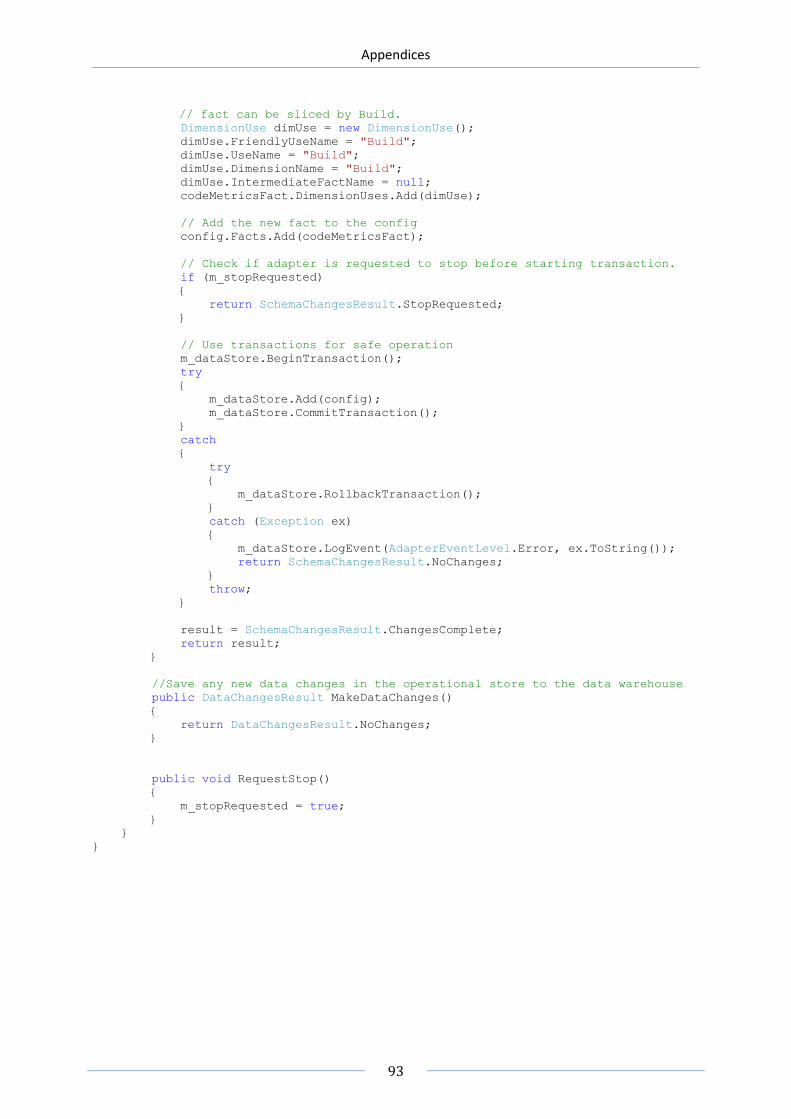
Appendices
93
// fact can be sliced by Build.
DimensionUse dimUse = new DimensionUse();
dimUse.FriendlyUseName = "Build";
dimUse.UseName = "Build";
dimUse.DimensionName = "Build";
dimUse.IntermediateFactName = null;
codeMetricsFact.DimensionUses.Add(dimUse);
// Add the new fact to the config
config.Facts.Add(codeMetricsFact);
// Check if adapter is requested to stop before starting transaction.
if (m_stopRequested)
{
return SchemaChangesResult.StopRequested;
}
// Use transactions for safe operation
m_dataStore.BeginTransaction();
try
{
m_dataStore.Add(config);
m_dataStore.CommitTransaction();
}
catch
{
try
{
m_dataStore.RollbackTransaction();
}
catch (Exception ex)
{
m_dataStore.LogEvent(AdapterEventLevel.Error, ex.ToString());
return SchemaChangesResult.NoChanges;
}
throw;
}
result = SchemaChangesResult.ChangesComplete;
return result;
}
//Save any new data changes in the operational store to the data warehouse
public DataChangesResult MakeDataChanges()
{
return DataChangesResult.NoChanges;
}
public void RequestStop()
{
m_stopRequested = true;
}
}
}

PART IV - EPILOGUE
Annotated Bibliography
Human beings, who are almost unique in
having the ability to learn from the
experience of others, are also remarkable
for their apparent disinclination to do so.
- Douglas Adams,
Last Chance to See

Annotated Bibliography
95
Annotated Bibliography
Buglione, L., & Abran, A. (1999). A Quality Factor for Software. Quality and reliability (pp. 7-13). Paris:
Qualita.
Copeland, L. (2006). A Practitioner's Guide to Software Test Design. USA: Artech House Publishers.
Côté, M.-A., Syrun, W., & Georgiadou, E. (2006). Software Quality Model Requirements for Software
Quality Engineering. Proceedings of the 14th International Software Quality Management (SQM) &
INSPIRE conference (BSI), (pp. 31-50). Southampton UK.
DeMarco, T. (1982). Controlling Software Projects. New York, USA: Yourdon Press.
DeToma, D., & Perry, J. (1994). A Software Metrics Program. Conference Proceedings, Combined
Volumes, Electro/94 International (pp. 230-238). Boston, MA, USA: IEEE.
Fenton, N. E., & Pfleeger, S. L. (1998). Software Metrics - A Rigorous & Practical Approach (2:nd ed.).
Boston: PWS Publishing Company.
Fisher, M. (2007, July 20). NASA IV&V Facility Metrics Data Program - Misc. Quantitative Metrics.
Retrieved September 18, 2007, from NASA IV&V Facility Metrics Data Program:
http://mdp.ivv.nasa.gov/count_metrics.html
Fisher, M. (2007, July 20). NASA IV&V MDP - Complexity Metrics. Retrieved September 18, 2007, from
NASA IV&V Facility Metrics Data Program: http://mdp.ivv.nasa.gov/complexity_metrics.html
Fisher, M. (2007, July 20). NASA IV&V MDP - Glossary and Definitions. (M. Fisher, Ed.) Retrieved
September 18, 2007, from NASA IV&V Facility Metrics Data Program:
http://mdp.ivv.nasa.gov/mdp_glossary.html#metrics
Fisher, M. (2007, July 20). NASA IV&V MDP - Line of Code Metrics. Retrieved September 18, 2007,
from NASA IV&V Facility Metrics Data Program: http://mdp.ivv.nasa.gov/loc_metrics.html
Fisher, M. (2007, July 20). NASA IV&V MDP - Object Oriented Metrics. Retrieved September 18, 2007,
from NASA IV&V Facility Metrics Data Program: http://mdp.ivv.nasa.gov/oo_metrics.html
Fleming, I. (n.d.). SQA Software Quality Assurance. Retrieved September 18, 2007, from Software
Metrics: http://www.sqa.net/softwarequalitymetrics.html
Fugleseth, E. (1992). A study of software metrics: choosing a relevant set of attributes for the
measurement of software quality at Tandberg Data A/S. University of Linköping, IDA. Linköping:
University of Linköping.
Gaffney Jr, J. E. (1981). Metrics In Software Quality Assurance. ACM Annual Conference/Annual
Meeting, Proceedings of the ACM '81 conference (pp. 126-130). ACM.
Galin, D. (2004). Software Quality Assurance - From Theory to implementation. Harlow Essex: Addison
Wesley.

Annotated Bibliography
96
Glover, A. (2006, May 30). In Pursuit of code quality: Refactoring with code metrics. Retrieved
November 21, 2007, from IBM developerWorks:
http://www.ibm.com/developerworks/java/library/j-cq05306/
Grady, R. B. (1994). Successfully Applying Software Metrics. Computer , 27 (9), 18-25.
Hufton, D. R. (1994). Experiences of collecting and using Software Metrics in Industry. 18th Annual
International Computer Software and Applications Conference (p. 208). IEEE Computer Society Press.
IEEE Standards Board. (1990). IEEE Standard Glossary of Software Engineering Terminology. New
York: IEEE Inc.
Ince, D. (1990). Software Metrics - An Introduction. IEE Colloquium on Software Metrics (pp. 1-2).
IEEE.
Jones, C. (1994, September). Software metrics: good, bad and missing. Computer , 27 (9), pp. 98-100.
Kean, D. M. (2007, February 28). Announcing Visual Studio Code Metrics. Retrieved December 5,
2007, from The Visual Studio Code Analysis Team Blog:
http://blogs.msdn.com/fxcop/archive/2007/02/28/announcing-visual-studio-code-metrics.aspx
Levinson, J. (2007, July). Inside VSTS: Picture Your Code With Metrics. Retrieved November 15, 2007,
from Visual Studio Magazine Online:
http://visualstudiomagazine.com/columns/article.aspx?editorialsid=2232
Li, H., & Cheung, W. (1987). An Empirical Study of Software Metrics. 13 (6), pp. 697-708.
Liso, A. (2001, August). STSC Crosstalk - Software Maintainability Metrics Model: An Improvement in
the Coleman-Oman Model. Retrieved September 18, 2007, from U.S. Air Force Software Technology
Support Center (STSC): http://www.stsc.hill.af.mil/crosstalk/2001/08/liso.html
Liu, X., & Viswanathan, R. (1999). A WWW Based Software Metrics Environment for Software Process
Management and Software Product Quality Improvement. 23rd International Computer Software and
Applications Conference (pp. 301-304). Washington DC, USA: IEEE Computer Society.
Marais, M. (2006, February 26). CodeProject: Code Metrics, Code Smells, and Refactoring in Practice.
Retrieved November 16, 2007, from The Code Project:
http://www.codeproject.com/KB/architecture/practicalexp.aspx
Microsoft. (2007). How to: Create a Report in Microsoft Excel for Team Foundation Server and Team
System. Hämtat från MSDN Library: http://msdn2.microsoft.com/en-
us/library/ms244699(VS.80).aspx den 15 December 2007
Microsoft. (2007). VSTS Build Schema. (Microsoft, Ed.) Retrieved September 25, 2007, from MSDN
Library: http://msdn2.microsoft.com/en-us/library/ms244693(VS.80).aspx
Milicic, D. (2005, June). Software Quality Models and Philosophies. (L. Lundberg, M. Mattsson, & C.
Wohlin, Eds.) Software quality attributes and trade-offs , 3-19.
Morrison, C. (2007, October 12). About the code metrics feature. (T. Haag, & M. Holm, Interviewers)

Annotated Bibliography
97
Morrison, C. (2007, November 20). Maintainability Index Range and Meaning. Retrieved December 5,
2007, from Code Analysis Team Blog:
http://blogs.msdn.com/fxcop/archive/2007/11/20/maintainability-index-range-and-meaning.aspx
NASA IV&V. (2007, July 20). NASA IV&V Facility Metrics Data Program. (M. Fisher, Editor) Retrieved
09 18, 2007, from NASA IV&V Facility Metrics Data Program: http://mdp.ivv.nasa.gov/
NASA SATC. (2000, August 22). Non-OO Code Metric Definitions. Retrieved September 18, 007, from
SATC Historical Metrics Database:
http://satc.gsfc.nasa.gov/metrics/codemetrics/non_oo/definitions/index.html
NASA SATC. (1999a, December 22). Non-OO Recommended Thresholds. Retrieved September 18,
2007, from SATC Historical Metrics Database:
http://satc.gsfc.nasa.gov/metrics/codemetrics/non_oo/thresholds/index.html
NASA SATC. (1999b, December 27). OO Recommended Thresholds. Retrieved September 18, 2007,
from SATC Historical Metrics Database:
http://satc.gsfc.nasa.gov/metrics/codemetrics/oo/thresholds/index.html
NASA SATC. (2002, May 1). Software Assurance Technology Center. Retrieved September 18, 2007,
from SATC Historical Metrics Database: http://satc.gsfc.nasa.gov/metrics/codemetrics/index.html
NDepend. (2007). Metrics Definitions. Retrieved December 14, 2007, from NDepend:
http://www.ndepend.com/Metrics.aspx
Svahn, F., & Österlund, M. (1997). Mätetal för mjukvaruutveckling: framtagande av ett mätprogram
på Ericsson Business Networks AB. University of Linköping, IKP. Linköping: University of Linköping.
VanDoren, E. (2007, January 11). Software Technolog Roadmap - Maintainability Index Technique for
Measuring Program Maintainability. (E. VanDoren, Ed.) Retrieved October 15, 2007, from Carnegie
Mellon Software Engineering Institute: http://www.sei.cmu.edu/str/descriptions/mitmpm.html
VanDoren, E. (2007, January 11). Software Technology Roadmap - Cyclomatic Complexity. (E.
VanDoren, Ed.) Retrieved October 15, 2007, from Carnegie Mellon Software Engineering Institute:
http://www.sei.cmu.edu/str/descriptions/cyclomatic_body.html
Wikipedia. (2007, December 13). Windows Communication Foundation. Retrieved December 15,
2007, from Wikipedia: http://en.wikipedia.org/wiki/Windows_Communication_Foundation


![REB215-XPRO Extension Board (USER GUIDE) · PDF fileREB215-XPRO Extension Board [USER GUIDE] 42398A-MCU-03/2015 6 Restart Atmel Studio, allow help to make changes and the Performance](https://static.fdocuments.in/doc/165x107/5aa6da3d7f8b9a424f8b90a3/reb215-xpro-extension-board-user-guide-extension-board-user-guide-42398a-mcu-032015.jpg)