Evaluation and Control of Corrosion and Encrustation In ... · PDF fileEvaluation and Control...
69
Evaluation and Control of Corrosion and Encrustation In Tube Wells of the Indus Plains, West Pakistan GEOLOGICAL SURVEY WATER-SUPPLY PAPER 1608-L Prepared in cooperation with the West Pakistan Water and Power Development Authority under the auspices of the U.S. Agency for International Development . *HI » IM CITY, OKLA. RECEIVED Li m u d WATER RESOURCES DIVISION
Transcript of Evaluation and Control of Corrosion and Encrustation In ... · PDF fileEvaluation and Control...

Evaluation and Control of Corrosion and Encrustation In Tube Wells of the Indus Plains, West Pakistan
GEOLOGICAL SURVEY WATER-SUPPLY PAPER 1608-L
Prepared in cooperation with the West Pakistan Water and Power Development Authority under the auspices of the U.S. Agency for International Development
. *HI » IM CITY, OKLA.
RECEIVED
Li m u dWATER RESOURCES DIVISION

Slotted fiber-glass well casing, Indus Plains, West Pakistan. Courtesy Koppers Company, Organic Materials Division.

EVALUATION AND CONTROLOF CORROSION AND ENCRUSTATION
IN TUBE WELLS OF THE INDUS PLAINSWEST PAKISTAN

Evaluation and Control of Corrosion and Encrustation In Tube Wells of the Indus Plains, West PakistanBy FRANK E. CLARKE and IVAN BARNES
CONTRIBUTIONS TO THE HYDROLOGY OF ASIA AND OCEANIA
GEOLOGICAL SURVEY WATER-SUPPLY PAPER 1608-L
Prepared in cooperation with the West Pakistan Water and Power Development Authority under the auspices of the U.S. Agency for International Development
UNITED STATES GOVERNMENT PRINTING OFFICE, WASHINGTON : 1969

UNITED STATES DEPARTMENT OF THE INTERIOR
WALTER J. HICKEL, Secretary
GEOLOGICAL SURVEY
William T. Pecora, Director
For sale by the Superintendent of Documents, U.S. Government Printing Office Washington, D.C. 20402 - Price 40 cents (paper cover)

CONTENTS
PageAbstract.__________________________________________________________ LIAcknowledgments. _______ -___-,___ ,_,_ ______________,_.,___ ____ 1Hydrologic setting.___________________._____,_ __________,,._,,___ 2General water-quality characteristics of ground-water systems.------- 9Tube wells of the Indus Plains._____________ ._______.,_-____-________ 11Nature and pattern of water-well problems -_-___-___-_-_ _-_-___-_ 13Field and laboratory studies of water-well problems__________-_--~_-_-- 16On-site interpretations of data.___-_-___.__-_______,-______--_- ---- 21Pattern and nature of water-well encrustants-------------------------- 22Nature and significance of corrosion damage,_________-_____---_-_---- 27Causes of corrosion._____-_______-_____________-_-___--_-----_----- 30Encrustation mechanisms and effects_____._.___-____------._.-_--.--~ 34Chemical interactions.____._____.____,___.___-__._..___._---_-_---- 46Corrosion control treatments.._____..______-___-__-__-_--_..__-------- 47Maintenance and rehabilitation.______________-___-_-_----__.-,--_--- 48Improved materials of construction._._______.._-__^____,______--...---- 51Summary. _______________________-_____,_-_-_,_--__-_-------_--_- 60References_ _____-__________________--_---_--__---__--_---------- 61Index ____________________-_____-______---,-_--------------------- 63
ILLUSTRATIONS
Page FKONTISPIECE. Photograph of slotted fiber-glass well casing, Indus Plains,
West Pakistan. FIGURE 1. Map of Indus Plains showing approximate test areas________ L3
2. Photograph of Persian wheel in shallow well,______________ 43. Photograph of irrigation barrage, Jhelum River ____________ 54. Section showing change in ground^water leveL_____________ 65. View of waterlogging__________________________________ 76. Photograph of salinized soil____________________-___------ 87. Map showing mineral content of native ground water in
Punjab area.________________________________________ 108. Diagrammatic sketch of coir well screen.__________________ 129. Photograph of slotted steel filter pipe._____ ____-___-____- 14
10. Photograph of typical tube well._________________________ 1511. Graphs of performance record, troublesome steel wells,
SCARP-1_.________,___________-__-__------__------- 1612-15. Photographs:
12. Measuring electrode potential._____________--_--- 1713. Platinum-calomel flow cell for measuring electrode
potential_ _ _______________-_________---__--, 1814. Corrosion probe with guard removed to show element- 1915. Measuring long-line potential, SCARP-1 well_____- 20

VI CONTENTS
Page FIGURE 16. Stability field diagram, ferric and ferrous species, assuming
2X 10~7 molal activity of iron and based on Fe(OH) 3______ L 2117-20. Photographs:
17. Preferential encrustation of steel casing, Shadmanwell 34, SCARP-l-____-__----__---_---_______ 23
18. Localized encrustation of casing slots, Shadman well34, SCARP-1._____________________________ 24
19. Encrusted gravel pack, well TW2, Sind area.______ 2420. Mineral deposit from casing slot, Shadman well 34,
SCARP-1_ __________________________________ 2521. Diagram of structure of slot deposit, Shadman well 34,
SCARP-1 __________________________________________ 2522. Photograph of casing slot damaged by corrosion and erosion,
Shadman well 34, SCARP-1_____________________ 2823. Photograph of localized corrosion hole, Shahkot well 198____ 29
24-27. Graphs showing corrosion curves, mild steel:24. Shadman well 27_____-_____-___-_________-_-__- 3025. Shadman well 47__ _________________________ 3126. Shahkot well 251-___---_--__--_-_---_________ 3227. Shahkot well 252-_-_---_---_--_-___---____---_- 33
28-34. Graphs showing relation of corrosion to equilibrium state:28. FeCOs---------------------------------------- 3829. CaCO3_________________________________________ 3830. Fe(OH)3--_---------------_--------_ --------- 3931. Fe304 _______.________________________________ 4032. Fe___________________________________________ 4133. Mn3O4_____________-_____________-_________-___ 4234. Cu(OH) 2 - -- --- 43
35. Graph showing performance record of corrosion test wells,SCARP-1____________ _______________________________ 46
36. Photograph of WAPDA personnel installing primacord toblast encrusted well__________________________________ 49
37. Graphs showing effect of blasting on well performance,Shadman wells, SCARP-1____________________________ 50
38-40. Photographs:38. Wire-wrapped stainless-steel well screen._________ 5339. Fiber-glass well casing with key lock._____________ 5440. Saw-slotted fiber-glass well casing ________________ 55
TABLES
Page TABLE 1. Composition of deposits from Shadman well 34_____________ L 26
2. Minerals identified in deposits from Shadman well 34_________ 263. Water-quality data, Indus Plains wells, West Pakistan. _______ 344. Equilibrium data, selected minerals, West Pakistan wells______ 445. Effects of ground water on idle water wells-_________________ 56

CONTRIBUTIONS TO THE HYDROLOGY OF ASIA AND OCEANIA
EVALUATION AND CONTROL OF CORROSIONAND ENCRUSTATION IN TUBE WELLS OF THE
INDUS PLAINS, WEST PAKISTAN
By FRANK E. CLARKE and IVAN BARNES
ABSTRACT
Seepage from rivers and irrigation canals has contributed to waterlogging and soil salinization problems in much of the Indus Plains of West Pakistan. These problems are being overcome in part by tube-well dewatering and deep leaching of salinized soils. The ground waters described here are anaerobic and some are supersaturated with troublesome minerals such as calcium carbonate (calcite) and iron carbonate (siderite). These waters are moderately corrosive to steel. Some wells contain sulfate-reducing bacteria, which catalyze corrosion, and pH-electrode potential relationships favorable to the solution of iron also are rather common. Corrosion is concentrated in the relatively active (anodic) saw slots of water-well filter pipes (screens), where metal loss is least tolerable. Local changes in chemical properties of the water, because of corrosion, appar ently cause deposition of calcium carbonate, iron carbonate, and other minerals which clog the filter pipes. In some places well capacities are seriously reduced in very short periods of time. There appears to be no practicable preventive treat ment for corrosion and encrustation in these wells. Even chemical sterilization for bacterial control has yielded poor results. Periodic rehabilitation by down-hole blasting or by other effective mechanical or chemical cleaning methods will pro long well life. It may be possible to repair severely damaged well screens by insert ing perforated sleeves of plastic or other inert material.
The most promising approach to future well-field development is to use filter pipes of epoxy-resin-bonded fiber glass, stainless steel, or other inert material which minimizes both corrosion and corrosion-catalyzed encrustation. Fiber glass plastic pipe appears to be the most economically practicable construction material at this time and already is being used with promising results.
ACKNOWLEDGMENTS
The water-well studies which yielded the data and led to the con clusions of this report, were made in cooperation with the West Pakistan Water and Power Development Authority under the auspices of the United States Agency for International Development (USAID). The references contain the names of many individuals of USAID, the Wa ter and Power Development Authority of West Pakistan (WAPDA), and the Water and Soils Investigation Division of WAPDA
LI

L2 CONTRIBUTIONS TO THE HYDROLOGY OF ASIA AND OCEANIA
(WASID), who provided valuable technical help and background in formation. The references also acknowledge the excellent technical assistance of U.S. Geological Survey employees, Norman H. Beamer, Herman K. Feltz, Pauline J. Dunton, Blair F. Jones, Roger G. Wolff, and Mary E. Mrose.
Tipton and Kalmbach, Inc., Technical Consultants to WAPDA, made very important contributions to the investigation by providing information on well construction and performance, and on the com pany's development research and field studies on well maintenance, methods, and improved well construction materials, particularly fiber- glass plastic pipe. The company's technical staff also provided valu able assistance with the field tests described here.
Acknowledgment is made here to George C. Taylor, Jr., for his interest, advice, and support throughout the period of study; to Joan V. Moiier and Mary J. Burks, who helped type the manuscript; and to Norma 0. Gfube for manuscript work, technical editing, and constructive criticisms of composition and format. All are employees of the U.S. Geological Survey.
HYDROLOGIC SETTING
The area known as the Indus Plains of West Pakistan is approxi mately 900 miles long and is as much as 400 miles wide. As shown in figure 1, it, stretches from the Arabian Sea at the southwest to the foothills of the Himalayas in the northeast, with Afghanistan on the west, and India and Kashmir on the east. It appears to lie at least in part, in a structural trough formed by deep crustal subsidence related to upthrusting of the Himalaya and other bordering mountain ranges, The i25?000-square-mile area is underlain by unconsolidated sediments of Tertiary and more recent age, which extend to depths of a few thou sand feet. The sediments consist primarily of sand, silt and clay but sandy sediment ii most prevalent. Much of the deposit is water satu rated to within a few feet of the land surface, Significant salt deposits occur in the northwestern margin bordering the Salt Kange.
In the northern part of the plains, the Sutlej, Kavi, Chenab, Jhelum, and Indus Rivers converge in a fan-shaped pattern to form a single channel the Indus, and to give the area its name, Punjab, from the native words "paunch ab,M which mean five waters. From this point of convergence the Indus flows alone southwest through the Sind to the Arabian Sea.
The climate of the Indus Plains ranges from relatively humid in the mountainous northeast, where rainfall may exceed 30 inches per year, to semiarid in the central part, and to near desert conditions in the southern Sind, where annual precipitation is likely to be less than

CORROSION IN TUBE WELLS, INDUS PLAINS, WEST PAKISTAN L3
U.S.S.R. _-
B A L L/C H I S T A N
Indus basin boundary
Sind test area
SCARP-1 areaTAUNSA
Barrage
24
100I_
100 0 100 200 300 KILOMETERSI I I ! I______________|______________|______________j
300 MILES100 200_I_________I
FIGTJBE 1. Map of Indus Plains showing approximate test areas.
32S-982 O 69 2

L4 CONTRIBUTIONS TO THE HYDROLOGY OF ASIA AND OCEANIA
4 inches. Generally speaking, the 15-inch precipitation line which passes through the city of Lyallpur (see fig. 1) divides the south from the north and the arid from the semiarid region. The plains' gentle slope of 1 to iy2 feet per mile results in rather sluggish drainage of whatever water falls upon them. During the dry season (Rabi) almost all of the rain which falls is lost by evaporation. Even during the wet season (Karif) the loss by evaporation is about 75 percent. Hence, leakage from the perennial rivers, canals, and natural drains plays a major role in sustaining the ground-water level.
Man has lived upon and irrigated the Indus Plains with waters from its rivers and shallow flood-plain ground waters since the dawn of history. The Harappa civilization (2300 to 1500 B.C.), centered in the north near Montgomery and in the south at Mohenjo-Daro near the present town of Larkana, apparently flourished despite the limited rainfall. At first all irrigation depended on natural river flooding, called "sailab," during the monsoon season (July and August) or primitive mechanical water lifts, such as the shaduf, the mote, and the Persian wheel (fig. 2). Near the end of the 17th century inundation canals were dug from the rivers inland to spread water further into the doabs which separated them, thereby extending the benefits of monsoon flooding. About the middle of the 19th century low barrages constructed on the rivers (fig. 3) and networks of canals stemming from them made perennial irrigation feasible for the first time on a relatively large scale. These canals covered more of the flat Punjab
FIGURE 2. 'Persian wheel in shallow well.

CORROSION IN TUBE WELLS, INDUS PLAINS, WEST PAKISTAN L5
FIGURE 3. Irrigation barrage, Jhelum River.
area with water and markedly increased infiltration through porous alluvial deposits into the ground-water system (Carlston, 1953). As a result, ground-water levels once 30-90 feet below the surface rose steadily in heavily irrigated areas of the Punjab and eventually caused waterlogging, soil salinization from near surface evaporation, and crop destruction. The compressed-scale diagram in figure 4 shows the change in ground-water level in the Punjab during the first half of the 20th century. Typical effects of waterlogging and salinization are shown in figures 5 and 6.
\Attempts to control the rising water table by pumping ground water back to major canals was started during the 1940's in Ohaj and Rechna Do&bs with rows of wells approximately a quarter of a mile apart on both sides of the canals. The first wells were installed about 60 feet from the water's edge and were later constructed 100 feet away in an effort to improve results. The 1,800 "Rasul" wells, named for the hydro- plant which powered them, had little beneficial effect partly because of inadequate pumping capacity and partly because some electrical power originally intended for their operation was necessarily diverted to other uses. By 1960 the water table in Rechna Doab had risen as much as 90 feet, thus exceeding river level and reversing the hydraulic gradient (Malmberg and Ataur Rahman, 1966). More promising rec lamation projects were started during the 1950's in several areas of central Rechna Doab. The Chuharkana project started in 1952, and originally planned to benefit about 9,000 acres, included 24 centrif- ugally-pumped tube wells which supplied ground water to canals for

L6 CONTRIBUTIONS TO THE HYDROLOGY OF ASIA AND OCEANIA

CORROSION IN TUBE WELLS, INDUS PLAINS, WEST PAKISTAN L7

L8 CONTRIBUTIONS TO THE HYDROLOGY OF ASIA AND OCEANIA
FIGURE 6. Salinized soil.
irrigation water while lowering the water table. Here too pumping capacity failed to prevent waterlogging from canal leakage and monsoon floods. Three other reclamation projects, Jaranwala, Pindi Bhattian, and Chichohi Mallian, involving 178 wells and 105,000 acres followed during the years 1954 and 1960. These later were incor porated in the present Salinity Control and Reclamation Project 1 (SCARP-1) which started in 1959 and now includes a total of 12 reclamation projects with 2,000 wells covering 1.3 million acres.
The principle of tube-well dewatering is relatively simple, although it involves extensive hydraulic testing and well construction. It is less costly than any kind of horizontal drainage and is more effective under favorable geologic conditions such as those in the Indus Plains. Suffi cient water is pumped to establish a new hydraulic condition in which ground-water levels are low enough to prevent serious water-table evaporation and consequent salt concentration in the root zones. Usable ground water is pumped back into the surface irrigation system from which it can be spread onto the land for irrigation, salt leaching, and soil reclamation. Salty water is pumped to drains or to rivers or large canals for dilution. Because much of the water pumped from the underground system is lost by surface evaporation during irrigation, ground-water levels can be lowered significantly in relatively short periods of time provided wells are properly spaced and perform at rated capacities. According to Malmberg and Ataur Rahman (1966),
CORROSION IN TUBE WELLS, INDUS PLAINS, WEST PAKISTAN L9
dewatering operations during the past 4 years has lowered ground- water levels in the SCAKP-1 area 1-8 feet and an average of 6 feet. Depth to water now ranges from 10-20 feet in this region. Some salty areas like the one shown in figure 6 have been reclaimed and are productive agricultural lands.
Continuing success of ground-water dewatering operations in the Indus Plains depends on the continuing effectiveness of pumping. Loss of well capacity already has proven to be an unexpected and costly problem in parts of the Punjab. Exploratory studies by several investi gators have shown corrosion and related mineral encrustation of water- well components, particularly the latter, to be major contributing factors. These observations led to the work reported here, which was conducted in the shaded areas shown in figure 1 and was aimed at understanding corrosion and encrustation processes involved in order to determine the preventive and corrective treatments best suited to tube wells of the Indus Plains. Earlier work is discussed in open-file reports (Clarke and Barnes, 1964 and 1967).
GENERAL WATER-QUALITY CHARACTERISTICS OF GROUND-WATERSYSTEMS
Data reported by Swarzenski (1968) show that five rivers of the Punjab contain waters with dissolved solid contents of only 200- 300 mg/1 (milligrams per liter), particularly during the period from April to October when the rivers are sustained partially by snowmelt from the mountains and by monsoon rains, both of which dilute the higher base-flow concentrations resulting from irrigation return. The river waters are calcium-magnesium bicarbonate types, but this surface water is converted to sodium bicarbonate type as it seeps from the river channels to form narrow belts of relatively shallow fresh ground water beneath the flood plains. Deeper water and water farther inland beyond the range of this fresh-water source generally have higher salt concentrations and sodium chloride contents.
The data shown in table 3 are reasonably representative of ground- water quality in the Punjab, where tube-well dewatering and irriga tion is being practiced or planned. The data represent a rather wide range of dissolved-solid concentrations and ionic balances. Most of the waters with dissolved-solid contents below 1,000 mg/1 are primarily sodium bicarbonate types because of base exchange. Occasionally sodium sulfate or calcium sulfate solutes are found to predominate. Sodium chloride predominates only in water with concentrations above 1,000 mg/1, and occasionally sodium sulfate predominates in this con centration range. Much of the water is anaerobic, and much of it con tains significant concentrations of ferrous and sulfide ions, which are

L10 CONTRIBUTIONS TO THE HYDROLOGY OF ASIA AND OCEANIA
relatively common in air-free ground-water systems. Generally speak ing, concentration of ground-water solutes tends to increase down doabs toward river junctions. However, this is not a consistent pattern, and more than one center of high salt concentration may occur within the doab boundaries as shown in figure 7. Water-table evaporation at depths of 50 feet or more has been suggested as the primary cause of salt concentration (Greenman, Swarzenski, and Bennett, 1967). Flow of saline water from the Salt Range in the northwest of the Punjab also has been proposed as a possible source of saline water (H. E. Skibitzke, oral commun., 1967). However, it is doubtful that the Salt Range supplied saline ground water to the southern plains (Sind)
.... : AND
:' KASHMIR
EXPLANATION1000 --?-
Shows average concentra tion of dissolved solids in water from wells at depths of 100 to 450 feet. Dashed where approximate; queried where doubtful. 1 In terval, in parts per mil lion, is variable
25 0 25 50 75 100 KILOMETERSL.,,1 I II I0 25 50 75 100 MILES
, I _____ | _____ | ______ | ______ |
FIGURE 7. Mineral content of native ground water in Punjab area.

CORROSION IN TUBE WELLS, INDUS PLAINS, WEST PAKISTAN Lll
where it is even more prevalent and troublesome. Increasing aridity from north to south would be expected to intensify evaporation and to increase salt concentration in both surface water and ground water in a downstream direction.
Vertical movement of surface salt to pumping depth and its lateral movement to the wells will take considerable time. Because of this and the small amount of direct return flow to the rivers from irrigation projects, local changes in ground-water quality are not likely to be rapid except in marginal zones separating fresh and saline ground- water bodies. Here, continuous pumping can be expected to cause up- coning and lateral intrusion of saline water and noticeable changes in water-quality patterns. General inoculation of the aquifers by bacteria, such as sulfate-reducing organisms, introduced through water wells is also possible, but water-quality effects of such organisms probably will be concentrated in the boreholes rather than spread throughout the aquifers. One would expect areal variations in water quality to be more significant than variations of quality with time at a particular location. However, Malmberg and Ataur Eahman (1966) report that significant quality changes already have been observed in some of the tube wells and that changes in quality with time can be detected by plotting isograms periodically for pertinent solutes.
TUBE WELLS OF THE INDUS PLAINS
The term "tube well" is used to describe relatively small-diameter boreholes which penetrate the ground-water formation and yield water by artesian flow or pumping. Tube wells of the Indus Plains generally are 10 inches or less in diameter and seldom exceed a depth of 500 feet except in exploratory boreholes. Many wells are privately owned and of relatively simple design. Some of these are constructed by percus sion drilling and are cased with plain carbon steel pipe from 6-8 inches in diameter. Many wells are equipped with coir filter pipes (screens) consisting of central cylindrical grids or cages of uniformly spaced vertical steel rods or bars held in place by circumferential steel bands and wrapped spirally with closely-spaced small diameter coconut- hull (coir) rope (fig. 8). Wells with coir screens generally are rela tively shallow and are equipped with centrifugal pumps of local design which are relatively inexpensive, easy to install, and rather trouble free. Yields are limited by well design and pump capacity to 1 cfs (cubic foot per second) or less. Cost of constructing coir wells is said to be approximately one-fifth that of an all-steel well with saw-slotted filter sections.
Better quality private wells and certain wells constructed and op erated by government agencies are cased with steel tubes and equipped with saw-slotted plain yellow brass filter pipes ("screens").
323-982 O 6S 3

LI 2 CONTRIBUTIONS TO THE HYDROLOGY OF ASIA AND OCEANIA
Rope, wrapping,
(coir)
Metal bands
Metal rods
FIGUEE 8. Diagrammatic sketch of coir well screen.

CORROSION IN TUBE WELLS, INDUS PLAINS, WEST PAKISTAN L13
These wells generally are gravel packed and may be equipped with either centrifugal or multistage turbine pumps, the latter capable of discharging up to 5 cfs of water. The brass filter pipe is made locally, with slots about ^ inch wide. Construction with brass pipe is signifi cantly more costly than all steel construction because of the higher cost of the brass. However, brass filter pipes have proven to be less trouble some than those made of steel.
Modern tube wells installed under direction of the Water and Power Development Authority (WAPDA) in the SCARP projects are de signed for 8-inch- to 10-inch-diameter casing and are constructed by reverse rotary drilling. Most wells have steel casings, slotted steel filter pipes, and multistage turbine pumps which discharge 3-5 cf s; all are gravel packed. Filter pipes are slotted in the pattern shown in figure 9, with slots approximately TV inch wide and 3 inches long. This pat tern provides from 6 to 8 percent opening, which is calculated to be adequate for the aquifers involved.
A few hundred wells with less conventional construction materials (such as fiber-glass plastic) are in use as a result of the investigations reported here and are discussed later in the text. Figure 10 shows a typical tube well.
More than 30,000 private tube wells are now operating in the Pun jab. The 12 schemes of SCARP-1 area include approximately 2,000 modern high capacity wells. About 1,500 modern high capacity tube wells already have been constructed in SCARP-2 area. These, plus the 2,000 in SCARP-1 and new wells to be completed in SCARPs 2, 3, and 4, will bring the total to about 4,900 wells serving more than 3 million acres before the end of 1968 (Tipton and Kalmbach, Inc., 1967).
Because of basic similarities in water quality, all wells afe likely to be subjected to conditions similar to those responsible for the cor rosion and encrustation problems observed in wells of SCARP-1. Severity of effects can be expected to vary because of significant differ ences in water quality, well design, operational factors, and sensitivity of well construction matrials, particularly the last.
NATURE AND PATTERN OF WATER-WELL PROBLEMS
Tube wells of the Punjab often are completed and developed with pumps powered by portable electric generators before permanent electrical power is available for continual pumping. Such wells may stand idle for a year or more before final acceptance testing. Wells constructed and developed in this manner using slotted steel filter pipes occasionally suffer serious losses in specific capacity during the idle period between initial development and start of service.

L14 CONTRIBUTIONS TO THE HYDROLOGY OF ASIA AND OCEANIA
9. Slotted steel filter pipe.

CORROSION IN TUBE WELLS, INDUS PLAINS, WEST PAKISTAN L15
FIGURE 10. Typical tube well.
These losses suggest clogging of openings in the gravel pack (shroud ing) or filter pipe, presumably by mineral encrustation, formation par ticles or corrosion products. Specific capacity losses as high as 80 percent have occurred in unused waterwells, and losses of 30 percent are rather common. After pumping starts, wells generally continue to decline in capacity, and in some the rate of decline is so rapid that rehabilitation is required in 3 years or less. Rehabilitated or replaced wells commonly follow the same die-away pattern. The performance curves in figure 11 for typical troublesome steel wells in SCARP-1 show the rates and extents of capacity changes after start of pumping.
Well-clogging problems vary considerably from one area to another because of the variation in water quality. Only 10-15 percent of the modern tube wells in SCARP-1 had proven to be very troublesome at the time of this study, but most of these had been in operation for 5 years or less. A much larger percentage showed evidence of gradual decline, which could markedly affect their usefulness within a decade. Some areas, such as parts of the Shahkot project in SCARP-1, appear to be relatively free of serious tube-well deterioration problems, where as others, like much of the Shadman project, require frequent atten tion. The fact that all areas contain examples of relatively good and relatively poor performers, sometimes located rather close together and operating in waters with very similar general characteristics,

LI 6 CONTRIBUTIONS TO THE HYDROLOGY OF ASIA AND OCEANIA
10
O 15Q
1C£ on Q <iU
25
30
1962 1963 1964 1965
Start of pumping Well blasted
\
- \ Shadman 34 (Well replaced)
Shadman 34 »---^(Replacement)
Zafarwal 17
FIGURE 11. Performance record, troublesome steel wells, SCARP-1.
presents a particularly challenging situation to the investigator. It suggests marginal water quality where kinetic factors and catalytic effects have :a marked bearing on troublesome reactions.
FIELD AND LABORATORY STUDIES OF WATER-WELL PROBLEMS
Conventional laboratory analyses of water samples alone are of little value in determining subtle quality characteristics responsible for spotty well performance of the kind observed in West Pakistan. The field and laboratory studies used in the investigation described here involve a number of tests and analyses which generally are not made in studies of ground-water quality. These included well-head tests for hydrogen ion (pH); electrode potential reading (called Eh for convenience) ; ferrous, sulfide, and bicarbonate ions; and short- term measurements of corrosion rates with special test equipment. These measurements relate to unstable properties or components which can be expected to change during transit of water samples to the laboratory. Results obtained, together with field observations of affected well parts and data from conventional laboratory analyses for more stable water components and mineral deposits, were sub jected to rigorous thermodynaniic studies in an effort to understand observed behavior. The field tests have been described in detail in an earlier open-file report (Clarke and Barnes, 1964). Brief descrip tions are presented here for convenience of the reader.
Tests for pH and bicarbonate ion were made by the methods of Barnes (1964). In these methods, an electronic pH meter with glass- calomel electrode system is used both for measuring the pH and for detecting the chemical equivalence point in the electrometric titration

CORROSION IN TUBE WELLS, INDUS PLAINS, WEST PAKISTAN L17
for bicarbonate ion. Electrode potential was measured by the method of Back and Barnes (1961) using a platinum-calomel electrode system in a special flow cell (figs. 12 and 13), together with the above-men tioned pH meter, w^hich served as a potentiometer*. Ferrous ion was determined colorimetrically with bipyridine reagent, and sulfide ion was determined by iodometric titration, as described by Clarke and Barnes (1964). Short-term corrosion rates were measured with an electrical-resistance type wire-loop probe inserted in the well water and monitored with .a portable Kelvin Bridge circuit (eorrosometer). This senses resistance changes in the test loops as evidence of change in diameter of the metal test specimens. The meter's dial reading rep resents an average value over the entire specimen, and therefore the reading is easily converted to metal penetration in inches per year (ipy) or any other convenient unit of metal loss. The type and size of wire corrosion specimens are selected to provide various rates of testing and sensitivity to corrosion. Such corrosion data in themselves are not quantitative indications of well life; however, they provide an excellent means for comparing performance of a particular metal in a variety of ground waters, or the effects of a particular ground water on various construction materials. Corrosometer tests provide useful data for correlating well performance records 'and water- quality data. A corrosion probe with its guard removed to show the wire loop specimen is illustrated in figure 14.
FIGURE 12. Measuring electrode potential.

LI 8 CONTRIBUTIONS TO THE HYDROLOGY OF ASIA AND OCEANIA
FIGURE 13. Platinum-calomel flow cell for measuring electrode potential.

CORROSION IN TUBE WELLS, INDUS PLAINS, WEST PAKISTAN L19
FIGTJBE 14. Corrosion probe with guard removed to show element.
323-0S2 i

L20 CONTRIBUTIONS TO THE HYDROLOGY OF ASIA AND OCEANIA
Long-line corrosion current studies were made on selected SCARP-1 wells by the standard procedure of burying a copper sulfate reference electrode at various distances from the well, connecting it to the well head through a potentiometer, and measuring well-casing potential against the reference (fig. 15). This reveals differences in electrical po tential between upper and lower portions of the casing filter pipe assembly. Results of the tests have been discussed by L. P. Sudrabin (written commun., 1964). Such surveys are useful in detecting massive corrosion cells caused by differences in concentrations of air or salt dissolved in the water at various levels in the underground system.
Actual corrosion and encrustation effects on water-well components were determined by optical and microscopic examination of well screens and casings and by laboratory analyses.
In addition to the special field tests, complete laboratory analyses were made on all water samples. Water-formed deposits were ex amined by microscopic, X-ray diffraction, X-ray fluorescence, and spectrographic methods.
Both field and laboratory data are needed to determine states of reactions among minerals and a variety of ground-water solutes be fore the probable behavior of the water can be predicted. The calcula tions involved and results obtained in such analyses are discussed later in this report.
FIGUEE 15. Measuring long-line potential, SCARP-1 well.

CORROSION IN TUBE WELLS, INDUS PLAINS, WEST PAKISTAN L21
ON-SITE INTERPRETATIONS OF DATA
Certain of the field data can be interpreted immediately in terms of effects of ground water on well parts. Presence of ferrous ion, a com mon solute in West Pakistan wells, is positive evidence that the water has dissolved iron from subsurface geologic formations, ferrous well parts, or both. Electrode potential readings below 200 mv (millivolts), which are common in the Indus Plains, show that the environment is favorable to sulfate-reducing bacteria which are likely to cause cor rosion. When plotted on a stability field diagram (fig. 16) of the type
+ 1.20
+ 1.00 -
+ 0.80
+0.60 -
+ 0.40 -
+0.20 -
-0.20 -
-0.40
-0.60 -
AWEST PAKISTAN WELLS
:::K"*:::;:Sx Mild to moderate corrosion 1
Illilllllmoderate to heavy encrustation
Sffm Fe(OH)3c!}:|::.;:j-x._-:|:j::::
EGYPTIAN WELL. (Severe corrosion)
NIGERIAN WELL. (Severe corrosion)
FIGURE 16. Stability field diagram, ferric and ferrous species, assuming 2X10'7 molal activity of iron and based on Fe(OH) 3.

L22
published by Hem and Cropper (1959), Eh-pH relationships give useful information regarding probable intensity of corrosion. In this diagram, the central curved line is fixed by the Nernst equa tion, and it separates the oxidized species above the line from the reduced species below. The vertical lines which separate the species are determined from related equilibrium constants. Corrosive waters like the Egyptian and Nigerian examples plot within the ferrous ion field (reduced). This may be because 'the reducing environment pre vents retention of protective films on steel well parts. Those waters which plot near the boundary between ferrous ion and ferric hydrox ide have marginal qualities and are likely to cause both mild corrosion and related encrustation. Those which fall in the ferric hydroxide field are more likely to cause encrustation problems than corrosion prob lems. Ground waters of the Indus Plains belong to the last two classes.
PATTERN AND NATURE OF WATER-WELL ENCRUSTANTS
Mineral encrustation is prevalent and troublesome in Pakistan wells. Deposits include minerals precipitated directly from the ground water, as well as corrosion products resulting from reactions between the water and well-construction materials. Examination of wells which have lost pumping capacity invariably shows a majority of casing slots to be clogged with mixed mineral deposits. It is not uncommon to find in the same well adjacent sections of slotted pipe with markedly dif ferent amounts of deposit. For example, one side of a casing may be heavily encrusted, whereas the opposite side is almost completely clean (fig. 17). Whenever there is limited encrustation, the deposits are con centrated around the slots of the filter pipe, as shown in figure 18. Regardless of the intensity of external encrustation, the insides of casings and filter pipes always are rather clean, with no more than eggshell thickness of mixed corrosion products and mineral deposits. Pumps and column pipes also appear to be free of troublesome deposits. Encrustation is known to have extended into the gravel shrouding for several inches, as shown in figure 19. There is some evidence that use of calcareous gravel is at least partially responsible for this effect.

CORROSION IN TUBE WELLS, INDUS PLAINS, WEST PAKISTAN L23
The compositions of SCARP-1 encrustants are as variable as their depositional patterns, but calcium and iron are the major elements. External crusts are predominantly iron carbonate (siderite) with much smaller amounts of calcium carbonate (calcite) and heavy metal constituents. Deposits removed from the casing slots, like the one shown in figure 20, generally are complex, multilayer, sandwichlike plugs consisting of the original slot filling plus several layers of corro sion products on either side of it. This layering appears to be the result of continually changing depositional patterns, which are presumably the result of catalytic effects of successive deposits. The structure of the slot filling is shown in figure 21.
FIGTJKE 17. Preferential encrustation of steel casing (X 1%), Shadman well34, SCARP-1.

FIGURE 18. Localized encrustation of casing slots, Shadman Well 34, SCARP-1.
FIGURE 19. Encrusted gravel pack (X 3), well TW2, Sind area.

CORROSION IN TUBE WELLS, INDUS PLAINS, WEST PAKISTAN L25
FIGURE 20. Mineral deposit from casing slot (X 4), Shadman well 34, SOARP-1.
FIGURE 21. Structure of slot deposit, Shadman well 34, SCARP-1. Numbers correspond to zones of encrustation in table 2.

L26 CONTRIBUTIONS TO THE HYDROLOGY OF ASIA AND OCEANIA
The analytical data, obtained by emission spectrography, X-ray diffraction, and X-ray fluorescence are presented in tables 1 and 2.
TABLE 1. Composition of deposits, in percent, from Shadman well 34
[Sulfur was determined quantitatively by X-ray fluorescence; other determinations were made semiquanti- tatively by emission spectrography. Analyses by Pauline Dunton, U.S. Geological Survey. Samples 1 and 2 represent separate deposit plugs removed from casing slots of Shadman well 34]
Element found
Calcium (Ca) .......
Cobalt(Co) ..........
Nickel(Ni). ........Sulfur(S). ............
Pump Casing suction interior
side
.... 10 .1.3 .1
.. _ .. ___ . .007.003 .1
- .01.005 .03
- ..- 14
Casing exterior
Casing, slot plug,
metal side
Casing, slot plug, s
central part
Sample 1 Sample 2 Sample 1 Sample 2
37 .5 .5 .01 .5 .07 .3
3
34 .1 .5 .03 .7 .05 .3
48
.5
.03 1.0 .1 .3 4
165.1.009 .03 .003 .005
27
.1
.003
.05
.007
.005 18
Casing, lot plug inter
mediate layer
44
.1
.007
.05
.007
.03
TABLE 2. Minerals identified in deposits from Shadman well 34
For photograph and diagram of casing slot plug structure, see figs. 20, 21. Identification by Roger WolfE and Blair Jones, U.S. Geological Survey]
Zones 1 and 5
Siderite(FeC03) Mn3O4 _ _(spinel)
Cu(OH) 2____.
Hausmanite(Mn304)
(Fe304)
(Fe203)
Slot filling
Zones 2 and 4
._ Cu(OH) 2 ___
(FeS)
(Si02)
ZoneS
(Si02)
(CaC03) Siderite _(FeC03)
Mackinawite(FeS) Mica?
Feldspar? _
Crust from
slotted pipe
Siderite. _(FeCOs) Cu(OH) 2 _
Mn3O4 _(spinel) Calcite _
(CaCOs)
Crust from Inside
Cu(OH) 2
Mackinawite(FeS)
Siderite(FeCOs)
Mn(OH) 2?
They show the original slot filling to be primarily quartz (SiO2 ) from the geologic formation (sand particles) held in a deposited matrix of siderite (FeCO3 ), with smaller amounts of mackinawite (FeS, tetrag onal) , mica, and feldspar. The outermost surfaces of the plug, which contacted the corroding steel (fig. 21, zones 1 and 5) contained siderite CFeCO3 ), spinel (MnsO4), copper hydroxide [Cu(OH) 2], hausman- nite (Mn3O4, tetragonal), magnetite (Fe3O4 ), possibly maghemite (Fe2O3 ), and detrital quartz and mica. The intermediate layers be tween the original slot fillings and the outermost layers, which depos ited as corrosion proceeded (fig. 21, zones 2 and 4), contained copper hydroxide [Cu(OH) 2] and mackinawite (FeS, tetragonal), as well as quartz, but there was no carbonate. This depositional pattern suggests

CORROSION IN TUBE WELLS, INDUS PLAINS, WEST PAKISTAN L27
complex interactions between corrosion and encrustation processes in the steel system. Slot plugs in brass filter pipes were found to be far less complex and consisted mostly of calcite. They were confined pri marily to the original slot opening because of the very limited metal loss in filter pipe constructed from this alloy.
NATURE AND SIGNIFICANCE OF CORROSION DAMAGE
From the limited amount of well parts available for examination, it would appear that significant corrosion damage in water wells of the Punjab is concentrated almost entirely in the saw slots of the filter sections, although occasional corrosion in threads of steel casings jointed with cast iron couplings has been observed. The interiors and exteriors of blank (unslotted) casings generally show little evidence of metal loss; and pump parts, including the bowls, impeller blades, and shafts, also are free from significant corrosion damage. Even the relatively sensitive pump column pipes (above the pump bowls) show little damage in SCAEP-1 wells.
In the saw slots of the filter pipes it is sometimes difficult to determine the extent of damage by casual inspection. Metal attack starts on the sawed slot faces and proceeds so gradually that metal is replaced by corrosion products with little evidence that conversion of the metal to friable reaction product has occurred. Only when a deposit is dis lodged from the slot or eroded away is the extent of damage clearly evident. Figure 22 shows slots which were seriously corroded and eroded by local concentration of flow in an otherwise almost com pletely encrusted section of filter pipe. In some wells corroding slots develop into relatively large holes of the type shown in figure 23.
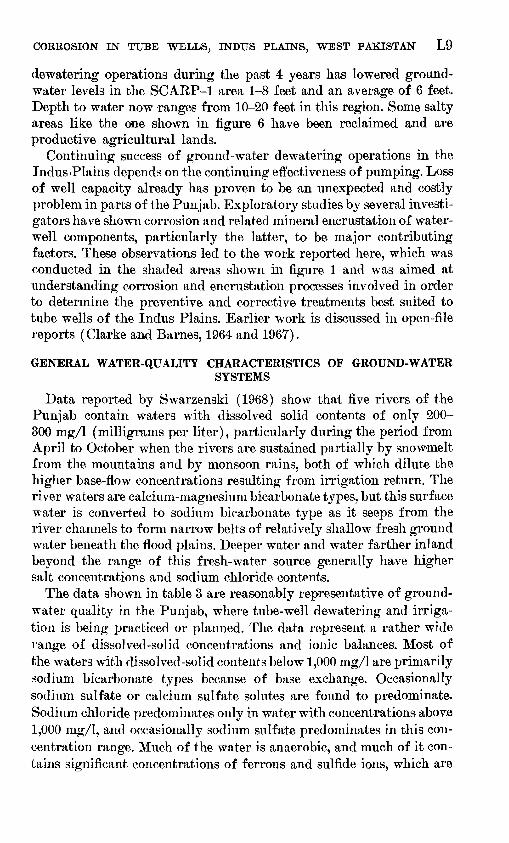
Both forms of localized damage are typical effects of relatively moderate corrosion, which concentrates attack on the most active (anodic) surfaces of the electrochemical system. Most of the ground waters examined in the Indus Plains can be described as mildly or moderately corrosive, and they fall into a class which would not be considered intolerably aggressive to steel tube wells, if it were not for the loss of critical dimension in the abnormally sensitive casing slots and troublesome interactions between corrosion and encrustation processes. The corrosion curves in figures 24-27, obtained with the electrical-resistance type oorrosometer probes, agree with the moderate corrosion revealed by visual inspection of damaged casings.
The fact that corrosion of steel is moderate and concentrated pri marily in the casing slots does not reduce its seriousness from the standpoint of well maintenance. Slot dimensions control well perform ance. Enlarging them, either through gradual metal wasting or by periodic removal of corrosion products to restore capacity, defeats
323-982 O 69 5

L28 CONTRIBUTIONS TO THE HYDROLOGY OF ASIA AND OCEANIA
FIGURE 22. Casing slot damaged by corrosion and erosion (approximate mag nification, X 4), Shadman well 34, SCARP-1.

CORROSION IN TUBE WELLS, INDUS PLAINS, WEST PAKISTAN L29
FIGURE 23. Localized corrosion hole (approximate magnification, X 2), Shahkot well 198. Courtesy of David Greenman, Tipton and Kalmbach, Inc.
L3'0 CONTRIBUTIONS TO THE HYDROLOGY OF ASIA AND OCEANIA
C
O
O 140
00
£EOO 60,
120 -
100 -
10 20 TIME, IN DAYS
FIGURE 24. Corrosion curve, mild steel, Shadman well 27.
their original design purpose stabilization of the gravel pack and aquifer sand while admitting water to the borehole. Clogging the slots with mixtures of corrosion products and related mineral encrustants is equally intolerable because of reduction in capacity. For these rea sons, corrosion of steel is a significant, and, in some cases, an intolerable problem in water wells of the Indus Plains, although the corrosion rates observed would be considered rather insignificant by quantitative
vStandards.CAUSES OF CORROSION
All corrosion in aqueous media is electrochemical in nature, where by solution of iron in anodic areas forms ferrous ion and releases electrons which flow to cathodic areas where they neutralize hydrogen ion and cause atomic hydrogen to plate out on the metal surface. The reactions eventually become blocked (polarized), because of metal ion concentration in the system and hydrogen plating on the cathode areas, unless depolarizing processes, such as combination of dissolved oxygen with hydrogen or scouring away of reaction products, occur. Surfaces of active metals, such as steel, are covered with innumerable microscopic anodes and cathodes resulting from slight differences in composition or physical characteristics of the metal surface. In the
CORROSION IN TUBE WELLS, INDUS PLAINS, WEST PAKISTAN L31
C
O
O
180
160
<S 140
z
5 Si 120
LJ uj
tS 100So.
00 80
60
40
Average corrosion rate,0.015 ipy _..; " v""-:
Maximum corrosion fjjd&Jl^K 0.021 ipy .:: Si||P®::
«* ^
E Z
10 20
TIME, IN DAYS
30
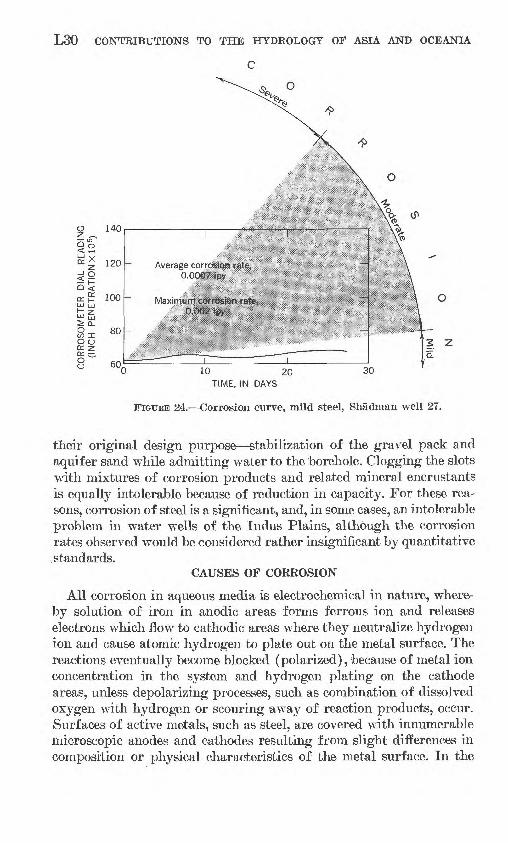
FIGURE 25. Corrosion curve, mild steel, Shadman well 47.
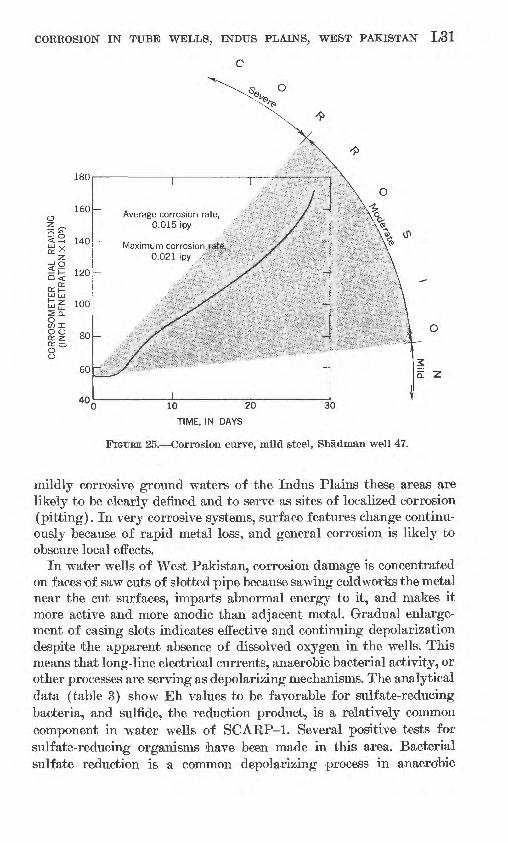
mildly corrosive ground waters of the Indus Plains these areas are likely to be clearly defined and to serve as sites of localized corrosion (pitting). In very corrosive systems, surface features change continu ously because of rapid metal loss, and general corrosion is likely to obscure local effects.
In water wells of West Pakistan, corrosion damage is concentrated on faces of saw cuts of slotted pipe because sawing coldworks the metal near the cut surfaces, imparts abnormal energy to it, and makes it more active and more anodic than adjacent metal. Gradual enlarge ment of casing slots indicates effective and continuing depolarization despite the apparent absence of dissolved oxygen in the wells. This means that long-line electrical currents, anaerobic bacterial activity, or other processes are serving as depolarizing mechanisms. The analytical data (table 3) show Eh values to be favorable for sulfate-reducing bacteria, and sulfide, the reduction product, is a relatively common component in water wells of SCARP-1. Several positive tests for sulfate-reducing organisms have been made in this area. Bacterial sulfate reduction is a common depolarizing process in anaerobic
L32 CONTRIBUTIONS TO THE HYDROLOGY OF ASIA AND OCEANIA
C
CORROSOMETER DIAL READING (INCH PENETRATION xlO5)
J> en oo o r\ o o o o c
1 ,Average corrogjfill
_ o.oo5§;I|pm
i
if--
\
i:
Sll"
_^'
13 10 20 3(
TIME, IN DAYS
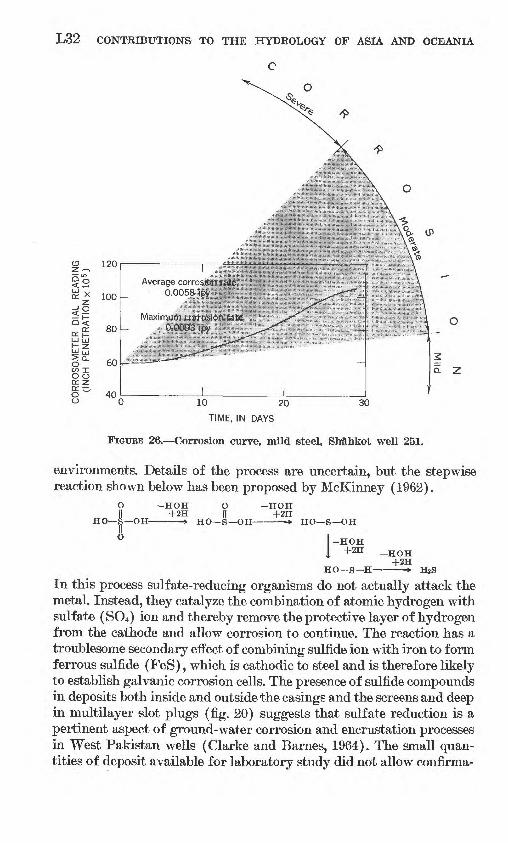
FIGURE 26. Corrosion curve, mild steel, SMhkot well 251.
environments. Details of the process are uncertain, but the stepwise reaction shown below has been proposed by McKinney (1962).
O HOH O HOHII +2H || +2H
HO S OH » HO S OH * HO S OH
-HOH+2H _H OH
+2H HO S H » HsS
In this process sulf ate-reducing organisms do not actually attack the metal. Instead, they catalyze the combination of atomic hydrogen with sulf ate (SO4 ) ion and thereby remove the protective layer of hydrogen from the cathode and allow corrosion to continue. The reaction has a troublesome secondary effect of combining sulfide ion with iron to form ferrous sulfide (FeS), which is cathodic to steel and is therefore likely to establish galvanic corrosion cells. The presence of sulfide compounds in deposits both inside and outside the casings and the screens and deep in multilayer slot plugs (fig. 20) suggests that sulf ate reduction is a pertinent aspect of ground-water corrosion and encrustation processes in West Pakistan wells (Clarke and Barnes, 1964). The small quan tities of deposit available for laboratory study did not allow confirma-

CORROSION IN TUBE WELLS, INDUS PLAINS, WEST PAKISTAN L33
C
O
O
160
140 Average corrosiorg^^32£x*155*£UJ LU1 z;
^1SxOOo:zcc oOo
120
100
80
60
40(
0.004 ipp :>;; s M:<
Maximum.^j^iiia^t^
^ftnik***^'-"'"'''' '\ \
3 10 20
: ---:-: ' ' j.-'.?/-?/--.-:*/-?.-'.- ->>: ]
./- .;: .-:- v: .- - >.:: ; :--: X^-vv^-:-: ^^i
I I30 40
TIME, IN DAYS
FIGTIKE 21. Corrosion curve, mild steel, S'Mhkot well 252.
tion of the 3 Fe(OH) 3/l FeS structure which characterizes deposits involving such bacterial activity.
Evidence of long-line current flow also was found in the Indus Plains. This flow undoubtedly provides some depolarization which otherwise would have to be supplied by local processes. Well-head measurements using remote copper sulfate electrodes (fig. 15) on a number of SCARP-1 wells yielded electrical potentials of the order of 500 mv, rather than the 850 mv potential expected for an anaerobic aqueous system containing iron or steel (L. P. Sudrabin, written commun., 1964). A potential of 500 mv is typical of steel corroding in aerated water and indicates that local corrosion cell effects in the screen slots probably are being intensified by superimposed long-line currents flowing from deep anodic surfaces to cathodic areas of casings surrounded by aerated soil near the land surface.
In most of the West Pakistan wells the EH-ph relationships favor mild or moderate corrosion. They are marginal environments between the stability fields of ferrous ion and ferric hydroxide (fig. 16), so that both removal of protective films and solution of iron would be expected.
L34 CONTRIBUTIONS TO THE HYDROLOGY OF ASIA AND OCEANIA
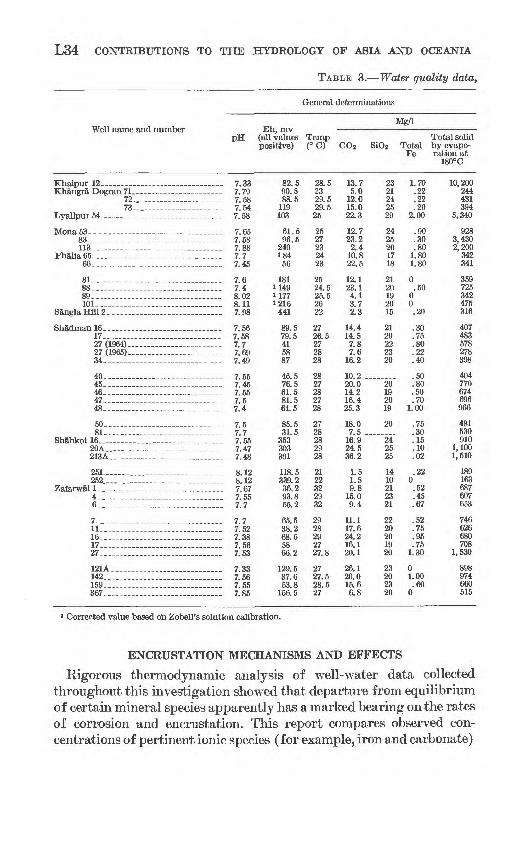
TABLE 3. Water quality data,
General determinations
pH (all values positive)
Khaipur 12 .. __ . Khangra Dogran 71. - . _
72.. .. ... ...73-. .
Lyallpur 54.- -- . _ _
Mona53- ___ _ _ _ __ _.83_- ____ - _ -__ -113_- _________
Phalia65 ... . .66-. -
81 88- _ _89 101_-__ ___
Sangla Hill 2_ . . _____
Shadmanl6-. ___ _ _17 . 27 (1964)- 27 (1965) 34-. _______
40-. _ - ___45-. __- ___ -46-.. __47 48
60- 81
Shahkot 16. _ 20A _____ 213A ._ _- __ _
251. __ .252
Zafarwal 1 ___ __.. ___ .4 _ ___ .6
7- ___ ____11 16-. ___ 17 27
121A-- ___142 159 _ __ - -367-. ___
._ _ _ 7.33 7.79. 7.58.. 7.54 7.58
. 7.65 _ 7.58 . 7.88- _ 7.7 _-_._ 7.45
. 7.6 - 7.4 8.02 ___ 8.11 - 7.98
_ 7.56 7.58__ , _ - 7.7 ____ 7.69 7.49
7.55-. _ .. 7,45
-_____ 7.55 _ 7.5 7.4
_-____ 7.5 7.7
. ___ 7.55
.. . 7.47
. . 7.48
_____ ___ 8.12 - 8.12 7.67. ____ 7.55... ..__ _ 7.7
7.7__.. __ 7.52 - 7.38 7.56 7.53
_ ___ 7.33_ 7.56
7.55 7.85
82.590.588.5
119103
61.596.5
240184
56
181114911771216
441
89.579.5415887
46.576.561.581.561.5
85.531.5
353303391
118.5339.236.293.855.2
65.538.268.55866.2
129.537.653.8
156.5
Mg/1
Temp (°C)
28.52329.529.5
25
2527232423
2524.525.52622
2726.5272828
2827282728
2728282928
2122322932
2928292727.8
2727.528.527
Total solid CO 2 SiO2 Total by evapo-
Fe ration at
13.75.0
12.015.022.3
12.723.22.4
10.822.5
12.123.14.13.72.3
14.414.57.87.6
16.2
10.2 ...20.014.216.425.3
18.07.5 .
16.924.536.2
1.51.59.8
15.09.4
11.117.624.216.120.1
26.120.015.66.8
2321242529
2425201718
2120192015
2120222320
20192019
20
242525
1410212321
2220201920
23202320
1.70.22.22.20
2.00
.90
.30
.801.801.80
0.50
00.20
.30
.75
.80
.22
.40
.50
.80
.50.70
1.00
.75
.30
.15
.10
.02
.220.52.45.67
.52
.75
.95
.751.30
01.00.60
0
180°C
10, 200244431394
5,340
9283,4302,200
342341
359725342475316
407483578278398
404770674696966
481530910
1,1001,510
189163687607653
746626680708
1,530
898974660515
i Corrected value based on Zobell's solution calibration.
ENCRUSTATION MECHANISMS AND EFFECTS
Rigorous thermodynamic analysis of well-water data collected throughout this investigation showed that departure from equilibrium of certain mineral species apparently has a marked bearing on the rates of corrosion and encrustation. This report compares observed con centrations of pertinent ionic species (for example, iron and carbonate)

CORROSION IN TUBE WELLS, INDUS PLAINS, WEST PAKISTAN L35
Indus Plains wells, West Pakistan
Cations (mg/l) Anions (mg/l)
Al Ca Mg Na K Fe++ Mn Cu Cl HCO 3 CO3 S SO 4
0.9000.5
.3
.6
.50.1
00.10.4
00.2
0.01
.5
.3
.3
.1
0
.5
.5
.1
000.1.2
00000
.1000
34428393960
4189635047
2670181429
4755464262
3758436362
5634353616
2728385443
4049625275
69585427
415162323106
4452372127
1238101113
1317151627
2523161817
2010212640
109
201917
1914171528
26171818
2,350358476
1,500
1038256006248
881309814019
88110443561
56959877
150
12066155190496
1915
200138166
202158155185453
195280150135
424.84.36.7
28
3.86.26.73.45.3
3.56.11.72.63.6
3.13.14.85.03.1
4.96.73.44.1
4.4
6.06.29.1
4.33.83.25.04.5
4.54.54.43.85.8
6.35.56.53.6
1.7.2.22'.7
.9
.3
.11.81.8
0.5
00.1
.3
.75.8.22.4
.5 _
.7
o1.0
.75
.3 .000
. 22o'
. 52
.45
.67
.52
.75
.95
.751.3
01.0.60
0.26.12.12. 12!l3
12!420.4
0
.02
.04
.02
.02
.14
0.05.24.10.12
.27
.19
. 22!34
.05
.10
.050
.100.09.09.11
.11
.11
.11
.11
.11
0.08.09.04
0000.26
.17
.35
.2000
00.020.47
00.12.04.04
.25
.15
.16
.09
.02
.26
.21
.02
00.22
00
00000
0000
3,0003.6209.3
1,490
39460925138
11796.1153.5
2632161323
12.626222241
3612.63240145
6.83.8
1086096
74566986448
1591858138
265183306321678
394690131341333
327407295328138
366388271259357
266399359366459
404142432536810
126123344387354
408420425421514
289533402340
0.5.57.64.57
2.4
1.12.3.8.91.46
.68
.521.62.2.8
.64
.76
.81.7.7
.6
.8
.8
.8
.8
.59
.91.1
l'.15
1.81.81 21.01.4
1.51.0.7
1.11.4
.271.41.01.15
0.65.75
1.152.1
1.0.61.251.1
.7
.35
.7
.4
.1
.9
.97
.251.1.5
.2
.6
.4
.9
.5
.7
.451.0
.501.1.75.5
0.1.65.5.5
1.0.95
1.0.5
3,220O
6475
1,150
1168741814444
44209529929
6092221845
912564956104
92130121267380
4228111117126
187115141142230
26015311097
with calculated equilibrium concentrations of the same species in the same environment. The degree of undersaturation or supersaturation determined by this analysis is an indication of the driving forces in pertinent chemical processes. Such calculations do not indicate chemi cal effects on well components in a quantitative way because such effects also are influenced by kinetic and catalytic factors.
L36 CONTRIBUTIONS TO THE HYDROLOGY OF ASIA AND OCEANIA
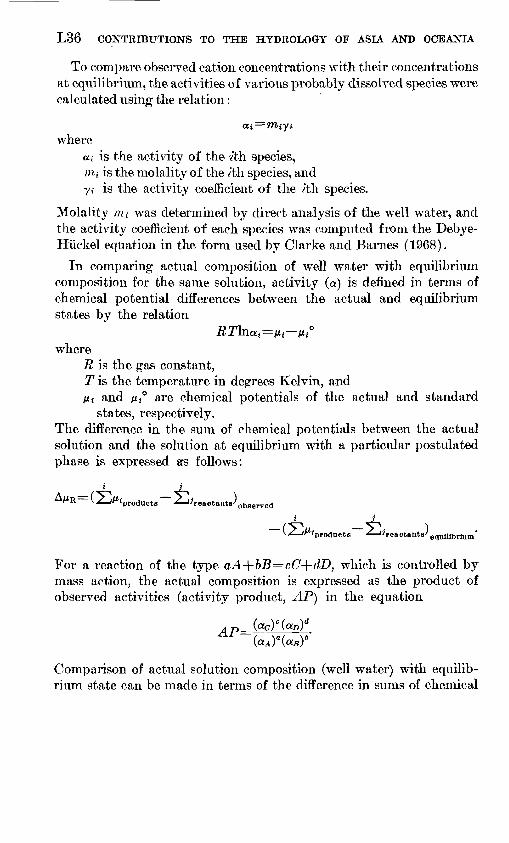
To compare observed cation concentrations with their concentrations at equilibrium, the activities of various probably dissolved species were calculated using the relation :
where«! is the activity of the ith species,m » is the molality of the /th species, andyi is the activity coefficient of the /th species.
Molality nit was determined by direct analysis of the well water, and the activity coefficient of each species was computed from the Debye- Hiickel equation in the form used by Clarke and Barries (1968).
In comparing actual composition of well water with equilibrium composition for the same solution, activity (a) is defined in terms of chemical potential differences between the actual and equilibrium states by the relation
whereR is the gas constant,T is the temperature in degrees Kelvin, andHi and 1*° are chemical potentials of the actual and standard
states, respectively.The difference in the sum of chemical potentials between the actual solution and the solution at equilibrium with a particular postulated phase is expressed as follows:
equlilbrlum
^R ^ -^^products ^-^reactants' obgerve(1
i J
{^-iVi products '" /reactants'
For a reaction of the type aA-\-bB=cC-\-dD, which is controlled by mass action, the actual composition is expressed as the product of observed activities (activity product, AP) in the equation
Comparison of actual solution composition (well water) with equilib rium state can be made in terms of the difference in sums of chemical
CORROSION IN TUBE WELLS, INDUS PLAINS, WEST PAKISTAN L37
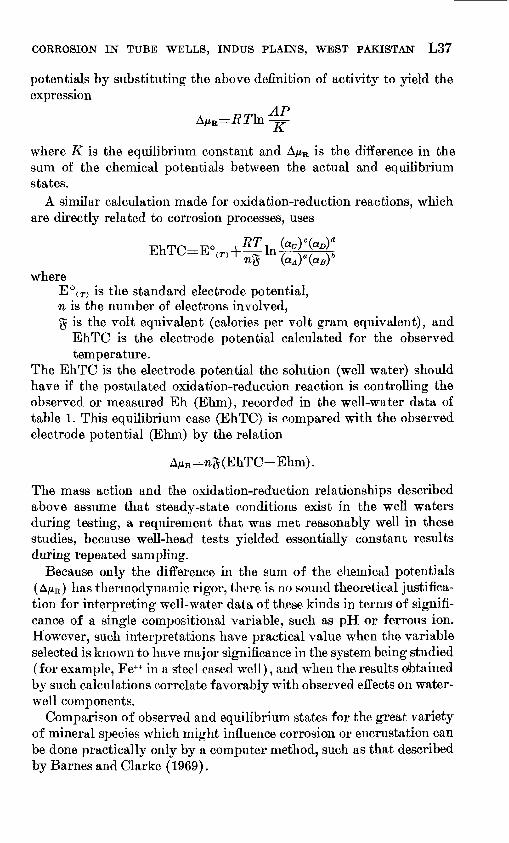
potentials by substituting the above definition of activity to yield the expression
AP K
where K is the equilibrium constant and A/zR is the difference in the sum of the chemical potentials between the actual and equilibrium states.
A similar calculation made for oxidation-reduction reactions, which are directly related to corrosion processes, uses
whereE° (r) is the standard electrode potential,n is the number of electrons involved,g is the volt equivalent (calories per volt gram equivalent), and
EhTC is the electrode potential calculated for the observed temperature.
The EhTC is the electrode potential the solution (well water) should have if the postulated oxidation-reduction reaction is controlling the observed or measured Eh (Ehm), recorded in the well-water data of table 1. This equilibrium case (EhTC) is compared with the observed electrode potential (Ehm) by the relation
The mass action and the oxidation-reduction relationships described above assume that steady-state conditions exist in the well waters during testing, a requirement that was met reasonably well in these studies, because well-head tests yielded essentially constant results during repeated sampling.
Because only the difference in the sum of the chemical potentials (A/xR ) lias thermodynamic rigor, there is no sound theoretical justifica tion for interpreting well-water data of these kinds in terms of signifi cance of a single compositional variable, such as pH or ferrous ion. However, such interpretations have practical value when the variable selected is known to have major significance in the system being studied (for example, Fe++ in a steel cased well) , and when the results obtained by such calculations correlate favorably with observed effects on water- well components.
Comparison of observed and equilibrium states for the great variety of mineral species which might influence corrosion or encrustation can be done practically only by a computer method, such as that described by Barnes and Clarke (1969) .

L38 CONTRIBUTIONS TO THE HYDROLOGY OF ASIA AND OCEANIA
The usefulness of such studies in assessing water-well problems of the Indus Plains is evident in figures 28-34, where equilibrium data
actual concentration , -,[log (equilibrium concentration 7
for particularly significant minerals are plotted against measured cor-
+ 2
+ 1
-2 -
-3
+ 2
+ 1
Shadman 27J ^Nigerian
^ Egyptian
/ Egyptian
^ Shahkot 251 .SATURATIONt-
Egyptian
Shadman 47 Nigerian
Moderate corrosion
Severe corrosionI____I
Extreme corrosion
) 0.02 0.04 0.06 0.08 0.10
AVERAGE CORROSION RATE, IN INCHES PER YEAR
FIGTTBH 28. Relation of corrosion to equilibrium state, FeCO3.
-1 -
-2 -
-3
-4
1
Shadman 27
/ Shahkoty *sh iShahkot 251
"^Egyptian
Eg!
"
Moderatecorrosion
1 1
252 adman 47
^ Nigerian
Egyptian ptian
Severecorrosion
1
1 1 1
ENCRUST
CORRODE
Nigerian ~~
"
Extremecorrosion
1 1I 0.02 0.04 0.06 0.08 0.10
AVERAGE CORROSION RATE, IN INCHES PER YEAR
FIGURE 29. Relation of corrosion to equilibrium state, CaCOa.

CORROSION IN TUBE WELLS, INDUS PLAINS, WEST PAKISTAN L39
TO
+ 2
+ 1
0
-1
-2
-3
-4
-5
G
1
Shahkot 251
-
^Shadman 27
Shac
-
^Egyptian
E
-
L
Moderate corrosion
1
1 1
man 47
Egyptian
gyptian
9 Nigerian
Severe corrosion
1 1
1 1 1 1
_
ENCRUST
CORRODE
-
^ Nigerian "
Extreme corrosion
I 1 1 10.100 0.02 0.04 0.06 0.08
AVERAGE CORROSION RATE, IN INCHES PER YEAR
FIGURE 30. Relation of corrosion to equilibrium state, Fe(OH) 3.
rosion rates in steel parts of the corresponding wells. Similar data from troublesome well fields in the Western Desert of Egypt and the Chad Basin of Nigeria are included for comparison. The corrosion ranges, marked by vertical dashed lines and representing moderate, severe, and extreme damage, are those normally accepted by corrosion engineers. In each case the heavy solid horizontal line represents equi librium concentration (saturation) for the mineral species identified on the ordinate. Plotted points above and below this line represent well waters supersaturated and undersaturated, respectively, with this spe cies. Positive correlation between severity of corrosion and degree of saturation with both Fe(OH) 3 and CaCO3 is evident in these plots. However, tests in other well fields suggest that the CaCO3 relationship is the more consistent one. There appears to be no consistent relation between corrosion rate and degree of saturation with iron carbonate

L40 CONTRIBUTIONS TO THE HYDROLOGY OF ASIA AND OCEANIA
+ 7
+ 6
+ 5
+4
= +3
+ 2
+ 1
-1
-2
1
Shahkot 251~"
Shadman 27
Shi
^Egyptian
E
Moderatecorrosion
1
1 1 1 1 1 1 1
-
dman 47
Egyptian
;yptian Nigerian
Nigerian
^ SATURATION
Severe Extremecorrosion corrosionII 1 1 1 1
0.02 0.04 0.06 0.08 0.10
AVERAGE CORROSION RATE, IN INCHES PER YEAR
FIQTJEB 31. Relation of corrosion to equilibrium state, FesCX.
(FeCO3 ), although this is a troublesome encrustant in steel-cased water wells, and particularly so in the Indus Plains.
Other interesting relationships between ground-water qualities and effects on steel well parts also are evident in equilibrium data of table 4. From the standpoint of corrosion, it is significant that virtually all anaerobic waters represented by the diagram in figures 28-34 are un- dersaturated with ferrous hydroxide [Fe(OH) 2], a primary product of corrosion of steel, and iron metal, the material undergoing solution in steel systems. Undersaturation with ferrous hydroxide and iron metal indicate capacity of the water for dissolving iron, and one would expect corrosion in such an environment unless there are inhibiting processes. All waters were supersaturated with Fe3O4 and unsaturated with Mn3O4 the highest concentrations occurring in the least corro sive wells in each case. The fact that waters slightly supersaturated

CORROSION IN TUBE WELLS, INDUS PLAINS, WEST PAKISTAN L41
T 1
0
-2
-9
-10
-11
-12
5
: -13
5r^ -14
|1 -15
1-16
~Z -17
I-18
-19
-20
-21
-22
-23
-24
oc
1
Moderatecorrosion
1 1
Severecorrosion
1 1 1 1 /SATURATION
Extremecorrosion
^__J_____^J___^^- - i - - -i - - _ - -
~
Egyptian-* H ---
^Shadma
s
Shahkot I
^ Nigerian
Egyptian
Egyp
127
ladman 47-
2511 1
-
-
-
~""
.tian
Nigerian
III!0 0.02 0.04 0.06 0.08 0.10
AVERAGE CORROSION RATE, IN INCHES PER YEAR
FIGURE 32. Relation of corrosion to equilibrium state, Fe.
with ferric hydroxide [Fe(OH) 3 ], as judged from analysis of well head samples, cause relatively mild corrosion of steel, whereas much more serious damage occurs in waters undersaturated with this species,

L42 CONTRIBUTIONS TO THE HYDROLOGY OF ASIA AND OCEANIA
+ 1
-1
-2
-3
-5
-6
-7
-9
-10
-11
-SATURATION
_ Shahkot251
Shadman 27 i
Shadman|47
- Egyptian
JEgyptian
Egyptian ^Nigerian
> Nigerian
Moderate corrosion
Severe corrosion
I I
Extreme corrosionJ___L_
0 0.02 0.04 0.06 0.08
AVERAGE CORROSION RATE, IN INCHES PER YEAR
FIGURE 33. Relation of corrosion to equilibrium state, M
0.10
probably is significant. However, the true relationship of this meta- stable phase to corrosion processes has not yet been determined.
It is evident in table 4 that practically all waters tested in SCARP-1 were supersaturated with siderite and calcite the supersaturation fac tors of these materials range from 1.08-12.16. Field experience sug gests that supersaturation above a factor of 2 is likely to cause mineral deposition, either spontaneously or in combination with some reaction that serves as a catalyst. The relative rates of deposition from waters with various levels of supersaturation are unknown because catalytic
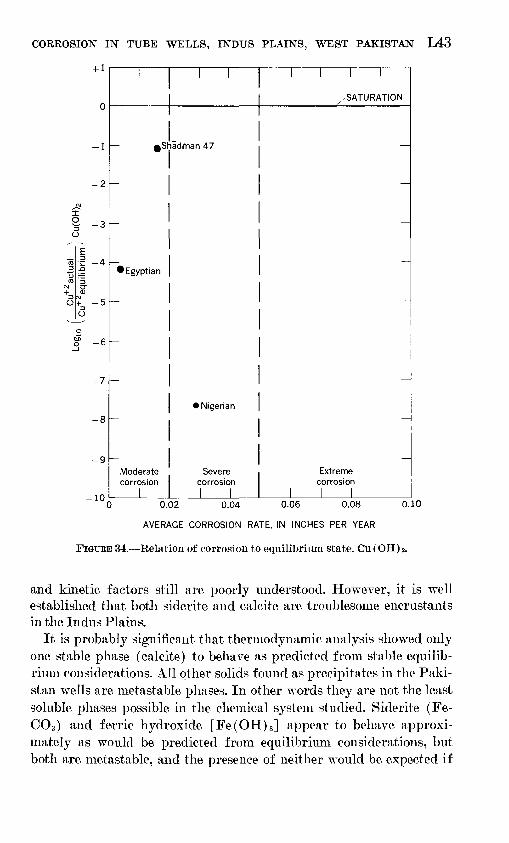
CORROSION IN TUBE WELLS, INDUS PLAINS, WEST PAKISTAN L43
+ 1
-1
-2
r -3»
I -4
o+ -5
-6
-7
-9
-10
.SATURATION
iShadman 47
Egyptian
Moderatecorrosion
I
Nigerian
Severe corrosion
Extreme corrosion
0.02 0.04 0.06 0.08 0.10
AVERAGE CORROSION RATE, IN INCHES PER YEAR
FIGURE 34. Relation of corrosion to equilibrium state, Ou(OH) 2.
and kinetic factors still are poorly understood. However, it is welJ established that both siderite and calcite are troublesome encrustants in the Indus Plains.
It is probably significant that thermodynamic analysis showed only one stable phase (calcite) to beha\7e as predicted from stable equilib rium considerations. All other solids found as precipitates in the Paki stan wells are metastable phases. In other words they are not the least soluble phases possible in the chemical system studied. Siderite (Fe- CO 3 ) and ferric hydroxide [Fe(OH) 3 ] appear to behave approxi mately as would be predicted from equilibrium considerations, but both are metastable, and the presence of neither would be expected if

L44 CONTRIBUTIONS TO THE HYDROLOGY OF ASIA AND OCEANIA
TABLE 4. Equilibrium data, selected
Well name and No.
Measured cation concentration
Cation concentration at equilibrium=cation ratio
CaCOs Iron, Fe Fe(OH) 2
Khaipur 12_____________ 2. 1831 3. 4338XIQ-23 3. 6049X 10-Khangra Dogran 73____ 1.3614 5. 9539X10-25 2.6568X10
72____ 1.4204 6.1772X10-2* 3. 1960X1Q-71____ 8. 1153X10-1 2.2996X10-2* 4. 1210X10-
Lyallpur 54___________ 2.0313____. 2. 2453X1Q-2* 3.8965X10
Mona 53_______________ 1.6977 1. 1416X1Q-22 1.0814X1083_______________ 4.0306 2.4334X10-2* 2.4445X10-113______________ 1.0305 2. 6527X10-3° 2. 2103X10-
Phalia 65_ _ _ _ _______ 2. 2398 3. 6698 X IQ~& 2. 5658 X 10"366_._____________ 1.2910 2.8369X10⁻²² 7. 1126X1Q-*
81_______________ 9.0021X10⁻¹ ________-___-_-----_-_-_--_-__._88_____________ 1.5441 6.1496X10⁻²⁸ 1. 7011X1Q-*89_______________ 1.5343 ______________---_--__-----_.___101______________ 1.5884 ________________________________
Sangla Hill 2____________ 9. 6410X1Q-1 1. 0944X1Q-38 4. 4690X1Q-*
Shadman 16_ ___________ 1. 7436 6. 0579X 1Q-2* 3. 2303 X 10~*17____________ 2.1215 2.9641X10⁻²³ 8.0622X1Q-*27 (1964) ______ l. 8475 7. 1861X10-22 1. 7170 X 10~327 (1965)______ 1.6741 6.1218X10⁻²³ 5. 1472X10~*34____________ 1.9612 1.1097X10⁻²³ 3. 4715X10~*
40____________ 7.9397X10⁻¹ 2. 6473X1Q-22 4. 8150X1Q-*45____________ 1.7583 3.7583X10⁻²³ 4. 4195X1Q-*46________ 1.6019 ________________________47____________ 1.6983 7.4560X10-2* 1. 6248X10~*48__________ 1.9266 1.8853X10⁻²² 5. 4601X1Q-*
50____________ 1.8897 1.9762X10⁻²³ 5. 8672XI0~*81____________ 1.3500 6.1822X10⁻²² 7. 0617X1Q-*
Shahkot 16___________ 1.4670 _ _ ____________________20A___________ 1.5036 ________________________________213A__________ 7.7976X10⁻¹ ________________________________
251___________ 1.0762 ___________________________252_____________ 1.1688 _____________________________
Zafarwal !____________ 1.9598 1. 0818X10-22 1. 5179X1Q-*4______________ 2.1122 6.3399X10-2* 4.3309X1Q-*6______________ 2.4461 1.5397X10⁻²² 1. 0522X1Q-3
7______________ 2.2377 3.8583X10⁻²³ 5. 9821X1Q-*11_____________ 1.8537 4.5795X10⁻²² 3. 8267X1Q-*16_____________ 1.7545 1.1779X10⁻²² 5. 2677X1Q-*17__ ___________ 2. 0059 1. 6004 X 10-** 7. 4707 X 10~*27___________ 2.8341 1.4138X10⁻²² 1. 0730X10-3
121A________ 1.4103 ______________-__-_________142__________ 2.7010 1.0405X10⁻²¹ 1. 0006X10-3159________ 2.1242 2.1868X10⁻²² 6. 9496X10~*367__________ 1.7723 _______________________.

CORROSION IN TUBE WELLS, INDUS PLAINS, WEST PAKISTAN L45
minerals, West Pakistan wells
Measured cation concentration
Cation concentration at equilibrium
Fe(OH) 3
5. 4924 2. 7384 X101 1. 1217X101 2. 1079 X101 2. 1169X101
1. 3726 X101 1. 0896 X101 4. 8678 X103 8. 5178X101 4. 3032
3. 6205 X101
FeCO 3
1. 6152 1. 0434 1. 0886 8. 7524X10-1 3. 5682
5. 6111 2. 0393 2.4698X10⁻¹ 1. 2158X101 7. 4655
1. 6618
Fe2O 3
1.8528X10⁶ 9. 0502X106 3. 7071X106 7.9809X10⁶ 7. 6818X106
4. 9807X106 3. 7916X106 1. 8431X10* 3. 1570 XlO7 1. 6293X106
1. 3278X107
Fe304
3. 8835 X104 1. 0026X105 5. 8812 X104 1. 1 194 X 10s 1. 0552 X 10s
1. 1108X104 5. 5595 XlO4 3. 4233X106 5. 1123X105 4. 6552 X104
1. 1572X105
3. 3201 XlO7
1. 0490 X101 1. 8351 X101 1. 1802 X101 6. 8893 8. 9623
2. 9975 6. 7395
3. 3728 4. 2892
1. 4216 X101 3. 4838
5. 0260X10-1
1. 6705 4. 3458 4. 8228 1. 3141 1. 8960
1. 6253 3. 1852
9. 6191X10-1 4. 6563
3. 7988 1. 7955
1. 2843 XlQi3
3. 6504X106 6. 4528X106 4. 1071 X106 2. 3482 X106 3. 0548X106
1. 0217 X106 2. 3453 X106
1. 1737X106 1. 4620X106
4. 9472X106 1. 1874X106
1. 5912X109
5. 9484 XlO4 1. 1839X105 1. 1230 X105 5. 1399 X104 5. 3715X104
2. 8863 XI O4 4. 9168X104
2. 2202 X104 3. 8221 XlO4
8. 8881 X104 3. 6250 XlO4
9. 6116X10-1 1. 7146X101 1. 4705 X101
1. 1283 X101 1. 6147 5. 3362 7. 1778 1. 3543 X101
4. 4457 5. 8257
3. 8352X10-1 2. 0478 2. 5589
2. 0921 2. 2675 4. 0214 4. 3425 7. 3636
6. 9841 3. 5336
3. 0194 X 10s 5. 7252X106 4. 6193X106
3. 7674X106 5. 5036 X105 1. 7818X106 2. 4978X106 4. 6354X106
1. 5311X106 1.9653X10⁶
8. 4700X103 8. 7267 X104 9. 9527X104
7. 3527 X104 1. 7700 X104 4. 2780 X104 6. 1083 X104 1. 0347X105
4. 8409 XlO4 5. 0269 XlO4
L46 CONTRIBUTIONS TO THE HYDROLOGY OF ASIA AND OCEANIA
only the most stable phases were considered. Why metastable phases precipitate in these wells, and by what route stable phases eventually would be formed, cannot be explained on the basis of present data. Regardless of this fact, the data do provide an explanation for the presence of siderite and calcite encrustants and thus provide a plausible explanation for the observed clogging of screens.
CHEMICAL INTERACTIONS
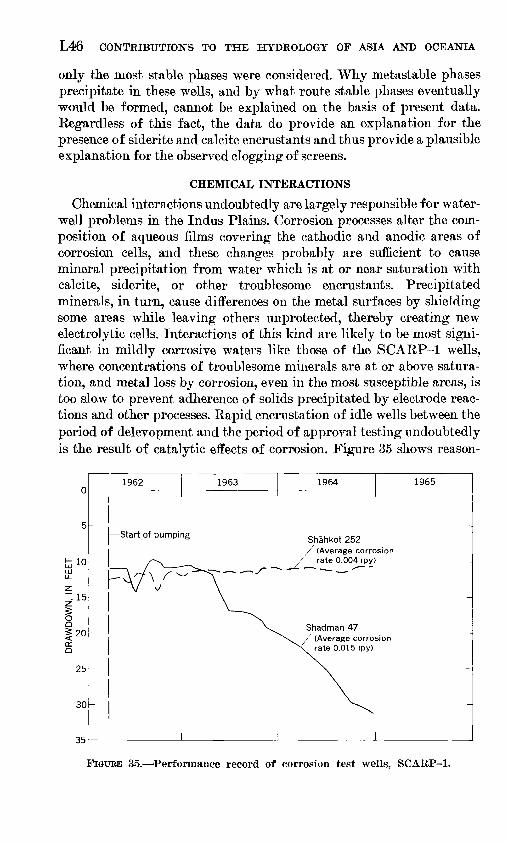
Chemical interactions undoubtedly are largely responsible for water- well problems in the Indus Plains. Corrosion processes alter the com position of aqueous films covering the cathodic and anodic areas of corrosion cells, and these changes probably are sufficient to cause mineral precipitation from water which is at or near saturation with calcite, siderite, or other troublesome encrustants. Precipitated minerals, in turn, cause differences on the metal surfaces by shielding some areas while leaving others unprotected, thereby creating new electrolytic cells. Interactions of this kind are likely to be most signi ficant in mildly corrosive waters like those of the SCAKP-1 wells, where concentrations of troublesome minerals are at or above satura tion, and metal loss by corrosion, even in the most susceptible areas, is too slow to prevent adherence of solids precipitated by electrode reac tions and other processes. Rapid encrustation of idle wells between the period of delevopment and the period of approval testing undoubtedly is the result of catalytic effects of corrosion. Figure 35 shows reason-
10
"15
20
25-
30
35
1962 1963 1964 1965
Start of pumpingShahkot 252 / (Average corrosion
rate 0.004 ipy)
Shadman 47 / (Average corrosion
rate 0.015 ipy)
FIGURE 35. 'Performance record of corrosion test wells, SCARP-1.

CORROSION IN TUBE WELLS, INDUS PLAINS, WEST PAKISTAN L47
ably good correlation between performance records and corrosion data for two wells checked with corrosion probes. Preferential corrosion of the casing slots is the most probable cause of heavy mineral encrusta tion in these areas, where it is least tolerable. The fact that both corro sion and mineral encrustation are far more prevalent on the relatively stagnant exterior of the casing than on the interior surfaces can be explained on this basis. Inert surfaces, such as stainless steel or plastic, are less likely to encrust because chemical interactions are minimized. Performance data in table 5 show that steel wells in certain areas lose as much as 80 percent of original capacity during a few months of idle ness between development and performance testing, whereas fiber-glass wells generally retain approximately their original capacities under similar conditions. Apparent increases in these capacity data resulted from change of datum point due to well-house construction. The marked variations in performance among the test areas indicates the importance of slight quality differences and kinetic factors.
CORROSION CONTROL TREATMENTS
Corrosion of steel can be controlled by protecting the metal surface with an inhibiting chemical or impervious coating; by eliminating de polarizing agents from the system; by counteracting corrosion current with an external current source (cathodic protection); by providing a sacrificial anode, which corrodes in preference to the steel well part; or by minimizing effects of dissolved carbon dioxide and unfavorable Eh- ph relationships through addition of an alkaline chemical. These treat ments are not very practicable for a water well, and they are not con sidered promising for corrosion control in ground-water systems of the Indus Plains. Surface coatings, such as bitumastic paint, enamels, and epoxy resins invariably provide very poor coverage of the sharp edges of filter pipe openings, where corrosion is likely to be most severe and corrosion damage least tolerable. Even the best coating is subject to damage during transport and installation of well parts, and cor rosion is concentrated and accelerated in damaged areas unless second ary protective treatment, such as cathodic protection, is available.
Theoretically, cathodic protection is capable of counteracting the total electrolytic current generated by local and long-line corrosion sells. However, no practical use has been made of the process in these wells because theoretical considerations and experience show that it- will not prevent corrosion within the screen slots. Also, overcharging because of improper current control would increase pH in cathodic areas and could accelerate encrustation. Placing sacrificial electrodes inside the well casings involves high cost and difficult engineering problems.

L48 CONTRIBUTIONS TO THE HYDROLOGY OF ASIA AND OCEANIA
Chemical treatment with film-forming inhibitors, such as sodium silicate, and neutralizers, such as lime, would not be economically feas ible for irrigation wells of this type. Down-hole injection of chemicals involves expensive pumping equipment, and the cost of chemicals alone probably would exceed the cost of well replacement in only a few years of operation.
Sterilization with chlorine, hypochlorite, formaldehyde, copper sul- fate, or other bactericide to eliminate sulfate-reducing bacteria and their depolarizing effects is not very promising. With the exception of copper sulf ate, these treatments are not expected to have lasting effect, and even the copper treatment has proved to be of little or no value in West Pakistan. If sulfate-reducing bacteria introduced through well openings invade the aquifers, reinfection of wells may occur soon after the sterilizing chemical has been flushed away.
For these many reasons, corrosion control is far less promising than reliance on rehabilitation and use of materials other than steel which are less susceptible to corrosion and encrustation.
MAINTENANCE AND REHABILITATION
Approximately 10 percent of the water wells in SCARP-1 area of the Indus Plains have deteriorated rapidly enough that rehabilitation has been required to maintain adequate productivity. Both blasting (fig. 36) and chemical cleaning have been tried, and only the former has been effective. Blasting is effected by suspending explosive rope (primacord) in the well and detonating it with an electric spark so that an exposion occurs simultaneously throughout the slotted part of the well casing. This is intended to blast out the slot plugs, leaving in their places the enlarged openings resulting from whatever metal wast ing occurred since installation or the last rehabilitation treatment. Blasting sometimes restores capacity to near that of the original well; however, its effectiveness may be quite temporary, as shown in figure 37, and capacity decline after blasting is common. Repeated blasting can be expected to lead to abnormal openings in the filter section, collapse of gravel shroud, and sand pumping problems.
Both hydrochloric acid and sulfamic acid have been tried without success in chemical cleaning of encrusted water wells in SCARP-1. In every case the acid component has been poured into and mixed with the water of the well at ambient temperature, which always is far below the optimum temperature for maximum effectiveness of chemical clean ing. In at least one case serious frothing of the well occurred, and capacity after treatment was even less than before.

CORROSION IN TUBE WELLS. INDUS PLAINS. WEST PAKISTAN L49
FIGUEB 36. WAPDA personnel installing primacord to blast encrusted well.

L50 CONTRIBUTIONS TO THE HYDROLOGY OF ASIA AND OCEANIA
crLoJ CO
t%g%^%^%^
1,1
.E Mto
z: "£O -Q _roP o> -Q^ O '
O)
Q_ X
O)
ro
O~> ' O~> CTi
O CNJ
O CO
oID
133J Nl 'NMOQMVdQ

CORROSION IN TUBE WELLS, INDUS PLAINS, WEST PAKISTAN L51
To improve the effectiveness of chemical cleaning, it would be neces sary to maintain higher well-water temperatures, either with down- hole immersion heaters or by recirculating the cleaning solution in a heated surface tank, as discussed by Clarke and Barnes (1964). In either case the well water must be analyzed periodically to insure main tenance of sufficient concentration of acid for effective chemical reac tion. Such treatment is difficult and expensive in a remote well site. For this reason mechanical rehabilitation of some kind always is likely to be more practical. Other mechanical treatments, some already tried, include high frequency vibration, high pressure surging, and mechan ical hammering. These have not proven to be as practicable and as effective as primacord blasting in West Pakistan. The bore holes are too small to accept the high energy packages recommended for effective high frequency treatment. High pressure surging of the long filter sec tions requires installation of packers which considerably increases the time and cost of cleaning.
Regardless of the rehabilitation method employed, gradual deteri oration of steel-casing slots eventually will lead to poor screening and related troubles. Problems of this kind have been overcome in other parts of the world (for example, the Chad Basin of Nigeria) by in serting noncorrodible plastic casings and corrosion-resisting screens within the damaged well. In the water wells of West Pakistan it may be possible to use the same method by first perforating the damaged screen with a down-hole cutter and then inserting slotted fiber glass, slotted polyvinyl choride plastic, or other noncorrodible filter section. The success of a rehabilitation method of this kind depends upon open ing enough area in the original screen to prevent rapid resealing of the openings with encrtistants. In other words, the cutter must produce large holes.
Leakage of the gravel shroud and aquifer sand into the annulus be tween the original casing and the insert may not be a problem if clog ging of openings in the original steel casing does not occur. However, there is the possibility that corrosion catalyzed encrustation may spread from the old steel member into gravel both inside and outside the original casing and thereby reduce flow. Thus, practicability of the method should be determined on an experimental basis before large- scale repair by this method is attempted.
IMPROVED MATERIALS OF CONSTRUCTION
Because of sensitivity to both aerobic and anaerobic environments, steel is seldom the best choice for well construction material where critical dimensions must be maintained for long periods of service. The tendency of corrosion to catalyze encrustation reactions makes
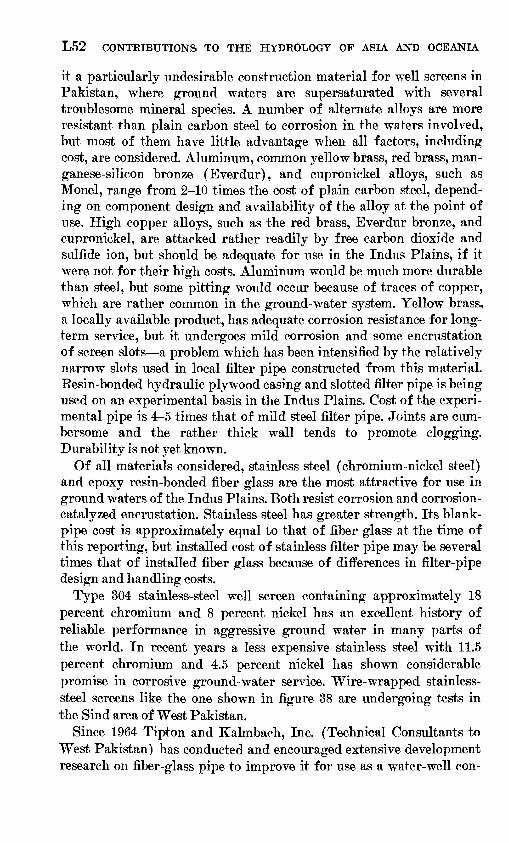
L52 CONTRIBUTIONS TO THE HYDROLOGY OF ASIA AND OCEANIA
it a particularly undesirable construction material for well screens in Pakistan, where ground waters are supersaturated with several troublesome mineral species. A number of alternate alloys are more resistant than plain carbon steel to corrosion in the waters involved, but most of them have little advantage when all factors, including cost, are considered. Aluminum, common yellow brass, red brass, man ganese-silicon bronze (Everdur), and cupronickel alloys, such as Monel, range from 2-10 times the cost of plain carbon steel, depend ing on component design and availability of the alloy at the point of use. High copper alloys, such as the red brass, Everdur bronze, and cupronickel, are attacked rather readily by free carbon dioxide and sulfide ion, but should be adequate for use in the Indus Plains, if it were not for their high costs. Aluminum would be much more durable than steel, but some pitting would occur because of traces of copper, which are rather common in the ground-water system. Yellow brass, a locally available product, has adequate corrosion resistance for long- term service, but it undergoes mild corrosion and some encrustation of screen slots a problem which has been intensified by the relatively narrow slots used in local filter pipe constructed from this material. Resin-bonded hydraulic plywood casing and slotted filter pipe is being used on an experimental basis in the Indus Plains. Cost of the experi mental pipe is 4-5 times that of mild steel filter pipe. Joints are cum bersome and the rather thick wall tends to promote clogging. Durability is not yet known.
Of all materials considered, stainless steel (chromium-nickel steel) and epoxy resin-bonded fiber glass are the most attractive for use in ground waters of the Indus Plains. Both resist corrosion and corrosion- catalyzed encrustation. Stainless steel has greater strength. Its blank- pipe cost is approximately equal to that of fiber glass at the time of this reporting, but installed cost of stainless filter pipe may be several times that of installed fiber glass because of differences in filter-pipe design and handling costs.
Type 304 stainless-steel well screen containing approximately 18 percent chromium and 8 percent nickel has an excellent history of reliable performance in aggressive ground water in many parts of the world. In recent years a less expensive stainless steel with 11.5 percent chromium and 4.5 percent nickel has shown considerable promise in corrosive ground-water service. Wire-wrapped stainless- steel screens like the one shown in figure 38 are undergoing tests in the Sind area of West Pakistan.
Since 1964 Tipton and Kalmbach, Inc. (Technical Consultants to West Pakistan) has conducted and encouraged extensive development research on fiber-glass pipe to improve it for use as a water-well con-

CORROSION IN TUBE WELLS, INDUS PLAINS, WEST PAKISTAN L53
II 111Illl
nil-Win iiimimi
FIGURE 38. Wire-wrapped stainless-steel well screen. Test specimen supplied by UOP-Johnson Division.
struction material. The product is available in two principal types, centrifugally-cast and mandrel-wrapped. However, only the latter has been used in water wells of West Pakistan. In centrifugal casting, resin is injected into a rotating mold lined with layers of glass fiber. Centrifugal force drives resin and fiber against the mold to form a plastic pipe. The desired wall thickness is obtained by varying the thickness of fiber layers and the quantity of resin. In the mandrel- wrapped variety, glass cloth generally is spiralled around the mandrel, first in one direction and then in another, to provide a crisscross pattern. However, some recent designs combine longitudinal and cir cumferential fibers in order to minimize loss of fiber strength in saw slotting of filter pipe. Pipe joints can be made with conventional threaded couplings, with epoxy cemented couplings, or with specially- designed key locks of the type shown in figure 39. O-ring seals can be added to key-locked joints if complete absence of leakage is de sirable. Coupling with threaded fitting and epoxy-bonded joints is relatively slow and plastic threads are easily jammed and damaged by debris. The lock joint specifically designed for the West Pakistan wells is strong and easily assembled. Ten-inch-diameter pipes coupled in this fashion have withstood 50,000-60,000 pounds of tensile load, and re cent laboratory tests suggest that similar assemblies can be made to withstand tensile loading of 100,000 pounds or more.

L54 CONTRIBUTIONS TO THE HYDROLOGY OF ASIA AND OCEANIA
FIGURE 39. Fiber-glass well casing with key lock. Courtesy Koppers Co., OrganicMaterials Division.
Physical testing of fiber-glass pipe in uncut form by Tipton and Kalmbach, Inc., Denver, Colo., using sand presses and other conven tional equipment, shows that its collapse strength in 0.18-inch wall thickness is adequate for use in water wells of West Pakistan (up to 400 ft deep). Saw-slotting longitudinally or transversally in a pat tern similar to that shown in figure 40 reduces crushing strength significantly, sometimes by as much as 25 percent, but such pipe still is sufficiently strong for use in the relatively shallow wells of the Indus Plains.
As supplied by the mill in uncut form, fiber-glass pipe is very resistant to water as well as to a great variety of aqueous solutions. Extensive boiling water tests and hydraulic pressure tests made by Tipton and Kalmbach and fiber-glass manufacturers have not dis closed any significant weakness attributable to saw slotting (excessive water adsorption or exfoliation). More experience with field installa tions like those in West Pakistan will be required to demonstrate its expected durability in ground-water environments. Detailed informa tion on development, testing, and use of fiber-glass pipe in West Paki stan wells has been prepared by Tipton and Kalmbach, Inc. (1967).

CORROSION IN TUBE WELLS, INDUS PLAINS, WEST PAKISTAN L55
it-*8
FIGURE 40. 'Saw-slotted fiber-glass well casing. Courtesy Koppers Co., OrganicMaterials Division.
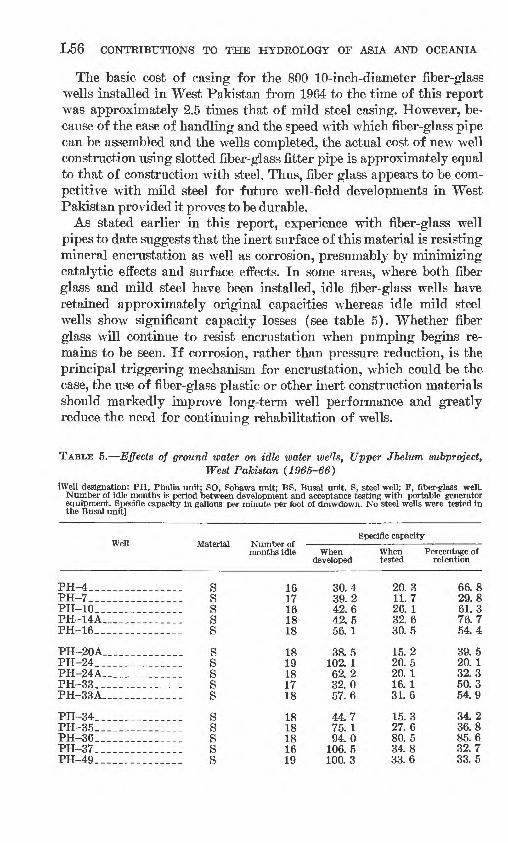
L56 CONTRIBUTIONS TO THE HYDROLOGY OF ASIA AND OCEANIA
The basic cost of casing for the 800 10-inch-diameter fiber-glass wells installed in West Pakistan from 1964 to the time of this report was approximately 2.5 times that of mild steel casing. However, be cause of the ease of handling and the speed with which fiber-glass pipe can be assembled and the wells completed, the actual cost of new well construction using slotted fiber-glass fitter pipe is approximately equal to that of construction with steel. Thus, fiber glass appears to be com petitive with mild steel for future well-field developments in West Pakistan provided it proves to be durable.
As stated earlier in this report, experience with fiber-glass well pipes to date suggests that the inert surface of this material is resisting mineral encrustation as well as corrosion, presumably by minimizing catalytic effects and surface effects. In some areas, where both fiber glass and mild steel have been installed, idle fiber-glass wells have retained approximately original capacities whereas idle mild steel wells show significant capacity losses (see table 5). Whether fiber glass will continue to resist encrustation when pumping begins re mains to be seen. If corrosion, rather than pressure reduction, is the principal triggering mechanism for encrustation, which could be the case, the use of fiber-glass plastic or other inert construction materials should markedly improve long-term well performance and greatly reduce the need for continuing rehabilitation of wells.
TABLE 5. Effects of ground water on idle water weHs, Upper Jhelum subproject,West Pakistan (1965-66)
[Well designation: PH, Phalia unit; SO, Sohawa unit; BS, Busal unit. S, steel well; F, fiber-glass well. Number of idle months is period between development and acceptance testing with portable generator equipment. Specific capacity in gallons per minute per foot of drawdown. No steel wells were tested in the Busal unit]
Well
PH-4____ ______PH-7 . __ _____PH-10___________PH-14A__________PH-16_____--____
PH-20A.. __ ____PH-24_..__ ___ _PH-24A__________PH-33. __________PH-33A__________
PH-34 ___ ____PH-35___ ________PH-36. __ _PH-37__ __ _ __PH-49_._ _ __ __
Materiali
--_. S____ S _ S____ S____ S
. __ S____ S____ S___. S--._ S
____ S____ S____ S____ S---_ S
months idle
16 17 16 18 18
18 19 18 17 18
18 18 18 16 19
Specific capacity
When developed
30.4 39.2 42.6 42.5 56. 1
38.5 102. 1 62.2 32.057.6
44.7 75. 1 94. 0
106.5 100. 3
When Percentage of tested retention
20.3 11.7 26. 1 32.6 30.5
15.2 20.5 20. 1 16. 1 31.6
15.3 27. 6 80.5 34.8 33.6
66.8 29.8 61.3 76.7 54.4
39. 5 20. 1 32.3 50.3 54.9
34.2 36.8 85.6 32.7 33.5

CORROSION IN TUBE WELLS, INDUS PLAINS, WEST PAKISTAN L57
TABLE 5. Effects of ground water on idle 'water well-s, etc. Continued
Well
PH-75____._____PH-76__________PH-77__. _______PH-78____._.___PH-78A__. ______
PH-79___ _______PH-80... _______PH-82PH-82A_________PH-85_____.____
PH-86________._PH-90__________PH-91_________.PH-92__________PH-94__________
PH-180_________PH-181_________PH-182 _PH-183___. ___._.PH-184_________.
PH-198_____.___PH-199_-_._____PH-200.._______PH-201. ________PH-202_________
PH-203_______._PH-205---_-___-PH-207___._____PH-210_________PH-211. ________
PH-212_________PH-214_______-_PH-215---------PH-216_----_-_-PH-217---------
PH-218---------PH-220___----_-PH-221_____-__-PH-222_________PH-223---------
PH-224________-PH-227__-------PH-228_-----_-_PH-230__-------PH-231---------
months idle
_____ F_____ F_____ F_____ F_____ F
_____ F_____ F_____ F_____ F_____ F
_____ F_____ F_____ F_____ F.____ F
_____ F_____ F_____ F
F_____ F
_____ F_____ F_____ F_____ F_____ F
_____ F_____ F____: F_____ F_____ F
_-_-_ S----- S_---_ S----- S_____ S
----- S_____ S_____ S_____ S_---_ S
_____ S_____ S_____ S_____ S----- S
56766
67666
66665
66666
55455
44454
78888
87888
88788
Specific capacity
Whendeveloped
75.457. 570.952. 879.0
55.257. 381. 177.373.8
69.461. 074. 686. 0
101. 8
117. 7149. 0157. 7127.7141. 0
111. 5111. 8145. 6121.9146. 1
152. 5113.3115. 0121.4130. 8
96. 2117. 2121. 1103. 2101. 3
139. 3118. 9129. 3110. 7152. 5
89.5163. 3145. 6101.7110. 7
When Percentage oftested retention
78.764.478.955.480. 1
56. 560.985.484. 178.6
117.760. 874. 576.7
103. 7
119. 0153.4153. 0129.4147. 7
105.9121. 0153. 7122.9157. 8
159. 5121. 7118.4126. 5142. 5
108. 3110. 6131. 1107. 3104. 2
138. 6118. 6141. 7127. 9167. 5
95. 3167. 3150. 3114. 6119.4
104.4112 0111.3104.9101.4
102.4106.3105.3108. 8106. 5
169. 699. 799. 989. 2
101. 9
101. 1103. 097.0
101. 3104. 8
95. 0108. 2105. 5100. 8108. 0
104. 6107.4103. 0104. 2108.9
112. 694.4
108. 3104.0102. 9
99. 599. 7
109. 6115. 5109. 8
106. 5102.4103.2112. 7107.9

L58 CONTRIBUTIONS TO THE HYDROLOGY OF ASIA AND OCEANIA
TABLE 5, Effects of ground water on idle water wells, etc. Continued
Wellmonths idle
Specific capacity
Whendeveloped
SO -8 ____,___.SO -8A__ ___...__.SO -9, _____--___SO -20A __..._.SO-21--_----__-
SO-21A.. ..__.__.SO-23-. .____.__.SO-23A .____..SO-24..__. .._._.SO-25. ---------
SO -26. - ..__.SO-27. ______--_SO-27A _______SO-29-__ _.__.._.SO -30.. ._.,._._.
SO -30A.. _..._._.SO -41. .___._....SO -42. _________80-43-. __.._.SO-44_-___-.-__.
SO-45--__-__-__SO-46 _-....SO-47_--__--___SO-48--- . _.SO-49 ...
SO -50- ____.._.SO-51 _ .SO-53- ._ _.SO~56_____--___SO-57_--___-___SO-58 _.
SO-59-_-_-_---_SO-60_.--_-_-__SO-61_-___-_--_SO-62 __ _.SO-64_-___-.___
SO-65. .SO-66 .SO -67 _ - _.SO-68 . .SO-69 .
SO-70 _ .SO-71 . .SO-73--__-____-SO-74__________SO-75- ... .
----- S--__- S----- S----- S..-__ S
----- S-_-__ S-_._- S.-._- S-_-._ S
.--_- S--__- S----- S----- S----- S
----- S.___- S-__-. S----- S-__-- S
----- S..__- S---__ S----- S---__ F
----- F-___- S-___- S--__- F F_____ F
-___- F----- F__-__ F-____ F_-___ F
-____ F-____ F-____ F_____ F_____ F
-__-_ F-_-_- F___-. F-____ F_____ F
121111
815
6774
11
148877
9111211
8
138
108
13
79
1310
914
89
101010
109
109
10
1210
999
86. 977. 372. 548.547. 8
39. 255. 348. 362. 077. 2
53. 980. 265. 797. 674. 8
73. 3101. 794. 0
113. 997. 5
60. 974.758. 865. 468.7
65. 852. 959. 759. 377.474.4
83. 352. 048. 985. 358. 7
61. 1103. 1105. 3
84. 692. 9
102. 368. 282. 0
100. 5111. 0
When Percentage oftested retention
64. 453. 754. 232. 836.4
30. 836. 035. 743. 766. 1
36.244. 247. 259. 972. 4
70. 2104. 594. 973. 196. 5
64. 073. 848. 650. 664. 5
70. 652. 150. 359. 178. 075. 8
82. 557. 048. 684. 859. 8
52. 3109. 5115. 291. 083. 5
102.472. 479. 897. 8
108. 8
74.169. 574. 867.676.2
78. 665. 173. 970. 585. 6
67. 255. 171. 861. 496. 8
95. 8102. 8101. 0
64. 299. 0
105. 198. 882. 777. 493. 9
107. 398. 584. 399.7
100. 8101. 9
99. 0109. 699.499.4
101.9
85. 6106.2109. 4107. 689. 9
100. 1106. 297. 397. 398. 0

CORROSION IN TUBE WELLS, INDUS PLAINS, WEST PAKISTAN L59
TABLE 5. Effects of ground water on idle water wells, etc. Continued
Well
SO~76_ _____so-77__ _ SO-78- __SO-80_--_-----_-_.SO-81-------_-__-.
SO-82_--_--______.SO-83- - _____SO-84_____---_-___SO-85---------,--.80 -85A _________
BS-1. __ ___. _BS-2..., ...... _____BS-3.. ___________BB-4_____ _______BS-5__-_______-
BS-40.. _____._.BS-42____. _____ .BS-43 ---_-_._BS-44_-___________BS-46. ______
BB-81- - --------BS-82___.______BS-83..________BS-94- ___-___BS-95 ________
BS-149 __ BS-150-.__ ______BS-151 - --------BS-152 - _______BS-154- _____
BS-191 __BS-192 __-_-----.BS-193 __-__BS-194 _________BS-195 __ _______
BS-223- _____BS-224 - --------BS-225- --__-__-BS-226 ---------BS-227 __ .-__--__-
months Idle
FFFFF
FFFFF
FFFFF
FFFFF
FFFFF
FFFFF
FFFFF
FFFFF
1010101012
999
1010
99
111113
119999
1010
855
59998
66666
88889
Specific capacity
Whendeveloped
74.6130. 9118. 2
64. 573. 0
63. 869. 1
136. 161.770.9
130.3178.9142. 6128.8124. 4
138.2152. 5103.6
81. 3103. 3
91.4129. 5150.8100.4109.2
118. 987. 8
128. 3119.7132. 7
104.9101.4107. 886.999. 3
75.0110.7107.2116. 8148.6
When Percentage oftested retention
68. 1123.7100. 056.679. 8
64.473. 1
135. 059. 379. 5
145. 0205.7158. 5156.8125. 8
156. 5169.2115.887. 6
113.7
97.6145.2169.5150. 8123. 0
132.889.4
132. 5121.2139. 2
112. 6112. 0122.9100. 0115. 0
119. 0115. 7120.6126. 3159. 5
91.394. 584.6
103.9109. 3
100.9105. 899.296. 1
112, 1
111. 3115. 0111. 2121. 7101. 1
113.2111. 0111. 8107.7110. 1
106. 9112. 1112.4150. 2112. 6
111. 7101.8103. 3101. 3104. 9
107. 3110. 5114. 0115. 1115. 8
158.7104. 5112. 5108. 1107. 3

L60 CONTRIBUTIONS TO THE HYDROLOGY OF ASIA AND OCEANIA
SUMMARY
Ground water of the Indus Plains varies considerably in solute concentration and ionic balance, but much of it is supersaturated with troublesome minerals, such as calcite, siderite, and ferric hydroxide. Most of the wells covered by this report are anaerobic (air free), and sulfate-reducing bacteria and their products, sulfide ion and metallic sulfide compounds, are rather prevalent. The waters tested so far are corrosive enough to cause objectionable changes in dimensions of mild steel casing slots and to encourage mineral encrustation, but are not corrosive enough to cause intolerable damage on blank casings and pumps.
High cost, engineering difficulties, and probability of adverse chemi cal reactions make it impracticable to overcome corrosion and en crustation problems through the use of protective coatings, chemical treatments, or cathodic protection, and chemical sterilization for minimizing bacterial attack has not yielded promising results. Theo retical considerations and short-term experience suggest that construc tion of slotted filter pipes and screens from corrosion-resisting materials, such as fiber-glass plastic and stainless steel, will minimize encrustation as well as corrosion, and use of fiber-glass plastic appears to be the most economically feasible alternative at present. Some en crustation is likely to occur regardless of the construction material used, and both corrosion and encrustation will continue to plague existing steel-cased wells. These problems must be overcome by me chanical or chemical cleaning and either repair or periodic replace ment of wells. The water-quality tests now in use are capable of identifying the areas which are most likely to be tolerant to steel-cased wells those with high Eh and pH and with low CO2 , sulfide, and ferrous ions. The same tests are adequate for systematically monitor ing areal changes in water quality as dewatering continues and for providing data against which to compare performance of alternate construction materials. Periodic removal and examination of slotted fiber-glass pipe is the best means of assessing long-term performance of this new and pronlising product.

CORROSION IN TUBE WELLS, INDUS PLAINS, WEST PAKISTAN L61
REFERENCESBack, William, and Barnes, Ivan, 1961, Equipment for field measurement of
electrochemical potentials, in Short papers in the geologic and hydrologicsciences: U.S. Geol. Survey Prof. Paper 424-C, p. C366-C368.
Barnes, Ivan, 1964, Field measurement of alkalinity and pH: U.S. Geol. SurveyWater-Supply Paper 1535-H, 17 p.
Barnes, Ivan, and Clarke, F. E., 1969, Chemical properties of ground water andtheir corrosion and encrustation effects on wells: U.S. Geol. Survey Prof.Paper 498-D, 57 p. (in press).
Carlston, C. W., 1953, History and causes of rising ground-water levels in theRechna Doab: United Nations Food and Agriculture Organization Rept.90, 29 p.
Clarke, F. E., and Barnes, Ivan, 1964, Preliminary evaluation of corrosion andencrustation mechanisms in tube wells of the Indus Plains, West Pakistan :U.S. Geol. Survey open-file rept., 81 p.
1967, Evaluation and control of corrosion and encrustation in tube wells of the Indus Plains, West Pakistan: U.S. Geol. Survey open-file rept., 69 p.
1968, Significance of chemical equilibria data in well water corrosionstudies: Internat. Cong. Metallic Corrosion, 3d, Moscow 1966, Proc.
Greenman, D. W., Swarzenski, W. V., and Bennett, G. D., 1967, The ground- water hydrology of the Punjab, West Pakistan, with emphasis on problems caused by canal irrigation: U.S. Geol. Survey Water-Supply Paper 1608-H, 66 p.
Hem, J. D., and Cropper, W. H., 1959, Survey of ferrous-ferric chemical equi libria and redox potentials: U.S. Geol. Survey Water-Supply Paper 1459-A, 30 p.
Malmberg, G. T., and Ataur Rahman. Ch., 1966, Preliminary water budget analy sis of SCARP-1, Rechna Doab, July 1965-June 1966: West Pakistan Water and Power Devel. Authority, Water and Soils Inv. Div. Tech. Paper 16, 46 p.
McKinney, R. E., 1962, Microbiology for sanitary engineers McGraw-Hill series in sanitary engineering and science: New York, McGraw-Hill Book Com pany, 293 p.
Swarzenski, W. V., 1968, Fresh and saline ground water zones in the Punjab Region, West Pakistan: U.S. Geol. Survey Water-Supply Paper 1608-1, 24 p.
Tipton and Kalmbach, Inc., 1967, Regional Plan, Northern Indus Plains: Denver, Colo., v. 1-5.

INDEX
[Italic page numbers indicate major references]
Anaerobic environment.Page
9,31,40,51
Bibliography.. _ - ._ _____ 61Bicarbonate ion, test methods_............. 17Blasting...................................... 45,51
Calcite..................... 23,26,38,39,42,43,44,46Capacity losses..........___......... 15,22,48,56Catalytic effects.................. 16,23,35,42,46,56Cathodic protection.......................... 47Chemical cleaning._......._............. 48Chemical interactions-----.-------.-.---.---. 46Chuharkana project.----------------------.-- 5Climate.--------..__._-.- _._ ______ 2Clogging.-.---....--....--.---.-- 15,22,30,46,51,52Construction materials, improved ------------ SICopper hydroxide.-...----------------------- 26,43Corrosion, causes____._.-.....__._._________ SO
damage_... .......-..._--------- 27,31,39intensity..--..--------------------. M,39,47,66probes............................... 17,19,47products.__......_ _____..._... 22,27rates ---------... . .......... 17,30,34,39control treatments_..................... 1ft
Corrosometer probes__... .....--..-.._ 17,27
Eh-pH relationships........ ............ 17,22,33,47Encrustants, composition ...--.-..... ... 23,26Equilibrium concentration. - .-_____-___ 39
comparison with observed state ....... 34data...............-.. .- ---........ 38,40,44
Ferric hydroxide................. 22,33,39,41,43,45Ferrous hydroxide__..-..... ---..------.- 40,44Ferrous ion ..--.------------------. 9,21,30,33,37
determination..................-----..--. 17Ferrous sulflde......._.-.... ...-.- ..-.. 32Field studies.-.----.--..-------------------_ 16,20
Ground-water dewatering. Qround-water quality.....
Hausmanite.
Page Inoculation- - . ___ - -- 11,48Irrigation__....._..._..._____... 4,8,9,11
Kinetic factors_.............. . - 16,35,42,47
Laboratory analyses..._.....--...-... ..- 16, 20Long-line corrosion current studies........ 20,31,33
Mackinawite..-..---..----. - --- 26Maghemite...--------------------------__- 26,45Magnetite-..-...-.----.---.-.----------- 26,40,45Mineral encrustation..-. .-..--------- 15,20,47,56
PH.test methods.
37,4718
Quartz-
Rainfall.-.-....---.---.---..-.--------------- 2"Rasul" wells.... _-.......--..-....-.-... 5Rehabilitation...------..----------------- 15,48,56
Sacrificial anode.-- __..........-----.-.... 47Salt concentration...._..........._ 3,9,20Salt deposits._............................ 2Salt Range ...--..-----...------.---... 2,10Saw slots, damage.---------------- 27,30,31Siderite.. -- --.-- 23,26,38,40,42,43,44,45,46 Slot filling....____ __ ......... ..--.. 23,26Soil salinization...............- -..--...-..- 5Spinel. ._ ____ ____--- ---. 26,40,42Sulfate ion----------. -.-.----- 33Sulfate-reducing bacteria.---_.----- 11,21,31,48Sulfideion .......... -...... .. -.. 9,32
determination..--... . .. ..... ... 17Supersaturation. -.-.-. ........-...-- . 36,39
Thermodynamic analysis_........ . -.. 34,43Tube wells, description_...........-. -.. 11
dewatering._. .... . .. - 8,9number.. . ------- 13
Undersaturation_ - .....-.- -..------ 35,39
Improved construction materials.----------- 51 Waterlogging. - - -.....-. -.--.... . 5,8
L63
U.S. GOVERNMENT PRINTING OFFICE: 1969 O 323-982