Evaluation and Application of Probabilistic Tsunami Hazard...
27
1 Evaluation and Application of Probabilistic Tsunami Hazard Analysis in California Crescent City Demonstration Projects and the California Probabilistic Tsunami Hazard Analysis Work Group 2013 California Geological Survey Special Report 2013-XX Version 1.0 Funding by the National Tsunami Hazard Mitigation Program
Transcript of Evaluation and Application of Probabilistic Tsunami Hazard...

1
Evaluation and Application of Probabilistic
Tsunami Hazard Analysis in California
Crescent City Demonstration Projects and the California
Probabilistic Tsunami Hazard Analysis Work Group
2013
California Geological Survey Special Report 2013-XX
Version 1.0
Funding by the National Tsunami Hazard Mitigation Program

2
California Probabilistic Tsunami Hazard Analysis Work Group
Project Lead: Rick Wilson, California Geological Survey
Crescent City Demonstration Project Principal Investigators:
URS Corporation: Hong Kie Thio and Wenwen Li
University of Washington: Frank Gonzalez, Randy LeVeque, and Loyce Adams
Work Group Members, Participants, and Invitees:
Norm Abrahamson, PGE Brian Atwater, U.S. Geological Survey Rui Chen, California Geological Survey Gary Chock, Martin-Chock Corporation Ed Curtis, Federal Emergency Management
Agency Lori Dengler, Humboldt State University Marie Eble, Pacific Environmental Marine
Laboratory Lesley Ewing, California Coastal Commission Kwok Fai Cheung, University of Hawaii Art Frankel, U.S. Geological Survey Kara Gately, National Oceanic and Atmospheric
Administration Eric Geist, U.S. Geological Survey Chris Goldfinger, Oregon State University Stephen Grilli, University of Rhode Island Darryl Hatheway, AECom Paul Hegedus, RBF Incorporated Juan Horrillo, Texas A&M, Galveston Victor Huerfano, University of Puerto Rico Laurie Johnson, Laurie Johnson Consulting Jim Kirby, University of Delaware Alberto Lopez, University of Puerto Rico Patrick Lynett, University of Southern California Tim McCrink, California Geological Survey Aurelio Mercado, University of Puerto Rico Nicole Metzger, Michael Baker Corporation
Kevin Miller, California Office of Emergency Services
Dmitry Nicolsky, University of Alaska, Fairbanks Stu Nishenko, PGE Mark Petersen, U.S. Geological Survey Cindy Pridmore, California Geological Survey George Priest, Oregon Department of Geology
and Mineral Industries Charles Real, California Geological Survey Tom Shantz, California Department of
Transportation Joe Street, California Coastal Commission Elena Suleimani, University of Alaska, Fairbanks Costas Synolakis, University of Southern
California Lisa Togiai, America Samoa Emergency
Management Ken Topping, Topping Associates International Timothy Walsh, Washington Department of
Natural Resources Kelin Wang, Natural Resources - Canada Yong Wei, Pacific Marine Environmental
Laboratory Michael West, University of Alaska, Fairbanks Paul Whitmore, National Oceanic and
Atmospheric Administration Rob Witter, U.S. Geological Survey Harry Yeh, Oregon State University
3
Contents Abstract ......................................................................................................................................................... 4
Introduction .................................................................................................................................................. 4
Project Background ................................................................................................................................... 5
Work Group .............................................................................................................................................. 7
Methods ........................................................................................................................................................ 8
URS Method .............................................................................................................................................. 9
Univ. of Washington Method ................................................................................................................. 11
Evaluation ................................................................................................................................................... 11
Methods Comparison ............................................................................................................................. 11
Results Comparison ................................................................................................................................ 15
Findings ....................................................................................................................................................... 17
Phase 1: Initial results ............................................................................................................................ 17
Phase 2: Immediate improvements ........................................................................................................ 18
Phase 3: Long-term needs ...................................................................................................................... 19
Use of PTHA Products ................................................................................................................................. 20
Applications............................................................................................................................................. 20
PTHA Products ........................................................................................................................................ 22
Conclusions ................................................................................................................................................. 23
References .................................................................................................................................................. 25

4
Abstract
The California Geological Survey (CGS) intends to generate tsunami hazard map products for land-use
planning and construction through the California Seismic Hazard Mapping Act (Public Resources Code,
sec 2690 et seq.). Similar to seismic hazard analyses, these products for land-use and development
decision-making must be based on a probabilistic analysis, and require information on the frequency of
occurrence through a probabilistic tsunami hazard analysis (PTHA). The California Probabilistic Tsunami
Hazard Analysis (CA-PTHA) Work Group was developed to evaluate the results of two new PTHA
demonstration projects in Crescent City: 1) URS Corporation developing a statewide PTHA for Caltrans
and the Pacific Earthquake Engineering Research Center for evaluating transportation corridors, and 2)
the University of Washington developing PTHA products in Crescent City as a demonstration project for
Baker/AECom and FEMA and FEMA’s RiskMAP platform. The results of this Phase 1 review of the two
independent analyses indicate PTHA’s can be developed with recommended improvements in source
characterization, PTHA methods, and numerical model use. An immediate significant improvement is to
align the Cascadia subduction zone PTHA characterization with the National Seismic Hazard Map
Program of the U.S. Geological Survey. In addition to applying PTHA to land-use planning and the two
demonstration projects, CGS and the CA-PTHA Work Group identified other applications for various
PTHA risk levels (ARP = Average Return Period), including flood insurance (100 and 500 year ARP),
building codes (2,500 year ARP), and emergency response planning (1000 year ARP or larger). CGS’s
Phase 2 plan is to produce a single set of reliable and consistent PTHA maps for various risk levels and
work with various end-users to determine how to use the maps. The California PTHA and the results of
the Work Group review are also proposed to be used by the U.S. National Tsunami Hazard Mitigation
Program to develop guidelines for production in other coastal states.
Introduction
California’s 1,100-mile-long coastline is home to over one-million residents and tens of millions of
visitors each year that are at risk to both local and distant tsunami hazards (California Seismic Safety
Commission, 2005). There are 20 counties, 100 cities, and over 130 maritime communities that are
vulnerable to tsunamis. Over 100 possible or confirmed tsunamis have been observed or recorded in
California since the year 1800 (Lander et al., 1993; National Geophysical Data Center-NGDC, 2013).
While the majority of these events were small and only detected by tide gauges, thirteen were large
enough to cause damage and five events have caused deaths (NGDC, 2013). The most significant
historical tsunami to impact California was the March 27, 1964 Alaska event, flooding 29 blocks of
Crescent City and killing 13 people statewide. A detailed evaluation being performed by the U.S.
Geological Survey’s Science Application for Risk Reduction Project indicates that nearly a hundred
thousand residents and millions of coastal visitors could be at risk to flooding in California to a single

5
large tsunami originating from the Alaska-Aleutian Islands region, and that this large tsunami could cost
the state and nation over six billion dollars in flood-related damage and long-term recovery (Jones and
Ross, in press).
The California Tsunami Preparedness and Hazard Mitigation Program is a state level tsunami hazard
reduction program managed by the California Governor’s Office of Emergency Services (CalOES) with
assistance from the California Geological Survey (CGS) that, in cooperation with NOAA’s National
Weather Service and other federal, state and local agencies, promotes tsunami planning, preparedness
and hazard mitigation among California’s coastal communities. Over the past two decades, tsunami
hazard analyses have been performed using scenario-based, deterministic methods in order to develop
tsunami inundation products for emergency response planning (Wilson et al., 2010; Barberopoulou et
al., 2009). The 2011 National Academy of Science review of the federal and state tsunami inundation
mapping activities indicated that a greater understanding of the “probabilities” of tsunami inundation is
needed to produce more accurate and consistent products for planning between communities and
across state boundaries. With regard to tsunami hazard mitigation and land-use planning, knowing only
the maximum possible run-up without information about likelihood of occurrence is an insufficient
product to set engineering and land-use planning guidelines. In California, seismic hazard products for
land-use and construction decisions are based on a probabilistic analysis, and for such applications
information on the frequency of occurrence is similarly desirable for tsunami hazard products through a
probabilistic tsunami hazard analysis (PTHA; ref??).
To assist city and county land-use planning/building departments with enforcement of hazard
information like this, the California Legislature authorized the CGS to prepare tsunami hazard maps for
incorporation into land-use plans through the Seismic Hazard Mapping (SHM) Act (Public Resources
Code, sec 2690 et seq.). This State Law also contains provisions that require site-specific hazard
evaluations and design mitigation plans to be completed prior to certain types of development within
special designated hazard zones. CGS and CalOES has received funding through the NTHMP to initiate
this work over the past several years and into Fiscal Year 2013-14 by CGS. Because of this, the NTHMP
Mapping and Modeling Subcommittee (MMS) has considered the work by California to be a
“demonstration project” for PTHA mapping, integrating the discussion of this work into the FY2013-2017
NTHMP Strategic Plan (2013). The resulting set of maps will identify a suite of specific tsunami-flood
risk levels (average return periods or percent chance of exceedance) that will be compatible with other
coastal flood hazards, such as severe storm inundation and sea level rise. One of the primary benefits of
this work will be the production of single set of consistent maps along the entire coast.
Project Background
Initial work on PTHA products included evaluation of several methodologies that have been and/or are
being established for probabilistic tsunami hazard analysis (PTHA) in California and along the west coast
(Tsunami Pilot Study Working Group - Seaside, Oregon, 2006; Geist and Parsons, 2006; Uslu, 2011; Thio,
2010). The production of PTHA maps in Seaside, Oregon (2006) was the first time federal, state,

6
academic, and non-governmental partners cooperated on such a project. The project incorporated the
state-of-the-science for the time in paleoseismic/paleotsunami information, tsunami source
characterization, and numerical modeling to produce tsunami inundation lines for various risk levels and
set the standard for PTHA work on the west coast of the U.S.
During the summers of 2010 and 2011, two workshops were held at the Pacific Earthquake Engineering
Research (PEER) Center in Berkeley, California, to discuss new developments in PTHA research. In the
2010 workshop, participants presented their various work on probabilistic seismic and tsunami hazard
analyses. During the time between workshops, it was discovered that two different projects, one at URS
Corporation and another at the University of Washington (UW), were engaging in new PTHA work in
California:
1. URS is being funded by PEER and Caltrans on a project to develop tsunami hazard maps for the
entire California coastline. These maps representing various PTHA risk levels will be used by
Caltrans to evaluate the vulnerability of transportation facilities to the threat of tsunami
inundation and surge loading. In 2010, URS completed a report on the first phase of the project
that focused on the development of a practical PTHA procedure that can be applied to a large
region while also utilizing nonlinear based wave propagation methods for estimating on-shore
wave heights and inundation levels. This first phase report also focused on tele-tsunami
sources. The second phase of the project, due in 2013, is to extend the sources considered in
the overall PTHA to include analysis and modeling of the Cascadia subduction zone, and
evaluation of inclusion of potential local sources in the PTHA methodology. Because of the
involvement and funding of a fellow state agency (Caltrans), CGS began their partnership with
URS, PEER, and Caltrans in 2011 to produce a higher-level product for land-use planning.
2. UW is being supported by coastal hazards consultant Baker/AECOM and the Federal Emergency
Management Agency (FEMA). This project focuses specifically on Crescent City, and builds on
PTHA methodologies established in the Seaside, Oregon, PTHA pilot study (2006). The intent of
the project is to develop PTHA products that will become incorporated into FEMA’s Risk
Mapping, Assessment, and Planning (RiskMAP) platform for communities to utilize, with the
potential for being incorporated into the coastal flood insurance rate maps at some time in the
future. The first phase of their project, completed in 2012, was to produce PTHA inundation and
flow depth products for 100-year and 500-year return periods (risk levels). The second phase,
due at the end of 2013, is to focus on PTHA tsunami current velocity products.
Because both studies involve Crescent City, CGS worked with URS and UW to establish their work at this
location as a PTHA demonstration project to compare methods and products. Prior to the 2011
workshop at PEER, CGS worked with both parties to determine the areas of biggest need in their
evaluations. The common concern was to develop a better understanding of the Cascadia subduction
zone (CSZ) so experts from the USGS and Oregon, who had both been working on characterizing the CSZ
probabilistically, were invited to present their new information about the paleo-history of past CSZ

7
events. This workshop set the stage for developing similar source characterizations for the CSZ by URS
and UW that followed the work in Oregon providing a 10,000 year period of CSZ activity, and of the
probabilistic seismic hazard analysis (PSHA) for the National Seismic Hazard Maps (NSHM) by the USGS.
Work Group
CGS developed a voluntary panel of experts known as the “California PTHA Work Group” (CA-PTHA) to
review the PTHA methods and products of the principle investigators at URS and the UW, and provide
feedback on what improvements should be made for developing products in the future. This report
documents the Work Group review, as well as provides recommendations for future short- and long-
term improvements to CA-PTHA.
CA-PTHA Work Group members included researchers and practitioners selected based on the following
specific areas:
1) Local and distant tsunami source characterization and deformation modeling;
2) Probabilistic methods and product development;
3) Numerical tsunami modeling and tsunami hazard map accuracy; and,
4) Applications for PTHA products and appropriate risk levels for production and use.
The goals of the CA-PTHA WG review are to help validate the methods, formulate a plan for map
production in California by CGS, and document procedures to be used in the rest of the nation through
the National Tsunami Hazard Mitigation Program (NTHMP). CGS also invited members NTHMP Mapping
and Modeling Subcommittee to take part in the review process of the PTHA methods in order for them
to become more familiar with the methods and products.
From March to August, 2013, the CA-PTHA WG held eight teleconferences/online meetings, and one in-
person workshop on June 3-4 in Menlo Park. Initial online meetings were held to share initial results
and reports, and define the expectations for the CA-PTHA WG. Several of these online meetings were
held for discussion between Work Group members from three specific groups: source characterization,
numerical analysis, and applications. The in-person Menlo Park workshop generated focused
discussions on the CSZ source characterization, the types of applications and product needs, and the
following three outcomes to identify where: (1) consensus/differences in Work Group exists; (2)
immediate improvements can be made in PTHA; and (3) long-term needs exist for improving PTHA.
Another significant outcome of this workshop was the realization that the CA-PTHA WG required a
second phase to evaluate second-generation PTHA products, validate modeled current velocity results,
and develop a risk-based approach for land-use programs.

8
Methods
In early 2013, URS and UW completed initial PTHA products and reports for Crescent City (Thio, 2013;
Gonzalez et al, 2013). An early evaluation of these two products indicated they share many of the same
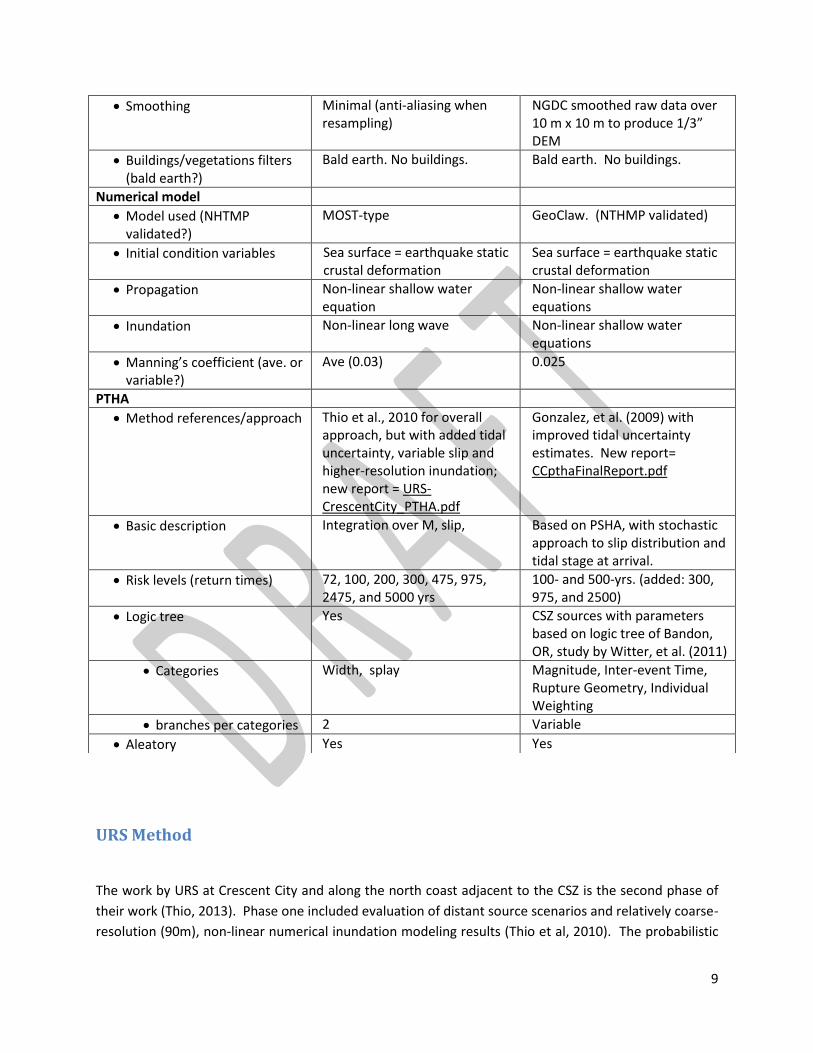
attributes and inputs, and differ in other areas. Table 1 compares aspects of the methods and source
and model inputs to help identify where similarities and differences exist. Preliminary comparisons of
hazard curves and, more fundamentally, tsunami model output, have revealed significant differences
that are still being evaluated.
Table 1: Comparison of various source and model inputs into two PTHA work by URS and UW.
URS – Hong Kie Thio References/Methods
UW – Gonzalez/LeVeque References/Methods
Tsunami sources – probability, location, slip, deformation
Cascadia Use source scenarios by USGS (Frankel)
Use source scenarios by USGS (Frankel)
Number of scenarios > 500 15 realizations of a CSZ event generated by Witter, et al., 2011 for the Bandon, OR study
Rupture length 5 (-2s, -s, mean, +1s, +2 s) 1000 km
Rupture width 2 Variable
Splay fault(s) yes Yes. Some realizations are based on assumed splay faulting.
Variable or average slip 3 slip distributions per event Variable
Magnitude 8.7 – 9.2 Variable. Mw8.7 to Mw9.2
Recurrence Interval Between 400-1200 yr Two computations: Tm = 332 years and Tm = 525 years
Tides 3 levels New methodology to estimate tidal uncertainty.
Alaska/Aleutians Yes 9 Scenarios
Kamchatka Yes 2 Scenarios
Kurils Yes 3 Scenarios
Japan Yes 1 Scenario
Other distant source areas None None
Non-Cascadia local sources None None
DEMs
Source of data NGDC (1/3” resolution) NGDC (1/3” resolution)
Resolution in inundation modeling
1’ (~30m) 2/3” (~20m)
DEM QC Minimal By NOAA/NGDC
Structured/non-structured grid
Structured Structured
9
URS Method
The work by URS at Crescent City and along the north coast adjacent to the CSZ is the second phase of
their work (Thio, 2013). Phase one included evaluation of distant source scenarios and relatively coarse-
resolution (90m), non-linear numerical inundation modeling results (Thio et al, 2010). The probabilistic
Smoothing Minimal (anti-aliasing when resampling)
NGDC smoothed raw data over 10 m x 10 m to produce 1/3” DEM
Buildings/vegetations filters (bald earth?)
Bald earth. No buildings. Bald earth. No buildings.
Numerical model
Model used (NHTMP validated?)
MOST-type GeoClaw. (NTHMP validated)
Initial condition variables Sea surface = earthquake static crustal deformation
Sea surface = earthquake static crustal deformation
Propagation Non-linear shallow water equation
Non-linear shallow water equations
Inundation Non-linear long wave Non-linear shallow water equations
Manning’s coefficient (ave. or variable?)
Ave (0.03) 0.025
PTHA
Method references/approach Thio et al., 2010 for overall approach, but with added tidal uncertainty, variable slip and higher-resolution inundation; new report = URS-CrescentCity_PTHA.pdf
Gonzalez, et al. (2009) with improved tidal uncertainty estimates. New report= CCpthaFinalReport.pdf
Basic description Integration over M, slip, Based on PSHA, with stochastic approach to slip distribution and tidal stage at arrival.
Risk levels (return times) 72, 100, 200, 300, 475, 975, 2475, and 5000 yrs
100- and 500-yrs. (added: 300, 975, and 2500)
Logic tree Yes CSZ sources with parameters based on logic tree of Bandon, OR, study by Witter, et al. (2011)
Categories Width, splay Magnitude, Inter-event Time, Rupture Geometry, Individual Weighting
branches per categories 2 Variable
Aleatory Yes Yes

10
characterization of the sources closely followed a probabilistic seismic hazard analysis (PSHA) definition
of the hazard. Non-linear modeling propagated the tsunami onshore from a probabilistic offshore
tsunami wave height representing a specific risk level. This offshore wave height was based on Green’s
function summation approach that was able to integrate a wide range of source areas and magnitudes,
and consider both epistemic and aleatory uncertainties.
According to Thio and others (2010) and Thio (2013), the methodology for these distant sources can be
summarized in the following steps:
1. Subfault partitioning of earthquake sources;
2. Computation of fundamental Green’s functions for every sub-fault to near-shore locations;
3. Definition of earthquake recurrence models;
4. Generation of a large set of scenario events that represents the full integration over earthquake
magnitudes, locations and sources, for every logic tree branch;
5. Computation of near-shore probabilistic wave height exceedence rates;
6. Identification of dominant sources through source disaggregation; and,
7. Computation of probabilistic inundation hazard by computing non-linear runup using
disaggregated sources and offshore wave heights.
The second phase of work included evaluation of the CSZ as a local source scenario, improvements in
overall tsunami source modeling and probabilistic methodologies, and the use of higher resolution
digital elevation models (DEMs; 30m; Thio, 2013). The CSZ source characterization followed a logic-tree
approach where multiple branches incorporate known and theoretical return periods, rupture location,
magnitudes, and slip amounts of CSZ events. Return periods were based on both onshore and offshore
evidence of CSZ events (Priest et al., 2009; Witter et al., 2011; Goldfinger et al., 2012), and guidance
from the USGS PSHA analysis for the NSHM work group (Art Frankel, personal communication, 2012).
The length and width of the probabilistic CSZ scenarios were functions of information and deformation
models constrained by the observed locked zone of the subduction interface and patterns in subsidence
from previous earthquakes (Wang et al., 2003; Leonard et al., 2010). The magnitude of scenario
earthquakes and related slip pattern on the CSZ were constrained by the dimensions of the rupture and
global scaling relations (Thio, 2013).
Return periods of large scenario events were also controlled by the convergence rate along the CSZ,
which is approximately 29 mm/yr in northern California to 45 mm/yr from Oregon to the north (McCrory
et al., 2006). Thio (2013) utilized a 20 mm/yr maximum convergence rate, which provides seismic
efficiency of nearly 70%.
The tsunami propagation model used by URS was benchmarked against inundation data from the 1993
Okushiri Island (Japan) event. However, Thio (2013) states that newer propagation models may provide
better inundation results.

11
Univ. of Washington Method
The UW study, summarized in Gonzalez et al (2013), builds on the PTHA work conducted in Seaside,
Oregon (Gonzalez, 2006), with some improvements. New non-linear tsunami propagation software
called GeoClaw was used; this propagation model has been validated against a series of benchmark tests
developed by the NTHMP Mapping and Modeling Subcommittee (NTHMP Benchmark doc, 2012).
Source characterization has been updated using new CSZ data from Witter et al. (2012) and new post-
2011 Tohoku-oki event evaluations of the sources off the coast of Japan. UW also used improved
methods on estimating tidal uncertainty based on Adams et al. (2013).
In general, the UW probabilistic approach is similar to that of URS. Both used a combination of the work
being done by the NSHM program on the PTHA as well as information from the work in Oregon. UW
applied more directly the scenarios of Witter et al. (2012) where full seismic efficiency (nearly 100%) of
the slip is accounted for in the PTHA. According to Gonzalez et al. (2013), the CSZ source
characterization provided one of the largest uncertainties in their evaluation. The use of the GeoClaw
modeling program and 10m resolution DEMs improves the chances for accurate tsunami inundation
modeling.
Evaluation
The CA-PTHA Work Group was created to help CGS evaluate the two PTHA products and reports being
developed in Crescent City. Although a direct comparison of the methods and products would have
been ideal, several factors made a comparison and validation difficult. The methods (logic trees,
uncertainties, numerical modeling, etc.) were developed independent of this review process and,
therefore, did not use consistent input data or parameters. Products were produced prior to the
initiation of the full evaluation or guidance of CGS or the CA-PTHA Work Group. In addition, validation
of the PTHA products could not be performed as probabilistic benchmarks do not exist. Considering
these limitations, CGS and the CA-PTHA Work Group focused on determining if the differences in the
UW and URS PTHA products were acceptable, and, if they are not, recommendations for short-term and
long-term improvements to PTHA in California would be provided.
Methods Comparison
Cascadia Subduction Zone (CSZ) Geometry: CSZ geometry in the URS study follows contours of McCrory
et al. (2006) Cascadia slab model (a revised model is available at http://pubs.usgs.gov/ds/633/).
Potential rupture length is prescribed by six earthquake scenarios provide by the USGS (Art Frankel,

12
personal communication, 2012), which includes one scenario rupturing the entire CSZ and five partial
rupture scenarios. Following the USGS scenario descriptions, segment boundaries for the partial rupture
scenarios are approximately chosen at Cape Blanco, Heceta Bank, and Nehalem Bank based on the
paleoseismic work of Goldfinger et al. (2012). The URS approach includes two down-dip edge options
with rupture widths of 80 km and 120 km, respectively. It uses a 20-km grid of sub-faults to cover entire
rupture areas. It also includes options for rupture to occur on a splay fault as well as on the shallow
trench-ward part of the subduction zone.
The UW study used the digital source files developed by Witter et al. (2011) for a study of Bandon,
Orgeon. These sources were characterized by a fixed length of 1,000 km for CSZ and two average
rupture width options: 83 km and 105 km; the actual modeled width varies with latitude and included
shallow buried rupture, deep buried rupture, and splay fault features.
The CSZ geometric model used by URS for Crescent City tsunami evaluation shares more similarities with
the model used by the USGS for the 2014 update of the National Seismic Hazard Maps (NSHM) than the
UW model. Similarities between URS and NSHM models include rupture lengths, segment boundaries,
and slope of the subducting slab. These two models differ in the potential lateral rupture extents and
splay fault. The Witter et al. (2011) sources utilized the earlier CSZ geometry developed by McCrory et
al. (2004), with its lateral and along-strike extents that are different from either the URS model or the
NSHM model. The NSHM model does not include shallow trench-ward rupture and splay fault that are
included in the URS model. The upper edge extent (McCrory 5 km contour) of the NSHM model may be
comparable to the shallow buried rupture option in the UW model (need to confirm), but the NSHM
model does not include deep buried rupture and splay fault options that are in the UW model. The
NSHM model includes three alternatives for down-dip extent that are based on a comprehensive set of
research by multiple scientists with a wide range of approaches (Frankel and Petersen, 2012).
CSZ Earthquake Magnitude and Frequency: The URS study uses the Strasser et al. (2010) global scaling
relation between magnitude and rupture area (M-A relation) to estimate earthquake magnitude from
rupture areas for the six scenarios provided by the USGS. It considers uncertainty (aleatory) in the M-A
relation by sampling magnitude distribution at five points from -2 to +2 standard deviations. The
standard deviation is 0.286 magnitude units. This scaling methodology in combination with six rupture
areas resulted in a magnitude range of 7.58 to 9.5. The URS event rates appear to follow those of
Goldfinger et al. (2012).
The URS scaling approach for earthquake magnitude is similar to the NSHM approach for the
characteristic branches of NSHM logic tree (Frankel, 2012), except that the NSHM approach uses three
published M-A relations, including Strasser et al. (2010) relation, to account for epistemic uncertainty.
That is, the URS study accounts for aleatory variability in earthquake magnitude, whereas NSHM
accounts for epistemic uncertainty. The NSHM approach resulted in a magnitude range of 8.61 to 9.34
for the full CSZ rupture and a magnitude range of 8.11 to 9.07 for partial ruptures. In addition, the
NSHM logic tree also includes an un-segmented branch for M8.0 to M8.7 earthquakes floating over the
entire CSZ and southern CSZ; and a series of M8 earthquakes clustered in time that fill the entire CSZ.

13
Although the overall NSHM magnitude range of 8 to 9.34 is not too different from the URS magnitude
range of 7.58 to 9.5, the two approaches have different magnitude-frequency distributions. In the
NSHM approach, magnitude-frequency distribution is governed by weights assigned to the three M-A
scaling relations, the three down-dip options, and the various branches of the NSHM event rate logic
tree. The URS scenario event rate approach is similar to only one of the three branches on the NSHM
event rate logic tree. The URS magnitude-frequency distribution is mainly governed by the magnitude
distribution of Strasser et al. (2010) M-A relation and weights assigned to the two rupture width options.
The UW approach is very different than the URS approach and the NSMH approach. It is based on the
five rupture models developed for tsunami inundation studies at Bandon, Oregon, by Witter et al.
(2011), namely the “extra extra large,” “extra large,” “large,” “medium,” and “small” even models. For
each rupture model, an inter-event time (slip deficit time) is defined, along with vertical seafloor
deformation data. Maximum slip is estimated as slip deficit time multiplied by a plate convergence rate
of 34 mm/yr. Average slip is estimated as 0.49 of the maximum slip. Also, each rupture model is
combined with three fault geometric options (i.e., splay fault, shallow buried rupture, or deep buried
rupture) resulting in 15 total realizations.
Witter et al. (2011) developed a total of 15 source scenarios, with characteristics listed in their Tables 3
and 4. The fixed length of 1000 km was adopted; each source was characterized by spatial
concentrations of slip that could be considered to produce various “effective” lengths. Segmented
ruptures and north-south-limited asperities were not included, because testing (e.g. Priest et al., 2009;
Priest et al., submitted) revealed that tsunami energy is not efficiently transmitted by edge wave
propagating north and south of source areas. The UW approach adopted the view that the 15 source
scenarios were realizations of a single event. Model output from the 15 simulations were then used to
produce two sets of probabilistic computations that differed only in the assumed mean recurrence times
of 332 and 525 years, with each assigned conditional probabilities based on the expert opinion of the
Bandon study authors, as expressed in the “TotalWeight" column of their Table 3. The two values of
mean recurrence time corresponded to: (1) 1/322 per year, based on an estimate of 14% probability of a
whole CSZ rupturing event in next 50 years from Petersen et al. (2002) and a Poisson distribution, with
time-dependent consideration; and (2) 1/525 per year, based on recurrence of M9, full-length rupturing
earthquakes. The UW magnitude range of 8.7 to 9.2 is similar to the full-source, characteristic branch of
the NSHM model. The 1/525 per year rate option is similar to the NSHM rate. The UW model does not
seem to reflect partial ruptures with smaller magnitude earthquakes, like the segmented branch of the
NSHM logic tree that is based on the segmentation boundaries and event rates of Goldfinger (2012, i.e.,
cases B, C, and D).
CSZ Co-Seismic Slip and Slip Distribution: The URS estimates the average co-seismic slip for a given
scenarios (i.e., a given magnitude) from moment definition and correlation between earthquake
moment and moment magnitude using magnitude, rupture area, and an assumed shear modulus of 30
GPa. The URS method incorporates variable slip by designating one-third of the rupture as an asperity
with twice the average slip and the other two-thirds of the rupture at half the average slip. A total of
three slip distributions cases are implemented so asperity occupies every part of the rupture once. Slip
along fault dip is uniform.

14
As noted previously, in the UW approach calculates maximum slip as inter-event time multiplied by
plate convergence rate and average slip is estimated at approximately half of the maximum slip. Slip
distribution appears to be uniform along rupture length, but varies across rupture width.
Perhaps both groups can improve their slip distribution by considering more realistic slip patterns
depicted from various inversion techniques for some recent subduction earthquakes.
The current URS model for CSZ most closely resembles the NSHM logic tree; however, differences exist
as noted above. The URS model can be aligned with the NSHM model if the following modifications are
made:
1. Eliminate the two partial rupture scenarios that do not rupture the southernmost segment;
2. Use NSHM magnitudes and rates for segmented ruptures as well as whole zone rupture, and
implement un-segmented floating rupture option; and,
3. Use NSHM geometry, both along strike and down-dip extent for segmented models as well as
for whole zone rupture.
Implementation of the series of ruptures clustered in time on the NSHM logic tree may be difficult and
may not be necessary for tsunami hazards owing to the previously mentioned inefficiency of tsunami
energy transmittal by edge waves propagating north and south.
Distant Sources: Both URS and UW evaluated a number of distant subduction zone source regions for
their PTHA (Alaska, Aleutian Islands, Kamchatka, Kuril Islands, Japan, and Chile). Both also use historical
earthquakes to help determine the probabilistic character for these sources despite the relatively short
historical earthquake record for distant sources leading to potential large uncertainties. A difference in
the two analyses exists with URS incorporation considering rates of subduction in these source areas to
help predict the amount of slip during large earthquakes over a period of time. URS approach yielded
only a percentage of slip, or seismic efficiency, from 30% to 50% as occurring during a single large event,
the remaining slip would be explained as taken up by aseismic means.
Local sources: Other than the CSZ, no other local sources were considered in development of the PTHA
in California. Although potential tsunamigenic sources such as offshore normal and thrust faults and
submarine landslides exist, these sources appear to be either relatively minor in tsunami generation or
they have a very long return period (7,000 to 10,000 years; refs???). Additional work should be
completed to evaluate the age and tsunami potential of these sources.
Numerical Models: URS and UW used different numerical modeling programs for tsunami inundation.
The UW Geoclaw model is more numerically enhanced than the model used by URS, and their model
has gone through the NTHMP model validation exercises. Therefore, the inundation modeling
completed by UW is expected to be more accurate.

15
Other inputs and variables: A number of other variables were part of the PTHA production process (see
Table 1):
1) Though the source DEM used by URS and UW was the same, the resolution they each used for
inundation modeling was different. UW used a 20m resolution and URS used a 30m resolution.
We would expect that UW modeling to be able to capture smaller features and, therefore, have
a better inundation accuracy.
2) The Manning’s Coefficient for surface roughness was similar between the two methods: 0.25
for UW and 0.3 for URS. Generally, both values are within the average range of the normal
modeling community, however we would expect UW inundation models to flood slightly more
inland because a lower ground roughness (smoother surface).
Results Comparison
Despite differences in the methods and input parameters, a comparison of hazard curves (Figure 1) and
map products (Figure 2) was attempted to determine the impact of the differences and where the
greatest potential sources for error exist. Figure 1 shows hazard curves where modeled tsunami flow
depth is compared to the annual rate of exceedance. The flow depths on the URS hazard curves are
higher than that of the UW hazard curves for the range of annual rates of exceedance. This implies that
the inundation from the URS method should be greater than the UW method. However, Figure 2 which
illustrates the inundation for the resulting 100-year and 500-year maps are nearly the same between the
two methods.
One likely source for the difference in the inundation results is the numerical inundation models being
used. Figure 3 shows the inundation results using the two different numerical models on the same
source, called the Cascadia-Large scenario, and other input parameters, thus eliminating these inputs as
causing the differences. URS’ “MOST-type” model, which was used by URS for production of their initial
maps, does not inundate as far inland as the UW GeoClaw model. Therefore, the similarities in
inundation in Figure 2 are likely only there because the URS results, which should inundate a much
larger area based on the hazard curves (Figure 1), did not show inundation moving further inland.
Because GeoClaw uses higher order physics for improved inundation inland of the tsunami, it is likely a
more accurate model to use.
Although this is one apparent source for differences/errors, other sources for error may prove more
difficult to determine. General observations about these differences and errors are discussed more in
the Findings section below, with a more detailed evaluation of potential differences and errors in Phase
2 of the project.

16
Figure 1: Probabilistic tsunami hazard curves comparing flow depth
Figure 2: Comparison of inundation maps for 100-year and 500-year return periods.

17
Figure 3: Comparison of inundation maps using the same source (M9.0 on Cascadia subduction zone;
Oregon’s “large” event) and input parameters but different numerical models: the GeoClaw model on
the left and the URS’ “MOST-like” model on the right. Note there appears to be greater inundation
using the GeoClaw model.
Findings
The findings of CGS and the CA-PTHA Work Group can be broken down into three phases. The work and
evaluation to this point is considered Phase 1. Phase 2 work includes the initial verification of modeled
currents and the production of secondary products based on Phase 1 recommendations that can be
shared with end-users for feedback. Phase 3 is the long-term needs to make improvements in future
PTHA production.
Phase 1: Initial results
Although PSHA has been around for some time, PTHA work is a relatively new field of research and
application. PSHA has been vetted over the past 50 years by both national and international experts.
PTHA work has only been initiated in earnest over the past decade, and has made some significant
advancements because of studies of the 2004 Indian Ocean, 2010 Maule (Chile), and 2011 Tohoku-oki
(Japan) tsunamis. This CA-PTHA Work Group is the first multi-disciplinary review group to analyze two
separate PTHA studies at one location.
As previously mentioned, despite the guidance provided by the USGS on the CSZ source characterization
and the availability of other similar inputs to the PTHA model and methods, the two principal
18
investigators used different inputs and methods to develop their PTHA products. These differences limit
the ability of the CA-PTHA Work Group to provide a direct comparison and verification of the two
methods and products.
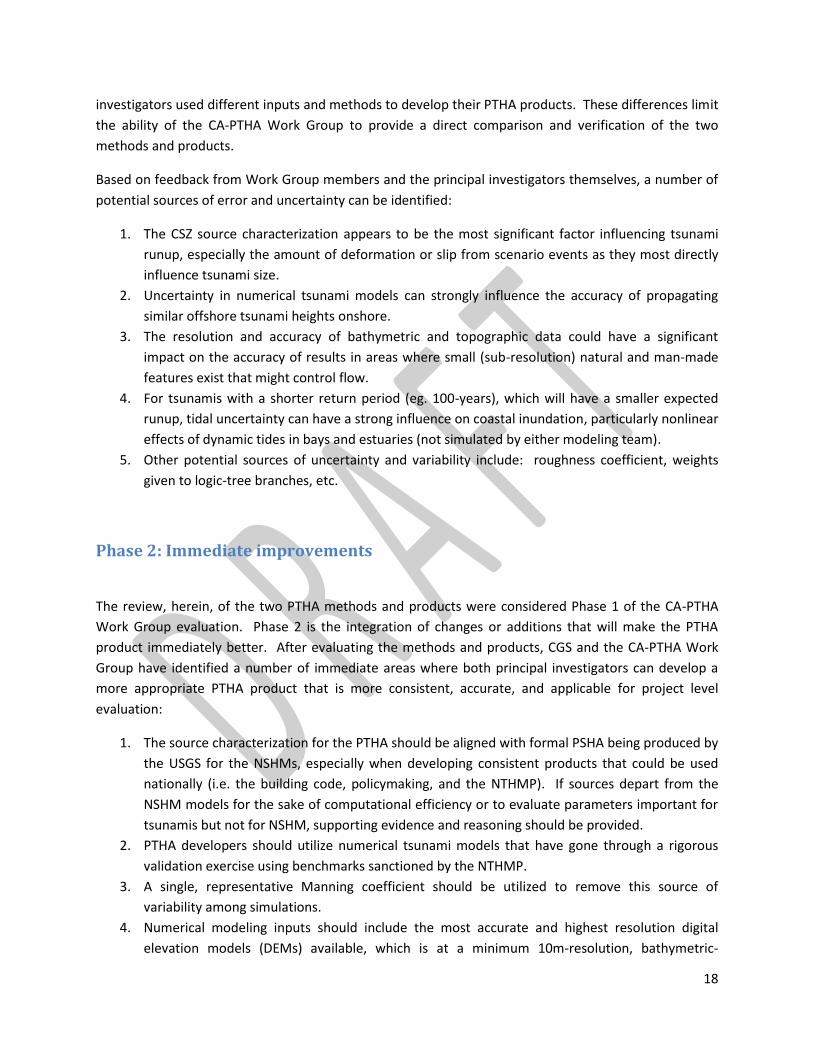
Based on feedback from Work Group members and the principal investigators themselves, a number of
potential sources of error and uncertainty can be identified:
1. The CSZ source characterization appears to be the most significant factor influencing tsunami
runup, especially the amount of deformation or slip from scenario events as they most directly
influence tsunami size.
2. Uncertainty in numerical tsunami models can strongly influence the accuracy of propagating
similar offshore tsunami heights onshore.
3. The resolution and accuracy of bathymetric and topographic data could have a significant
impact on the accuracy of results in areas where small (sub-resolution) natural and man-made
features exist that might control flow.
4. For tsunamis with a shorter return period (eg. 100-years), which will have a smaller expected
runup, tidal uncertainty can have a strong influence on coastal inundation, particularly nonlinear
effects of dynamic tides in bays and estuaries (not simulated by either modeling team).
5. Other potential sources of uncertainty and variability include: roughness coefficient, weights
given to logic-tree branches, etc.
Phase 2: Immediate improvements
The review, herein, of the two PTHA methods and products were considered Phase 1 of the CA-PTHA
Work Group evaluation. Phase 2 is the integration of changes or additions that will make the PTHA
product immediately better. After evaluating the methods and products, CGS and the CA-PTHA Work
Group have identified a number of immediate areas where both principal investigators can develop a
more appropriate PTHA product that is more consistent, accurate, and applicable for project level
evaluation:
1. The source characterization for the PTHA should be aligned with formal PSHA being produced by
the USGS for the NSHMs, especially when developing consistent products that could be used
nationally (i.e. the building code, policymaking, and the NTHMP). If sources depart from the
NSHM models for the sake of computational efficiency or to evaluate parameters important for
tsunamis but not for NSHM, supporting evidence and reasoning should be provided.
2. PTHA developers should utilize numerical tsunami models that have gone through a rigorous
validation exercise using benchmarks sanctioned by the NTHMP.
3. A single, representative Manning coefficient should be utilized to remove this source of
variability among simulations.
4. Numerical modeling inputs should include the most accurate and highest resolution digital
elevation models (DEMs) available, which is at a minimum 10m-resolution, bathymetric-

19
topographic DEMs from the National Geophysical Data Center. If available, higher resolution
(1m) LiDAR should be utilized.
5. A short-term strategy for benchmarking modeled tsunami current velocities using 2011 data
from Crescent City and possibly Japan should be developed and implemented.
6. A quantitative analysis of the sensitivity of various source and model inputs to the final results
will be undertaken to determine what parameters are most important to PTHA.
Discussions at the 3-4 June 2013 CA-PTHA meeting indicated that the approach taken by URS to develop
CSZ source scenarios was more in line with the approach of the NSHM program. As a result, the UW
group now plans to adopt the suite of CSZ sources developed and provided to the UW by URS.
Phase 2 work will be initiated and help in the initial production of PTHA products (maps, digital files,
guidance, etc.) in California. Phase 2 will likely be completed at the beginning of 2014.
Phase 3: Long-term needs
In addition to the Phase 1 results and the immediate Phase 2 work, CGS and the CA-PTHA Work Group
recommend a number of long-term needs that will help in the development of future PTHA products:
1. Consideration and integration into the PTHA of additional smaller earthquakes (M8.0 to M8.5)
that occur more often in the southern CSZ. There are number of factors that support a higher
likelihood of smaller, non- or less tsunamigenic earthquakes, because of differences between
the CSZ off the coast of northern California and the rest of the CSZ to the north: (1) the
convergence rate is lower on the southern section (2.9cm/yr vs. 4.3cm/yr); (2) the higher
frequency of smaller earthquake events in south; (3) higher fault activity in the interplate area
and not on subduction zone; and (4) lack of evidence for large/very large events in geologic
record in California over the last 3,500 years, especially the low likelihood that the dunes in the
North Spit of Humboldt Bay have been overtopped over this time. Evaluation of the California
Tsunami Deposit Database (Hemphill-Haley et al., in press) will help define the recurrence and
other characteristics of the southern CSZ tsunami source in California. Changes in
characterization of the southern CSZ must consider potential deviation from the USGS NSHM
treatment of the source.
2. More rigorous benchmarking of numerically modeled current velocities through the NTHMP or
other national consortium. Although several workshops have been held to benchmark the
modeled tsunami inundation results, the lack of actual current velocity measurements have
limited the ability to validate velocities in the numerical models. However, the 2011 Tohoku-oki
tsunami has provided current velocity data from instrumentation and video that can be used for
benchmarking models. The FY13-17 NTHMP Strategic Plan (2013) recommends that the state
and federal partners work together to develop a suite of benchmarks and a workshop to help
verify the accuracy of tsunami currents in numerical models.

20
3. Additional evaluation of local sources will be performed. Based on the existing data available,
most offshore faults other than the CSZ have a low tsunamigenic potential. In addition,
submarine landslides which may cause large local tsunamis appear to lack a seismic triggering
mechanism and are believed to have a long return period, on the order of 10,000-100,000 years.
However, more work including age dating of submarine faults and landslide deposits should be
completed before ruling out the potential.
Use of PTHA Products
PTHA products will be important to tsunami hazard and risk analysis, and community preparedness,
mitigation, and long-term resilience. The CA-PTHA Work Group includes practitioners -- engineers,
planners, and emergency preparedness experts -- who provide a broad perspective on priority uses of
PTHA products. Because the products have not been previously developed for use, many of the ideas on
the types and uses of products are relatively new. However, hazard mitigation policies and protocols
developed for other hazards (seismic, flood, wind, etc.) can form the basis for tsunami risk product
applications.
Potential Applications
The resulting set of maps will identify a suite of specific tsunami-flood risk levels that will be compatible
with probabilistic products for other coastal flood and earthquake hazards, such as severe storm
inundation, liquefaction, and predicted sea level rise. In addition to providing the maps/products
needed for integration into the project-level, land-use evaluation required under the Seismic Hazard
Mapping Act, CGS and the CA-PTHA Work Group have identified a number of other potential important
flood protection and planning applications that could utilize PTHA products:
1. FEMA RiskMAP – FEMA’s RiskMAP products are useful for local jurisdictions to help mitigate
hazards. RiskMAP products are the primary focus of the UW principal investigators. Through a
Collaborative Technical Partnership with FEMA, CGS and Cal-OES are developing tsunami hazard
products for RiskMAP specifically for the maritime community in California.
2. California Coastal Commission, Governor’s Office of Planning and Research (OPR), and local
community land-use planning through modifications to California general plan law – Although
the Seismic Hazard Mapping Act addresses project level mitigation, CGS will work with the
Coastal Commission, OPR, and local community land-use planner on ways PTHA products can be
used for local planning through integration of probabilistic tsunami mapping with land use
elements of local general plans and Local Coastal Programs (LCPs). An outcome of Phase 2 work
will be identifying the need and utility of the CA-PTHA products for these specific purposes.

21
3. ASCE 7-15 tsunami loads/proposed building codes – CGS and URS are members of a national
engineering subcommittee establishing a procedure for determining tsunami loads for coastal
building design standards. The design standards are being targeted for inclusion in the
International/Uniform Building Codes by the year 2018, and will include a performance-based
approach related to the 100- and 2,500-year return periods.
4. FEMA Flood Insurance – FEMA’s National Flood Insurance Program is producing Flood Insurance
Rate Maps that identify 100- and 500-year flood zones. Although there is no plan to integrate
PTHA products at this time, if products were available they might be utilized in the program in
the future.
5. CalOES evacuation planning – The National Academy of Science recommended the use of
standardized, PTHA-related products for consistent, cross-jurisdictional evacuation planning
(National Academy of Science, 2011). PTHA inundation maps will provide a standardized risk-
level comparison for the state’s deterministic-based tsunami inundation lines used for
evacuation planning, flood protection, and emergency response.
6. Local Hazard Mitigation Planning (FEMA/CalOES) - PTHA products will help communities develop
long-term, tsunami hazard mitigation plans more effectively, and provide a platform for FEMA
and CalOES to evaluate those plan and provide mitigation funding in a more consistent manner.
7. California Department of Water Resources (DWRs) Statewide Flood Risk Planning – DWR is
mandated to provide 200-year flood zones for areas of the Central Valley of California (California
Department of Water Resources, 2013). Development of a 200-year flood map may provide
support for developing similar flood protection protocol for tsunami and other coastal flood
hazards.
8. State of California “My Plan” platform – Cal-OES has developed a community mapping and data
resource platform that can house and share the potential large data and GIS files produced from
the PTHA. This is platform that can be easily accessed by community GIS departments.
9. FEMA HAZUS – FEMA is developing a tsunami module for HAZUS loss estimation that is being
tested in various locations, including Crescent City. PTHA products of various tsunami risk levels
will be useful for comparing tsunami risk for all coastal communities.
10. Nuclear Regulatory Commission (NRC) – Although the risk levels may be longer term and the
PTHAs evaluated may be rigorous with the NRC, there are critical similarities between NRC and
the CA-PTHA in source characterization and analysis methods employed. A better
understanding of the relationship between this work and the NRC should be a long-term goal.
Table 2 summarizes the probabilistic mapping needs for a number of the applications discussed above.
Many of these organizations have expressed verbal support for completion of a consistent set of PTHA
products in California. In order to determine the appropriate PTHA risk-level maps for the different
applications, CGS will engage these end user group to determine their interest and needs. Ultimately, a
suite of accurate risk-level map products will be developed so that they can be applied consistently
statewide, and provide an example of how they could be used nationally through the NTHMP.

22
Table 2: Potential PTHA risk-level needs for a number of applications.
PTHA Products
During Phase 1, review of the prospective applications of the PTHA work provides insight into what
different types products would be most useful. Table 3 presents potential products as they relate to
specific applications discussed above. The various products include tsunami inundation area, flow depth,
current velocity, momentum flux (force), and water-level change. These or related products can be
generated at any time as long as the numerically modeled “time-series” information (tsunami amplitude
and velocity results for each time-step for each model run) is saved. Archiving of this valuable data
should be accomplished by government agencies at the state or federal level so it is not lost.These
products could be produced as maximum or minimum values, and as paper maps or digital formats
depending on the users’ needs.
For Phase 2 of the project, CGS will produce maps and other products for the Seismic Hazard Mapping
Program as well as other potential user communities. The Seismic Hazard Mapping Program will
develop a set of guidance on how to use these products in-line with the authorization under the Seismic
Hazard Mapping Act. These products could become “zones of required investigation” similar to the
existing liquefaction and seismically induced landslide zones, or they may simply be used to assist
communities in better understanding their tsunami risk and integrating the PTHA products into their
local planning.
Example products will also be created for different end user communities. These products will be
shared with those end users and CGS will work with them to determine the adequacy and utility of the
products. For example, CGS will work with the California Coastal Commission and the pilot project
communities to establish a performance-based approach for land-use planning and development; a
result of this may be products from a suite of various risk levels that can be applied towards different
types of construction based on intended use and occupancy.

23
Table 3: Potential PTHA maps and products needs for a number of applications.
Conclusions
The CA-PTHA Work Group was established to assist with the review of PTHA results from two
independent analyses as well as to provide a prospective on the overall state of the science in
probabilistic tsunami analysis. An absolute comparison of the methods and products of the two
analyses was not possible given the individual nature of the source characterization and the different
models and model inputs used. However, the Work Group has agreed on the following consensus
statements related to the PTHA discussions and review:
1) The PTHA methods, with the improvements discussed and uncertainties understood, are
scientifically suitable for use in California.
2) Application of probabilistic analysis will improve the understanding of the tsunami risk as long as
input parameters are reliable and the uncertainties are well understood.
3) Alignment of the PTHA with the formal NSHM Probabilistic Seismic Hazard Analysis is important,
especially for production of consistent products statewide and nationally (building code,
policymakers, and NTHMP), but some adjustments may be needed to accommodate unique
aspects of tsunami generation and simulation.
4) Improvements to and use of more robust numerical models and more accurate and higher
resolution DEMs lead to lower uncertainties in PTHA.

24
5) PTHA development and production will be more consistent and accurate when multiple
scientific and engineering organizations (state, federal, academic, private, etc.) work together.
6) Production of a single set of PTHA risk-level maps will reduce the potential for confusion and
misuse at the local level.
7) Multiple end-users of PTHA products should be involved and help support this work early in
production in order to ensure that all expectations for application are met.
8) Guidance should be developed by the NTHMP and other partners for consistent and accurate
PTHA production among the nation’s coastal states and communities.

25
References
Barberopoulou, A., Borrero, J.C., Uslu, B., Kalligeris, N., Goltz, J.D., Wilson, R.I., and Synolakis, C.E., 2009,
New maps of California to improve tsunami preparedness: EOS Trans. American Geophysical Union,
90 (16), pp. 137-138.
California Department of Water Resources, 2013, Public Draft - California’s flood future:
Recommendations for managing the state’s flood risk: State of California, The Natural Resources
Agency, Department of Water Resources: April 2013, 148 pp.
California Seismic Safety Commission, 2005, The tsunami threat to California: Ad Hoc Committee on
Tsunami Safety, CSSC 05-03, 24 pp.
Frankel, A., and Petersen, M., 2012, Models of Earthquake Recurrence and Down-Dip Edge of Rupture for the Cascadia Subduction Zone., U.S. Geological Survey.
Geist, E.L., and Parsons, T., 2006, Probabilistic analysis of tsunami hazards: Natural Hazards, v. 37, p. 277-314.
Goldfinger, C., Nelson, C.H., Morey, A., Johnson, J.E., Gutierrez-Pastor, J., Eriksson, A.T., Karabanov, E.,
Patton, J., Gracia, E., Enkin, R., Dallimore, A., Dunhill, G., and Vallier, T., 2012, Turbidite Event
History: Methods and Implications for Holocene Paleoseismicity of the Cascadia Subduction Zone,
USGS Professional Paper 1661-F, Reston, VA, U.S. Geological Survey, 332 p, 64 Figures.
Gonzalez, F.I., Geist, E.L., Jaffe, B., Kanoglu, U., Nofjeld, H., Synolakis, C.E., and fifteen others, 2009,
Probabilistic tsunami hazard assessment at Seaside, Oregon, for near- and far-field seismic sources:
Journal of Geophysical Research-Oceans, 114:C11023, Jan. 2009.
Gonzalez, F.I., LeVeque, R.J., and Adams, L.M., 2013, Probabilistic Tsunami Hazard Assessment (PTHA)
for Crescent City, CA, Final Report on Phase I, January 31, 2013: University of Washington Report,
70 p.
Hemphill-Haley, E., Admire, A., and Wilson, R., in press, California Tsunami Deposit Database: California
Geological Survey Special Report, 24 p.
Jones, L., and Ross, S. (editors), in press, USGS Science Application for Risk Reduction Tsunami Scenario:
USGS Open File Report 2013-XX.
Lander, J., Lockridge, P.A., and Kozuch, J., 1993, Tsunamis affecting the west coast of the United States
1806-1992: NGDC Key to Geophysical Research Documentation No. 29,
USDOC/NOAA/NESDIS/NGDC, Boulder, CO, USA, 242 pp.
Leonard, L.J., Currie, C.A., Mazzotti, S., and Hyndman, R.D., 2010, Rupture area and displacement of past
Cascadia great earthquakes from coastal coseismic subsidence: Geological Society of America
Bulletin, v. 122, no. 11-12, p. 2079-2096, doi:10.1130/B30108.1.
McCrory, P.A., J.L. Blair, D.H. Oppenheimer, and S.R. Walter, 2006, Depth to the Juan de Fuca slab beneath the Cascadia subduction margin: A3-D model for sorting earthquakes, Data Ser. 91: US Geol. Surv., Reston, Va; http://pubsusgsgov/ds/91/.

26
National Academy of Sciences, 2011, Tsunami warning and preparedness: An assessment of the U.S.
Tsunami Program and that nation’s preparedness efforts: The National Academies Press, 296 p.
NGDC, 2012, National Geophysical Data Center Historic Tsunami Data Base at:
http://www.ngdc.noaa.gov/seg/hazard/tsu_db.shtml.
National Tsunami Hazard Mitigation Program (NTHMP), 2012, Proceedings and results of the 2011
NTHMP Model Benchmarking Workshop: published July 2012, Boulder, CO: U.S. Department of
Commerce/NOAA/NTHMP; (NOAA Special Report), 436 p.;
http://nthmp.tsunami.gov/documents/nthmpWorkshopProcMerged.pdf
National Tsunami Hazard Mitigation Program (NTHMP), 2013, National Tsunami Hazard Mitigation
Program 2013-2017 Strategic Plan, published May 30, 2013, 32 p.;
http://nthmp.tsunami.gov/documents/NTHMPStrategicPlan.pdf
Priest, G. R., Goldfinger, C., Wang, W., Witter, R. C. Zhang, Y., 2009, Confidence levels for tsunami-
inundation limits in northern Oregon inferred from a 10,000-year history of great earthquakes at
the Cascadia subduction zone: Natural Hazards v. 54, p. 27-73. DOI 10.1007/s11069-009-9453-5.
Priest, G. R., Zhang, Y.,Witter, R. C., Wang, W., Goldfinger, C., and Stimely, L, submitted, Tsunami impact
to Washington and northern Oregon from segment ruptures on the southern Cascadia subduction
zone,Natural Hazards.
Strasser, F.O., M.C. Arango, J.J. Bommer, 2010, Scaling of the Source Dimensions of Interface and Intraslab Subduction-zone Earthquakes with Moment Magnitude, Seismological Research Letters, v 71, n 6, p 941-950.
Thio, H.K., 2010, Probabilistic tsunami hazard analysis in California – Year One: Pacific Earthquake Engineering Research (PEER) Center Lifelines Project #10A01.
Thio, H.K., 2013, Probabilistic Tsunami Hazard at Crescent City: URS Corporation Report, 43 p.
Tsunami Pilot Study Working Group [Gonzalez, F., Geist, E., Synolakis, C., Arcas, D., Bellomo, D., Carlton,
D., Horning, T., Jaffe, B., Johnson, J., Kanoglu, U., Mofjeld, H., Newman, J., Parsons, T., Peters, R.,
Peterson, C., Priest, G., Titov, V., Venturato, A., Weber, J., Wong, F., Yalciner, A.], 2006, Seaside,
Oregon Tsunami Pilot Study--Modernization of FEMA Flood Hazard Maps: U.S. Geological Survey
Open-File Report 2006-1234, 161 p. http://pubs.usgs.gov/of/2006/1234/
Uslu, B., 2011, Deterministic and probabilistic tsunami analyses of California: University of Southern
California, PhD dissertation.
Wang, K., 2003, A revised dislocation model of interseismic deformation of the Cascadia subduction
zone: Journal of Geophysical Research, v. 108, no. B1, p. 2026, doi:10.1029/2001JB001227.
Wilson, R.I., Barberopoulou, A., Miller, K.M., Goltz, J.D., and Synolakis, C.E., 2010, New maximum
tsunami inundation maps for use by local emergency planners in the State of California, USA: in
Lee, W.H.K., Kirby, S.H., and Diggles, M.F., compilers, 2010, Program and abstracts of the Second
Tsunami Source Workshop; July 19-20, 2010: U.S. Geological Survey Open-File Report 2010-1152,
33 p.

27
Wilson, R.I., Admire, A.R., Borrero, J.C., Dengler, L.A., Legg, M.R., Lynett, P., Miller, K.M., Ritchie, A.,
Sterling, K., McCrink, T.P., Whitmore, P.M., 2012, Observations and impacts from the 2010 Chilean
and 2011 Japanese tsunami in California (USA): Pure and Applied Geophysics.
http://dx.doi.org/10.1007/s00024-012-0527-z.
Witter, R.C., Y. Zhang, K. Wang, G. R. Priest, C. Goldfinger, L. L. Stimely, J. T. English, and P. A. Ferro. Simulating tsunami inundation at Bandon, Coos County, Oregon, using hypothetical Cascadia and Alaska earthquake scenarios. Oregon Department of Geology and Mineral Industries Special Paper 43, 2011.