Human adenoviruses: new bioassays for antiviral screening and
Upload
kylie-catterallCategory
view
213download
1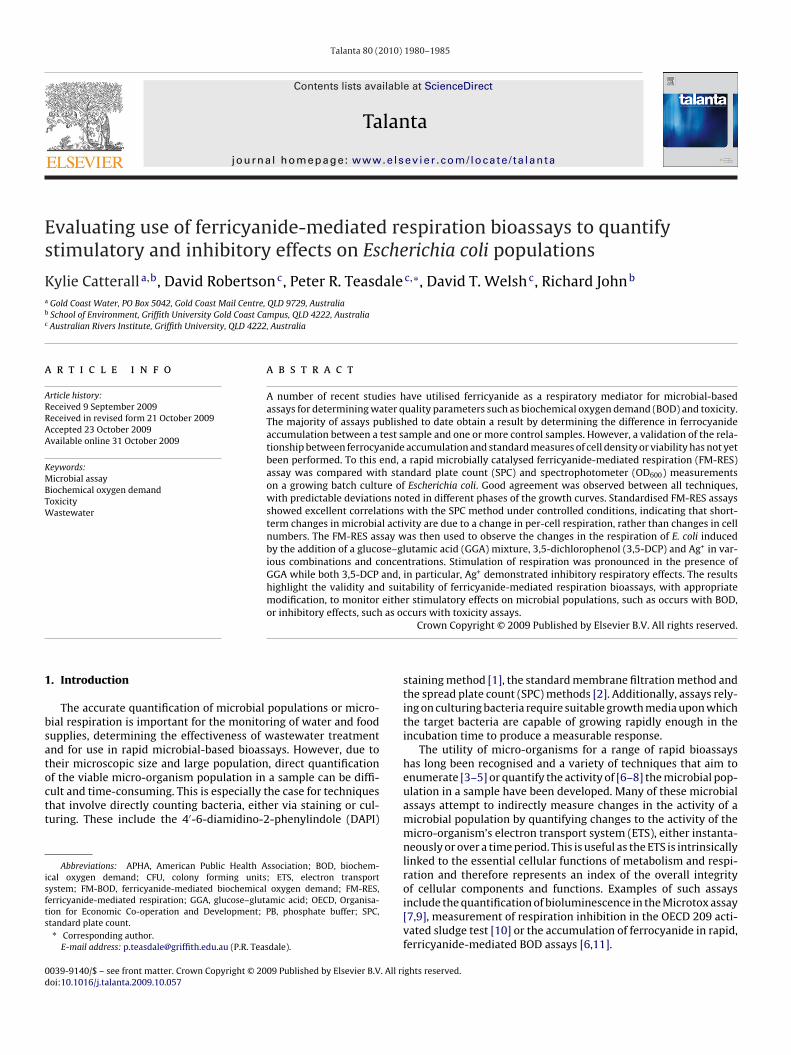
Es
Ka
b
c
a
ARRAA
KMBTW
1
bsatoctt
isfts
0d
Talanta 80 (2010) 1980–1985
Contents lists available at ScienceDirect
Talanta
journa l homepage: www.e lsev ier .com/ locate / ta lanta
valuating use of ferricyanide-mediated respiration bioassays to quantifytimulatory and inhibitory effects on Escherichia coli populations
ylie Catterall a,b, David Robertsonc, Peter R. Teasdalec,∗, David T. Welshc, Richard Johnb
Gold Coast Water, PO Box 5042, Gold Coast Mail Centre, QLD 9729, AustraliaSchool of Environment, Griffith University Gold Coast Campus, QLD 4222, AustraliaAustralian Rivers Institute, Griffith University, QLD 4222, Australia
r t i c l e i n f o
rticle history:eceived 9 September 2009eceived in revised form 21 October 2009ccepted 23 October 2009vailable online 31 October 2009
eywords:icrobial assay
iochemical oxygen demandoxicityastewater
a b s t r a c t
A number of recent studies have utilised ferricyanide as a respiratory mediator for microbial-basedassays for determining water quality parameters such as biochemical oxygen demand (BOD) and toxicity.The majority of assays published to date obtain a result by determining the difference in ferrocyanideaccumulation between a test sample and one or more control samples. However, a validation of the rela-tionship between ferrocyanide accumulation and standard measures of cell density or viability has not yetbeen performed. To this end, a rapid microbially catalysed ferricyanide-mediated respiration (FM-RES)assay was compared with standard plate count (SPC) and spectrophotometer (OD600) measurementson a growing batch culture of Escherichia coli. Good agreement was observed between all techniques,with predictable deviations noted in different phases of the growth curves. Standardised FM-RES assaysshowed excellent correlations with the SPC method under controlled conditions, indicating that short-term changes in microbial activity are due to a change in per-cell respiration, rather than changes in cell
numbers. The FM-RES assay was then used to observe the changes in the respiration of E. coli inducedby the addition of a glucose–glutamic acid (GGA) mixture, 3,5-dichlorophenol (3,5-DCP) and Ag+ in var-ious combinations and concentrations. Stimulation of respiration was pronounced in the presence ofGGA while both 3,5-DCP and, in particular, Ag+ demonstrated inhibitory respiratory effects. The resultshighlight the validity and suitability of ferricyanide-mediated respiration bioassays, with appropriatemodification, to monitor either stimulatory effects on microbial populations, such as occurs with BOD,as oc
or inhibitory effects, such. Introduction
The accurate quantification of microbial populations or micro-ial respiration is important for the monitoring of water and foodupplies, determining the effectiveness of wastewater treatmentnd for use in rapid microbial-based bioassays. However, due toheir microscopic size and large population, direct quantification
f the viable micro-organism population in a sample can be diffi-ult and time-consuming. This is especially the case for techniqueshat involve directly counting bacteria, either via staining or cul-uring. These include the 4′-6-diamidino-2-phenylindole (DAPI)Abbreviations: APHA, American Public Health Association; BOD, biochem-cal oxygen demand; CFU, colony forming units; ETS, electron transportystem; FM-BOD, ferricyanide-mediated biochemical oxygen demand; FM-RES,erricyanide-mediated respiration; GGA, glucose–glutamic acid; OECD, Organisa-ion for Economic Co-operation and Development; PB, phosphate buffer; SPC,tandard plate count.∗ Corresponding author.
E-mail address: [email protected] (P.R. Teasdale).
039-9140/$ – see front matter. Crown Copyright © 2009 Published by Elsevier B.V. All rioi:10.1016/j.talanta.2009.10.057
curs with toxicity assays.Crown Copyright © 2009 Published by Elsevier B.V. All rights reserved.
staining method [1], the standard membrane filtration method andthe spread plate count (SPC) methods [2]. Additionally, assays rely-ing on culturing bacteria require suitable growth media upon whichthe target bacteria are capable of growing rapidly enough in theincubation time to produce a measurable response.
The utility of micro-organisms for a range of rapid bioassayshas long been recognised and a variety of techniques that aim toenumerate [3–5] or quantify the activity of [6–8] the microbial pop-ulation in a sample have been developed. Many of these microbialassays attempt to indirectly measure changes in the activity of amicrobial population by quantifying changes to the activity of themicro-organism’s electron transport system (ETS), either instanta-neously or over a time period. This is useful as the ETS is intrinsicallylinked to the essential cellular functions of metabolism and respi-ration and therefore represents an index of the overall integrity
of cellular components and functions. Examples of such assaysinclude the quantification of bioluminescence in the Microtox assay[7,9], measurement of respiration inhibition in the OECD 209 acti-vated sludge test [10] or the accumulation of ferrocyanide in rapid,ferricyanide-mediated BOD assays [6,11].ghts reserved.
anta 8
chmomarTvrmtobalrmrs
pav[sfnHcet
oatdcivraustie
2
2
Wa1u1
2
ab
K. Catterall et al. / Tal
Ferricyanide has been used as a redox mediator for studyingellular processes for a considerable time [12], but only recentlyas research interest into the use of ferricyanide-mediated (FM)icrobial reactions focused on rapid analytical bioassays [13–15]
r biosensors [11]. Ferricyanide is approximately five orders ofagnitude more soluble than oxygen in water and can be used
s an alternative terminal electron acceptor by a range of bacte-ial species, including the commonly studied Escherichia coli [6].his enables the use of high microbial populations in small sampleolumes without the electron acceptor limiting the rate of respi-ation, in turn reducing the incubation time required to achieve aeasurable response. An example of this FM approach has been in
he development of rapid BOD assays. There are several advantagesf this approach over the conventional BOD5 method, which haveeen discussed in more detail elsewhere [6]. In short, the FM-BODssay can be completed in hours rather than days, has a greaterinear range and measures the accumulation of the reduced respi-ation product, ferrocyanide, from a zero background [13]. Minorodification of the assay to quantify the inhibition of FM respi-
ation due to toxicity has also been the subject of several recenttudies [16–18].
A number of bacterial species, including E. coli, Pseudomonasutida and mixed consortia have been investigated as biocat-lysts in the FM assays [11,19]. The most recently publishedersions of the FM-BOD technique have incubation times of 1–4 h6,20], though some FM biosensors utilising immobilised cells havehorter incubation times [21]. A single FM incubation cannot dif-erentiate changes in overall activity due to individual cell growth,et population size, metabolic activity or substrate availability.owever, controlling parameters such as incubation time and thehoice of biocatalyst can facilitate investigation into degradationfficiencies of various compounds and provide more insight intohe processes occurring during the incubation [19].
All of these studies have assumed that the measured productionf ferrocyanide is quantitatively related to cell growth and/or cellctivity. In support of this assumption, Morris et al. [13] describedhe relationship between microbial density and ferrocyanide pro-uction, through a dilution process of a homogeneous bacterialulture. However, the ability of an FM bioassay to sensitively mon-tor changes in a dynamic microbial population has not yet beenalidated. This study aims to explore the relationship betweenespiration, as measured by the production of ferrocyanide by
bacterial culture, and quantification by two common, widelysed bacterial enumeration methods. The utility of the assay forensitively describing changes in the activity of bacterial popula-ions will be demonstrated with an example of stimulatory andnhibitory responses to various mixtures of a GGA solution withither 3,5-dichlorophenol (3,5-DCP) or silver ions.
. Methods
.1. Bacterial cultures
E. coli K12 was obtained from the University of New Southales Culture Collection. Cultures were maintained on nutrient
gar plates (Oxoid) and re-plated regularly to ensure viability. A.5 L solution of autoclaved tryptone soy broth (Gibco) was inoc-lated with a colony of E. coli and grown aerobically at 37 ◦C for6–18 h on an orbital shaker.
.2. Microbial culture growth experiment
At the desired sampling times (either 30 or 60 min intervals),representative 10 mL subsample was withdrawn from the 1.5 L
roth culture and divided into three sub-samples. Each of the
0 (2010) 1980–1985 1981
sub-samples was analysed concurrently using spectrophotomet-ric analysis of the optical density, the standard spread plate countmethod and the ferricyanide-mediated respiration rate. For thepurposes of this paper, the incubation of bacteria in the presenceof ferricyanide is referred to as an FM-RES assay.
For the FM-RES assay, ferricyanide was made up to 600 mMin PB solution comprising 0.08 M K2HPO4/0.12 M KH2PO4. Theferricyanide-mediated cellular respiration technique consisted ofimmediately adding 100 �L of freshly prepared ferricyanide to 1 mLaliquots of the batch culture sub-sample, to give a final ferricyanideconcentration of 55 mM. The sub-samples were then incubated for15, 30 and 60 min at 37 ◦C, after which the biochemical reactionwas terminated by centrifugation (13 200 rpm). Determination ofmicrobially produced ferrocyanide in the supernatant was carriedout by chronoamperometry using a 25 �m Pt microelectrode, asdescribed in Morris et al. [13].
Optical density measurements of the batch culture sub-sampleswere taken in 1 mL quartz cuvettes at 600 nm (OD600) using aShimadzu UV-1601 UV-Vis spectrophotometer. To avoid devia-tions of linearity in the measurement, when the OD600 reachedapproximately 0.5, the sample was diluted with the remaining ref-erence solution. Reference solution was prepared by centrifugingthe remaining sample at 13 200 rpm and then filtering the super-natant through a 0.2 �m cellulose filter. This ensured that, as faras practically possible, the sample and the reference solution werematrix matched.
Standard plate counts were carried out as described by theAPHA standard methods [2]. In brief, a serial decimal dilution serieswas prepared in 3% sterile peptone solution. Following dilution,duplicate 100 �L aliquots were pipetted onto sterile agar platesand spread over the surface of the agar plate using a sterile glassspreader. Following inoculation, the plates were incubated at 37 ◦Cfor 24 h and the numbers of colony forming units (CFUs) werecounted. As recommended by the APHA standard methods, onlydilutions producing counts between 30 and 300 CFUs were consid-ered to be valid to be used in the calculation of population density(CFU/mL).
2.3. Standardised FM-RES and SPC test
An E. coli culture was prepared as described above and har-vested by centrifugation (4000 rpm) in the late exponential phaseof growth, as determined by a growth curve. The cells were washedtwice and resuspended in a minimal amount of PB to give a con-centrated suspension of cells in their endogenous state.
Serial dilutions (no dilution, 20%, 40%, 60%, 80%, 90%, 98%) ofthe cell solution were then prepared using PB as the diluent. Thesesolutions were then concurrently analysed employing the SPC andFM-RES techniques described above. As the washed cells containedlittle exogenous organic substrate, the FM-RES method was slightlyaltered to supply the bacteria with a carbon source. In this case,100 �L of the standard GGA mixture (300 mg L−1 each of glucoseand glutamic acid, giving a BOD5 equivalent of 396 mg L−1) wasadded to the FM-RES matrix.
2.4. Microbial response to substrates and toxicants
Cells were harvested as described for the standardised test andresuspended in PB to an OD600 of 8.8. Samples were then preparedby adding 1.00 mL of cell suspension, 1.00 mL of test sample, and0.20 mL of 600 mM potassium ferricyanide solution. Test samples
comprised GGA and one of either 3,5-DCP or Ag+. 3,5-DCP wastested at concentrations of 0, 5, 15 and 40 mg L−1, Ag+ at concen-trations of 0, 2.5, 7.5 and 20 mg L−1 and GGA at BOD5 equivalentconcentrations of 0, 25, 100 and 400 mg L−1. Test samples were pre-pared in a matrix format, in which each toxicant concentration was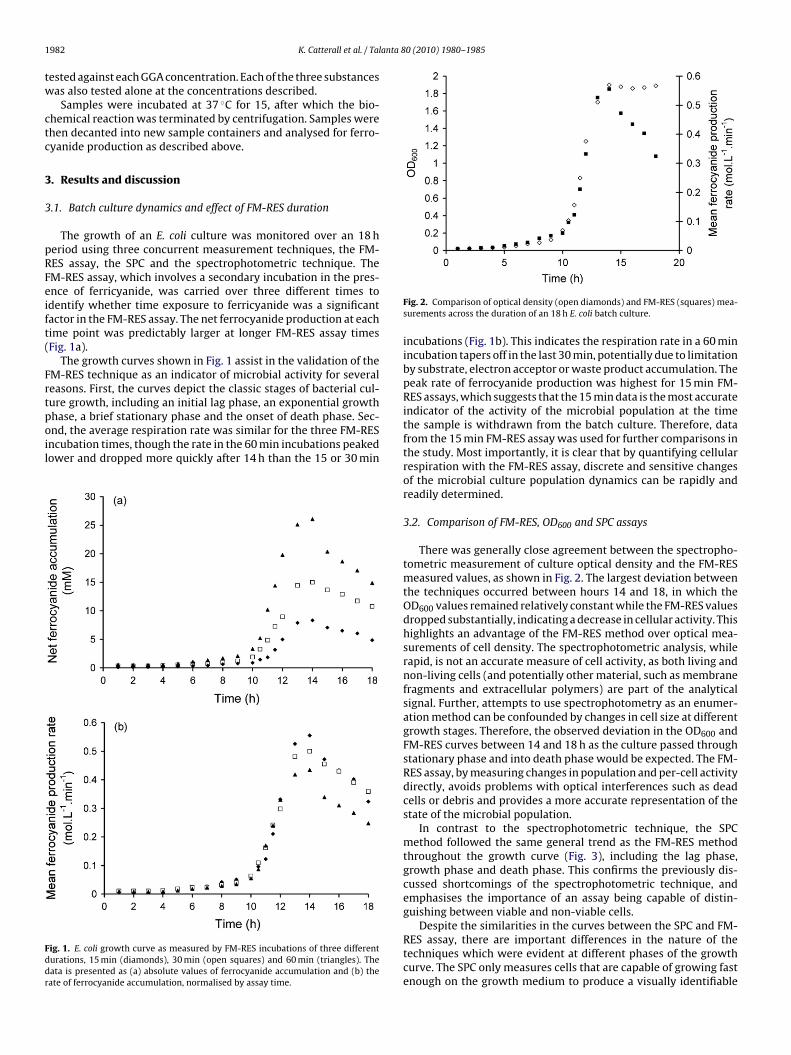
1 anta 80 (2010) 1980–1985
tw
ctc
3
3
pRFeift(
Frtpoil
Fddr
982 K. Catterall et al. / Tal
ested against each GGA concentration. Each of the three substancesas also tested alone at the concentrations described.
Samples were incubated at 37 ◦C for 15, after which the bio-hemical reaction was terminated by centrifugation. Samples werehen decanted into new sample containers and analysed for ferro-yanide production as described above.
. Results and discussion
.1. Batch culture dynamics and effect of FM-RES duration
The growth of an E. coli culture was monitored over an 18 heriod using three concurrent measurement techniques, the FM-ES assay, the SPC and the spectrophotometric technique. TheM-RES assay, which involves a secondary incubation in the pres-nce of ferricyanide, was carried over three different times todentify whether time exposure to ferricyanide was a significantactor in the FM-RES assay. The net ferrocyanide production at eachime point was predictably larger at longer FM-RES assay timesFig. 1a).
The growth curves shown in Fig. 1 assist in the validation of theM-RES technique as an indicator of microbial activity for severaleasons. First, the curves depict the classic stages of bacterial cul-ure growth, including an initial lag phase, an exponential growth
hase, a brief stationary phase and the onset of death phase. Sec-nd, the average respiration rate was similar for the three FM-RESncubation times, though the rate in the 60 min incubations peakedower and dropped more quickly after 14 h than the 15 or 30 minig. 1. E. coli growth curve as measured by FM-RES incubations of three differenturations, 15 min (diamonds), 30 min (open squares) and 60 min (triangles). Theata is presented as (a) absolute values of ferrocyanide accumulation and (b) theate of ferrocyanide accumulation, normalised by assay time.
Fig. 2. Comparison of optical density (open diamonds) and FM-RES (squares) mea-surements across the duration of an 18 h E. coli batch culture.
incubations (Fig. 1b). This indicates the respiration rate in a 60 minincubation tapers off in the last 30 min, potentially due to limitationby substrate, electron acceptor or waste product accumulation. Thepeak rate of ferrocyanide production was highest for 15 min FM-RES assays, which suggests that the 15 min data is the most accurateindicator of the activity of the microbial population at the timethe sample is withdrawn from the batch culture. Therefore, datafrom the 15 min FM-RES assay was used for further comparisons inthe study. Most importantly, it is clear that by quantifying cellularrespiration with the FM-RES assay, discrete and sensitive changesof the microbial culture population dynamics can be rapidly andreadily determined.
3.2. Comparison of FM-RES, OD600 and SPC assays
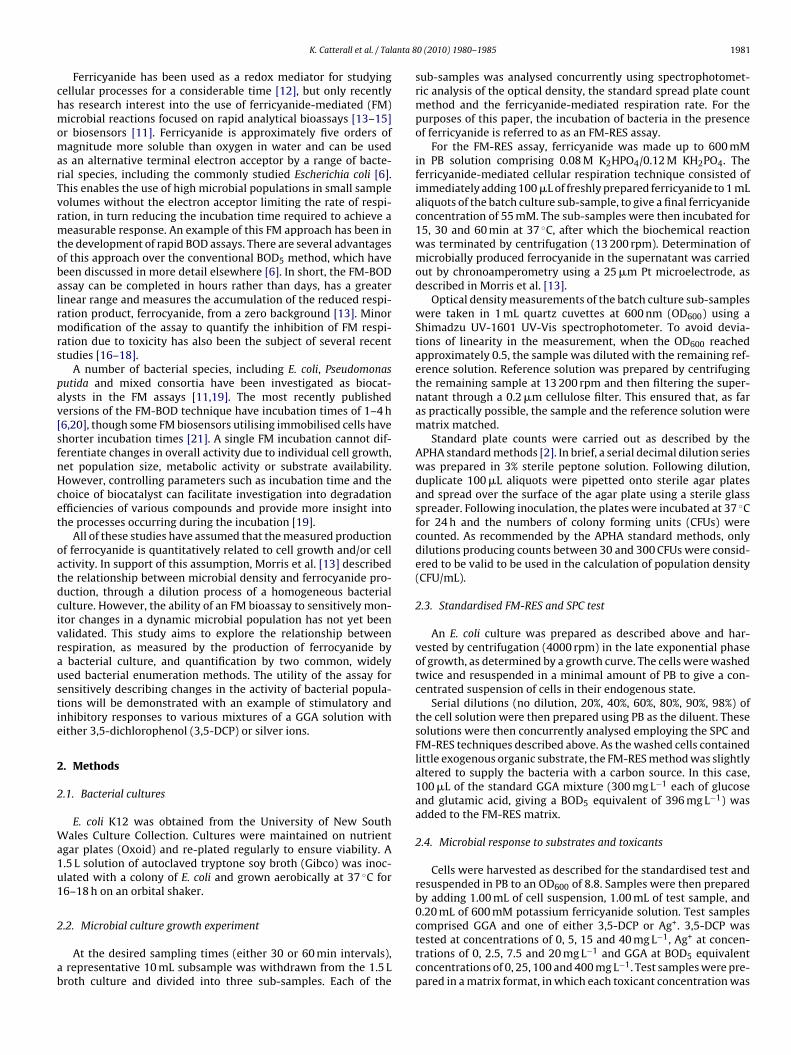
There was generally close agreement between the spectropho-tometric measurement of culture optical density and the FM-RESmeasured values, as shown in Fig. 2. The largest deviation betweenthe techniques occurred between hours 14 and 18, in which theOD600 values remained relatively constant while the FM-RES valuesdropped substantially, indicating a decrease in cellular activity. Thishighlights an advantage of the FM-RES method over optical mea-surements of cell density. The spectrophotometric analysis, whilerapid, is not an accurate measure of cell activity, as both living andnon-living cells (and potentially other material, such as membranefragments and extracellular polymers) are part of the analyticalsignal. Further, attempts to use spectrophotometry as an enumer-ation method can be confounded by changes in cell size at differentgrowth stages. Therefore, the observed deviation in the OD600 andFM-RES curves between 14 and 18 h as the culture passed throughstationary phase and into death phase would be expected. The FM-RES assay, by measuring changes in population and per-cell activitydirectly, avoids problems with optical interferences such as deadcells or debris and provides a more accurate representation of thestate of the microbial population.
In contrast to the spectrophotometric technique, the SPCmethod followed the same general trend as the FM-RES methodthroughout the growth curve (Fig. 3), including the lag phase,growth phase and death phase. This confirms the previously dis-cussed shortcomings of the spectrophotometric technique, andemphasises the importance of an assay being capable of distin-guishing between viable and non-viable cells.
Despite the similarities in the curves between the SPC and FM-RES assay, there are important differences in the nature of thetechniques which were evident at different phases of the growthcurve. The SPC only measures cells that are capable of growing fastenough on the growth medium to produce a visually identifiable
K. Catterall et al. / Talanta 80 (2010) 1980–1985 1983
Fma
cRwtcwptntrttf
3
FitaaabcRis(sfw
wtvbwbirttv
Fig. 4. Linear relationships between the rate of ferrocyanide production and quan-
ig. 3. Plot of growth curve displaying log CFU/mL from the standard SPC (dia-onds) and log mean ferrocyanide production rate (open squares) from the FM-RESssay.
olony, which are defined as viable cells. By contrast, the FM-ES signal comprises the net activity of all cells in the population,hether they are respiring at maximal capacity or only a fraction of
heir potential. This is an important distinction, as microbial activityan change with factors such as the cell size or substrate availability,ithout necessarily changing the number of viable cells. For exam-le, increasing cell size in the early exponential phase would leado increasing activity without a proportional increase in viable cellumbers. Conversely, in the death phase, the proportion of cellshat are viable may decline rapidly, but these cells may still beespiring and hence contributing to the FM-RES signal. Importantly,he FM-RES assay can provide information about the changing bac-erial population in just over 15 min, as opposed to 24 h requiredor the SPC method.
.3. Comparison of SPC and standardised FM-RES assay
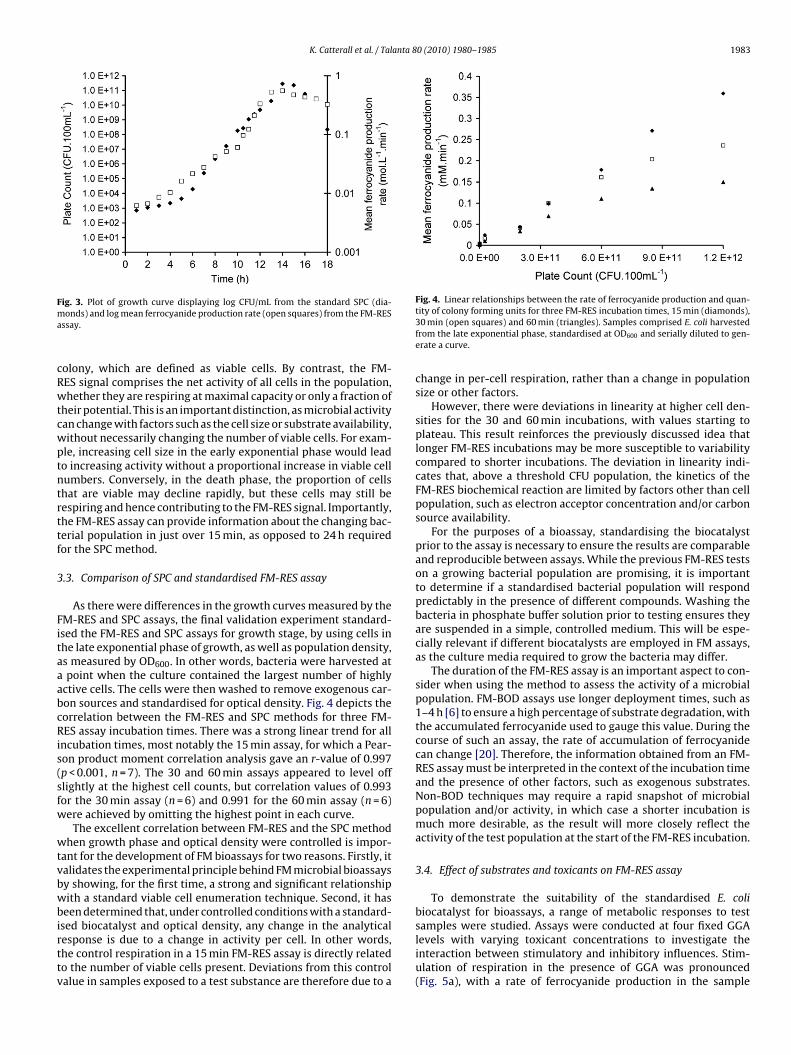
As there were differences in the growth curves measured by theM-RES and SPC assays, the final validation experiment standard-sed the FM-RES and SPC assays for growth stage, by using cells inhe late exponential phase of growth, as well as population density,s measured by OD600. In other words, bacteria were harvested atpoint when the culture contained the largest number of highly
ctive cells. The cells were then washed to remove exogenous car-on sources and standardised for optical density. Fig. 4 depicts theorrelation between the FM-RES and SPC methods for three FM-ES assay incubation times. There was a strong linear trend for all
ncubation times, most notably the 15 min assay, for which a Pear-on product moment correlation analysis gave an r-value of 0.997p < 0.001, n = 7). The 30 and 60 min assays appeared to level offlightly at the highest cell counts, but correlation values of 0.993or the 30 min assay (n = 6) and 0.991 for the 60 min assay (n = 6)ere achieved by omitting the highest point in each curve.
The excellent correlation between FM-RES and the SPC methodhen growth phase and optical density were controlled is impor-
ant for the development of FM bioassays for two reasons. Firstly, italidates the experimental principle behind FM microbial bioassaysy showing, for the first time, a strong and significant relationshipith a standard viable cell enumeration technique. Second, it has
een determined that, under controlled conditions with a standard-
sed biocatalyst and optical density, any change in the analyticalesponse is due to a change in activity per cell. In other words,he control respiration in a 15 min FM-RES assay is directly relatedo the number of viable cells present. Deviations from this controlalue in samples exposed to a test substance are therefore due to atity of colony forming units for three FM-RES incubation times, 15 min (diamonds),30 min (open squares) and 60 min (triangles). Samples comprised E. coli harvestedfrom the late exponential phase, standardised at OD600 and serially diluted to gen-erate a curve.
change in per-cell respiration, rather than a change in populationsize or other factors.
However, there were deviations in linearity at higher cell den-sities for the 30 and 60 min incubations, with values starting toplateau. This result reinforces the previously discussed idea thatlonger FM-RES incubations may be more susceptible to variabilitycompared to shorter incubations. The deviation in linearity indi-cates that, above a threshold CFU population, the kinetics of theFM-RES biochemical reaction are limited by factors other than cellpopulation, such as electron acceptor concentration and/or carbonsource availability.
For the purposes of a bioassay, standardising the biocatalystprior to the assay is necessary to ensure the results are comparableand reproducible between assays. While the previous FM-RES testson a growing bacterial population are promising, it is importantto determine if a standardised bacterial population will respondpredictably in the presence of different compounds. Washing thebacteria in phosphate buffer solution prior to testing ensures theyare suspended in a simple, controlled medium. This will be espe-cially relevant if different biocatalysts are employed in FM assays,as the culture media required to grow the bacteria may differ.
The duration of the FM-RES assay is an important aspect to con-sider when using the method to assess the activity of a microbialpopulation. FM-BOD assays use longer deployment times, such as1–4 h [6] to ensure a high percentage of substrate degradation, withthe accumulated ferrocyanide used to gauge this value. During thecourse of such an assay, the rate of accumulation of ferrocyanidecan change [20]. Therefore, the information obtained from an FM-RES assay must be interpreted in the context of the incubation timeand the presence of other factors, such as exogenous substrates.Non-BOD techniques may require a rapid snapshot of microbialpopulation and/or activity, in which case a shorter incubation ismuch more desirable, as the result will more closely reflect theactivity of the test population at the start of the FM-RES incubation.
3.4. Effect of substrates and toxicants on FM-RES assay
To demonstrate the suitability of the standardised E. colibiocatalyst for bioassays, a range of metabolic responses to testsamples were studied. Assays were conducted at four fixed GGA
levels with varying toxicant concentrations to investigate theinteraction between stimulatory and inhibitory influences. Stim-ulation of respiration in the presence of GGA was pronounced(Fig. 5a), with a rate of ferrocyanide production in the sample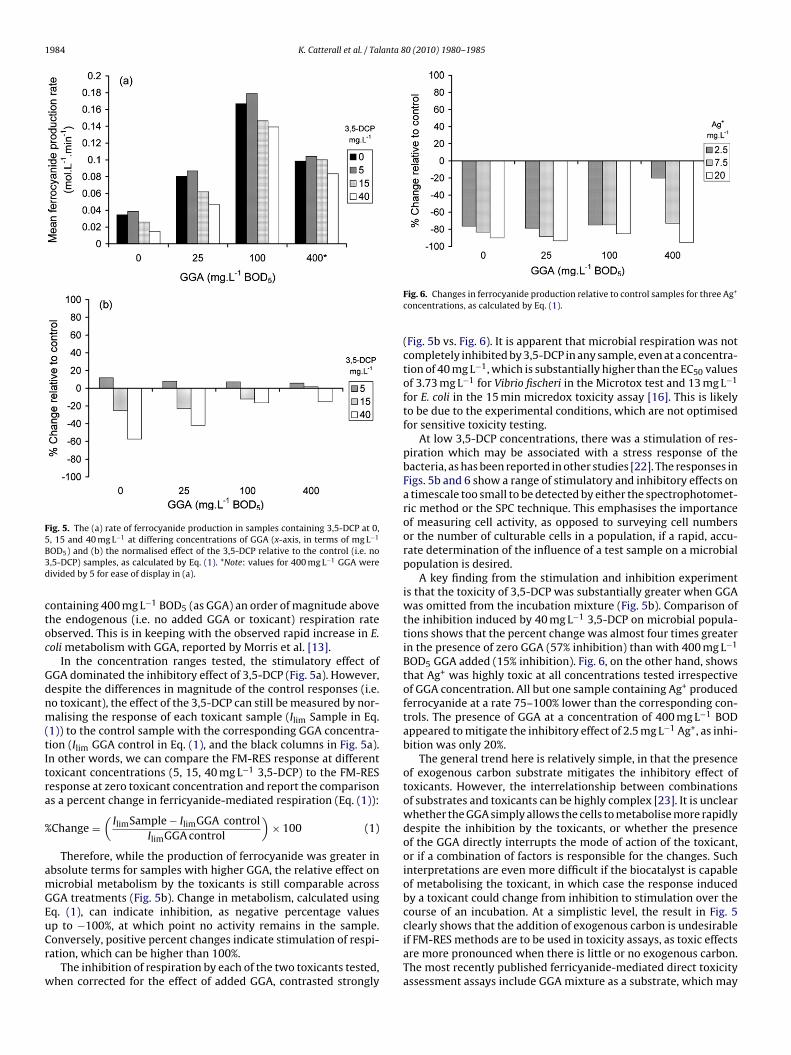
1984 K. Catterall et al. / Talanta 80 (2010) 1980–1985
Fig. 5. The (a) rate of ferrocyanide production in samples containing 3,5-DCP at 0,5B3d
ctoc
Gdnm(tItra
%
amGEuCr
w
, 15 and 40 mg L−1 at differing concentrations of GGA (x-axis, in terms of mg L−1
OD5) and (b) the normalised effect of the 3,5-DCP relative to the control (i.e. no,5-DCP) samples, as calculated by Eq. (1). *Note: values for 400 mg L−1 GGA wereivided by 5 for ease of display in (a).
ontaining 400 mg L−1 BOD5 (as GGA) an order of magnitude abovehe endogenous (i.e. no added GGA or toxicant) respiration ratebserved. This is in keeping with the observed rapid increase in E.oli metabolism with GGA, reported by Morris et al. [13].
In the concentration ranges tested, the stimulatory effect ofGA dominated the inhibitory effect of 3,5-DCP (Fig. 5a). However,espite the differences in magnitude of the control responses (i.e.o toxicant), the effect of the 3,5-DCP can still be measured by nor-alising the response of each toxicant sample (Ilim Sample in Eq.
1)) to the control sample with the corresponding GGA concentra-ion (Ilim GGA control in Eq. (1), and the black columns in Fig. 5a).n other words, we can compare the FM-RES response at differentoxicant concentrations (5, 15, 40 mg L−1 3,5-DCP) to the FM-RESesponse at zero toxicant concentration and report the comparisons a percent change in ferricyanide-mediated respiration (Eq. (1)):
Change =(
IlimSample − IlimGGA controlIlimGGA control
)× 100 (1)
Therefore, while the production of ferrocyanide was greater inbsolute terms for samples with higher GGA, the relative effect onicrobial metabolism by the toxicants is still comparable acrossGA treatments (Fig. 5b). Change in metabolism, calculated usingq. (1), can indicate inhibition, as negative percentage values
p to −100%, at which point no activity remains in the sample.onversely, positive percent changes indicate stimulation of respi-ation, which can be higher than 100%.The inhibition of respiration by each of the two toxicants tested,hen corrected for the effect of added GGA, contrasted strongly
Fig. 6. Changes in ferrocyanide production relative to control samples for three Ag+
concentrations, as calculated by Eq. (1).
(Fig. 5b vs. Fig. 6). It is apparent that microbial respiration was notcompletely inhibited by 3,5-DCP in any sample, even at a concentra-tion of 40 mg L−1, which is substantially higher than the EC50 valuesof 3.73 mg L−1 for Vibrio fischeri in the Microtox test and 13 mg L−1
for E. coli in the 15 min micredox toxicity assay [16]. This is likelyto be due to the experimental conditions, which are not optimisedfor sensitive toxicity testing.
At low 3,5-DCP concentrations, there was a stimulation of res-piration which may be associated with a stress response of thebacteria, as has been reported in other studies [22]. The responses inFigs. 5b and 6 show a range of stimulatory and inhibitory effects ona timescale too small to be detected by either the spectrophotomet-ric method or the SPC technique. This emphasises the importanceof measuring cell activity, as opposed to surveying cell numbersor the number of culturable cells in a population, if a rapid, accu-rate determination of the influence of a test sample on a microbialpopulation is desired.
A key finding from the stimulation and inhibition experimentis that the toxicity of 3,5-DCP was substantially greater when GGAwas omitted from the incubation mixture (Fig. 5b). Comparison ofthe inhibition induced by 40 mg L−1 3,5-DCP on microbial popula-tions shows that the percent change was almost four times greaterin the presence of zero GGA (57% inhibition) than with 400 mg L−1
BOD5 GGA added (15% inhibition). Fig. 6, on the other hand, showsthat Ag+ was highly toxic at all concentrations tested irrespectiveof GGA concentration. All but one sample containing Ag+ producedferrocyanide at a rate 75–100% lower than the corresponding con-trols. The presence of GGA at a concentration of 400 mg L−1 BODappeared to mitigate the inhibitory effect of 2.5 mg L−1 Ag+, as inhi-bition was only 20%.
The general trend here is relatively simple, in that the presenceof exogenous carbon substrate mitigates the inhibitory effect oftoxicants. However, the interrelationship between combinationsof substrates and toxicants can be highly complex [23]. It is unclearwhether the GGA simply allows the cells to metabolise more rapidlydespite the inhibition by the toxicants, or whether the presenceof the GGA directly interrupts the mode of action of the toxicant,or if a combination of factors is responsible for the changes. Suchinterpretations are even more difficult if the biocatalyst is capableof metabolising the toxicant, in which case the response inducedby a toxicant could change from inhibition to stimulation over thecourse of an incubation. At a simplistic level, the result in Fig. 5clearly shows that the addition of exogenous carbon is undesirable
if FM-RES methods are to be used in toxicity assays, as toxic effectsare more pronounced when there is little or no exogenous carbon.The most recently published ferricyanide-mediated direct toxicityassessment assays include GGA mixture as a substrate, which may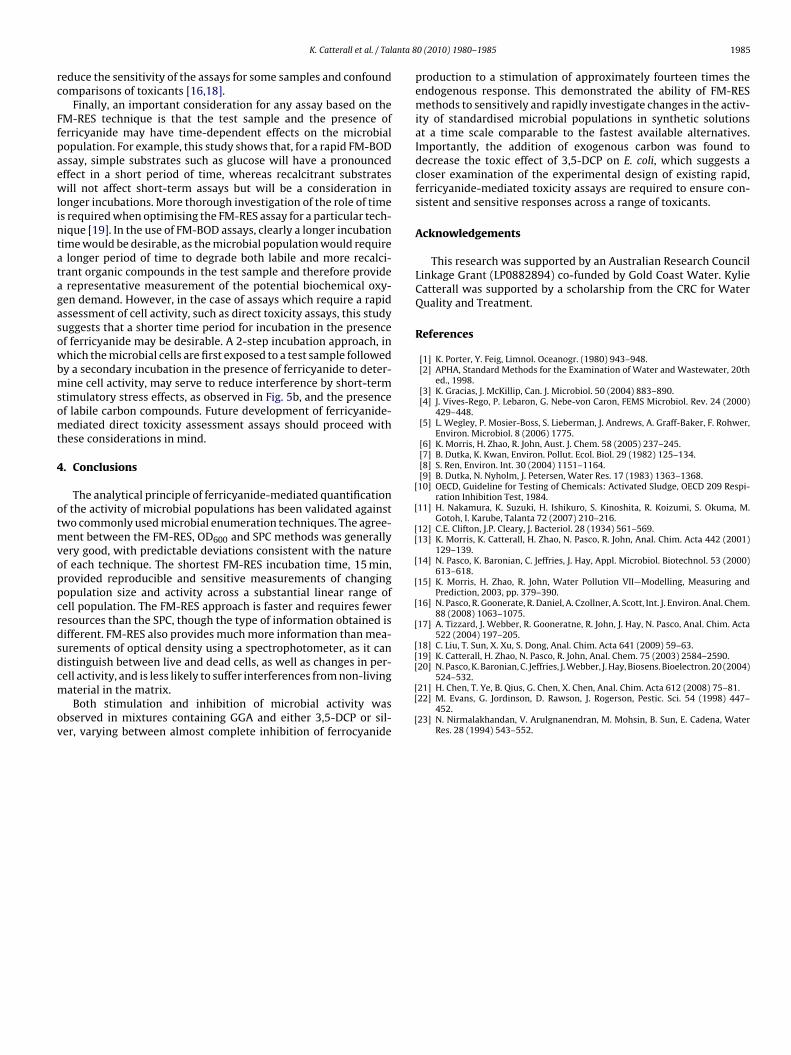
anta 8
rc
Ffpaewlintatagasowbmsomt
4
otmvoppcrdsdcm
ov
[
[
[[
[
[
[
[
[[[
K. Catterall et al. / Tal
educe the sensitivity of the assays for some samples and confoundomparisons of toxicants [16,18].
Finally, an important consideration for any assay based on theM-RES technique is that the test sample and the presence oferricyanide may have time-dependent effects on the microbialopulation. For example, this study shows that, for a rapid FM-BODssay, simple substrates such as glucose will have a pronouncedffect in a short period of time, whereas recalcitrant substratesill not affect short-term assays but will be a consideration in
onger incubations. More thorough investigation of the role of times required when optimising the FM-RES assay for a particular tech-ique [19]. In the use of FM-BOD assays, clearly a longer incubationime would be desirable, as the microbial population would requirelonger period of time to degrade both labile and more recalci-
rant organic compounds in the test sample and therefore providerepresentative measurement of the potential biochemical oxy-
en demand. However, in the case of assays which require a rapidssessment of cell activity, such as direct toxicity assays, this studyuggests that a shorter time period for incubation in the presencef ferricyanide may be desirable. A 2-step incubation approach, inhich the microbial cells are first exposed to a test sample followed
y a secondary incubation in the presence of ferricyanide to deter-ine cell activity, may serve to reduce interference by short-term
timulatory stress effects, as observed in Fig. 5b, and the presencef labile carbon compounds. Future development of ferricyanide-ediated direct toxicity assessment assays should proceed with
hese considerations in mind.
. Conclusions
The analytical principle of ferricyanide-mediated quantificationf the activity of microbial populations has been validated againstwo commonly used microbial enumeration techniques. The agree-
ent between the FM-RES, OD600 and SPC methods was generallyery good, with predictable deviations consistent with the naturef each technique. The shortest FM-RES incubation time, 15 min,rovided reproducible and sensitive measurements of changingopulation size and activity across a substantial linear range ofell population. The FM-RES approach is faster and requires feweresources than the SPC, though the type of information obtained isifferent. FM-RES also provides much more information than mea-urements of optical density using a spectrophotometer, as it canistinguish between live and dead cells, as well as changes in per-
ell activity, and is less likely to suffer interferences from non-livingaterial in the matrix.Both stimulation and inhibition of microbial activity wasbserved in mixtures containing GGA and either 3,5-DCP or sil-er, varying between almost complete inhibition of ferrocyanide
[[
[
0 (2010) 1980–1985 1985
production to a stimulation of approximately fourteen times theendogenous response. This demonstrated the ability of FM-RESmethods to sensitively and rapidly investigate changes in the activ-ity of standardised microbial populations in synthetic solutionsat a time scale comparable to the fastest available alternatives.Importantly, the addition of exogenous carbon was found todecrease the toxic effect of 3,5-DCP on E. coli, which suggests acloser examination of the experimental design of existing rapid,ferricyanide-mediated toxicity assays are required to ensure con-sistent and sensitive responses across a range of toxicants.
Acknowledgements
This research was supported by an Australian Research CouncilLinkage Grant (LP0882894) co-funded by Gold Coast Water. KylieCatterall was supported by a scholarship from the CRC for WaterQuality and Treatment.
References
[1] K. Porter, Y. Feig, Limnol. Oceanogr. (1980) 943–948.[2] APHA, Standard Methods for the Examination of Water and Wastewater, 20th
ed., 1998.[3] K. Gracias, J. McKillip, Can. J. Microbiol. 50 (2004) 883–890.[4] J. Vives-Rego, P. Lebaron, G. Nebe-von Caron, FEMS Microbiol. Rev. 24 (2000)
429–448.[5] L. Wegley, P. Mosier-Boss, S. Lieberman, J. Andrews, A. Graff-Baker, F. Rohwer,
Environ. Microbiol. 8 (2006) 1775.[6] K. Morris, H. Zhao, R. John, Aust. J. Chem. 58 (2005) 237–245.[7] B. Dutka, K. Kwan, Environ. Pollut. Ecol. Biol. 29 (1982) 125–134.[8] S. Ren, Environ. Int. 30 (2004) 1151–1164.[9] B. Dutka, N. Nyholm, J. Petersen, Water Res. 17 (1983) 1363–1368.10] OECD, Guideline for Testing of Chemicals: Activated Sludge, OECD 209 Respi-
ration Inhibition Test, 1984.11] H. Nakamura, K. Suzuki, H. Ishikuro, S. Kinoshita, R. Koizumi, S. Okuma, M.
Gotoh, I. Karube, Talanta 72 (2007) 210–216.12] C.E. Clifton, J.P. Cleary, J. Bacteriol. 28 (1934) 561–569.13] K. Morris, K. Catterall, H. Zhao, N. Pasco, R. John, Anal. Chim. Acta 442 (2001)
129–139.14] N. Pasco, K. Baronian, C. Jeffries, J. Hay, Appl. Microbiol. Biotechnol. 53 (2000)
613–618.15] K. Morris, H. Zhao, R. John, Water Pollution VII—Modelling, Measuring and
Prediction, 2003, pp. 379–390.16] N. Pasco, R. Goonerate, R. Daniel, A. Czollner, A. Scott, Int. J. Environ. Anal. Chem.
88 (2008) 1063–1075.17] A. Tizzard, J. Webber, R. Gooneratne, R. John, J. Hay, N. Pasco, Anal. Chim. Acta
522 (2004) 197–205.18] C. Liu, T. Sun, X. Xu, S. Dong, Anal. Chim. Acta 641 (2009) 59–63.19] K. Catterall, H. Zhao, N. Pasco, R. John, Anal. Chem. 75 (2003) 2584–2590.20] N. Pasco, K. Baronian, C. Jeffries, J. Webber, J. Hay, Biosens. Bioelectron. 20 (2004)
524–532.21] H. Chen, T. Ye, B. Qius, G. Chen, X. Chen, Anal. Chim. Acta 612 (2008) 75–81.22] M. Evans, G. Jordinson, D. Rawson, J. Rogerson, Pestic. Sci. 54 (1998) 447–
452.23] N. Nirmalakhandan, V. Arulgnanendran, M. Mohsin, B. Sun, E. Cadena, Water
Res. 28 (1994) 543–552.