Evaluating thermal and durability performance of...
101
Department of Chemistry and Chemical Engineering Division of High Temperature Corrosion CHALMERS UNIVERSTY OF TECHNOLOGY Göteborg, Sweden 2018 Department of Industrial Engineering Division of Corrosion UNIVERSITY OF TRENTO Trento, Italy 2018 Evaluating thermal and durability performance of acrylic cool colored coatings containing NIR-inorganic reflective pigments for roof coating application Master’s thesis in Materials Chemistry Hampus Lindmark
Transcript of Evaluating thermal and durability performance of...
Department of Chemistry and Chemical Engineering
Division of High Temperature Corrosion
CHALMERS UNIVERSTY OF TECHNOLOGY
Göteborg, Sweden 2018
Department of Industrial Engineering
Division of Corrosion
UNIVERSITY OF TRENTO
Trento, Italy 2018
Evaluating thermal and durability
performance of acrylic cool colored
coatings containing NIR-inorganic
reflective pigments for roof coating
application
Master’s thesis in Materials Chemistry
Hampus Lindmark
ii
Evaluating thermal and durability performance of acrylic cool colored
coatings containing NIR-inorganic reflective pigments for roof coating
application
Hampus Lindmark
Diploma work for Master of Science degree in the master programme Materials Chemistry for
Chalmers University of Technology in collaboration with University of Trento.
Department of Chemistry and Chemical Engineering
Division of High Temperature Corrosion
CHALMERS UNIVERSITY OF TECHNOLOGY
Göteborg, Sweden 2018
Department of Industrial Engineering
Division of Corrosion
UNIVERSITY OF TRENTO
Trento, Italy 2018
Performed at: University of Trento,
Trento, Italy
14/02/18-25/07/18
Supervisors: Professor Stefano Rossi
University of Trento, Italy [email protected]
Assistant Professor Michele Fedel
University of Trento, Italy [email protected]
Examiner: Associate Professor Jesper Liske
Chalmers University of Technology, Sweden [email protected]
iii
© HAMPUS LINDMARK, 2018.
Title: Evaluating thermal and durability performance of acrylic cool colored coatings containing NIR-
inorganic reflective pigments for roof coating application.
Author: Hampus Lindmark
Diploma work for Master of Science degree for the master programme Materials Chemistry
Department of Chemistry and Chemical Engineering
Chalmers University of Technology
SE-412 96 Gothenburg
Sweden
Telephone: +46 31-772 1000
In collaboration with University of Trento
Department of Industrial Engineering
University of Trento
via Sommarive. 9 - 38123 Trento
Italy
Telephone: +39 0461 282500-2503
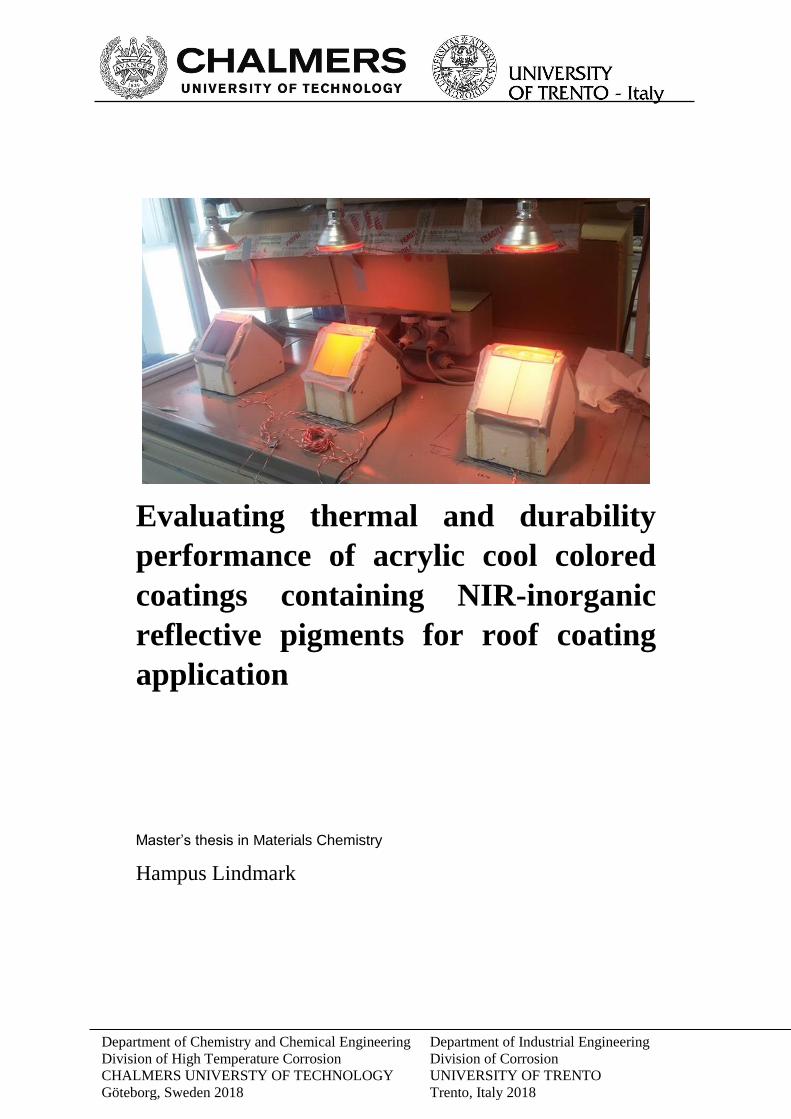
Cover: Experimental set-up for thermal analysis of cool coatings used in this thesis. The cool coatings
were subjected to a 150 W IR-emitted lamp. The temperatures of the outer and inner surface of the
coated substrates were monitored together with the temperature inside each house model using
thermocouples and an IR-camera.
Typeset: Times New Roman
iv
Acknowledgements First and foremost, the author would like to sincerely thank Professor Stefano Rossi for providing and
suggesting the Master’s thesis work and allowing me to be part of his research group.
The author would like to express a special gratitude towards Assistant Professor Michele Fedel and
Professor Stefano Rossi for their exceptional supervision throughout the whole project. Thank you for
your patience, your professional input and encouragement.
Undoubtedly, this work would have never been possible without the help from Lab Technician Luca
Benedetti. Thank you for helping me with all the instrumental set-up throughout the whole project.
Gratefulness is shown to examiner Associate Professor Jesper Liske. Thank you for the moral support
throughout the whole project and for your important feedback.
Thankfulness is shown to everyone at the department of industrial engineering for being so kind and
helpful throughout my stay at the University of Trento.
Lastly the author would like to express sincere gratitude towards his family and his girlfriend Ludovica
Frare. Thank you for your unconditional support.
Hampus Lindmark, Gothenburg, August 2018
v
Abstract Cool coatings applied on top of roof panels have been studied for decades as an approach to mitigate
the urban heat island effect. Prior research has mostly focused on analyzing the aesthetical and thermal
properties of the coating material at initial state without considering how these parameters are affected
by exposure to the outdoor environment.
This thesis proposes an experimental approach to create and estimate thermal, aesthetical and durability
performance of cool coatings. Three different so-called near infrared (NIR) inorganic reflective
pigments were added to an acrylic based transparent paint and applied on metal substrates to give rise
to a cooling and color sensation (black, yellow and a semitransparent color). In addition, different
concentration of the NIR inorganic reflective pigments were added to the paint formulations to see its
effect on the mentioned parameters. The cool coatings were subjected to accelerated UVB radiation (for
a total of 480 h, 96h/cycle) to evaluate its effect on the mentioned parameters.
A characterization study of the pigments and the formed cool coatings in terms of morphology, chemical
composition, phase structure and dispersion quality were conducted using powder X-ray diffraction
(PXRD) and scanning electron microscopy (SEM) assisted with electron X-ray spectroscopy (SEM-
EDS).
The aesthetical properties investigated for the cool coatings were limited to colour, in accordance with
CIELAB colour coordination standard, and specular gloss measurements. The thermal behavior of the
cool coatings was assessed in the near infrared region of light by subjecting the coating substrates to a
150 W IR-emitted lamp. The chemical degradation process of the coating material was assessed and
monitored using FTIR-ATR.
The results show that after 480 h of accelerated UVB exposure no significant alteration of the mentioned
parameters was detected. No significant thermal variation of the cool coatings was observed regardless
of NIR inorganic pigment type or concentration. The gloss decay and initial glossiness showed slight
dependence on the type and concentration of pigment added to the paint formulation. Furthermore, no
significant color alteration was observed for each cool coating sample. Lastly, there was no direct
correlation for each cool coating sample that indicated that minor aesthetical alteration of coatings had
a strong effect on the thermal properties of the coatings.
Furthermore, the results also suggest that the total amount of time the cool coatings were exposed to
UVB-light was insufficient to properly analyze how UVB degradation mechanism affected the
mentioned parameters since only minor alteration of the surface chemistry and roughness of the cool
coatings were observed.
Keywords: NIR inorganic reflective pigments, cool coatings, accelerated UVB radiation, acrylic
copolymer
vi
Table of Content
Acknowledgements ................................................................................................................................. iv
Abstract .................................................................................................................................................... v
List of Figures ....................................................................................................................................... viii
List of Tables ......................................................................................................................................... xiii
1. Introduction ....................................................................................................................................... 1
1.1 Motivation and Background .............................................................................................................. 1
2. Aim, Approach and Limitations ...................................................................................................... 3
2.1 Aim .................................................................................................................................................... 3
2.2 Approach ........................................................................................................................................... 3
2.2 Limitations ........................................................................................................................................ 4
3. Theoretical Background ................................................................................................................... 5
3.1 Negative Aspects of the UHI-Effect on Society ............................................................................ 5
3.1.1 Reduction of Air Quality ........................................................................................................ 5
3.1.2 Impact on Energy Consumption and Environment ................................................................ 6
3.2 Origin of Light and the Solar Spectrum of Light .......................................................................... 6
3.3 Light-Matter Interaction ................................................................................................................ 7
3.3.1 Absorption of Light and Heat Formation ............................................................................... 7
3.3.2 Reflection of Light ................................................................................................................. 9
3.3.3 Transmission of Light .......................................................................................................... 10
3.4 Chemical Composition of Cool Coatings .................................................................................... 10
3.4.1 Binder, Solvent and Additives .............................................................................................. 10
3.4.2 NIR-reflective Inorganic Pigments ....................................................................................... 10
3.5 Refraction Index .......................................................................................................................... 11
3.6 Pigment Size ................................................................................................................................ 13
3.7 Special-Effect Pigments for Cool Coating Application .............................................................. 13
3.8 UVB-Degradation of Cool Coatings ........................................................................................... 15
4. Characterization Techniques ......................................................................................................... 17
4.1 Scanning Electron Microscopy (SEM) ........................................................................................ 17
4.2 Colorimetry ................................................................................................................................. 19
4.3 Glossmeter ................................................................................................................................... 20
4.4 Fourier Transform Infrared Spectroscopy (FTIR) ....................................................................... 20
4.5 Powder X-Ray Diffraction (PXRD) ............................................................................................ 22
5. Experimental Approach.................................................................................................................. 24
5.1 Characterization of NIR-Reflective Pigments ............................................................................. 24
vii
5.2 Preparation of Roof-Panel Substrate ........................................................................................... 24
5.3 Paint Formulation ........................................................................................................................ 24
5.4 Dispersion Evaluation and Chemical Analysis of the Cool Coating Samples ............................ 25
5.5 Gloss and Color Assessment ....................................................................................................... 25
5.6 Degradation Assessment ............................................................................................................. 26
5.7 Thermal Evaluation ..................................................................................................................... 26
5.8 UVB-Exposure ............................................................................................................................ 27
6. Results and Discussion .................................................................................................................... 28
6.1 Dry Coating Thickness ................................................................................................................ 28
6.2 Particle Size, Morphology and Phase Analysis of NIR reflective pigments ............................... 28
6.3 Dispersion Analysis of Cool Coatings ........................................................................................ 32
6.4 Elemental Mapping ..................................................................................................................... 35
6.5 UVB Degradation of Cool Coatings............................................................................................ 38
6.6 Aesthetical Evaluation ................................................................................................................. 41
6.6.1 Gloss Evaluation ................................................................................................................... 42
6.6.2 Color Evaluation ................................................................................................................... 46
6.7 Thermal Evaluation ..................................................................................................................... 49
6.7 Correlation between Aesthetical and Thermal Alteration of Cool Coatings ............................... 55
7. Conclusion ........................................................................................................................................ 60
8. Future Work .................................................................................................................................... 62
9. Bibliography .................................................................................................................................... 63
Appendix A ............................................................................................................................................. 1
Appendix B ............................................................................................................................................. 1
Appendix C ............................................................................................................................................. 1
Appendix D ............................................................................................................................................. 1
Appendix E .............................................................................................................................................. 1
viii
List of Figures
1.1 Temperature profile describing the thermal elevation of cities as a function of UHI effect. Figure
from [1]……………………………………………………………………………………………….... 1
1.2 Comparison of optical and thermal property between a) cool roof coating and b) conventional roof
coating. The dimensions of the arrows represent the magnitude of the described
parameters.……………………………………………………………………………………………... 2
3.1 Electromagnetic wave. From [21]………………………………………………………………….. 6
3.2 Solar spectrum of light reaching sea level with air to mass ratio of 1.5. All accordance with ASTM
G173-03 standard reference spectra. The percentage value to the right of the spectra shows the energy
distribution of light reaching sea level…………………………………………………………………. 7
3.3 Schematic description of absorption of light and conversion of light energy to thermal
energy…………………………………………………………………………………………………... 8
3.4 a) specular reflectance b) diffuse reflectance ……………………………………………………… 9
3.5 Comparison of coatings with different level of glossiness. a) high gloss material b) low gloss
material…………………………………………………………………………………………………. 9
3.6 Unit cell of rutile TiO2. Ti atoms are depicted as white dots and oxygen as red dots. From [24]… 11
3.7 Angle of refraction. n is equal to the refraction index of the medium and v represents the speed of
light of the two different mediums. From [36]………………………………………………………… 12
3.8 Schematic figure showing the importance of the relationship between refraction index of binding
material and pigment in cool coating applications. a) refraction index is similar between pigment and
binding material b) refraction index for pigment is significant larger than for the binding material.
………………………………………………………………………………………………………… 13
3.9 Morphology structure of special-effect pigments…………………………………………………. 13
3.10 The effect of TiO2 metal oxide thickness on colour sensation for of special-effect pigments.
………………………………………………………………………………………………………… 14
3.11 Special-pigment colour effect. The size of the specular reflectance colour arrows represents the
magnitude of observed colour. The reflection at every interphase give rise to a 3-dimensional colour
sensation. Light striking these special pigments will reflect and transmit light at the interphase. The
transmitted light is diffused reflected on the arbitrary background that give rise to a complementary
colour for the observer at non-specular reflectance angles (a). In figure b, all the transmitted light striking
the background is absorbed and the specular reflected light will be dominant in every angle. in example
c, the diffuse reflectance from the white background will lead to such a high scattering of light that the
pigment will not give rise to strong colour effect and the reflectance colours will be less dominant than
comparing with black or arbitrary background………………………………………………………... 15
4.1 Fundamental parts of a SEM instrument. An electron beam is targeting the sample that upon
interaction leads to different events that can be detected and used for creating an image of the surface
and chemical analysis of the sample with high spatial and temporal resolution………………………. 17
4.2 Secondary electron detection……………………………………………………………………... 18
4.3 Backscattered electron detection…………………………………………………………………..18
4.4 X-ray detection (EDS)……………………………………………………………………………. 19
ix
4.5 CIELAB colour coordination system. The values shown for each axis represents common maximum
values observed in coating industries. From[45]……………………………………………………… 19
4.6 Figure 18. glossmeter instrument. From [46]……………………………………………………… 20
4.7 Schematic figure of a FTIR-instrument. From [47]………………………………………………. 21
4.8 Description of the transformation of an interferogram to its corresponded FTIR-spectrum via Fourier
transformation. The picture to the right represents an FTIR spectra in transmission mode for acrylate
polymer. At certain wavenumbers a sudden drop of transmitted light reaching the detector is observed
which implies that the light has been absorbed by molecular species in the sample……………………22
4.9 Schematic figure of PXRD instrument. The diffracted light reaching the detector is converted into a
correspondent diffractogram that provides with valuable information of the crystalline material such as
its morphology structure and phase composition.……………………………………………………… 23
5.1 Image of metal substrate prior to surface treatment………………………………………………. 24
5.2 Spray coating gun used for coating application in this thesis……………………………………... 25
5.3 Schematic description of the experimental setup for thermal measurements used in this thesis. The
black dots represent thermocouples and were attached behind the metal substrate and inside the house
models………………………………………………………………………………………………… 26
5.4 Thermal measurements of the cool coating panel and the air temperature inside the house model. a)
IR-images taken on the outer surface of the coated roof panel. b) describes the temperature profile of
the thermocouples attached on the inside part of the coated roof panel and inside the house model after
subjected being subjected to NIR light for 80 minutes………………………………………………. 27
5.5 UV-chamber used in this thesis…………………………………………………………………... 27
6.1 Secondary electron SEM (20kV) images of a) black pigment, b) yellow pigment, c) IRIOTEC® 9870
pigment. The table below each image shows the mass distribution of chemical elements identified during
SEM-EDS analysis……………………………………………………………………………………. 29
6.2 Diffractogram of black pigment sample…………………………………………………………… 29
6.3 Diffractogram of black pigment superimposed on a reference peak pattern……………………… 30
6.4 Diffractogram of yellow pigment sample…………………………………………………………. 30
6.5 Diffractogram of yellow pigment superimposed on a reference peak pattern…………………….. 31
6.6 Diffractogram of IRIOTEC® 9870 pigment………………………………………………………. 31
6.7 Diffractogram of IRIOTEC® 9870 pigment superimposed on a reference peak pattern………….. 32
6.8 Dispersion analysis of each black cool coating sample. The BE-SEM (20) kV images to the left
represent the cross section of the coating layer. The images to the right describe the size distribution of
the agglomerated pigment particles…………………………………………………………………… 33
6.9 Dispersion analysis of each yellow cool coating sample. The BED-SEM (20) kV images to the left
represent the cross section of the coating layer. The images to the right describe the size distribution of
the agglomerated pigment particles…………………………………………………………………… 34
6.10 Dispersion analysis of each IRIOTEC® 9870 cool coating sample. The BED-SEM (20) kV images
to the left represent the cross section of the coating layer. The images to the right show the particle size
distribution in the coating………………………………………………………………………………34
6.11 SEM-EDS elemental mapping for black cool coating containing 3 wt.% black NIR reflective black
pigment. The spectrum to the right corresponds to the emission spectra obtained during analysis. The
table below list all chemical elements observed………………………………………………………. 36
x
6.12 SEM-EDS elemental mapping for yellow cool coating containing 3 wt.% yellow NIR reflective
pigment. The spectrum to the right corresponds to the emission spectra obtained during analysis. The
table below list all chemical elements observed………………………………………………………. 37
6.13 SEM-EDS elemental mapping for semi-transparent cool coating containing 3 wt.% IRIOTEC®
9870 NIR reflective pigment. The spectrum to the right corresponds to the emission spectra obtained
during analysis. The table below list all chemical elements observed………………………………… 38
6.14 FTIR spectra for pure transparent paint before UVB exposure………………………………….. 39
6.15 FTIR spectra of the 0 wt.% coating sample. a) before UVB exposure b) 96 h of UVB exposure c)
480 h of UVB exposure……………………………………………………………………………….. 39
6.16 FTIR spectra for 1 and 5 wt.% black cool coating. The different lines in each spectra corresponds
to FTIR spectra at initial state and after 96 and 480 h of UVB exposure…………………………….. 40
6.17 FTIR spectra for 1 and 5 wt.% yellow cool coating. The different lines in each spectra corresponds
to FTIR spectra at initial state and after 96 and 480 h of UVB exposure…………………………….. 40
6.18 FTIR spectra for 1 and 5 wt.% IRIOTEC® 9870 cool coating. The different lines in each spectra
corresponds to FTIR spectra at initial state and after 96 and 480 h of UVB exposure……………….. 41
6.19 Initial gloss value for each coating sample measured at 60° specular angle…………………….. 42
6.20 Gloss evolution for black coating and the 0 wt.% coating. a) gloss unit vs time exposed to UVB
radiation b) normalised glossiness vs time exposed to UVB radiation……………………………….. 43
6.21 Gloss evolution for yellow coatings and the 0 wt.% coating. a) gloss unit vs time exposed to UVB
radiation b) normalised glossiness vs time exposed to UVB radiation……………………………….. 44
6.22 Gloss evolution for IRIOTEC® 9870 coatings and the 0 wt.% coatings. a) gloss unit vs time exposed
to UVB radiation b) normalised glossiness vs exposed to UVB radiation……………………………. 45
6.23 ΔE evolution of the different formed coatings as a function of time exposed to UVB radiation. a)
black coatings and the 0 wt.% coating b) yellow coatings and the 0 wt.% coating c) IRIOTEC® 9870
cool coatings and the 0 wt.% coating…………………………………………………………………. 47
6.24 The diagrams to the right shows the evolution of a*, b* and L* CIELAB colour coordinates for
black cool coatings and the images to the left compares the colour of each black cool coating sample
obtained at initial state and after 480 h of UVB exposure…………………………………………….. 48
6.25 The diagrams to the right shows the evolution of a*, b* and L* CIELAB colour coordinates for the
yellow cool coatings and the images to the left compares the colour of each yellow cool coating sample
obtained at initial state and after 480 h of UVB exposure…………………………………………….. 49
6.26 The diagrams to the right shows the evolution of a*, b* and L* CIELAB colour coordinates for
IRIOTEC® 9870 cool coatings and the images to the left compares the colour of each IRIOTEC® 9870
cool coating sample obtained at initial state and after 480 h of UVB exposure………………………. 49
6.27 Thermal data collection of 3 wt.% black cool coating. a) temperature of the inner surface of the
roof panel b) temperature inside the house model c) temperature of the outer surface of the roof panel
d) image of the experimental set-up and IR-image taken by an IR-camera…………………………… 50
6.28 Temperature observed for black coatings as a function of time exposed to UVB radiation. a) inner
surface of roof panel b) outer surface of roof panel c) air inside house d) legend…………………….. 51
6.29 Temperature observed for yellow coatings as a function of time exposed to UVB radiation. a) inner
surface of roof panel b) outer surface of roof panel c) air inside house d) legend…………………….. 53
xi
6.30 Temperature observed for IRIOTEC® 9870 cool coatings and the 0 wt.% coating as a function of
time exposed to UVB radiation. a) inner surface of roof panel b) outer surface of roof panel c) air inside
house d) legend………………………………………………………………………………………... 54
6.31 Aesthetical and temperature evolution of black cool coatings plotted together as a function of time
exposed to UVB radiation…………………………………………………………………………….. 56
6.32 Aesthetical and temperature evolution of yellow cool coatings plotted together as a function of time
exposed to UVB radiation…………………………………………………………………………….. 57
6.33 Aesthetical and temperature evolution of IRIOTEC® 9870 cool coatings plotted together as a
function of time exposed to UVB radiation…………………………………………………………... 58
A1. SEM-EDS elemental mapping for black cool coating containing 1 wt.% black NIR reflective black
pigment. The spectrum to the right corresponds to the emission spectra obtained during analysis. The
table below list all chemical elements observed……………………………………………………… A1
A2. SEM-EDS elemental mapping for black cool coating containing 5 wt.% black NIR reflective black
pigment. The spectrum to the right corresponds to the emission spectra obtained during analysis. The
table below list all chemical elements observed……………………………………………………… A2
A3. SEM-EDS elemental mapping for yellow cool coating containing 1 wt.% yellow NIR reflective
black pigment. The spectrum to the right corresponds to the emission spectra obtained during analysis.
The table below list all chemical elements observed…………………………………………………. A3
A4. SEM-EDS elemental mapping for yellow cool coating containing 5 wt.% black NIR reflective
yellow pigment. The spectrum to the right corresponds to the emission spectra obtained during analysis.
The table below list all chemical elements observed………………………………………………….. A4
A5. SEM-EDS elemental mapping for yellow cool coating containing 1 wt.% NIR reflective IRIOTEC®
9870 pigment. The spectrum to the right corresponds to the emission spectra obtained during analysis.
The table below list all chemical elements observed…………………………………………………. A5
A6. SEM-EDS elemental mapping for yellow cool coating containing 5 wt.% NIR reflective IRIOTEC®
9870 pigment. The spectrum to the right corresponds to the emission spectra obtained during analysis.
The table below list all chemical elements observed………………………………………………….. A6
D.1 Thermal measurements of 1 wt.% black cool coating……………………………………………. D2
D.2 Thermal measurements of 3 wt.% black cool coating……………………………………………. D2
D.3 Thermal measurements of 5 wt.% black cool coating……………………………………………. D3
D.4 Thermal measurements of black conventional coating…………………………………………… D3
D.5 Thermal measurements of 1 wt.% yellow cool coating…………………………………………... D5
D.6 Thermal measurements of 3 wt.% yellow cool coating…………………………………………... D5
D.7 Thermal measurements of 5 wt.% yellow cool coating………………………………………….. D6
D.8 Thermal measurements of yellow conventional coating…………………………………………. D6
D.9 Thermal measurements of 1 wt.% IRIOTEC® 9870 cool coating……………………………….. D8
D.10 Thermal measurements of 3 wt.% IRIOTEC® 9870 cool coating……………………………… D8
D.11 Thermal measurements of 5 wt.% IRIOTEC® 9870 cool coating……………………………… D9
D.12 Thermal measurements of 0 wt.% coating…………………………………………………….. D10
xii
E.1 FTIR spectra of the 3 wt.% black cool coating sample. a) before UVB exposure b) 96 h of UVB
exposure c) 480 h of UVB exposure…………………………………………………………………. E1
E.2 FTIR spectra of the 3 wt.% yellow cool coating sample. a) before UVB exposure b) 96 h of UVB
exposure c) 480 h of UVB exposure…………………………………………………………………. E1
E.3 FTIR spectra of the 3 wt.% IRIOTEC® 9870 cool coating sample. a) before UVB exposure b) 96 h
of UVB exposure c) 480 h of UVB exposure………………………………………………………… E2
xiii
List of Tables 2.1 Technical information of the different pigments and conventional paints used in this thesis……... 4
6.1 Dry coating thickness……………………………………………………………………………... 28
6.2 Initial gloss unit and gloss unit after 480 h of UVB exposure together with gloss preservation (%)
after 480 h of UVB exposure for black coatings and the 0 wt.% coating…………………………….. 43
6.3 Initial gloss unit and gloss unit after 480 h of UVB exposure together with gloss preservation (%)
after 480 h of UVB exposure for yellow coatings and the 0 wt.% coating…………………………… 44
6.4 Initial gloss unit and gloss unit after 480 h of UVB exposure together with gloss preservation (%)
after 480 h of UVB exposure for IRIOTEC 9870® cool coatings and the 0 wt.% coating……………. 45
6.5 Initial colour coordination values for each coating sample………………………………………... 46
6.6 Temperature values of black coatings at initial and after 480 h of UVB exposure……………….. 52
6.7 Temperature values of yellow coatings at initial and after 480 h of UVB exposure……………… 53
6.8. Temperature values of IRIOTEC® 9870 cool coatings and the 0 wt.% coating at initial and after 480
h of UVB exposure……………………………………………………………………………………. 55
B.1 Evolution of gloss unit as a function of UVB exposure for black coating samples………………. B1
B.2 Evolution of gloss unit as a function of UVB exposure for yellow coating samples……………. B1
B.3 Evolution of gloss unit as a function of UVB exposure for IRIOTEC® 9870 cool coating samples
and the 0 wt.% coating sample………………………………………………………………………... B2
C.1 Evolution of colour coordinates for the black coating samples as a function of UVB exposure… C1
C.2 Evolution of colour coordinates for the black coating samples as a function of UVB exposure… C1
C.3 Evolution of colour coordinates as a function of UVB exposure for IRIOTEC® 9870 cool coating
samples and the 0 wt.% coating sample……………………………………………………………… C2
D.1 Evolution of temperature for black coatings as a function of UVB exposure…………………… D1
D.2 Evolution of temperature for yellow coatings as a function of UVB exposure…………………. D4
D.3 Evolution of temperature for IRIOTEC® 9870 cool coatings and the 0 wt.% sample as a function of
UVB exposure………………………………………………………………………………………... D7
1
Chapter I
1. Introduction
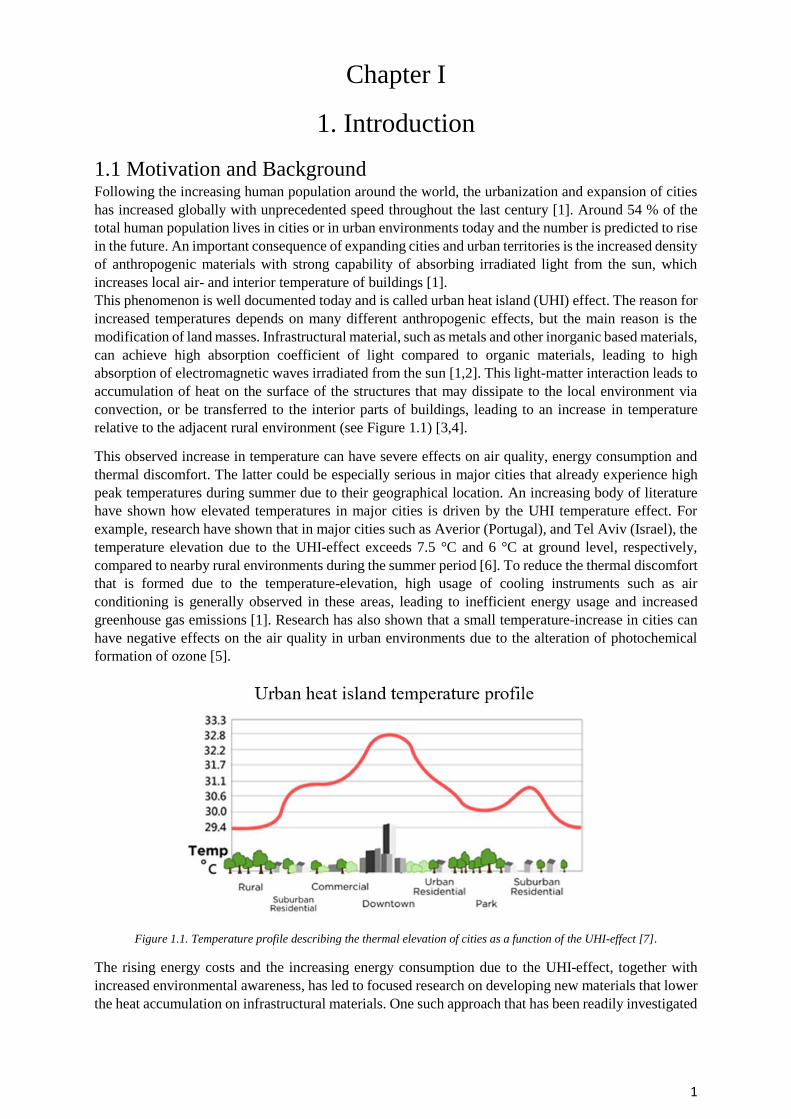
1.1 Motivation and Background Following the increasing human population around the world, the urbanization and expansion of cities
has increased globally with unprecedented speed throughout the last century [1]. Around 54 % of the
total human population lives in cities or in urban environments today and the number is predicted to rise
in the future. An important consequence of expanding cities and urban territories is the increased density
of anthropogenic materials with strong capability of absorbing irradiated light from the sun, which
increases local air- and interior temperature of buildings [1].
This phenomenon is well documented today and is called urban heat island (UHI) effect. The reason for
increased temperatures depends on many different anthropogenic effects, but the main reason is the
modification of land masses. Infrastructural material, such as metals and other inorganic based materials,
can achieve high absorption coefficient of light compared to organic materials, leading to high
absorption of electromagnetic waves irradiated from the sun [1,2]. This light-matter interaction leads to
accumulation of heat on the surface of the structures that may dissipate to the local environment via
convection, or be transferred to the interior parts of buildings, leading to an increase in temperature
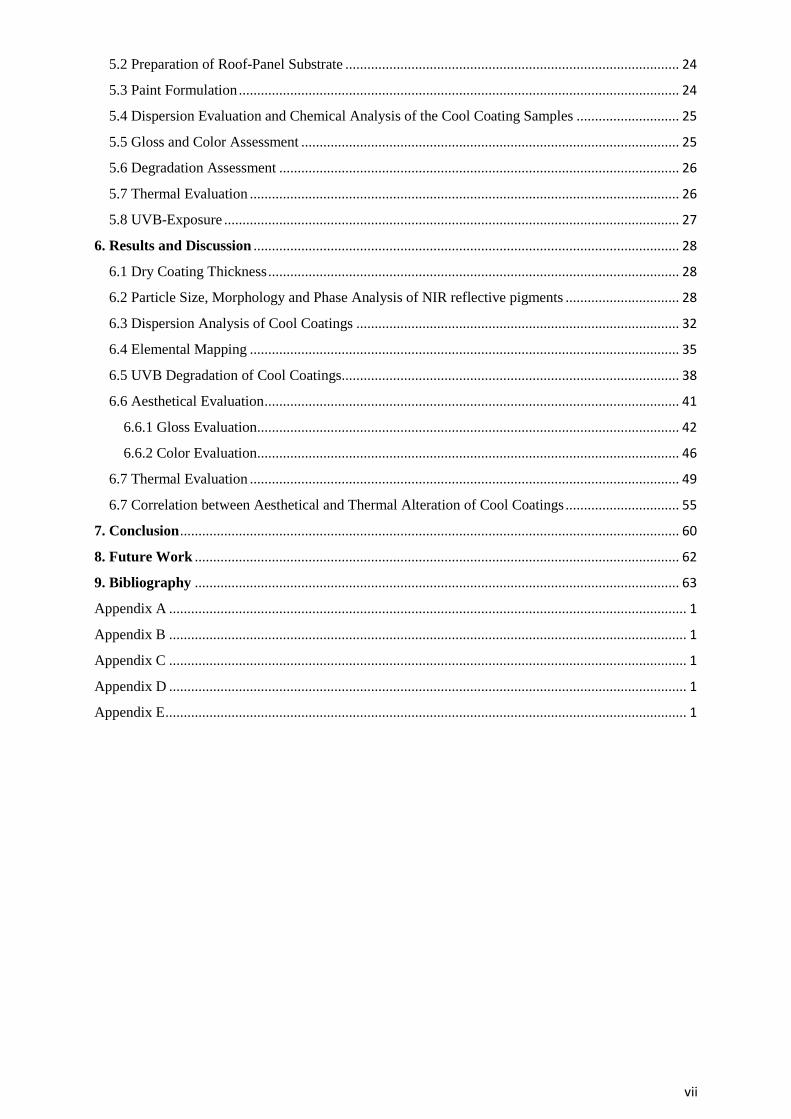
relative to the adjacent rural environment (see Figure 1.1) [3,4].
This observed increase in temperature can have severe effects on air quality, energy consumption and
thermal discomfort. The latter could be especially serious in major cities that already experience high
peak temperatures during summer due to their geographical location. An increasing body of literature
have shown how elevated temperatures in major cities is driven by the UHI temperature effect. For
example, research have shown that in major cities such as Averior (Portugal), and Tel Aviv (Israel), the
temperature elevation due to the UHI-effect exceeds 7.5 °C and 6 °C at ground level, respectively,
compared to nearby rural environments during the summer period [6]. To reduce the thermal discomfort
that is formed due to the temperature-elevation, high usage of cooling instruments such as air
conditioning is generally observed in these areas, leading to inefficient energy usage and increased
greenhouse gas emissions [1]. Research has also shown that a small temperature-increase in cities can
have negative effects on the air quality in urban environments due to the alteration of photochemical
formation of ozone [5].
Figure 1.1. Temperature profile describing the thermal elevation of cities as a function of the UHI-effect [7].
The rising energy costs and the increasing energy consumption due to the UHI-effect, together with
increased environmental awareness, has led to focused research on developing new materials that lower
the heat accumulation on infrastructural materials. One such approach that has been readily investigated
2
over the past decades has been a non-architecture method that is based on the synthetization and
formation of NIR-reflective inorganic pigments applied to surface coatings used on top of roof panels
[8,9,10]. These pigments reflect a very high percentage of the NIR spectra of sunlight, while maintaining
absorption in the visible light to impart any color, thus maintaining aesthetical demands of the roof.
These so-called cool coatings also show high thermal emittance, leading to increased release rates of
absorbed energy to the environment that exits the atmosphere. Furthermore, the cooled coating system
is a passive cooling system that does not require any external energy to operate [8]. The fundamentals
of NIR reflective pigment and cool coatings will be thoroughly described in the theory section of this
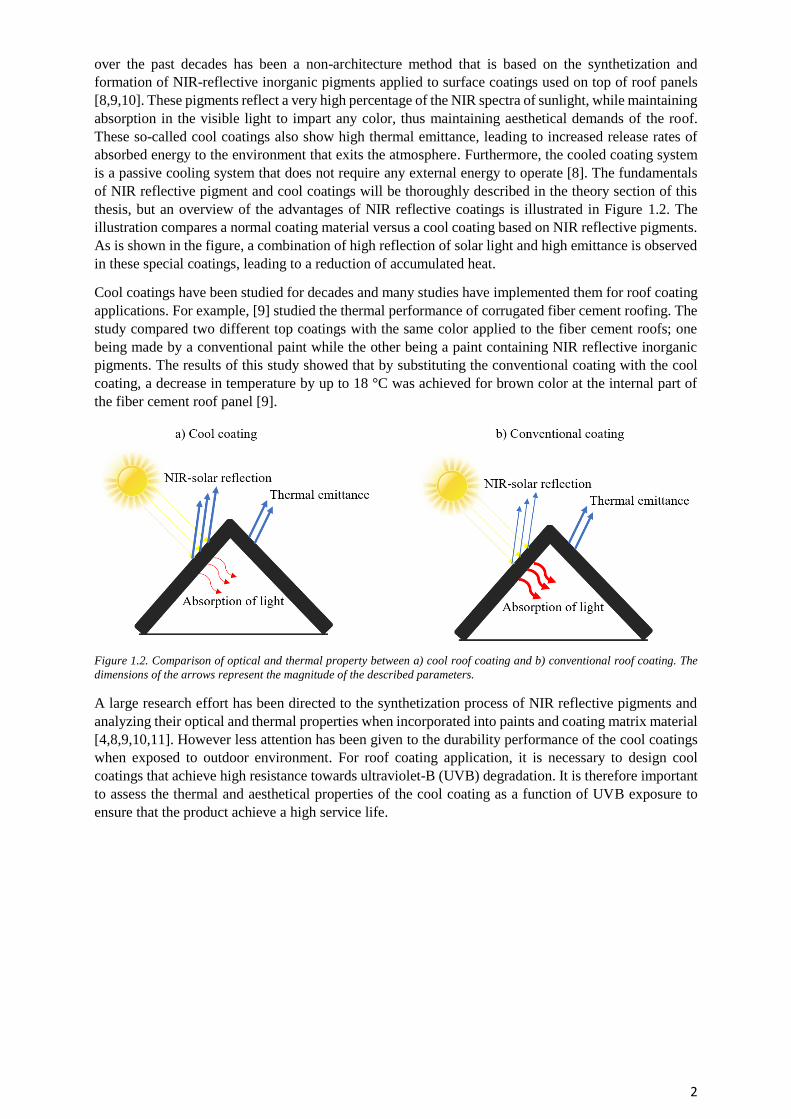
thesis, but an overview of the advantages of NIR reflective coatings is illustrated in Figure 1.2. The
illustration compares a normal coating material versus a cool coating based on NIR reflective pigments.
As is shown in the figure, a combination of high reflection of solar light and high emittance is observed
in these special coatings, leading to a reduction of accumulated heat.
Cool coatings have been studied for decades and many studies have implemented them for roof coating
applications. For example, [9] studied the thermal performance of corrugated fiber cement roofing. The
study compared two different top coatings with the same color applied to the fiber cement roofs; one
being made by a conventional paint while the other being a paint containing NIR reflective inorganic
pigments. The results of this study showed that by substituting the conventional coating with the cool
coating, a decrease in temperature by up to 18 °C was achieved for brown color at the internal part of
the fiber cement roof panel [9].
Figure 1.2. Comparison of optical and thermal property between a) cool roof coating and b) conventional roof coating. The
dimensions of the arrows represent the magnitude of the described parameters.
A large research effort has been directed to the synthetization process of NIR reflective pigments and
analyzing their optical and thermal properties when incorporated into paints and coating matrix material
[4,8,9,10,11]. However less attention has been given to the durability performance of the cool coatings
when exposed to outdoor environment. For roof coating application, it is necessary to design cool
coatings that achieve high resistance towards ultraviolet-B (UVB) degradation. It is therefore important
to assess the thermal and aesthetical properties of the cool coating as a function of UVB exposure to
ensure that the product achieve a high service life.
3
Chapter II
2. Aim, Approach and Limitations
2.1 Aim The current project aims to develop a black, yellow and semi-transparent cool coating for roof coating
application. The thermal properties (in NIR-range of light), specular gloss and color properties of the
made cool coatings were assessed at initial state and after exposure to accelerated UVB radiation (a total
of 480 h, 96 h/cycle). In addition, the pigments weight concentration (wt.%) of the prepared paint
formulations varied between 0,1,3 5 wt.% to see its effect on the mentioned properties. The most
important questions that this thesis aims to answer is the following:
• Is the paint formulation method used in this thesis sufficient to form an unformal dispersion of
pigments inside the formed cool coatings?
• How does pigment concentration effect the aesthetical, thermal and durability performance of
the cool coatings?
• How does the different pigment type alter the durability and thermal performance of the cool
coatings?
• Is the amount of pigment added sufficient to have satisfied thermal and aesthetical properties?
• Is there a correlation between aesthetical degradation of the cool coatings, as a function of UVB
exposure, and alteration in thermal behaviour?
2.2 Approach The cool coatings were made by preparing paint formulations that contained three different NIR-
reflective inorganic pigments and an acrylic transparent paint as binding material. The NIR reflective
pigments that imparted black and yellow colour for the cool coatings were complex inorganic colour
pigments (CCIP) and the semi-transparent NIR reflective pigment was a so called special-effect pigment
that obtained a complex 3-D colour sensation. In addition, black and yellow conventional coatings were
also prepared for a proper comparison study between conventional and cool coatings. No conventional
coating for the special-effect pigment was made. However due to similar colour characteristics as the
transparent binding material, the cool coatings based on the special-effect pigment was compared with
a coating based on the binding material (0 wt.% pigment added).
Prior to coating application, a characterization study of the pigments and the cool coatings in terms of
morphology, chemical composition, phase structure and dispersion quality were conducted using
scanning electron microscopy (SEM) assisted with electron X-ray spectroscopy (SEM-EDS) and
powder X-ray diffraction (PXRD).
The colour measurements were done in accordance to CIELAB colour coordination standard (ASTM
E805) and the specular gloss was measured at 60° angle (ASTM D523). The thermal characterization
of the coatings was assessed by applying them on metal surface panels, simulating small-scale roof
panels that were applied on small scale houses and subjected to an emitted IR-lamp with thermocouples
attached on the inner part of the metal surface and inside the small-scale house model (see experimental
section for detailed explanation). The thermal property of the outer part of the different coatings was
evaluated using an IR-camera. The chemical degradation process of the coating material as a function
of accelerated UVB exposure was assessed and monitored using FTIR-ATR.
The NIR reflective CCIP pigments were provided by FERRO Cooperation and the NIR reflective
special-effect pigment was provided by MERCK group company. Both the commercialized paint, that
was used for the formation of conventional coatings and for base coat application, and the acrylic
transparent paint was bought at a regular paint store. Additional information of the different pigments
and paints used in this thesis is described in table 2.1.
4
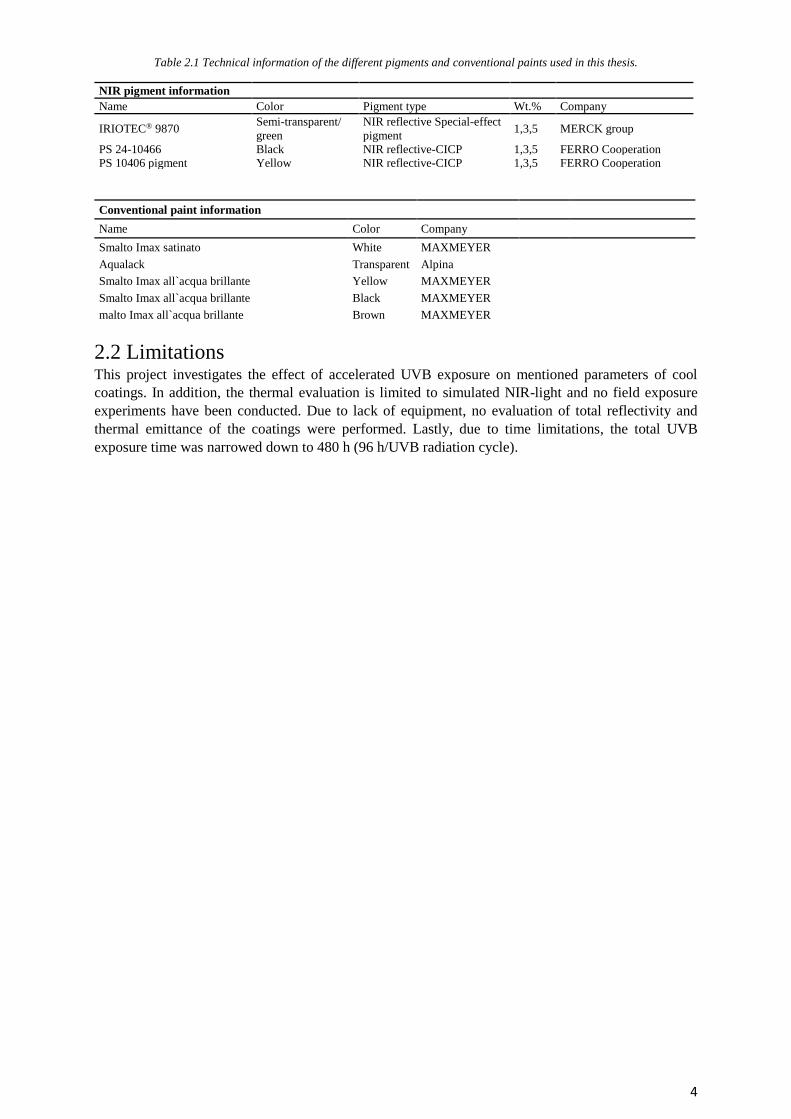
Table 2.1 Technical information of the different pigments and conventional paints used in this thesis.
NIR pigment information
Name Color Pigment type Wt.% Company
IRIOTEC® 9870 Semi-transparent/
green
NIR reflective Special-effect
pigment 1,3,5 MERCK group
PS 24-10466 Black NIR reflective-CICP 1,3,5 FERRO Cooperation
PS 10406 pigment Yellow NIR reflective-CICP 1,3,5 FERRO Cooperation
Conventional paint information
Name Color Company
Smalto Imax satinato White MAXMEYER Aqualack Transparent Alpina Smalto Imax all`acqua brillante Yellow MAXMEYER Smalto Imax all`acqua brillante Black MAXMEYER malto Imax all`acqua brillante Brown MAXMEYER
2.2 Limitations This project investigates the effect of accelerated UVB exposure on mentioned parameters of cool
coatings. In addition, the thermal evaluation is limited to simulated NIR-light and no field exposure
experiments have been conducted. Due to lack of equipment, no evaluation of total reflectivity and
thermal emittance of the coatings were performed. Lastly, due to time limitations, the total UVB
exposure time was narrowed down to 480 h (96 h/UVB radiation cycle).
5
CHAPTER III
3. Theoretical Background The main purpose of this section is to provide the reader with necessary theoretical background
regarding the negative aspects of the UHI-effect and the fundamental theory of NIR-reflective inorganic
pigment and cool coatings. In addition, at the end of this chapter a short discussion of UVB-degradation
of coatings will be described.
3.1 Negative Aspects of the UHI-Effect on Society
3.1.1 Reduction of Air Quality
Formation of ozone (O3) in the troposphere is a major factor of the air quality in urban environments. A
simplified example of the photochemical formation of ozone in the troposphere is described in equation
1, which shows how ozone is formed in the presence of solar light, nitrogen dioxide (NO2) and volatile
organic compounds (VOC) [5,12].
NO2 + VOC + sunlight → O3 + biproducts (1)
NO2 in urban environments originates mainly from combustion of different types of vehicles and
emissions from industries. An increase in NO2 subsequently leads to an increase of ozone formation
since it is a precursor to ozone. VOC can form in the atmosphere when evaporated from coating material
or as a biproduct from combustion-engines or industrial power plants. Even though global efforts to
reduce NO2 and usage of VOC in coatings through governmental regulations have led to large reduction
of these compounds, it remains an issue for the air quality in major cities [5,12].
Elevated temperatures due to the UHI-effect can affect the air quality in major cities by altering the
concentration of O3. In the troposphere, VOC together with NO2 may also form peroxyacyl nitrate
(PAN) from a three-way reaction involving carbonyl radicals, hydroxy radicals, NO2 and UV light. This
reaction is described in Equation 2 [5,12,13].
CH3CHO + OH •→ CH3CO • +H2O (2)
CH3CO • +O2 → CH3CO3 •
CH3C(O3) • +NO2 (Consumption) → CH3CO3NO2(PAN)
In this reaction, (PAN) functions as a reservoir of NO2, thus reducing the concentration of available
reactants for the photochemical production of ozone. However, the amount of PAN formed is strongly
dependent on the ambient temperature. When exceeding the temperature threshold value, PAN tends to
decompose and re-form NO2 that will lead to an increase in the photochemical production of ozone [5].
[13] studied the ozone formation in Atlanta (USA) and how temperature-fluctuations influenced the
concentration of ozone in the troposphere. They found that an increase in temperature by 1-3°C
accelerated smog formation by over 20ppbv (parts per billion by volume) in Atlanta city, due to the
reduced formation of PAN [13]. Furthermore, the same study also investigated the formation of VOC
in the atmosphere as a function of temperature. According to this study 2°C increase in the urban
environment in Atlanta lead to an increase in anthropogenic emission of VOC by 10%, which indirectly
may lead to an increase ozone formation (see equation 1) [13].
Taken together, these studies suggest that elevated temperatures in major cities may have an impact on
the air quality of the local environment. Furthermore, the temperature range that affects the air quality
is within the range of cool roof coatings’ ability to mitigate urban heat island temperature elevation.
Therefore, it is important to investigate the substitution of conventional roof coatings with cool roof
coating material to mitigate temperature-induced reductions in air quality in major cities [15].
6
3.1.2 Impact on Energy Consumption and Environment
The consequences of UHI-effect have also been researched from an economic standpoint. According to
the US Energy Information Admiration (EIA), over 70% of the total electrical energy consumption in
USA are from buildings. Furthermore, 14 % of this energy consumption is yearly used for cooling
interior parts of the building by air condition systems [16]. [17] conducted research on the increased
energy consumption due to UHI-effects in Los Angeles (USA). The study concluded that the UHI-effect
was responsible for increasing the energy consumption related to cooling in the Los Angeles basin by
an estimated 1-1.5 GW/year. This lead to a yearly increase in energy costs by 35 million US-dollars
(USD) compared to if the temperature in Los Angeles would be the same as in adjacent rural
environments. Furthermore, the study also estimated the increased energy costs nationwide and
concluded that the UHI-effect was responsible for a 10-15% increase in energy demands nationwide,
which lead to an estimated annual total cost of 750 million USD [17].
[18] researched the consequence of UHI effect in Athens in 2009 and found that the temperature
elevation due to UHI effect was 10°C at summertime. Consequentially, the energy required to cool urban
buildings was twice the amount of energy needed for adjacent rural environments [18] [19].
Increased energy consumption is also an environmental issue. On the basis of the overwhelming
scientific evidence for the negative ecological, economical and societal implications of global climate
change, subventions and other measures to increase the proportion of clean energy are in place globally.
However, most of the produced electricity today still originates from burning fossil fuels. The increased
electricity demand due to the UHI-effect increases the generation of electricity in the power plants,
leading to increase release of CO2, SO2 and other greenhouse gases, whose negative impacts on global
climatic patterns are well documented [1,10,11].
3.2 Origin of Light and the Solar Spectrum of Light In order to appreciate the potential and function of NIR reflective pigments and cool coatings, it is first
necessary to discuss the nature of light, the solar spectrum of light and the fundamental theory of light-
matter interaction.
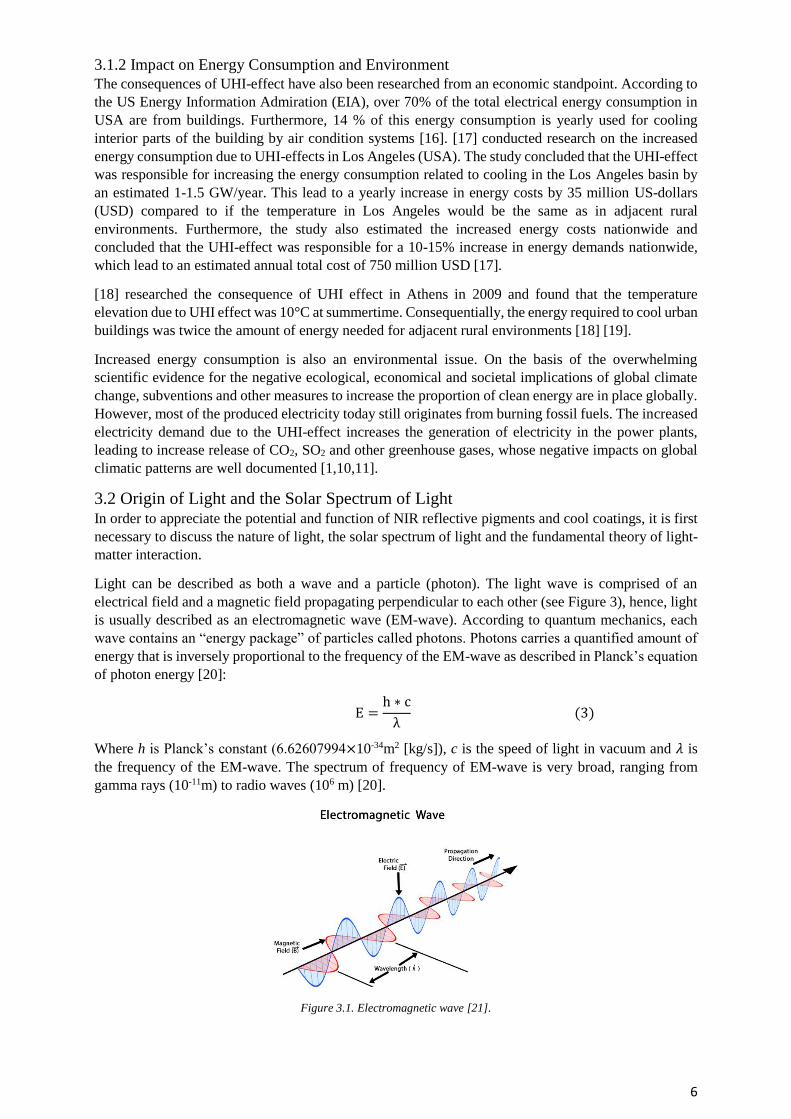
Light can be described as both a wave and a particle (photon). The light wave is comprised of an
electrical field and a magnetic field propagating perpendicular to each other (see Figure 3), hence, light
is usually described as an electromagnetic wave (EM-wave). According to quantum mechanics, each
wave contains an “energy package” of particles called photons. Photons carries a quantified amount of
energy that is inversely proportional to the frequency of the EM-wave as described in Planck’s equation
of photon energy [20]:
E =h ∗ c
λ (3)
Where h is Planck’s constant (6.62607994×10⁻³⁴m2 [kg/s]), c is the speed of light in vacuum and 𝜆 is
the frequency of the EM-wave. The spectrum of frequency of EM-wave is very broad, ranging from
gamma rays (10-11m) to radio waves (106 m) [20].
Figure 3.1. Electromagnetic wave [21].
7
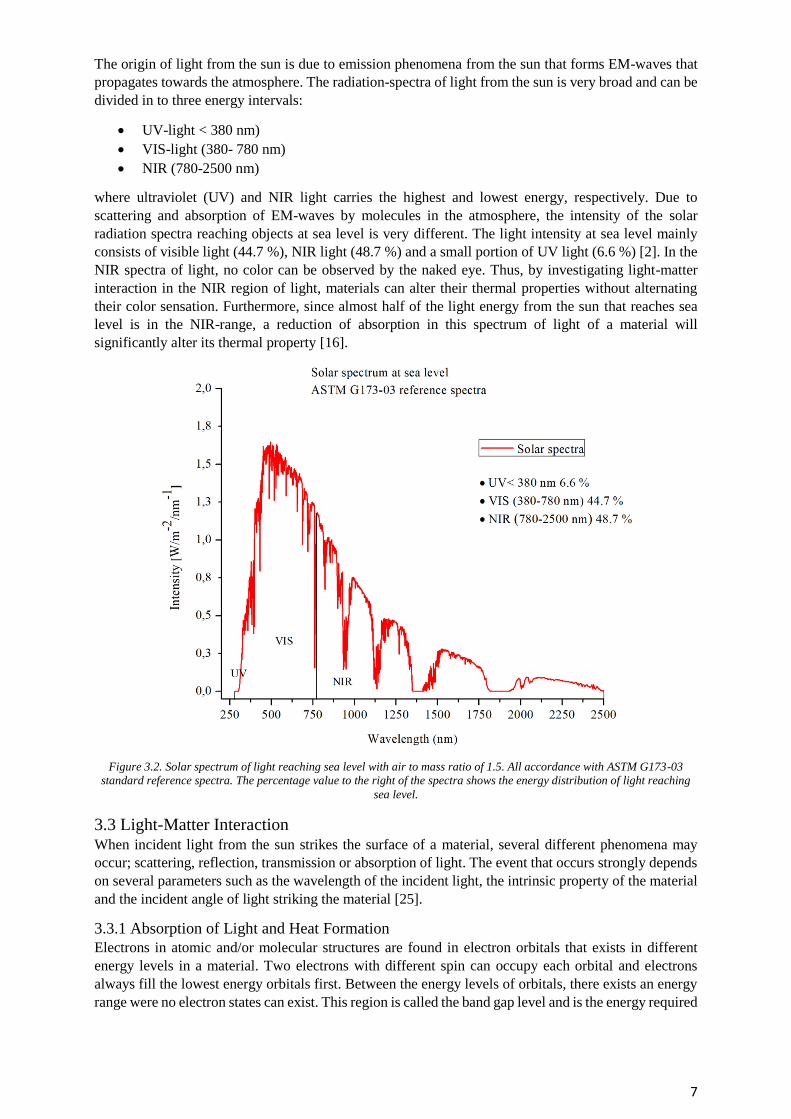
The origin of light from the sun is due to emission phenomena from the sun that forms EM-waves that
propagates towards the atmosphere. The radiation-spectra of light from the sun is very broad and can be
divided in to three energy intervals:
• UV-light < 380 nm)
• VIS-light (380- 780 nm)
• NIR (780-2500 nm)
where ultraviolet (UV) and NIR light carries the highest and lowest energy, respectively. Due to
scattering and absorption of EM-waves by molecules in the atmosphere, the intensity of the solar
radiation spectra reaching objects at sea level is very different. The light intensity at sea level mainly
consists of visible light (44.7 %), NIR light (48.7 %) and a small portion of UV light (6.6 %) [2]. In the
NIR spectra of light, no color can be observed by the naked eye. Thus, by investigating light-matter
interaction in the NIR region of light, materials can alter their thermal properties without alternating
their color sensation. Furthermore, since almost half of the light energy from the sun that reaches sea
level is in the NIR-range, a reduction of absorption in this spectrum of light of a material will
significantly alter its thermal property [16].
Figure 3.2. Solar spectrum of light reaching sea level with air to mass ratio of 1.5. All accordance with ASTM G173-03
standard reference spectra. The percentage value to the right of the spectra shows the energy distribution of light reaching
sea level.
3.3 Light-Matter Interaction When incident light from the sun strikes the surface of a material, several different phenomena may
occur; scattering, reflection, transmission or absorption of light. The event that occurs strongly depends
on several parameters such as the wavelength of the incident light, the intrinsic property of the material
and the incident angle of light striking the material [25].
3.3.1 Absorption of Light and Heat Formation
Electrons in atomic and/or molecular structures are found in electron orbitals that exists in different
energy levels in a material. Two electrons with different spin can occupy each orbital and electrons
always fill the lowest energy orbitals first. Between the energy levels of orbitals, there exists an energy
range were no electron states can exist. This region is called the band gap level and is the energy required
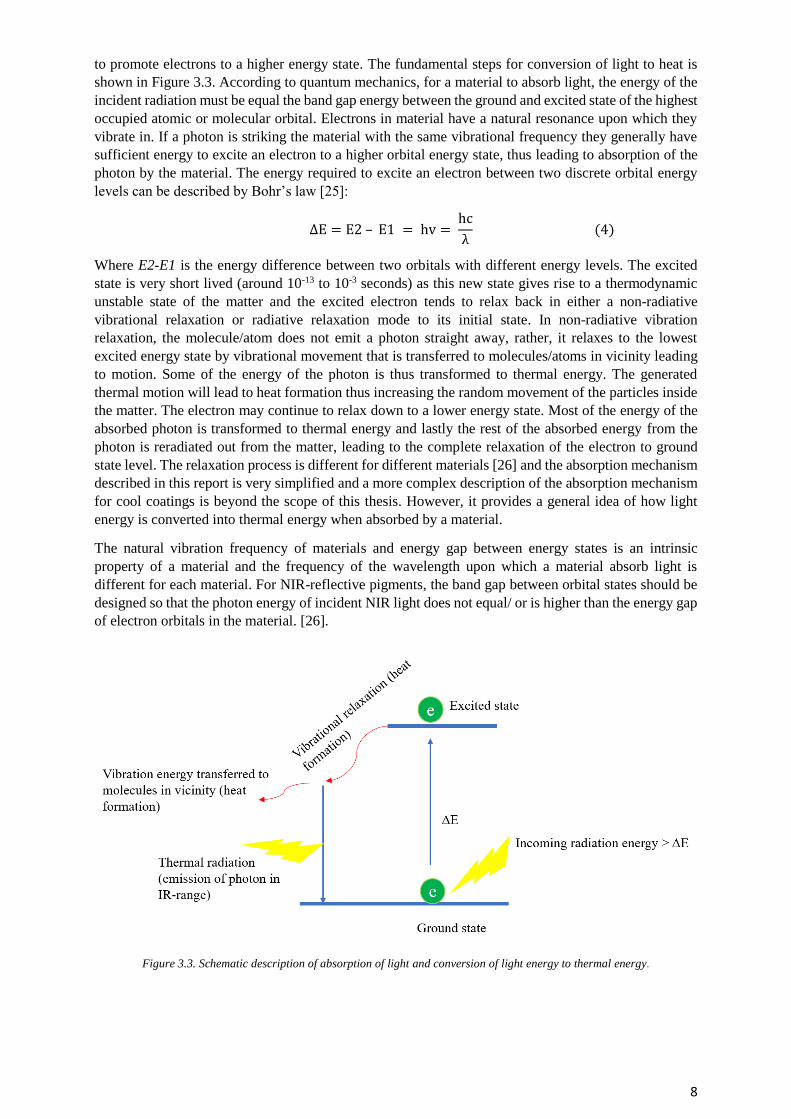
8
to promote electrons to a higher energy state. The fundamental steps for conversion of light to heat is
shown in Figure 3.3. According to quantum mechanics, for a material to absorb light, the energy of the
incident radiation must be equal the band gap energy between the ground and excited state of the highest
occupied atomic or molecular orbital. Electrons in material have a natural resonance upon which they
vibrate in. If a photon is striking the material with the same vibrational frequency they generally have
sufficient energy to excite an electron to a higher orbital energy state, thus leading to absorption of the
photon by the material. The energy required to excite an electron between two discrete orbital energy
levels can be described by Bohr’s law [25]:
ΔE = E2 – E1 = hv = hc
λ (4)
Where E2-E1 is the energy difference between two orbitals with different energy levels. The excited
state is very short lived (around 10-13 to 10-3 seconds) as this new state gives rise to a thermodynamic
unstable state of the matter and the excited electron tends to relax back in either a non-radiative
vibrational relaxation or radiative relaxation mode to its initial state. In non-radiative vibration
relaxation, the molecule/atom does not emit a photon straight away, rather, it relaxes to the lowest
excited energy state by vibrational movement that is transferred to molecules/atoms in vicinity leading
to motion. Some of the energy of the photon is thus transformed to thermal energy. The generated
thermal motion will lead to heat formation thus increasing the random movement of the particles inside
the matter. The electron may continue to relax down to a lower energy state. Most of the energy of the
absorbed photon is transformed to thermal energy and lastly the rest of the absorbed energy from the
photon is reradiated out from the matter, leading to the complete relaxation of the electron to ground
state level. The relaxation process is different for different materials [26] and the absorption mechanism
described in this report is very simplified and a more complex description of the absorption mechanism
for cool coatings is beyond the scope of this thesis. However, it provides a general idea of how light
energy is converted into thermal energy when absorbed by a material.
The natural vibration frequency of materials and energy gap between energy states is an intrinsic
property of a material and the frequency of the wavelength upon which a material absorb light is
different for each material. For NIR-reflective pigments, the band gap between orbital states should be
designed so that the photon energy of incident NIR light does not equal/ or is higher than the energy gap
of electron orbitals in the material. [26].
Figure 3.3. Schematic description of absorption of light and conversion of light energy to thermal energy.
9
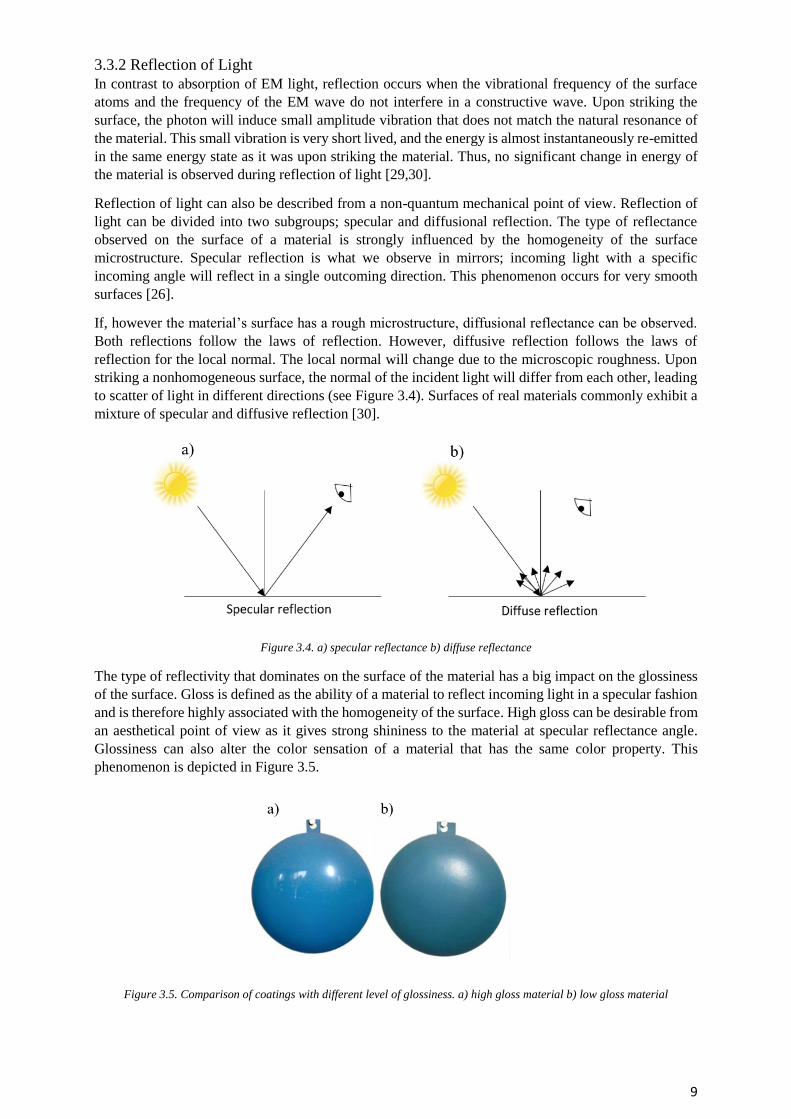
3.3.2 Reflection of Light
In contrast to absorption of EM light, reflection occurs when the vibrational frequency of the surface
atoms and the frequency of the EM wave do not interfere in a constructive wave. Upon striking the
surface, the photon will induce small amplitude vibration that does not match the natural resonance of
the material. This small vibration is very short lived, and the energy is almost instantaneously re-emitted
in the same energy state as it was upon striking the material. Thus, no significant change in energy of
the material is observed during reflection of light [29,30].
Reflection of light can also be described from a non-quantum mechanical point of view. Reflection of
light can be divided into two subgroups; specular and diffusional reflection. The type of reflectance
observed on the surface of a material is strongly influenced by the homogeneity of the surface
microstructure. Specular reflection is what we observe in mirrors; incoming light with a specific
incoming angle will reflect in a single outcoming direction. This phenomenon occurs for very smooth
surfaces [26].
If, however the material’s surface has a rough microstructure, diffusional reflectance can be observed.
Both reflections follow the laws of reflection. However, diffusive reflection follows the laws of
reflection for the local normal. The local normal will change due to the microscopic roughness. Upon
striking a nonhomogeneous surface, the normal of the incident light will differ from each other, leading
to scatter of light in different directions (see Figure 3.4). Surfaces of real materials commonly exhibit a
mixture of specular and diffusive reflection [30].
Figure 3.4. a) specular reflectance b) diffuse reflectance
The type of reflectivity that dominates on the surface of the material has a big impact on the glossiness
of the surface. Gloss is defined as the ability of a material to reflect incoming light in a specular fashion
and is therefore highly associated with the homogeneity of the surface. High gloss can be desirable from
an aesthetical point of view as it gives strong shininess to the material at specular reflectance angle.
Glossiness can also alter the color sensation of a material that has the same color property. This
phenomenon is depicted in Figure 3.5.
Figure 3.5. Comparison of coatings with different level of glossiness. a) high gloss material b) low gloss material
10
The intensity of gloss depends on the surface structure of the material. The surface structure may be
altered by weathering phenomena such as UV-degradation of the coating or by the paint composition.
The pigment concentration, shape and dispersion may influence the glossiness of coatings. Too high
concentration of pigments may lead to insufficient amount of binding material to properly wet out the
pigments which leads to a high agglomeration rate of pigment on the surface that will lead to a less
homogenic surface layer [30].
3.3.3 Transmission of Light
Transmission of light show similar physical event as reflection of light. However, in contrast to
reflection of light, the short-lived amplitude vibrations that occurs when light strikes the material and is
not absorbed, is instead transferred directly to atoms in the vicinity through the bulk of the material and
eventually re-radiated on the other side of the material. This give rise to a transparent appearance of the
material [30].
3.4 Chemical Composition of Cool Coatings Cool coatings consist mainly of four different components; binder, solvent, additives and NIR-reflective
pigments. NIR-reflective pigments can be divided in to several different subgroups. However, in this
thesis, the focus will be on discussing two different NIR reflective pigment types that achieve similar
thermal properties but give rise to different color sensation.
3.4.1 Binder, Solvent and Additives
The main purpose of the binding material inside cool coatings is to form a continues film on the surface
being coated on. Furthermore, the binding material is also responsible for allowing the pigments inside
the coating to form a uniformed dispersion and to hold the pigments in fixed position inside the coating
[16].
Binding material can consist of either inorganic or organic chemical species. A very common binding
material used for outdoor applications is based on acrylic polymer resins. Acrylic based binders have
proven to achieve exceptional resistance towards UV, chemical and thermal degradation which makes
them a strong candidate for outdoor applications. Furthermore, it is a very light material that is cheap to
manufacture. Acrylic polymers derive from acrylic and methacrylic monomers that may copolymerize
with other monomer resins such as styrene or alkyl esters to further modify the properties of the binding
material [16].
For a binding material to achieve good wetting properties it must achieve strong adhesion forces with
the substrate itself. This is accomplished by establishing a binder material that has a lower or equal
surface tension as the critical surface tension of the substrate it is supposed to wet on. The critical surface
tension is defined as the minimum surface tension needed by the binder material to completely wet the
substrate surface [16].
Solvent are volatile components added to the paint formulation to enhance the rheology properties of
the paint thus allowing the application process to be more effortless. When the paint is applied on the
substrate, the solvent is eventually evaporated, leaving behind a dissolved thin coating film. Solvents
can either be water or oil based depending on the coating technology used. However due to the increased
understanding of the negative impact of evaporated organic compounds reaching the atmosphere, paint
company today strive to fully substitute organic volatile compounds with water-based solvents [16].
Additives are a wide range of material that is added in small quantity to the paint formulation to further
enhance different properties such as mechanical and wetting stability. For instance, silicon oxide can be
added to further increase the weather resistances of the paint formulation [16].
3.4.2 NIR-reflective Inorganic Pigments
Inorganic NIR-reflective pigments are pigments that are commonly made of metal oxides. They are
insoluble in their surrounding material and imparts color and cooling property to paint formulations and
coatings [22]. One of the most commercialized inorganic NIR reflective pigment is TiO2 in natural rutile
phase. Even though rutile TiO2 has been reported to achieve up to 87% reflectivity in the NIR region of
11
light, its use and applicability is restricted due to its coloristic limitation as it only imparts white color
to paints. [22].
Previous studies have explored the formation of NIR reflective pigments that imparts a broad spectrum
of color to coatings. These pigments are called NIR-reflective complex inorganic pigments (NIR-CICP).
The optical properties for these pigments are based on the classical theory of light-matter interaction
described in previous section of the theory part in this thesis. The NIR-CCIP consist of different metals
or metal oxides that when mixed together forms intrinsic optical properties that selectively absorb
specific wavelength of visible light while simultaneously achieving high reflectivity in the NIR spectra
of light, thus introducing cooling properties to the paint while still allowing a broad spectrum of color
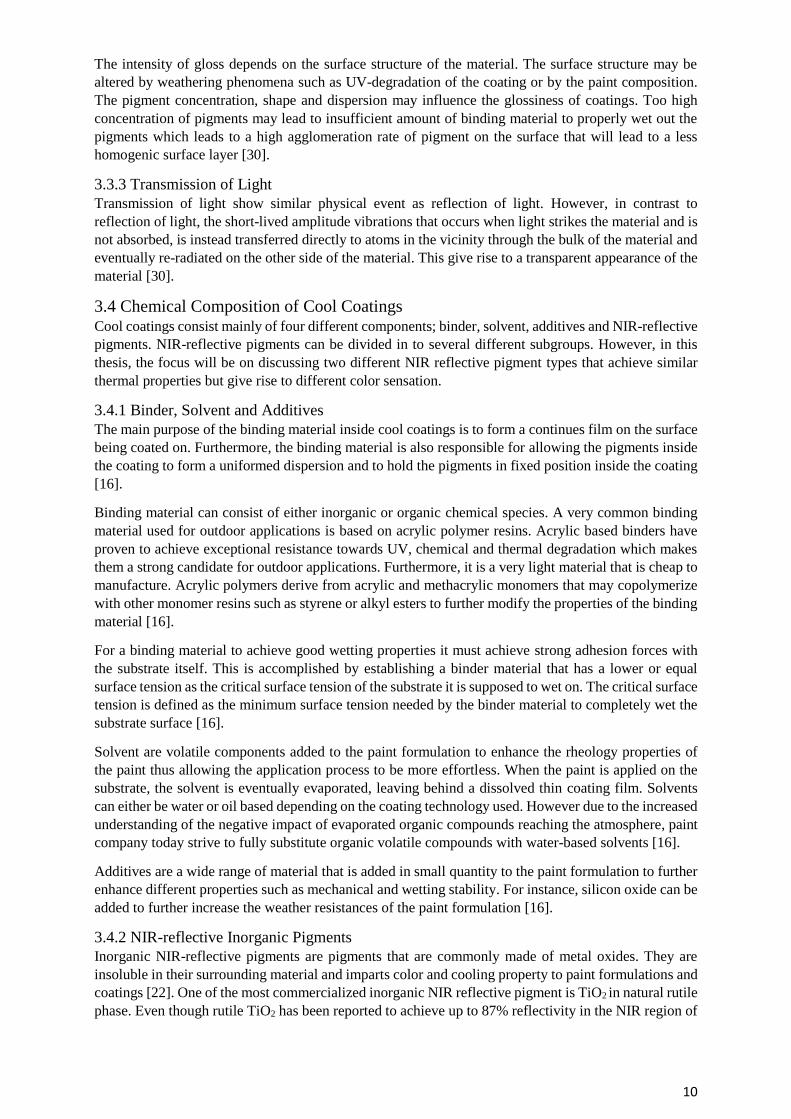
to be shaped. For instance, color in NIR-CCIP can be achieved by doping TiO2 rutile together with
different metal compounds. Yellow 59 is a strong NIR reflective pigment that is synthesized by inter
diffusion of nickel and antimony in to a TiO2 host element via solid state reaction, which produces a
shady yellow color pigment with high mechanical stability and reflection of NIR-light [23].
Figure 3.6. Unit cell of rutile TiO2. Ti atoms are depicted as white dots and oxygen as red dots [24].
However, implementing TiO2 particles in paints leads to limited options for darker colors. To achieve
darker tones of color, several different CCIP with high NIR reflectivity have been developed by mixing
metal oxides in a solid-state solution. For instance, mixing Cr and Fe oxides have proven to achieve
very high NIR reflectivity while forming a very dark color [23]. [8] managed to synthesize brown
colored pigment based on Cr2O3–Fe2O3 with NIR reflectivity that exceeded over 50% NIR-reflectivity.
They made a cooling load estimation calculation, that considered radiation flow to a building due to
absorption of light on the roof panels, by comparing conventional brown coating with cool coatings
containing the newly formed NIR reflective synthesized pigment. The coatings were applied as a top
coating on roof panels for real scale house models at different geographical locations in Iran. The results
concluded that by substituting the conventional brown coating with the cool coating, the annual energy
saving was approximated to be between 6-14 % depending on the geographical location. The maximum
annual reduction of energy solely due to the use of air condition was reduced by 1148 KW/h for a
Mediterranean climate, thus significantly reducing the energy cost and emission rate of greenhouse
gases [8].
3.5 Refraction Index Not all light is directly absorbed or reflected at the top surface of materials. This is also true for NIR
reflective coatings based on NIR-CCIP pigments. The distance the light must travel inside the coating
material before re-emerging to the surface highly determines the coatings cooling ability. An important
parameter that will have an impact on the total reflection of cool coatings is the ratio of the refraction
index between binder and pigment material inside the coating [33].
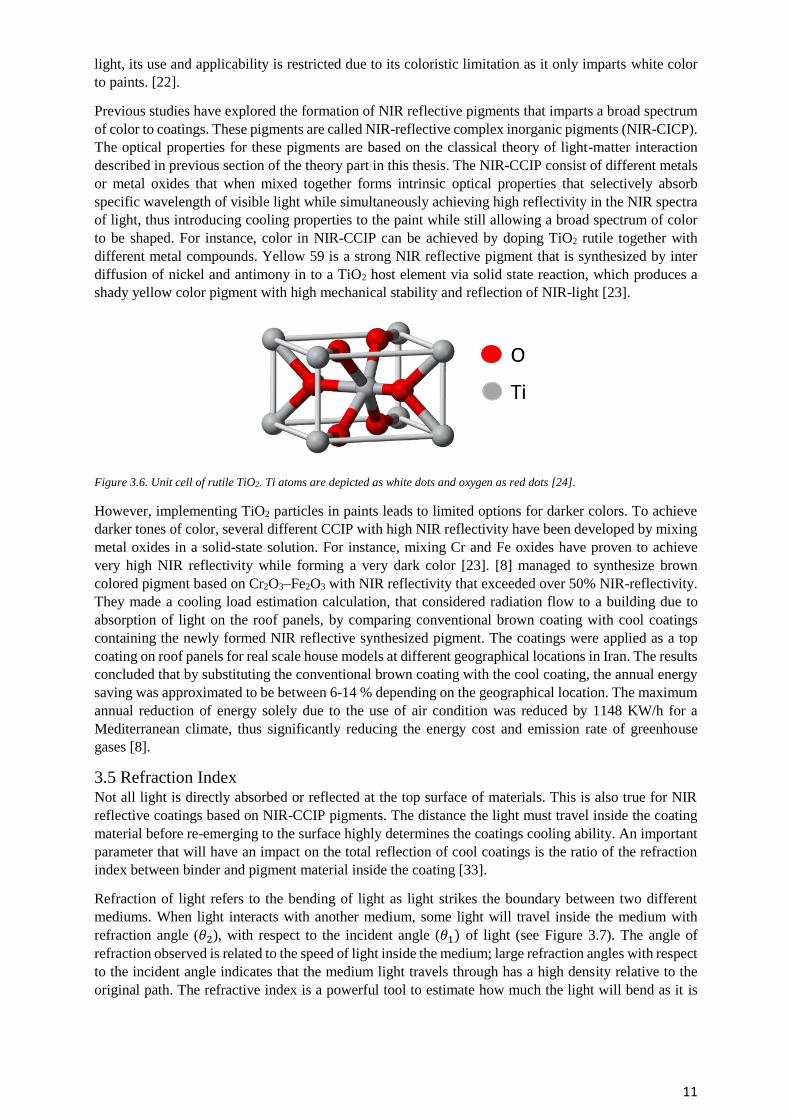
Refraction of light refers to the bending of light as light strikes the boundary between two different
mediums. When light interacts with another medium, some light will travel inside the medium with
refraction angle (𝜃2), with respect to the incident angle (𝜃1) of light (see Figure 3.7). The angle of
refraction observed is related to the speed of light inside the medium; large refraction angles with respect
to the incident angle indicates that the medium light travels through has a high density relative to the
original path. The refractive index is a powerful tool to estimate how much the light will bend as it is
12
introduced to another material. The index of refraction can be described with the following equation
[33,34,35]:
n =c
v (5)
Where n is the refraction index and is expressed as the ratio of speed light in vacuum, c, and the speed
of light inside the material,v. For instance, if a material has refraction index of 2 it means that light
travels twice as fast in vacuum than in that medium. The angle of refraction due to different speed of
light in mediums can be calculated using Snell’s law of refraction [34,35]:
𝑆𝑖𝑛(θ2)
𝑆𝑖𝑛(θ1)=
𝑣2
𝑣1 =
𝑛1
𝑛2 (6)
Figure 3.7. Angle of refraction. n is equal to the refraction index of the medium and v represents the speed of light of the two
different mediums [36].
Were n stands for refraction index of the two mediums. From this equation one can understand that the
bending of light between two mediums is increased if the ratio of refraction index between the two
materials is large.
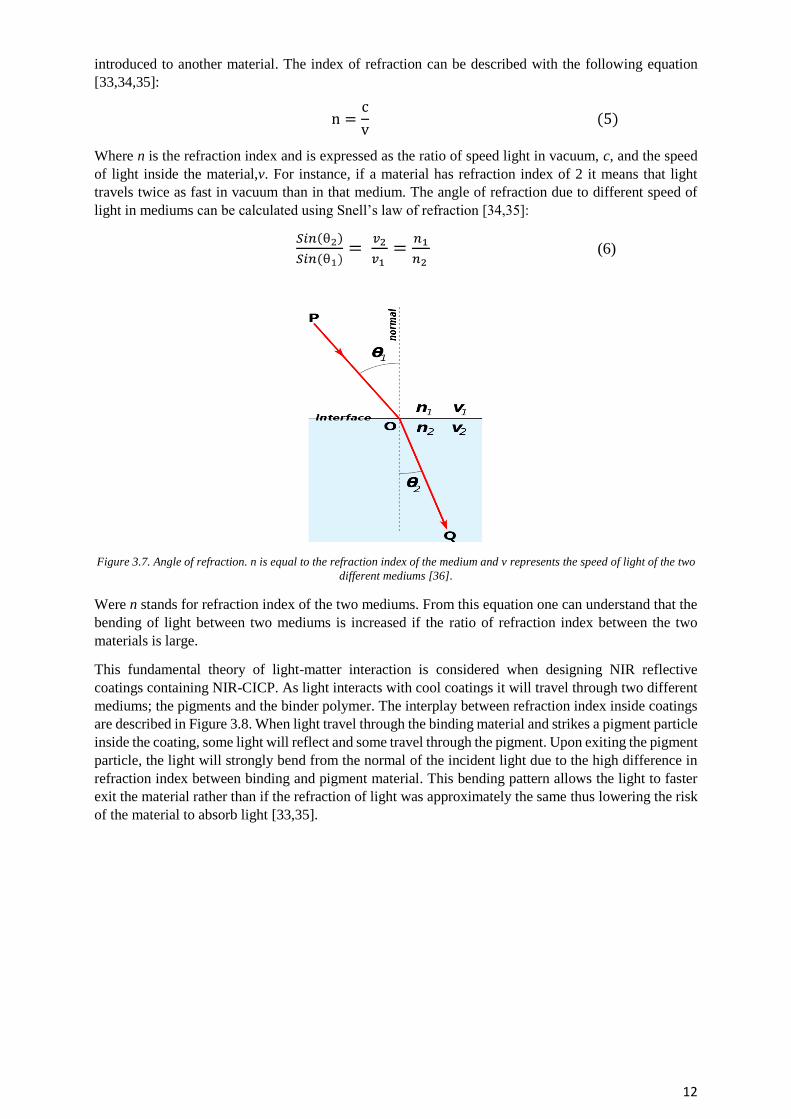
This fundamental theory of light-matter interaction is considered when designing NIR reflective
coatings containing NIR-CICP. As light interacts with cool coatings it will travel through two different
mediums; the pigments and the binder polymer. The interplay between refraction index inside coatings
are described in Figure 3.8. When light travel through the binding material and strikes a pigment particle
inside the coating, some light will reflect and some travel through the pigment. Upon exiting the pigment
particle, the light will strongly bend from the normal of the incident light due to the high difference in
refraction index between binding and pigment material. This bending pattern allows the light to faster
exit the material rather than if the refraction of light was approximately the same thus lowering the risk
of the material to absorb light [33,35].
13
Figure 3.8. Schematic figure showing the importance of the relationship between refraction index of binding material and
pigment for cool coating applications. a) refraction index is similar between pigment and binding material b) refraction index
for pigment is significantly larger than for the binding material.
3.6 Pigment Size The pigment size has shown to play a part when discussing reflection of light in cool coatings. According
to [22], a good rule of thumb for the optimal pigment size for achieving high NIR reflection is to form
pigments that approximately are half the size of the wavelength intended to reflect [22].
From this statement it is understood that it is difficult to form high opacity in both NIR and visible part
of light. By optimizing the pigment diameter for high NIR reflectivity, the intentional colour of the
material may be altered and lead to aesthetical failure. A balance of optimal thermal properties and
aesthetical properties is always considered when designing NIR reflective inorganic pigments [22,33].
3.7 Special-Effect Pigments for Cool Coating Application The NIR-CCIP pigments described in previous section imparts color via classic light-matter interaction
phenomena that forms a one-dimensional color sensation. However, three-dimensional color sensation
and NIR reflective pigments can also be achieved using so called special-effect pigment that alters the
depicted color depending on the viewing angle, incident angle of the light and the color of the
background material due to a complex light ray interference which gives rise to the so-called pearlescent
effect [23].
Special-effect pigments are commonly used for decorative enhancements in vehicles and infrastructures.
However, the development of these pigments has led to its usage in cooling applications as well. The
reflectivity of NIR light follows the same fundamental theory described for the NIR-CCIP pigment.
However, the color sensation and interaction with VIS light differs significantly. These unique pigments
may have very high transparency in VIS light, allowing VIS light to enter the interior part of the substrate
while still obtaining high reflectivity in NIR region of light spectra thus achieving great cooling
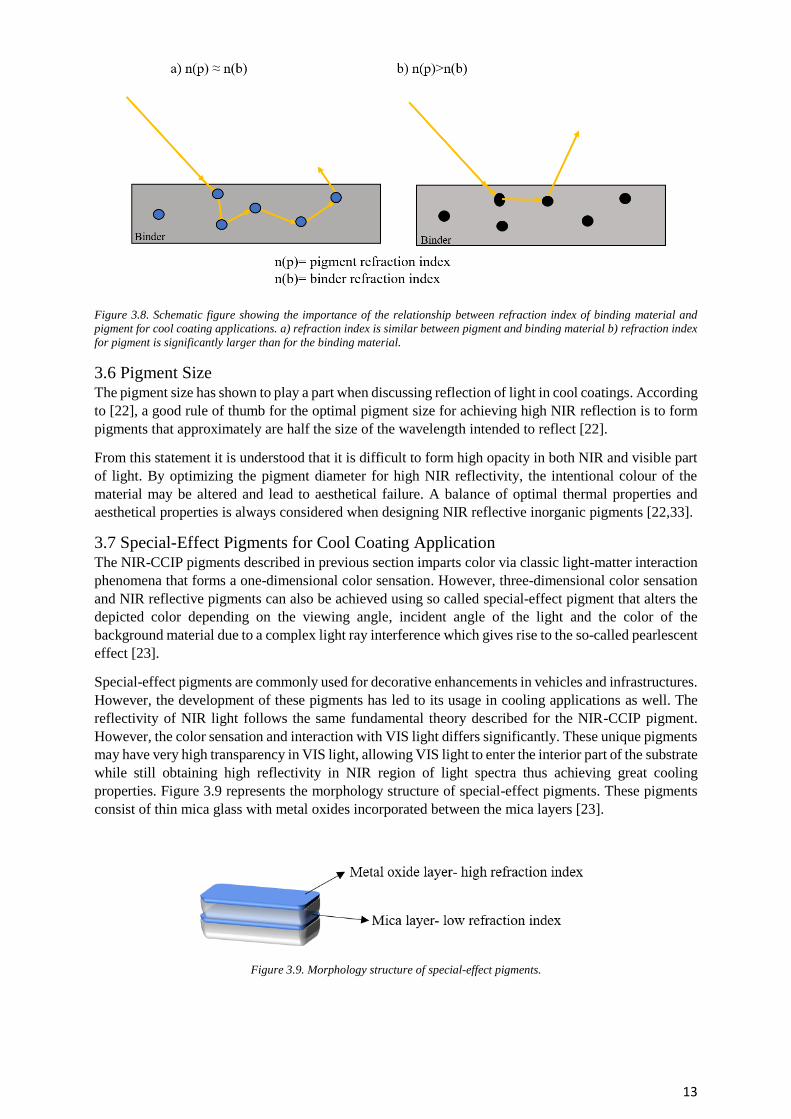
properties. Figure 3.9 represents the morphology structure of special-effect pigments. These pigments
consist of thin mica glass with metal oxides incorporated between the mica layers [23].
Figure 3.9. Morphology structure of special-effect pigments.
14
Mica is a natural material that exhibit a platelet morphology structure. Natural mica is based on silicon
oxide that exhibit a very low refraction index in the visible part of light which allows high amount of
visible light to be transmitted through the structure. The thin metal oxide layer incorporated in special-
effect pigments between the mica layer has a high refractive index and it is this very high structured
alternation of refractive index upon interphases in the pigment that develops a 3-D color sensation to
the coating material.
When light strikes the surface of a special-effect pigment some light will be reflected by the metal oxide
layer and some light will be transmit through the metal oxide layer and the mica platelet structure layer.
A multilayer of these special pigments incorporated in coatings forms a partial reflection pattern that
produces an in-depth color impression. The reflective light from each multilayer emerges out from the
coating parallel to each other but with different wave phases relative to each other. The phase shift of
the EM-wave is directly proportional to the thickness of the pigment and the angle of incident light.
When the light emerges out from the coating material they may re-emerge in a constructive or
destructive way depending on the phase shift formed when interacting with the pigments. If a
constructive interference is formed, the specific wavelength will increase in amplitude and the color
corresponding to that wavelength will be dominant at that angle. If, however a destructive interference
occurs the reflected light will not be visualized as effectively, and the transmitted light will instead be
dominant. Thus, by alternating the viewing angle, different color sensation of the pigment can be
achieved.
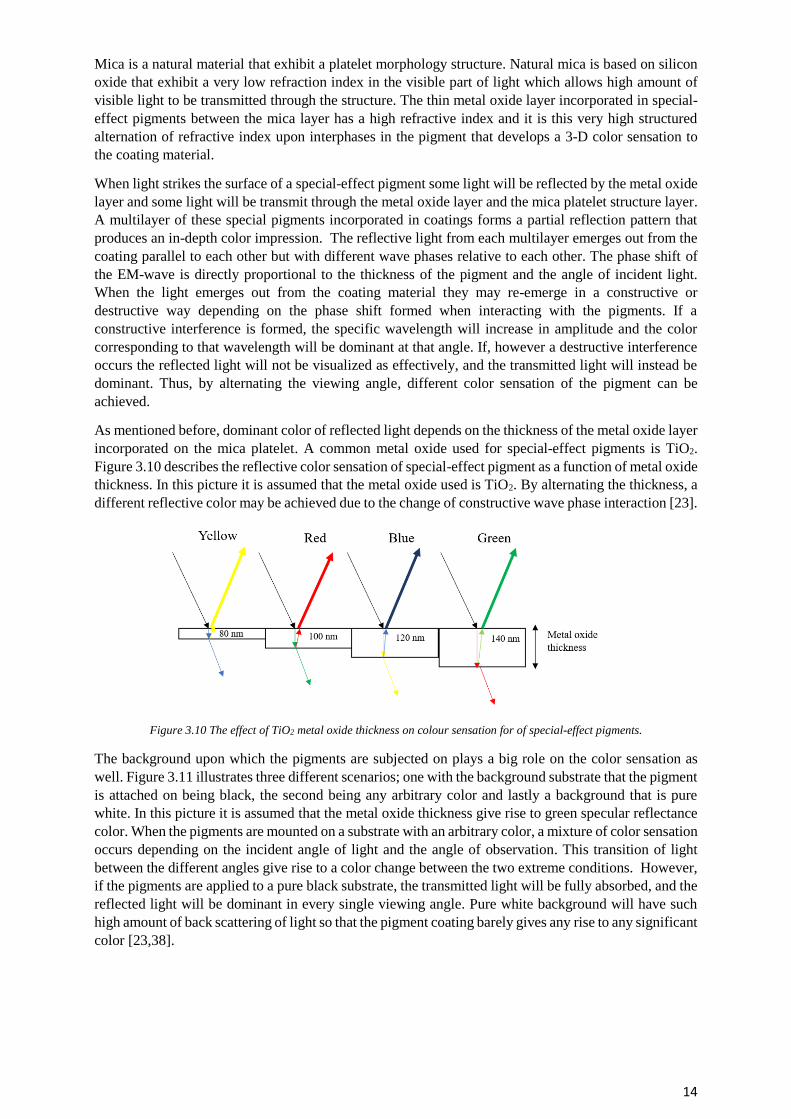
As mentioned before, dominant color of reflected light depends on the thickness of the metal oxide layer
incorporated on the mica platelet. A common metal oxide used for special-effect pigments is TiO2.
Figure 3.10 describes the reflective color sensation of special-effect pigment as a function of metal oxide
thickness. In this picture it is assumed that the metal oxide used is TiO2. By alternating the thickness, a
different reflective color may be achieved due to the change of constructive wave phase interaction [23].
Figure 3.10 The effect of TiO2 metal oxide thickness on colour sensation for of special-effect pigments.
The background upon which the pigments are subjected on plays a big role on the color sensation as
well. Figure 3.11 illustrates three different scenarios; one with the background substrate that the pigment
is attached on being black, the second being any arbitrary color and lastly a background that is pure
white. In this picture it is assumed that the metal oxide thickness give rise to green specular reflectance
color. When the pigments are mounted on a substrate with an arbitrary color, a mixture of color sensation
occurs depending on the incident angle of light and the angle of observation. This transition of light
between the different angles give rise to a color change between the two extreme conditions. However,
if the pigments are applied to a pure black substrate, the transmitted light will be fully absorbed, and the
reflected light will be dominant in every single viewing angle. Pure white background will have such
high amount of back scattering of light so that the pigment coating barely gives any rise to any significant
color [23,38].
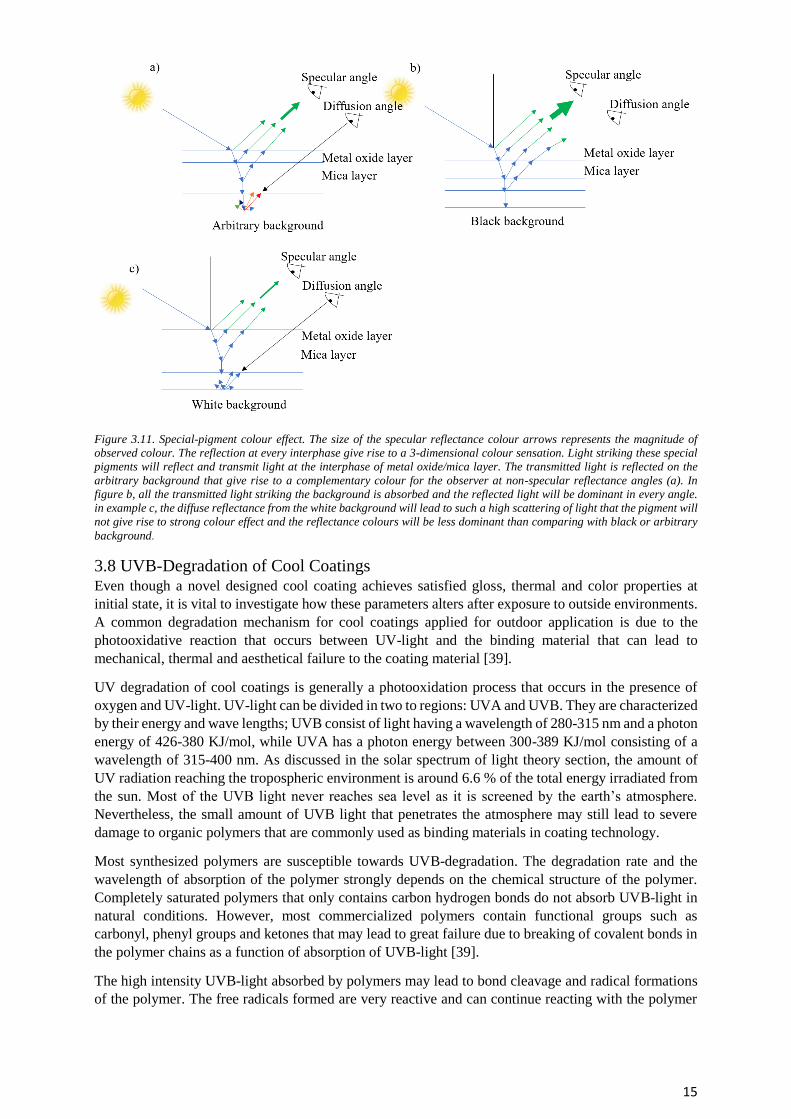
15
Figure 3.11. Special-pigment colour effect. The size of the specular reflectance colour arrows represents the magnitude of
observed colour. The reflection at every interphase give rise to a 3-dimensional colour sensation. Light striking these special
pigments will reflect and transmit light at the interphase of metal oxide/mica layer. The transmitted light is reflected on the
arbitrary background that give rise to a complementary colour for the observer at non-specular reflectance angles (a). In
figure b, all the transmitted light striking the background is absorbed and the reflected light will be dominant in every angle.
in example c, the diffuse reflectance from the white background will lead to such a high scattering of light that the pigment will
not give rise to strong colour effect and the reflectance colours will be less dominant than comparing with black or arbitrary
background.
3.8 UVB-Degradation of Cool Coatings Even though a novel designed cool coating achieves satisfied gloss, thermal and color properties at
initial state, it is vital to investigate how these parameters alters after exposure to outside environments.
A common degradation mechanism for cool coatings applied for outdoor application is due to the
photooxidative reaction that occurs between UV-light and the binding material that can lead to
mechanical, thermal and aesthetical failure to the coating material [39].
UV degradation of cool coatings is generally a photooxidation process that occurs in the presence of
oxygen and UV-light. UV-light can be divided in two to regions: UVA and UVB. They are characterized
by their energy and wave lengths; UVB consist of light having a wavelength of 280-315 nm and a photon
energy of 426-380 KJ/mol, while UVA has a photon energy between 300-389 KJ/mol consisting of a
wavelength of 315-400 nm. As discussed in the solar spectrum of light theory section, the amount of
UV radiation reaching the tropospheric environment is around 6.6 % of the total energy irradiated from
the sun. Most of the UVB light never reaches sea level as it is screened by the earth’s atmosphere.
Nevertheless, the small amount of UVB light that penetrates the atmosphere may still lead to severe
damage to organic polymers that are commonly used as binding materials in coating technology.
Most synthesized polymers are susceptible towards UVB-degradation. The degradation rate and the
wavelength of absorption of the polymer strongly depends on the chemical structure of the polymer.
Completely saturated polymers that only contains carbon hydrogen bonds do not absorb UVB-light in
natural conditions. However, most commercialized polymers contain functional groups such as
carbonyl, phenyl groups and ketones that may lead to great failure due to breaking of covalent bonds in
the polymer chains as a function of absorption of UVB-light [39].
The high intensity UVB-light absorbed by polymers may lead to bond cleavage and radical formations
of the polymer. The free radicals formed are very reactive and can continue reacting with the polymer
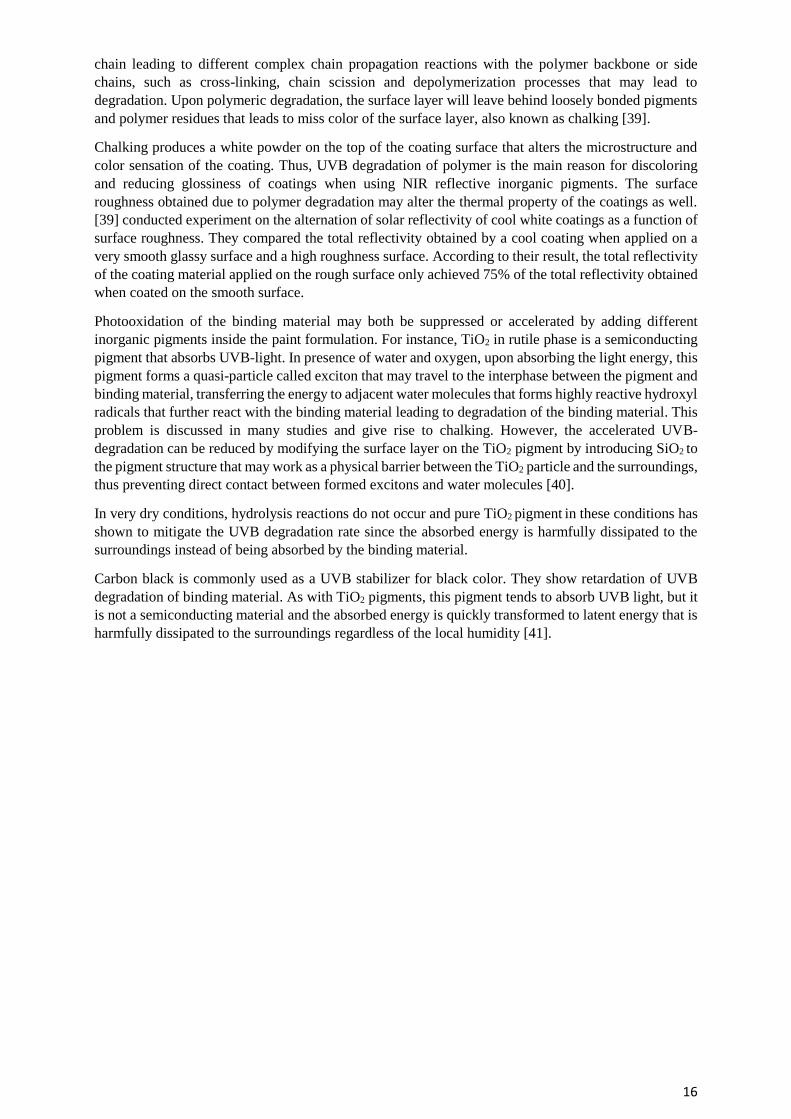
16
chain leading to different complex chain propagation reactions with the polymer backbone or side
chains, such as cross-linking, chain scission and depolymerization processes that may lead to
degradation. Upon polymeric degradation, the surface layer will leave behind loosely bonded pigments
and polymer residues that leads to miss color of the surface layer, also known as chalking [39].
Chalking produces a white powder on the top of the coating surface that alters the microstructure and
color sensation of the coating. Thus, UVB degradation of polymer is the main reason for discoloring
and reducing glossiness of coatings when using NIR reflective inorganic pigments. The surface
roughness obtained due to polymer degradation may alter the thermal property of the coatings as well.
[39] conducted experiment on the alternation of solar reflectivity of cool white coatings as a function of
surface roughness. They compared the total reflectivity obtained by a cool coating when applied on a
very smooth glassy surface and a high roughness surface. According to their result, the total reflectivity
of the coating material applied on the rough surface only achieved 75% of the total reflectivity obtained
when coated on the smooth surface.
Photooxidation of the binding material may both be suppressed or accelerated by adding different
inorganic pigments inside the paint formulation. For instance, TiO2 in rutile phase is a semiconducting
pigment that absorbs UVB-light. In presence of water and oxygen, upon absorbing the light energy, this
pigment forms a quasi-particle called exciton that may travel to the interphase between the pigment and
binding material, transferring the energy to adjacent water molecules that forms highly reactive hydroxyl
radicals that further react with the binding material leading to degradation of the binding material. This
problem is discussed in many studies and give rise to chalking. However, the accelerated UVB-
degradation can be reduced by modifying the surface layer on the TiO2 pigment by introducing SiO2 to
the pigment structure that may work as a physical barrier between the TiO2 particle and the surroundings,
thus preventing direct contact between formed excitons and water molecules [40].
In very dry conditions, hydrolysis reactions do not occur and pure TiO2 pigment in these conditions has
shown to mitigate the UVB degradation rate since the absorbed energy is harmfully dissipated to the
surroundings instead of being absorbed by the binding material.
Carbon black is commonly used as a UVB stabilizer for black color. They show retardation of UVB
degradation of binding material. As with TiO2 pigments, this pigment tends to absorb UVB light, but it
is not a semiconducting material and the absorbed energy is quickly transformed to latent energy that is
harmfully dissipated to the surroundings regardless of the local humidity [41].
17
Chapter IV
4. Characterization Techniques In this thesis, the following characterisation instruments were used:
• Scanning electron microscopy (SEM)
• Colorimetry
• Glossmeter
• Fourier transform- Infrared spectroscopy (FTIR)
• Powder X-ray diffraction (PXDR)
A short description of the fundamental theory of the different instruments is presented in the section
below. The thermal measurement technique used in this thesis is described in the experimental section.
4.1 Scanning Electron Microscopy (SEM) Scanning electron microscopy (SEM) is a commonly used analytical instrument for analysing
morphology, surface and chemical properties of materials. A schematic description of a SEM instrument
is depicted in Figure 4.1. A charged electron beam is generated by an electron source that is commonly
made by a tungsten filament. Thermal energy is applied to the filament until the surface potential of the
filament is reached, leading to high emission of electrons from the filament itself, commonly obtaining
an energy of 20 – 50Kv. The emitted electrons are directed towards the sample and scanned on the
surface in a raster pattern. The interaction between the emitted electrons and the surface of the sample
is what essentially leads to a surface image formation. The interaction with the beam electron and sample
leads to different SEM-images depending on the detection mode that is used. The different detection
mode and interaction phenomena is described in the text below [42]:
Figure 4.1. Fundamental parts of a SEM instrument. An electron beam is targeting the sample that upon interaction leads to
different events that can be detected and used for creating an image of the surface and chemical analysis of the sample with
high spatial and temporal resolution.
• Secondary electron (SE) detection mode is commonly used when a high spatial resolution within
nano-meter range of the surface layer is desired. A schematic picture for this detection mode is
shown in Figure 4.2. When the beam electron is subjected to the sample, they may impart some
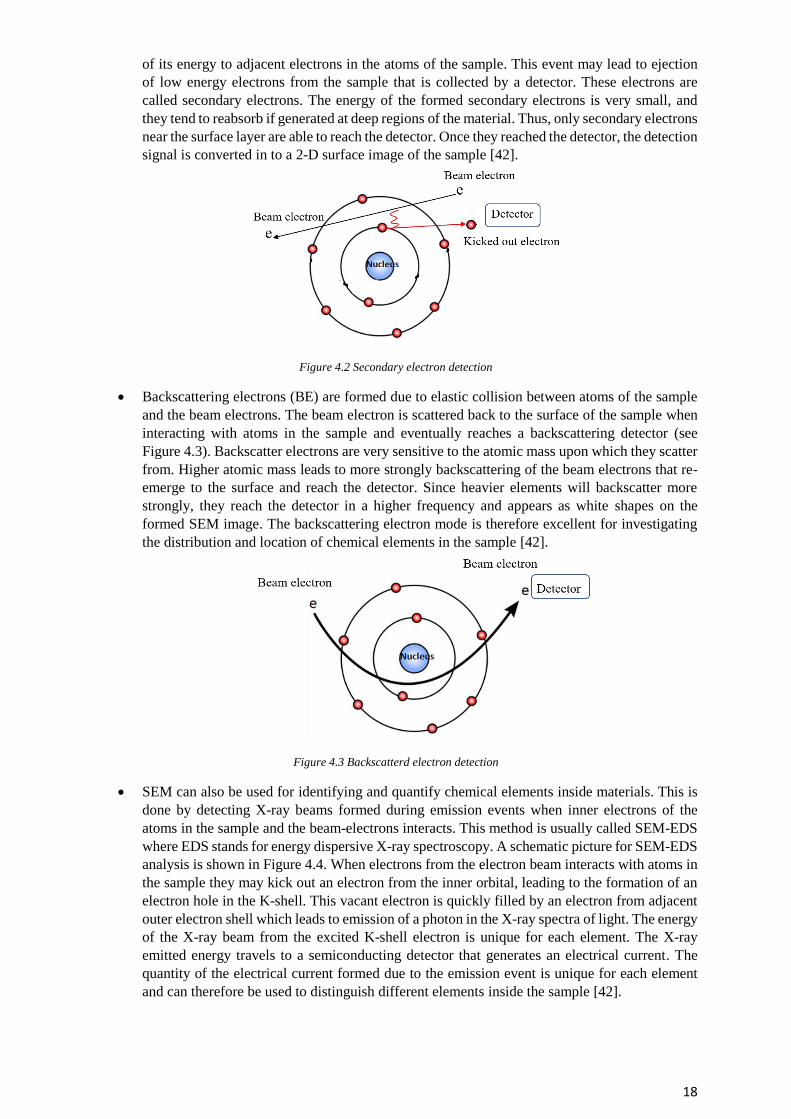
18
of its energy to adjacent electrons in the atoms of the sample. This event may lead to ejection
of low energy electrons from the sample that is collected by a detector. These electrons are
called secondary electrons. The energy of the formed secondary electrons is very small, and
they tend to reabsorb if generated at deep regions of the material. Thus, only secondary electrons
near the surface layer are able to reach the detector. Once they reached the detector, the detection
signal is converted in to a 2-D surface image of the sample [42].
Figure 4.2 Secondary electron detection
• Backscattering electrons (BE) are formed due to elastic collision between atoms of the sample
and the beam electrons. The beam electron is scattered back to the surface of the sample when
interacting with atoms in the sample and eventually reaches a backscattering detector (see
Figure 4.3). Backscatter electrons are very sensitive to the atomic mass upon which they scatter
from. Higher atomic mass leads to more strongly backscattering of the beam electrons that re-
emerge to the surface and reach the detector. Since heavier elements will backscatter more
strongly, they reach the detector in a higher frequency and appears as white shapes on the
formed SEM image. The backscattering electron mode is therefore excellent for investigating
the distribution and location of chemical elements in the sample [42].
Figure 4.3 Backscatterd electron detection
• SEM can also be used for identifying and quantify chemical elements inside materials. This is
done by detecting X-ray beams formed during emission events when inner electrons of the
atoms in the sample and the beam-electrons interacts. This method is usually called SEM-EDS
where EDS stands for energy dispersive X-ray spectroscopy. A schematic picture for SEM-EDS
analysis is shown in Figure 4.4. When electrons from the electron beam interacts with atoms in
the sample they may kick out an electron from the inner orbital, leading to the formation of an
electron hole in the K-shell. This vacant electron is quickly filled by an electron from adjacent
outer electron shell which leads to emission of a photon in the X-ray spectra of light. The energy
of the X-ray beam from the excited K-shell electron is unique for each element. The X-ray
emitted energy travels to a semiconducting detector that generates an electrical current. The
quantity of the electrical current formed due to the emission event is unique for each element
and can therefore be used to distinguish different elements inside the sample [42].
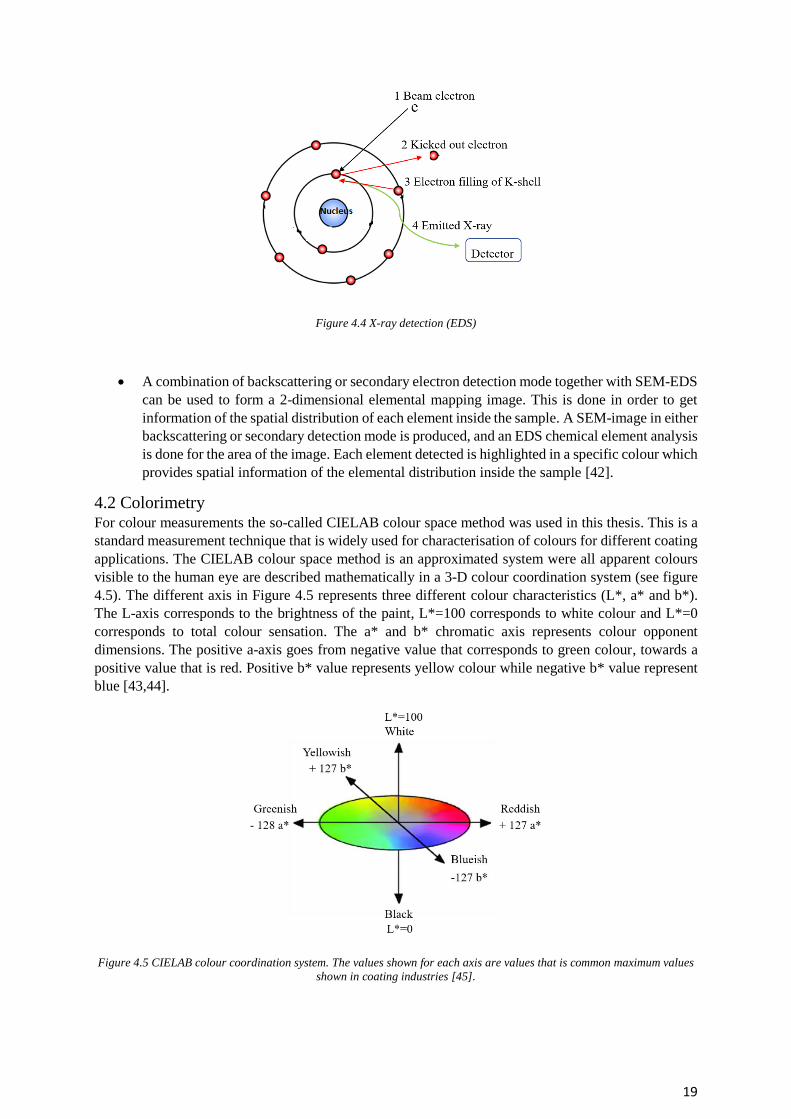
19
Figure 4.4 X-ray detection (EDS)
• A combination of backscattering or secondary electron detection mode together with SEM-EDS
can be used to form a 2-dimensional elemental mapping image. This is done in order to get
information of the spatial distribution of each element inside the sample. A SEM-image in either
backscattering or secondary detection mode is produced, and an EDS chemical element analysis
is done for the area of the image. Each element detected is highlighted in a specific colour which
provides spatial information of the elemental distribution inside the sample [42].
4.2 Colorimetry For colour measurements the so-called CIELAB colour space method was used in this thesis. This is a
standard measurement technique that is widely used for characterisation of colours for different coating
applications. The CIELAB colour space method is an approximated system were all apparent colours
visible to the human eye are described mathematically in a 3-D colour coordination system (see figure
4.5). The different axis in Figure 4.5 represents three different colour characteristics (L*, a* and b*).
The L-axis corresponds to the brightness of the paint, L*=100 corresponds to white colour and L*=0
corresponds to total colour sensation. The a* and b* chromatic axis represents colour opponent
dimensions. The positive a-axis goes from negative value that corresponds to green colour, towards a
positive value that is red. Positive b* value represents yellow colour while negative b* value represent
blue [43,44].
Figure 4.5 CIELAB colour coordination system. The values shown for each axis are values that is common maximum values
shown in coating industries [45].
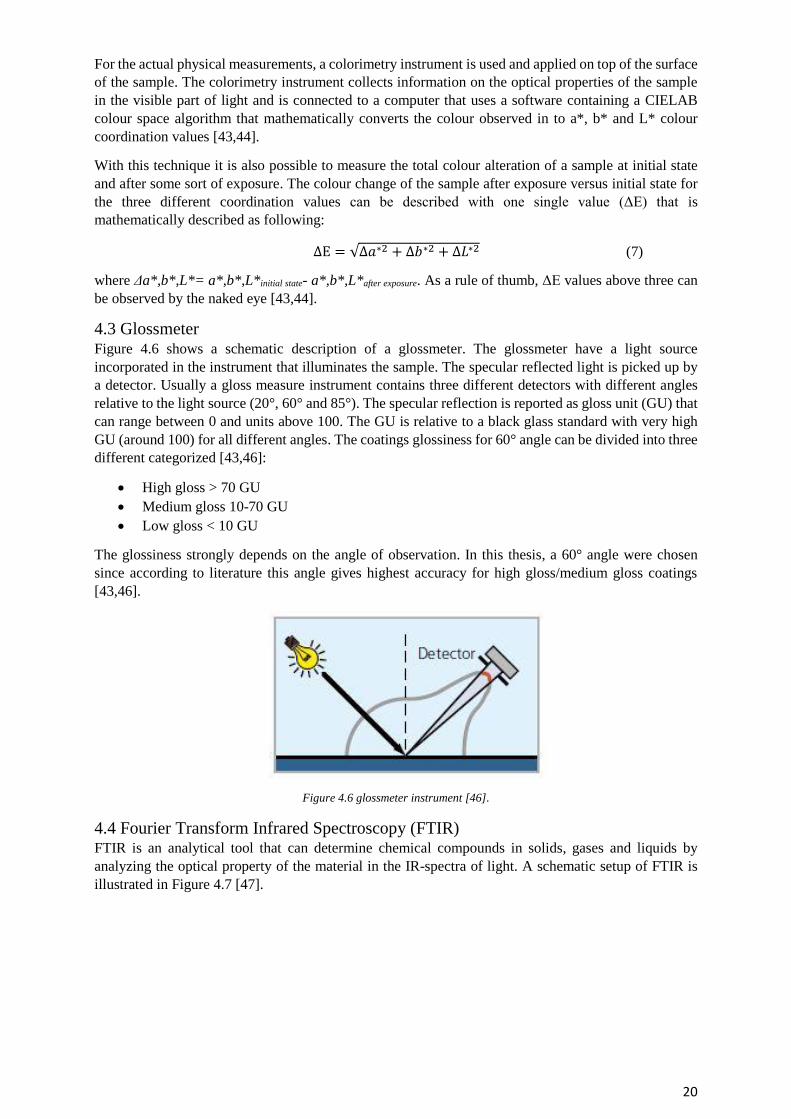
20
For the actual physical measurements, a colorimetry instrument is used and applied on top of the surface
of the sample. The colorimetry instrument collects information on the optical properties of the sample
in the visible part of light and is connected to a computer that uses a software containing a CIELAB
colour space algorithm that mathematically converts the colour observed in to a*, b* and L* colour
coordination values [43,44].
With this technique it is also possible to measure the total colour alteration of a sample at initial state
and after some sort of exposure. The colour change of the sample after exposure versus initial state for
the three different coordination values can be described with one single value (ΔE) that is
mathematically described as following:
ΔE = √Δ𝑎∗2 + Δ𝑏∗2 + Δ𝐿∗2 (7)
where Δa*,b*,L*= a*,b*,L*initial state- a*,b*,L*after exposure. As a rule of thumb, ΔE values above three can
be observed by the naked eye [43,44].
4.3 Glossmeter Figure 4.6 shows a schematic description of a glossmeter. The glossmeter have a light source
incorporated in the instrument that illuminates the sample. The specular reflected light is picked up by
a detector. Usually a gloss measure instrument contains three different detectors with different angles
relative to the light source (20°, 60° and 85°). The specular reflection is reported as gloss unit (GU) that
can range between 0 and units above 100. The GU is relative to a black glass standard with very high
GU (around 100) for all different angles. The coatings glossiness for 60° angle can be divided into three
different categorized [43,46]:
• High gloss > 70 GU
• Medium gloss 10-70 GU
• Low gloss < 10 GU
The glossiness strongly depends on the angle of observation. In this thesis, a 60° angle were chosen
since according to literature this angle gives highest accuracy for high gloss/medium gloss coatings
[43,46].
Figure 4.6 glossmeter instrument [46].
4.4 Fourier Transform Infrared Spectroscopy (FTIR) FTIR is an analytical tool that can determine chemical compounds in solids, gases and liquids by
analyzing the optical property of the material in the IR-spectra of light. A schematic setup of FTIR is
illustrated in Figure 4.7 [47].
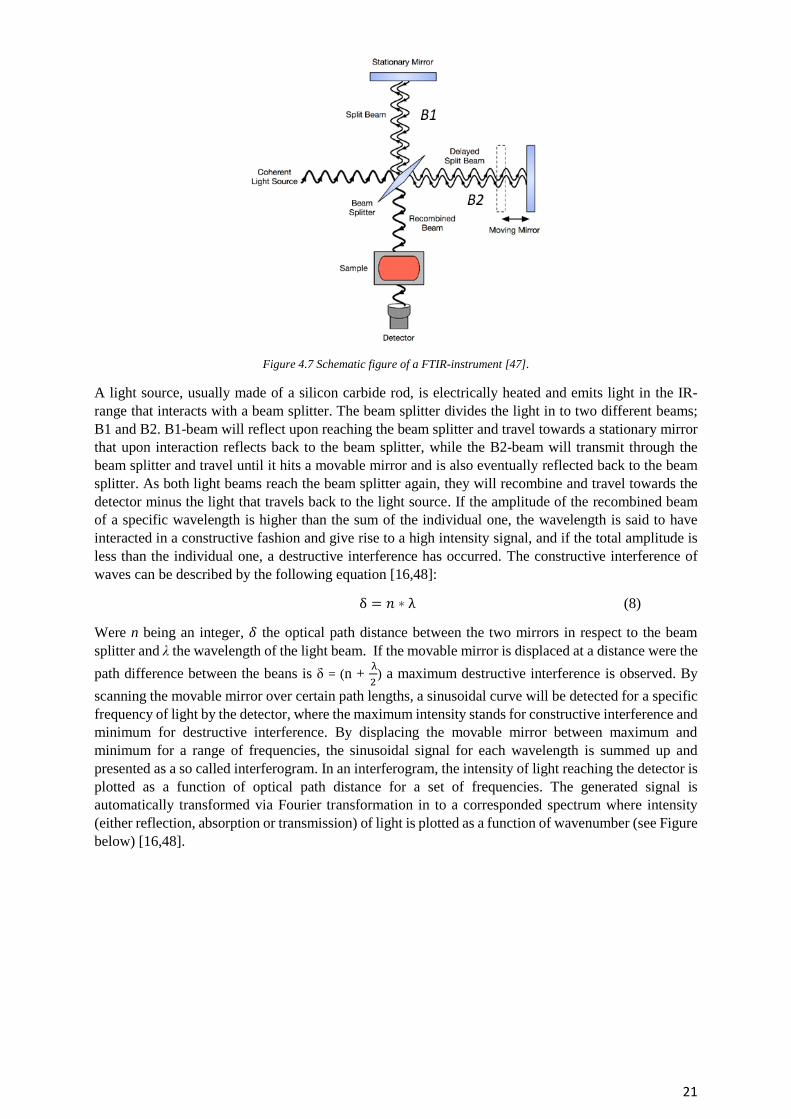
21
Figure 4.7 Schematic figure of a FTIR-instrument [47].
A light source, usually made of a silicon carbide rod, is electrically heated and emits light in the IR-
range that interacts with a beam splitter. The beam splitter divides the light in to two different beams;
B1 and B2. B1-beam will reflect upon reaching the beam splitter and travel towards a stationary mirror
that upon interaction reflects back to the beam splitter, while the B2-beam will transmit through the
beam splitter and travel until it hits a movable mirror and is also eventually reflected back to the beam
splitter. As both light beams reach the beam splitter again, they will recombine and travel towards the
detector minus the light that travels back to the light source. If the amplitude of the recombined beam
of a specific wavelength is higher than the sum of the individual one, the wavelength is said to have
interacted in a constructive fashion and give rise to a high intensity signal, and if the total amplitude is
less than the individual one, a destructive interference has occurred. The constructive interference of
waves can be described by the following equation [16,48]:
δ = 𝑛 ∗ λ (8)
Were n being an integer, 𝛿 the optical path distance between the two mirrors in respect to the beam
splitter and λ the wavelength of the light beam. If the movable mirror is displaced at a distance were the
path difference between the beans is δ = (n + λ
2) a maximum destructive interference is observed. By
scanning the movable mirror over certain path lengths, a sinusoidal curve will be detected for a specific
frequency of light by the detector, where the maximum intensity stands for constructive interference and
minimum for destructive interference. By displacing the movable mirror between maximum and
minimum for a range of frequencies, the sinusoidal signal for each wavelength is summed up and
presented as a so called interferogram. In an interferogram, the intensity of light reaching the detector is
plotted as a function of optical path distance for a set of frequencies. The generated signal is
automatically transformed via Fourier transformation in to a corresponded spectrum where intensity
(either reflection, absorption or transmission) of light is plotted as a function of wavenumber (see Figure
below) [16,48].
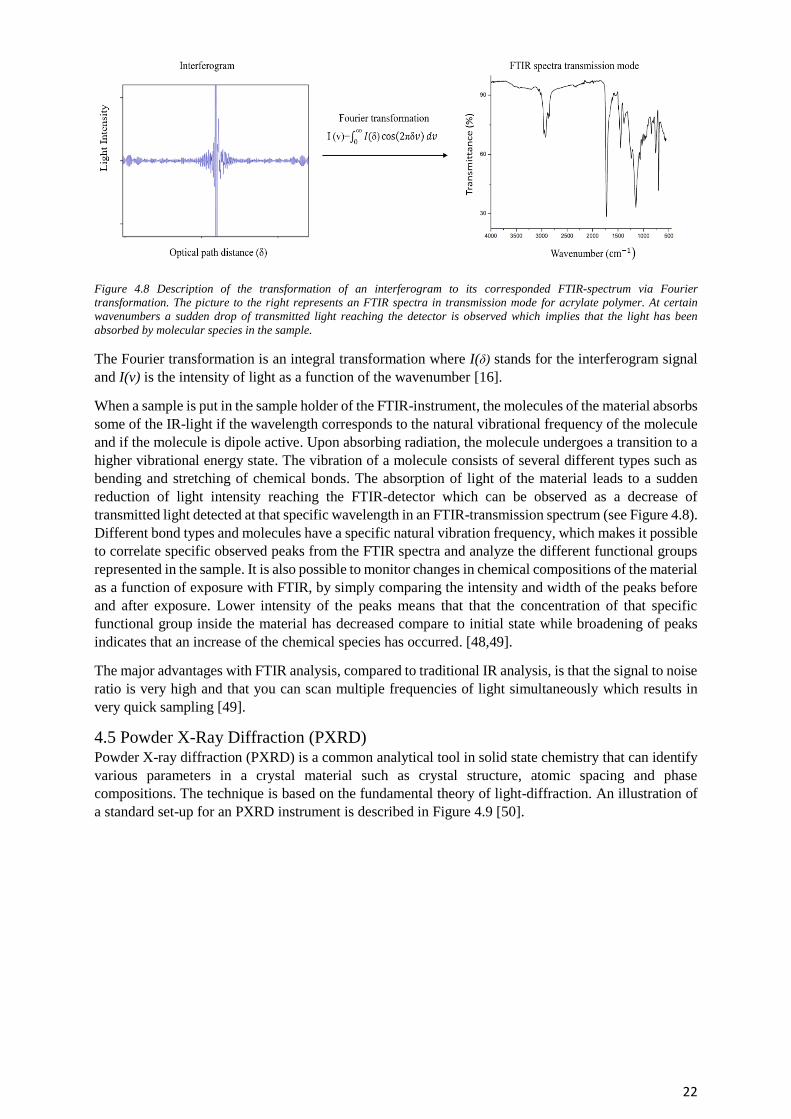
22
Figure 4.8 Description of the transformation of an interferogram to its corresponded FTIR-spectrum via Fourier
transformation. The picture to the right represents an FTIR spectra in transmission mode for acrylate polymer. At certain
wavenumbers a sudden drop of transmitted light reaching the detector is observed which implies that the light has been
absorbed by molecular species in the sample.
The Fourier transformation is an integral transformation where I(δ) stands for the interferogram signal
and I(v) is the intensity of light as a function of the wavenumber [16].
When a sample is put in the sample holder of the FTIR-instrument, the molecules of the material absorbs
some of the IR-light if the wavelength corresponds to the natural vibrational frequency of the molecule
and if the molecule is dipole active. Upon absorbing radiation, the molecule undergoes a transition to a
higher vibrational energy state. The vibration of a molecule consists of several different types such as
bending and stretching of chemical bonds. The absorption of light of the material leads to a sudden
reduction of light intensity reaching the FTIR-detector which can be observed as a decrease of
transmitted light detected at that specific wavelength in an FTIR-transmission spectrum (see Figure 4.8).
Different bond types and molecules have a specific natural vibration frequency, which makes it possible
to correlate specific observed peaks from the FTIR spectra and analyze the different functional groups
represented in the sample. It is also possible to monitor changes in chemical compositions of the material
as a function of exposure with FTIR, by simply comparing the intensity and width of the peaks before
and after exposure. Lower intensity of the peaks means that that the concentration of that specific
functional group inside the material has decreased compare to initial state while broadening of peaks
indicates that an increase of the chemical species has occurred. [48,49].
The major advantages with FTIR analysis, compared to traditional IR analysis, is that the signal to noise
ratio is very high and that you can scan multiple frequencies of light simultaneously which results in
very quick sampling [49].
4.5 Powder X-Ray Diffraction (PXRD) Powder X-ray diffraction (PXRD) is a common analytical tool in solid state chemistry that can identify
various parameters in a crystal material such as crystal structure, atomic spacing and phase
compositions. The technique is based on the fundamental theory of light-diffraction. An illustration of
a standard set-up for an PXRD instrument is described in Figure 4.9 [50].
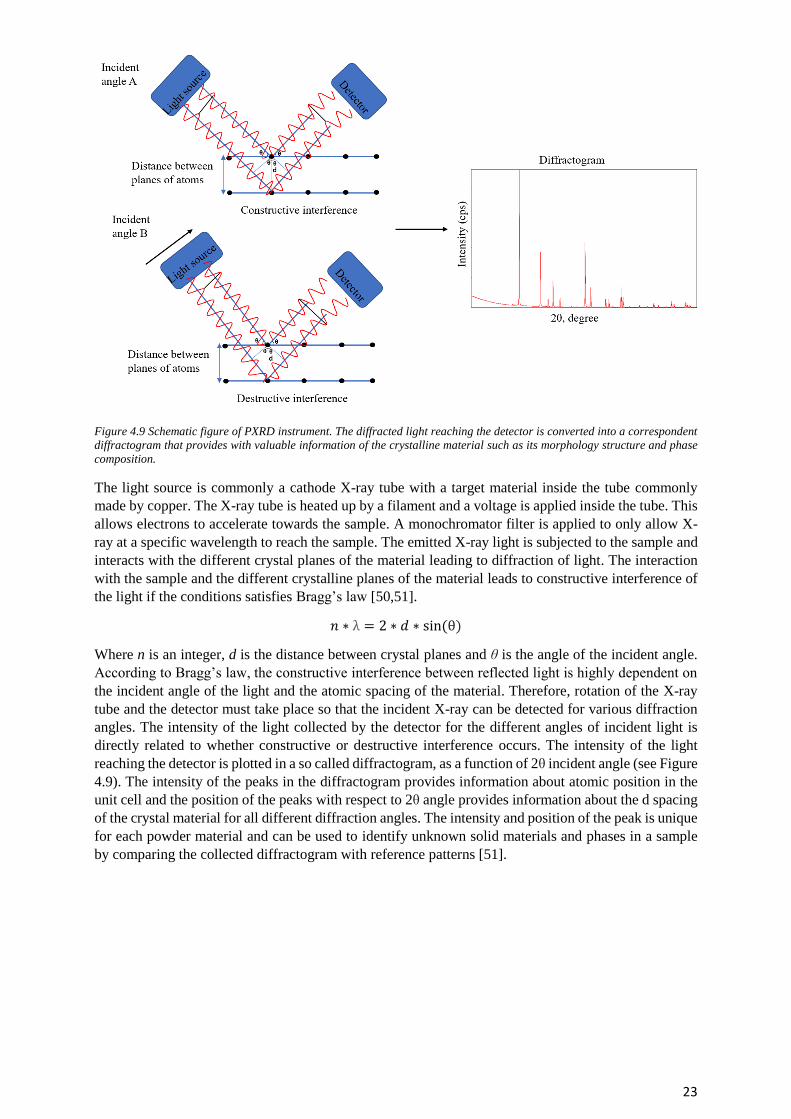
23
Figure 4.9 Schematic figure of PXRD instrument. The diffracted light reaching the detector is converted into a correspondent
diffractogram that provides with valuable information of the crystalline material such as its morphology structure and phase
composition.
The light source is commonly a cathode X-ray tube with a target material inside the tube commonly
made by copper. The X-ray tube is heated up by a filament and a voltage is applied inside the tube. This
allows electrons to accelerate towards the sample. A monochromator filter is applied to only allow X-
ray at a specific wavelength to reach the sample. The emitted X-ray light is subjected to the sample and
interacts with the different crystal planes of the material leading to diffraction of light. The interaction
with the sample and the different crystalline planes of the material leads to constructive interference of
the light if the conditions satisfies Bragg’s law [50,51].
𝑛 ∗ λ = 2 ∗ 𝑑 ∗ sin (θ)
Where n is an integer, d is the distance between crystal planes and θ is the angle of the incident angle.
According to Bragg’s law, the constructive interference between reflected light is highly dependent on
the incident angle of the light and the atomic spacing of the material. Therefore, rotation of the X-ray
tube and the detector must take place so that the incident X-ray can be detected for various diffraction
angles. The intensity of the light collected by the detector for the different angles of incident light is
directly related to whether constructive or destructive interference occurs. The intensity of the light
reaching the detector is plotted in a so called diffractogram, as a function of 2θ incident angle (see Figure
4.9). The intensity of the peaks in the diffractogram provides information about atomic position in the
unit cell and the position of the peaks with respect to 2θ angle provides information about the d spacing
of the crystal material for all different diffraction angles. The intensity and position of the peak is unique
for each powder material and can be used to identify unknown solid materials and phases in a sample
by comparing the collected diffractogram with reference patterns [51].
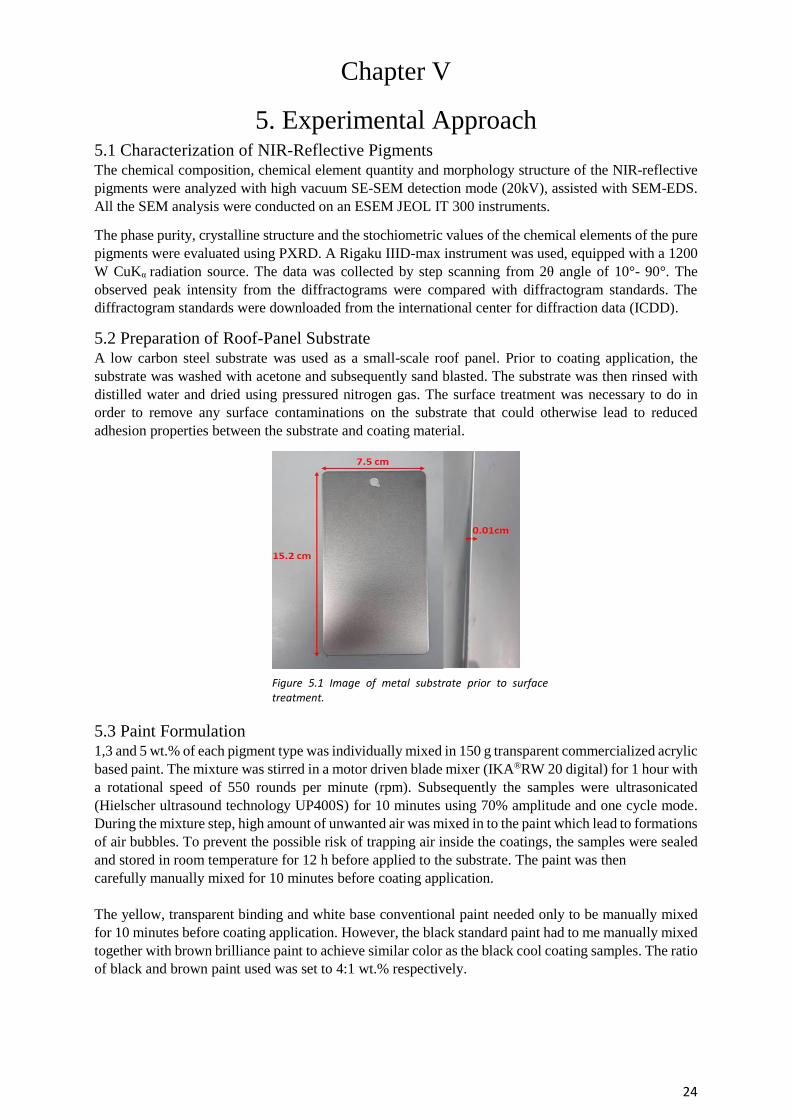
24
Chapter V
5. Experimental Approach 5.1 Characterization of NIR-Reflective Pigments The chemical composition, chemical element quantity and morphology structure of the NIR-reflective
pigments were analyzed with high vacuum SE-SEM detection mode (20kV), assisted with SEM-EDS.
All the SEM analysis were conducted on an ESEM JEOL IT 300 instruments.
The phase purity, crystalline structure and the stochiometric values of the chemical elements of the pure
pigments were evaluated using PXRD. A Rigaku IIID-max instrument was used, equipped with a 1200
W CuKα radiation source. The data was collected by step scanning from 2θ angle of 10°- 90°. The
observed peak intensity from the diffractograms were compared with diffractogram standards. The
diffractogram standards were downloaded from the international center for diffraction data (ICDD).
5.2 Preparation of Roof-Panel Substrate A low carbon steel substrate was used as a small-scale roof panel. Prior to coating application, the
substrate was washed with acetone and subsequently sand blasted. The substrate was then rinsed with
distilled water and dried using pressured nitrogen gas. The surface treatment was necessary to do in
order to remove any surface contaminations on the substrate that could otherwise lead to reduced
adhesion properties between the substrate and coating material.
5.3 Paint Formulation 1,3 and 5 wt.% of each pigment type was individually mixed in 150 g transparent commercialized acrylic
based paint. The mixture was stirred in a motor driven blade mixer (IKA®RW 20 digital) for 1 hour with
a rotational speed of 550 rounds per minute (rpm). Subsequently the samples were ultrasonicated
(Hielscher ultrasound technology UP400S) for 10 minutes using 70% amplitude and one cycle mode.
During the mixture step, high amount of unwanted air was mixed in to the paint which lead to formations
of air bubbles. To prevent the possible risk of trapping air inside the coatings, the samples were sealed
and stored in room temperature for 12 h before applied to the substrate. The paint was then
carefully manually mixed for 10 minutes before coating application.
The yellow, transparent binding and white base conventional paint needed only to be manually mixed
for 10 minutes before coating application. However, the black standard paint had to me manually mixed
together with brown brilliance paint to achieve similar color as the black cool coating samples. The ratio
of black and brown paint used was set to 4:1 wt.% respectively.
Figure 5.1 Image of metal substrate prior to surface treatment.
25
The different paints were applied on treated metal substrates by spray coating with pressured nitrogen
gas. Prior to spray coating, all the different paints had to be diluted to achieve favorable viscosity. The
white base paint was of oil-based origin and had to be diluted by adding 10 wt.% organic solvent to the
paint while the commercialized and NIR reflective pigment-based paints were water based and was
diluted by adding 20 wt.% distilled water to the paint mixtures.
The base paint was initially spray coated on the treated metal substrate and dried in room temperature
for 24 h. After the base paint coatings had been dried, the formed cool paints and the conventional paints
were sprayed on top of the base paints and dried in room temperature for 8 h. The dry coating thickness
of the white base coating, the cool and conventional coatings were measured using PHYNIX equipment
(model surfix® version: FN2.2) instrument. A total of 10 data points at different positions on each
coating samples were collected, and the dry coating thickness was reported as the arithmetic mean of
the obtained data points. In this report, only one coating per pigment type, pigment wt.% and
conventional paint was evaluated. The thickness measurements were done in accordance with ASTM
D6132 13 standard.
5.4 Dispersion Evaluation and Chemical Analysis of the Cool Coating Samples SEM in both BE and SE detection mode assisted with SEM-EDS elemental mapping was used for
identifying and quantifying the chemical elements of the formed cool coatings and to evaluate their
dispersion quality. Prior to SEM analysis, a 1x3 cm piece of each cool coating sample were cut and
immersed in to liquid nitrogen for approximately one minute. The sample was then removed and brittle
fractured. The surface of the fractured coating was cleaned with pressured nitrogen gas before mounted
on the SEM sample holder.
5.5 Gloss and Color Assessment The initial gloss value and evolution of glossiness was measured using a Picogloss model 503 Erichsen
Glossmeter instrument. Five data points were collected for each coating sample and the recorded gloss
result was represented as the arithmetic mean of the obtained data points. The gloss measurements we
all done in accordance with ASTM D523 standard.
The colour measurements were conducted using CM-2600d spectrophotometer (Konica Minolta). The
data were collected using a D64 illuminant instrument with an observer angle of 10° and aperture
diameter of 10 mm. These measurements were done in accordance with CIELAB colour space method
and have been used in previous reports with similar approach [43]. For each coating sample, three colour
measurements at three different positions on the surface of the coating samples were done and the
recorded colour result was represented as the arithmetic mean of the obtained data points.
Figure 5.2. Spray coating gun used for coating application in this thesis.
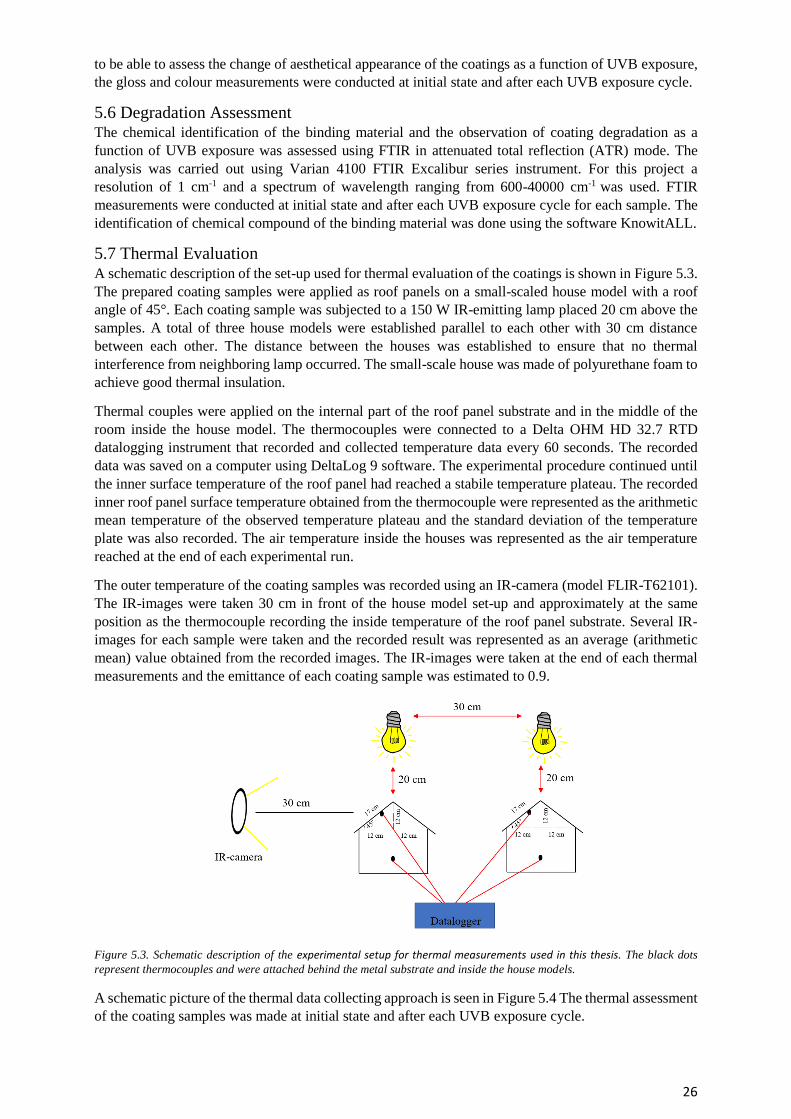
26
to be able to assess the change of aesthetical appearance of the coatings as a function of UVB exposure,
the gloss and colour measurements were conducted at initial state and after each UVB exposure cycle.
5.6 Degradation Assessment The chemical identification of the binding material and the observation of coating degradation as a
function of UVB exposure was assessed using FTIR in attenuated total reflection (ATR) mode. The
analysis was carried out using Varian 4100 FTIR Excalibur series instrument. For this project a
resolution of 1 cm-1 and a spectrum of wavelength ranging from 600-40000 cm-1 was used. FTIR
measurements were conducted at initial state and after each UVB exposure cycle for each sample. The
identification of chemical compound of the binding material was done using the software KnowitALL.
5.7 Thermal Evaluation A schematic description of the set-up used for thermal evaluation of the coatings is shown in Figure 5.3.
The prepared coating samples were applied as roof panels on a small-scaled house model with a roof
angle of 45°. Each coating sample was subjected to a 150 W IR-emitting lamp placed 20 cm above the
samples. A total of three house models were established parallel to each other with 30 cm distance
between each other. The distance between the houses was established to ensure that no thermal
interference from neighboring lamp occurred. The small-scale house was made of polyurethane foam to
achieve good thermal insulation.
Thermal couples were applied on the internal part of the roof panel substrate and in the middle of the
room inside the house model. The thermocouples were connected to a Delta OHM HD 32.7 RTD
datalogging instrument that recorded and collected temperature data every 60 seconds. The recorded
data was saved on a computer using DeltaLog 9 software. The experimental procedure continued until
the inner surface temperature of the roof panel had reached a stabile temperature plateau. The recorded
inner roof panel surface temperature obtained from the thermocouple were represented as the arithmetic
mean temperature of the observed temperature plateau and the standard deviation of the temperature
plate was also recorded. The air temperature inside the houses was represented as the air temperature
reached at the end of each experimental run.
The outer temperature of the coating samples was recorded using an IR-camera (model FLIR-T62101).
The IR-images were taken 30 cm in front of the house model set-up and approximately at the same
position as the thermocouple recording the inside temperature of the roof panel substrate. Several IR-
images for each sample were taken and the recorded result was represented as an average (arithmetic
mean) value obtained from the recorded images. The IR-images were taken at the end of each thermal
measurements and the emittance of each coating sample was estimated to 0.9.
Figure 5.3. Schematic description of the experimental setup for thermal measurements used in this thesis. The black dots
represent thermocouples and were attached behind the metal substrate and inside the house models.
A schematic picture of the thermal data collecting approach is seen in Figure 5.4 The thermal assessment
of the coating samples was made at initial state and after each UVB exposure cycle.
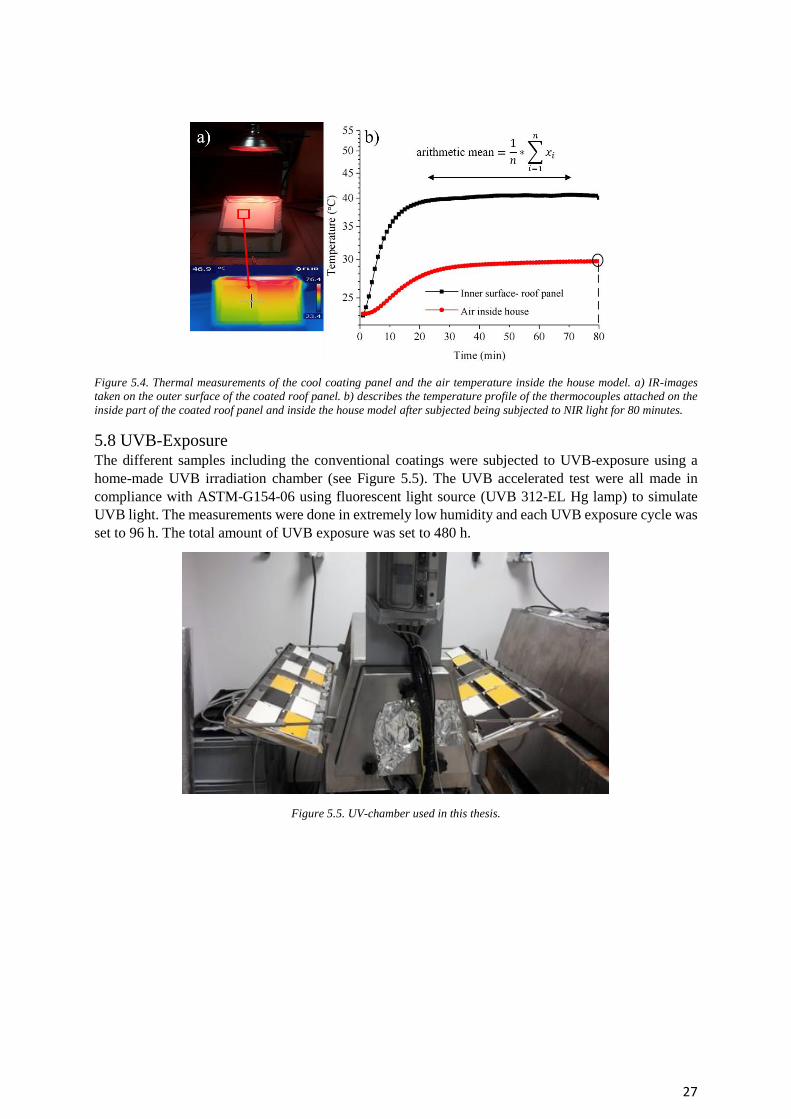
27
Figure 5.4. Thermal measurements of the cool coating panel and the air temperature inside the house model. a) IR-images
taken on the outer surface of the coated roof panel. b) describes the temperature profile of the thermocouples attached on the
inside part of the coated roof panel and inside the house model after subjected being subjected to NIR light for 80 minutes.
5.8 UVB-Exposure The different samples including the conventional coatings were subjected to UVB-exposure using a
home-made UVB irradiation chamber (see Figure 5.5). The UVB accelerated test were all made in
compliance with ASTM-G154-06 using fluorescent light source (UVB 312-EL Hg lamp) to simulate
UVB light. The measurements were done in extremely low humidity and each UVB exposure cycle was
set to 96 h. The total amount of UVB exposure was set to 480 h.
Figure 5.5. UV-chamber used in this thesis.
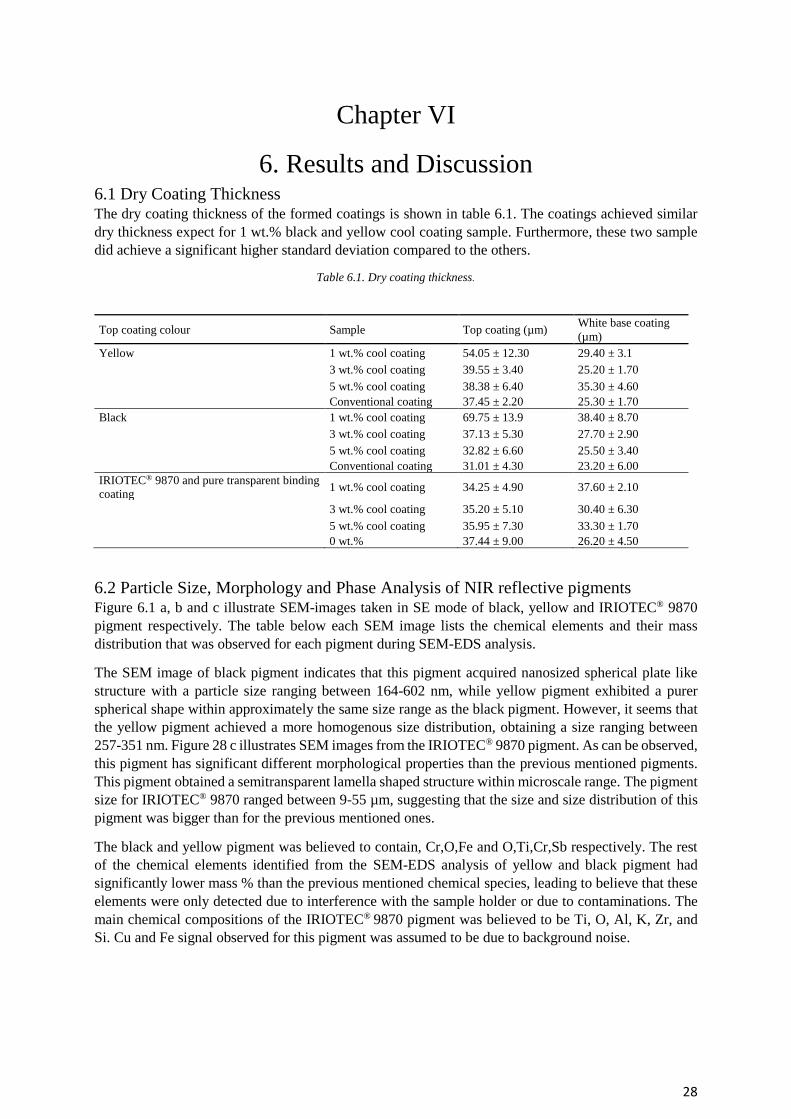
28
Chapter VI
6. Results and Discussion 6.1 Dry Coating Thickness The dry coating thickness of the formed coatings is shown in table 6.1. The coatings achieved similar
dry thickness expect for 1 wt.% black and yellow cool coating sample. Furthermore, these two sample
did achieve a significant higher standard deviation compared to the others.
Table 6.1. Dry coating thickness.
Top coating colour Sample Top coating (µm) White base coating
(µm)
Yellow 1 wt.% cool coating 54.05 ± 12.30 29.40 ± 3.1
3 wt.% cool coating 39.55 ± 3.40 25.20 ± 1.70
5 wt.% cool coating 38.38 ± 6.40 35.30 ± 4.60
Conventional coating 37.45 ± 2.20 25.30 ± 1.70
Black 1 wt.% cool coating 69.75 ± 13.9 38.40 ± 8.70
3 wt.% cool coating 37.13 ± 5.30 27.70 ± 2.90
5 wt.% cool coating 32.82 ± 6.60 25.50 ± 3.40
Conventional coating 31.01 ± 4.30 23.20 ± 6.00
IRIOTEC® 9870 and pure transparent binding
coating 1 wt.% cool coating 34.25 ± 4.90 37.60 ± 2.10
3 wt.% cool coating 35.20 ± 5.10 30.40 ± 6.30
5 wt.% cool coating 35.95 ± 7.30 33.30 ± 1.70
0 wt.% 37.44 ± 9.00 26.20 ± 4.50
6.2 Particle Size, Morphology and Phase Analysis of NIR reflective pigments Figure 6.1 a, b and c illustrate SEM-images taken in SE mode of black, yellow and IRIOTEC® 9870
pigment respectively. The table below each SEM image lists the chemical elements and their mass
distribution that was observed for each pigment during SEM-EDS analysis.
The SEM image of black pigment indicates that this pigment acquired nanosized spherical plate like
structure with a particle size ranging between 164-602 nm, while yellow pigment exhibited a purer
spherical shape within approximately the same size range as the black pigment. However, it seems that
the yellow pigment achieved a more homogenous size distribution, obtaining a size ranging between
257-351 nm. Figure 28 c illustrates SEM images from the IRIOTEC® 9870 pigment. As can be observed,
this pigment has significant different morphological properties than the previous mentioned pigments.
This pigment obtained a semitransparent lamella shaped structure within microscale range. The pigment
size for IRIOTEC® 9870 ranged between 9-55 µm, suggesting that the size and size distribution of this
pigment was bigger than for the previous mentioned ones.
The black and yellow pigment was believed to contain, Cr,O,Fe and O,Ti,Cr,Sb respectively. The rest
of the chemical elements identified from the SEM-EDS analysis of yellow and black pigment had
significantly lower mass % than the previous mentioned chemical species, leading to believe that these
elements were only detected due to interference with the sample holder or due to contaminations. The
main chemical compositions of the IRIOTEC® 9870 pigment was believed to be Ti, O, Al, K, Zr, and
Si. Cu and Fe signal observed for this pigment was assumed to be due to background noise.
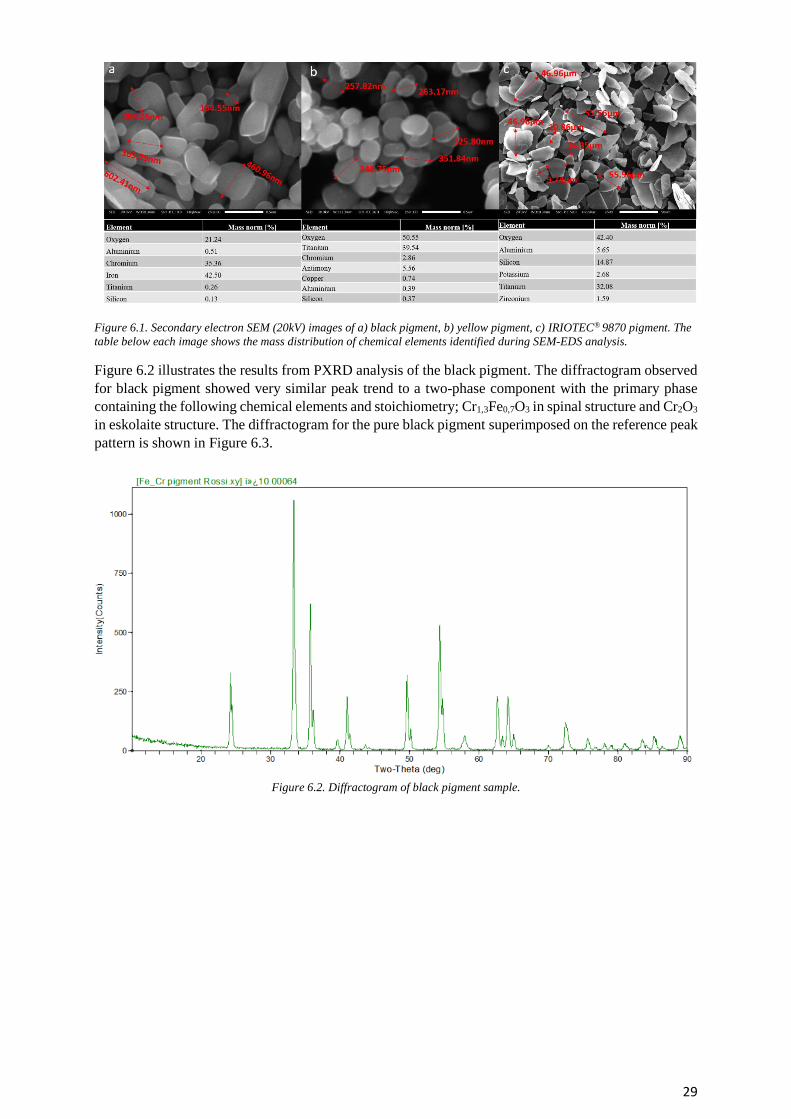
29
Figure 6.1. Secondary electron SEM (20kV) images of a) black pigment, b) yellow pigment, c) IRIOTEC® 9870 pigment. The
table below each image shows the mass distribution of chemical elements identified during SEM-EDS analysis.
Figure 6.2 illustrates the results from PXRD analysis of the black pigment. The diffractogram observed
for black pigment showed very similar peak trend to a two-phase component with the primary phase
containing the following chemical elements and stoichiometry; Cr1,3Fe0,7O3 in spinal structure and Cr2O3
in eskolaite structure. The diffractogram for the pure black pigment superimposed on the reference peak
pattern is shown in Figure 6.3.
Figure 6.2. Diffractogram of black pigment sample.
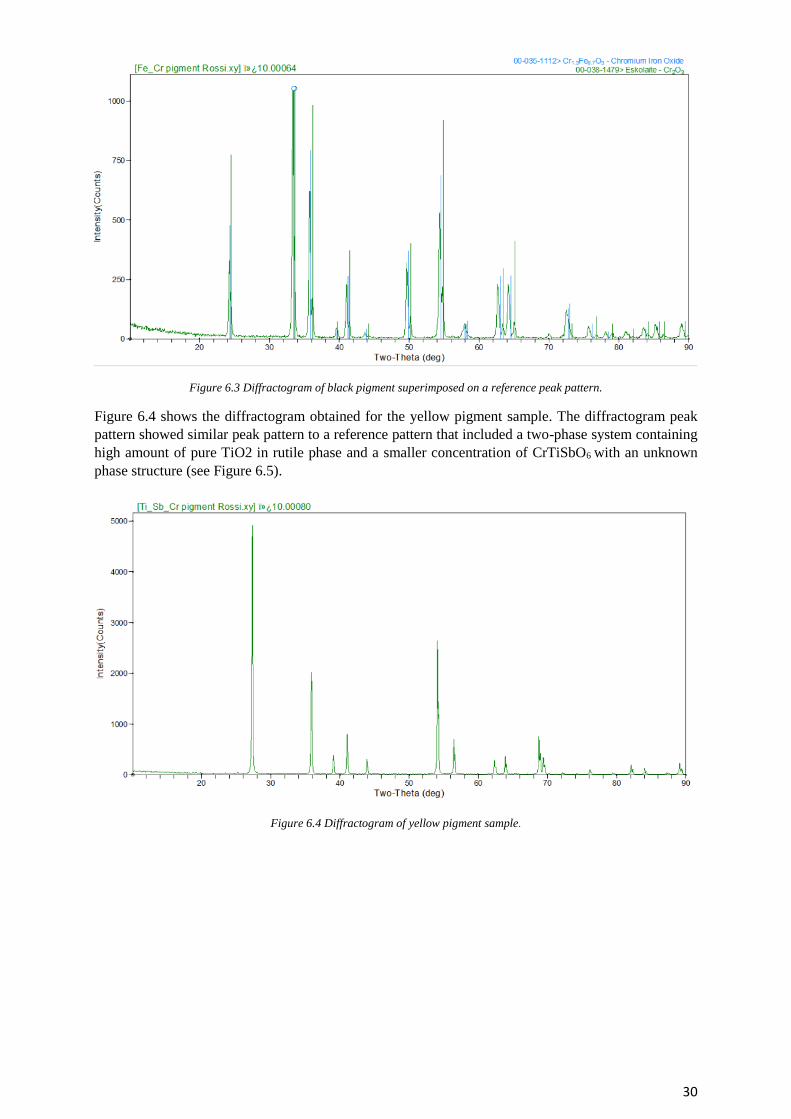
30
Figure 6.3 Diffractogram of black pigment superimposed on a reference peak pattern.
Figure 6.4 shows the diffractogram obtained for the yellow pigment sample. The diffractogram peak
pattern showed similar peak pattern to a reference pattern that included a two-phase system containing
high amount of pure TiO2 in rutile phase and a smaller concentration of CrTiSbO6 with an unknown
phase structure (see Figure 6.5).
Figure 6.4 Diffractogram of yellow pigment sample.
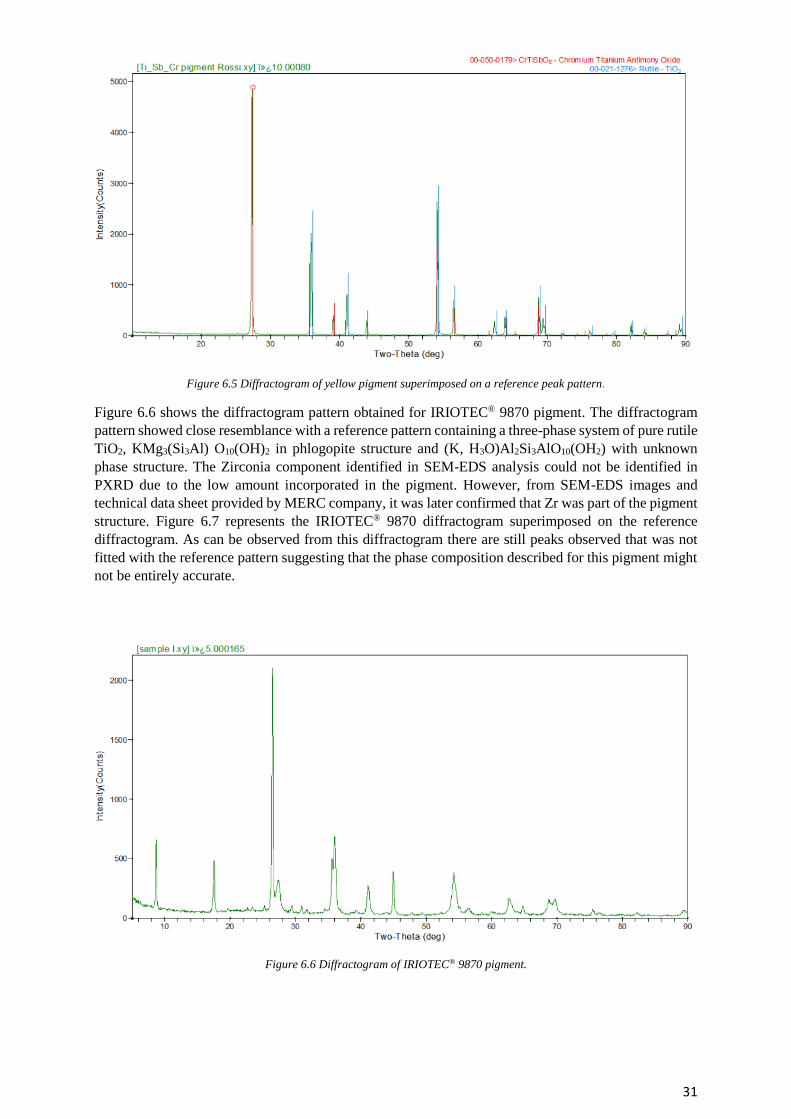
31
Figure 6.5 Diffractogram of yellow pigment superimposed on a reference peak pattern.
Figure 6.6 shows the diffractogram pattern obtained for IRIOTEC® 9870 pigment. The diffractogram
pattern showed close resemblance with a reference pattern containing a three-phase system of pure rutile
TiO2, KMg3(Si3Al) O10(OH)2 in phlogopite structure and (K, H3O)Al2Si3AlO10(OH2) with unknown
phase structure. The Zirconia component identified in SEM-EDS analysis could not be identified in
PXRD due to the low amount incorporated in the pigment. However, from SEM-EDS images and
technical data sheet provided by MERC company, it was later confirmed that Zr was part of the pigment
structure. Figure 6.7 represents the IRIOTEC® 9870 diffractogram superimposed on the reference
diffractogram. As can be observed from this diffractogram there are still peaks observed that was not
fitted with the reference pattern suggesting that the phase composition described for this pigment might
not be entirely accurate.
Figure 6.6 Diffractogram of IRIOTEC® 9870 pigment.
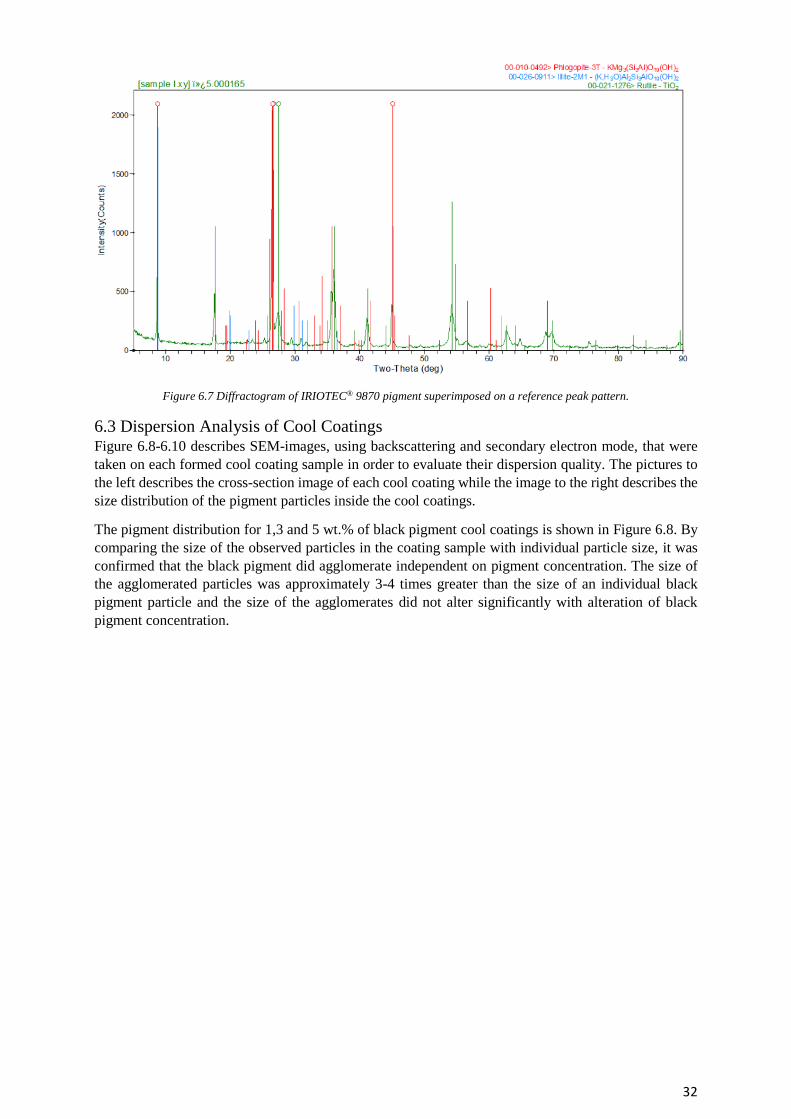
32
Figure 6.7 Diffractogram of IRIOTEC® 9870 pigment superimposed on a reference peak pattern.
6.3 Dispersion Analysis of Cool Coatings Figure 6.8-6.10 describes SEM-images, using backscattering and secondary electron mode, that were
taken on each formed cool coating sample in order to evaluate their dispersion quality. The pictures to
the left describes the cross-section image of each cool coating while the image to the right describes the
size distribution of the pigment particles inside the cool coatings.
The pigment distribution for 1,3 and 5 wt.% of black pigment cool coatings is shown in Figure 6.8. By
comparing the size of the observed particles in the coating sample with individual particle size, it was
confirmed that the black pigment did agglomerate independent on pigment concentration. The size of
the agglomerated particles was approximately 3-4 times greater than the size of an individual black
pigment particle and the size of the agglomerates did not alter significantly with alteration of black
pigment concentration.
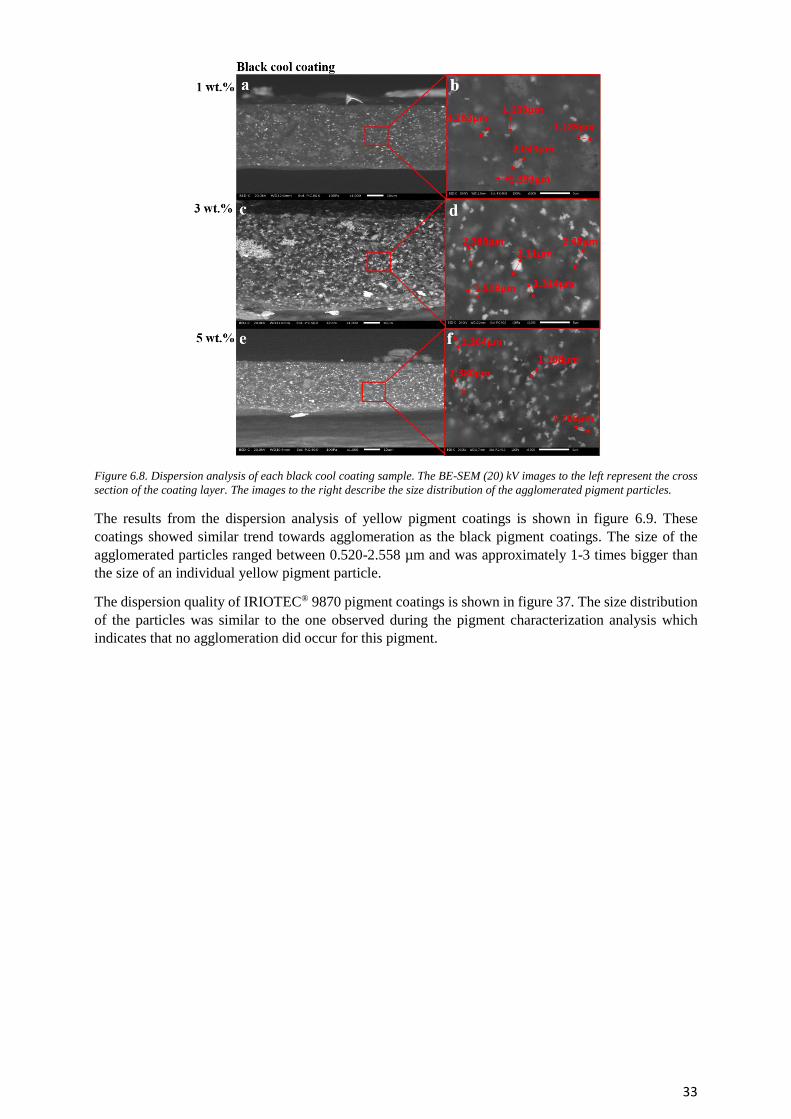
33
Figure 6.8. Dispersion analysis of each black cool coating sample. The BE-SEM (20) kV images to the left represent the cross
section of the coating layer. The images to the right describe the size distribution of the agglomerated pigment particles.
The results from the dispersion analysis of yellow pigment coatings is shown in figure 6.9. These
coatings showed similar trend towards agglomeration as the black pigment coatings. The size of the
agglomerated particles ranged between 0.520-2.558 µm and was approximately 1-3 times bigger than
the size of an individual yellow pigment particle.
The dispersion quality of IRIOTEC® 9870 pigment coatings is shown in figure 37. The size distribution
of the particles was similar to the one observed during the pigment characterization analysis which
indicates that no agglomeration did occur for this pigment.
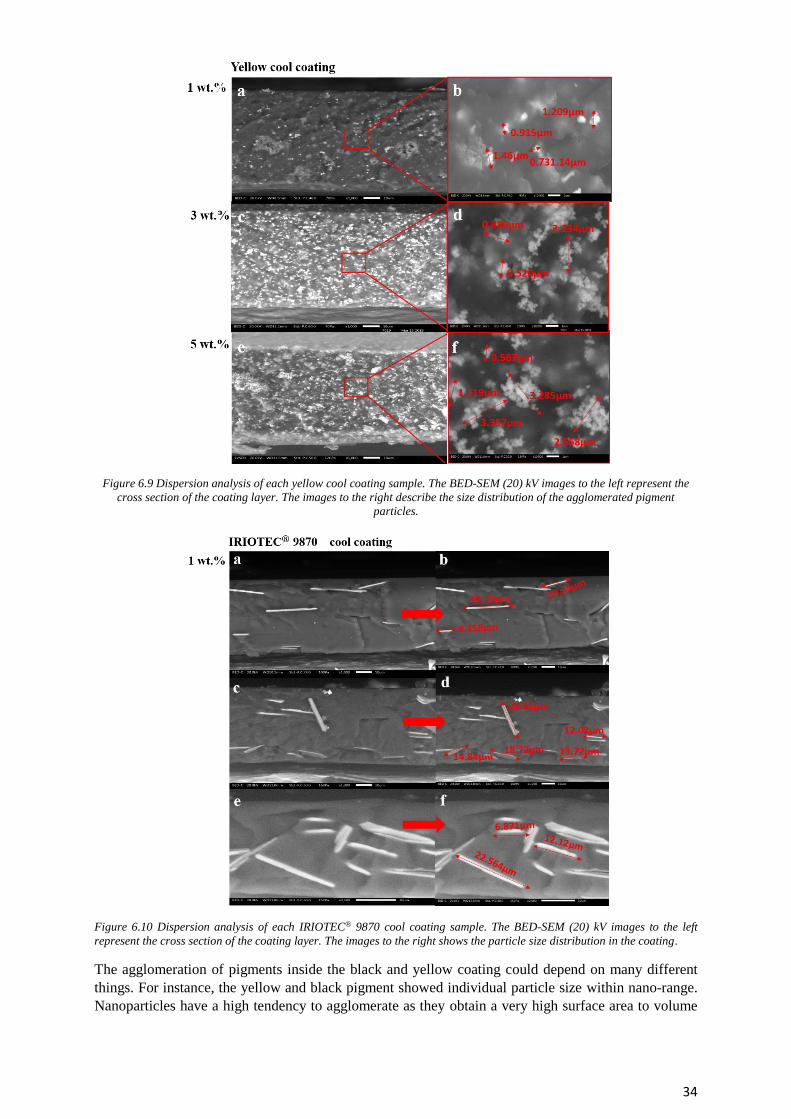
34
Figure 6.9 Dispersion analysis of each yellow cool coating sample. The BED-SEM (20) kV images to the left represent the
cross section of the coating layer. The images to the right describe the size distribution of the agglomerated pigment
particles.
Figure 6.10 Dispersion analysis of each IRIOTEC® 9870 cool coating sample. The BED-SEM (20) kV images to the left
represent the cross section of the coating layer. The images to the right shows the particle size distribution in the coating.
The agglomeration of pigments inside the black and yellow coating could depend on many different
things. For instance, the yellow and black pigment showed individual particle size within nano-range.
Nanoparticles have a high tendency to agglomerate as they obtain a very high surface area to volume
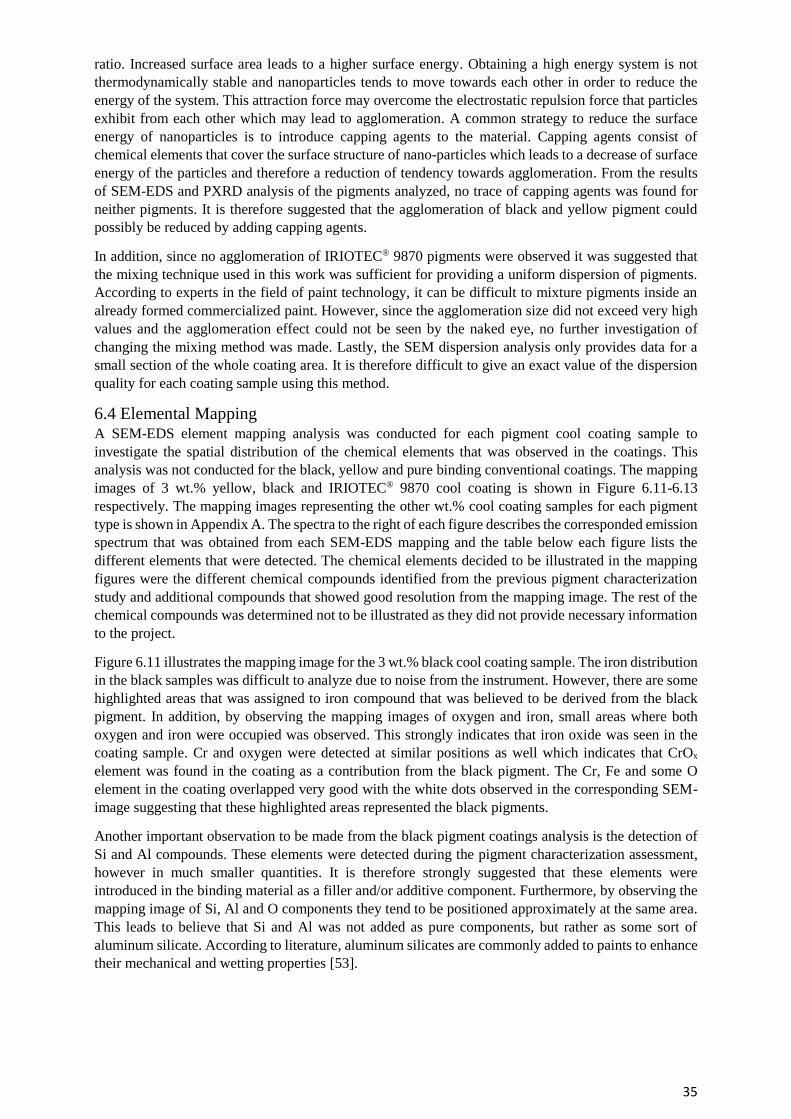
35
ratio. Increased surface area leads to a higher surface energy. Obtaining a high energy system is not
thermodynamically stable and nanoparticles tends to move towards each other in order to reduce the
energy of the system. This attraction force may overcome the electrostatic repulsion force that particles
exhibit from each other which may lead to agglomeration. A common strategy to reduce the surface
energy of nanoparticles is to introduce capping agents to the material. Capping agents consist of
chemical elements that cover the surface structure of nano-particles which leads to a decrease of surface
energy of the particles and therefore a reduction of tendency towards agglomeration. From the results
of SEM-EDS and PXRD analysis of the pigments analyzed, no trace of capping agents was found for
neither pigments. It is therefore suggested that the agglomeration of black and yellow pigment could
possibly be reduced by adding capping agents.
In addition, since no agglomeration of IRIOTEC® 9870 pigments were observed it was suggested that
the mixing technique used in this work was sufficient for providing a uniform dispersion of pigments.
According to experts in the field of paint technology, it can be difficult to mixture pigments inside an
already formed commercialized paint. However, since the agglomeration size did not exceed very high
values and the agglomeration effect could not be seen by the naked eye, no further investigation of
changing the mixing method was made. Lastly, the SEM dispersion analysis only provides data for a
small section of the whole coating area. It is therefore difficult to give an exact value of the dispersion
quality for each coating sample using this method.
6.4 Elemental Mapping A SEM-EDS element mapping analysis was conducted for each pigment cool coating sample to
investigate the spatial distribution of the chemical elements that was observed in the coatings. This
analysis was not conducted for the black, yellow and pure binding conventional coatings. The mapping
images of 3 wt.% yellow, black and IRIOTEC® 9870 cool coating is shown in Figure 6.11-6.13
respectively. The mapping images representing the other wt.% cool coating samples for each pigment
type is shown in Appendix A. The spectra to the right of each figure describes the corresponded emission
spectrum that was obtained from each SEM-EDS mapping and the table below each figure lists the
different elements that were detected. The chemical elements decided to be illustrated in the mapping
figures were the different chemical compounds identified from the previous pigment characterization
study and additional compounds that showed good resolution from the mapping image. The rest of the
chemical compounds was determined not to be illustrated as they did not provide necessary information
to the project.
Figure 6.11 illustrates the mapping image for the 3 wt.% black cool coating sample. The iron distribution
in the black samples was difficult to analyze due to noise from the instrument. However, there are some
highlighted areas that was assigned to iron compound that was believed to be derived from the black
pigment. In addition, by observing the mapping images of oxygen and iron, small areas where both
oxygen and iron were occupied was observed. This strongly indicates that iron oxide was seen in the
coating sample. Cr and oxygen were detected at similar positions as well which indicates that CrOx
element was found in the coating as a contribution from the black pigment. The Cr, Fe and some O
element in the coating overlapped very good with the white dots observed in the corresponding SEM-
image suggesting that these highlighted areas represented the black pigments.
Another important observation to be made from the black pigment coatings analysis is the detection of
Si and Al compounds. These elements were detected during the pigment characterization assessment,
however in much smaller quantities. It is therefore strongly suggested that these elements were
introduced in the binding material as a filler and/or additive component. Furthermore, by observing the
mapping image of Si, Al and O components they tend to be positioned approximately at the same area.
This leads to believe that Si and Al was not added as pure components, but rather as some sort of
aluminum silicate. According to literature, aluminum silicates are commonly added to paints to enhance
their mechanical and wetting properties [53].
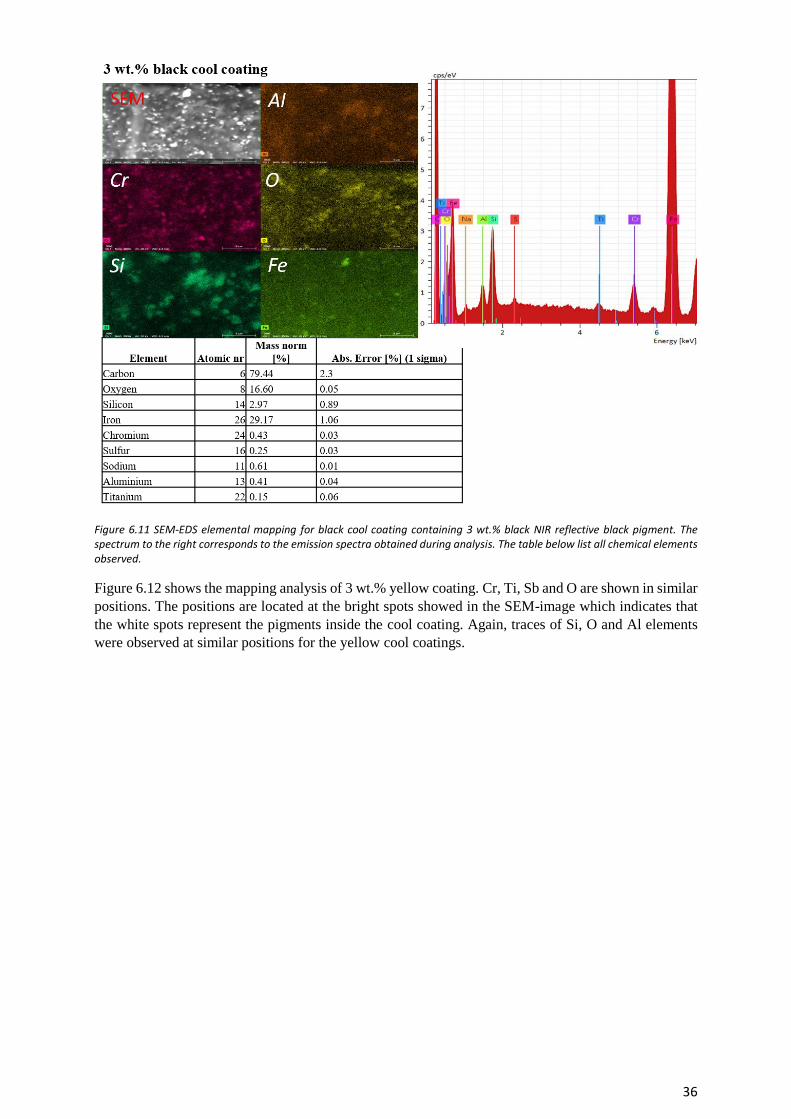
36
Figure 6.11 SEM-EDS elemental mapping for black cool coating containing 3 wt.% black NIR reflective black pigment. The spectrum to the right corresponds to the emission spectra obtained during analysis. The table below list all chemical elements observed.
Figure 6.12 shows the mapping analysis of 3 wt.% yellow coating. Cr, Ti, Sb and O are shown in similar
positions. The positions are located at the bright spots showed in the SEM-image which indicates that
the white spots represent the pigments inside the cool coating. Again, traces of Si, O and Al elements
were observed at similar positions for the yellow cool coatings.
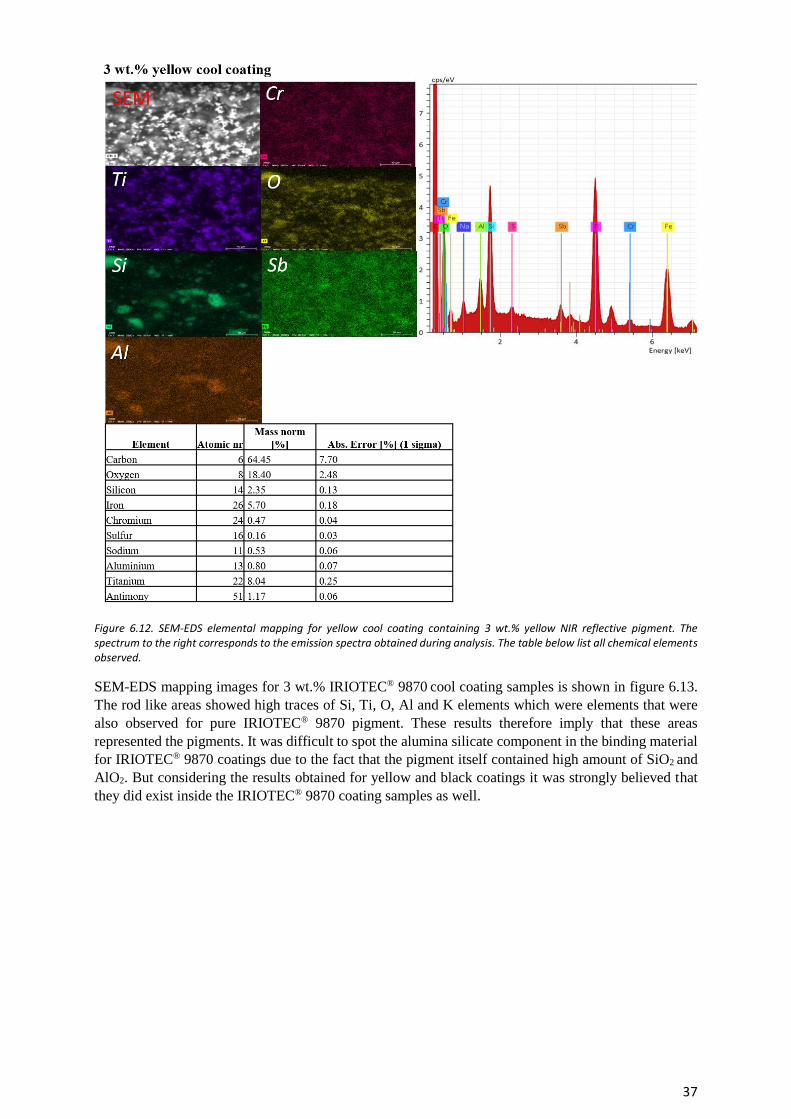
37
Figure 6.12. SEM-EDS elemental mapping for yellow cool coating containing 3 wt.% yellow NIR reflective pigment. The spectrum to the right corresponds to the emission spectra obtained during analysis. The table below list all chemical elements observed.
SEM-EDS mapping images for 3 wt.% IRIOTEC® 9870 cool coating samples is shown in figure 6.13.
The rod like areas showed high traces of Si, Ti, O, Al and K elements which were elements that were
also observed for pure IRIOTEC® 9870 pigment. These results therefore imply that these areas
represented the pigments. It was difficult to spot the alumina silicate component in the binding material
for IRIOTEC® 9870 coatings due to the fact that the pigment itself contained high amount of SiO2 and
AlO2. But considering the results obtained for yellow and black coatings it was strongly believed that
they did exist inside the IRIOTEC® 9870 coating samples as well.
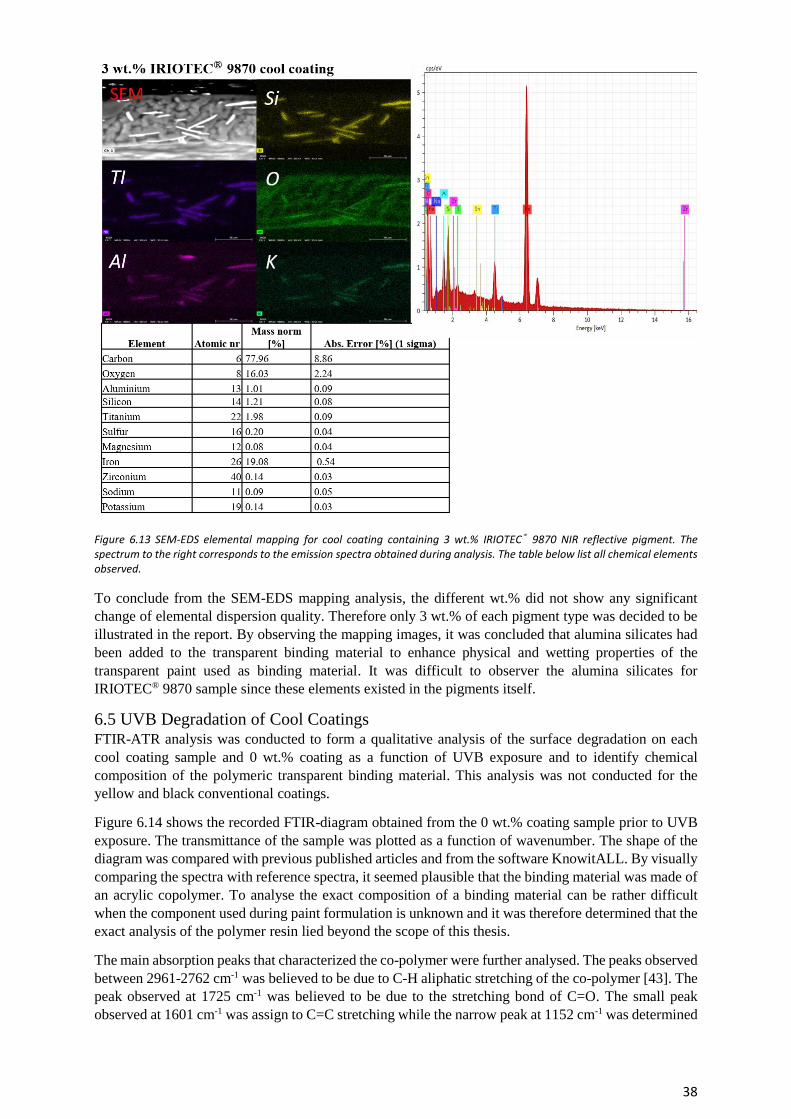
38
Figure 6.13 SEM-EDS elemental mapping for cool coating containing 3 wt.% IRIOTEC® 9870 NIR reflective pigment. The spectrum to the right corresponds to the emission spectra obtained during analysis. The table below list all chemical elements observed.
To conclude from the SEM-EDS mapping analysis, the different wt.% did not show any significant
change of elemental dispersion quality. Therefore only 3 wt.% of each pigment type was decided to be
illustrated in the report. By observing the mapping images, it was concluded that alumina silicates had
been added to the transparent binding material to enhance physical and wetting properties of the
transparent paint used as binding material. It was difficult to observer the alumina silicates for
IRIOTEC® 9870 sample since these elements existed in the pigments itself.
6.5 UVB Degradation of Cool Coatings FTIR-ATR analysis was conducted to form a qualitative analysis of the surface degradation on each
cool coating sample and 0 wt.% coating as a function of UVB exposure and to identify chemical
composition of the polymeric transparent binding material. This analysis was not conducted for the
yellow and black conventional coatings.
Figure 6.14 shows the recorded FTIR-diagram obtained from the 0 wt.% coating sample prior to UVB
exposure. The transmittance of the sample was plotted as a function of wavenumber. The shape of the
diagram was compared with previous published articles and from the software KnowitALL. By visually
comparing the spectra with reference spectra, it seemed plausible that the binding material was made of
an acrylic copolymer. To analyse the exact composition of a binding material can be rather difficult
when the component used during paint formulation is unknown and it was therefore determined that the
exact analysis of the polymer resin lied beyond the scope of this thesis.
The main absorption peaks that characterized the co-polymer were further analysed. The peaks observed
between 2961-2762 cm-1 was believed to be due to C-H aliphatic stretching of the co-polymer [43]. The
peak observed at 1725 cm-1 was believed to be due to the stretching bond of C=O. The small peak
observed at 1601 cm-1 was assign to C=C stretching while the narrow peak at 1152 cm-1 was determined
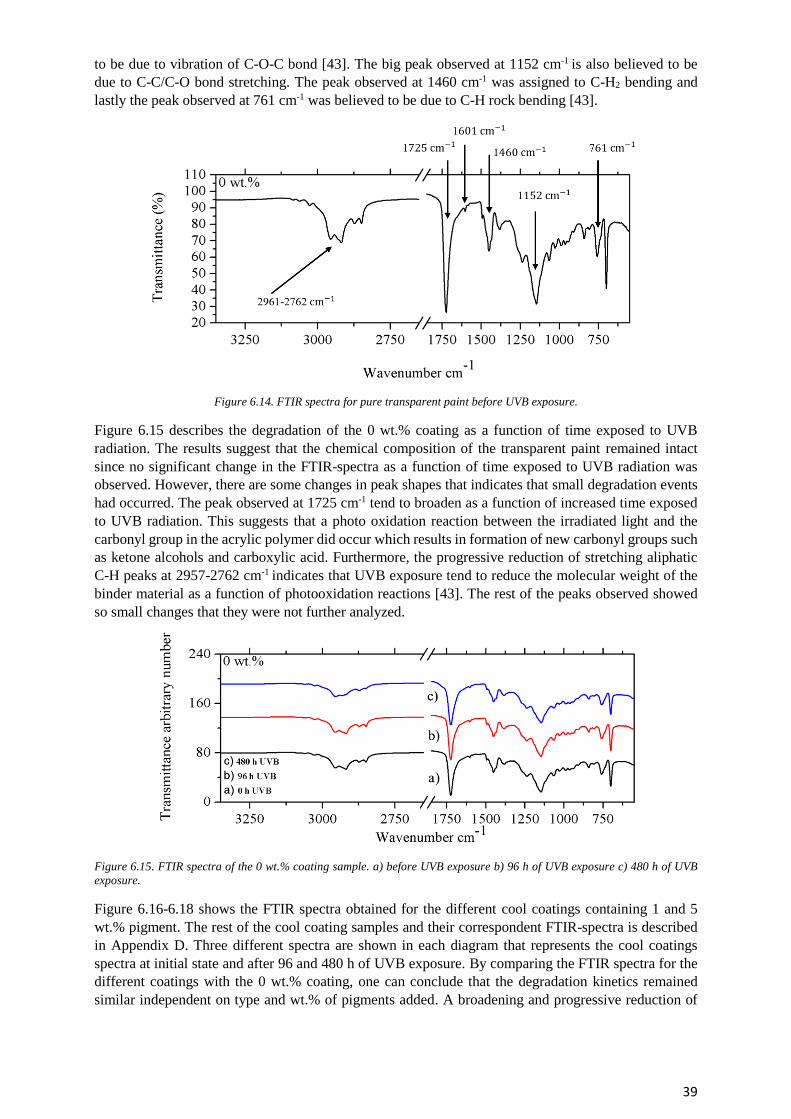
39
to be due to vibration of C-O-C bond [43]. The big peak observed at 1152 cm-1 is also believed to be
due to C-C/C-O bond stretching. The peak observed at 1460 cm-1 was assigned to C-H2 bending and
lastly the peak observed at 761 cm-1 was believed to be due to C-H rock bending [43].
Figure 6.14. FTIR spectra for pure transparent paint before UVB exposure.
Figure 6.15 describes the degradation of the 0 wt.% coating as a function of time exposed to UVB
radiation. The results suggest that the chemical composition of the transparent paint remained intact
since no significant change in the FTIR-spectra as a function of time exposed to UVB radiation was
observed. However, there are some changes in peak shapes that indicates that small degradation events
had occurred. The peak observed at 1725 cm-1 tend to broaden as a function of increased time exposed
to UVB radiation. This suggests that a photo oxidation reaction between the irradiated light and the
carbonyl group in the acrylic polymer did occur which results in formation of new carbonyl groups such
as ketone alcohols and carboxylic acid. Furthermore, the progressive reduction of stretching aliphatic
C-H peaks at 2957-2762 cm-1 indicates that UVB exposure tend to reduce the molecular weight of the
binder material as a function of photooxidation reactions [43]. The rest of the peaks observed showed
so small changes that they were not further analyzed.
Figure 6.15. FTIR spectra of the 0 wt.% coating sample. a) before UVB exposure b) 96 h of UVB exposure c) 480 h of UVB
exposure.
Figure 6.16-6.18 shows the FTIR spectra obtained for the different cool coatings containing 1 and 5
wt.% pigment. The rest of the cool coating samples and their correspondent FTIR-spectra is described
in Appendix D. Three different spectra are shown in each diagram that represents the cool coatings
spectra at initial state and after 96 and 480 h of UVB exposure. By comparing the FTIR spectra for the
different coatings with the 0 wt.% coating, one can conclude that the degradation kinetics remained
similar independent on type and wt.% of pigments added. A broadening and progressive reduction of
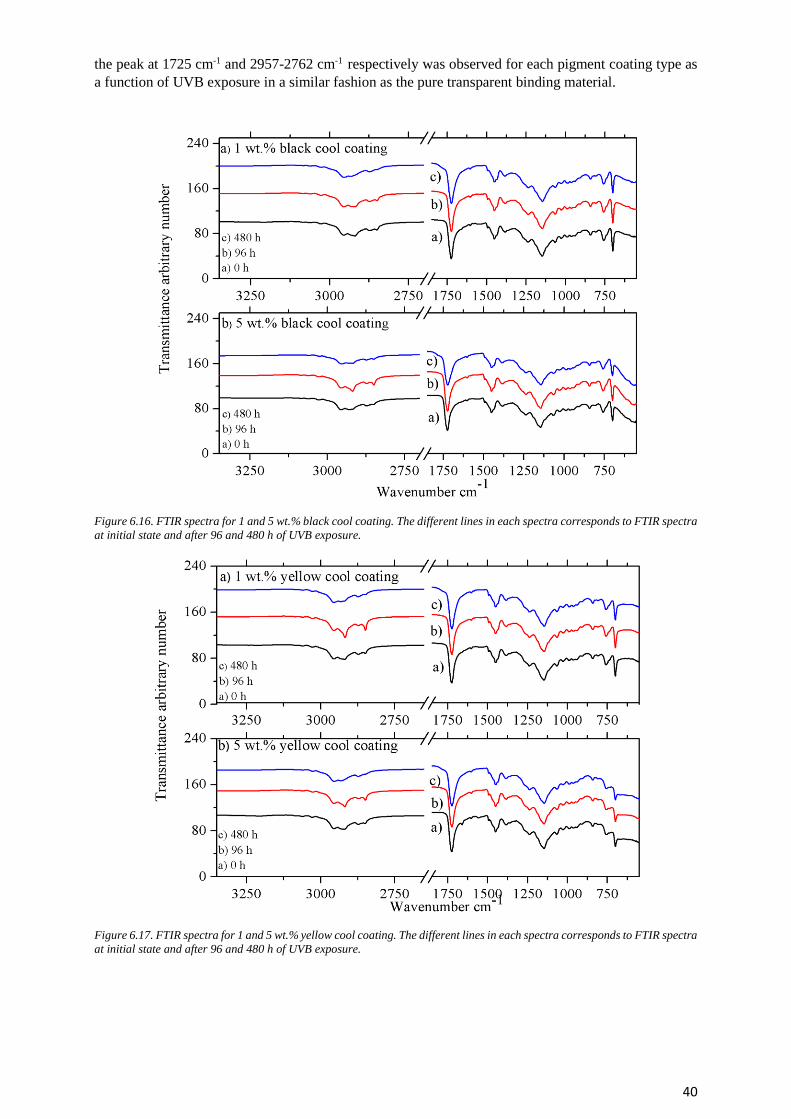
40
the peak at 1725 cm-1 and 2957-2762 cm-1 respectively was observed for each pigment coating type as
a function of UVB exposure in a similar fashion as the pure transparent binding material.
Figure 6.16. FTIR spectra for 1 and 5 wt.% black cool coating. The different lines in each spectra corresponds to FTIR spectra
at initial state and after 96 and 480 h of UVB exposure.
Figure 6.17. FTIR spectra for 1 and 5 wt.% yellow cool coating. The different lines in each spectra corresponds to FTIR spectra
at initial state and after 96 and 480 h of UVB exposure.
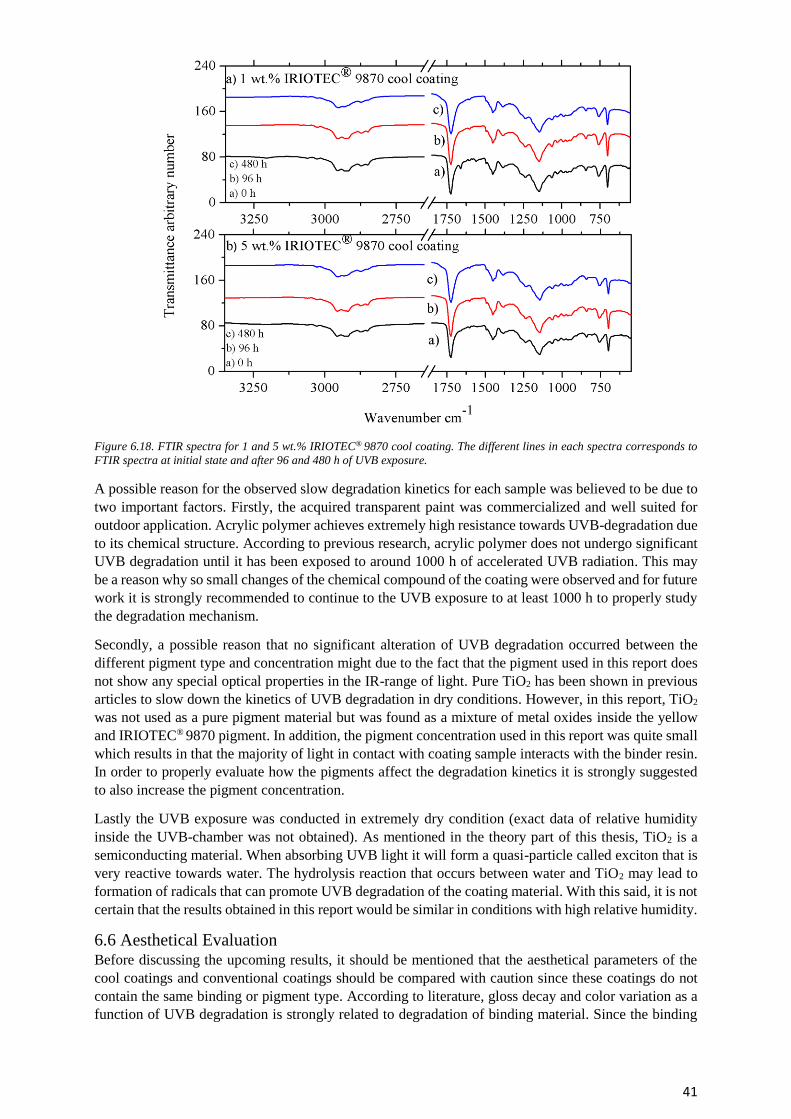
41
Figure 6.18. FTIR spectra for 1 and 5 wt.% IRIOTEC® 9870 cool coating. The different lines in each spectra corresponds to
FTIR spectra at initial state and after 96 and 480 h of UVB exposure.
A possible reason for the observed slow degradation kinetics for each sample was believed to be due to
two important factors. Firstly, the acquired transparent paint was commercialized and well suited for
outdoor application. Acrylic polymer achieves extremely high resistance towards UVB-degradation due
to its chemical structure. According to previous research, acrylic polymer does not undergo significant
UVB degradation until it has been exposed to around 1000 h of accelerated UVB radiation. This may
be a reason why so small changes of the chemical compound of the coating were observed and for future
work it is strongly recommended to continue to the UVB exposure to at least 1000 h to properly study
the degradation mechanism.
Secondly, a possible reason that no significant alteration of UVB degradation occurred between the
different pigment type and concentration might due to the fact that the pigment used in this report does
not show any special optical properties in the IR-range of light. Pure TiO2 has been shown in previous
articles to slow down the kinetics of UVB degradation in dry conditions. However, in this report, TiO2
was not used as a pure pigment material but was found as a mixture of metal oxides inside the yellow
and IRIOTEC® 9870 pigment. In addition, the pigment concentration used in this report was quite small
which results in that the majority of light in contact with coating sample interacts with the binder resin.
In order to properly evaluate how the pigments affect the degradation kinetics it is strongly suggested
to also increase the pigment concentration.
Lastly the UVB exposure was conducted in extremely dry condition (exact data of relative humidity
inside the UVB-chamber was not obtained). As mentioned in the theory part of this thesis, TiO2 is a
semiconducting material. When absorbing UVB light it will form a quasi-particle called exciton that is
very reactive towards water. The hydrolysis reaction that occurs between water and TiO2 may lead to
formation of radicals that can promote UVB degradation of the coating material. With this said, it is not
certain that the results obtained in this report would be similar in conditions with high relative humidity.
6.6 Aesthetical Evaluation Before discussing the upcoming results, it should be mentioned that the aesthetical parameters of the
cool coatings and conventional coatings should be compared with caution since these coatings do not
contain the same binding or pigment type. According to literature, gloss decay and color variation as a
function of UVB degradation is strongly related to degradation of binding material. Since the binding
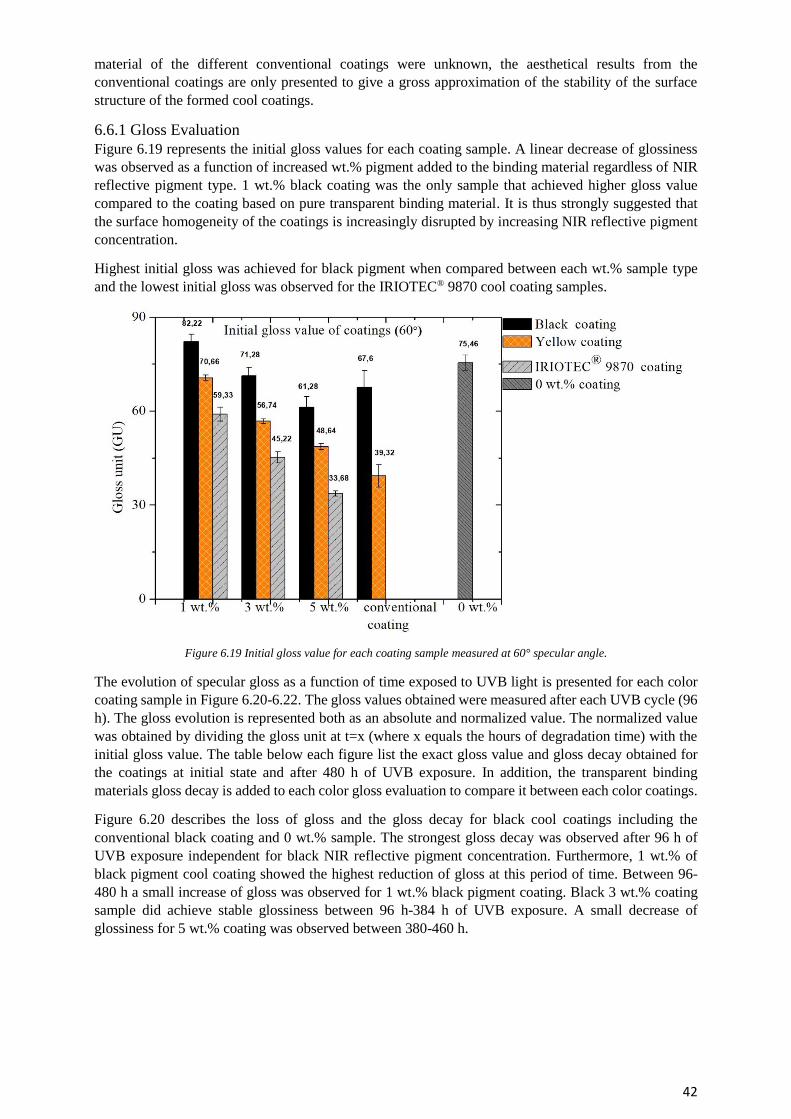
42
material of the different conventional coatings were unknown, the aesthetical results from the
conventional coatings are only presented to give a gross approximation of the stability of the surface
structure of the formed cool coatings.
6.6.1 Gloss Evaluation
Figure 6.19 represents the initial gloss values for each coating sample. A linear decrease of glossiness
was observed as a function of increased wt.% pigment added to the binding material regardless of NIR
reflective pigment type. 1 wt.% black coating was the only sample that achieved higher gloss value
compared to the coating based on pure transparent binding material. It is thus strongly suggested that
the surface homogeneity of the coatings is increasingly disrupted by increasing NIR reflective pigment
concentration.
Highest initial gloss was achieved for black pigment when compared between each wt.% sample type
and the lowest initial gloss was observed for the IRIOTEC® 9870 cool coating samples.
Figure 6.19 Initial gloss value for each coating sample measured at 60° specular angle.
The evolution of specular gloss as a function of time exposed to UVB light is presented for each color
coating sample in Figure 6.20-6.22. The gloss values obtained were measured after each UVB cycle (96
h). The gloss evolution is represented both as an absolute and normalized value. The normalized value
was obtained by dividing the gloss unit at t=x (where x equals the hours of degradation time) with the
initial gloss value. The table below each figure list the exact gloss value and gloss decay obtained for
the coatings at initial state and after 480 h of UVB exposure. In addition, the transparent binding
materials gloss decay is added to each color gloss evaluation to compare it between each color coatings.
Figure 6.20 describes the loss of gloss and the gloss decay for black cool coatings including the
conventional black coating and 0 wt.% sample. The strongest gloss decay was observed after 96 h of
UVB exposure independent for black NIR reflective pigment concentration. Furthermore, 1 wt.% of
black pigment cool coating showed the highest reduction of gloss at this period of time. Between 96-
480 h a small increase of gloss was observed for 1 wt.% black pigment coating. Black 3 wt.% coating
sample did achieve stable glossiness between 96 h-384 h of UVB exposure. A small decrease of
glossiness for 5 wt.% coating was observed between 380-460 h.
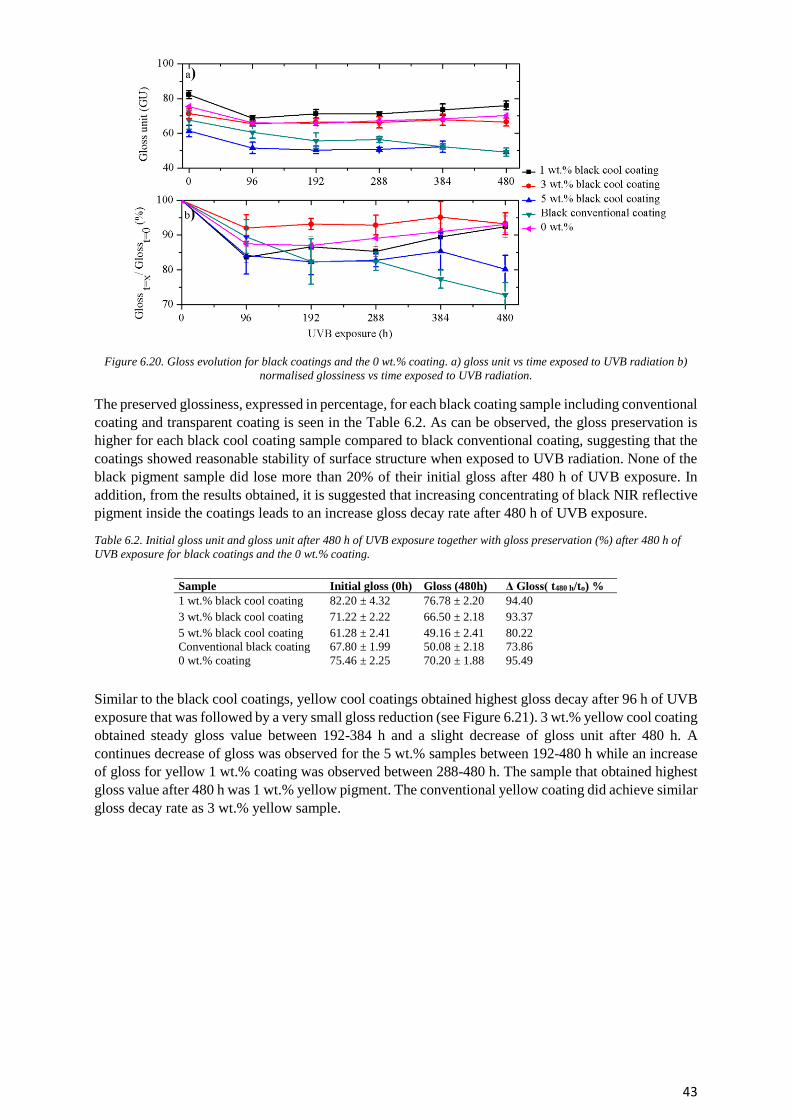
43
Figure 6.20. Gloss evolution for black coatings and the 0 wt.% coating. a) gloss unit vs time exposed to UVB radiation b)
normalised glossiness vs time exposed to UVB radiation.
The preserved glossiness, expressed in percentage, for each black coating sample including conventional
coating and transparent coating is seen in the Table 6.2. As can be observed, the gloss preservation is
higher for each black cool coating sample compared to black conventional coating, suggesting that the
coatings showed reasonable stability of surface structure when exposed to UVB radiation. None of the
black pigment sample did lose more than 20% of their initial gloss after 480 h of UVB exposure. In
addition, from the results obtained, it is suggested that increasing concentrating of black NIR reflective
pigment inside the coatings leads to an increase gloss decay rate after 480 h of UVB exposure.
Table 6.2. Initial gloss unit and gloss unit after 480 h of UVB exposure together with gloss preservation (%) after 480 h of
UVB exposure for black coatings and the 0 wt.% coating.
Similar to the black cool coatings, yellow cool coatings obtained highest gloss decay after 96 h of UVB
exposure that was followed by a very small gloss reduction (see Figure 6.21). 3 wt.% yellow cool coating
obtained steady gloss value between 192-384 h and a slight decrease of gloss unit after 480 h. A
continues decrease of gloss was observed for the 5 wt.% samples between 192-480 h while an increase
of gloss for yellow 1 wt.% coating was observed between 288-480 h. The sample that obtained highest
gloss value after 480 h was 1 wt.% yellow pigment. The conventional yellow coating did achieve similar
gloss decay rate as 3 wt.% yellow sample.
Sample Initial gloss (0h) Gloss (480h) Δ Gloss( t480 h/to) %
1 wt.% black cool coating 82.20 ± 4.32 76.78 ± 2.20 94.40
3 wt.% black cool coating 71.22 ± 2.22 66.50 ± 2.18 93.37
5 wt.% black cool coating 61.28 ± 2.41 49.16 ± 2.41 80.22
Conventional black coating 67.80 ± 1.99 50.08 ± 2.18 73.86
0 wt.% coating 75.46 ± 2.25 70.20 ± 1.88 95.49
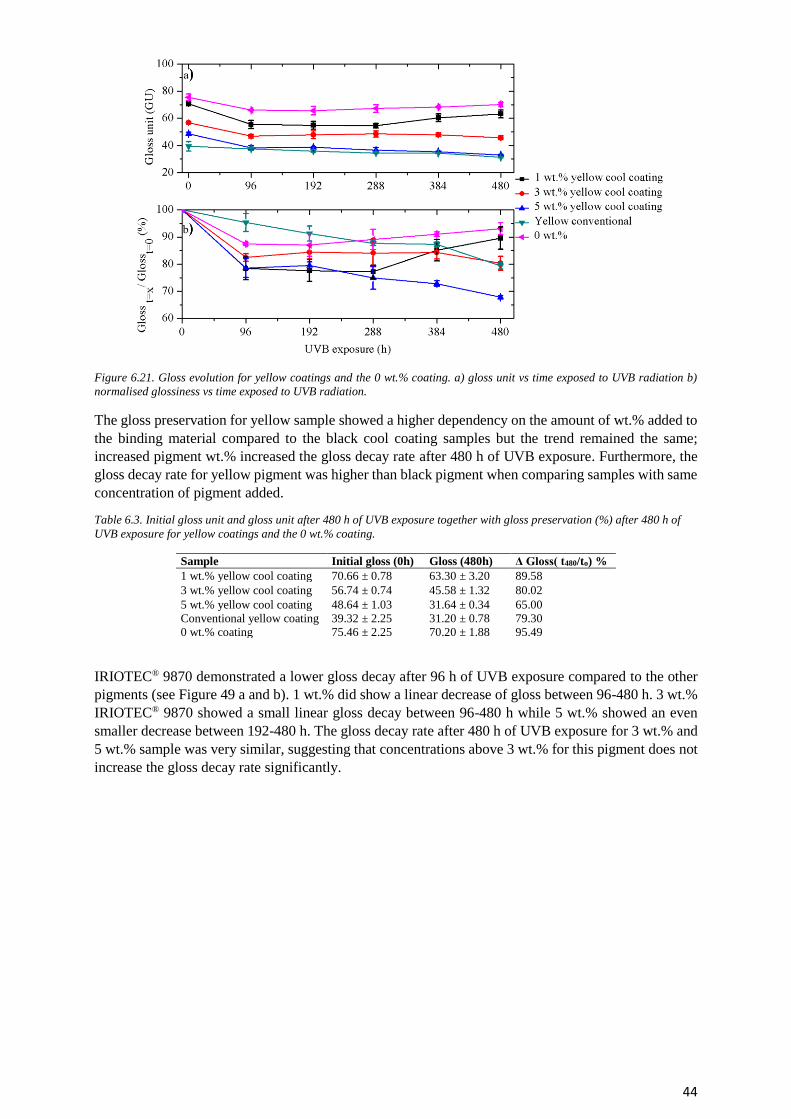
44
Figure 6.21. Gloss evolution for yellow coatings and the 0 wt.% coating. a) gloss unit vs time exposed to UVB radiation b)
normalised glossiness vs time exposed to UVB radiation.
The gloss preservation for yellow sample showed a higher dependency on the amount of wt.% added to
the binding material compared to the black cool coating samples but the trend remained the same;
increased pigment wt.% increased the gloss decay rate after 480 h of UVB exposure. Furthermore, the
gloss decay rate for yellow pigment was higher than black pigment when comparing samples with same
concentration of pigment added.
Table 6.3. Initial gloss unit and gloss unit after 480 h of UVB exposure together with gloss preservation (%) after 480 h of
UVB exposure for yellow coatings and the 0 wt.% coating.
Sample Initial gloss (0h) Gloss (480h) Δ Gloss( t480/to) %
1 wt.% yellow cool coating 70.66 ± 0.78 63.30 ± 3.20 89.58
3 wt.% yellow cool coating 56.74 ± 0.74 45.58 ± 1.32 80.02
5 wt.% yellow cool coating 48.64 ± 1.03 31.64 ± 0.34 65.00
Conventional yellow coating 39.32 ± 2.25 31.20 ± 0.78 79.30
0 wt.% coating 75.46 ± 2.25 70.20 ± 1.88 95.49
IRIOTEC® 9870 demonstrated a lower gloss decay after 96 h of UVB exposure compared to the other
pigments (see Figure 49 a and b). 1 wt.% did show a linear decrease of gloss between 96-480 h. 3 wt.%
IRIOTEC® 9870 showed a small linear gloss decay between 96-480 h while 5 wt.% showed an even
smaller decrease between 192-480 h. The gloss decay rate after 480 h of UVB exposure for 3 wt.% and
5 wt.% sample was very similar, suggesting that concentrations above 3 wt.% for this pigment does not
increase the gloss decay rate significantly.
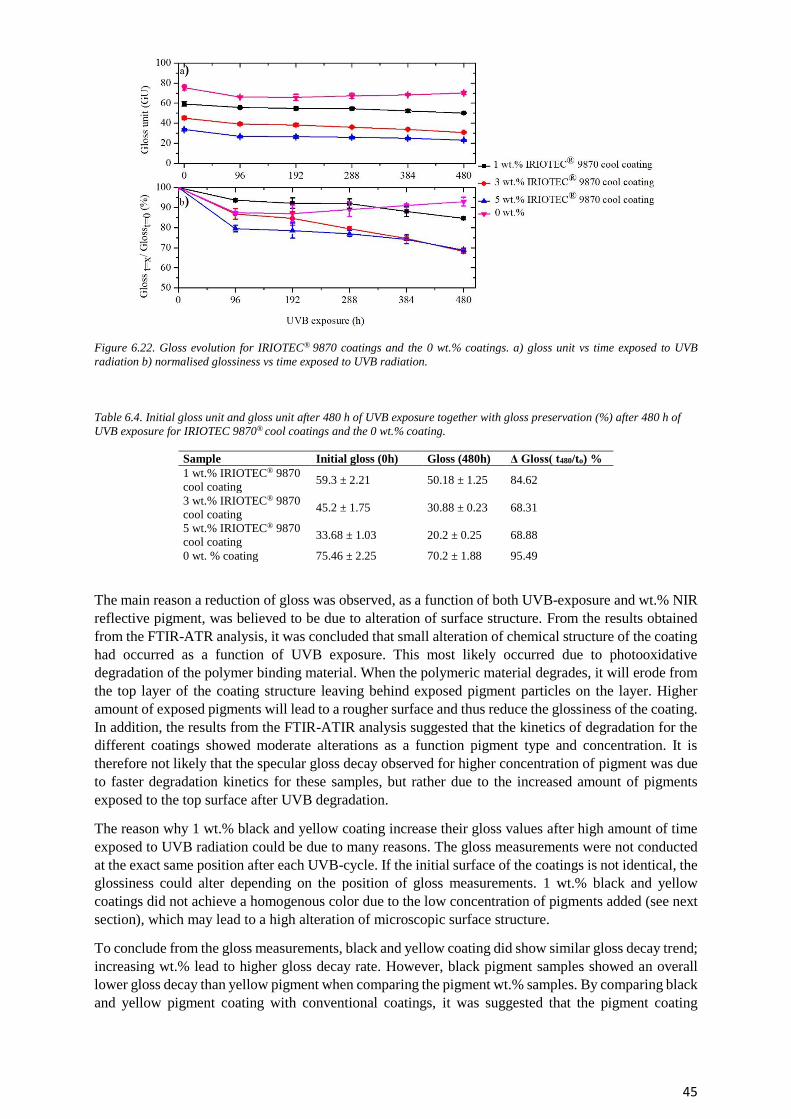
45
Figure 6.22. Gloss evolution for IRIOTEC® 9870 coatings and the 0 wt.% coatings. a) gloss unit vs time exposed to UVB
radiation b) normalised glossiness vs time exposed to UVB radiation.
Table 6.4. Initial gloss unit and gloss unit after 480 h of UVB exposure together with gloss preservation (%) after 480 h of
UVB exposure for IRIOTEC 9870® cool coatings and the 0 wt.% coating.
Sample Initial gloss (0h) Gloss (480h) Δ Gloss( t480/to) %
1 wt.% IRIOTEC® 9870
cool coating 59.3 ± 2.21 50.18 ± 1.25 84.62
3 wt.% IRIOTEC® 9870
cool coating 45.2 ± 1.75 30.88 ± 0.23 68.31
5 wt.% IRIOTEC® 9870
cool coating 33.68 ± 1.03 20.2 ± 0.25 68.88
0 wt. % coating 75.46 ± 2.25 70.2 ± 1.88 95.49
The main reason a reduction of gloss was observed, as a function of both UVB-exposure and wt.% NIR
reflective pigment, was believed to be due to alteration of surface structure. From the results obtained
from the FTIR-ATR analysis, it was concluded that small alteration of chemical structure of the coating
had occurred as a function of UVB exposure. This most likely occurred due to photooxidative
degradation of the polymer binding material. When the polymeric material degrades, it will erode from
the top layer of the coating structure leaving behind exposed pigment particles on the layer. Higher
amount of exposed pigments will lead to a rougher surface and thus reduce the glossiness of the coating.
In addition, the results from the FTIR-ATIR analysis suggested that the kinetics of degradation for the
different coatings showed moderate alterations as a function pigment type and concentration. It is
therefore not likely that the specular gloss decay observed for higher concentration of pigment was due
to faster degradation kinetics for these samples, but rather due to the increased amount of pigments
exposed to the top surface after UVB degradation.
The reason why 1 wt.% black and yellow coating increase their gloss values after high amount of time
exposed to UVB radiation could be due to many reasons. The gloss measurements were not conducted
at the exact same position after each UVB-cycle. If the initial surface of the coatings is not identical, the
glossiness could alter depending on the position of gloss measurements. 1 wt.% black and yellow
coatings did not achieve a homogenous color due to the low concentration of pigments added (see next
section), which may lead to a high alteration of microscopic surface structure.
To conclude from the gloss measurements, black and yellow coating did show similar gloss decay trend;
increasing wt.% lead to higher gloss decay rate. However, black pigment samples showed an overall
lower gloss decay than yellow pigment when comparing the pigment wt.% samples. By comparing black
and yellow pigment coating with conventional coatings, it was suggested that the pigment coating
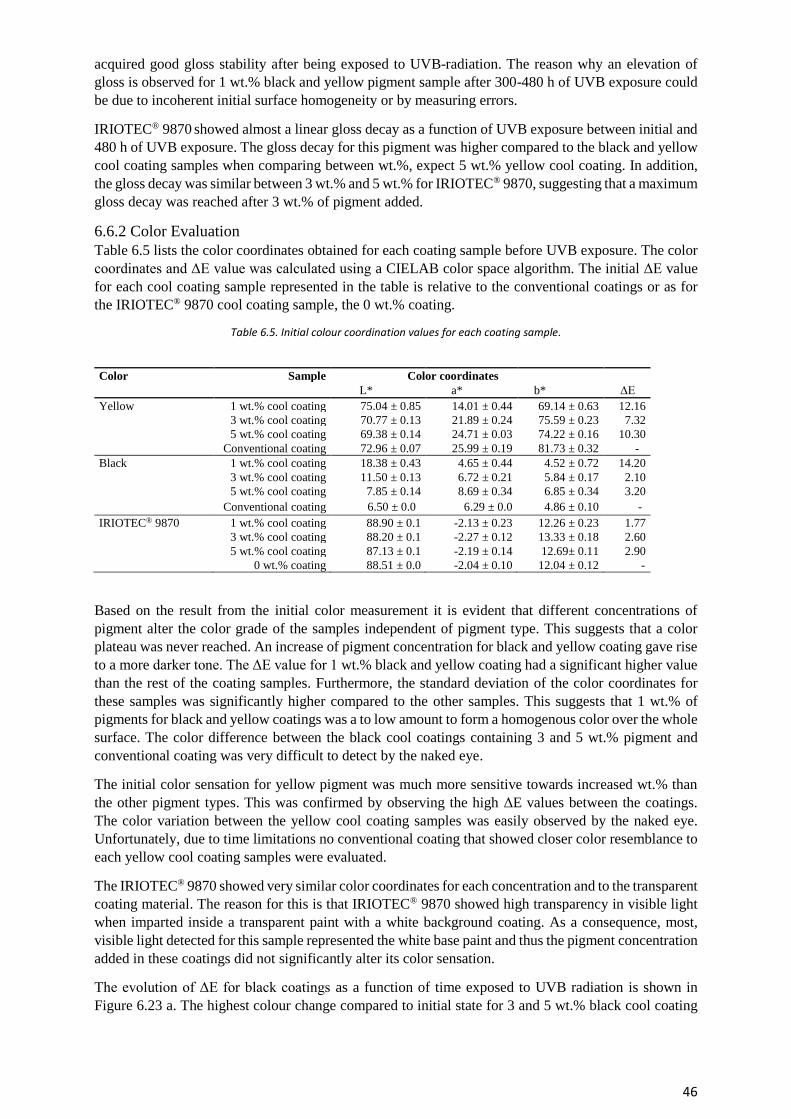
46
acquired good gloss stability after being exposed to UVB-radiation. The reason why an elevation of
gloss is observed for 1 wt.% black and yellow pigment sample after 300-480 h of UVB exposure could
be due to incoherent initial surface homogeneity or by measuring errors.
IRIOTEC® 9870 showed almost a linear gloss decay as a function of UVB exposure between initial and
480 h of UVB exposure. The gloss decay for this pigment was higher compared to the black and yellow
cool coating samples when comparing between wt.%, expect 5 wt.% yellow cool coating. In addition,
the gloss decay was similar between 3 wt.% and 5 wt.% for IRIOTEC® 9870, suggesting that a maximum
gloss decay was reached after 3 wt.% of pigment added.
6.6.2 Color Evaluation
Table 6.5 lists the color coordinates obtained for each coating sample before UVB exposure. The color
coordinates and ΔE value was calculated using a CIELAB color space algorithm. The initial ΔE value
for each cool coating sample represented in the table is relative to the conventional coatings or as for
the IRIOTEC® 9870 cool coating sample, the 0 wt.% coating.
Table 6.5. Initial colour coordination values for each coating sample.
Color Sample Color coordinates L* a* b* ΔE
Yellow 1 wt.% cool coating 75.04 ± 0.85 14.01 ± 0.44 69.14 ± 0.63 12.16
3 wt.% cool coating 70.77 ± 0.13 21.89 ± 0.24 75.59 ± 0.23 7.32
5 wt.% cool coating 69.38 ± 0.14 24.71 ± 0.03 74.22 ± 0.16 10.30
Conventional coating 72.96 ± 0.07 25.99 ± 0.19 81.73 ± 0.32 -
Black 1 wt.% cool coating 18.38 ± 0.43 4.65 ± 0.44 4.52 ± 0.72 14.20
3 wt.% cool coating 11.50 ± 0.13 6.72 ± 0.21 5.84 ± 0.17 2.10
5 wt.% cool coating 7.85 ± 0.14 8.69 ± 0.34 6.85 ± 0.34 3.20
Conventional coating 6.50 ± 0.0 6.29 ± 0.0 4.86 ± 0.10 -
IRIOTEC® 9870 1 wt.% cool coating 88.90 ± 0.1 -2.13 ± 0.23 12.26 ± 0.23 1.77
3 wt.% cool coating 88.20 ± 0.1 -2.27 ± 0.12 13.33 ± 0.18 2.60
5 wt.% cool coating 87.13 ± 0.1 -2.19 ± 0.14 12.69± 0.11 2.90
0 wt.% coating 88.51 ± 0.0 -2.04 ± 0.10 12.04 ± 0.12 -
Based on the result from the initial color measurement it is evident that different concentrations of
pigment alter the color grade of the samples independent of pigment type. This suggests that a color
plateau was never reached. An increase of pigment concentration for black and yellow coating gave rise
to a more darker tone. The ΔE value for 1 wt.% black and yellow coating had a significant higher value
than the rest of the coating samples. Furthermore, the standard deviation of the color coordinates for
these samples was significantly higher compared to the other samples. This suggests that 1 wt.% of
pigments for black and yellow coatings was a to low amount to form a homogenous color over the whole
surface. The color difference between the black cool coatings containing 3 and 5 wt.% pigment and
conventional coating was very difficult to detect by the naked eye.
The initial color sensation for yellow pigment was much more sensitive towards increased wt.% than
the other pigment types. This was confirmed by observing the high ΔE values between the coatings.
The color variation between the yellow cool coating samples was easily observed by the naked eye.
Unfortunately, due to time limitations no conventional coating that showed closer color resemblance to
each yellow cool coating samples were evaluated.
The IRIOTEC® 9870 showed very similar color coordinates for each concentration and to the transparent
coating material. The reason for this is that IRIOTEC® 9870 showed high transparency in visible light
when imparted inside a transparent paint with a white background coating. As a consequence, most,
visible light detected for this sample represented the white base paint and thus the pigment concentration
added in these coatings did not significantly alter its color sensation.
The evolution of ΔE for black coatings as a function of time exposed to UVB radiation is shown in
Figure 6.23 a. The highest colour change compared to initial state for 3 and 5 wt.% black cool coating
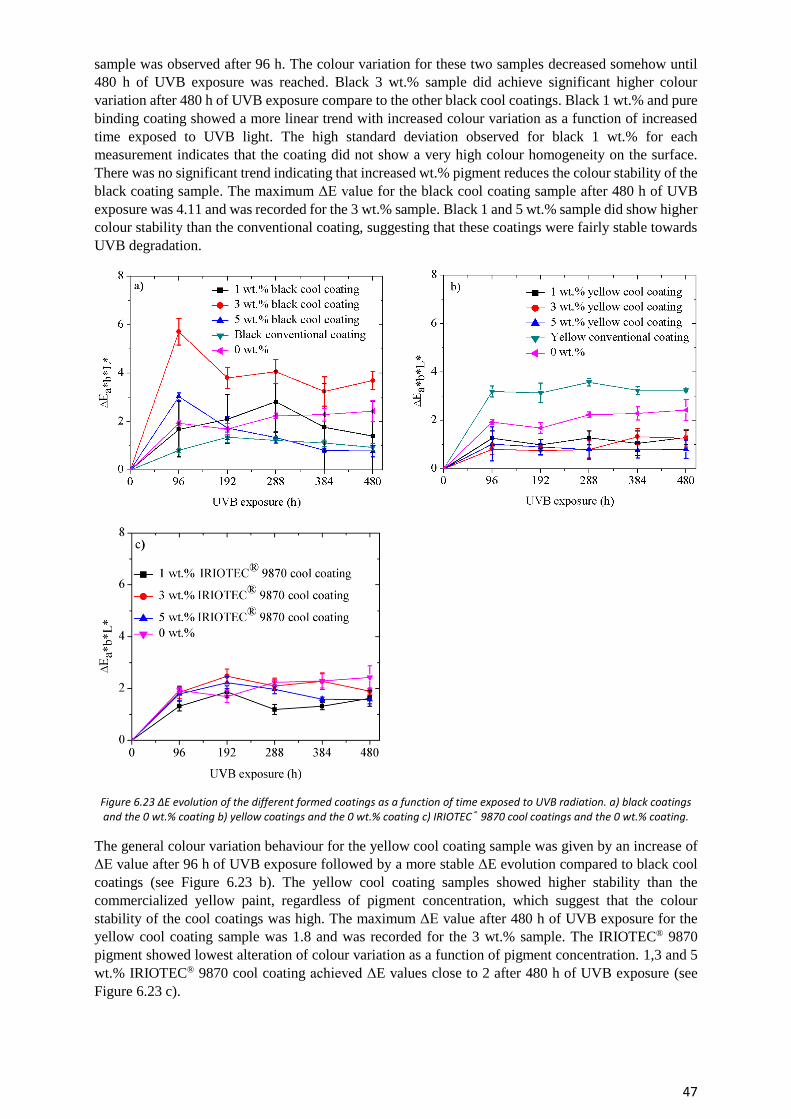
47
sample was observed after 96 h. The colour variation for these two samples decreased somehow until
480 h of UVB exposure was reached. Black 3 wt.% sample did achieve significant higher colour
variation after 480 h of UVB exposure compare to the other black cool coatings. Black 1 wt.% and pure
binding coating showed a more linear trend with increased colour variation as a function of increased
time exposed to UVB light. The high standard deviation observed for black 1 wt.% for each
measurement indicates that the coating did not show a very high colour homogeneity on the surface.
There was no significant trend indicating that increased wt.% pigment reduces the colour stability of the
black coating sample. The maximum ΔE value for the black cool coating sample after 480 h of UVB
exposure was 4.11 and was recorded for the 3 wt.% sample. Black 1 and 5 wt.% sample did show higher
colour stability than the conventional coating, suggesting that these coatings were fairly stable towards
UVB degradation.
Figure 6.23 ΔE evolution of the different formed coatings as a function of time exposed to UVB radiation. a) black coatings and the 0 wt.% coating b) yellow coatings and the 0 wt.% coating c) IRIOTEC® 9870 cool coatings and the 0 wt.% coating.
The general colour variation behaviour for the yellow cool coating sample was given by an increase of
ΔE value after 96 h of UVB exposure followed by a more stable ΔE evolution compared to black cool
coatings (see Figure 6.23 b). The yellow cool coating samples showed higher stability than the
commercialized yellow paint, regardless of pigment concentration, which suggest that the colour
stability of the cool coatings was high. The maximum ΔE value after 480 h of UVB exposure for the
yellow cool coating sample was 1.8 and was recorded for the 3 wt.% sample. The IRIOTEC® 9870
pigment showed lowest alteration of colour variation as a function of pigment concentration. 1,3 and 5
wt.% IRIOTEC® 9870 cool coating achieved ΔE values close to 2 after 480 h of UVB exposure (see
Figure 6.23 c).
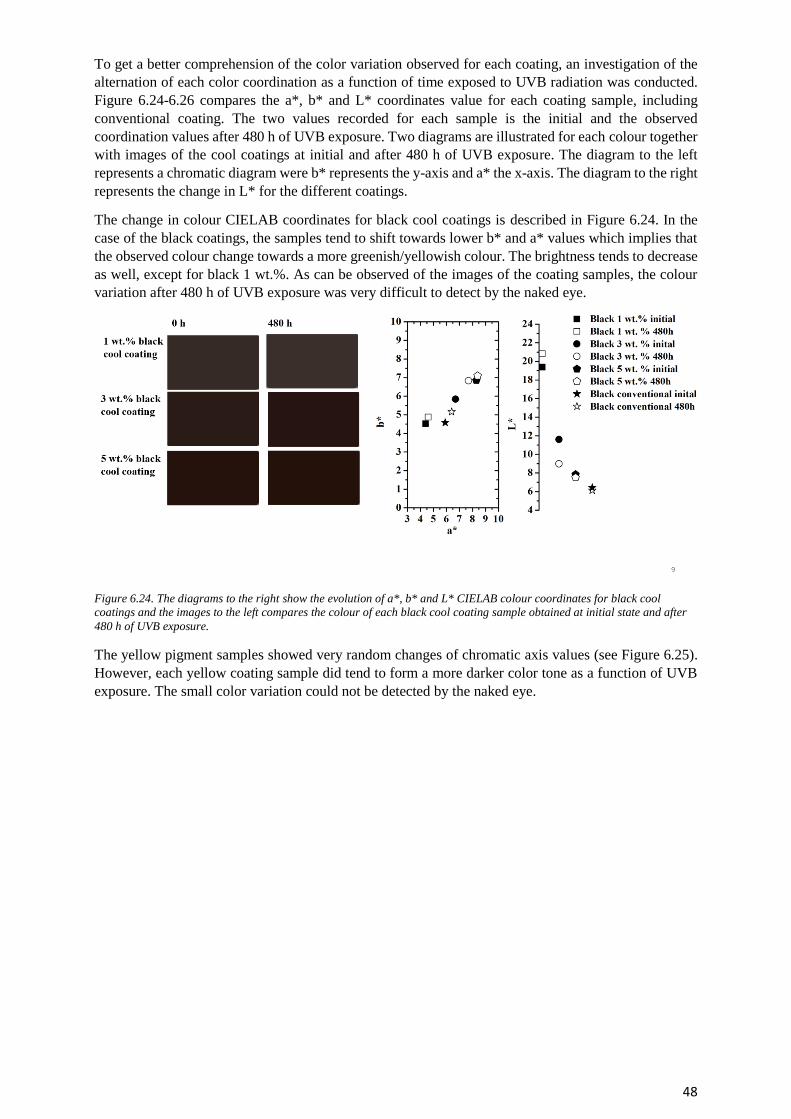
48
To get a better comprehension of the color variation observed for each coating, an investigation of the
alternation of each color coordination as a function of time exposed to UVB radiation was conducted.
Figure 6.24-6.26 compares the a*, b* and L* coordinates value for each coating sample, including
conventional coating. The two values recorded for each sample is the initial and the observed
coordination values after 480 h of UVB exposure. Two diagrams are illustrated for each colour together
with images of the cool coatings at initial and after 480 h of UVB exposure. The diagram to the left
represents a chromatic diagram were b* represents the y-axis and a* the x-axis. The diagram to the right
represents the change in L* for the different coatings.
The change in colour CIELAB coordinates for black cool coatings is described in Figure 6.24. In the
case of the black coatings, the samples tend to shift towards lower b* and a* values which implies that
the observed colour change towards a more greenish/yellowish colour. The brightness tends to decrease
as well, except for black 1 wt.%. As can be observed of the images of the coating samples, the colour
variation after 480 h of UVB exposure was very difficult to detect by the naked eye.
Figure 6.24. The diagrams to the right show the evolution of a*, b* and L* CIELAB colour coordinates for black cool
coatings and the images to the left compares the colour of each black cool coating sample obtained at initial state and after
480 h of UVB exposure.
The yellow pigment samples showed very random changes of chromatic axis values (see Figure 6.25).
However, each yellow coating sample did tend to form a more darker color tone as a function of UVB
exposure. The small color variation could not be detected by the naked eye.
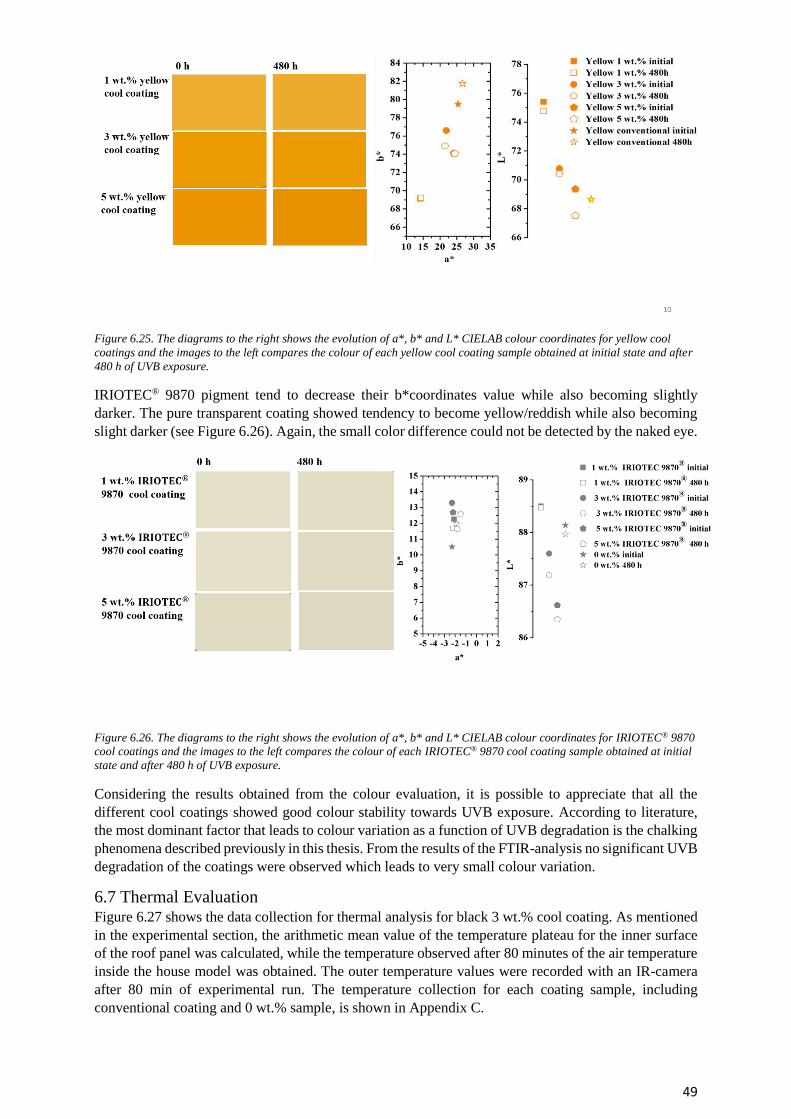
49
Figure 6.25. The diagrams to the right shows the evolution of a*, b* and L* CIELAB colour coordinates for yellow cool
coatings and the images to the left compares the colour of each yellow cool coating sample obtained at initial state and after
480 h of UVB exposure.
IRIOTEC® 9870 pigment tend to decrease their b*coordinates value while also becoming slightly
darker. The pure transparent coating showed tendency to become yellow/reddish while also becoming
slight darker (see Figure 6.26). Again, the small color difference could not be detected by the naked eye.
Figure 6.26. The diagrams to the right shows the evolution of a*, b* and L* CIELAB colour coordinates for IRIOTEC® 9870
cool coatings and the images to the left compares the colour of each IRIOTEC® 9870 cool coating sample obtained at initial
state and after 480 h of UVB exposure.
Considering the results obtained from the colour evaluation, it is possible to appreciate that all the
different cool coatings showed good colour stability towards UVB exposure. According to literature,
the most dominant factor that leads to colour variation as a function of UVB degradation is the chalking
phenomena described previously in this thesis. From the results of the FTIR-analysis no significant UVB
degradation of the coatings were observed which leads to very small colour variation.
6.7 Thermal Evaluation Figure 6.27 shows the data collection for thermal analysis for black 3 wt.% cool coating. As mentioned
in the experimental section, the arithmetic mean value of the temperature plateau for the inner surface
of the roof panel was calculated, while the temperature observed after 80 minutes of the air temperature
inside the house model was obtained. The outer temperature values were recorded with an IR-camera
after 80 min of experimental run. The temperature collection for each coating sample, including
conventional coating and 0 wt.% sample, is shown in Appendix C.
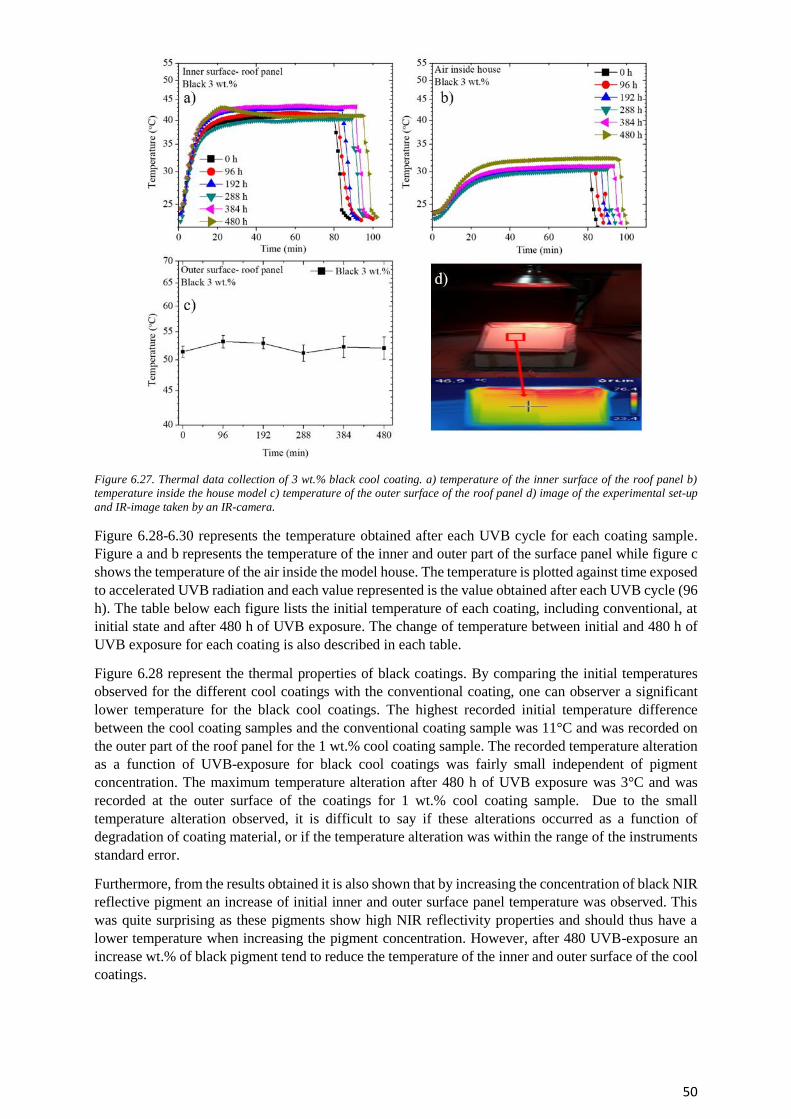
50
Figure 6.27. Thermal data collection of 3 wt.% black cool coating. a) temperature of the inner surface of the roof panel b)
temperature inside the house model c) temperature of the outer surface of the roof panel d) image of the experimental set-up
and IR-image taken by an IR-camera.
Figure 6.28-6.30 represents the temperature obtained after each UVB cycle for each coating sample.
Figure a and b represents the temperature of the inner and outer part of the surface panel while figure c
shows the temperature of the air inside the model house. The temperature is plotted against time exposed
to accelerated UVB radiation and each value represented is the value obtained after each UVB cycle (96
h). The table below each figure lists the initial temperature of each coating, including conventional, at
initial state and after 480 h of UVB exposure. The change of temperature between initial and 480 h of
UVB exposure for each coating is also described in each table.
Figure 6.28 represent the thermal properties of black coatings. By comparing the initial temperatures
observed for the different cool coatings with the conventional coating, one can observer a significant
lower temperature for the black cool coatings. The highest recorded initial temperature difference
between the cool coating samples and the conventional coating sample was 11°C and was recorded on
the outer part of the roof panel for the 1 wt.% cool coating sample. The recorded temperature alteration
as a function of UVB-exposure for black cool coatings was fairly small independent of pigment
concentration. The maximum temperature alteration after 480 h of UVB exposure was 3°C and was
recorded at the outer surface of the coatings for 1 wt.% cool coating sample. Due to the small
temperature alteration observed, it is difficult to say if these alterations occurred as a function of
degradation of coating material, or if the temperature alteration was within the range of the instruments
standard error.
Furthermore, from the results obtained it is also shown that by increasing the concentration of black NIR
reflective pigment an increase of initial inner and outer surface panel temperature was observed. This
was quite surprising as these pigments show high NIR reflectivity properties and should thus have a
lower temperature when increasing the pigment concentration. However, after 480 UVB-exposure an
increase wt.% of black pigment tend to reduce the temperature of the inner and outer surface of the cool
coatings.
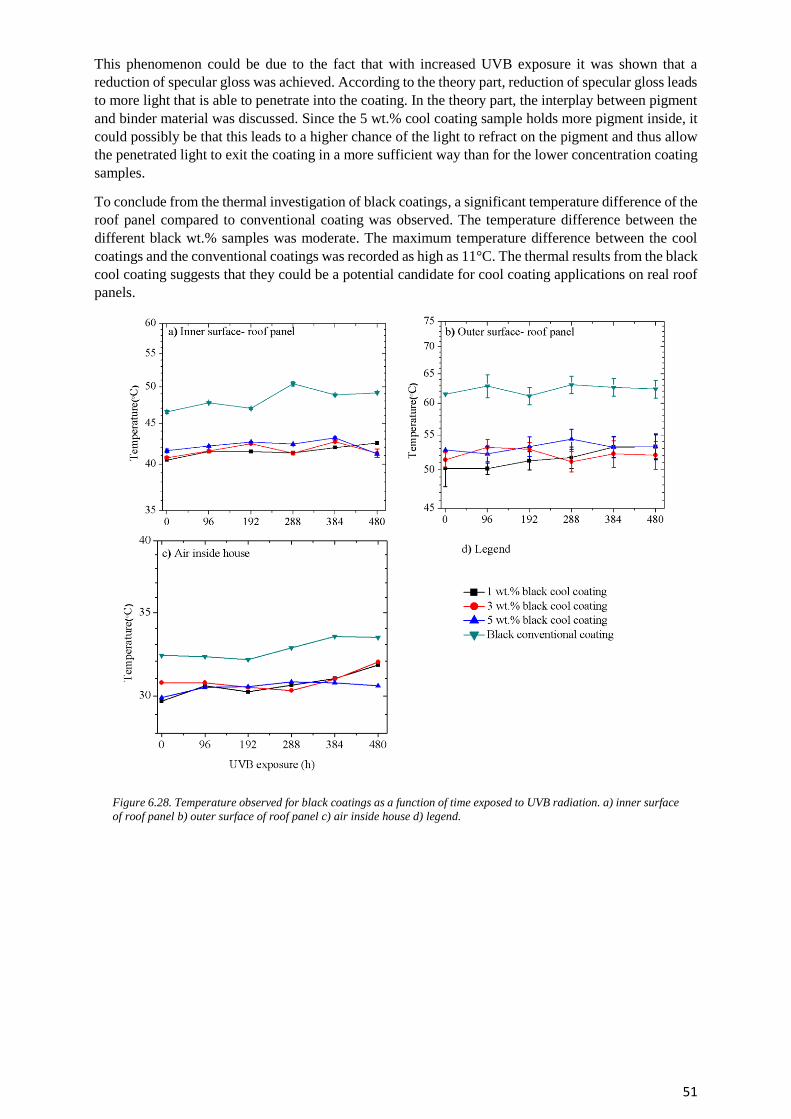
51
This phenomenon could be due to the fact that with increased UVB exposure it was shown that a
reduction of specular gloss was achieved. According to the theory part, reduction of specular gloss leads
to more light that is able to penetrate into the coating. In the theory part, the interplay between pigment
and binder material was discussed. Since the 5 wt.% cool coating sample holds more pigment inside, it
could possibly be that this leads to a higher chance of the light to refract on the pigment and thus allow
the penetrated light to exit the coating in a more sufficient way than for the lower concentration coating
samples.
To conclude from the thermal investigation of black coatings, a significant temperature difference of the
roof panel compared to conventional coating was observed. The temperature difference between the
different black wt.% samples was moderate. The maximum temperature difference between the cool
coatings and the conventional coatings was recorded as high as 11°C. The thermal results from the black
cool coating suggests that they could be a potential candidate for cool coating applications on real roof
panels.
Figure 6.28. Temperature observed for black coatings as a function of time exposed to UVB radiation. a) inner surface
of roof panel b) outer surface of roof panel c) air inside house d) legend.
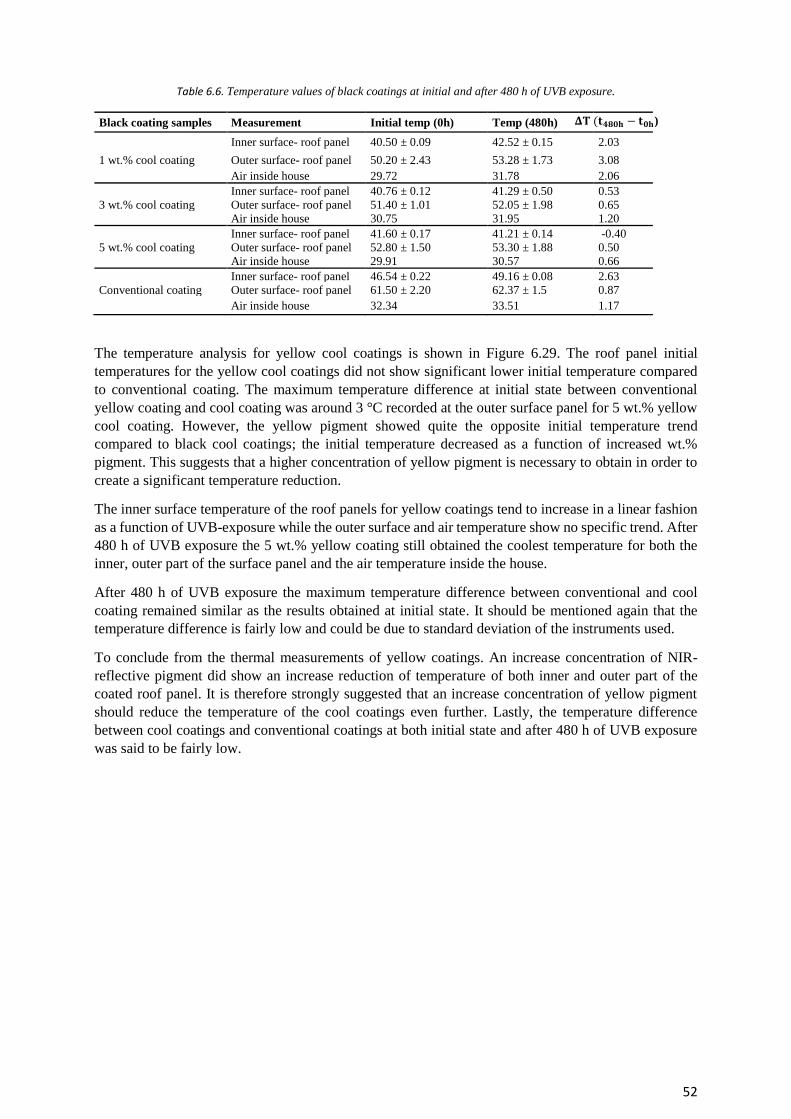
52
Table 6.6. Temperature values of black coatings at initial and after 480 h of UVB exposure.
Black coating samples Measurement Initial temp (0h) Temp (480h)
Inner surface- roof panel 40.50 ± 0.09 42.52 ± 0.15 2.03
1 wt.% cool coating Outer surface- roof panel 50.20 ± 2.43 53.28 ± 1.73 3.08
Air inside house 29.72 31.78 2.06
Inner surface- roof panel 40.76 ± 0.12 41.29 ± 0.50 0.53
3 wt.% cool coating Outer surface- roof panel 51.40 ± 1.01 52.05 ± 1.98 0.65
Air inside house 30.75 31.95 1.20
Inner surface- roof panel 41.60 ± 0.17 41.21 ± 0.14 -0.40
5 wt.% cool coating Outer surface- roof panel 52.80 ± 1.50 53.30 ± 1.88 0.50
Air inside house 29.91 30.57 0.66
Inner surface- roof panel 46.54 ± 0.22 49.16 ± 0.08 2.63
Conventional coating Outer surface- roof panel 61.50 ± 2.20 62.37 ± 1.5 0.87
Air inside house 32.34 33.51 1.17
The temperature analysis for yellow cool coatings is shown in Figure 6.29. The roof panel initial
temperatures for the yellow cool coatings did not show significant lower initial temperature compared
to conventional coating. The maximum temperature difference at initial state between conventional
yellow coating and cool coating was around 3 °C recorded at the outer surface panel for 5 wt.% yellow
cool coating. However, the yellow pigment showed quite the opposite initial temperature trend
compared to black cool coatings; the initial temperature decreased as a function of increased wt.%
pigment. This suggests that a higher concentration of yellow pigment is necessary to obtain in order to
create a significant temperature reduction.
The inner surface temperature of the roof panels for yellow coatings tend to increase in a linear fashion
as a function of UVB-exposure while the outer surface and air temperature show no specific trend. After
480 h of UVB exposure the 5 wt.% yellow coating still obtained the coolest temperature for both the
inner, outer part of the surface panel and the air temperature inside the house.
After 480 h of UVB exposure the maximum temperature difference between conventional and cool
coating remained similar as the results obtained at initial state. It should be mentioned again that the
temperature difference is fairly low and could be due to standard deviation of the instruments used.
To conclude from the thermal measurements of yellow coatings. An increase concentration of NIR-
reflective pigment did show an increase reduction of temperature of both inner and outer part of the
coated roof panel. It is therefore strongly suggested that an increase concentration of yellow pigment
should reduce the temperature of the cool coatings even further. Lastly, the temperature difference
between cool coatings and conventional coatings at both initial state and after 480 h of UVB exposure
was said to be fairly low.
𝚫𝐓 (𝐭𝟒𝟖𝟎𝐡 − 𝐭𝟎𝐡)
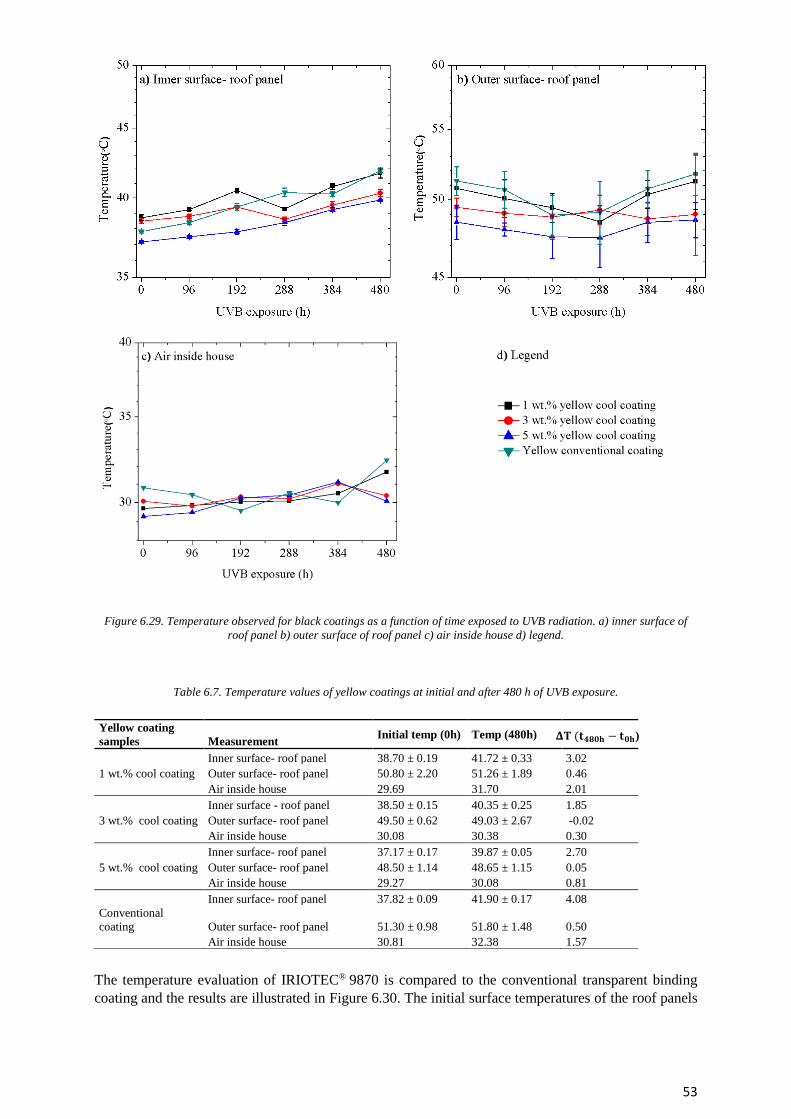
53
Figure 6.29. Temperature observed for black coatings as a function of time exposed to UVB radiation. a) inner surface of
roof panel b) outer surface of roof panel c) air inside house d) legend.
Table 6.7. Temperature values of yellow coatings at initial and after 480 h of UVB exposure.
The temperature evaluation of IRIOTEC® 9870 is compared to the conventional transparent binding
coating and the results are illustrated in Figure 6.30. The initial surface temperatures of the roof panels
Yellow coating
samples Measurement Initial temp (0h) Temp (480h)
Inner surface- roof panel 38.70 ± 0.19 41.72 ± 0.33 3.02
1 wt.% cool coating Outer surface- roof panel 50.80 ± 2.20 51.26 ± 1.89 0.46
Air inside house 29.69 31.70 2.01
Inner surface - roof panel 38.50 ± 0.15 40.35 ± 0.25 1.85
3 wt.% cool coating Outer surface- roof panel 49.50 ± 0.62 49.03 ± 2.67 -0.02
Air inside house 30.08 30.38 0.30
Inner surface- roof panel 37.17 ± 0.17 39.87 ± 0.05 2.70
5 wt.% cool coating Outer surface- roof panel 48.50 ± 1.14 48.65 ± 1.15 0.05
Air inside house 29.27 30.08 0.81
Inner surface- roof panel 37.82 ± 0.09 41.90 ± 0.17 4.08
Conventional
coating Outer surface- roof panel 51.30 ± 0.98 51.80 ± 1.48 0.50
Air inside house 30.81 32.38 1.57
𝚫𝐓 (𝐭𝟒𝟖𝟎𝐡 − 𝐭𝟎𝐡)
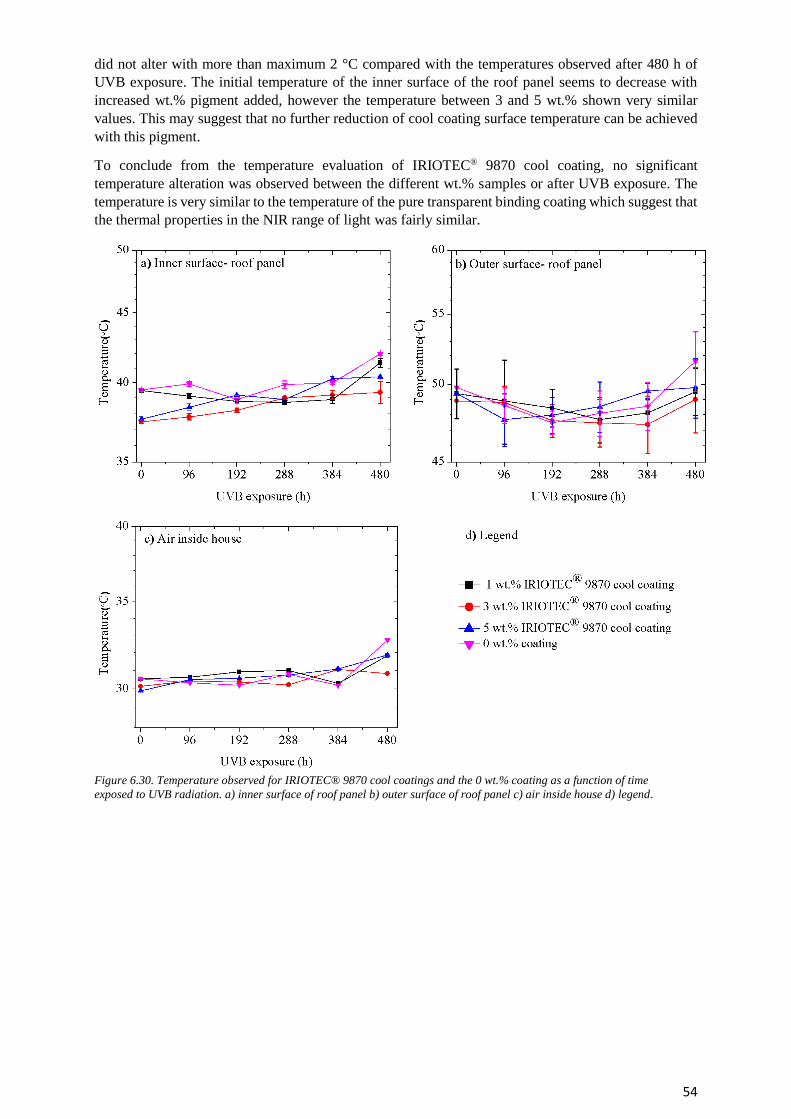
54
did not alter with more than maximum 2 °C compared with the temperatures observed after 480 h of
UVB exposure. The initial temperature of the inner surface of the roof panel seems to decrease with
increased wt.% pigment added, however the temperature between 3 and 5 wt.% shown very similar
values. This may suggest that no further reduction of cool coating surface temperature can be achieved
with this pigment.
To conclude from the temperature evaluation of IRIOTEC® 9870 cool coating, no significant
temperature alteration was observed between the different wt.% samples or after UVB exposure. The
temperature is very similar to the temperature of the pure transparent binding coating which suggest that
the thermal properties in the NIR range of light was fairly similar.
Figure 6.30. Temperature observed for IRIOTEC® 9870 cool coatings and the 0 wt.% coating as a function of time
exposed to UVB radiation. a) inner surface of roof panel b) outer surface of roof panel c) air inside house d) legend.
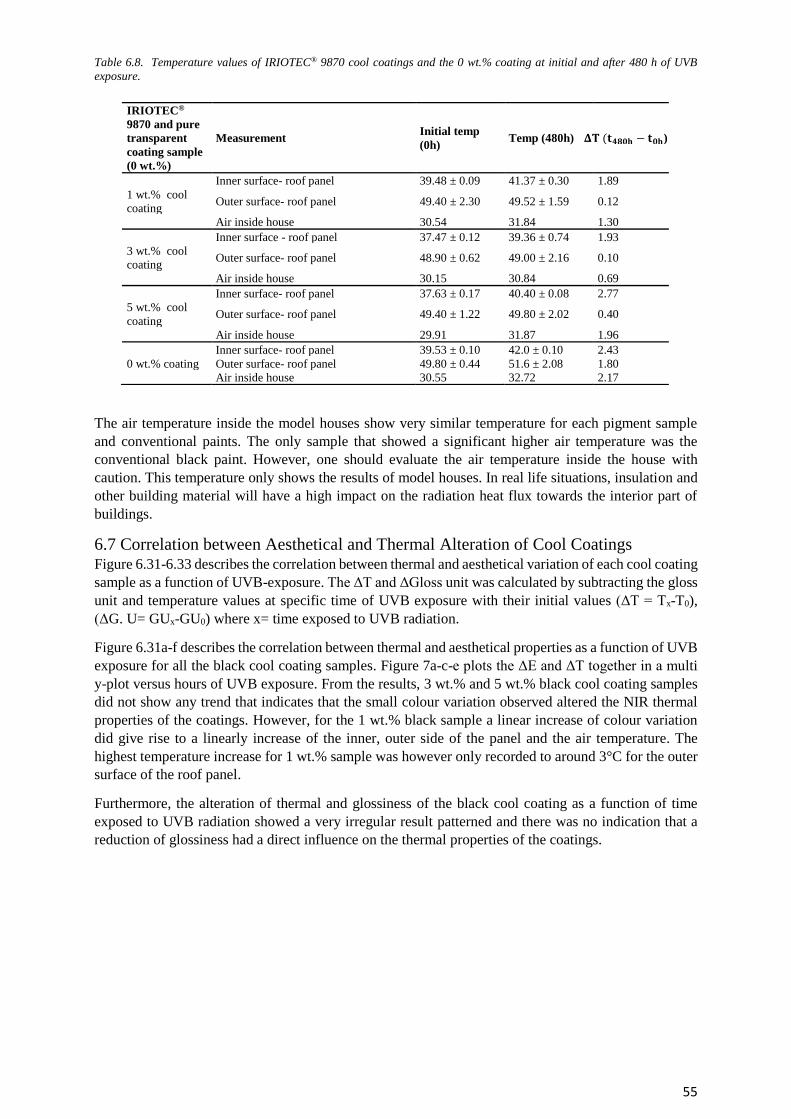
55
Table 6.8. Temperature values of IRIOTEC® 9870 cool coatings and the 0 wt.% coating at initial and after 480 h of UVB
exposure.
The air temperature inside the model houses show very similar temperature for each pigment sample
and conventional paints. The only sample that showed a significant higher air temperature was the
conventional black paint. However, one should evaluate the air temperature inside the house with
caution. This temperature only shows the results of model houses. In real life situations, insulation and
other building material will have a high impact on the radiation heat flux towards the interior part of
buildings.
6.7 Correlation between Aesthetical and Thermal Alteration of Cool Coatings Figure 6.31-6.33 describes the correlation between thermal and aesthetical variation of each cool coating
sample as a function of UVB-exposure. The ΔT and ΔGloss unit was calculated by subtracting the gloss
unit and temperature values at specific time of UVB exposure with their initial values (ΔT = Tx-T0),
(ΔG. U= GUx-GU0) where x= time exposed to UVB radiation.
Figure 6.31a-f describes the correlation between thermal and aesthetical properties as a function of UVB
exposure for all the black cool coating samples. Figure 7a-c-e plots the ΔE and ΔT together in a multi
y-plot versus hours of UVB exposure. From the results, 3 wt.% and 5 wt.% black cool coating samples
did not show any trend that indicates that the small colour variation observed altered the NIR thermal
properties of the coatings. However, for the 1 wt.% black sample a linear increase of colour variation
did give rise to a linearly increase of the inner, outer side of the panel and the air temperature. The
highest temperature increase for 1 wt.% sample was however only recorded to around 3°C for the outer
surface of the roof panel.
Furthermore, the alteration of thermal and glossiness of the black cool coating as a function of time
exposed to UVB radiation showed a very irregular result patterned and there was no indication that a
reduction of glossiness had a direct influence on the thermal properties of the coatings.
IRIOTEC®
9870 and pure
transparent
coating sample
(0 wt.%)
Measurement Initial temp
(0h) Temp (480h)
Inner surface- roof panel 39.48 ± 0.09 41.37 ± 0.30 1.89
1 wt.% cool
coating Outer surface- roof panel 49.40 ± 2.30 49.52 ± 1.59 0.12
Air inside house 30.54 31.84 1.30
Inner surface - roof panel 37.47 ± 0.12 39.36 ± 0.74 1.93
3 wt.% cool
coating Outer surface- roof panel 48.90 ± 0.62 49.00 ± 2.16 0.10
Air inside house 30.15 30.84 0.69
Inner surface- roof panel 37.63 ± 0.17 40.40 ± 0.08 2.77
5 wt.% cool
coating Outer surface- roof panel 49.40 ± 1.22 49.80 ± 2.02 0.40
Air inside house 29.91 31.87 1.96
Inner surface- roof panel 39.53 ± 0.10 42.0 ± 0.10 2.43
0 wt.% coating Outer surface- roof panel 49.80 ± 0.44 51.6 ± 2.08 1.80
Air inside house 30.55 32.72 2.17
𝚫𝐓 (𝐭𝟒𝟖𝟎𝐡 − 𝐭𝟎𝐡)
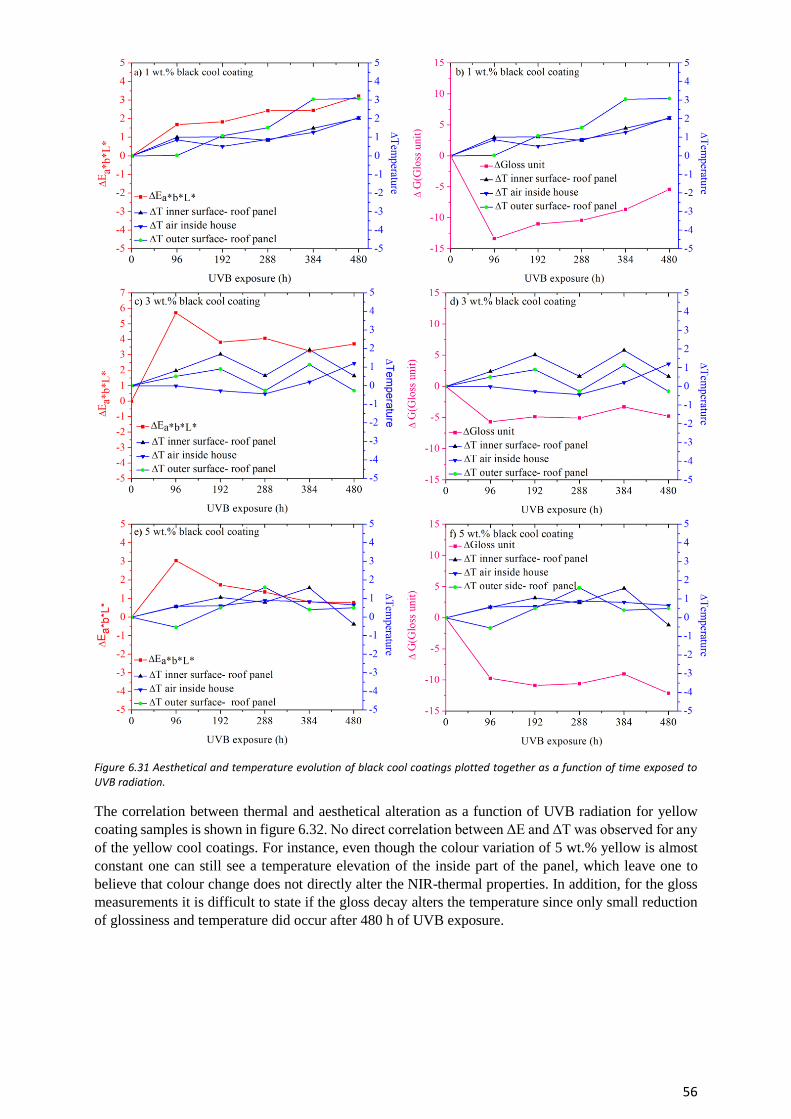
56
Figure 6.31 Aesthetical and temperature evolution of black cool coatings plotted together as a function of time exposed to UVB radiation.
The correlation between thermal and aesthetical alteration as a function of UVB radiation for yellow
coating samples is shown in figure 6.32. No direct correlation between ΔE and ΔT was observed for any
of the yellow cool coatings. For instance, even though the colour variation of 5 wt.% yellow is almost
constant one can still see a temperature elevation of the inside part of the panel, which leave one to
believe that colour change does not directly alter the NIR-thermal properties. In addition, for the gloss
measurements it is difficult to state if the gloss decay alters the temperature since only small reduction
of glossiness and temperature did occur after 480 h of UVB exposure.
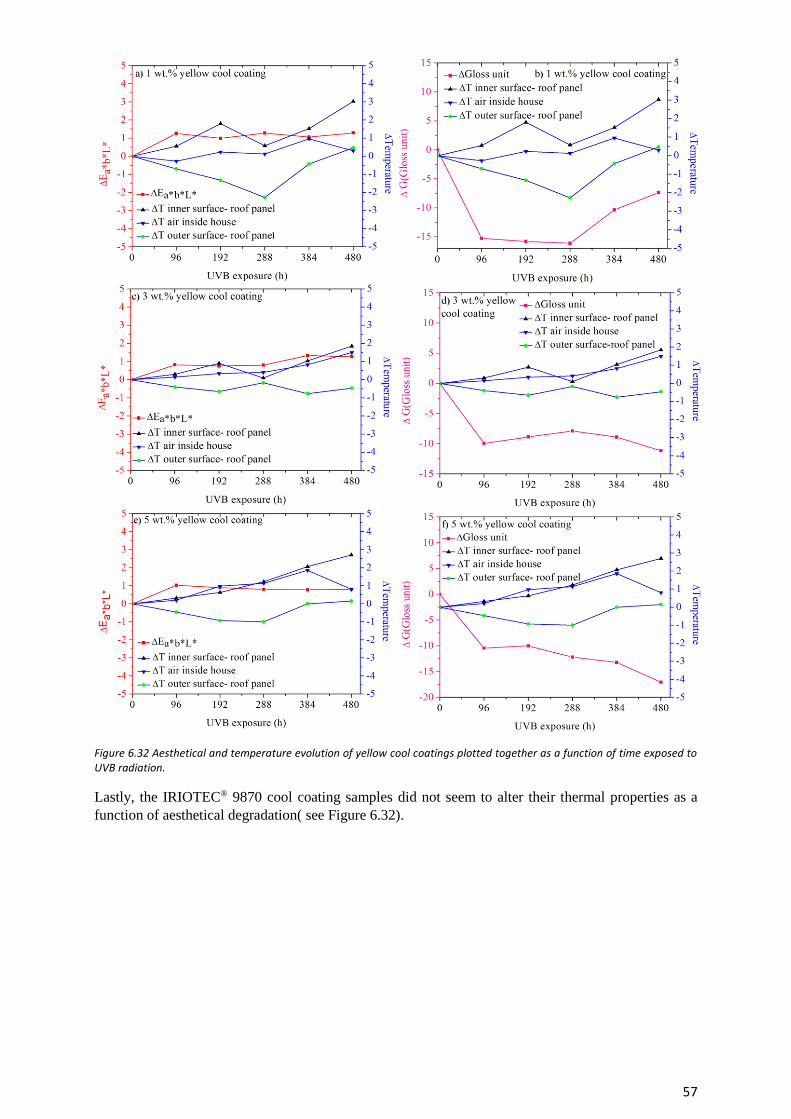
57
Figure 6.32 Aesthetical and temperature evolution of yellow cool coatings plotted together as a function of time exposed to UVB radiation.
Lastly, the IRIOTEC® 9870 cool coating samples did not seem to alter their thermal properties as a
function of aesthetical degradation( see Figure 6.32).
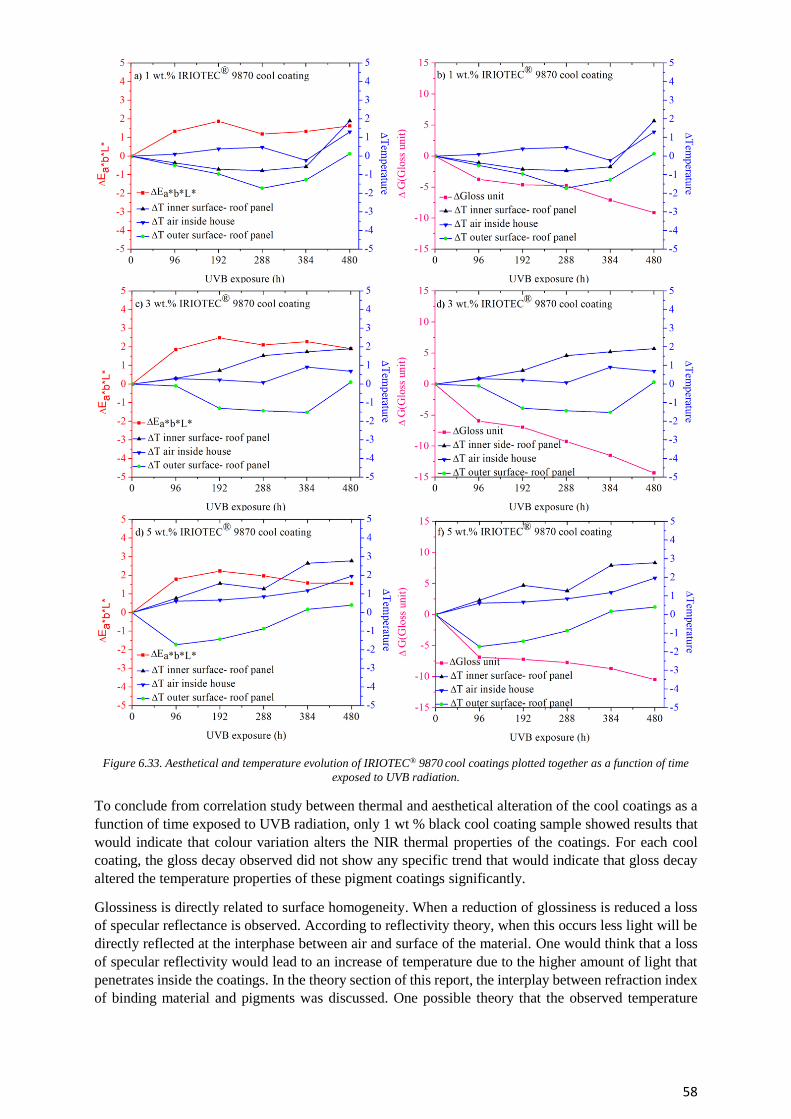
58
Figure 6.33. Aesthetical and temperature evolution of IRIOTEC® 9870 cool coatings plotted together as a function of time
exposed to UVB radiation.
To conclude from correlation study between thermal and aesthetical alteration of the cool coatings as a
function of time exposed to UVB radiation, only 1 wt % black cool coating sample showed results that
would indicate that colour variation alters the NIR thermal properties of the coatings. For each cool
coating, the gloss decay observed did not show any specific trend that would indicate that gloss decay
altered the temperature properties of these pigment coatings significantly.
Glossiness is directly related to surface homogeneity. When a reduction of glossiness is reduced a loss
of specular reflectance is observed. According to reflectivity theory, when this occurs less light will be
directly reflected at the interphase between air and surface of the material. One would think that a loss
of specular reflectivity would lead to an increase of temperature due to the higher amount of light that
penetrates inside the coatings. In the theory section of this report, the interplay between refraction index
of binding material and pigments was discussed. One possible theory that the observed temperature
59
alteration remained low while gloss reduction was quite significant could be that the refraction index of
the pigments and binding material was very optimally designed both for the commercialized and the
cool coatings leading to a high amount of diffuse scattering reflection of the penetrated light.
60
Chapter VII
7. Conclusion This study set out to characterize and evaluate thermal, aesthetical and durability parameters of three
different cool coatings. The cool coatings were made by mixing a transparent acrylic based
commercialized paint together with NIR- reflective inorganic pigments. Three different NIR reflective
pigments were used that formed cooling properties to the coating and gave rise to black, yellow and
semi-transparent colour sensation to the paint formulation. The black and yellow pigment were NIR-
inorganic CCIP while the semi-transparent pigment (IRIOTEC® 9870) was a so called special-effect
pigment that gave rise to a 3-D colour sensation. In addition, different concentration of pigment added
to the binder material was studied to evaluate its effect on the mentioned parameters. The durability of
the cool coatings was evaluated by investigating their change of aesthetical and thermal properties as a
function of accelerated UVB-exposure. The total amount of UVB exposure was set to 480 h, 96h/cycle.
The most significant results that emerged from this study were the following:
• Evaluation of mixing method: The method used for mixing the paint was sufficient to form
uniformly dispersion of pigments inside the coatings. The black and yellow pigments did form
small agglomerations; however, the size of the agglomeration was small. It is strongly believed
that the agglomeration for these two pigments occurred due to the absence of capping agents
since no agglomerates were observed for the larger IRIOTEC® 9870 pigment based cool
coatings.
• Degradation of cool coatings: Only small traces of UVB-degradation due to photooxidation
processes was observed for the formed cool coatings independent on the type and loading
content of pigment used after 480 h of UVB degradation. No significant change of the
degradation kinetics was observed between the different samples which implies that the pigment
type and/or concentration did not slow down or accelerate the degradation process significantly.
• Aesthetical evaluation. The color variation as a function of UVB degradation was fairly
independent on the type and loading content of pigment. No sample did achieve a higher ΔE
value than 4 and the color variation after 480 h of UVB exposure was barely visible to the naked
eye. Neither of the pigment type showed a specific color variation trend that would suggest that
pigment wt.% did affect the color stability of the samples. The highest color stability was shown
for yellow cool coating samples followed by IRIOTEC® 9870 and black cool coating samples.
The initial gloss of the different cool coatings decreased linearly as a function of increased
pigment concentration. The highest initial gloss value was obtained by the black pigments
followed by yellow and lastly IRIOTEC® 9870 sample. These observations indicate that the
chemical nature and concentration of pigment alters the surface homogeneity of the coatings.
Lowest gloss decay as a function of hours exposed to UVB-light was observed for the black
cool coating samples, followed by yellow and IRIOTEC® 9870.
In addition, increased pigment concentration increased the gloss decay for each pigment type.
However, IRIOTEC® 9870 obtained similar gloss decay rate for the 3 and 5 wt.% sample which
indicates that a maximum gloss decay rate may have been established already at 3 wt.%. The
lowest gloss decay rate was achieved for black coating samples followed by yellow and
IRIOTEC® 9870 sample.
Lastly, by comparing the gloss decay rate with commercialized coatings and the pure transparent
coating, it was suggested that the gloss decay for each pigment was quite stable. None of the
coatings did lose more than 40 % of their initial gloss.
61
The main reason for alteration in gloss and color was believed to be due to photooxidation
degradation of the acrylic based binding material. This degradation process will alter the color
due to a process called chalking that also will lead to a change in color and surface roughness.
• Thermal evaluation. The initial temperature of the roof panel containing black cool coating
achieved a maximum temperature reduction of 11 °C compared to conventional black coating.
A maximum of 3 °C of temperature alteration as a function of UVB degradation was observed
for these coatings, leading to believe that the thermal properties was quite stable. The amount
of black pigment added to the sample did not alter the thermal properties significantly. There
were no indication showing that the aesthetical alteration as a function of UVB-exposure
influenced the thermal properties of the different black cool coatings significantly.
Yellow cool coatings achieved similar roof panel temperature as the conventional coating. It
was therefore concluded that the amount of yellow pigment was too small to from a proper cool
coating. The panel temperature tends to increase for yellow pigment as a function of UVB-
degradation. However, the temperature increase does not rise above 4°C and was thus decided
to be quite small. There is no indication that aesthetical alteration as a function of UVB-
degradation of yellow cool coatings has a direct effect on their thermal properties.
IRIOTEC® 9870 cool coatings showed small thermal alteration as a function of UVB exposure
and concentration of pigment. The temperature of these coating samples achieved a maximum
temperature reduction of 4°C compared to the pure binding material coating. In addition, from
the comparison study of aesthetical and thermal properties there were no evidence stating that
the aesthetical alteration did affect the thermal properties significantly.
Taken together, these results indicate that only black pigment cool coatings did achieve a significant
reduction of temperature, compared to conventional coating, while also maintaining high stability after
being exposed to accelerated UVB-degradation. The results achieved in this report provides essential
data for future work considering these pigments and cool coating applications.
62
Chapter VIII
8. Future Work As mentioned several times in this thesis, a strong reason why so small alteration of color and thermal
properties as a function of UVB-exospore was shown, was believed to be due to the very stable binding
material used in this project. The binding material was commercialized and optimized for outdoor
application. For future work it is necessary to increase the total amount of hour exposed to accelerated
UVB-light if similar binding material is to be used. In this way a proper evaluation of all the measured
parameters can be conducted.
The UVB-exposure was done in a so-called accelerated weathering test standard. It would however for
future work be interesting to evaluate the mentioned properties in real field exposure conditions.
The different wt.% of pigment gave rise to a different color sensation. It would be more convenient to
add a higher amount of pigment so that the color variation remains constant with minimal color
difference between the different wt.% sample. In this case one can remove the possible effect the color
sensation may have on the temperature profile of the different wt.% coatings. Even though IR-lamps
was used in this report, they do emit small part of visible light which might have disturbed the thermal
measurements.
Furthermore, it would also be interesting to analyze the incorporation of NIR-reflective pigments inside
conventional coatings. NIR-reflective pigments are more expensive than normal pigments. It is therefore
vital to try to add as small amount as possible of these pigments to paint formulations. Since pigments
also give rise to color sensation, it could be an interesting idea to use conventional pigments to achieve
color sensation and then add small amount of NIR-reflective pigments to achieve cooling properties.
A significant number of published articles mention thermal emittance and NIR-light reflectivity as the
most important parameters to obtain for cool coatings [4,8,9,10,11]. Due to lack of equipment these
parameters could not be measured in this project. However, it is strongly recommended these two
parameters is investigated for future work. For instance, the binding material used in this project had
silicon aluminum oxide inside in order to increase the mechanical and wetting properties. However pure
silicon oxide and aluminum oxide achieves very high reflectivity of NIR-light. It would have been
interesting to measure the NIR reflectivity of silicon alumina oxide to have an understanding on the
optical properties of the transparent paint used in this thesis as a binding material.
.
63
Chapter IX
9. Bibliography [1] Zhang, J., & Wu, L. (2017). Influence of human population movements on urban climate of
Beijing during the Chinese New Year holiday. Scientific Reports,7, 45813. doi:10.1038/srep45813
[2] Taha, H., Sailor, D., & Akbari, H. (1992). High-albedo materials for reducing building cooling
energy use. doi:10.2172/10178958
[3] Gunawardena, K., Wells, M., & Kershaw, T. (2017). Utilising green and bluespace to mitigate
urban heat island intensity. Science of The Total Environment,584-585, 1040-1055.
doi:10.1016/j.scitotenv.2017.01.158
[4] Meenakshi, P., & Selvaraj, M. (2018). Bismuth titanate as an infrared reflective pigment for cool
roof coating. Solar Energy Materials and Solar Cells,174, 530-537. doi:10.1016/j.solmat.2017.09.048
(https://reader.elsevier.com/reader/sd/E688AB77420080449F2E9C4F8119C06CCAD23683311EBCC
DE52D07B2ACEDEBF0D19C99C088995253A5634C78DDBF4323)
[5] Cardelino, C. A., & Chameides, W. L. (1990). Natural hydrocarbons, urbanization, and urban
ozone. Journal of Geophysical Research,95(D9), 13971. doi:10.1029/jd095id09p13971
[6] Kolokotsa, D., Psomas, A., & Karapidakis, E. (2009). Urban heat island in southern Europe: The
case study of Hania, Crete. Solar Energy,83(10), 1871-1883. doi:10.1016/j.solener.2009.06.018
[7] Urban värmeö. (2018, May 03). Retrieved from https://sv.wikipedia.org/wiki/Urban_värmeö
[8] Thongkanluang, T., Chirakanphaisarn, N., & Limsuwan, P. (2012). Preparation of NIR Reflective
Brown Pigment. Procedia Engineering,32, 895-901. doi:10.1016/j.proeng.2012.02.029
[9] Uemoto, K. L., Sato, N. M., & John, V. M. (2010). Estimating thermal performance of cool
colored paints. Energy and Buildings,42(1), 17-22. doi:10.1016/j.enbuild.2009.07.026
[10] Yang, R., Han, A., Ye, M., Chen, X., & Yuan, L. (2017). Synthesis, characterization and thermal
performance of Fe/N co-doped MgTiO 3 as a novel high near-infrared reflective pigment. Solar
Energy Materials and Solar Cells,160, 307-318. doi:10.1016/j.solmat.2016.10.045
[11] Yang, R., Han, A., Ye, M., Chen, X., & Yuan, L. (2017). The influence of Mn/N-codoping on the
thermal performance of ZnAl 2 O 4 as high near-infrared reflective inorganic pigment. Journal of
Alloys and Compounds,696, 1329-1341. doi:10.1016/j.jallcom.2016.12.100
[12] jd095id09p13971Chemistry in the Sunlight : Feature Articles. (n.d.). Retrieved from
https://earthobservatory.nasa.gov/Features/ChemistrySunlight/chemistry_sunlight3.php
[13] Cardelino, C. A., & Chameides, W. L. (1990). Natural hydrocarbons, urbanization, and urban
ozone. Journal of Geophysical Research,95(D9), 13971. doi:10.1029/
[14] Thakur, R. S. (2014, December 10). Air Pollution. Retrieved from
https://www.slideshare.net/rajendrasinghthakur/air-pollution-42591127
[15] Heat Island Effect. (2018, March 26). Retrieved from https://www.epa.gov/heat-islands
[16] Sandin O. (2013). Optical and mechanical properties of cool roof paint containing hollow
thermoplastic microspheres. [online] DIVA. Available at http://uu.diva-
portal.org/smash/record.jsf?aq2=%5B%5B%5D%5D&c=18%af=%5b%5D%seachType=SIMPLE%q
uery=&language=sv%pid=diva2%3A643316&aq=%5B%5B%7B%22categoryId%22%3A%2211602
%22%7D%5D%5D&sf=all&aqw=%5B%5D&sortOrder=author_sort_asc&onlyFullText=false&noOF
Rows=50&dswid=-3468
64
[17] Cool Colored Roofs to Save Energy and Improve Air Quality. (n.d.). Retrieved from
https://www.bing.com/cr?IG=97348F17D8664F28BBB39EC5D4769C90&CID=31758FF5896E6E6B
3DD583EC88936FA1&rd=1&h=gf6AeHUg6PwziftBLXyEwD9JrRykpJ4z_mfpiL7FiAs&v=1&r=htt
ps://www.coolrooftoolkit.org/wp-content/uploads/2012/04/eScholarship-UC-item-
20j676c9.pdf&p=DevEx.LB.1,5497.1
[18] On the impact of urban climate on the energy consumption of buildings. (2001, February 05).
Retrieved from https://www.sciencedirect.com/science/article/pii/S0038092X00000955
[19] Georgakis, C., & Santamouris, M. (2017). Determination of the Surface and Canopy Urban Heat
Island in Athens Central Zone Using Advanced Monitoring. Climate,5(4), 97. doi:10.3390/cli5040097
[20] A.J Mulson & J.M Herbert. 2003. Electroceramics. West sussex, England: John Wiley & sons ltd.
[21] Common.wikipedia.org. (2018). File: Electromagnetic waves.png- Wikimedia Commons.
[online] Available at: http://commons.wilimedia.org/wiki/File:Electromagnetic_waves.png [Accessed
15 Apr. 2018].
[22] Malshe, V., & Bendiganavale, A. (2008). Infrared Reflective Inorganic Pigments. Recent Patents
on Chemical Engineeringe,1(1), 67-79. doi:10.2174/2211334710801010067
[23] Smith, H. M. (2009). High performance pigments. Weinheim: Wiley-VCH.
[24] Rutile. (2018, June 2). Retrieved from https://en.wikipedia.org/wiki/Rutile
[25] Harris, D. C., & Lucy, C. A. (2017). Quantitative chemical analysis. New York, NY: Macmillan
Higher Education / Worth Publ.
[26] Eprints.unifeit. (2018). [online] Available at: http://eprints-unife.it/465/1/PhD_Boselli.pdf
[Acessed 26 jun. 2018].
[27] Moran, M. J., Moran, M. J., Shapiro, H. N., Boettner, D. D., & Bailey, M. B.
(2018). Fundamentals of engineering thermodynamics. Hoboken, NJ: John Wiley & Sons.
[28] Granqvist, C. G. (1981, August 01). Radiative heating and cooling with spectrally selective
surfaces. Retrieved from https://www.osapublishing.org/abstract.cfm?URI=ao-20-15-2606
[29] The Law of Reflection. (n.d.). Retrieved from
http://www.physicsclassroom.com/mmedia/optics/lr.cfm
[30] Farrier.Lisa, (2006). INFLUENCE OF SURFACE ROUGHNESS ON THE SPECULAR
REFLECTANCE OF LOW GLOSS COATINGS USING BIDIRECTIONAL REFLECTANCE
MEASUREMENTS . Avilable at: http://www.dtic.mil/dtic/tr/fulltext/u2/a464906.pdf. [Acessed 15
march. 2018]
[31] P. Fairey, Radiant Energy Transfer and Radiant Barrier Systems in Buildings. Design Note 6,
Florida Energy Center, Cape Canaveral, FL, 1986
[32] Coser, E., Moritz, V. F., Krenzinger, A., & Ferreira, C. A. (2015). Development of paints with
infrared radiation reflective properties. Polímeros,25(3), 305-310. doi:10.1590/0104-1428.1869
[33] Fang, V., Kennedy, J. V., Futter, J., & Manning, J. (2013). A review of near infrared reflectance
properties of metal oxide nanostructures. Lower Hutt, New Zealand: GNS Science.
[34] Synnefa, A., Santamouris, M., & Apostolakis, K. (2007). On the development, optical properties
and thermal performance of cool colored coatings for the urban environment. Solar Energy,81(4), 488-
497. doi:10.1016/j.solener.2006.08.005
65
[35] Weiner, J., & Nunes, F. (2017). Light-matter interaction: Physics and engineering at the
nanoscale. Oxford: Oxford University Press.
[36] Snell's law. (2018, June 1). Retrieved from https://en.wikipedia.org/wiki/Snell's_law
[37] Berdahl, P., & Bretz, S. E. (1997). Preliminary survey of the solar reflectance of cool roofing
materials. Energy and Buildings,25(2), 149-158. doi:10.1016/s0378-7788(96)01004-3
[38] How to get changing patterns on a textile surface by using ... (2018, June 6). Retrieved from
https://www.bing.com/cr?IG=8985573AD9744D9496EA6AE901DE35E5&CID=27B21622E444652
C1FC71A38E5B964B0&rd=1&h=PS-
zUmUIA1vgeCCk0KiIh2zCHFFmXgX1WEW3LQLwrp8&v=1&r=https://www.researchgate.net/prof
ile/Sara_Eivazi/publication/277230453_How_to_get_changing_patterns_on_a_textile_surface_by_usi
ng_pearl_luster_and_color_travel_pigments/links/55d6ffdc08ae9d65948c1f1f.pdf?inViewer=true&dis
ableCoverPage=true&origin=publication_detail&p=DevEx.LB.1,5389.1
[39] Yousif, E., & Haddad, R. (2013). Photodegradation and photostabilization of polymers, especially
polystyrene: Review. SpringerPlus,2(1), 398. doi:10.1186/2193-1801-2-398
[40] Wojciechowski, K., Zukowska, G. Z., Korczagin, I., & Malanowski, P. (2015). Effect of TiO2 on
UV stability of polymeric binder films used in waterborne facade paints. Progress in Organic
Coatings,85, 123-130. doi:10.1016/j.porgcoat.2015.04.002
[41] Ghasemi-Kahrizsangi, A., Neshati, J., Shariatpanahi, H., & Akbarinezhad, E. (2015). Improving
the UV degradation resistance of epoxy coatings using modified carbon black nanoparticles. Progress
in Organic Coatings,85, 199-207. doi:10.1016/j.porgcoat.2015.04.011
[42] SEM JEOL USA Electron Optics Documents & Downloads. (n.d.). Retrieved from
https://www.jeolusa.com/RESOURCES/Electron-Optics/Documents-Downloads/EntryId/59
[43] Ecco, L., Rossi, S., Fedel, M., & Deflorian, F. (2017). Color variation of electrophoretic styrene-
acrylic paints under field and accelerated ultraviolet exposure. Materials & Design,116, 554-564.
doi:10.1016/j.matdes.2016.12.051
[44] CIELAB color space. (2018, June 19). Retrieved from
https://en.wikipedia.org/wiki/CIELAB_color_space
[45 COLOR SPACE EFTER ATT JAG FRÅGAT)
[46] Gloss-meters. (n.d.). Retrieved from http://www.gloss-meters.com/ContactUs.html
[47] Fourier-transform infrared spectroscopy. (2018, June 19). Retrieved from
https://en.wikipedia.org/wiki/Fourier-transform_infrared_spectroscopy
[48] Smith, B. C. (2011). Fundamentals of Fourier transform infrared spectroscopy. Boca Raton: CRC
Press.
[49] Libretexts. (2016, July 21). How an FTIR Spectrometer Operates. Retrieved from
https://chem.libretexts.org/Core/Physical_and_Theoretical_Chemistry/Spectroscopy/Vibrational_Spec
troscopy/Infrared_Spectroscopy/How_an_FTIR_Spectrometer_Operates
[50] Publications.lib.chalmers.se. (2018). [online] Available at:
http://publications.lib.chalmers.se/records/fulltext/254924/254924.pdf[Accessed 3 Jun. 2018]
[51] X-ray Powder Diffraction (XRD). (2018, June 25). Retrieved from
https://serc.carleton.edu/research_education/geochemsheets/techniques/XRD.html
[52]. ICDD-International Centre for Diffraction Data. (2018, August 19). Retrieved from
httop://www.icdd.com/

66
[53]. Paint, pigment, solvent, coating, emulsion, paint additives and formulations. (2008). Delhi, India:
Engineers India Research Institute.
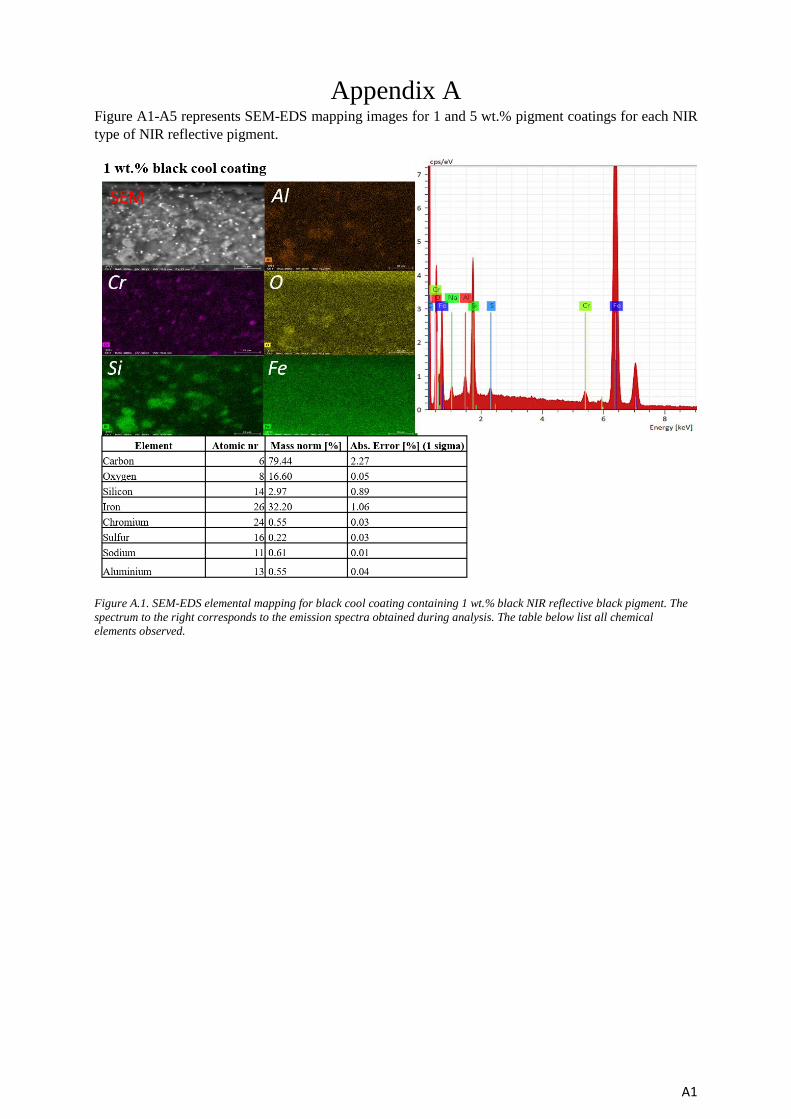
A1
Appendix A Figure A1-A5 represents SEM-EDS mapping images for 1 and 5 wt.% pigment coatings for each NIR
type of NIR reflective pigment.
Figure A.1. SEM-EDS elemental mapping for black cool coating containing 1 wt.% black NIR reflective black pigment. The
spectrum to the right corresponds to the emission spectra obtained during analysis. The table below list all chemical
elements observed.
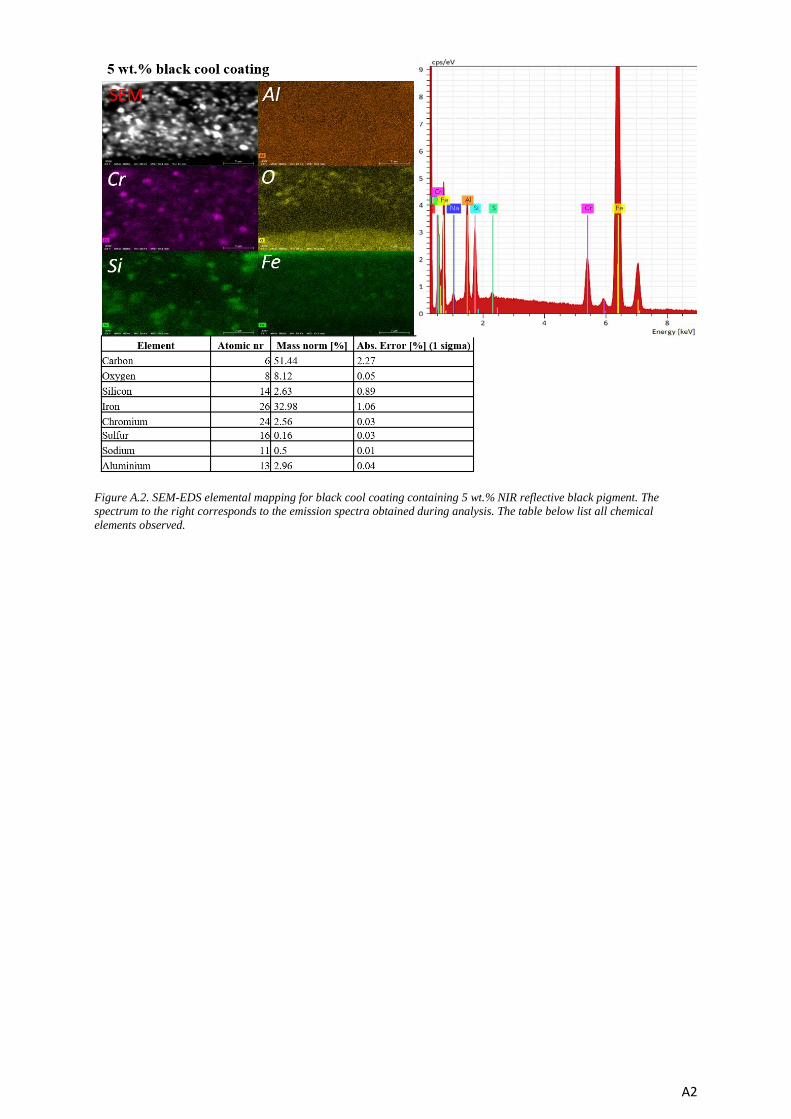
A2
Figure A.2. SEM-EDS elemental mapping for black cool coating containing 5 wt.% NIR reflective black pigment. The
spectrum to the right corresponds to the emission spectra obtained during analysis. The table below list all chemical
elements observed.
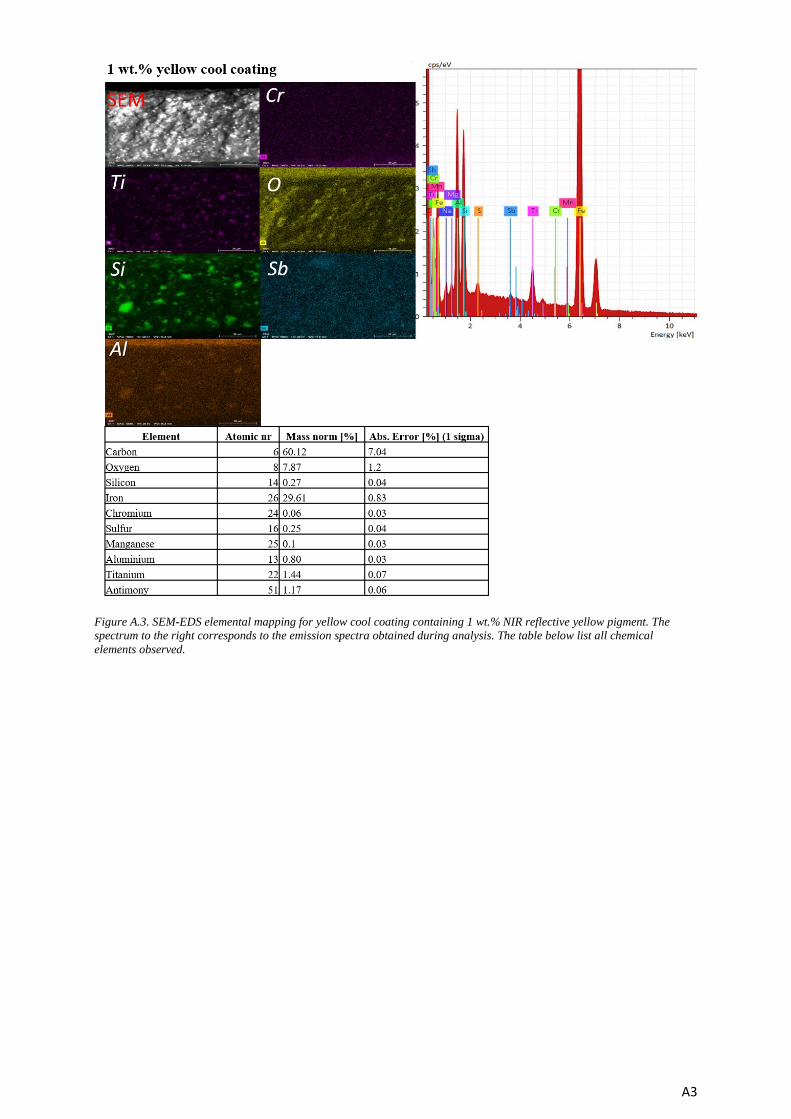
A3
Figure A.3. SEM-EDS elemental mapping for yellow cool coating containing 1 wt.% NIR reflective yellow pigment. The
spectrum to the right corresponds to the emission spectra obtained during analysis. The table below list all chemical
elements observed.
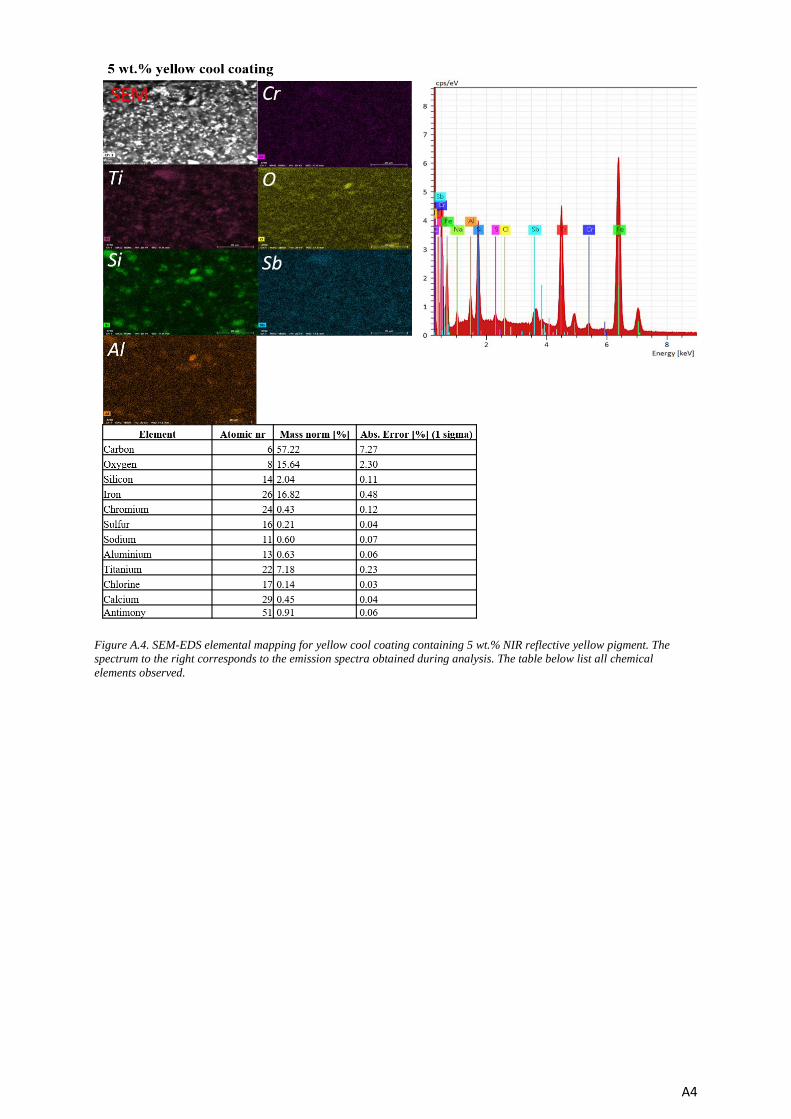
A4
Figure A.4. SEM-EDS elemental mapping for yellow cool coating containing 5 wt.% NIR reflective yellow pigment. The
spectrum to the right corresponds to the emission spectra obtained during analysis. The table below list all chemical
elements observed.
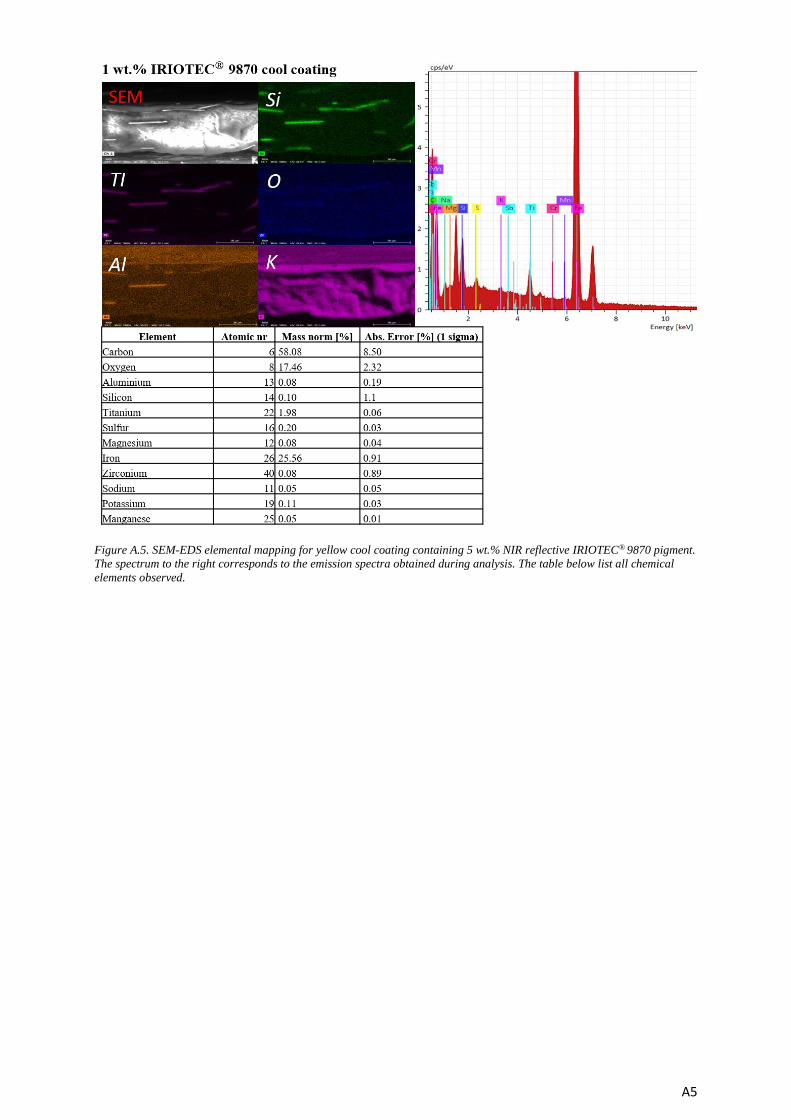
A5
Figure A.5. SEM-EDS elemental mapping for yellow cool coating containing 5 wt.% NIR reflective IRIOTEC® 9870 pigment.
The spectrum to the right corresponds to the emission spectra obtained during analysis. The table below list all chemical
elements observed.
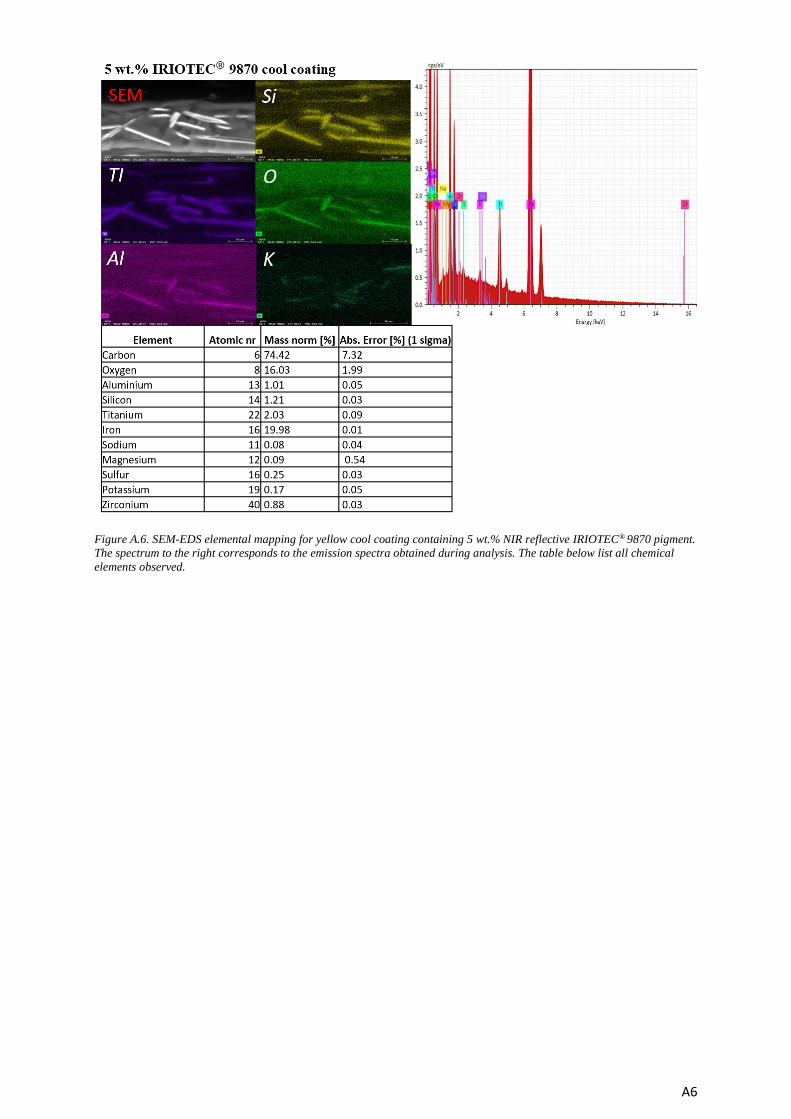
A6
Figure A.6. SEM-EDS elemental mapping for yellow cool coating containing 5 wt.% NIR reflective IRIOTEC® 9870 pigment.
The spectrum to the right corresponds to the emission spectra obtained during analysis. The table below list all chemical
elements observed.
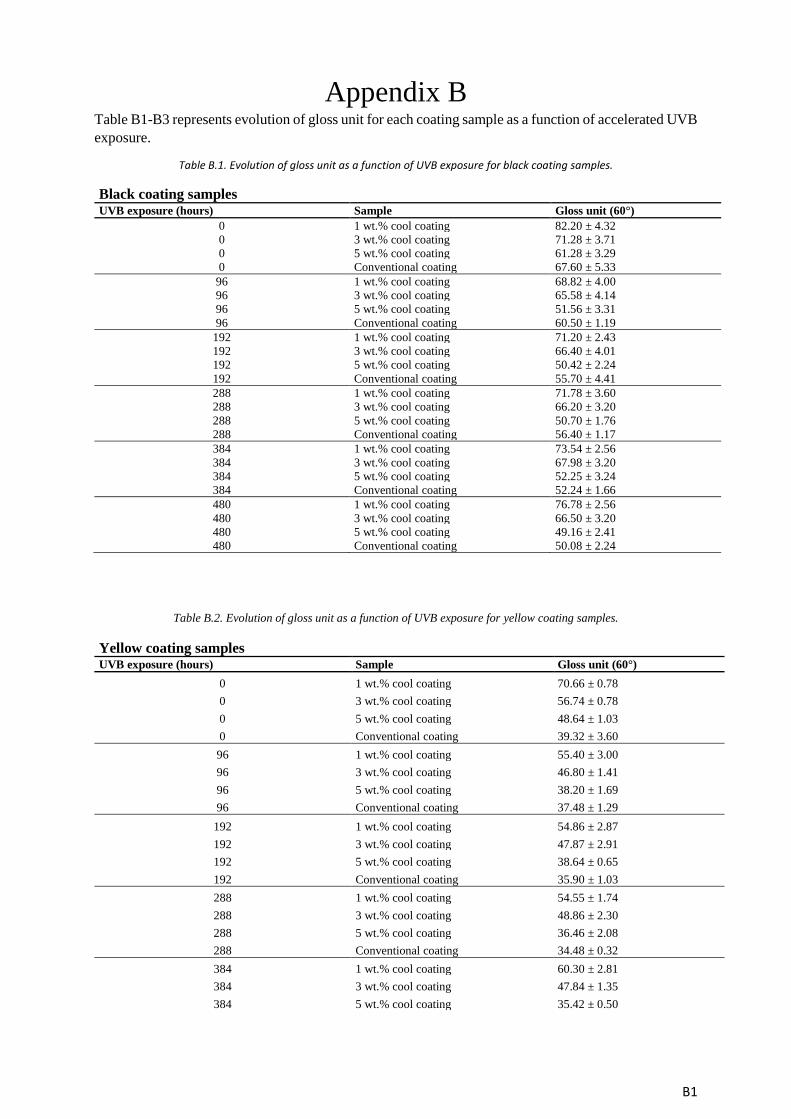
B1
Appendix B Table B1-B3 represents evolution of gloss unit for each coating sample as a function of accelerated UVB
exposure.
Table B.1. Evolution of gloss unit as a function of UVB exposure for black coating samples.
Black coating samples UVB exposure (hours) Sample Gloss unit (60°)
0 1 wt.% cool coating 82.20 ± 4.32
0 3 wt.% cool coating 71.28 ± 3.71
0 5 wt.% cool coating 61.28 ± 3.29
0 Conventional coating 67.60 ± 5.33
96 1 wt.% cool coating 68.82 ± 4.00
96 3 wt.% cool coating 65.58 ± 4.14
96 5 wt.% cool coating 51.56 ± 3.31
96 Conventional coating 60.50 ± 1.19
192 1 wt.% cool coating 71.20 ± 2.43
192 3 wt.% cool coating 66.40 ± 4.01
192 5 wt.% cool coating 50.42 ± 2.24
192 Conventional coating 55.70 ± 4.41
288 1 wt.% cool coating 71.78 ± 3.60
288 3 wt.% cool coating 66.20 ± 3.20
288 5 wt.% cool coating 50.70 ± 1.76
288 Conventional coating 56.40 ± 1.17
384 1 wt.% cool coating 73.54 ± 2.56
384 3 wt.% cool coating 67.98 ± 3.20
384 5 wt.% cool coating 52.25 ± 3.24
384 Conventional coating 52.24 ± 1.66
480 1 wt.% cool coating 76.78 ± 2.56
480 3 wt.% cool coating 66.50 ± 3.20
480 5 wt.% cool coating 49.16 ± 2.41
480 Conventional coating 50.08 ± 2.24
Table B.2. Evolution of gloss unit as a function of UVB exposure for yellow coating samples.
Yellow coating samples UVB exposure (hours) Sample Gloss unit (60°)
0 1 wt.% cool coating 70.66 ± 0.78
0 3 wt.% cool coating 56.74 ± 0.78
0 5 wt.% cool coating 48.64 ± 1.03
0 Conventional coating 39.32 ± 3.60
96 1 wt.% cool coating 55.40 ± 3.00
96 3 wt.% cool coating 46.80 ± 1.41
96 5 wt.% cool coating 38.20 ± 1.69
96 Conventional coating 37.48 ± 1.29
192 1 wt.% cool coating 54.86 ± 2.87
192 3 wt.% cool coating 47.87 ± 2.91
192 5 wt.% cool coating 38.64 ± 0.65
192 Conventional coating 35.90 ± 1.03
288 1 wt.% cool coating 54.55 ± 1.74
288 3 wt.% cool coating 48.86 ± 2.30
288 5 wt.% cool coating 36.46 ± 2.08
288 Conventional coating 34.48 ± 0.32
384 1 wt.% cool coating 60.30 ± 2.81
384 3 wt.% cool coating 47.84 ± 1.35
384 5 wt.% cool coating 35.42 ± 0.50
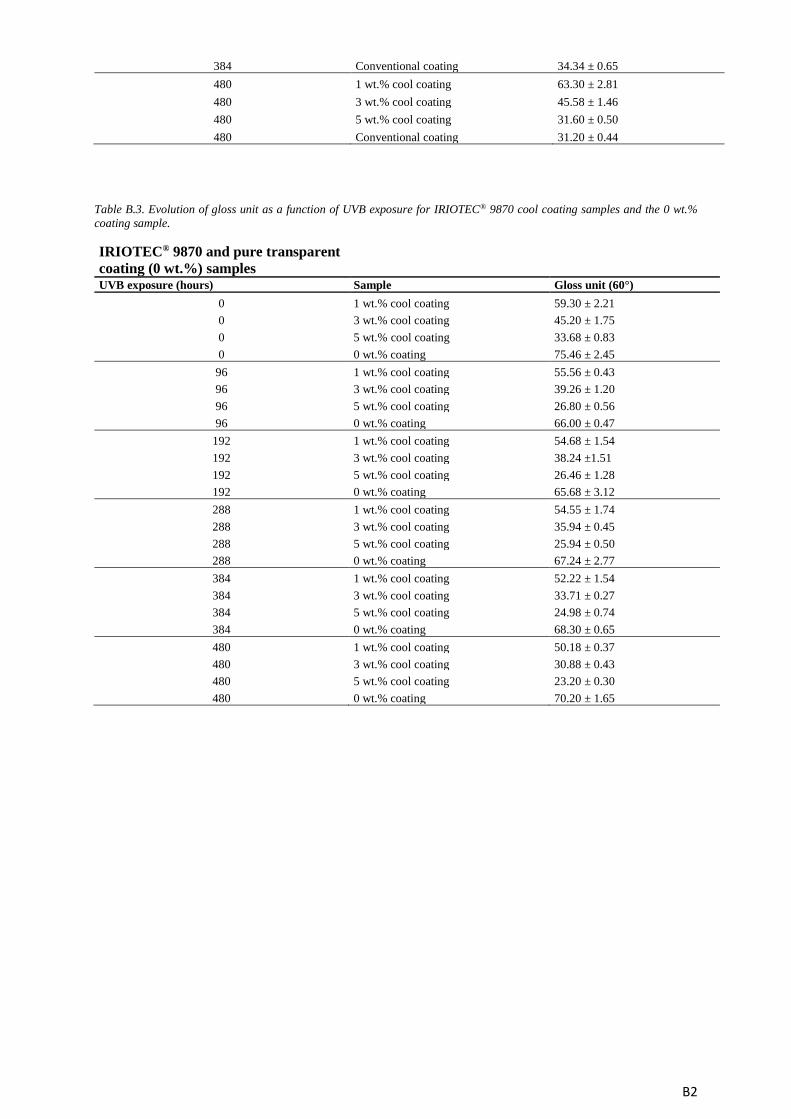
B2
384 Conventional coating 34.34 ± 0.65
480 1 wt.% cool coating 63.30 ± 2.81
480 3 wt.% cool coating 45.58 ± 1.46
480 5 wt.% cool coating 31.60 ± 0.50
480 Conventional coating 31.20 ± 0.44
Table B.3. Evolution of gloss unit as a function of UVB exposure for IRIOTEC® 9870 cool coating samples and the 0 wt.%
coating sample.
IRIOTEC® 9870 and pure transparent
coating (0 wt.%) samples UVB exposure (hours) Sample Gloss unit (60°)
0 1 wt.% cool coating 59.30 ± 2.21
0 3 wt.% cool coating 45.20 ± 1.75
0 5 wt.% cool coating 33.68 ± 0.83
0 0 wt.% coating 75.46 ± 2.45
96 1 wt.% cool coating 55.56 ± 0.43
96 3 wt.% cool coating 39.26 ± 1.20
96 5 wt.% cool coating 26.80 ± 0.56
96 0 wt.% coating 66.00 ± 0.47
192 1 wt.% cool coating 54.68 ± 1.54
192 3 wt.% cool coating 38.24 ±1.51
192 5 wt.% cool coating 26.46 ± 1.28
192 0 wt.% coating 65.68 ± 3.12
288 1 wt.% cool coating 54.55 ± 1.74
288 3 wt.% cool coating 35.94 ± 0.45
288 5 wt.% cool coating 25.94 ± 0.50
288 0 wt.% coating 67.24 ± 2.77
384 1 wt.% cool coating 52.22 ± 1.54
384 3 wt.% cool coating 33.71 ± 0.27
384 5 wt.% cool coating 24.98 ± 0.74
384 0 wt.% coating 68.30 ± 0.65
480 1 wt.% cool coating 50.18 ± 0.37
480 3 wt.% cool coating 30.88 ± 0.43
480 5 wt.% cool coating 23.20 ± 0.30
480 0 wt.% coating 70.20 ± 1.65
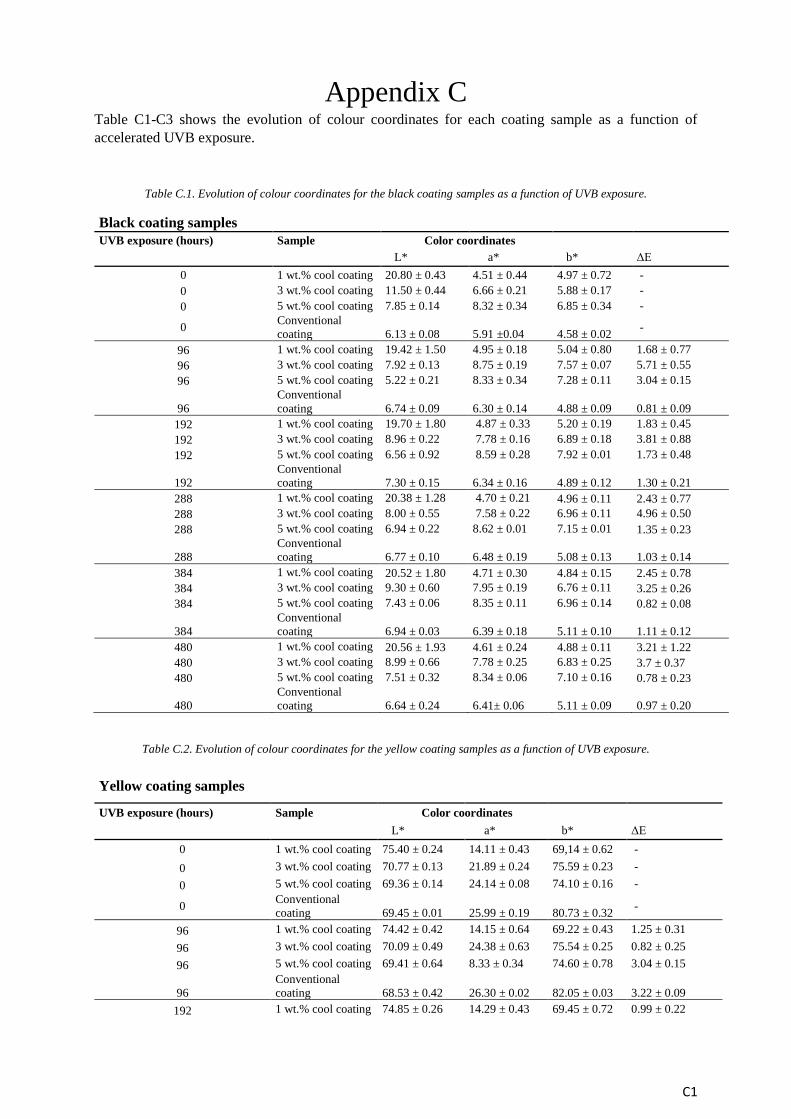
C1
Appendix C Table C1-C3 shows the evolution of colour coordinates for each coating sample as a function of
accelerated UVB exposure.
Table C.1. Evolution of colour coordinates for the black coating samples as a function of UVB exposure.
Black coating samples UVB exposure (hours) Sample Color coordinates
L* a* b* ΔE
0 1 wt.% cool coating 20.80 ± 0.43 4.51 ± 0.44 4.97 ± 0.72 -
0 3 wt.% cool coating 11.50 ± 0.44 6.66 ± 0.21 5.88 ± 0.17 -
0 5 wt.% cool coating 7.85 ± 0.14 8.32 ± 0.34 6.85 ± 0.34 -
0 Conventional
coating
6.13 ± 0.08
5.91 ±0.04
4.58 ± 0.02 -
96 1 wt.% cool coating 19.42 ± 1.50 4.95 ± 0.18 5.04 ± 0.80 1.68 ± 0.77
96 3 wt.% cool coating 7.92 ± 0.13 8.75 ± 0.19 7.57 ± 0.07 5.71 ± 0.55
96 5 wt.% cool coating 5.22 ± 0.21 8.33 ± 0.34 7.28 ± 0.11 3.04 ± 0.15
96
Conventional
coating
6.74 ± 0.09
6.30 ± 0.14
4.88 ± 0.09
0.81 ± 0.09
192 1 wt.% cool coating 19.70 ± 1.80 4.87 ± 0.33 5.20 ± 0.19 1.83 ± 0.45
192 3 wt.% cool coating 8.96 ± 0.22 7.78 ± 0.16 6.89 ± 0.18 3.81 ± 0.88
192 5 wt.% cool coating 6.56 ± 0.92 8.59 ± 0.28 7.92 ± 0.01 1.73 ± 0.48
192
Conventional
coating
7.30 ± 0.15
6.34 ± 0.16
4.89 ± 0.12
1.30 ± 0.21
288 1 wt.% cool coating 20.38 ± 1.28 4.70 ± 0.21 4.96 ± 0.11 2.43 ± 0.77
288 3 wt.% cool coating 8.00 ± 0.55 7.58 ± 0.22 6.96 ± 0.11 4.96 ± 0.50
288 5 wt.% cool coating 6.94 ± 0.22 8.62 ± 0.01 7.15 ± 0.01 1.35 ± 0.23
288
Conventional
coating
6.77 ± 0.10
6.48 ± 0.19
5.08 ± 0.13 1.03 ± 0.14
384 1 wt.% cool coating 20.52 ± 1.80 4.71 ± 0.30 4.84 ± 0.15 2.45 ± 0.78
384 3 wt.% cool coating 9.30 ± 0.60 7.95 ± 0.19 6.76 ± 0.11 3.25 ± 0.26
384 5 wt.% cool coating 7.43 ± 0.06 8.35 ± 0.11 6.96 ± 0.14 0.82 ± 0.08
384
Conventional
coating
6.94 ± 0.03
6.39 ± 0.18
5.11 ± 0.10 1.11 ± 0.12
480 1 wt.% cool coating 20.56 ± 1.93 4.61 ± 0.24 4.88 ± 0.11 3.21 ± 1.22
480 3 wt.% cool coating 8.99 ± 0.66 7.78 ± 0.25 6.83 ± 0.25 3.7 ± 0.37
480 5 wt.% cool coating 7.51 ± 0.32 8.34 ± 0.06 7.10 ± 0.16 0.78 ± 0.23
480
Conventional
coating
6.64 ± 0.24
6.41± 0.06
5.11 ± 0.09 0.97 ± 0.20
Table C.2. Evolution of colour coordinates for the yellow coating samples as a function of UVB exposure.
Yellow coating samples
UVB exposure (hours) Sample Color coordinates
L* a* b* ΔE
0 1 wt.% cool coating 75.40 ± 0.24 14.11 ± 0.43 69,14 ± 0.62 -
0 3 wt.% cool coating 70.77 ± 0.13 21.89 ± 0.24 75.59 ± 0.23 -
0 5 wt.% cool coating 69.36 ± 0.14 24.14 ± 0.08 74.10 ± 0.16 -
0 Conventional
coating
69.45 ± 0.01
25.99 ± 0.19
80.73 ± 0.32 -
96 1 wt.% cool coating 74.42 ± 0.42 14.15 ± 0.64 69.22 ± 0.43 1.25 ± 0.31
96 3 wt.% cool coating 70.09 ± 0.49 24.38 ± 0.63 75.54 ± 0.25 0.82 ± 0.25
96 5 wt.% cool coating 69.41 ± 0.64 8.33 ± 0.34 74.60 ± 0.78 3.04 ± 0.15
96
Conventional
coating
68.53 ± 0.42
26.30 ± 0.02
82.05 ± 0.03
3.22 ± 0.09
192 1 wt.% cool coating 74.85 ± 0.26 14.29 ± 0.43 69.45 ± 0.72 0.99 ± 0.22
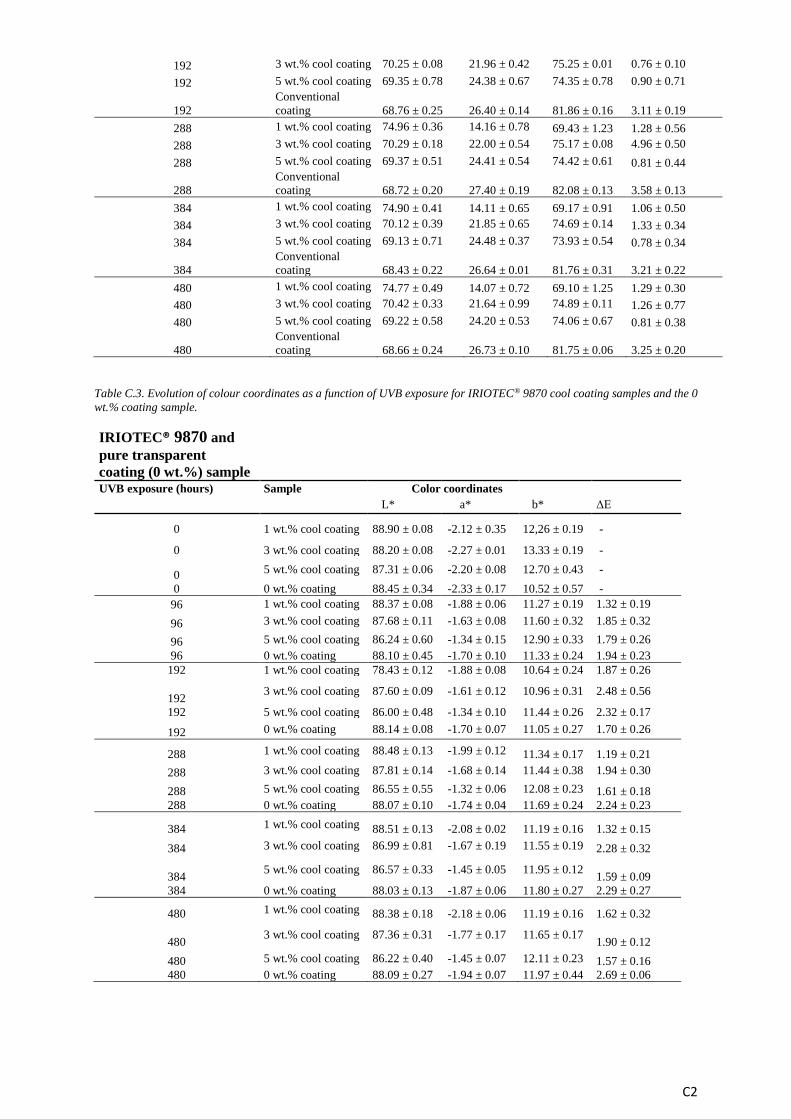
C2
192 3 wt.% cool coating 70.25 ± 0.08 21.96 ± 0.42 75.25 ± 0.01 0.76 ± 0.10
192 5 wt.% cool coating 69.35 ± 0.78 24.38 ± 0.67 74.35 ± 0.78 0.90 ± 0.71
192
Conventional
coating
68.76 ± 0.25
26.40 ± 0.14
81.86 ± 0.16
3.11 ± 0.19
288 1 wt.% cool coating 74.96 ± 0.36 14.16 ± 0.78 69.43 ± 1.23 1.28 ± 0.56
288 3 wt.% cool coating 70.29 ± 0.18 22.00 ± 0.54 75.17 ± 0.08 4.96 ± 0.50
288 5 wt.% cool coating 69.37 ± 0.51 24.41 ± 0.54 74.42 ± 0.61 0.81 ± 0.44
288
Conventional
coating
68.72 ± 0.20
27.40 ± 0.19
82.08 ± 0.13 3.58 ± 0.13
384 1 wt.% cool coating 74.90 ± 0.41 14.11 ± 0.65 69.17 ± 0.91 1.06 ± 0.50
384 3 wt.% cool coating 70.12 ± 0.39 21.85 ± 0.65 74.69 ± 0.14 1.33 ± 0.34
384 5 wt.% cool coating 69.13 ± 0.71 24.48 ± 0.37 73.93 ± 0.54 0.78 ± 0.34
384
Conventional
coating
68.43 ± 0.22
26.64 ± 0.01
81.76 ± 0.31 3.21 ± 0.22
480 1 wt.% cool coating 74.77 ± 0.49 14.07 ± 0.72 69.10 ± 1.25 1.29 ± 0.30
480 3 wt.% cool coating 70.42 ± 0.33 21.64 ± 0.99 74.89 ± 0.11 1.26 ± 0.77
480 5 wt.% cool coating 69.22 ± 0.58 24.20 ± 0.53 74.06 ± 0.67 0.81 ± 0.38
480
Conventional
coating
68.66 ± 0.24
26.73 ± 0.10
81.75 ± 0.06 3.25 ± 0.20
Table C.3. Evolution of colour coordinates as a function of UVB exposure for IRIOTEC® 9870 cool coating samples and the 0
wt.% coating sample.
IRIOTEC® 9870 and
pure transparent
coating (0 wt.%) sample UVB exposure (hours) Sample Color coordinates
L* a* b* ΔE
0 1 wt.% cool coating 88.90 ± 0.08 -2.12 ± 0.35 12,26 ± 0.19 -
0 3 wt.% cool coating 88.20 ± 0.08 -2.27 ± 0.01 13.33 ± 0.19 -
0 5 wt.% cool coating 87.31 ± 0.06 -2.20 ± 0.08 12.70 ± 0.43 -
0 0 wt.% coating 88.45 ± 0.34 -2.33 ± 0.17 10.52 ± 0.57 -
96 1 wt.% cool coating 88.37 ± 0.08 -1.88 ± 0.06 11.27 ± 0.19 1.32 ± 0.19
96 3 wt.% cool coating 87.68 ± 0.11 -1.63 ± 0.08 11.60 ± 0.32 1.85 ± 0.32
96 5 wt.% cool coating 86.24 ± 0.60 -1.34 ± 0.15 12.90 ± 0.33 1.79 ± 0.26
96 0 wt.% coating 88.10 ± 0.45 -1.70 ± 0.10 11.33 ± 0.24 1.94 ± 0.23
192 1 wt.% cool coating 78.43 ± 0.12 -1.88 ± 0.08 10.64 ± 0.24 1.87 ± 0.26
192 3 wt.% cool coating 87.60 ± 0.09 -1.61 ± 0.12 10.96 ± 0.31 2.48 ± 0.56
192 5 wt.% cool coating 86.00 ± 0.48 -1.34 ± 0.10 11.44 ± 0.26 2.32 ± 0.17
192 0 wt.% coating 88.14 ± 0.08 -1.70 ± 0.07 11.05 ± 0.27 1.70 ± 0.26
288 1 wt.% cool coating 88.48 ± 0.13 -1.99 ± 0.12 11.34 ± 0.17 1.19 ± 0.21
288 3 wt.% cool coating 87.81 ± 0.14 -1.68 ± 0.14 11.44 ± 0.38 1.94 ± 0.30
288 5 wt.% cool coating 86.55 ± 0.55 -1.32 ± 0.06 12.08 ± 0.23 1.61 ± 0.18
288 0 wt.% coating 88.07 ± 0.10 -1.74 ± 0.04 11.69 ± 0.24 2.24 ± 0.23
384 1 wt.% cool coating 88.51 ± 0.13 -2.08 ± 0.02 11.19 ± 0.16 1.32 ± 0.15
384 3 wt.% cool coating 86.99 ± 0.81 -1.67 ± 0.19 11.55 ± 0.19 2.28 ± 0.32
384 5 wt.% cool coating 86.57 ± 0.33 -1.45 ± 0.05 11.95 ± 0.12
1.59 ± 0.09
384 0 wt.% coating 88.03 ± 0.13 -1.87 ± 0.06 11.80 ± 0.27 2.29 ± 0.27
480 1 wt.% cool coating 88.38 ± 0.18 -2.18 ± 0.06 11.19 ± 0.16 1.62 ± 0.32
480 3 wt.% cool coating 87.36 ± 0.31 -1.77 ± 0.17 11.65 ± 0.17
1.90 ± 0.12
480 5 wt.% cool coating 86.22 ± 0.40 -1.45 ± 0.07 12.11 ± 0.23 1.57 ± 0.16
480 0 wt.% coating 88.09 ± 0.27 -1.94 ± 0.07 11.97 ± 0.44 2.69 ± 0.06
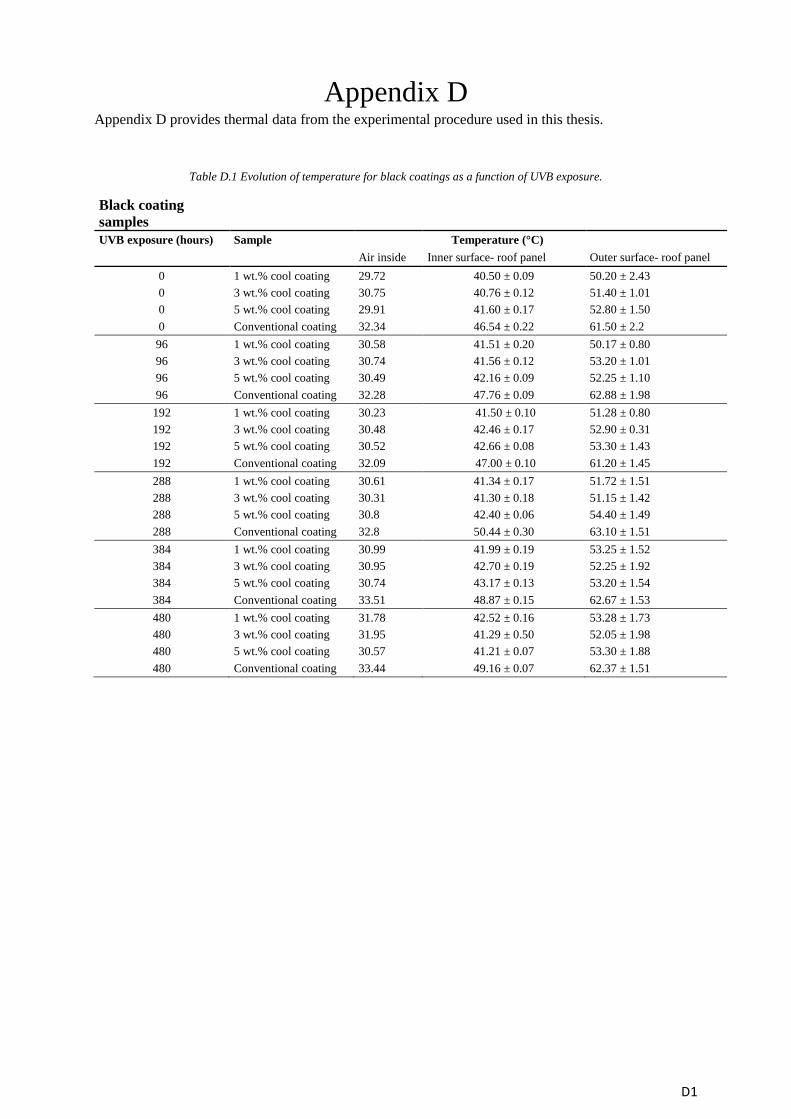
D1
Appendix D Appendix D provides thermal data from the experimental procedure used in this thesis.
Table D.1 Evolution of temperature for black coatings as a function of UVB exposure.
Black coating
samples
UVB exposure (hours) Sample Temperature (°C)
Air inside Inner surface- roof panel Outer surface- roof panel
0 1 wt.% cool coating 29.72 40.50 ± 0.09 50.20 ± 2.43
0 3 wt.% cool coating 30.75 40.76 ± 0.12 51.40 ± 1.01
0 5 wt.% cool coating 29.91 41.60 ± 0.17 52.80 ± 1.50
0 Conventional coating 32.34 46.54 ± 0.22 61.50 ± 2.2
96 1 wt.% cool coating 30.58 41.51 ± 0.20 50.17 ± 0.80
96 3 wt.% cool coating 30.74 41.56 ± 0.12 53.20 ± 1.01
96 5 wt.% cool coating 30.49 42.16 ± 0.09 52.25 ± 1.10
96 Conventional coating 32.28 47.76 ± 0.09 62.88 ± 1.98
192 1 wt.% cool coating 30.23 41.50 ± 0.10 51.28 ± 0.80
192 3 wt.% cool coating 30.48 42.46 ± 0.17 52.90 ± 0.31
192 5 wt.% cool coating 30.52 42.66 ± 0.08 53.30 ± 1.43
192 Conventional coating 32.09 47.00 ± 0.10 61.20 ± 1.45
288 1 wt.% cool coating 30.61 41.34 ± 0.17 51.72 ± 1.51
288 3 wt.% cool coating 30.31 41.30 ± 0.18 51.15 ± 1.42
288 5 wt.% cool coating 30.8 42.40 ± 0.06 54.40 ± 1.49
288 Conventional coating 32.8 50.44 ± 0.30 63.10 ± 1.51
384 1 wt.% cool coating 30.99 41.99 ± 0.19 53.25 ± 1.52
384 3 wt.% cool coating 30.95 42.70 ± 0.19 52.25 ± 1.92
384 5 wt.% cool coating 30.74 43.17 ± 0.13 53.20 ± 1.54
384 Conventional coating 33.51 48.87 ± 0.15 62.67 ± 1.53
480 1 wt.% cool coating 31.78 42.52 ± 0.16 53.28 ± 1.73
480 3 wt.% cool coating 31.95 41.29 ± 0.50 52.05 ± 1.98
480 5 wt.% cool coating 30.57 41.21 ± 0.07 53.30 ± 1.88
480 Conventional coating 33.44 49.16 ± 0.07 62.37 ± 1.51
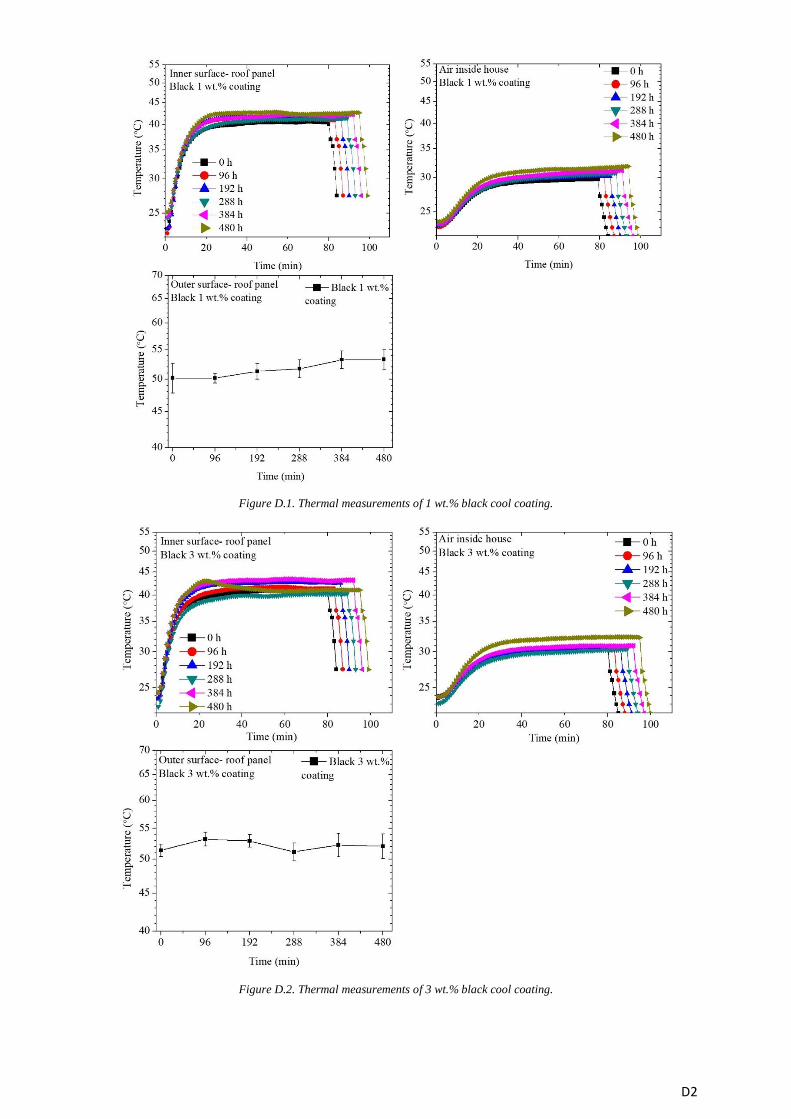
D2
Figure D.1. Thermal measurements of 1 wt.% black cool coating.
Figure D.2. Thermal measurements of 3 wt.% black cool coating.
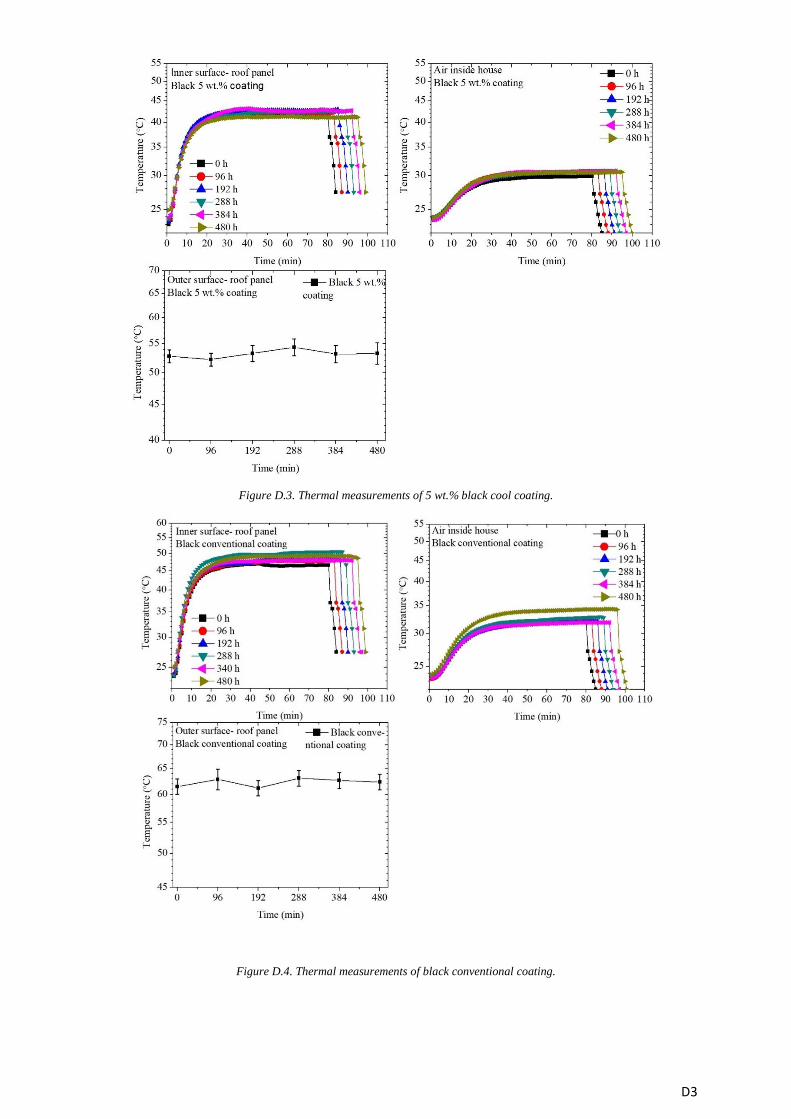
D3
Figure D.3. Thermal measurements of 5 wt.% black cool coating.
Figure D.4. Thermal measurements of black conventional coating.
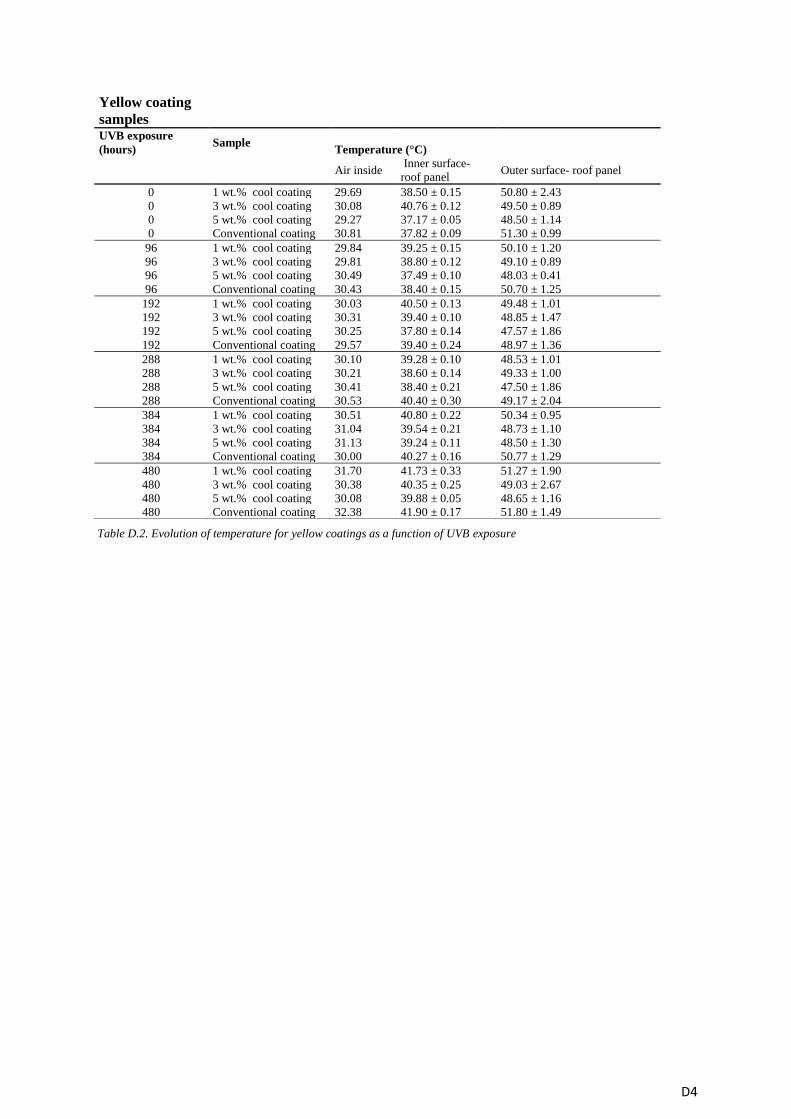
D4
Table D.2. Evolution of temperature for yellow coatings as a function of UVB exposure
Yellow coating
samples
UVB exposure
(hours) Sample
Temperature (°C)
Air inside Inner surface-
roof panel Outer surface- roof panel
0 1 wt.% cool coating 29.69 38.50 ± 0.15 50.80 ± 2.43
0 3 wt.% cool coating 30.08 40.76 ± 0.12 49.50 ± 0.89
0 5 wt.% cool coating 29.27 37.17 ± 0.05 48.50 ± 1.14
0 Conventional coating 30.81 37.82 ± 0.09 51.30 ± 0.99
96 1 wt.% cool coating 29.84 39.25 ± 0.15 50.10 ± 1.20
96 3 wt.% cool coating 29.81 38.80 ± 0.12 49.10 ± 0.89
96 5 wt.% cool coating 30.49 37.49 ± 0.10 48.03 ± 0.41
96 Conventional coating 30.43 38.40 ± 0.15 50.70 ± 1.25
192 1 wt.% cool coating 30.03 40.50 ± 0.13 49.48 ± 1.01
192 3 wt.% cool coating 30.31 39.40 ± 0.10 48.85 ± 1.47
192 5 wt.% cool coating 30.25 37.80 ± 0.14 47.57 ± 1.86
192 Conventional coating 29.57 39.40 ± 0.24 48.97 ± 1.36
288 1 wt.% cool coating 30.10 39.28 ± 0.10 48.53 ± 1.01
288 3 wt.% cool coating 30.21 38.60 ± 0.14 49.33 ± 1.00
288 5 wt.% cool coating 30.41 38.40 ± 0.21 47.50 ± 1.86
288 Conventional coating 30.53 40.40 ± 0.30 49.17 ± 2.04
384 1 wt.% cool coating 30.51 40.80 ± 0.22 50.34 ± 0.95
384 3 wt.% cool coating 31.04 39.54 ± 0.21 48.73 ± 1.10
384 5 wt.% cool coating 31.13 39.24 ± 0.11 48.50 ± 1.30
384 Conventional coating 30.00 40.27 ± 0.16 50.77 ± 1.29
480 1 wt.% cool coating 31.70 41.73 ± 0.33 51.27 ± 1.90
480 3 wt.% cool coating 30.38 40.35 ± 0.25 49.03 ± 2.67
480 5 wt.% cool coating 30.08 39.88 ± 0.05 48.65 ± 1.16
480 Conventional coating 32.38 41.90 ± 0.17 51.80 ± 1.49
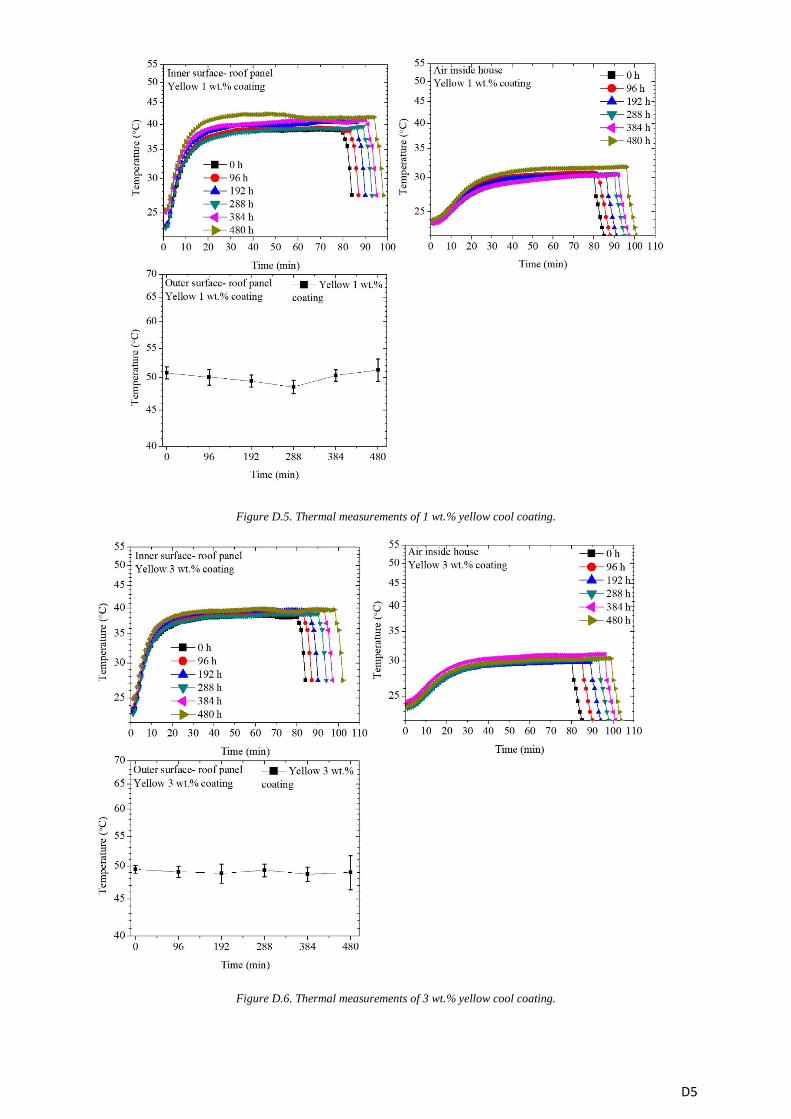
D5
Figure D.5. Thermal measurements of 1 wt.% yellow cool coating.
Figure D.6. Thermal measurements of 3 wt.% yellow cool coating.
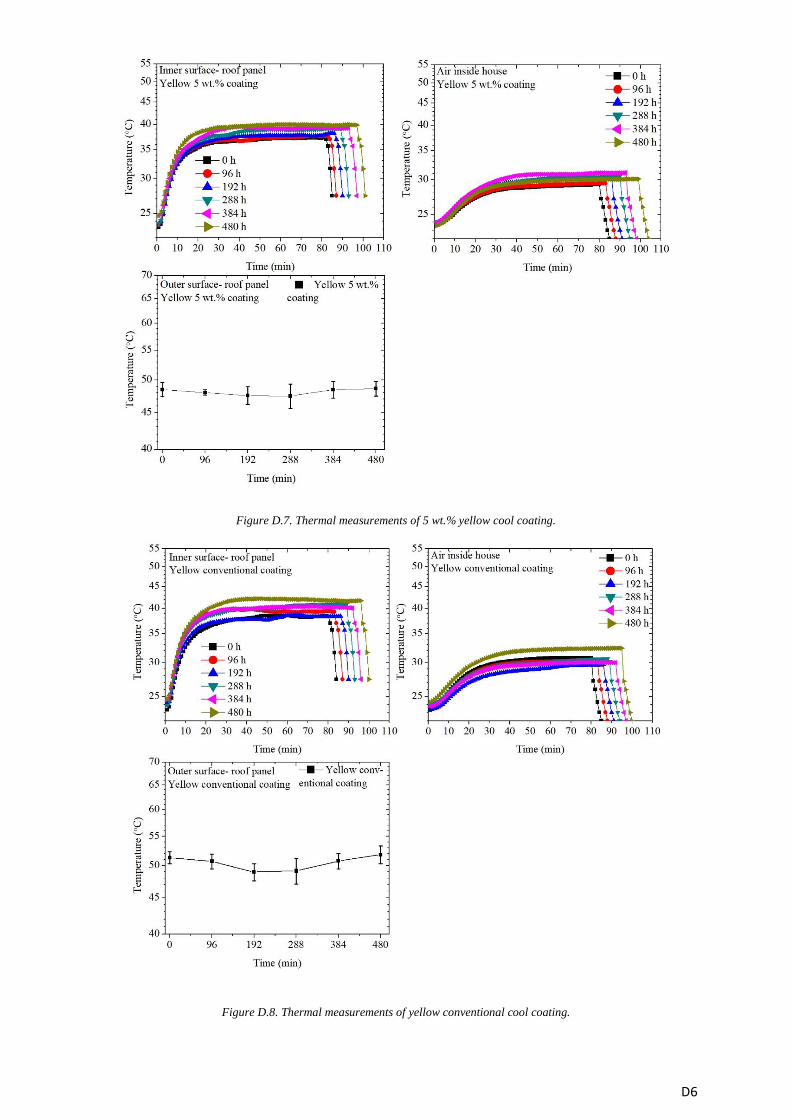
D6
Figure D.7. Thermal measurements of 5 wt.% yellow cool coating.
Figure D.8. Thermal measurements of yellow conventional cool coating.
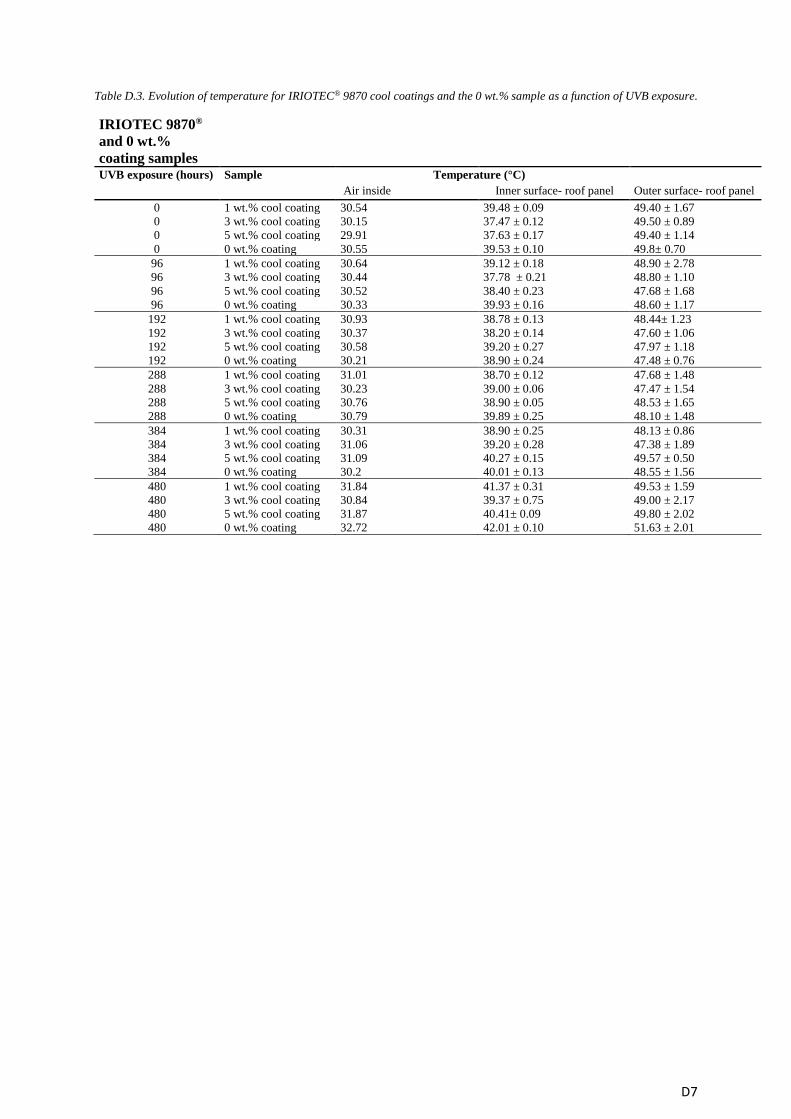
D7
Table D.3. Evolution of temperature for IRIOTEC® 9870 cool coatings and the 0 wt.% sample as a function of UVB exposure.
IRIOTEC 9870®
and 0 wt.%
coating samples
UVB exposure (hours) Sample Temperature (°C)
Air inside Inner surface- roof panel Outer surface- roof panel
0 1 wt.% cool coating 30.54 39.48 ± 0.09 49.40 ± 1.67
0 3 wt.% cool coating 30.15 37.47 ± 0.12 49.50 ± 0.89
0 5 wt.% cool coating 29.91 37.63 ± 0.17 49.40 ± 1.14
0 0 wt.% coating 30.55 39.53 ± 0.10 49.8± 0.70
96 1 wt.% cool coating 30.64 39.12 ± 0.18 48.90 ± 2.78
96 3 wt.% cool coating 30.44 37.78 ± 0.21 48.80 ± 1.10
96 5 wt.% cool coating 30.52 38.40 ± 0.23 47.68 ± 1.68
96 0 wt.% coating 30.33 39.93 ± 0.16 48.60 ± 1.17
192 1 wt.% cool coating 30.93 38.78 ± 0.13 48.44± 1.23
192 3 wt.% cool coating 30.37 38.20 ± 0.14 47.60 ± 1.06
192 5 wt.% cool coating 30.58 39.20 ± 0.27 47.97 ± 1.18
192 0 wt.% coating 30.21 38.90 ± 0.24 47.48 ± 0.76
288 1 wt.% cool coating 31.01 38.70 ± 0.12 47.68 ± 1.48
288 3 wt.% cool coating 30.23 39.00 ± 0.06 47.47 ± 1.54
288 5 wt.% cool coating 30.76 38.90 ± 0.05 48.53 ± 1.65
288 0 wt.% coating 30.79 39.89 ± 0.25 48.10 ± 1.48
384 1 wt.% cool coating 30.31 38.90 ± 0.25 48.13 ± 0.86
384 3 wt.% cool coating 31.06 39.20 ± 0.28 47.38 ± 1.89
384 5 wt.% cool coating 31.09 40.27 ± 0.15 49.57 ± 0.50
384 0 wt.% coating 30.2 40.01 ± 0.13 48.55 ± 1.56
480 1 wt.% cool coating 31.84 41.37 ± 0.31 49.53 ± 1.59
480 3 wt.% cool coating 30.84 39.37 ± 0.75 49.00 ± 2.17
480 5 wt.% cool coating 31.87 40.41± 0.09 49.80 ± 2.02
480 0 wt.% coating 32.72 42.01 ± 0.10 51.63 ± 2.01
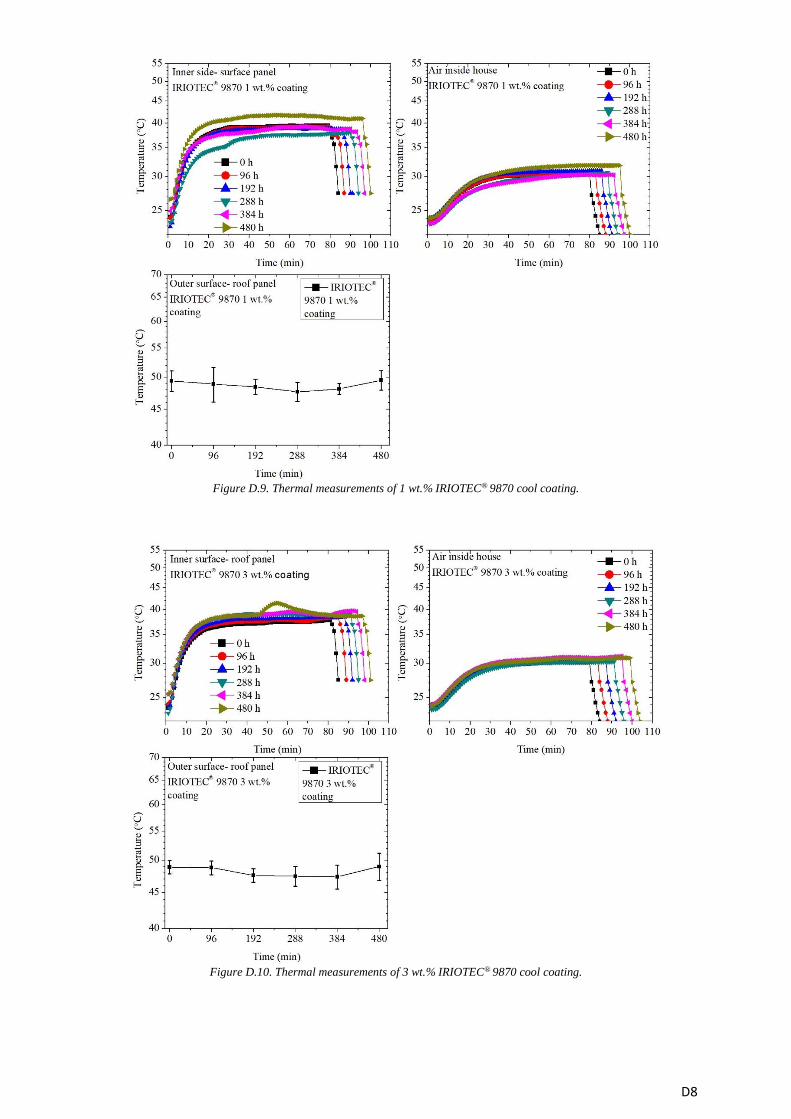
D8
Figure D.9. Thermal measurements of 1 wt.% IRIOTEC® 9870 cool coating.
Figure D.10. Thermal measurements of 3 wt.% IRIOTEC® 9870 cool coating.
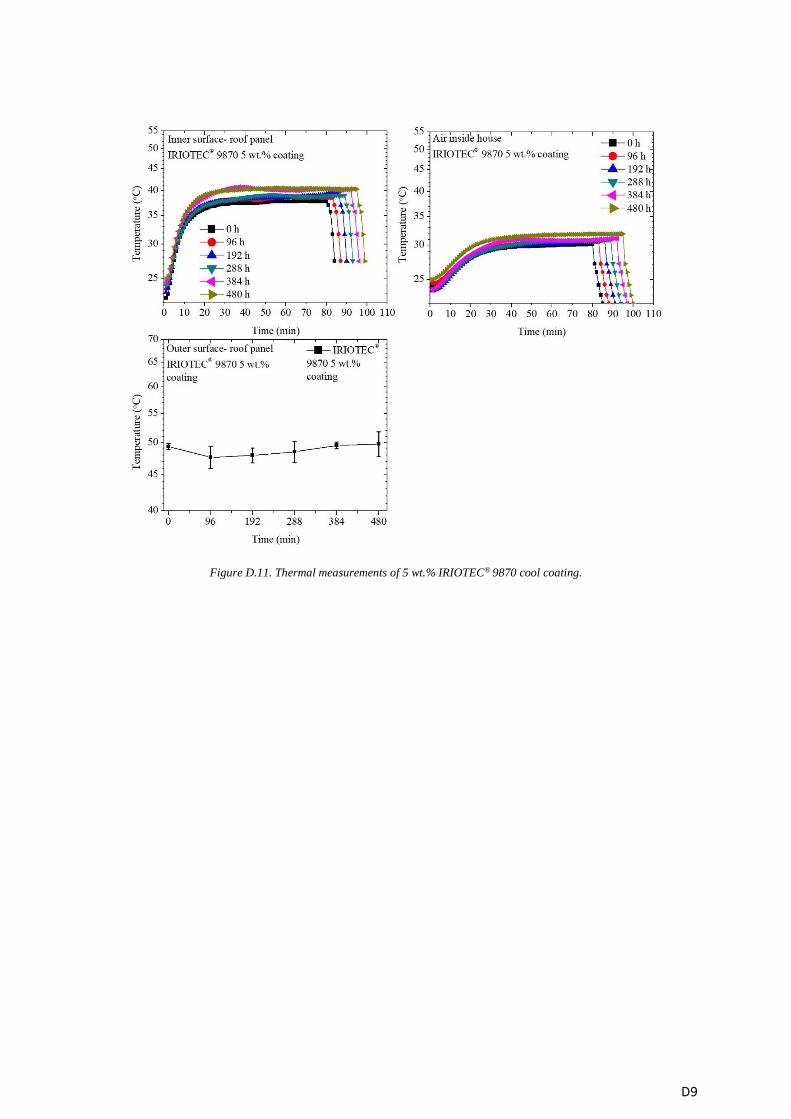
D9
Figure D.11. Thermal measurements of 5 wt.% IRIOTEC® 9870 cool coating.
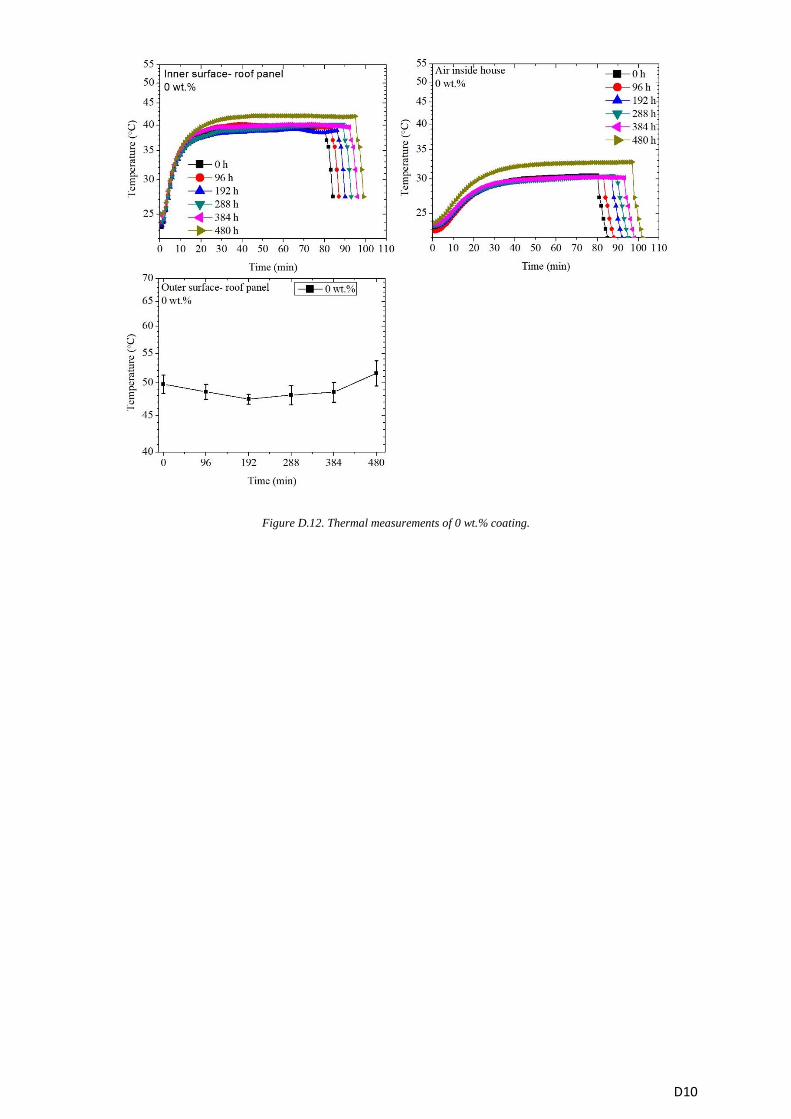
D10
Figure D.12. Thermal measurements of 0 wt.% coating.
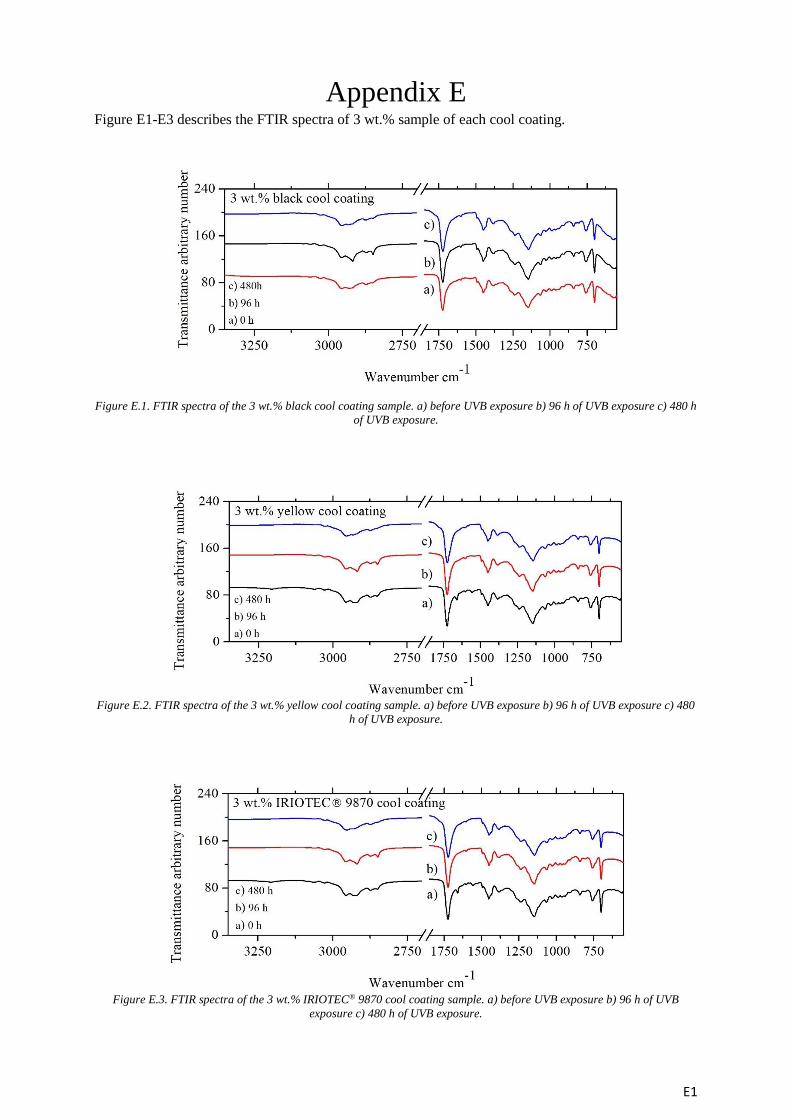
E1
Appendix E Figure E1-E3 describes the FTIR spectra of 3 wt.% sample of each cool coating.
Figure E.1. FTIR spectra of the 3 wt.% black cool coating sample. a) before UVB exposure b) 96 h of UVB exposure c) 480 h
of UVB exposure.
Figure E.2. FTIR spectra of the 3 wt.% yellow cool coating sample. a) before UVB exposure b) 96 h of UVB exposure c) 480
h of UVB exposure.
Figure E.3. FTIR spectra of the 3 wt.% IRIOTEC® 9870 cool coating sample. a) before UVB exposure b) 96 h of UVB
exposure c) 480 h of UVB exposure.

D2