Evaluating the Reliability of Power MOSFETs€¦ · Evaluating the Reliability of Power MOSFETs ......
4
Power Electronics Technology November 2005 www.powerelectronics.com 40 Evaluating the Reliability of Power MOSFETs Device junction temperature and other op- erating conditions are critical in determining the avalanche current capability and for- ward bias safe operating area for MOSFETs designed in different processes. By Carl Blake, Tim McDonald, Dan Kinzer , r r Joe Cao, Alex Kwan and Aram Arzumanyan, International Rectifier, El Segundo, Calif. P ower device performance continues to advance at a high rate. Each generation is also becom- ing more optimized and more specialized to particular application conditions. At the same time, a high value continues to be placed on devices that are extremely rugged, capable of withstanding current, voltage and temperature conditions well in excess of their nominal continuous ratings. With the continuous drive for higher power density and lower cost, newer technologies achieve much higher channel densities than ever before, while keeping gate capacitance in check with innovative structures that minimize all nonessential gate overlaps with source and drain. Trench technologies are becoming commonplace and dominant in applications where a high premium is placed on dc or on pulsed-current density, while planar technolo- gies still find application where low thermal resistance and maximum forward bias safe operating area (FBSOA) is a dominant concern. To meet the system design goals in power switch applications, designers should understand ruggedness tradeoffs of each MOSFET device type as they apply to the target application. Avalanche Ruggedness in Trench Power MOSFETs One important feature of the new devices optimizes the design by forcing the avalanche breakdown site to occur directly under the source metal contact. At this location the hole current does not create a bias voltage to the source, thus improving EAS capability. For many applications, the ability of a device to drive unclamped inductive loads is a critical success criterion. A 300 250 200 150 100 05 0 100 200 300 400 500 600 EAS Fail Current (A) T emperature T T Inductor V alues (nH) 0.05 0 0 Fig. 1. The characteristic curves for a robust 40-V trench MOSFET show average avalanche failure energy versus starting junction temperature for various inductor sizes. 470 420 370 320 270 220 0 50 100 150 200 250 300 Intrinsic T emp (ºC) T T BV Rating (V) Fig. 2. The intrinsic temperature of a power device is calculated at vari- ous breakdown voltages, assuming a background concentration close to that of a plane junction.
Transcript of Evaluating the Reliability of Power MOSFETs€¦ · Evaluating the Reliability of Power MOSFETs ......

Power Electronics Technology November 2005 www.powerelectronics.com November 2005 www.powerelectronics.com40
Evaluating the Reliability of Power MOSFETsDevice junction temperature and other op-erating conditions are critical in determining the avalanche current capability and for-ward bias safe operating area for MOSFETs designed in different processes.
By Carl Blake, Tim McDonald, Dan Kinzer, Dan Kinzer, Dan Kinzer Joe Cao, Alex Kwan and Aram Arzumanyan, International Rectifi er, El Segundo, Calif.
Power device performance continues to advance at a high rate. Each generation is also becom-ing more optimized and more specialized to particular application conditions. At the same time, a high value continues to be placed on
devices that are extremely rugged, capable of withstanding current, voltage and temperature conditions well in excess of their nominal continuous ratings. With the continuous drive for higher power density and lower cost, newer technologies achieve much higher channel densities than ever before, while keeping gate capacitance in check with innovative structures that minimize all nonessential gate overlaps with source and drain.
Trench technologies are becoming commonplace and
dominant in applications where a high premium is placed on dc or on pulsed-current density, while planar technolo-gies still fi nd application where low thermal resistance and maximum forward bias safe operating area (FBSOA) is a dominant concern. To meet the system design goals in power switch applications, designers should understand ruggedness tradeoffs of each MOSFET device type as they apply to the target application.
Avalanche Ruggedness in Trench Power MOSFETs
One important feature of the new devices optimizes the design by forcing the avalanche breakdown site to occur directly under the source metal contact. At this location the hole current does not create a bias voltage to the source, thus improving EAS capability.
For many applications, the ability of a device to drive unclamped inductive loads is a critical success criterion. A
300
250
200
150
100
05
00 100 200 300 400 500 600
EAS
Fail
Curr
ent (
A)
Temperature Temperature T
Inductor VInductor VInductor Values (nH)
0.050.050.501.0020.00Linear (0.05)Linear (0.50)Linear (1.00)Linear (20.00)
0000
Fig. 1. The characteristic curves for a robust 40-V trench MOSFET show average avalanche failure energy versus starting junction temperature for various inductor sizes.
470
420
370
320
270
2200 50 100 150 200 250 300
Intri
nsic
Tem
p (º
C)In
trins
ic T
emp
(ºC)
Intri
nsic
T
BV Rating (V)
Fig. 2. The intrinsic temperature of a power device is calculated at vari-ous breakdown voltages, assuming a background concentration close to that of a plane junction.

www.powerelectronics.com Power Electronics Technology November 2005www.powerelectronics.com Power Electronics Technology 41
MOSFET RELIABILITY
well-designed and fabrication defect-free MOSFET will share current uniformly across the active area during avalanche, due to the positive temperature coeffi cient of breakdown voltage. When the device fails, it will not do so because of bipolar device mechanism activation. It will fail because the temperature and current have reached a point at which the thermally generated carrier concentration is too high for the device to support the applied voltage.
Such a device will have a characteristic family of curves as shown in Fig. 1, where an extrapolation of lines fi t to the average failure points at various starting temperatures will intersect the x-axis at or above the intrinsic temperature of the device. The intrinsic temperature is above 500°C and will be true for a large range of values of inductor. The data in Fig. 1 was obtained from a rugged 40-V trench MOSFET design. Fig. 2 shows a calculation of the intrinsic temperature, i.e. the temperature where the intrinsic carrier concentration is equal to the background doping, according to the formula:
Ni = 3.88e16T1.5exp(-7000/T), where T is temperature in degrees Kelvin.
Ensuring the ruggedness of a MOSFET design requires a very thorough evaluation of the device, and the acquisition of a statistically large sample of failure currents and energies. The population should be free as much as possible from maverick devices that fail at lower energies, and the mavericks
that do exist must be removed through 100% testing of the entire product population. Testing for a tight distribution even at elevated temperatures gives confi dence that there isn’t a signifi cant population of mavericks, and the room temperature screens that are applied should take the device close enough to its failure level to remove them.
Knowing the intrinsic temperature, the inductor value, the actual breakdown voltage at temperature and the tran-sient thermal impedance, one can calculate the expected current that will result in the device “going intrinsic.” For a 100-V device, the calculation yields IAS = 149 A at 25°C and IAS = 110 A at 150°C, for active area (AA) = 10.4 mm2 with L = 100 µH. The actual performance of several technologies is shown in Fig. 3.
The comparison of technologies gives some insight into the way different devices perform. The highest performance technology for handling unclamped avalanche is the ad-vanced planar design. It has unclamped avalanche failure points that exceed 80% of the ideal calculated value, and the standard deviation at both 25°C and 125°C is in the range of 1% to 2% with no mavericks or non-normal distribution.
The conventional planar technology fails at 25% lower current, with a standard deviation of 2% to 3%, and again no evidence of mavericks. The advanced trench devices perform similarly to the conventional planar, with one or two maverick parts in evidence. The conventional trench,

Power Electronics Technology November 2005 www.powerelectronics.com November 2005 www.powerelectronics.com42
MOSFET RELIABILITY
while it has a similar mean failure level, has a much larger variation, and evidence of a bimodal distribution at elevated temperature.
Forward Bias Safe Operating AreaA number of applications require power MOSFETs to
operate under the simultaneous application of high voltage and current. Linear power supplies and amplifi ers are still in use for low dropout and highly noise-sensitive applications. Automotive linear fan control is another such application. Some switching applications have surge requirements that will pull the device into a “linear” mode where the gate volt-age is controlling the current with high voltage applied (for example, hot swap in a Netcom converter).
A typical MOSFET transfer curve has a crossover current below which the temperature coeffi cient of I
D is positive, as
shown in Fig. 4. The dID/dV
GS/dV
GS/dV curve has a peak at low cur-
rents and gradually falls. This characteristic leads to thermal instability at higher voltage according to the equation:
dI
dTD
DS
>1
( )V Z( )V ZDS( )DSV ZDSV Z( )V ZDSV ZV Z¥V Z( )V Z¥V Z( )( )( )t( )t( )t( )t( )q( )
as described in Spirito and other references[1-4]. The constant power current derating curve that is often used for short pulses becomes invalid for longer pulses, and the maximum allowable current falls off as shown. High-density MOSFET designs have higher transconductance, the cross-over current is much higher, and the peak dI
D/dT is higher.
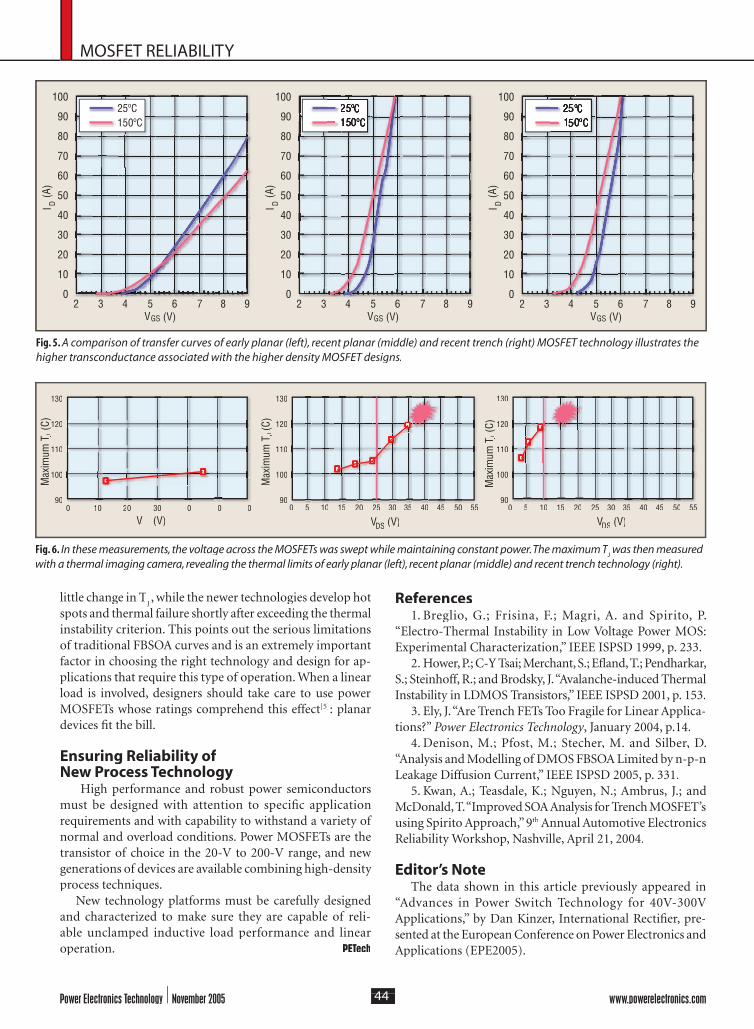
Fig. 5 shows a comparison of the transfer characteristics of three technologies.
In Fig. 6, MOSFET devices are swept up in voltage at constant power, and the maximum T
J was measured with
a thermal imaging camera. The lower transconductance device is able to be swept up to nearly the rated voltage with
I (A
)I
(A)
DI (A
)
V (V)GSV (V)GSV (V)
TTLOWLOW
TTHIHI
I (A)DI (A)DI (A)
I (A
)DI (A
)DI (A
)
DC Thermally LimitedDC Thermally LimitedDC Thermally LimitedDC Thermally LimitedDC Thermally LimitedOn Resistance LimitedOn Resistance LimitedDevice LimitedSpirito
V (V)DS V (V)DS V (V)
dI /d
T (A
/°C)
/dT
(A/°
C) /d
T (A
/°C)
D /d
T (A
/°C)
D /d
T (A
/°C)
Fig. 4. Shown here are a MOSFET ID
versus VGS
versus VGS
versus V transfer curve (left), the associated dID
/dT curve showing drain current temperature dependence (middle), and the resulting derating curve (safe operating area) (right).
Advanced planarConventional planarAdvanced trenchConventional trench
140
120
100
80
60
40
20
0-4 -3 -2 -1 0 1 2 3 4
Standard deviation from mean
IAS
(A) a
t 25º
C w
ith L
=100
µH
Advanced planarConventional planarAdvanced trenchConventional trench
120
100
80
60
40
20
0-4 -3 -2 -1 0 1 2 3 4
Standard deviation from mean
IAS
(A) a
t 125
ºC w
ith L
=100
µH
Fig. 3. A comparison of the statistics of samples (individual lot distributions) of various generations of planar and trench MOSFET technology at junction temperatures of 25°C (left) and 125°C (right). The value at 0 gives the mean avalanche failure current, while the slope gives the standard deviation.
Power Electronics Technology November 2005 www.powerelectronics.com November 2005 www.powerelectronics.com44
MOSFET RELIABILITY
little change in TJ , while the newer technologies develop hot
spots and thermal failure shortly after exceeding the thermal instability criterion. This points out the serious limitations of traditional FBSOA curves and is an extremely important factor in choosing the right technology and design for ap-plications that require this type of operation. When a linear load is involved, designers should take care to use power MOSFETs whose ratings comprehend this effect[5]: planar devices fi t the bill.
Ensuring Reliability of New Process Technology
High performance and robust power semiconductors must be designed with attention to specifi c application requirements and with capability to withstand a variety of normal and overload conditions. Power MOSFETs are the transistor of choice in the 20-V to 200-V range, and new generations of devices are available combining high-density process techniques.
New technology platforms must be carefully designed and characterized to make sure they are capable of reli-able unclamped inductive load performance and linear operation. PETech
References1. Breglio, G.; Frisina, F.; Magri, A. and Spirito, P.
“Electro-Thermal Instability in Low Voltage Power MOS: Experimental Characterization,” IEEE ISPSD 1999, p. 233.
2. Hower, P.; C-Y Tsai; Merchant, S.; Efl and, T.; Pendharkar, S.; Steinhoff, R.; and Brodsky, J. “Avalanche-induced Thermal Instability in LDMOS Transistors,” IEEE ISPSD 2001, p. 153.
3. Ely, J. “Are Trench FETs Too Fragile for Linear Applica-tions?” Power Electronics Technology, January 2004, p.14.
4. Denison, M.; Pfost, M.; Stecher, M. and Silber, D. “Analysis and Modelling of DMOS FBSOA Limited by n-p-n Leakage Diffusion Current,” IEEE ISPSD 2005, p. 331.
5. Kwan, A.; Teasdale, K.; Nguyen, N.; Ambrus, J.; and McDonald, T. “Improved SOA Analysis for Trench MOSFET’s using Spirito Approach,” 9th Annual Automotive Electronics Reliability Workshop, Nashville, April 21, 2004.
Editor’s NoteThe data shown in this article previously appeared in
“Advances in Power Switch Technology for 40V-300V Applications,” by Dan Kinzer, International Rectifi er, pre-sented at the European Conference on Power Electronics andApplications (EPE2005).
Fig. 6. In these measurements, the voltage across the MOSFETs was swept while maintaining constant power. The maximum TJ
In these measurements, the voltage across the MOSFETs was swept while maintaining constant power. The maximum TJ
In these measurements, the voltage across the MOSFETs was swept while maintaining constant power. The maximum T was then measured J was then measured
J
with a thermal imaging camera, revealing the thermal limits of early planar (left), recent planar (middle) and recent trench technology (right).
130
120
110
100
90
130
120
110
100
900 10 20 30 � 0 � 0 � 0
��V (V) DSV (V)DSV (V)DS DSV (V)DSV (V)DS
Max
imum
T (
C)J
Max
imum
T (
C)J
Max
imum
T (
C)
Max
imum
T (
C)J
Max
imum
T (
C)J
Max
imum
T (
C)
Max
imum
T (
C)J
Max
imum
T (
C)J
Max
imum
T (
C)
130
120
110
100
900 5 10 15 20 25 30 35 40 45 50 55 0 5 10 15 20 25 30 35 40 45 50 55
Fig. 5. A comparison of transfer curves of early planar (left), recent planar (middle) and recent trench (right) MOSFET technology illustrates the higher transconductance associated with the higher density MOSFET designs.