
Evaluating the Quality of Educational Answers in Community ...
10
Evaluating the Quality of Educational Answers in Community Question-Answering Long T. Le Department of Computer Science Rutgers University [email protected] Chirag Shah School of Communication and Information Rutgers University [email protected] Erik Choi Brainly [email protected] ABSTRACT Community Question-Answering (CQA), where questions and an- swers are generated by peers, has become a popular method of in- formation seeking in online environments. While the content repos- itories created through CQA sites have been used widely to sup- port general purpose tasks, using them as online digital libraries that support educational needs is an emerging practice. Horizontal CQA services, such as Yahoo! Answers, and vertical CQA ser- vices, such as Brainly, are aiming to help students improve their learning process by answering their educational questions. In these services, receiving high quality answer(s) to a question is a crit- ical factor not only for user satisfaction, but also for supporting learning. However, the questions are not necessarily answered by experts, and the askers may not have enough knowledge and skill to evaluate the quality of the answers they receive. This could be prob- lematic when students build their own knowledge base by applying inaccurate information or knowledge acquired from online sources. Using moderators could alleviate this problem. However, a moder- ator’s evaluation of answer quality may be inconsistent because it is based on their subjective assessments. Employing human assessors may also be insufficient due to the large amount of content available on a CQA site. To address these issues, we propose a framework for automatically assessing the quality of answers. This is achieved by integrating different groups of features - personal, community- based, textual, and contextual - to build a classification model and determine what constitutes answer quality. To test this evaluation framework, we collected more than 10 million educational answers posted by more than 3 million users on Brainly’s United States and Poland sites. The experiments conducted on these datasets show that the model using Random Forest (RF) achieves more than 83% accuracy in identifying high quality of answers. In addition, the findings indicate that personal and community-based features have more prediction power in assessing answer quality. Our approach also achieves high values on other key metrics such as F1-score and Area under ROC curve. The work reported here can be useful in many other contexts where providing automatic quality assessment in a digital repository of textual information is paramount. Permission to make digital or hard copies of all or part of this work for personal or classroom use is granted without fee provided that copies are not made or distributed for profit or commercial advantage and that copies bear this notice and the full citation on the first page. Copyrights for components of this work owned by others than the author(s) must be honored. Abstracting with credit is permitted. To copy otherwise, or republish, to post on servers or to redistribute to lists, requires prior specific permission and/or a fee. Request permissions from [email protected]. JCDL ’16, June 19 - 23, 2016, Newark, NJ, USA c 2016 Copyright held by the owner/author(s). Publication rights licensed to ACM. ISBN 978-1-4503-4229-2/16/06. . . $15.00 DOI: http://dx.doi.org/10.1145/2910896.2910900 Keywords Community Question-Answering (CQA); Answer Quality; Features 1. INTRODUCTION The Internet and the World Wide Web (WWW) have become critical and ubiquitous information tools that have changed the way people share and seek information. Many online resources on the WWW serve as some of the largest digital libraries publicly avail- able. As the number of new resources for communication and in- formation technologies have rapidly increased over the past few decades [18], users have adopted various types of such online in- formation sources in order to seek and share information. These include Wikis, forums, blogs, and community question-answering (CQA). CQAs are one example of a new means of information seeking in which users share information and knowledge in virtual environments. According to Gazan [12], CQA is "exemplifying the Web 2.0 model of user-generated and user-rated content" (p.2302), creat- ing a critical online repository and an engagement platform where users formulate their information need in natural language and vol- untarily interact with each other through the asking and answer- ing of a question. Within CQA, there are other elements, such as commenting and voting, that encourage social interactions for seek- ing and sharing information. Because of the fast growth of CQA’s popularity, a rich body of research has been conducted in order to understand the variety of content and user behaviors in question- answering interactions within the context of CQA. Shah et al. [25] state that previous studies based on user content have focused on content type, quality, and formulation, while studies focusing on user behaviors attempted to understand the motivations for asking and answering a question on CQA. Many of the initial CQA platforms, such as AnswerBag (the first one in the US), were developed to support general purpose infor- mation seeking. They are referred to as horizontal CQA services. Then, other sites were deployed for more specific tasks - vertical CQA. One type of specific task or purpose is online learning. In education, students not only use the Internet to look for new ma- terials but can also exchange ideas and knowledge. The advent of CQA has greatly assisted students in sharing knowledge in virtual environments. As CQA in education is an emerging field, educa- tors hope that they may be able improve learning capability and experience with the help of communication and information tech- nologies. To further this push for employing CQA services and content for educational purposes, we attempt to examine Brainly, 1 one of the largest CQA services specifically targeted at education. Brainly is 1 http://brainly.com
Transcript of Evaluating the Quality of Educational Answers in Community ...

Evaluating the Quality of Educational Answers inCommunity Question-Answering
Long T. LeDepartment of Computer
ScienceRutgers University
Chirag ShahSchool of Communication and
InformationRutgers University
Erik ChoiBrainly
ABSTRACTCommunity Question-Answering (CQA), where questions and an-swers are generated by peers, has become a popular method of in-formation seeking in online environments. While the content repos-itories created through CQA sites have been used widely to sup-port general purpose tasks, using them as online digital librariesthat support educational needs is an emerging practice. HorizontalCQA services, such as Yahoo! Answers, and vertical CQA ser-vices, such as Brainly, are aiming to help students improve theirlearning process by answering their educational questions. In theseservices, receiving high quality answer(s) to a question is a crit-ical factor not only for user satisfaction, but also for supportinglearning. However, the questions are not necessarily answered byexperts, and the askers may not have enough knowledge and skill toevaluate the quality of the answers they receive. This could be prob-lematic when students build their own knowledge base by applyinginaccurate information or knowledge acquired from online sources.Using moderators could alleviate this problem. However, a moder-ator’s evaluation of answer quality may be inconsistent because it isbased on their subjective assessments. Employing human assessorsmay also be insufficient due to the large amount of content availableon a CQA site. To address these issues, we propose a frameworkfor automatically assessing the quality of answers. This is achievedby integrating different groups of features - personal, community-based, textual, and contextual - to build a classification model anddetermine what constitutes answer quality. To test this evaluationframework, we collected more than 10 million educational answersposted by more than 3 million users on Brainly’s United States andPoland sites. The experiments conducted on these datasets showthat the model using Random Forest (RF) achieves more than 83%accuracy in identifying high quality of answers. In addition, thefindings indicate that personal and community-based features havemore prediction power in assessing answer quality. Our approachalso achieves high values on other key metrics such as F1-score andArea under ROC curve. The work reported here can be useful inmany other contexts where providing automatic quality assessmentin a digital repository of textual information is paramount.
Permission to make digital or hard copies of all or part of this work for personal orclassroom use is granted without fee provided that copies are not made or distributedfor profit or commercial advantage and that copies bear this notice and the full citationon the first page. Copyrights for components of this work owned by others than theauthor(s) must be honored. Abstracting with credit is permitted. To copy otherwise, orrepublish, to post on servers or to redistribute to lists, requires prior specific permissionand/or a fee. Request permissions from [email protected].
JCDL ’16, June 19 - 23, 2016, Newark, NJ, USAc© 2016 Copyright held by the owner/author(s). Publication rights licensed to ACM.
ISBN 978-1-4503-4229-2/16/06. . . $15.00
DOI: http://dx.doi.org/10.1145/2910896.2910900
KeywordsCommunity Question-Answering (CQA); Answer Quality; Features
1. INTRODUCTIONThe Internet and the World Wide Web (WWW) have become
critical and ubiquitous information tools that have changed the waypeople share and seek information. Many online resources on theWWW serve as some of the largest digital libraries publicly avail-able. As the number of new resources for communication and in-formation technologies have rapidly increased over the past fewdecades [18], users have adopted various types of such online in-formation sources in order to seek and share information. Theseinclude Wikis, forums, blogs, and community question-answering(CQA). CQAs are one example of a new means of informationseeking in which users share information and knowledge in virtualenvironments.
According to Gazan [12], CQA is "exemplifying the Web 2.0model of user-generated and user-rated content" (p.2302), creat-ing a critical online repository and an engagement platform whereusers formulate their information need in natural language and vol-untarily interact with each other through the asking and answer-ing of a question. Within CQA, there are other elements, such ascommenting and voting, that encourage social interactions for seek-ing and sharing information. Because of the fast growth of CQA’spopularity, a rich body of research has been conducted in order tounderstand the variety of content and user behaviors in question-answering interactions within the context of CQA. Shah et al. [25]state that previous studies based on user content have focused oncontent type, quality, and formulation, while studies focusing onuser behaviors attempted to understand the motivations for askingand answering a question on CQA.
Many of the initial CQA platforms, such as AnswerBag (the firstone in the US), were developed to support general purpose infor-mation seeking. They are referred to as horizontal CQA services.Then, other sites were deployed for more specific tasks - verticalCQA. One type of specific task or purpose is online learning. Ineducation, students not only use the Internet to look for new ma-terials but can also exchange ideas and knowledge. The advent ofCQA has greatly assisted students in sharing knowledge in virtualenvironments. As CQA in education is an emerging field, educa-tors hope that they may be able improve learning capability andexperience with the help of communication and information tech-nologies.
To further this push for employing CQA services and content foreducational purposes, we attempt to examine Brainly,1 one of thelargest CQA services specifically targeted at education. Brainly is
1http://brainly.com
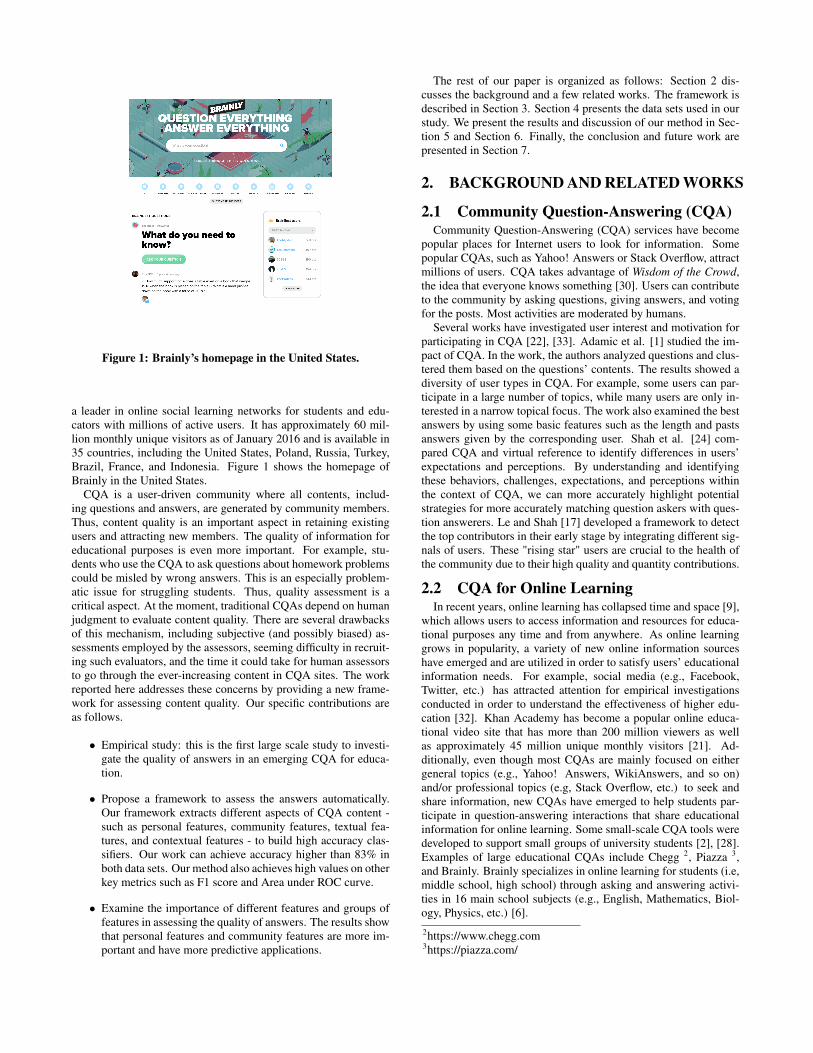
Figure 1: Brainly’s homepage in the United States.
a leader in online social learning networks for students and edu-cators with millions of active users. It has approximately 60 mil-lion monthly unique visitors as of January 2016 and is available in35 countries, including the United States, Poland, Russia, Turkey,Brazil, France, and Indonesia. Figure 1 shows the homepage ofBrainly in the United States.
CQA is a user-driven community where all contents, includ-ing questions and answers, are generated by community members.Thus, content quality is an important aspect in retaining existingusers and attracting new members. The quality of information foreducational purposes is even more important. For example, stu-dents who use the CQA to ask questions about homework problemscould be misled by wrong answers. This is an especially problem-atic issue for struggling students. Thus, quality assessment is acritical aspect. At the moment, traditional CQAs depend on humanjudgment to evaluate content quality. There are several drawbacksof this mechanism, including subjective (and possibly biased) as-sessments employed by the assessors, seeming difficulty in recruit-ing such evaluators, and the time it could take for human assessorsto go through the ever-increasing content in CQA sites. The workreported here addresses these concerns by providing a new frame-work for assessing content quality. Our specific contributions areas follows.
• Empirical study: this is the first large scale study to investi-gate the quality of answers in an emerging CQA for educa-tion.
• Propose a framework to assess the answers automatically.Our framework extracts different aspects of CQA content -such as personal features, community features, textual fea-tures, and contextual features - to build high accuracy clas-sifiers. Our work can achieve accuracy higher than 83% inboth data sets. Our method also achieves high values on otherkey metrics such as F1 score and Area under ROC curve.
• Examine the importance of different features and groups offeatures in assessing the quality of answers. The results showthat personal features and community features are more im-portant and have more predictive applications.
The rest of our paper is organized as follows: Section 2 dis-cusses the background and a few related works. The framework isdescribed in Section 3. Section 4 presents the data sets used in ourstudy. We present the results and discussion of our method in Sec-tion 5 and Section 6. Finally, the conclusion and future work arepresented in Section 7.
2. BACKGROUND AND RELATED WORKS
2.1 Community Question-Answering (CQA)Community Question-Answering (CQA) services have become
popular places for Internet users to look for information. Somepopular CQAs, such as Yahoo! Answers or Stack Overflow, attractmillions of users. CQA takes advantage of Wisdom of the Crowd,the idea that everyone knows something [30]. Users can contributeto the community by asking questions, giving answers, and votingfor the posts. Most activities are moderated by humans.
Several works have investigated user interest and motivation forparticipating in CQA [22], [33]. Adamic et al. [1] studied the im-pact of CQA. In the work, the authors analyzed questions and clus-tered them based on the questions’ contents. The results showed adiversity of user types in CQA. For example, some users can par-ticipate in a large number of topics, while many users are only in-terested in a narrow topical focus. The work also examined the bestanswers by using some basic features such as the length and pastsanswers given by the corresponding user. Shah et al. [24] com-pared CQA and virtual reference to identify differences in users’expectations and perceptions. By understanding and identifyingthese behaviors, challenges, expectations, and perceptions withinthe context of CQA, we can more accurately highlight potentialstrategies for more accurately matching question askers with ques-tion answerers. Le and Shah [17] developed a framework to detectthe top contributors in their early stage by integrating different sig-nals of users. These "rising star" users are crucial to the health ofthe community due to their high quality and quantity contributions.
2.2 CQA for Online LearningIn recent years, online learning has collapsed time and space [9],
which allows users to access information and resources for educa-tional purposes any time and from anywhere. As online learninggrows in popularity, a variety of new online information sourceshave emerged and are utilized in order to satisfy users’ educationalinformation needs. For example, social media (e.g., Facebook,Twitter, etc.) has attracted attention for empirical investigationsconducted in order to understand the effectiveness of higher edu-cation [32]. Khan Academy has become a popular online educa-tional video site that has more than 200 million viewers as wellas approximately 45 million unique monthly visitors [21]. Ad-ditionally, even though most CQAs are mainly focused on eithergeneral topics (e.g., Yahoo! Answers, WikiAnswers, and so on)and/or professional topics (e.g, Stack Overflow, etc.) to seek andshare information, new CQAs have emerged to help students par-ticipate in question-answering interactions that share educationalinformation for online learning. Some small-scale CQA tools weredeveloped to support small groups of university students [2], [28].Examples of large educational CQAs include Chegg 2, Piazza 3,and Brainly. Brainly specializes in online learning for students (i.e,middle school, high school) through asking and answering activi-ties in 16 main school subjects (e.g., English, Mathematics, Biol-ogy, Physics, etc.) [6].
2https://www.chegg.com3https://piazza.com/
2.3 Quality Assessment in CQASince most contents in CQA are generated by users who actively
seek and share information with other users, the content quality isa critical factor to the success of the community. Therefore, as-sessing the quality of posts in CQA is a critical task in order todevelop an information seeking environment where users receivereliable and helpful information for their educational informationneeds. High quality content is the best way to retain existing usersand attract new members [19]. However, assessing the quality ofposts in CQA is a difficult task due to the diversity of contents andusers. The quality of the posts might include quality of the questionand quality of the answer. In our work, we focus on the quality ofthe answer.
Examining the quality of answers can be divided into three typesof problems: (i) finding the best answer, (ii) ranking the answers,and (iii) measuring the quality of answers. For example, Shah andPomerantz [26] looked for the best answers in Yahoo! Answers byusing 13 different criteria. Ranking answers is a useful task whena question receives multiples answers. These works focus more onthe similarity between an answer and a question [29]. Surynato etal. [31] utilized the expertise of an asker and an answerer to rankthe answers. In this work, the authors also recognized that differentusers are experts in different subjects and used this understanding torank the answers. Recent work also showed the potential of usinggraphs to rank users [13], but it is not clear how to rank answersbased on users.
The most popular type of problem focuses on regression-relatedproblems, such as predicting how many answers a question willget or how much community interest a post can elicit. Researchersare interested in predicting whether certain questions in CQA willbe answered and how many answers a question will receive [34,11]. This research used features such as asker history, the lengthof question, and the question category to predict the answerabil-ity of the question. Shah et al. [27] studied why some questionsremain unanswered in CQA. Particularly, this work explored whyfact-based questions often fail to attract an answer. Momeni et al.[20] applied machine learning to judge the quality of comments inonline communities, revealing that social context is a useful fea-ture. Yao et al. [36] examined the long-term effect of the postsin Stack Overflow by developing a new scalable regression model.Dalip et al. [10] tried to reduce the number of features in collab-orative content, however, the number of reductions was not signif-icant. Furthermore, applying feature selection can solve the issuewith many features, such as over-fitting.
Our work is close to measuring the quality of answers. This re-search uses past question-answering interactions and current ques-tion and/or answering activities in order to predict the quality ofnew answers automatically. The framework incorporates differentgroups of features including personal features, community features,textual features, and contextual features.
3. EXAMINING THE QUALITY OF AN AN-SWER
In order to reduce the workload by assessing the quality of an-swers manually, we developed a framework to detect the quality ofanswers automatically. It is a difficult task due to the complexity ofcontent in the CQA. Here is the formal definition of our problem:
Formal definition:Given:
• a set of users U = {u1, u1, ..., un}
• a set of posts P = Q ∪A,
Q is the set of questions Q = {q1, q2, ..., qm1}, andA is the set of answers A = {a1, a2, ..., am2}
• a set of interactions I = {i1, i2, ..., im3} (such as givingthanks, making friends)
Task: For arbitrary answer a ∈ A, predict whether a will bedeleted or approved?
Our framework follows a classification problem. In the first step,we collect the history and information of users in the community,the interactions in the community, and the characteristics of an-swers. In the second step, we build the classification model basedon history. In the last step, we predict the quality of new answersbased on our trained models.
3.1 Feature ExtractionIn order to classify the quality of answers, we build a list of fea-
tures for each answer. Table 1 lists the features used in our study.The features are divided into four groups: Personal Features, Com-munity Features, Textual Features, and Contextual Features.
• Personal Features: These features are based on the charac-teristics of users. Personal features include the activity of ananswer’s owner, such as the number of answers given by theuser, the number of questions asked by the user, the rank thatuser achieved in the community, and the user’s grade level.
• Community Features: These features are based on the re-sponse of the community to a user’s answers, such as howmany thanks they received or how many bans they received.Furthermore, we also consider the social connectivity of usersin the community. In Brainly, users can make friends andexchange information. The friendships can be placed on agraph where users are nodes and the edge between two nodesrepresents the friendship. We extract several features abouttheir connection - such as the number of friends - clusteringthe coefficient of a user and their ego-net (aka, the friends offriends). The clustering coefficient (CCi) of a user measureshow closely their neighbors form a clique, defined as
CCi =# of triangles connected i
# of connected triples centered on i(1)
Higher values mean that this user and their friends form astronger connection. We denote di = |N(i)| as the numberof friends of users i, |N(i)| denotes set of neighbors of i.Average degree of neighborhood is defined as
d̄N (i) =1
di×
∑j∈Ni
dj (2)
We also use egonet features of a node. A node’s egonet isthe subgraph created by the node and its neighbors. Egonetfeatures include the size of egonet, the number of outgoingedges of egonet and the number of neighbors of egonet.
These features incorporate four social theories, which are So-cial Capital, Structural Hole, Balance, and Social Exchange[3]. The capacity of social connection in information dis-semination was conducted in [16]. Furthermore, these fea-tures are all computed locally, which is scalable and efficient.Computing the community features is an almost linear timealgorithm, taking almost O(n logn), where n is number ofnodes in graph.
• Textual Features: These features are based on answer con-tent, such as the length of answers and the format of an-swers. We also check whether users use Latex for typing,since many answers provided in mathematics and physicstopical areas are easier to read if Latex is used. Furthermore,we measure the readability of the text based on two popu-lar indexes: automated readability index (ARI), and Fleschreading ease score of answer (FRES) [15]. The ARI mea-sures what grade level should understand the text, which ismeasured by
4.71 ∗ # of characters
# of words+ 0.5 ∗ # of words
# of sentences− 21.43
(3)
The FRES index measures the readability of the document.Higher FRES scores indicate the text is easier to understand.FRES index is calculated as
206.8− 1.01 ∗ # of words
# of sentences− 84.6 ∗ # of syllables
# of words(4)
• Contextual Features: These features contain some contextualfeatures, such as the question’s grade level, the device typesused to answer the question, the similarity between answerand question, duration to type answer, and the typing speed.The typing speed measures how many words the user typesper second. The devices let us know whether the participantused a computer or a mobile device to answer. In order tocompute the similarity between the answer and the question,we treat the answer and question as two vectors of words.The cosine similarity between these two vectors returns thesimilarity between them. Value 0 means that there are nocommon words between them. We believe that no commonwords between the answer and the question might indicateunrelated answers.
Building training set: In order to build the training data, weextracted features for each answer as seen in Table 1. These canalso be divided into two types of features. (i): Immediate features:are the length, device type, typing speed, and similarity betweenanswers and questions. These features are extracted immediatelywhen the answer is posted. (ii:) History features: such as the num-ber of thanks and number of answers given, can be built beforehandand be updated whenever these features change. Thus, when a newanswer is posted, we can extract all proposed features immediately,which means our method can work in real time. Further detailsabout these settings are described in Section 5. Next, we describethree classifiers used in our study.
3.2 ClassificationSince our framework could use almost any classification model,
we compared the performance of different models in this study. Inparticular, we tested the classification algorithms below [4]. LetX = x1, x2, ..., xn be the list of features. The list of classificationalgorithms are summarized as:
• Logistic regression (log-reg): Log-reg is a generalized linearmodel with sigmoid function
P (Y = 1|X =1
1 + exp(−b) ) (5)
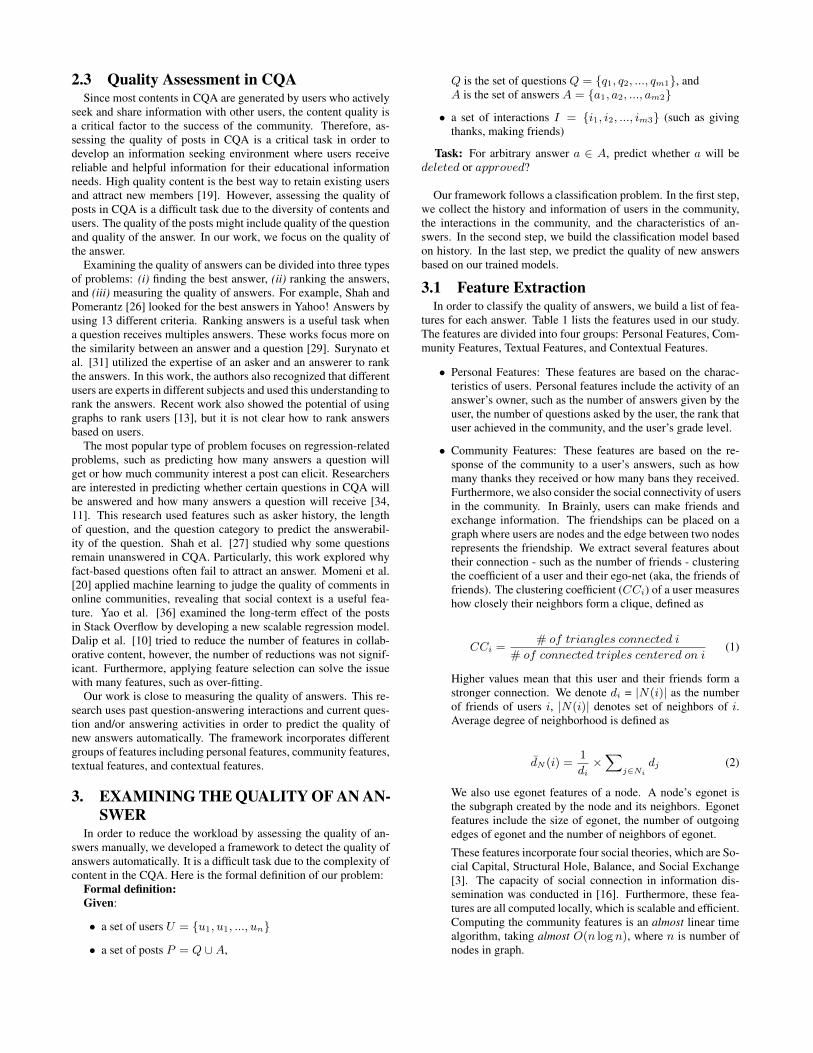
Table 1: Lists of features are classified into four groups of fea-tures: Personal, Community, Textual, and Contextual. The ab-breviations of features are in brackets.
Personal FeaturesNumber of answers given (n_answers)
Number of questions asked (n_questions)Ranking of users (rank_id)
Grade level of users (u_grade)Community Features
Number of thanks that user received (thanks_count)Number of warnings that user received (warns)
Number of spam reports that user received (spam_count)Number of friends in community (friends_count)Clustering Coefficient in friendship network (cc)
Average degree of neighborhood (deg_adj)Average CC of friends (cc_adj)
Size of ego-network of friendship (ego)Number of outgoing edges in ego-network (ego_out)
Number of neighbors in ego-network (ego_adj)Textual features
The length of answer (length)The readability of answer (ari)
The Flesch Reading Ease Score of answer (fres)The format of answer (well_format)
Using advance math typing: latex (contain_tex)Contextual features
The grade level of question (q_grade)The grade difference between answerer & question (diff_grade)
The rank difference between answerer & asker (diff_rank)The similarity between answer and question (sim)
Device used to type answer (client_type)Duration to answer (time_to_answer)
Typing speed (typing_speed)
where b = w0 +∑
(wi.xi) , wi are the inferred parametersfrom regression.
• Decision trees: The Tree-based method is a nonlinear modelthat partitions features into smaller sets and fits a simplemodel into each subset. The decision tree includes two-stageprocesses: tree growing and tree pruning. These steps stopwhen a certain depth is reached or each partition has a fixednumber of nodes.
• Random Forest (RF): RF is an average model approach [14,5] and we use a bag of 100 decision trees. Given a sampleset, the RF method randomly samples data and builds a deci-sion tree. This step also selects a random subset of featuresfor each tree. The final outcome is based on the average ofthese decisions. The pseudo-code of RF is described in Al-gorithm 1. There are some advantages of RF. When buildingeach tree in Step 4, RF randomly selects a list of features anda subset of data. Thus, RF can avoid the over-fitting prob-lem of the decision tree. Furthermore, each tree can be builtseparately, which makes distributively computing the treesextremely easy.
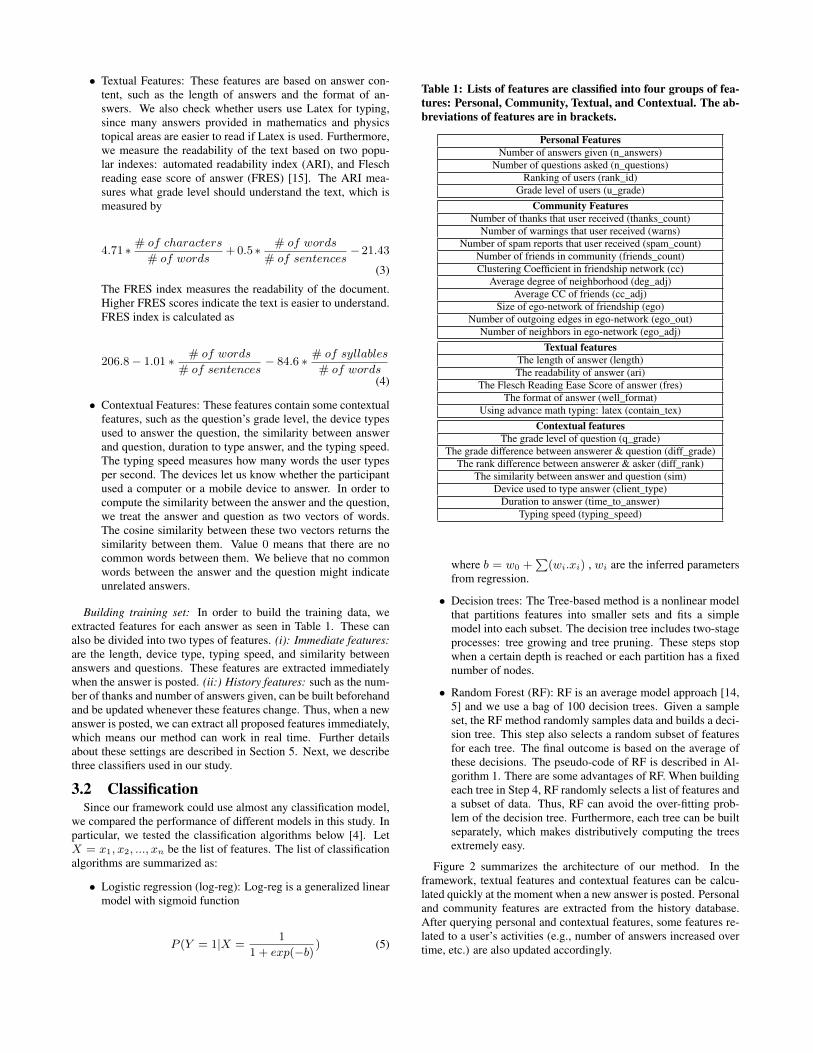
Figure 2 summarizes the architecture of our method. In theframework, textual features and contextual features can be calcu-lated quickly at the moment when a new answer is posted. Personaland community features are extracted from the history database.After querying personal and contextual features, some features re-lated to a user’s activities (e.g., number of answers increased overtime, etc.) are also updated accordingly.
Automatic feeback quality
Apply Model
Existing Answers New Answers
Answerer Asker Content Answerer Asker Content
Personal Features
Community Features
Contextual Features
Textual Features
Contextual Features
Textual Features
HistoryDatabase
Classification Model
Personal Features
Community Features
Query & Update
ReturnSave to
Build Model
Figure 2: An overview of a framework proposed in the study.
Algorithm 1 Pseudo-code of Random Forest algorithmInput:
• A set of training input T = {(Xi, yi)}, i = 1, ..., n.
• Number of trees Ntrees
• A new feature vector Xnew
Output: the prediction outcome of Xnew
1: for i = 1 : Ntrees do2: Randomly select a subset of training Trand ⊂ T3: Build the tree hi based on Trand
4: In each internal node of hi, randomly select a set of featuresand split the trees based on these selected features
5: end for
6: Pred(Xnew) =Ntrees∑i=1
hi(Xnew)
7: return Pred(Xnew)
Next, we will describe the data sets used in our study and somecharacteristics of users in online learning communities.
4. DATASETS AND CHARACTERIZATIONOF THE DATA
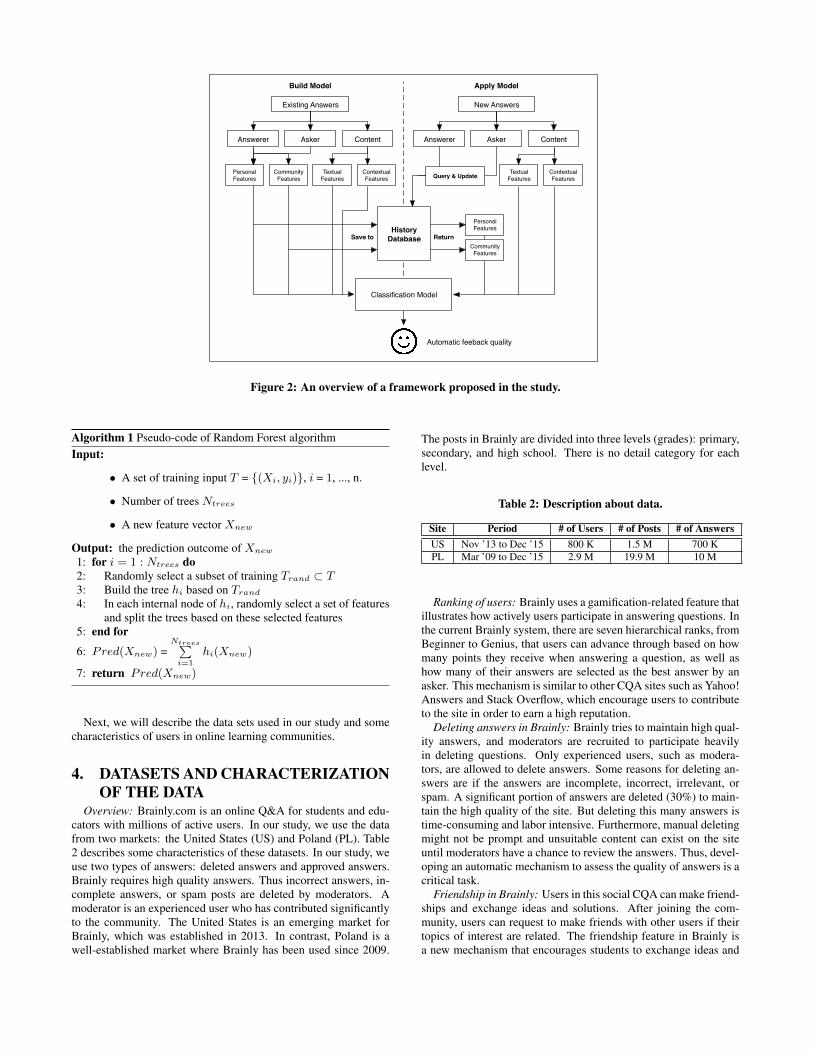
Overview: Brainly.com is an online Q&A for students and edu-cators with millions of active users. In our study, we use the datafrom two markets: the United States (US) and Poland (PL). Table2 describes some characteristics of these datasets. In our study, weuse two types of answers: deleted answers and approved answers.Brainly requires high quality answers. Thus incorrect answers, in-complete answers, or spam posts are deleted by moderators. Amoderator is an experienced user who has contributed significantlyto the community. The United States is an emerging market forBrainly, which was established in 2013. In contrast, Poland is awell-established market where Brainly has been used since 2009.
The posts in Brainly are divided into three levels (grades): primary,secondary, and high school. There is no detail category for eachlevel.
Table 2: Description about data.
Site Period # of Users # of Posts # of AnswersUS Nov ’13 to Dec ’15 800 K 1.5 M 700 KPL Mar ’09 to Dec ’15 2.9 M 19.9 M 10 M
Ranking of users: Brainly uses a gamification-related feature thatillustrates how actively users participate in answering questions. Inthe current Brainly system, there are seven hierarchical ranks, fromBeginner to Genius, that users can advance through based on howmany points they receive when answering a question, as well ashow many of their answers are selected as the best answer by anasker. This mechanism is similar to other CQA sites such as Yahoo!Answers and Stack Overflow, which encourage users to contributeto the site in order to earn a high reputation.
Deleting answers in Brainly: Brainly tries to maintain high qual-ity answers, and moderators are recruited to participate heavilyin deleting questions. Only experienced users, such as modera-tors, are allowed to delete answers. Some reasons for deleting an-swers are if the answers are incomplete, incorrect, irrelevant, orspam. A significant portion of answers are deleted (30%) to main-tain the high quality of the site. But deleting this many answers istime-consuming and labor intensive. Furthermore, manual deletingmight not be prompt and unsuitable content can exist on the siteuntil moderators have a chance to review the answers. Thus, devel-oping an automatic mechanism to assess the quality of answers is acritical task.
Friendship in Brainly: Users in this social CQA can make friend-ships and exchange ideas and solutions. After joining the com-munity, users can request to make friends with other users if theirtopics of interest are related. The friendship feature in Brainly isa new mechanism that encourages students to exchange ideas and

solutions. In traditional CQA such as Yahoo! Answers and StackOverflow, there is no formalized friendship connection. Figure 3depicts the distribution of number of friends per user. We see thatit follows the power law with long tail. Some users have manyconnections in the community while others make only a few con-nections. We expect that users with many connections are moreactive and more committed to answering questions.
100 101 102 103 104
Number of friends per users (log scale)
100
101
102
103
104
105
106
Num
bero
fuse
rs(lo
gsc
ale)
USAPL
Figure 3: Distribution of number of friends per user in log-logscale. The number of friends follows power law. Some usersmake a lot of friends in this community.
Activity in Brainly: This is a free community. Anyone can con-tribute by asking questions, giving answers, giving thanks, andmaking friends. Due to the nature of the community, the contri-bution of each user is different and based on their interests andavailability. Figure 4 plots the distribution of number of answersgiven per user. Again, this follows the power law with some veryactive users. Answering questions is a popular way for users to earnhigher scores and increase their ranking in the community. Givingmany answers shows that these active users are willing to devotetheir time to helping others. Answering a high number of questionsalso helps answerers gain knowledge and trust from the commu-nity. Thus, answers from these users could have high quality.
100 101 102 103 104 105
Number of answers given per users (log scale)
100
101
102
103
104
105
106
Num
bero
fuse
rs(lo
gsc
ale)
USAPL
Figure 4: Distribution of number of answers given per user. Asmall fraction of users answer a lot of questions while manyusers answer a few number of questions.
Subjects of interest: The questions in Brainly are divided intodifferent subjects/topics, such as Mathematics, Physics, etc. We ex-amine how students participate in these topics between two coun-tries. Figure 5 shows that students in both countries participatemore in the topical areas of Mathematics, History, and English.The percentage of posts on mathematics in the United States is sig-nificantly higher than in Poland (42% vs. 35%) This might indicatethat students in the US need more help with Mathematics.
Mat
hem
atic
s
His
tory
Eng
lish
Bio
logy
Soc
ialS
tudi
es
Che
mis
try
Phy
sics
Geo
grap
hy
Bus
ines
s
Com
pute
rs
Art
s
Subject
0
5
10
15
20
25
30
35
40
45
Perc
enta
geof
post
s
USAPL
Figure 5: Percentage of posts in different subjects. Both coun-tries are similar and students are most active in discussingMathematics, History, and English.
The readability of answers: We want to see whether the approvedanswers are more readable - or clear - than deleted answers. We useARI to measure the readability of answers. It shows that the ARIof approved answers is 6.9 ± 3.1, the ARI of deleted answers is5.1 ± 3.2. Similarly, the FRES indexes of deleted and approvedanswers are 69.9 ± 23.1 and 62.2 ± 22.5 respectively. A higherFRES value means that an answer is easier to read. We see thatthe standard deviation is large for both indices due to the diversityof content. We conducted a t-test and saw that the difference issignificant with p = 0.05. The reason for this difference is manyanswers in primary and secondary levels are deleted. In general,the answers in primary and secondary levels are easy to read.
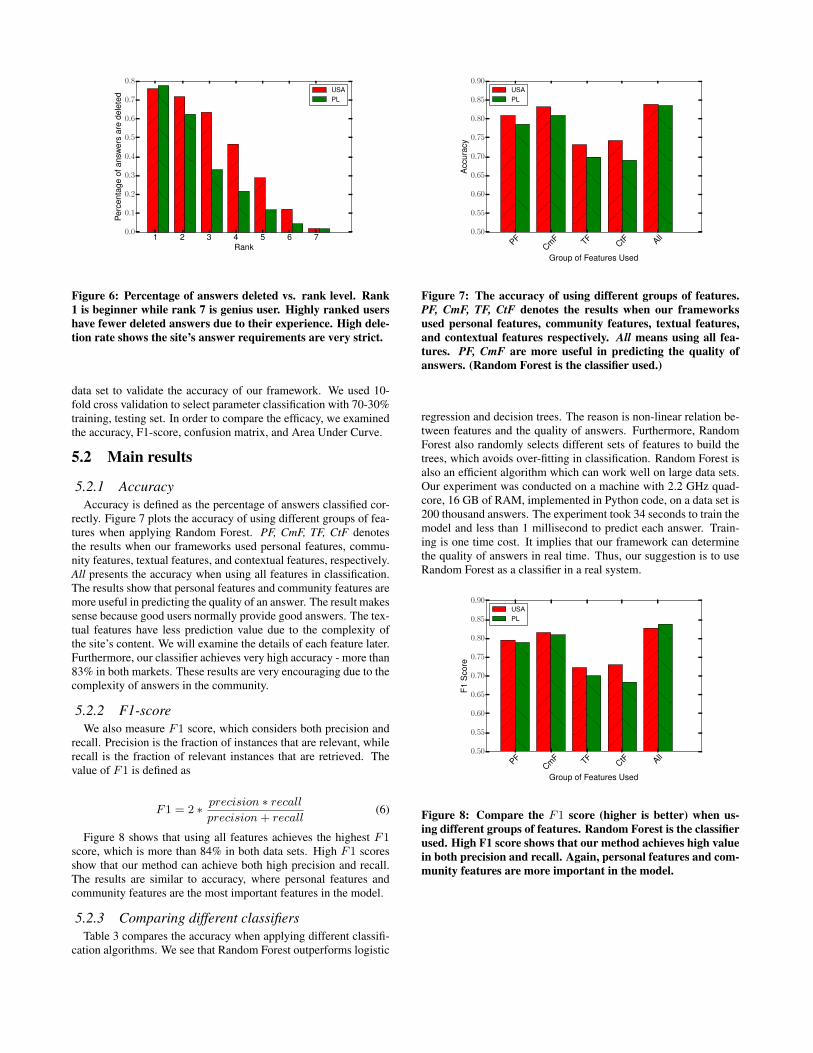
Quality of experienced and newbie users: We examine the qual-ity of answers from new users and experienced users. We examinethe deletion rate of answers based on the ranking of users. Figure6 plots the rate of answers deleted for differently ranked users. Wesee that low-ranked users have a very high rate of deletion. SinceBrainly is a CQA which supports education, the site expects cor-rect answers. Even incomplete answers are deleted. We see thatmany intermediate users’ (such as rank 3 or rank 4 users’) answersare deleted. This demonstrates that Brainly maintains a very highstandard to ensure quality answers.
5. EXPERIMENTS AND RESULTSIn this section we will describe our experimental setup, highlight
the main results, and provide a discussion around these experimentsand findings.
5.1 Experimental setupWe compare the performance of classification using different
classification algorithms with different sets of features. In the de-fault setting, we used the Random Forest of 100 decision trees.In the evaluation, we randomly selected 200 K answers in each
1 2 3 4 5 6 7Rank
0.0
0.1
0.2
0.3
0.4
0.5
0.6
0.7
0.8
Perc
enta
geof
answ
ers
are
dele
ted USA
PL
Figure 6: Percentage of answers deleted vs. rank level. Rank1 is beginner while rank 7 is genius user. Highly ranked usershave fewer deleted answers due to their experience. High dele-tion rate shows the site’s answer requirements are very strict.
data set to validate the accuracy of our framework. We used 10-fold cross validation to select parameter classification with 70-30%training, testing set. In order to compare the efficacy, we examinedthe accuracy, F1-score, confusion matrix, and Area Under Curve.
5.2 Main results
5.2.1 AccuracyAccuracy is defined as the percentage of answers classified cor-
rectly. Figure 7 plots the accuracy of using different groups of fea-tures when applying Random Forest. PF, CmF, TF, CtF denotesthe results when our frameworks used personal features, commu-nity features, textual features, and contextual features, respectively.All presents the accuracy when using all features in classification.The results show that personal features and community features aremore useful in predicting the quality of an answer. The result makessense because good users normally provide good answers. The tex-tual features have less prediction value due to the complexity ofthe site’s content. We will examine the details of each feature later.Furthermore, our classifier achieves very high accuracy - more than83% in both markets. These results are very encouraging due to thecomplexity of answers in the community.
5.2.2 F1-scoreWe also measure F1 score, which considers both precision and
recall. Precision is the fraction of instances that are relevant, whilerecall is the fraction of relevant instances that are retrieved. Thevalue of F1 is defined as
F1 = 2 ∗ precision ∗ recallprecision + recall
(6)
Figure 8 shows that using all features achieves the highest F1score, which is more than 84% in both data sets. High F1 scoresshow that our method can achieve both high precision and recall.The results are similar to accuracy, where personal features andcommunity features are the most important features in the model.
5.2.3 Comparing different classifiersTable 3 compares the accuracy when applying different classifi-
cation algorithms. We see that Random Forest outperforms logistic
PFCmF TF
CtF All
Group of Features Used
0.50
0.55
0.60
0.65
0.70
0.75
0.80
0.85
0.90
Acc
urac
y
USAPL
Figure 7: The accuracy of using different groups of features.PF, CmF, TF, CtF denotes the results when our frameworksused personal features, community features, textual features,and contextual features respectively. All means using all fea-tures. PF, CmF are more useful in predicting the quality ofanswers. (Random Forest is the classifier used.)
regression and decision trees. The reason is non-linear relation be-tween features and the quality of answers. Furthermore, RandomForest also randomly selects different sets of features to build thetrees, which avoids over-fitting in classification. Random Forest isalso an efficient algorithm which can work well on large data sets.Our experiment was conducted on a machine with 2.2 GHz quad-core, 16 GB of RAM, implemented in Python code, on a data set is200 thousand answers. The experiment took 34 seconds to train themodel and less than 1 millisecond to predict each answer. Train-ing is one time cost. It implies that our framework can determinethe quality of answers in real time. Thus, our suggestion is to useRandom Forest as a classifier in a real system.
PFCmF TF
CtF All
Group of Features Used
0.50
0.55
0.60
0.65
0.70
0.75
0.80
0.85
0.90
F1S
core
USAPL
Figure 8: Compare the F1 score (higher is better) when us-ing different groups of features. Random Forest is the classifierused. High F1 score shows that our method achieves high valuein both precision and recall. Again, personal features and com-munity features are more important in the model.

Table 3: Compare the accuracy of different classifiers. RandomForest (bag of 100 trees) outperforms logistic regression anddecision trees.
Classification USA PLLogistic Regression 79.1% 76.8%
Decision Trees 78.2% 77.1%Random Forest 83.9% 83.5%
5.3 Discussion
5.3.1 Feature importanceIn this section, we measure which features are more important.
In order to determine this, we use a permutation test to remove thefeatures and measure the accuracy of out-out-bag (OOB) samples.The important features will degenerate the accuracy substantially.Figure 9 reports the importance of different features used in ourstudy. The three most important features are the number of thanksusers receive, the amount of spam reported, and the similarity be-tween answers and questions. Some features are believed to havestrong correlation with quality but are less important, such as de-vice type or using Latex when typing. For example, participantsusing mobile devices to submit their answers may make more mis-takes, or a participant using Latex markup might indicate a user’shigh experience with certain topics. Unfortunately, there were onlya few answers that were posted from mobile devices or typed inLatex (less than 10%). Thus, these features lost their predictionvalue.
than
ksco
unt
spam
coun
tsi
meg
oad
jle
ngth
nan
swer
sfre
sar
in
ques
tions
ego
out
ccad
jde
gad
jra
nkid
diff
rank
user
seg
ofr
iend
sco
unt
war
ns ccdi
ffgr
ade
time
toan
swer
qgr
ade
ugr
ade
aske
rra
nkid
typi
ngsp
eed
wel
lfor
mat
clie
ntty
peus
ela
Tex
Feature Names
0.00
0.02
0.04
0.06
0.08
0.10
0.12
0.14
Feat
ure
Impo
rtan
ce(H
ighe
ris
mor
eim
port
ant) Feature Importance
Figure 9: Measure of important features (higher is more impor-tant). Most important features are number of thanks, number ofspams, similarity between question and answer, and so on. Table1 lists the notations of used features.
5.3.2 Features selectionOne possible concern is whether features selection can improve
the performance of our method. The general idea of features se-lection is to remove features that have no correlation with the out-come, or to remove two similar features. In both cases, such fea-tures cause over-fitting in the prediction. In Random Forest, we
Table 4: Confusion matrix for predicting answer quality.Prediction outcome
Deleted Approved Total
Actual value Deleted 90.1% 9.9% 100%Approved 22.4% 77.6% 100%
a. United StatesPrediction outcome
Deleted Approved Total
Actual value Deleted 81.5% 18.5% 100%Approved 14.5% 85.5% 100%
b. Poland
already randomly select features when building the trees. In par-ticular, Step 4 in Algorithm 1 selects random features to build thetrees. Furthermore, the number of features in our study is not large.Thus, features selection is unnecessary and does not help improveaccuracy.
5.3.3 High quality answers and low quality answersWe discuss which is more difficult to detect: high quality or low
quality answers. Table 4 examines the confusion matrix which de-scribes how answers are mis-classified in the US and PL. We seethat detecting deleted questions achieves higher accuracy than de-tecting approved answers in the US. The reason is that many an-swers in the US market are answered by newcomers, and this doesnot satisfy the high quality criteria established by this CQA com-munity. In the PL market, there is no difference due to a well-established community and the fact that the majority of the partici-pants are experienced users.
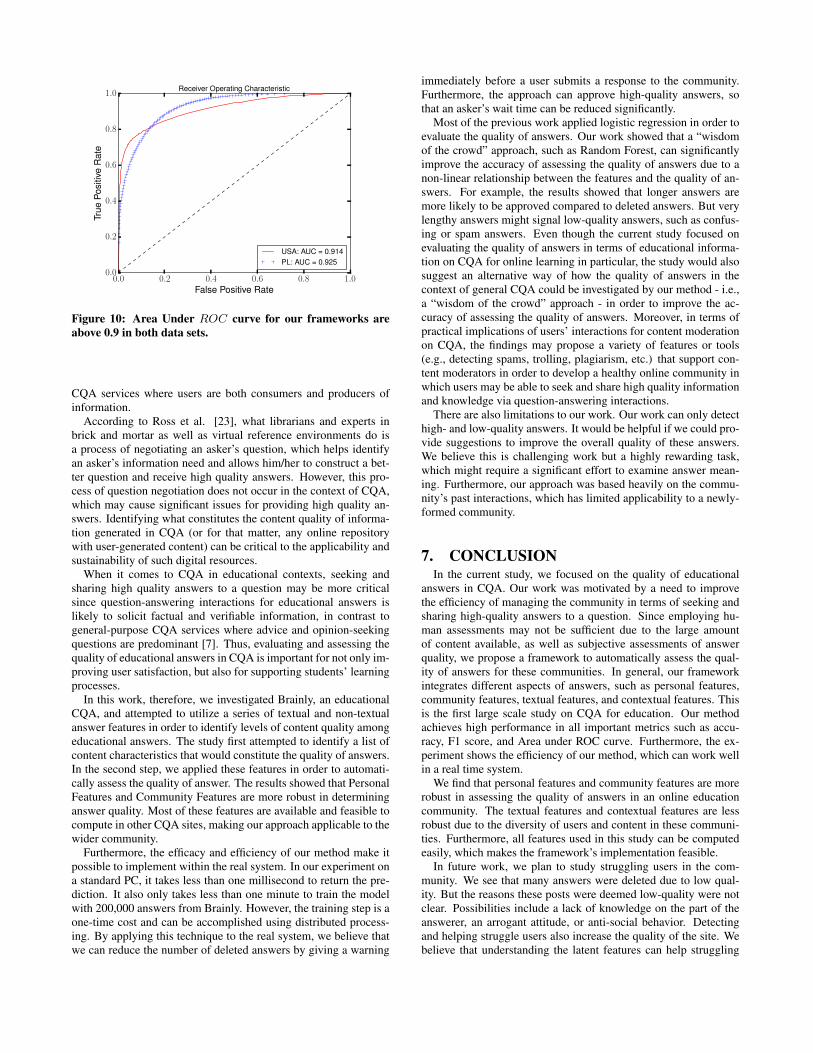
5.3.4 Receiver operating characteristic (ROC)We also evaluate the ROC of the approved answers for both data
sets. The ROC denotes the ability of the classification to find thecorrect high quality answers with different thresholds. The curvein Figure 10 plots the True Positive rate against the False Positiverate. We see that the area under ROC is higher than 0.91 in bothdata sets. In the real deployment, we can set different thresholdsto select the approved answers based on various requirements. Forexample, the administrators of the site might believe that 17% isinsufficient and require that the automatic assessments not makemistakes with a rate of more than 0.05. Figure 10 shows that ifthe False Positive Rate is 0.05, the True Positive Rates of the USand PL are 0.73 and 0.62, respectively. Otherwise, we can detect amajority of the approved answers with a small error rate. The restof the answers are considered borderline entities, which are hard todifferentiate between good or bad. Under these circumstances, wecan still take advantage of moderators and askers to evaluate thequestions or answers again. In this case, the workload of humansis reduced significantly.
6. DISCUSSIONAsking questions for the purpose of learning is not a new phe-
nomenon within the area of information seeking. It is an innate andpurposive human behavior to search information to satisfy a need[8], and information and knowledge received through an asker’squestioning behavior may become meaningful in that the informa-tion acquired helps solve their problematic situations [35]. In re-cent years, new information and communication technologies haveemerged to develop novel ways for users to interact with informa-tion systems and experts in order to seek information. These newresources include digital libraries and virtual references, as well as
0.0 0.2 0.4 0.6 0.8 1.0False Positive Rate
0.0
0.2
0.4
0.6
0.8
1.0Tr
uePo
sitiv
eR
ate
Receiver Operating Characteristic
USA: AUC = 0.914PL: AUC = 0.925
Figure 10: Area Under ROC curve for our frameworks areabove 0.9 in both data sets.
CQA services where users are both consumers and producers ofinformation.
According to Ross et al. [23], what librarians and experts inbrick and mortar as well as virtual reference environments do isa process of negotiating an asker’s question, which helps identifyan asker’s information need and allows him/her to construct a bet-ter question and receive high quality answers. However, this pro-cess of question negotiation does not occur in the context of CQA,which may cause significant issues for providing high quality an-swers. Identifying what constitutes the content quality of informa-tion generated in CQA (or for that matter, any online repositorywith user-generated content) can be critical to the applicability andsustainability of such digital resources.
When it comes to CQA in educational contexts, seeking andsharing high quality answers to a question may be more criticalsince question-answering interactions for educational answers islikely to solicit factual and verifiable information, in contrast togeneral-purpose CQA services where advice and opinion-seekingquestions are predominant [7]. Thus, evaluating and assessing thequality of educational answers in CQA is important for not only im-proving user satisfaction, but also for supporting students’ learningprocesses.
In this work, therefore, we investigated Brainly, an educationalCQA, and attempted to utilize a series of textual and non-textualanswer features in order to identify levels of content quality amongeducational answers. The study first attempted to identify a list ofcontent characteristics that would constitute the quality of answers.In the second step, we applied these features in order to automati-cally assess the quality of answer. The results showed that PersonalFeatures and Community Features are more robust in determininganswer quality. Most of these features are available and feasible tocompute in other CQA sites, making our approach applicable to thewider community.
Furthermore, the efficacy and efficiency of our method make itpossible to implement within the real system. In our experiment ona standard PC, it takes less than one millisecond to return the pre-diction. It also only takes less than one minute to train the modelwith 200,000 answers from Brainly. However, the training step is aone-time cost and can be accomplished using distributed process-ing. By applying this technique to the real system, we believe thatwe can reduce the number of deleted answers by giving a warning
immediately before a user submits a response to the community.Furthermore, the approach can approve high-quality answers, sothat an asker’s wait time can be reduced significantly.
Most of the previous work applied logistic regression in order toevaluate the quality of answers. Our work showed that a “wisdomof the crowd” approach, such as Random Forest, can significantlyimprove the accuracy of assessing the quality of answers due to anon-linear relationship between the features and the quality of an-swers. For example, the results showed that longer answers aremore likely to be approved compared to deleted answers. But verylengthy answers might signal low-quality answers, such as confus-ing or spam answers. Even though the current study focused onevaluating the quality of answers in terms of educational informa-tion on CQA for online learning in particular, the study would alsosuggest an alternative way of how the quality of answers in thecontext of general CQA could be investigated by our method - i.e.,a “wisdom of the crowd” approach - in order to improve the ac-curacy of assessing the quality of answers. Moreover, in terms ofpractical implications of users’ interactions for content moderationon CQA, the findings may propose a variety of features or tools(e.g., detecting spams, trolling, plagiarism, etc.) that support con-tent moderators in order to develop a healthy online community inwhich users may be able to seek and share high quality informationand knowledge via question-answering interactions.
There are also limitations to our work. Our work can only detecthigh- and low-quality answers. It would be helpful if we could pro-vide suggestions to improve the overall quality of these answers.We believe this is challenging work but a highly rewarding task,which might require a significant effort to examine answer mean-ing. Furthermore, our approach was based heavily on the commu-nity’s past interactions, which has limited applicability to a newly-formed community.
7. CONCLUSIONIn the current study, we focused on the quality of educational
answers in CQA. Our work was motivated by a need to improvethe efficiency of managing the community in terms of seeking andsharing high-quality answers to a question. Since employing hu-man assessments may not be sufficient due to the large amountof content available, as well as subjective assessments of answerquality, we propose a framework to automatically assess the qual-ity of answers for these communities. In general, our frameworkintegrates different aspects of answers, such as personal features,community features, textual features, and contextual features. Thisis the first large scale study on CQA for education. Our methodachieves high performance in all important metrics such as accu-racy, F1 score, and Area under ROC curve. Furthermore, the ex-periment shows the efficiency of our method, which can work wellin a real time system.
We find that personal features and community features are morerobust in assessing the quality of answers in an online educationcommunity. The textual features and contextual features are lessrobust due to the diversity of users and content in these communi-ties. Furthermore, all features used in this study can be computedeasily, which makes the framework’s implementation feasible.
In future work, we plan to study struggling users in the com-munity. We see that many answers were deleted due to low qual-ity. But the reasons these posts were deemed low-quality were notclear. Possibilities include a lack of knowledge on the part of theanswerer, an arrogant attitude, or anti-social behavior. Detectingand helping struggle users also increase the quality of the site. Webelieve that understanding the latent features can help struggling
users, improve users’ experiences, and make online learning moreefficient.
8. ACKNOWLEDGEMENTSA portion of the work reported here was possible due to funds
and data access provided by Brainly. We are also grateful to MichalLabedz and Mateusz Burdzel from Brainly for their help and in-sights into the topics discussed in this work.
9. REFERENCES[1] L. A. Adamic, J. Zhang, E. Bakshy, and M. S. Ackerman.
Knowledge sharing and yahoo answers: Everyone knowssomething. In WWW, pages 665–674, 2008.
[2] C. Aritajati and N. H. Narayanan. Facilitating students’collaboration and learning in a question and answer system.In CSCW Companion, pages 101–106, 2013.
[3] M. Berlingerio, D. Koutra, T. Eliassi-Rad, and C. Faloutsos.Network similarity via multiple social theories. In ASONAM,pages 1439–1440, 2013.
[4] C. M. Bishop. Pattern Recognition and Machine Learning(Information Science and Statistics). Springer, 2006.
[5] L. Breiman. Random forests. Mach. Learn., 45(1):5–32,2001.
[6] E. Choi, M. Borkowski, J. Zakoian, K. Sagan, K. Scholla,C. Ponti, M. Labedz, and M. Bielski. Utilizing contentmoderators to investigate critical factors for assessing thequality of answers on brainly, social learning Q&A platformfor students: a pilot study. In ASIST, 2015.
[7] E. Choi, V. Kitzie, and C. Shah. Developing a typology ofonline Q&A models and recommending the right model foreach question type. In ASIST, pages 1–4, 2012.
[8] E. Choi and C. Shah. User motivation for asking a questionin online Q&A services. JASIST, In press.
[9] R. A. Cole. Issues in Web-based pedagogy: A critical primer.Greenwood Press, 2000.
[10] D. H. Dalip, H. Lima, M. A. Gonçalves, M. Cristo, andP. Calado. Quality assessment of collaborative content withminimal information. In JCDL, pages 201–210, 2014.
[11] G. Dror, Y. Maarek, and I. Szpektor. Will my question beanswered? predicting "question answerability" in communityquestion-answering sites. In ECML/PKDD, volume 8190,pages 499–514, 2013.
[12] R. Gazan. Social Q&A. JASIST, 63:2301–2312, 2011.[13] S. D. Gollapalli, P. Mitra, and C. L. Giles. Ranking experts
using author-document-topic graphs. In JCDL, pages 87–96,2013.
[14] T. Hastie, R. Tibshirani, and J. Friedman. The Elements ofStatistical Learning. Springer Series in Statistics, 2009.
[15] J. P. Kincaid, R. P. Fishburne, R. L. Rogers, and B. S.Chissom. Derivation of New Readability Formulas(Automated Readability Index, Fog Count and FleschReading Ease Formula) for Navy Enlisted Personnel.Technical report, Naval Air Station Memphis, 1975.
[16] L. T. Le, T. Eliassi-Rad, and H. Tong. MET: A fast algorithmfor minimizing propagation in large graphs with smalleigen-gaps. In SDM, pages 694–702, 2015.
[17] L. T. Le and C. Shah. Retrieving rising stars in focusedcommunity question-answering. In ACIIDS, pages 25–36,2016.
[18] A. Y. Levy, A. Rajaraman, and J. J. Ordille. Querying
heterogeneous information sources using sourcedescriptions. In VLDB, pages 251–262, 1996.
[19] Y. Liu, J. Bian, and E. Agichtein. Predicting informationseeker satisfaction in community question answering. InSIGIR, pages 483–490, 2008.
[20] E. Momeni, K. Tao, B. Haslhofer, and G.-J. Houben.Identification of useful user comments in social media: Acase study on flickr commons. In JCDL, pages 1–10, 2013.
[21] M. Noer. One Man, One Computer, 10 Million Students:How Khan Academy Is Reinventing Education. Forbes, 2013.
[22] J. Preece, B. Nonnecke, and D. Andrews. The top fivereasons for lurking: improving community experiences foreveryone. Computers in Human Behavior, 20(2):201 – 223,2004.
[23] C. Ross, K. Nilsen, and P. Dewdney. Conducting thereference interview: A how-to-do-it manual for librarians.New York: NealSchuman, 2002.
[24] C. Shah and V. Kitzie. Social q&a and virtual reference -comparing apples and oranges with the help of experts andusers. JASIST, 63:2020–2036, 2012.
[25] C. Shah, S. Oh, and J. S. Oh. Research agenda for socialQ&A. Library & Information Science Research,31(4):205–209, 2009.
[26] C. Shah and J. Pomerantz. Evaluating and predicting answerquality in community qa. In SIGIR, pages 411–418, 2010.
[27] C. Shah, M. Radford, L. Connaway, E. Choi, and V. Kitzie.How much change do you get from 40$? analyzing andaddressing failed questions on social Q&A. In ASIST, pages1–10, 2012.
[28] I. Srba and M. Bielikova. Askalot: Community questionanswering as a means for knowledge sharing in aneducational organization. In CSCW Companion, pages179–182, 2015.
[29] M. Surdeanu, M. Ciaramita, and H. Zaragoza. Learning torank answers on large online qa collections. In ACL, pages719–727, 2008.
[30] J. Surowiecki. The Wisdom of Crowds. Anchor, 2005.[31] M. A. Suryanto, E. P. Lim, A. Sun, and R. H. L. Chiang.
Quality-aware collaborative question answering: Methodsand evaluation. In WSDM, pages 142–151, 2009.
[32] P. A. Tess. The role of social media in higher educationclasses (real and virtual) - a literature review. Computers inHuman Behavior, 29:A60–A68, 2013.
[33] G. Wang, K. Gill, M. Mohanlal, H. Zheng, and B. Y. Zhao.Wisdom in the social crowd: An analysis of quora. In WWW,pages 1341–1352, 2013.
[34] L. Yang, S. Bao, Q. Lin, X. Wu, D. Han, Z. Su, and Y. Yu.Analyzing and predicting not-answered questions incommunity-based question answering services. In AAAI,pages 1273–1278, 2011.
[35] S. Yang. Information seeking as problem-solving using aqualitative approach to uncover the novice learners’information-seeking process in a perseus hypertext system.Library and Information Science Research, 19(1):71–92,1997.
[36] Y. Yao, H. Tong, F. Xu, and J. Lu. Predicting long-termimpact of cqa posts: A comprehensive viewpoint. InSIGKDD, pages 1496–1505, 2014.