
Evaluating the Long-Term Impact of Nutrition Standards and ...
28
Evaluating the Long-Term Impact of Nutrition Standards and Other Healthy Food Procurement Practices in Los Angeles County NOPREN Food Service Guidelines Workgroup Meeting March 18 th , 2020 Brenda Robles, PhD, MPH Chief Research Analyst, Nutrition and Health Programs Division of Chronic Disease and Injury Prevention Los Angeles County Department of Public Health
Transcript of Evaluating the Long-Term Impact of Nutrition Standards and ...
Evaluating the Long-Term Impact of Nutrition Standards and Other Healthy Food Procurement Practices in Los Angeles County
NOPREN Food Service Guidelines Workgroup MeetingMarch 18th, 2020
Brenda Robles, PhD, MPHChief Research Analyst, Nutrition and Health ProgramsDivision of Chronic Disease and Injury Prevention Los Angeles County Department of Public Health

Overview
1
• Quick recap of programmatic and evaluation healthy food procurement efforts in Los Angeles County
• Highlight long-term impact evaluation activities
• Discuss lessons learned

Brief Recap of Programmatic and Evaluation Efforts in Los Angeles County
2

Healthy Food Procurement (HFP) Initiative
2010 – PresentDPH launched its initiative to create healthier food environments in the County of Los Angeles government and the private sector with support from the CDC.• Communities Putting Prevention to Work
• Community Transformation Grants
• 1422 Grant, State and Local Public Health Actions to
Prevent Obesity, Diabetes, and Heart Disease and Stroke
• Sodium Reduction in Communities Program (2010-Present)
2011 – County of Los Angeles Board of Supervisors adopted Board motion, Healthy Food Promotion in LA County Food
Services Contracts.
3

Healthy Food Procurement Initiative Timeline
4
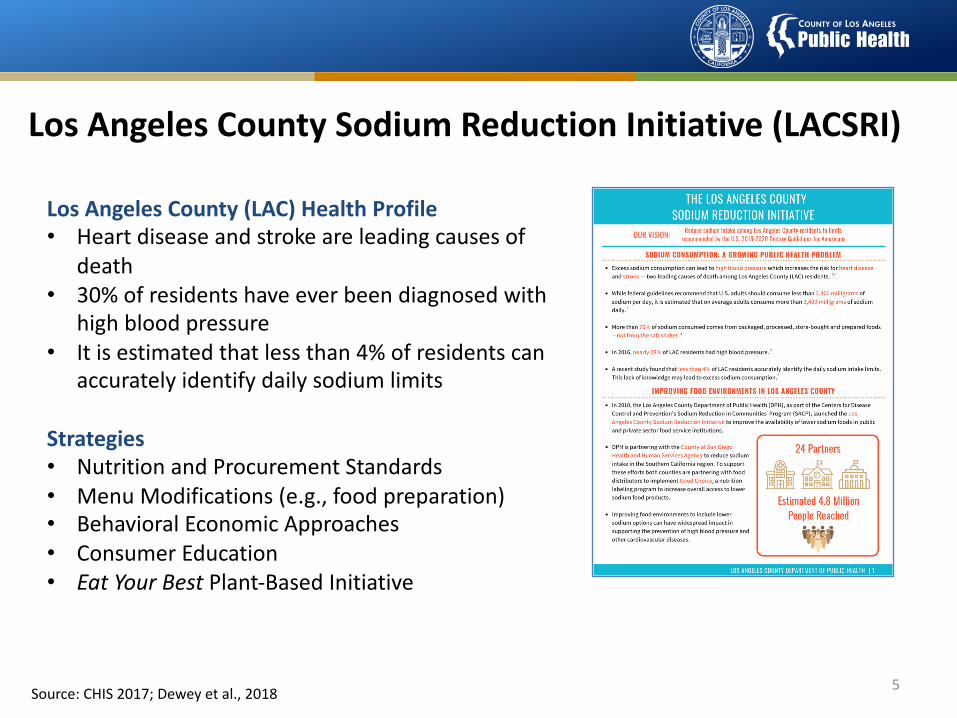
Los Angeles County Sodium Reduction Initiative (LACSRI)
5
Los Angeles County (LAC) Health Profile• Heart disease and stroke are leading causes of
death • 30% of residents have ever been diagnosed with
high blood pressure• It is estimated that less than 4% of residents can
accurately identify daily sodium limits
Strategies • Nutrition and Procurement Standards • Menu Modifications (e.g., food preparation)• Behavioral Economic Approaches• Consumer Education• Eat Your Best Plant-Based Initiative
Source: CHIS 2017; Dewey et al., 2018

6
Building the Business Case for Healthy Food ProcurementEvaluation Framework

Long-Term Impact Evaluation Activities
7

Approach #1: Estimate Potential Untapped Revenue
Usage reports or sales mix data
• Examines the volume for which a menu item or items are produced or sold during a set period of time.
8

Approach #1: Estimate Potential Untapped Revenue
Patron intercept of web-based survey analyses
• Benchmarks the percentage of customers eating or not eating at food service operator facilities and their nutrition-related knowledge, attitudes, beliefs, and behaviors.
9

Example of Survey Question Categories
10
Background
Cafeteria Purchasing Behaviors
General Food Purchasing Behaviors
Opinions about the Cafeteria
Respondent Health Knowledge /Behaviors
Respondent Characteristics
Purchases regularly
Does not regularly purchase

Survey Category Sub-Category Survey Question Examples
Background -- • Which of the following best describes you? (Response options: Staff, Faculty, Visitor, etc)
Food Purchasing Behaviors
-- • Do you regularly purchase food (including meals, snacks, and/or beverages) from <institution>(Response options: Yes or No)
-- Regularly purchases food
• On average, how many times a week do you purchase items from the following stations during: a) Breakfast; b) Lunch <insert photo of each station> (Response options: Never, 1x/week, 2x per week, 3x per week, 4x per week, 5x or more per week)
-- Does not regularly purchase food
• What is the main reason you do not regularly buy a meal, snack, and/or beverage at <institution>? (Response options: Variety is limited, Not enough heathy choices, Hours of operation are limited, Prices are too expensive, Other [fill in])
General Food Purchasing Behaviors
-- • Typically, when you buy a meal, how important is each of the following: a) calories it has; b) sodium it has; c) added sugar; d) how it tastes; e) getting a good price; e) that it is locally sourced; f) that it is organic (Response options: 4-point likert scale)
11

Survey Category Sub-Category Survey Question Examples
Opinions about <institution>
-- • In general, how satisfied are you with the food options sold at Café Med? (Response options: 4-point likert scale)• Please explain why you responded very satisfied,
dissatisfied, or very dissatisfied (Response option: fill in)
Health Respondent Knowledge and Behaviors
-- • Please fill in the blank in the following statement: “In general, an average adult should consume no more than ___ milligrams of sodium per day” (Response option: whole number fill in)
Respondent Characteristics
-- • How do you describe yourself? (Response options: Male, Female, Transgender, Prefer not to answer)
• What is your age? (Response option: fill in)
12

Approach #2: Understand the Menu Mix
Usage reports or sales mix data
• Examines the volume for which a menu item or items are produced or sold during a set period of time.
13

Approach #2: Understand the Menu Mix
Food Purchase Inventory Analyses
• Examines the types of products and ingredients a food service operator purchases from its food distributors.
14

Approach #2: Understand the Menu Mix
Back-of-House Environmental Scans (Pantry Assessments)
• Captures data on the nutritional quality of ingredients used during food preparation in instances where food service operators are unable to share food purchase inventory data.
15

Approach #2: Understand the Menu Mix
Recipe and/or nutritional information analyses
• Examines the nutritional quality of menu items to assess the extent to which foods meet healthy nutrition standards.
16
Approach #3: Adjust Product Set
Example: Salt Measurement Protocol
• Food purchasing inventory• Back-of-house environmental scans (e.g.,
pantry assessment, etc.)• Recipe assessment
17
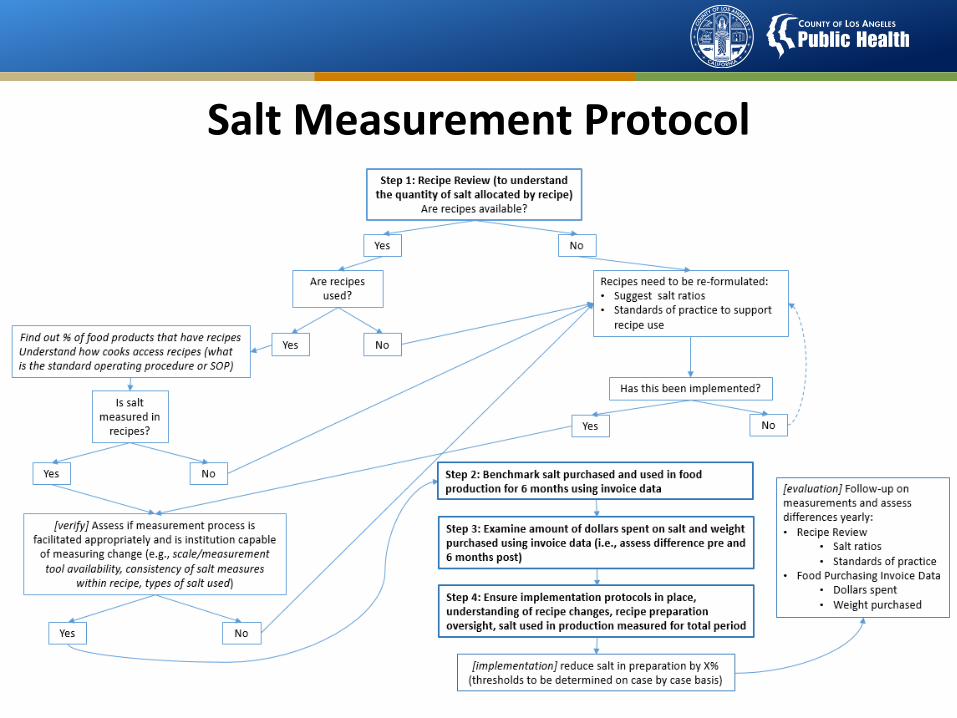
Salt Measurement Protocol
18

Lessons Learned To Date
19
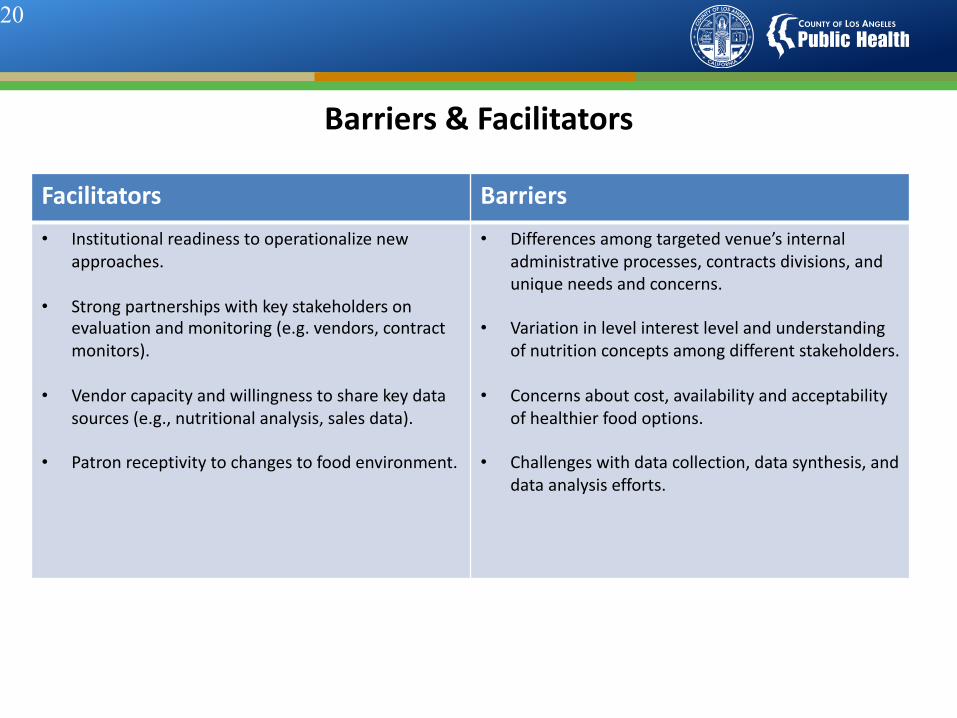
Barriers & Facilitators
Facilitators Barriers• Institutional readiness to operationalize new
approaches.
• Strong partnerships with key stakeholders on evaluation and monitoring (e.g. vendors, contract monitors).
• Vendor capacity and willingness to share key data sources (e.g., nutritional analysis, sales data).
• Patron receptivity to changes to food environment.
• Differences among targeted venue’s internal administrative processes, contracts divisions, and unique needs and concerns.
• Variation in level interest level and understanding of nutrition concepts among different stakeholders.
• Concerns about cost, availability and acceptability of healthier food options.
• Challenges with data collection, data synthesis, and data analysis efforts.
20

Usage Reports or Sales Mix Data
21
Challenges SolutionsFood service operators are often reluctant to share these types of proprietary information due to fears of being regulated and mandated to achieve certain standards.
Showcase business case success stories using examples of how other DPH partners have used this data to improve their business practices for health; work with a credible food industry consultant to reinforce that this data is necessary for making informed business decisions.
Food service operators often do not understand DPH’s data requests.
Use the correct terminology when asking institutions for such data (e.g., ask for “sales mix” instead of “sales” data)

Usage Reports or Sales Mix Data [CONT’D]
22
Challenge(s) Solution(s)Food service operators may not have collected the data in a way that is conducive to analyses and/or that provide data that are in difficult to understand formats (e.g., total sales are aggregated rather than itemized, making it difficult for DPH staff to identify top-selling items).
Work with food service operators to program point-of-sale machines to collect itemized sales data (e.g., have a button on the cash register that distinguishes between healthy and unhealthy meals).

Patron Intercept or Web-Based Surveys
23
Challenge(s) Solution(s)Administering patron surveys and analyzing corresponding data can be time and staff intensive, which makes if difficult for DPH to help institutional food industry partners to make informed decisions in real-time.
Disseminate web-based survey links through existing channels (e.g. list-servs) and encourage partners to promote the survey to their institutional bases.
Survey fatigue or general disinterest among prospective respondents in taking the survey results in low participation rates, which may introduce survey bias.
Work with institutional partners to provide financial or other incentives (e.g., free meal) to survey participants.

Food Purchase Inventory Analyses
24
Challenge(s) Solution(s)Food service operators are often reluctant to share these types of proprietary information due to fears of being regulated and mandated to achieve certain standards.
Showcase business case success stories using examples of how other DPH partners have used this data to improve their business practices for health; work with a credible food industry consultant to reinforce that this data is necessary for making informed business decisions.
Food service operators often do not understand DPH’s data requests.
Use the correct terminology when asking institutions for such data.
Food service operators may not have collected the data in a way that is conducive to analyses and/or that provide data that are in difficult to understand formats (e.g., total sales are aggregated rather than itemized, making it difficult for DPH staff to identify top-selling items).
Work with food service operators to program point-of-sale machines to collect itemized sales data (e.g., have a button on the cash register that distinguishes between healthy and unhealthy meals).

Back of House Environmental Scans
25
Challenge(s) Solution(s)Environmental scans are DPH staff and time intensive, and lead to delays in providing partners with results which could help them make informed decisions.
Create a simplified self-assessment environmental scan tools that institutional partners can complete themselves.

Recipe and/or Nutritional Information Analysis
26
Challenge(s) Solution(s)Some food service operators are unable to carry out nutritional analyses of their menu items because they either do not have or do not follow recipes.
DPH should continue to work with food service partners to develop recipes and to implement standardization protocols.
Nutritional information is difficult for institutions to update given that menus and product sets are constantly changing.
DPH should work with food service partners to implement timely reporting protocols to capture changes made to the nutritional profile of the food environment.