Hydrologic Data and Modeling: Towards Hydrologic Information Science

Evaluating the Hydrologic and Water Quality Performance of Infiltrating
Wet Retention Ponds
Joshua Baird, E.I.Town of Morrisville
Bill Hunt, Ph.D., PERyan Winston, PENorth Carolina State University
www.bae.ncsu.edu/stormwater

www.bae.ncsu.edu/stormwater
Forested Watershed (Swift et al., 1987)
ET = 50%
Runoff = 5%
Infiltration = 45%

www.bae.ncsu.edu/stormwater
Developed Watershed (US EPA, 1993)
ET = 30%
Runoff = 55%
Infiltration = 15%
www.bae.ncsu.edu/stormwater
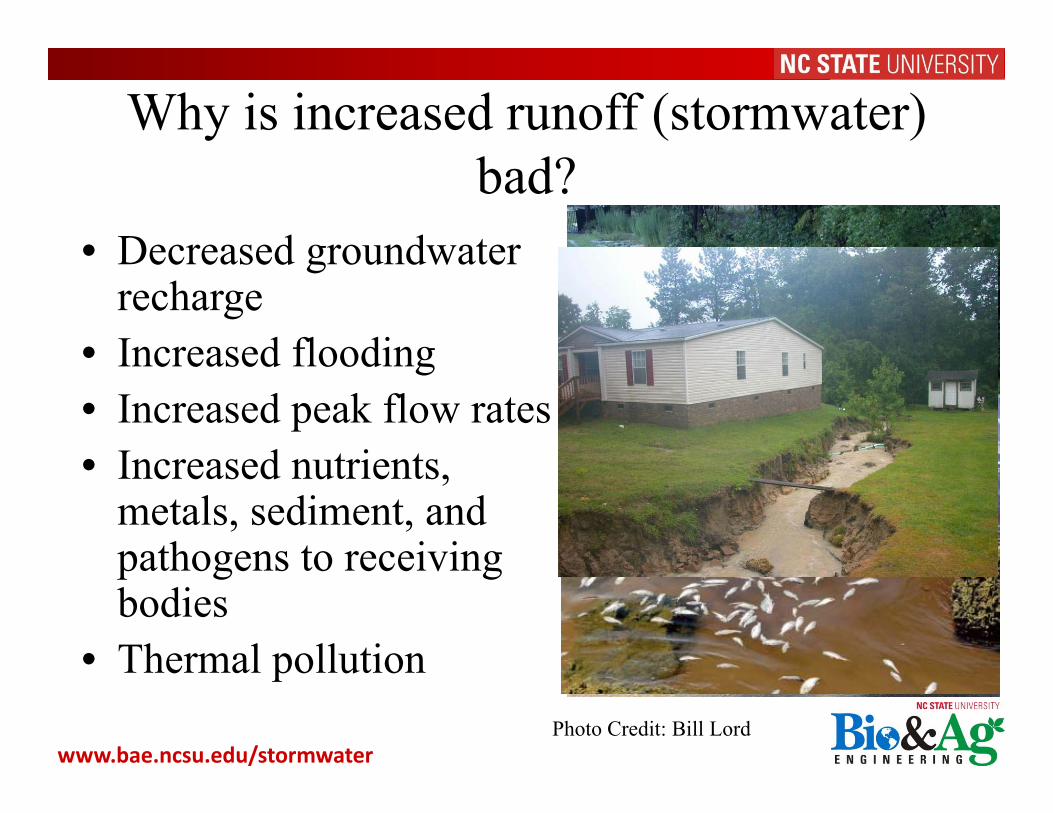
Why is increased runoff (stormwater) bad?
• Decreased groundwater recharge
• Increased flooding• Increased peak flow rates• Increased nutrients,
metals, sediment, and pathogens to receiving bodies
• Thermal pollutionPhoto Credit: Bill Lord
www.bae.ncsu.edu/stormwater
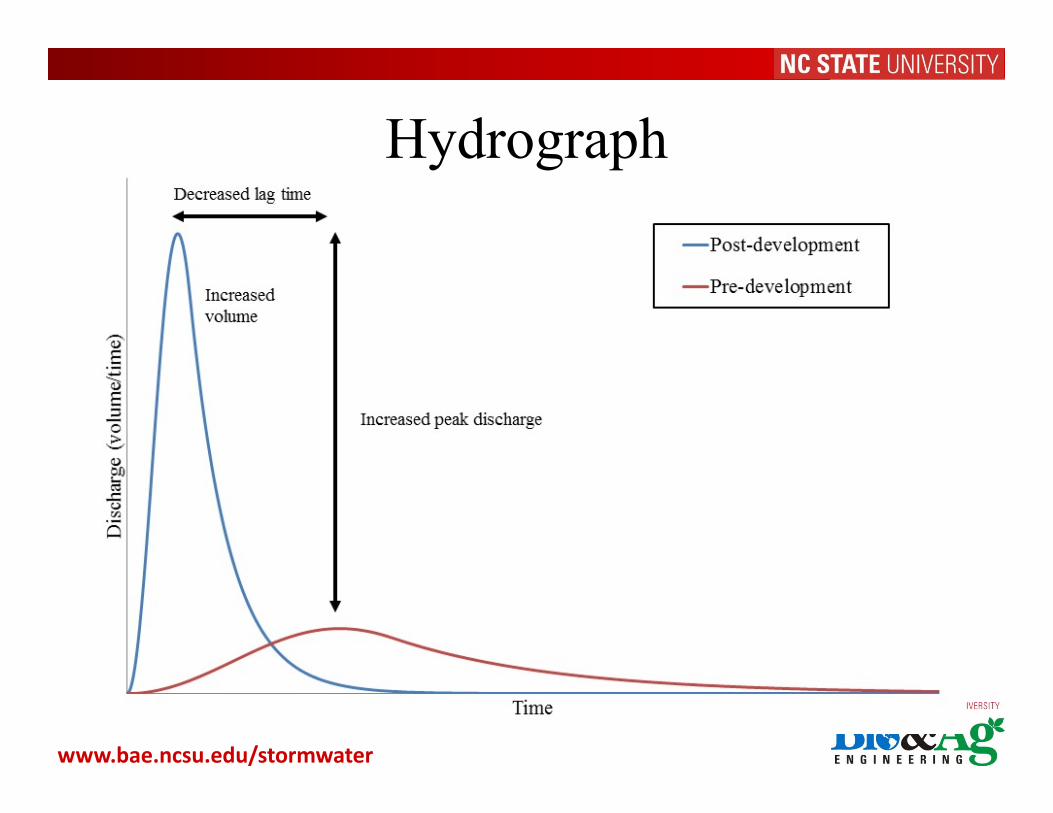
Hydrograph

www.bae.ncsu.edu/stormwater
Stormwater Regulations
• Clean Water Act – 1972• National Pollution Discharge Elimination System (NPDES) – Phase 1 ‐ 1990
• NPDES – Phase 2 ‐ 2003• Energy Independence and Security Act – 2007• Specific State regulations to protect certain water resources

www.bae.ncsu.edu/stormwater
Stormwater Control Measures (SCM)
Stormwater WetlandBioretention
Permeable Pavement
Grassed Swale
Wet Retention PondDry Detention Basin
Images from NC DEMLR BMP Manual (2009)
www.bae.ncsu.edu/stormwater
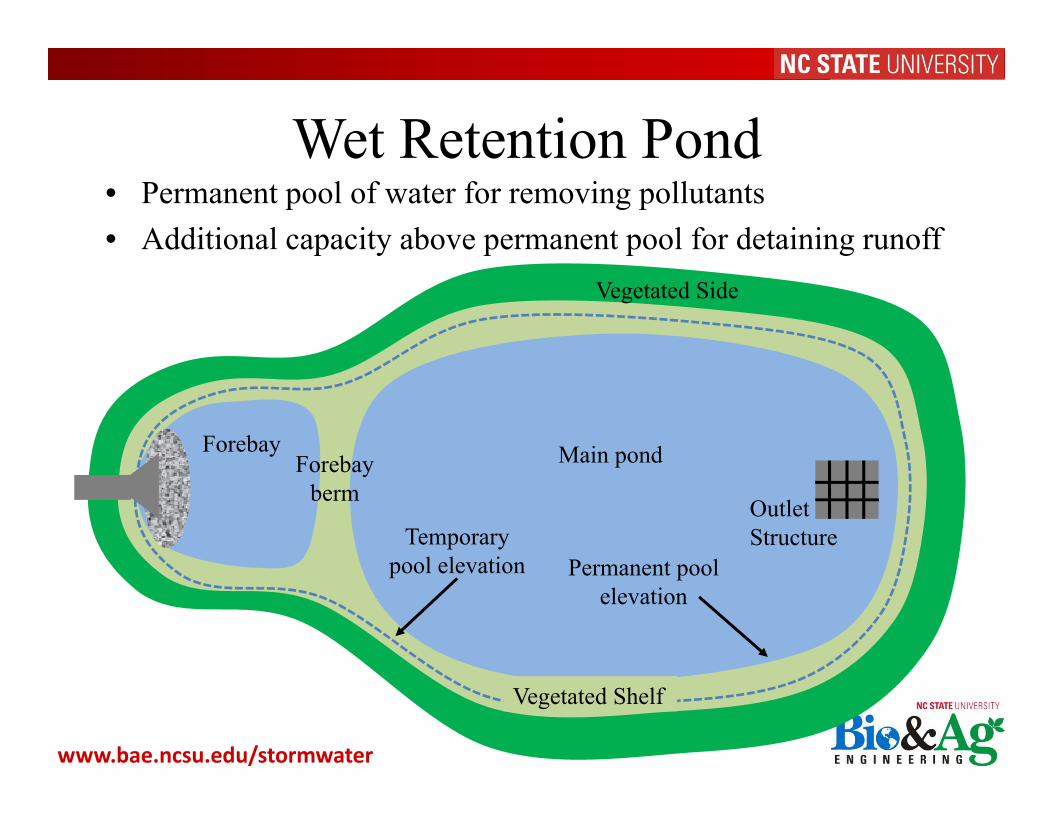
Wet Retention Pond• Permanent pool of water for removing pollutants • Additional capacity above permanent pool for detaining runoff
Forebay Main pond
Vegetated Side
Outlet Structure
Permanent pool elevation
Temporary pool elevation
Forebay berm
Vegetated Shelf

www.bae.ncsu.edu/stormwater
Typical Wet Pond
www.bae.ncsu.edu/stormwater
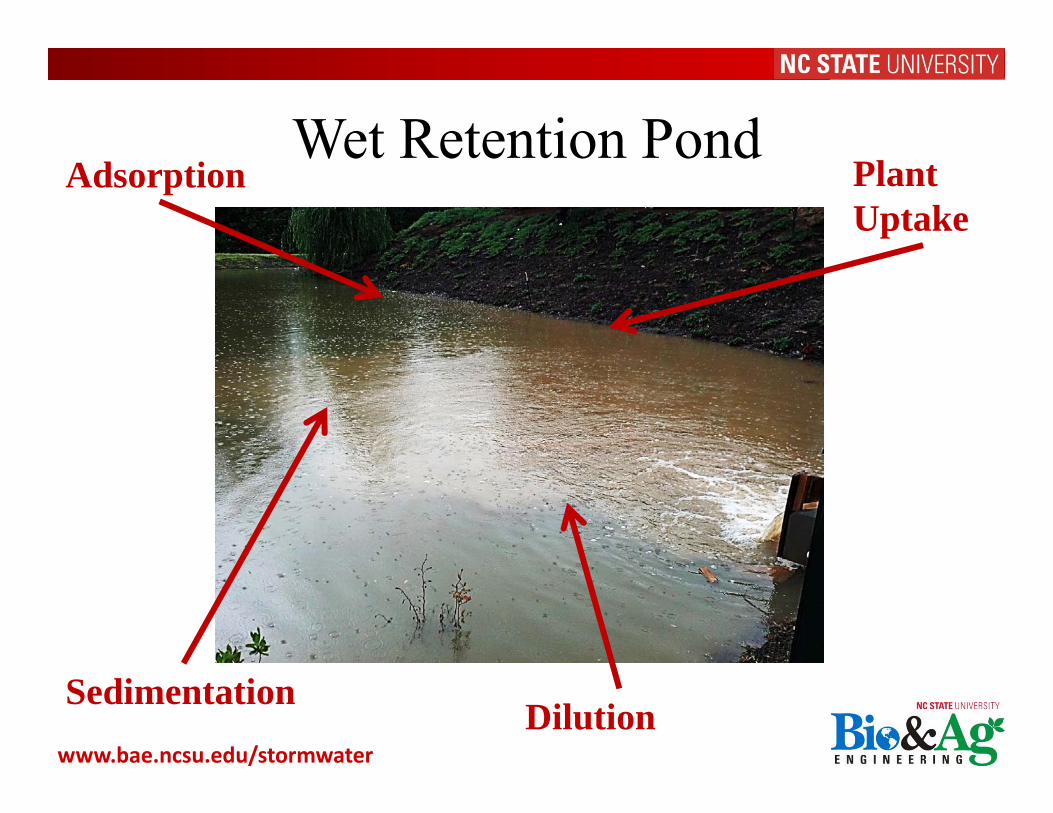
Wet Retention Pond
Sedimentation
Adsorption Plant Uptake
Dilution
www.bae.ncsu.edu/stormwater
Regulatory Credits• Pollutant Removal
- 85% Total Suspended Solids- 25% Total Nitrogen- 40% Total Phosphorous
• Water Quantity- Peak runoff attenuation- No runoff volume reduction

www.bae.ncsu.edu/stormwater
Wet Ponds Over Hydrologic Soil Group A
• Requires an impermeable liner to comply with state guidelines
Water
Bentonite/clay liner
Permeable Soil
www.bae.ncsu.edu/stormwater
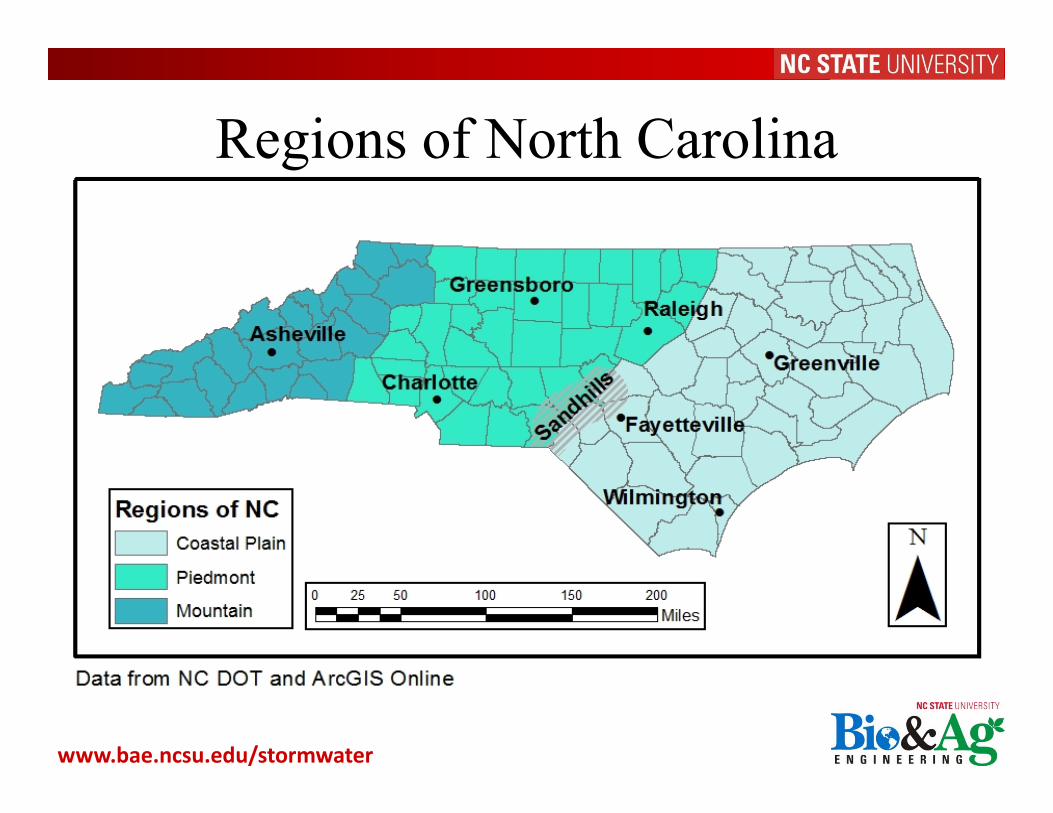
Regions of North Carolina

www.bae.ncsu.edu/stormwater
Infiltrating Wet Pond

www.bae.ncsu.edu/stormwater
Objectives• Quantify the effects of infiltration on wet
pond hydrology• Assess the water quality performance of
wet ponds that infiltrate• Determine if infiltrating wet ponds are
acceptable practices, and if so, develop supplemental design guidance and plant selection
www.bae.ncsu.edu/stormwater
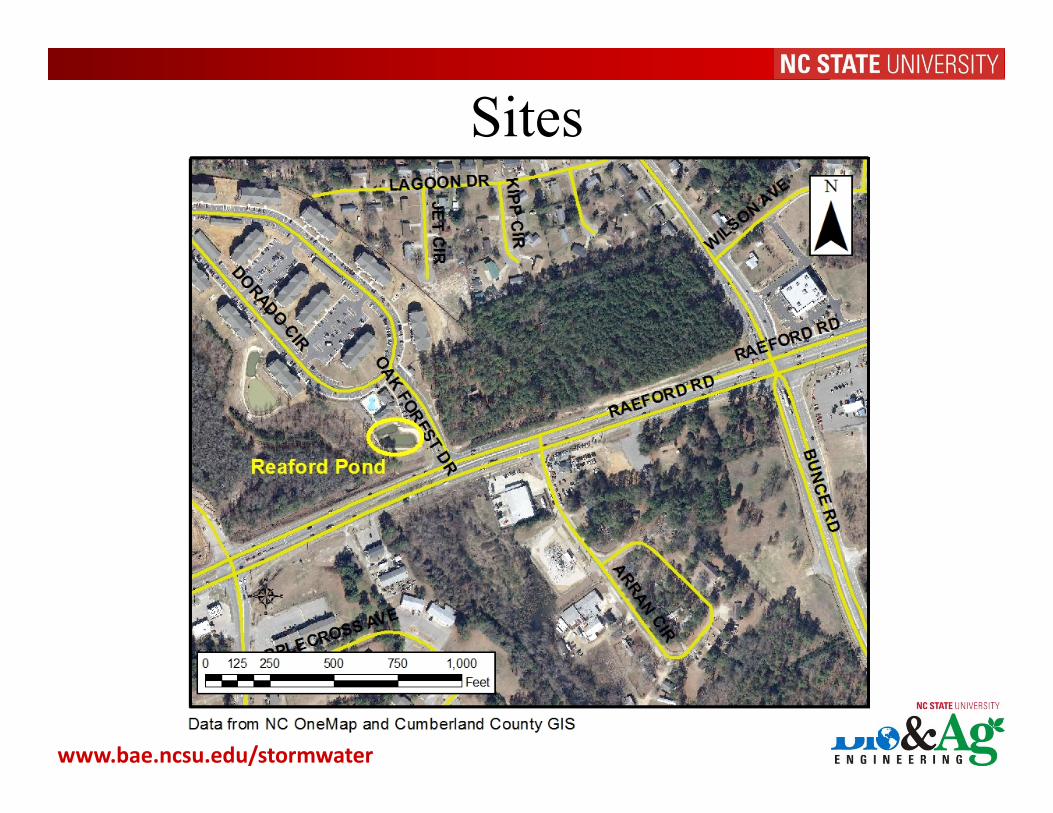
Sites
Bingham Station

www.bae.ncsu.edu/stormwater
Sites
Bingham Station

www.bae.ncsu.edu/stormwater
SitesBingham pond Raeford pond
Date construction was completed Mar-11 Jun-12
Surface area at permanent pool (ha) 0.12 0.08
Underlying Soil/HSG Autryville loamy sand/A Candor sand/A
Drainage Area (ha) 2.37 1.94Impervious Area (ha) 1.82 0.85
% Impervious 77 44Loading Ratio (area) 20:1 24:1Depth to SHWT (m) >1 <1Temp. water quality ponding depth (m) 0.45 0.9

www.bae.ncsu.edu/stormwater
Bingham Station
Raeford Crossing Apartments
Inlet
Outlet
Inlet 1
Outlet
Inlet 2
Images from Google Earth

www.bae.ncsu.edu/stormwater
Methods• Influent/Effluent Flow Rates
and Volumes - ISCO 6712 Automated samplers with Area Velocity Meter or compound weirs
• Rainfall and Intensity –manual and tipping bucket rain gauge
• Evaporation - ET gage atmometer model E with #30 turfgrass reference ET cover (Allen et al., 1998)
• Storage Volume - Hobo U20 - water level logger

www.bae.ncsu.edu/stormwater
Water Budget
= Vf
Vi = Initial volumeVin = Inflow volumeP = Rainfall on pondVOut = Outflow volumeE = EvaporationF = InfiltrationVf = Final volume
www.bae.ncsu.edu/stormwater
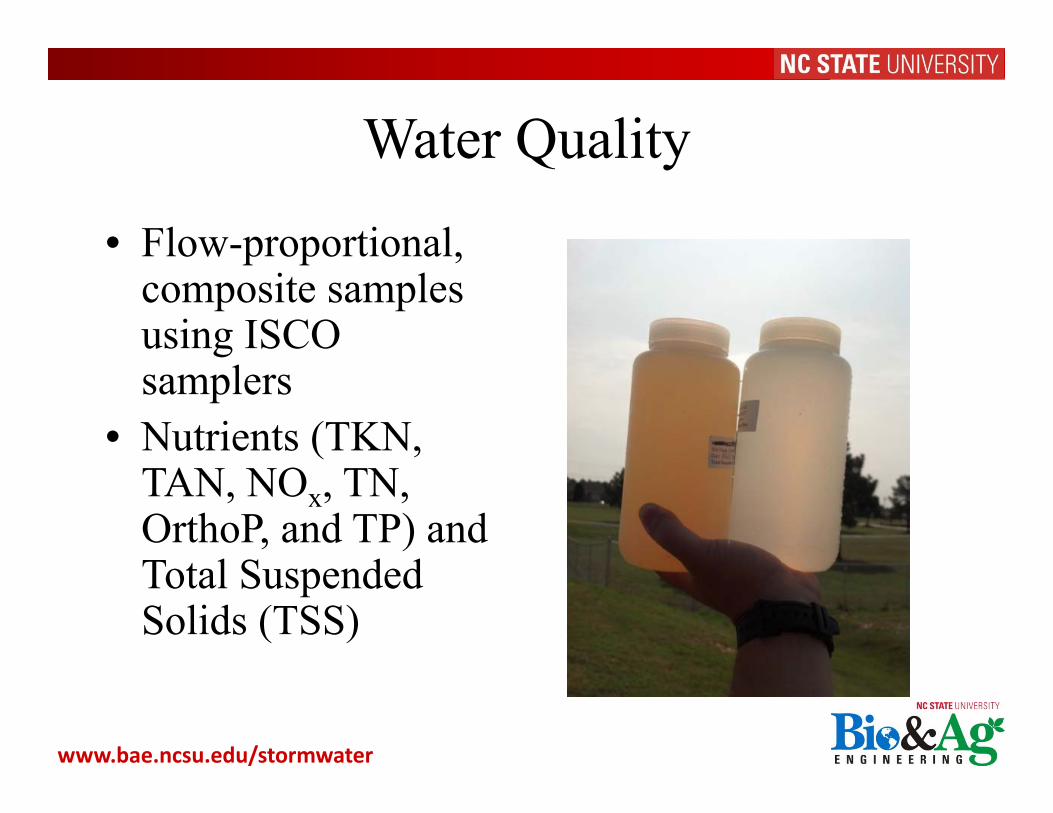
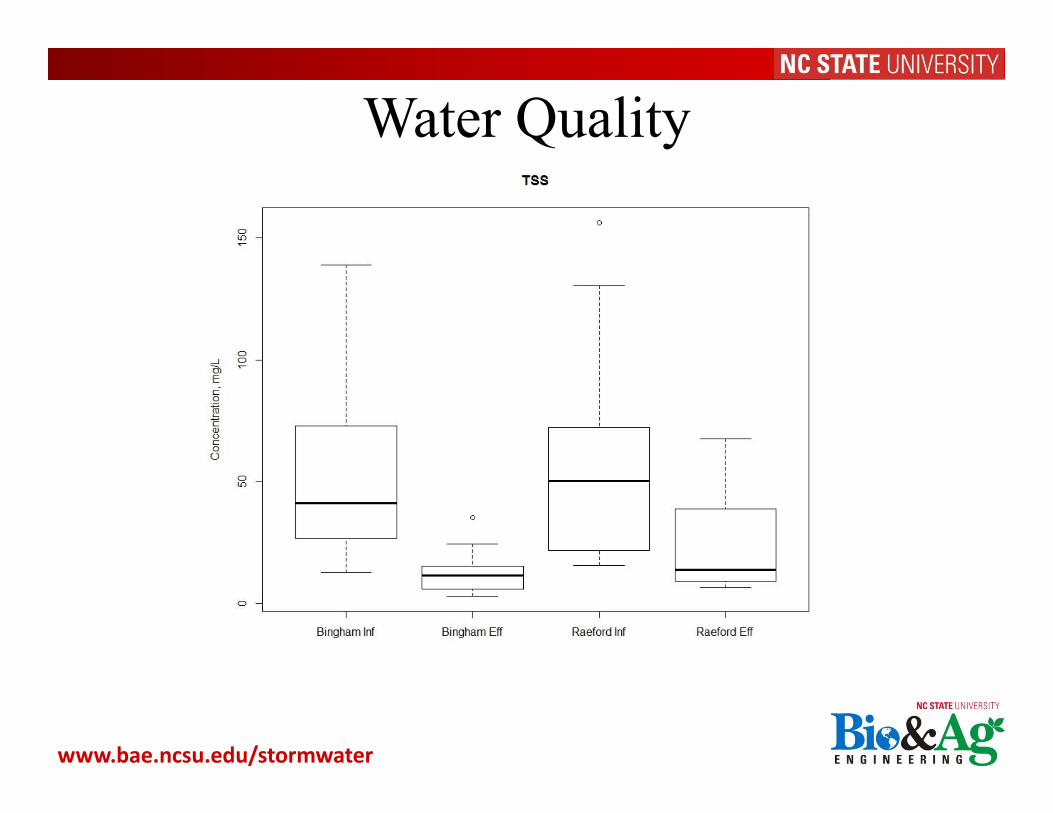
Water Quality
• Flow-proportional, composite samples using ISCO samplers
• Nutrients (TKN, TAN, NOx, TN, OrthoP, and TP) and Total Suspended Solids (TSS)

www.bae.ncsu.edu/stormwater
Results
Bingham RaefordNumber of water quality events 23 20Minimum storm rainfall (mm) 4 5Maximum storm rainfall (mm) 76 102
Minimum - 5-min peak rainfall intensity (mm/hr) 3 7Maximum - 5-min peak rainfall intensity (mm/hr) 135 133
Bingham RaefordNumber of hydrologic events 77 66Minimum storm rainfall (mm) 3 3Maximum storm rainfall (mm) 102 102

www.bae.ncsu.edu/stormwater
PrecipitationMonth
30-yr Normal* Bingham Raeford
Jan 106 117 114Feb 87 47 53Mar 111 117 138Apr 78 156 176May 84 57 64
Jun** 106 300 115Jul** 132 187 44Aug 132 117 118Sep 121 37 28Oct 77 13 19Nov 72 69 65Dec 81 115 132Year 1186 1330 1067
*(State Climate Office of North Carolina, 2014)**Rainfall totals at Bingham site from 2013 and rainfall totals from Raeford site from 2014

www.bae.ncsu.edu/stormwater
44 mm Event - Bingham0
0.5
1
1.5
2
2.5
3
3.5
40
0.02
0.04
0.06
0.08
0.1
0.12
0.14
11/26/13 8:24 11/26/13 18:00 11/27/13 3:36 11/27/13 13:12 11/27/13 22:48 11/28/13 8:24
Rai
nfal
l (m
m)
Flow
rate
(m3 /s
)
Influent Effluent Rainfall
83% Volume Reduction

www.bae.ncsu.edu/stormwater
Volume Reduction - Bingham0
100
200
300
400
5000
20
40
60
80
100
120
Rai
nfal
l (m
m)
Volu
me
Red
uctio
n (%
)
Volume Reduction Rainfall

www.bae.ncsu.edu/stormwater
Bingham Water Budget
MonthRainfall (mm)
Initial WL (m)
Influent Vol (m3)
Effluent Vol (m3)
Evap (m3)
Final WL (m)
InfiltratVol (m3)
Vol Reduction
(%)June 300 -0.16 3989 2075 123 0.19 1734 48.0July 187 0.19 2989 2683 158 -0.03 655 10.3
August 117 -0.03 1526 540 154 -0.19 1143 64.6September 37 -0.19 446 0 132 -0.19 359 100.0
October 13 -0.19 211 0 80 -0.43 380 100.0November 69 -0.43 805 84 67 -0.12 437 89.6December 115 -0.12 1414 423 47 -0.03 981 70.1January 117 -0.03 1751 872 55 -0.14 1137 50.2February 47 -0.14 751 4 62 -0.19 865 99.5
March 117 -0.19 2448 720 101 0.03 1619 70.6April 156 0.03 2428 1056 156 0.24 1290 56.5May 57 0.24 1099 441 170 -0.36 1417 59.8

www.bae.ncsu.edu/stormwater
Volume Reductions - Raeford0
50
100
150
200
250
300
350-20
0
20
40
60
80
100
120
Rai
nfal
l (m
m)
Volu
me
Red
uctio
n (%
)
Volume Reduction Rainfall

www.bae.ncsu.edu/stormwater
Raeford Water Budget
MonthRainfall (mm)
Initial WL (m)
Influent Vol (m3)
Effluent Vol (m3)
Evap(m3)
Final WL (m)
InfiltratVol (m3)
Vol Reduction
(%)August 118 0 1765 950 99 -0.03 655 46.2
September 28 -0.03 403 54 85 -0.15 566 86.7October 19 -0.15 77 0 52 -0.49 337 100.0
November 65 -0.49 684 64 43 -0.01 673 90.6December 132 -0.01 1855 1091 31 0.25 902 41.2January 114 0.25 1581 1816 36 -0.20 526 -14.9
February 53 -0.20 390 164 40 -0.11 592 58.1March 138 -0.11 1654 881 65 0.16 820 46.7April 176 0.16 2303 1665 100 0.61 1287 27.7May 64 0.61 1296 1107 109 -0.28 471 14.6June 115 -0.28 1582 723 81 0.01 687 54.3July 44 0.01 343 42 105 -0.31 451 87.7

www.bae.ncsu.edu/stormwater
Fate of Runoff - Bingham01002003004005006007008009000
1000
2000
3000
4000
5000
6000
Rai
nfal
l (m
m)
Volu
me
(m3 )
Outflow Infiltration Evaporation Rainfall

www.bae.ncsu.edu/stormwater
Fate of Runoff - Raeford0
100
200
300
400
5000
1000
2000
3000
4000
5000
Rai
nfal
l (m
m)
Volu
me
(m3 )
Outflow Infiltration Evaporation Rainfall
www.bae.ncsu.edu/stormwater
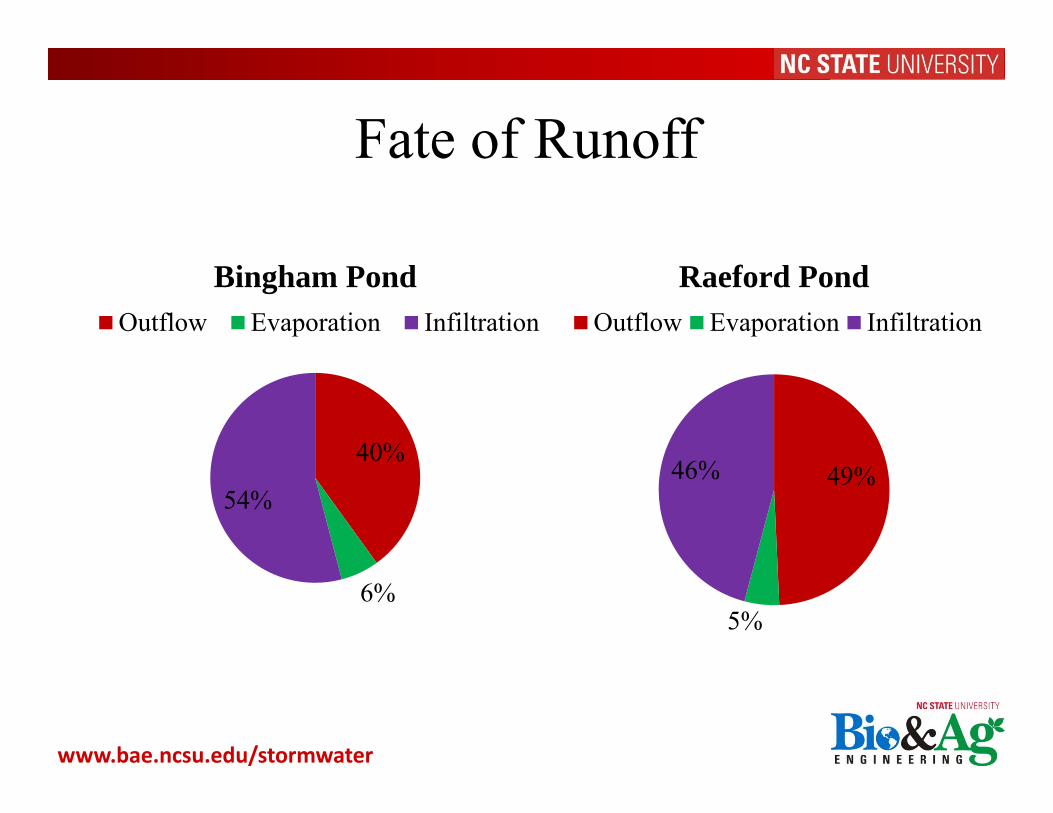
Fate of Runoff
40%
6%
54%
Bingham PondOutflow Evaporation Infiltration
49%
5%
46%
Raeford PondOutflow Evaporation Infiltration

www.bae.ncsu.edu/stormwater
Fate of Runoff
40% 49%
54%46%
6%5%
0
5000
10000
15000
20000
25000
Bingham Raeford
Tota
l inf
low
(m3 )
EvaporationInfiltrationOutflow

www.bae.ncsu.edu/stormwater
Summary of Hydrology
Bingham RaefordMedian Peak Flow Reduction* 99.2% 98.7%Median Volume Reduction** 100.0% 100.0%
Median Antecedent Dry Period (days) 2.4 3.9
*Values include storm events with no outflow that have a volume reduction and peak flow rate reduction of 100%.** Only solo storms (Bingham n=52, Raeford n=40) – solo storms considered those that began when the stage was below the draw-down orifice and the pond had time to de-water prior to the following event

www.bae.ncsu.edu/stormwater
0
1
2
3
4
5
60
1
2
3
4
5
6
7
8/19/2013 0:00 8/20/2013 0:00 8/21/2013 0:00
Rai
nfal
l (m
m)
Flow
Rat
e (c
fs)
Influent Effluent Rainfall
Bingham - 49 mm Event
-97% Peak Flow Reduction-53% Volume Reduction
www.bae.ncsu.edu/stormwater
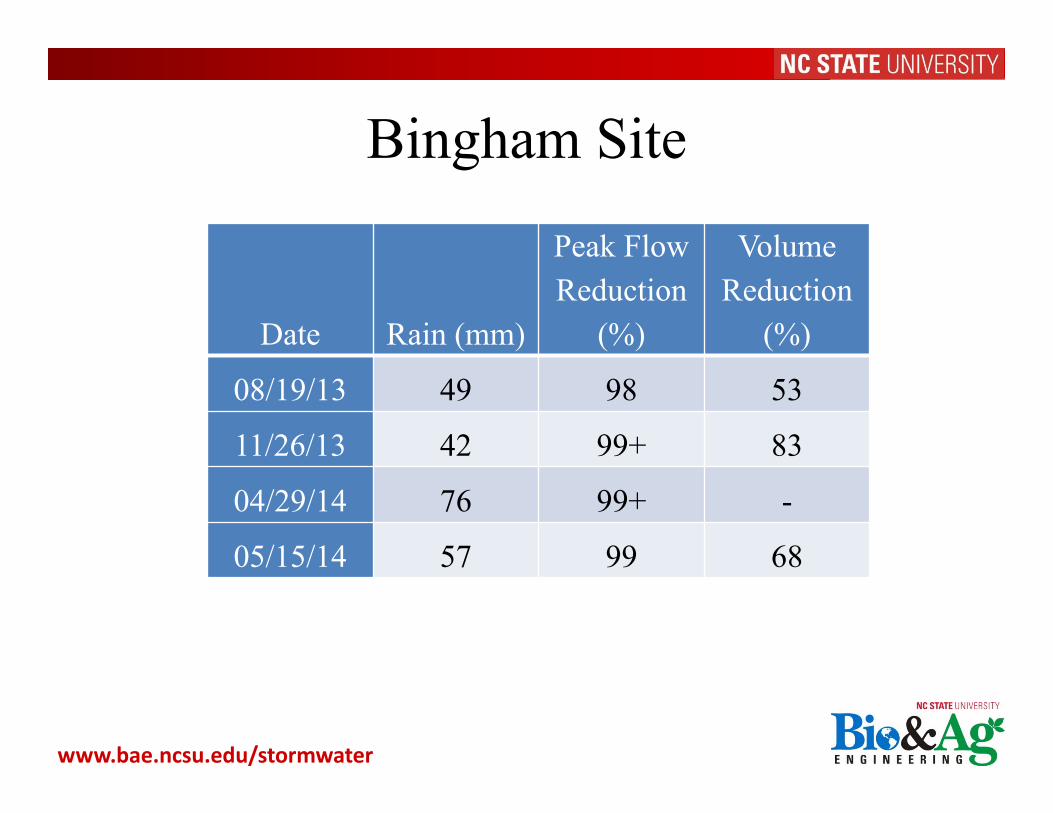
Bingham Site
Date Rain (mm)
Peak Flow Reduction
(%)
Volume Reduction
(%)
08/19/13 49 98 53
11/26/13 42 99+ 83
04/29/14 76 99+ -
05/15/14 57 99 68

www.bae.ncsu.edu/stormwater
Raeford Site
Date Rain (mm)
Peak Flow Reduction
(%)
Volume Reduction
(%)
12/14/13 40 98 31
12/29/13 50 70 -
03/16/14 46 93 34
03/28/14 34 99 -

www.bae.ncsu.edu/stormwater
Draw down curves post storm event
0
0.2
0.4
0.6
0.8
5/16/14 5/17/14 5/18/14 5/19/14 5/20/14 5/21/14
Wat
er L
evel
(m)
Bingham Raeford
Bingham pond – 2.38 days Raeford pond – 4.81 days

www.bae.ncsu.edu/stormwater
Average Water Level
-0.35-0.3
-0.25-0.2
-0.15-0.1
-0.050
0.050.1
0.15
Wat
er L
evel
(m)
Month
BinghamRaeford

www.bae.ncsu.edu/stormwater
Volume Reduction
0
10
20
30
40
50
60
70
80
90
100
Volume Re
duction (%
)
Month
Bingham Raeford

www.bae.ncsu.edu/stormwater
Bingham Water Level
‐0.4
‐0.35
‐0.3
‐0.25
‐0.2
‐0.15
‐0.1
‐0.05
018‐Oct 19‐Oct 20‐Oct 21‐Oct 22‐Oct 23‐Oct 24‐Oct 25‐Oct 26‐Oct 27‐Oct 28‐Oct
Stage Re
lativ
e to Drawdo
wn Orifice (m
)
Date

www.bae.ncsu.edu/stormwater
Bingham Water Level
‐0.4
‐0.35
‐0.3
‐0.25
‐0.2
‐0.15
‐0.1
‐0.05
018‐Oct 19‐Oct 20‐Oct 21‐Oct 22‐Oct 23‐Oct 24‐Oct 25‐Oct 26‐Oct 27‐Oct 28‐Oct
Stage Re
lativ
e to Drawdo
wn Orifice (m
)
Date

www.bae.ncsu.edu/stormwater
Bingham Water Level
y = ‐0.0134x + 557.12R² = 0.994
‐0.4
‐0.35
‐0.3
‐0.25
‐0.2
‐0.15
‐0.1
‐0.05
018‐Oct 19‐Oct 20‐Oct 21‐Oct 22‐Oct 23‐Oct 24‐Oct 25‐Oct 26‐Oct 27‐Oct 28‐Oct
Stage Re
lativ
e to Drawdo
wn Orifice (m
)
Date

www.bae.ncsu.edu/stormwater
Bingham Infiltration Rate (October)
0.013 m/day 0.56 mm/hrInfiltrated Volume = 390 m3
Surface Area of pond = 1212 m2
Number of Days = 310.010 m/day 0.43 mm/hr
Evaporation = 6.3 cmNumber of days = 31 days
0.002 m/day 0.09 mm/hr

www.bae.ncsu.edu/stormwater
Raeford Water Level
y = ‐0.0138x + 571.72R² = 0.9914
‐0.6
‐0.5
‐0.4
‐0.3
‐0.2
‐0.1
017‐Oct 19‐Oct 21‐Oct 23‐Oct 25‐Oct 27‐Oct 29‐Oct 31‐Oct 2‐Nov 4‐Nov
Water Level (m
)
Date

www.bae.ncsu.edu/stormwater
Median Nutrient Concentrations ‐ Raeford
0
0.2
0.4
0.6
0.8
1
1.2
1.4
TKN NO3+NO2 TN TAN OP TP
Med
ian Nutrie
nt Con
centratio
ns (m
g/L)
Influent Effluent
0
5
10
15
20
25
30
35
40
45
50
TSS
n=11n=9

www.bae.ncsu.edu/stormwater
Median Nutrient Concentrations ‐ Bingham
0
0.1
0.2
0.3
0.4
0.5
0.6
0.7
0.8
TKN NO3+NO2 TN TAN OP TP
Med
ian Nutrie
nt Con
centratio
ns (m
g/L)
Influent Effluent
0
5
10
15
20
25
30
35
40
45
50
TSS
n=20n=17

www.bae.ncsu.edu/stormwater
Median Concentration Reductions
‐20
0
20
40
60
80
100
TKN NO3+NO2 TN TAN OP TP TSS
Concentration Re
duction (%
)
Bingham Raeford
n=17n=9

www.bae.ncsu.edu/stormwater
Water Quality
www.bae.ncsu.edu/stormwater
Water Quality

www.bae.ncsu.edu/stormwater
Bingham WQ ConcentrationsMedian Values
VariableInlet
(mg/L)Outlet (mg/L)
Percent median conc. reduction (%)
TKN 0.55 0.55 -1NO2,3 0.19 0.05 71*TN 0.74 0.57 24
TAN 0.16 0.04 74*ON 0.42 0.54 -27*OP 0.008 0.003 65*PBP 0.049 0.051 -5TP 0.06 0.05 9*
TSS 44 12 74*(n=23 inlet, n=19 outlet, n=22 inlet TSS, n=18 outlet TSS)*Significant difference between inlet and outlet at α=0.05 sig level

www.bae.ncsu.edu/stormwater
Raeford WQ Concentrations
(n=20 inlet, n=16 outlet)*Significant difference between inlet and outlet at α=0.05 sig level
Median Values
VariableInlet
(mg/L)Outlet (mg/L)
Percent median conc. reduction (%)
TKN 1.00 0.72 28NO2,3 0.24 0.10 58*TN 1.26 0.79 37*
TAN 0.23 0.08 65*ON 0.74 0.63 15OP 0.064 0.027 58*PBP 0.12 0.10 15TP 0.23 0.13 42*
TSS 50 14 73*

www.bae.ncsu.edu/stormwater
0.00.10.20.30.40.50.60.70.80.9
TKN NOx TN TAN OP TP
Med
ian
Efflu
ent C
once
ntra
toin
s (m
g/L)
Bingham Raeford DOT Museum
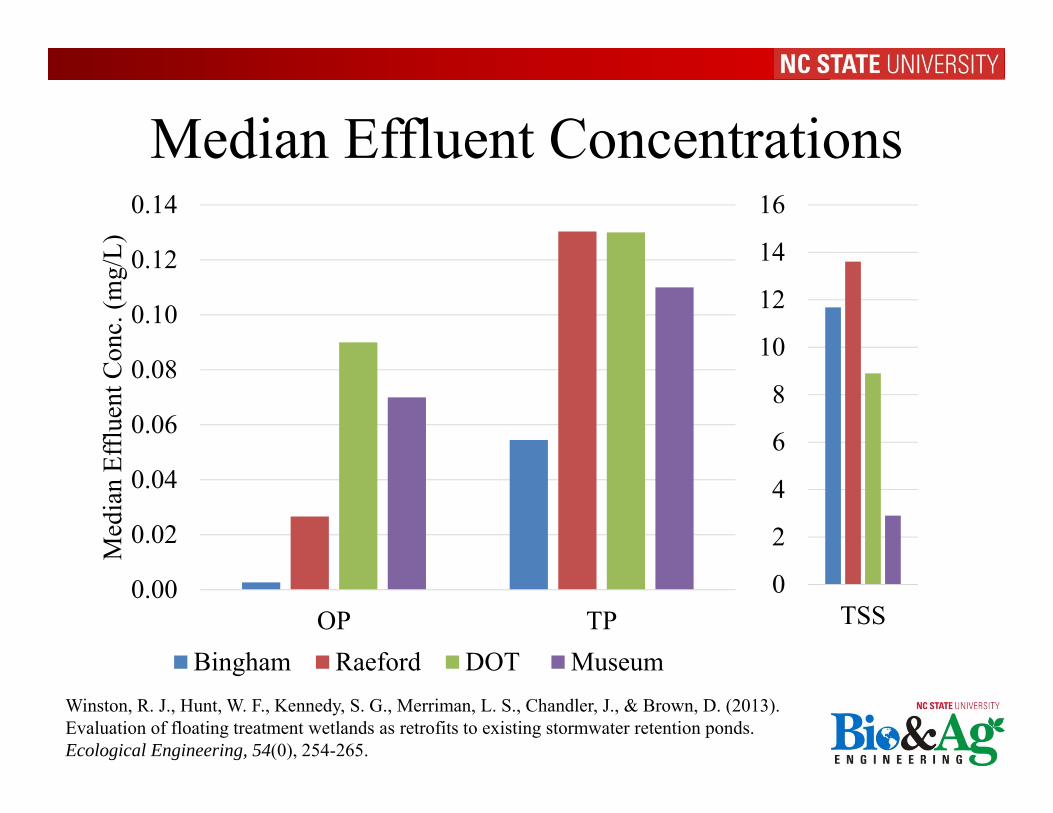
Median Effluent Concentrations
Winston, R. J., Hunt, W. F., Kennedy, S. G., Merriman, L. S., Chandler, J., & Brown, D. (2013). Evaluation of floating treatment wetlands as retrofits to existing stormwater retention ponds.Ecological Engineering, 54(0), 254-265.
0
5
10
15
20
25
30
TSS

www.bae.ncsu.edu/stormwater
Median Effluent Concentrations
Winston, R. J., Hunt, W. F., Kennedy, S. G., Merriman, L. S., Chandler, J., & Brown, D. (2013). Evaluation of floating treatment wetlands as retrofits to existing stormwater retention ponds.Ecological Engineering, 54(0), 254-265.
0.00.10.20.30.40.50.60.70.80.9
TKN NOx TN TAN
Med
ian
Efflu
ent C
onc.
(mg/
L)
Bingham Raeford DOT Museum
www.bae.ncsu.edu/stormwater
Median Effluent Concentrations
Winston, R. J., Hunt, W. F., Kennedy, S. G., Merriman, L. S., Chandler, J., & Brown, D. (2013). Evaluation of floating treatment wetlands as retrofits to existing stormwater retention ponds.Ecological Engineering, 54(0), 254-265.
0
2
4
6
8
10
12
14
16
TSS0.00
0.02
0.04
0.06
0.08
0.10
0.12
0.14
OP TP
Med
ian
Efflu
ent C
onc.
(mg/
L)
Bingham Raeford DOT Museum

www.bae.ncsu.edu/stormwater
Mean Effluent Concentrations
0.00.10.20.30.40.50.60.70.80.91.0
TKN TN TAN
Mea
n Ef
fluen
t Con
c. (m
g/L)
Bingham RaefordAnn McCrary Silver StreamEcho Farms Golf Course LakesideWaterford Runaway Bay
(Mallin et al., 2002) and (Wu et al., 1996)

www.bae.ncsu.edu/stormwater
Mean Effluent Concentrations
0.00
0.02
0.04
0.06
0.08
0.10
0.12
0.14
0.16
OP TP
Mea
n Ef
fluen
t Con
c. (m
g/L)
Bingham RaefordPond A Pond CAnn McCrary Silver StreamEcho Farms Golf Course LakesideWaterford Runaway Bay
05
101520253035404550
TSS
(Comings et al., 2000), (Mallin et al., 2002) and (Wu et al., 1996)

www.bae.ncsu.edu/stormwater
Bingham Load Reductions
Nutrients n=19, TSS n=17 -only the storms with both inflow and outflow sampled* Significant difference between inlet and outlet at α=0.05 sig level on a storm-by-storm basis
Variable∑ Inlet Loading
(kg)∑ Outlet Loading
(kg)Percent
Reduction (%)TKN 4.1 2.2 45*
NO2,3 1.1 0.4 68*TN 5.2 2.6 50*
TAN 1.1 0.3 70*ON 3.0 1.9 37*OP 0.05 0.02 62*PBP 0.5 0.2 60*TP 0.6 0.2 61*
TSS 451 66 85*
www.bae.ncsu.edu/stormwater
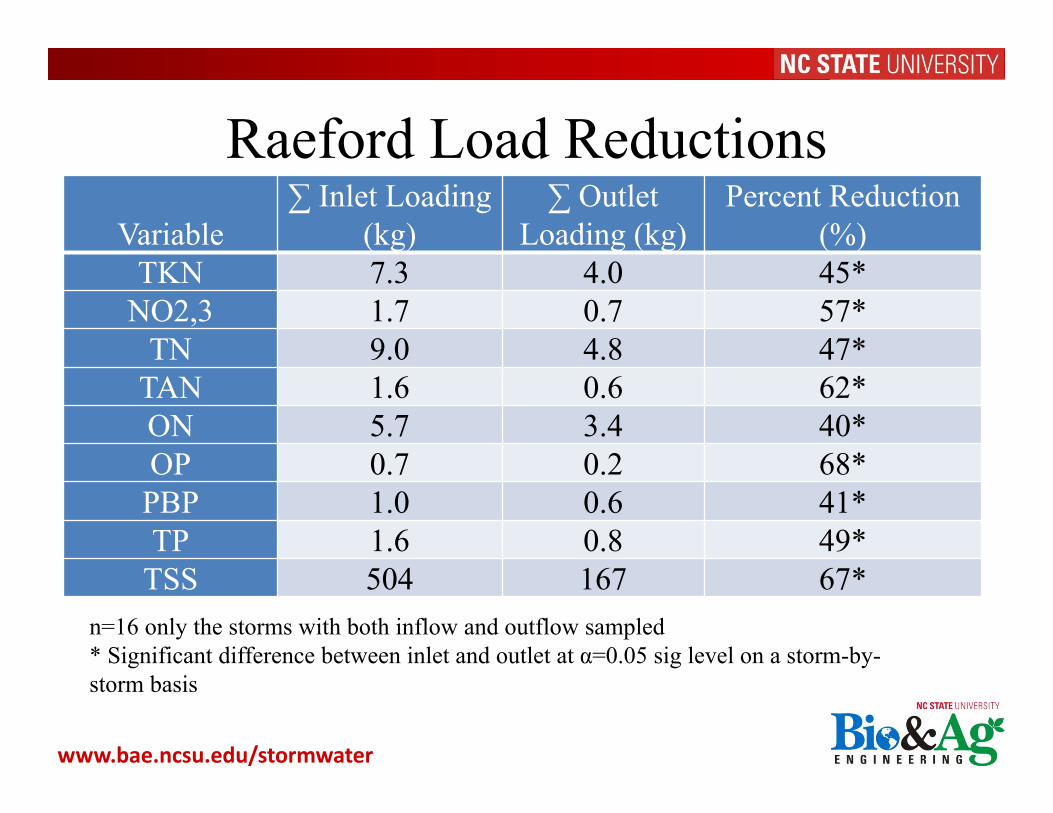
Raeford Load Reductions
n=16 only the storms with both inflow and outflow sampled* Significant difference between inlet and outlet at α=0.05 sig level on a storm-by-storm basis
Variable∑ Inlet Loading
(kg)∑ Outlet
Loading (kg)Percent Reduction
(%)TKN 7.3 4.0 45*
NO2,3 1.7 0.7 57*TN 9.0 4.8 47*
TAN 1.6 0.6 62*ON 5.7 3.4 40*OP 0.7 0.2 68*PBP 1.0 0.6 41*TP 1.6 0.8 49*
TSS 504 167 67*

www.bae.ncsu.edu/stormwater
Bingham Yearly Loadings
Variable
Annual Influent loading (kg/yr)
Annual Effluent loading (kg/yr)
Annual Influentloading
(kg/ha/yr)
Annual Effluent loading
(kg/ha/yr)
Percent Reduction
(%)
NC undeveloped*
(kg/ha/yr)TKN 11.1 4.8 4.7 2.0 57 5.3NO2,3 2.8 0.8 1.2 0.3 74 1.0TN 13.9 5.5 5.9 2.3 60 6.3
TAN 2.9 0.7 1.2 0.3 77 0.2ON 8.2 4.1 3.5 1.7 50 -OP 0.2 0.04 0.07 0.02 74 -TP 1.5 0.5 0.6 0.2 68 0.5
TSS 1109 141 469 60 87 349
*(Line & White, 2007)

www.bae.ncsu.edu/stormwater
Raeford Yearly Loadings
*(Line & White, 2007)
Variable
Annual Influent loading (kg/yr)
Annual Effluent loading (kg/yr)
Annual Influent loading
(kg/ha/yr)
Annual Effluent loading
(kg/ha/yr)
Percent Reduction
(%)
NC undeveloped*
(kg/ha/yr)TKN 14.5 7.9 7.5 4.1 46 5.3NO2,3 3.3 1.4 1.7 0.7 58 1.0TN 17.8 9.3 9.2 4.8 48 6.3
TAN 3.3 1.2 1.7 0.6 62 0.2ON 11.4 6.7 5.9 3.4 42 -OP 1.3 0.4 0.7 0.2 68 -TP 3.1 1.6 1.6 0.8 49 0.5
TSS 981 325 506 168 67 349
www.bae.ncsu.edu/stormwater
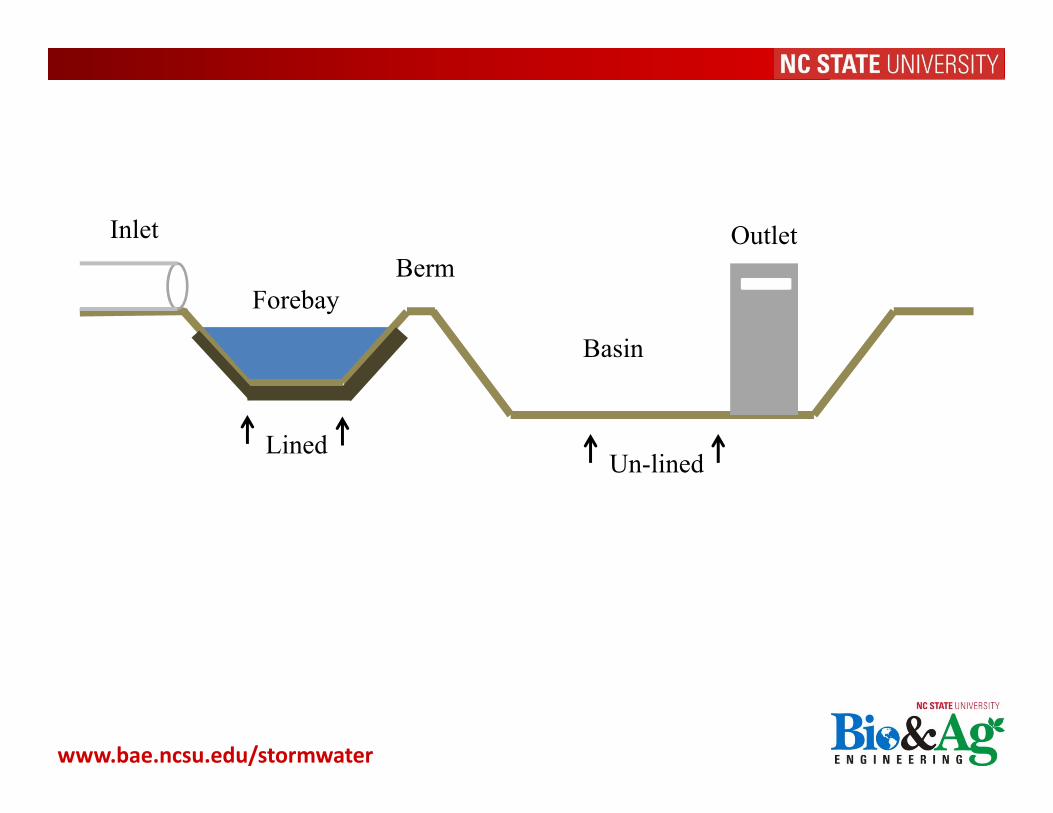
Inlet
Forebay
Basin
OutletBerm
LinedUn-lined

www.bae.ncsu.edu/stormwater
Inlet
Forebay Basin
OutletBerm
Restrict or Allow Infiltration
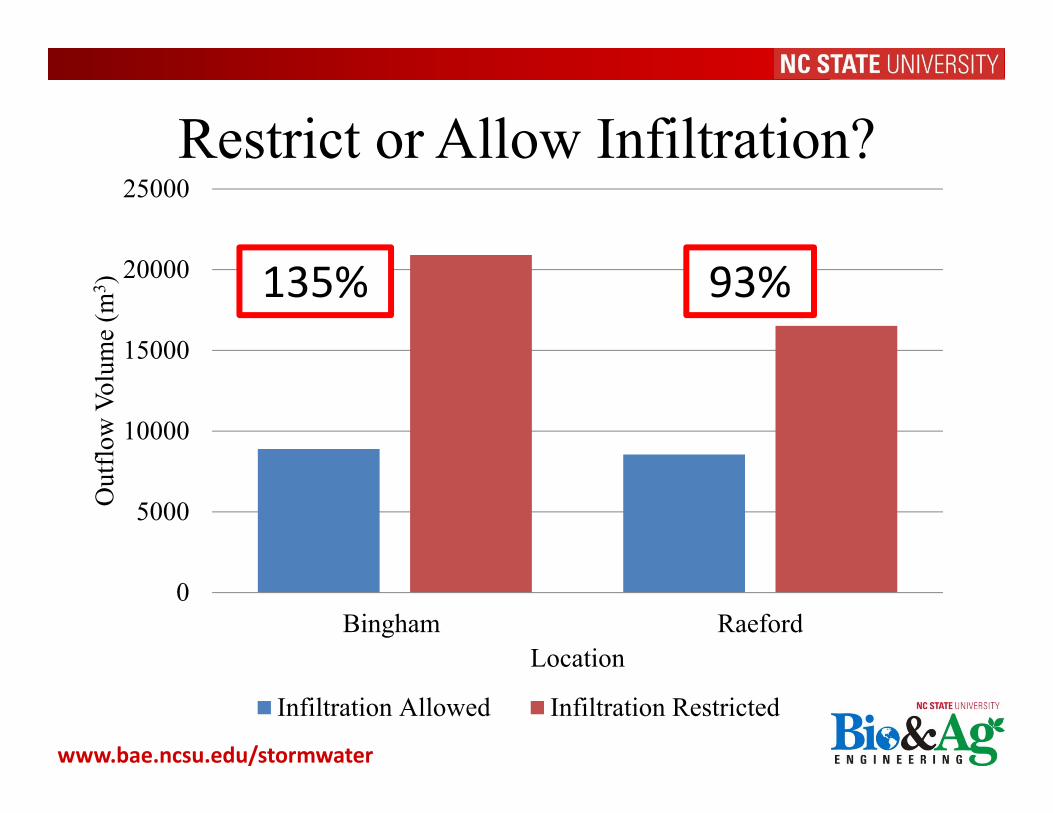
www.bae.ncsu.edu/stormwater
0
5000
10000
15000
20000
25000
Bingham Raeford
Out
flow
Vol
ume
(m3 )
Location
Infiltration Allowed Infiltration Restricted
Restrict or Allow Infiltration?
135% 93%

www.bae.ncsu.edu/stormwater
Inlet
Forebay
Basin
OutletBerm
LinedUn-lined
Research Implications
www.bae.ncsu.edu/stormwater
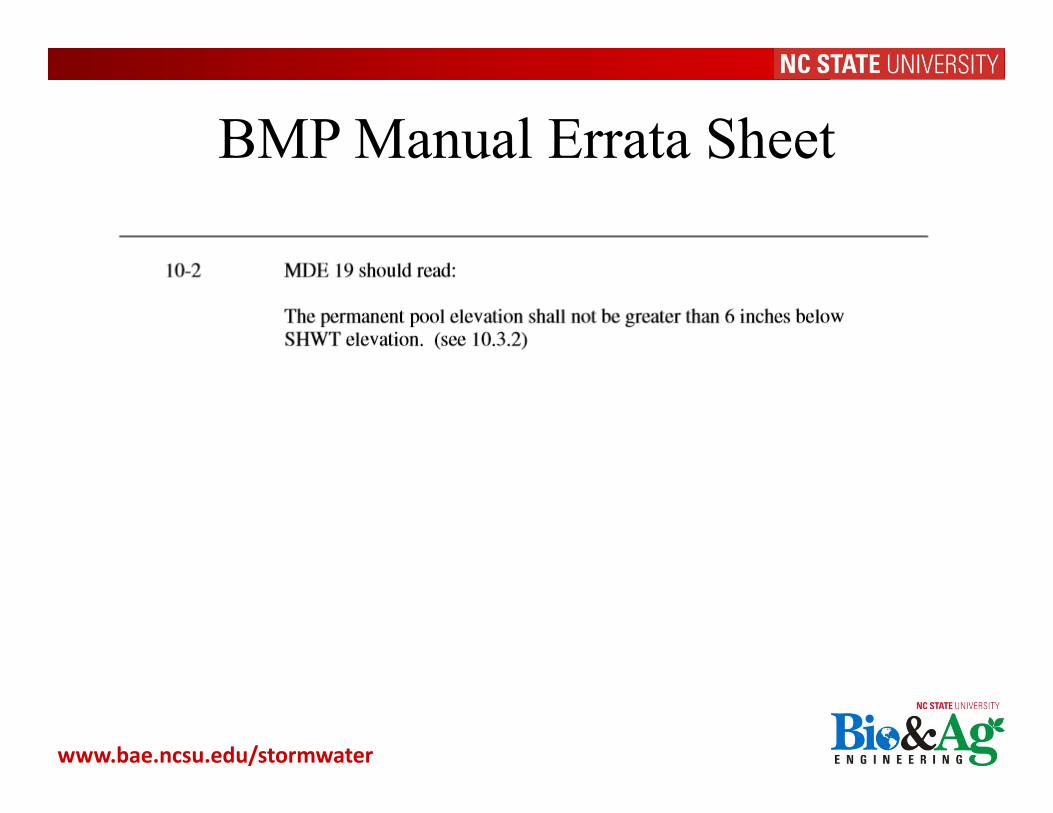
BMP Manual Errata Sheet

www.bae.ncsu.edu/stormwater
Plant Selection for Infiltrating Wet Ponds
http://greasebustersandsteam.com/Grease_Busters_%26_Steam_Inc/Coming_Soon.html
www.bae.ncsu.edu/stormwater
Conclusions• Substantial volume reductions when unlined
and located over hydrologic group A soils• Both ponds able to reduce peak flows from
small and large events • With both reduced EMCs and volume
reductions, nutrient and TSS loading were significantly reduced
• Effluent EMCs appear to be on par with other non-infiltrating wet ponds.

www.bae.ncsu.edu/stormwater
Next Steps• Complete one year of monitoring at each pond
• Statistical analysis• Design guidelines for purpose‐built infiltrating wet ponds
• Plant selection recommendations• Assign pollutant removal credits to infiltrating wet ponds

www.bae.ncsu.edu/stormwater
Acknowledgements
• Dr. Bill Hunt• Ryan Winston• Shawn Kennedy• City of Fayetteville (Giselle Rodriguez)• Home Builders Association of Fayetteville• Linda McKenzie and Jenny James, Center for
Applied Aquatic Ecology


![WELCOME [northcarolina.apwa.net]northcarolina.apwa.net/content/chapters/northcarolina...URETEK ICR Mid –Atlantic APWA-NC Hickory 2015 Joe Church, PE jchurch@uretekma.com 803.509.4439](https://static.fdocuments.in/doc/165x107/5f20b2d6ff589517972db821/welcome-uretek-icr-mid-aatlantic-apwa-nc-hickory-2015-joe-church-pe-jchurchuretekmacom.jpg)