Evaluating potassium phosphonate injections for the control of Quercus ilex decline in SW Spain:...
14
Evaluating potassium phosphonate injections for the control of Quercus ilex decline in SW Spain: implications of low soil contamination by Phytophthora cinnamomi and low soil water content on the effectiveness of treatments Alejandro Solla & Lorena García & Andrea Pérez & Ana Cordero & Elena Cubera & Gerardo Moreno Received: 17 March 2009 / Accepted: 5 July 2009 / Published online: 28 July 2009 # Springer Science & Business Media BV 2009 Abstract The Iberian forests are suffering severe disease and mortality as a result of decline, with Quercus ilex the major species at risk. Trunk injections with potassium phosphonate, which have been used successfully to control Phytophthora cinnamomi, were tested against decline. In an area in which P. cinnamomi was isolated, Q. ilex trees showing different degrees of decline were trunk- injected. Soil properties, and measurements of soil water content (θ) and depth to soil water table were assessed at three sites with markedly different decline incidences. Over the 5 years following the initiation of the experiment, mean symptoms among spring- treated trees and autumn-treated trees, or among trees injected twice a year (spring and autumn), once a year, and non-injected, were not significantly differ- ent. No effects of the treatments on shoot growth and acorn production were observed. However, θ values under trees which recovered from decline were higher than θ values under trees which did not recover from decline. At the site with the highest incidence of decline and tree mortality, P. cinnamomi was rarely isolated, and the presence of gravel, soil infiltration capacities and water table depth values were signif- icantly higher than at the other sites, water stress being more likely to contribute to decline than P. cinnamomi. In areas in which θ is low, the distribu- tion of phosphonate on the tree would be limited. Since the thresholds for phytotoxicity of potassium phosphonate in Q. ilex trees at the site studied would be higher than the amounts used, rates of the chemical slightly less than those that cause phytotoxicity should be tested. Keywords Oak decline . Phosphonic acid . Phytophthora cinnamomi . Potassium phosphonate . Quercus ilex . Soil water content Introduction Holm oak (Quercus ilex) is the main forest tree species in Spain, covering an area of more than 40,000 km 2 . This tree species has a critical function as a retardant to soil erosion and desertification, which is considered a primary environmental concern in the Mediterranean basin. Rangelands of scattered Q. ilex trees, locally known as ‘dehesas’, support an astounding diversity of plant and animal life, partly because isolated trees produce acorn crops (400–600 kg ha −1 yr −1 ) about ten times larger than their forest conspecifics (Pulido and Díaz 2005). A severe decline of Q. ilex has been observed since the 1990s in the southern Iberian Peninsula (Brasier Phytoparasitica (2009) 37:303–316 DOI 10.1007/s12600-009-0042-7 A. Solla (*) : L. García : A. Pérez : A. Cordero : E. Cubera : G. Moreno Ingeniería Técnica Forestal, Universidad de Extremadura, Avenida Virgen del Puerto 2, 10600 Plasencia, Spain e-mail: [email protected]
-
Upload
alejandro-solla -
Category
Documents
-
view
215 -
download
0
Transcript of Evaluating potassium phosphonate injections for the control of Quercus ilex decline in SW Spain:...

Evaluating potassium phosphonate injections for the controlof Quercus ilex decline in SW Spain: implications of lowsoil contamination by Phytophthora cinnamomi and lowsoil water content on the effectiveness of treatments
Alejandro Solla & Lorena García & Andrea Pérez &
Ana Cordero & Elena Cubera & Gerardo Moreno
Received: 17 March 2009 /Accepted: 5 July 2009 /Published online: 28 July 2009# Springer Science & Business Media BV 2009
Abstract The Iberian forests are suffering severedisease and mortality as a result of decline, withQuercus ilex the major species at risk. Trunkinjections with potassium phosphonate, which havebeen used successfully to control Phytophthoracinnamomi, were tested against decline. In an areain which P. cinnamomi was isolated, Q. ilex treesshowing different degrees of decline were trunk-injected. Soil properties, and measurements of soilwater content (θ) and depth to soil water table wereassessed at three sites with markedly different declineincidences. Over the 5 years following the initiationof the experiment, mean symptoms among spring-treated trees and autumn-treated trees, or among treesinjected twice a year (spring and autumn), once ayear, and non-injected, were not significantly differ-ent. No effects of the treatments on shoot growth andacorn production were observed. However, θ valuesunder trees which recovered from decline were higherthan θ values under trees which did not recover fromdecline. At the site with the highest incidence ofdecline and tree mortality, P. cinnamomi was rarelyisolated, and the presence of gravel, soil infiltrationcapacities and water table depth values were signif-
icantly higher than at the other sites, water stressbeing more likely to contribute to decline than P.cinnamomi. In areas in which θ is low, the distribu-tion of phosphonate on the tree would be limited.Since the thresholds for phytotoxicity of potassiumphosphonate in Q. ilex trees at the site studied wouldbe higher than the amounts used, rates of the chemicalslightly less than those that cause phytotoxicityshould be tested.
Keywords Oak decline . Phosphonic acid .
Phytophthora cinnamomi . Potassium phosphonate .
Quercus ilex . Soil water content
Introduction
Holm oak (Quercus ilex) is the main forest treespecies in Spain, covering an area of more than40,000 km2. This tree species has a critical function asa retardant to soil erosion and desertification, which isconsidered a primary environmental concern in theMediterranean basin. Rangelands of scattered Q. ilextrees, locally known as ‘dehesas’, support an astoundingdiversity of plant and animal life, partly because isolatedtrees produce acorn crops (400–600 kg ha−1 yr−1) aboutten times larger than their forest conspecifics (Pulidoand Díaz 2005).
A severe decline of Q. ilex has been observed sincethe 1990s in the southern Iberian Peninsula (Brasier
Phytoparasitica (2009) 37:303–316DOI 10.1007/s12600-009-0042-7
A. Solla (*) : L. García :A. Pérez :A. Cordero :E. Cubera :G. MorenoIngeniería Técnica Forestal, Universidad de Extremadura,Avenida Virgen del Puerto 2,10600 Plasencia, Spaine-mail: [email protected]

1992; Moreira et al. 2000; Moreira and Martins 2005)and more recently in France (Robin et al. 1998), Italy(Jung et al. 1996; Vettraino et al. 2002) and Morocco(F. Assali and K. Falca, unpublished). The typicalsymptoms of this phenomenon are (i) a slow declineof the trees showing necrotic leaves, defoliation, deadbranches and brown exudation of the trunk, or (ii) arapid decline followed by the death of the trees in afew weeks (Gallego et al. 1999). Under Iberianconditions, several factors possibly acting in synergyhave been proposed to explain the decline: water stressdue to severe droughts, soil degradation due to over-grazing, root damage due to deep plowing and fire, badpruning practices, insect pests (mainly Cerambyxspp.), and pathogens such as Biscogniauxia mediter-ranea, Brenneria quercina (Biosca et al. 2003),Pythium spiculum (Jiménez et al. 2008) and Phytoph-thora cinnamomi (Brasier 1996; Cubera et al. 2009;Gallego et al. 1999; Rodríguez-Molina et al. 2005;Romero et al. 2007; Sánchez et al. 2002). Among thecauses involved, P. cinnamomi has been proposed asthe major factor in Q. ilex decline and mortality, basedon the facts that the oomycete has been isolated fromthe soils and roots of a large number of declined trees(Brasier 1992; Brasier et al. 1993; Sánchez et al.2003, 2006; Tuset et al. 1996) and that pathogenicitytests on Q. ilex plants with P. cinnamomi satisfiedKoch’s postulates (Gallego et al. 1999; Robin et al.1998; Romero et al. 2007). In Central and EasternEuropean countries, strong associations between thepresence of several Phytophthora species and mortal-ity and decline of other oak species were found (Balciand Halmschlager 2003; Jung et al. 1996, 2000).
At present, no direct control measures have beenreported to assist in the recovery of Q. ilex trees fromdecline, with the exception of trunk injection ofpotassium phosphonate (Fernández-Escobar et al.1999). Phosphonates are fully systemic fungicides,i.e., being xylem- and phloem-translocated, with bothdownward and upward movement in the host. Theprecise mode of action of phosphonates is unknown(Guest and Grant 1991; Guest et al. 1995), but it isbelieved that they cause fungistasis and a stimulationof the defense mechanisms of the fine roots, leadingto an increase of the fine root system vigor, followedby the recovery of the crown condition. Trunkinjections do not require special equipment or highlabor costs, and for these reasons injections ofpotassium phosphonate are being extensively com-
mercialized and used in south–central Spain againstoak decline. However, recent observations on treatedtrees have reported a lack of effectiveness of thepotassium phosphonate injections (Porras et al. 2007;Tuset and Sánchez 2004). In south–west Spain, in 10out of 11 treated and declined Q. ilex stands, trees didnot recover significantly in comparison with thecontrols (Porras et al. 2007). Scientific support ofthe efficiency of injections under natural conditions islacking. The main purpose of the present work was toevaluate under field conditions, over a 5-year period,the effectiveness of potassium phosphonate treatmentsfor the control of Q. ilex decline. The followingquestions were addressed: (i) at which stage of treedecline are treatments more effective?, (ii) duringwhich phenological period (spring, autumn, or bothspring and autumn) is it better to treat trees?, and (iii)how do the soil properties, soil water content, and soilwater table depth affect the effectiveness of thetreatments? Finally, we examined the effect ofpotassium phosphonate treatments on tree growthand acorn production.
Materials and methods
Study area
The experiment was carried out at Dehesa de SantaAmalia (39°44′N, 5°59′W), 5 km south–east ofTorrejón el Rubio (Extremadura, W Spain). This Q.ilex open woodland is approximately 360 m a.s.l., andoccupies ~800 ha. The climate is Mediterranean witha mean annual rainfall of 597 mm which falls mainlyfrom October to May (climatic data from the nearbymeteorological station, Cáceres, 39°28′N, 6°20′W;405 m a.s.l.). Mean minimum and maximum temper-atures occur during January (3.4°C) and July (35.5°C),respectively. Soils are mainly chromic Luvisols (FAO)developed over tertiary sediments with abundantquartzite gravels. The dominant tree species is Q. ilex(15–20 trees per ha), although Q. suber and Pyrusbourgaeana are also present (<1 tree per ha), and themain understorey plant species are Cistus ladaniferand Lavandula stoechas. Current land-uses are exten-sive grazing by cows and sheep, and hunting.
A severe mortality of Q. ilex trees has beenobserved in Dehesa de Santa Amalia since 1997,and due to positive isolations of P. cinnamomi by the
304 Phytoparasitica (2009) 37:303–316

regional sanitary services (Junta de Extremadura) andthe absence of other pests or pathogens involved in thedecline, the owners were told to inject their trees withpotassium phosphonate as the only solution available.Therefore, the study area appeared suitable to test theefficacy of potassium phosphonate to control Q. ilexdecline. The efficiency of potassium phosphonateinjections was studied at two levels: (i) within anextensive area, in which disease symptoms, shootgrowth and acorn production of treated trees wereevaluated, and (ii) within a reduced area (sites 1, 2 and3, Fig. 1), where under treated trees, pathogen isolationand quantification, and soil physical properties wererecorded; and soil water table depth, soil infiltration,and soil water content measurements were performed.
Plant material and treatments
Four hundred Q. ilex trees were preselected within anextensive area of 67 ha affected by decline. Treeswere 120–140 years old, 8 m high, 35–55 cm in trunkdiameter at breast height, and with crown diameters of9–16 m. In April 2002, trees were first ratedaccording to the following decline categories(Fernández-Escobar et al. 1999): 0 = healthy trees(crown transparency ≤5%); 1 = trees showing fewdecline symptoms, i.e., necrotic leaves, defoliationand dead branches (crown transparency 6–20%); 2 =trees showing moderate symptoms (21–40%); 3 =
trees showing pronounced symptoms, indicating anadvanced stage of decline (41–60%); and 4 = veryadvanced decline (>60%). After this first rating, 48trees per decline category were labeled and selectedfor the experiment (N=240), rejecting those whichclearly differed in trunk diameter or crown size fromthe average.
Each group of 48 trees was divided into foursubgroups (n=12): (i) untreated control; (ii) treestreated in spring (April); (iii) trees treated in autumn(October); and (iv) trees treated in both spring andautumn (April and October). Treatment timing wasdesigned according to the assumption that duringautumn and spring maximum infections of Q. ilexroots by P. cinnamomi occur (Rodríguez-Molina et al.2005). Treatments consisted of trunk injections of28 g l−1 of potassium phosphonate, i.e., phosphonicacid neutralized with potassium hydroxide to pH 5.5(2.8% H3PO3 and 2.5 KOH, w/v). The injectiontreatments were carried out with Fertinyect® capsules(Fertinyect SL, Córdoba, Spain) following Fernández-Escobar et al. (1999). The method consisted of apressurized capsule containing 225 ml of the solutionto be injected, which was connected to a plasticinjector that was inserted into a drilled hole, 4.5 cmdeep and 6 mm in diameter. Injections were done atthe base of the trunk, 20–25 cm above the soilsurface, and the capsules were placed ~30 cm fromeach other. Each treated tree received three to five
Fig. 1 Orthoimage of the Dehesa de Santa Amalia, Cáceres,Spain. Within the three sites studied intensively, white circlesindicate healthy Quercus ilex trees or trees showing few declinesymptoms (score 1); half-filled circles indicate trees showingmoderate symptoms of decline (score 2); and black circles
indicate trees showing pronounced symptoms of decline ordead trees (scores 3–5). White squares indicate location andnumeration of piezometers used for water table measurements,black triangles indicate location of TDR-probes, and thediscontinuous line indicates the course of a stream
Phytoparasitica (2009) 37:303–316 305

simultaneous injections, depending on the size of thetree. The capsules were left on the tree until completeuptake of the solution, which usually occurred withinthe first 2 h. Treatments were carried out during 2002and 2003. Trees belonging to groups (ii) and (iii) wereinjected once a year, in April and October, respec-tively, and trees belonging to group (iv) were injectedtwice a year, in April (spring) and October (autumn).Treatments were arranged in a randomized designwithin the five decline categories described.
Symptom evaluation, tree growth and acornproduction
The results were evaluated by measuring the healthcondition of the 240 trees on the decline scaledescribed previously. Within this scale, the category5 = dead tree was also added. Tree condition wasevaluated nine times (every 3 months) between April2002 and April 2004, and a tenth assessment wasdone in April 2007. This last assessment was used togroup the trees into (i) those that had improved inhealth following the treatments, and (ii) those thatdeclined in health following the treatments. Vegeta-tive growth was determined in November 2002 and2003 by measuring shoot lengths of the currentseason of all trees of the experiment (N=240).Measurements were carried out on four terminalshoots per tree, located on the north, south, east andwest sides of the tree, at approximately 2.5 m height.In a previous experiment, when measuring four or 12terminal shoots of the same tree, no significantdifferences in average shoot length were found (P>0.05). Acorn production was estimated in November2002 and 2003 by counting the number of acorns onfour branches approximately 1 m long and 2 m aboveground on the north, south, east and west sides of thetree (N=240). Similarly, when counting the acorns onfour or 12 branches of the same tree, no significantdifferences in acorn production were found (P>0.10).
Pathogen isolation and quantification
In November 2002, soil and root samples were takenfrom a reduced area comprising three sites withmarkedly different oak decline incidences (Fig. 1).These sites were selected because they were approx-imately in the middle of the extensively studied area,and because site 1 was crossed laterally by a perennial
stream (Fig. 1). Flooding has been reported to beparticularly favorable for infections of P. cinnamomion Q. ilex roots (Sánchez et al. 2002, 2005; Tuset andSánchez 2004). At the time of sample removal, sites1, 2 and 3 had 2, 5 and 0 dead trees, respectively, andan average tree rating of 2.2, 4.8 and 0.1, respectively.Soil and root samples were taken under three trees persite, rated in November 2002 as 1 or 2. Approxi-mately 300 ml of soil and ~20 necrotic roots per treewere sampled at distances of 2 m from the north sideof the trunks, at a depth of 30 cm. The presence of P.cinnamomi was assessed in soil suspensions in deion-ized water, baited by floating 15–20 small pieces (2×2mm) of young Eucalyptus camaldulensis leaves underlaboratory conditions (20°C and diffuse daylight).After 3 days of incubation, baits were removed,washed, surface-sterilized (60 s in 1% aqueous sodiumhypochlorite) and blotted dry. Baits were then trans-ferred to nistatin–ampicillin–rifampicin–pentachloroni-trobenzene–hymexazol cornmeal agar (NARPH)selective medium. NARPH is a modified medium ofPARPH (Jeffers and Martin 1986), in which pimaricinis exchanged for nistatin at the same concentration, andhymexazol is obtained from Tachigaren® LS (Comer-cial Química Massó SA, Barcelona). Isolation was alsoattempted from root samples. Roots were cut into 1 cmsegments, surface-sterilized (2 min in 1% aqueoussodium hypochlorite), rinsed with sterile water, blotteddry and plated onto the selective medium. All plateswere incubated at 24°C in the dark, and after 2–3 days,selected isolates were transferred to carrot agar (CA)medium. Identification of the colonies isolated fromroots and soil was carried out by microscopicobservations from cultures incubated on CA mediumat 24°C in the dark for 4–6 days. Distinctive structures,such as clustered hyphal swellings for P. cinnamomi(Erwin and Ribeiro 1996) and oospore ornamentationfor Py. spiculum (Paul et al. 2006) were observed aftertransfer to a glass microscope slide and staining withacid fuchsin in lactophenol.
In March 2005 and in November 2008, soil androot sampling from the same three trees per site wasrepeated. In addition, quantification of P. cinnamomiand Py. spiculum colonies per g of soil was assessedfollowing Romero et al. (2007). Erlenmeyer flaskscontaining 200 ml of distilled water and 0.4 g of agar(Scharlau Chemie SA, Barcelona, Spain) were shakenand sterilized, and 10 g of a sieved (2 mm porediameter) soil sample were introduced. Soil samples
306 Phytoparasitica (2009) 37:303–316

were obtained from sites 1, 2 and 3, and only oneflask per site was used. After shaking, 1 ml aliquotswere taken from the soil–water agar mix, and platedon petri dishes containing 20 ml of NARPH medium.This dilution was shown to produce a countablenumber of P. cinnamomi and Py. spiculum coloniesfrom soil samples of declining oaks, varying between4 and 49, and 3 and 110 propagules per g soil,respectively (Romero et al. 2007). Forty plates perflask was used; thus 2 g of soil per site was screened.After 1 day of incubation at 24°C in the dark, the agarsurface of each plate was washed with sterile water,removing the soil–water agar mix. The plates weresealed with parafilm, and after 2 days of incubation at24°C in the dark, the number of P. cinnamomi and Py.spiculum colonies were identified under a dissectingmicroscope and counted (Romero et al. 2007). Thenumber of colonies was referred to grams of soil.
Soil water table depth measurements
Variation of the soil water table depths of sites 1–3was assessed through piezometers installed perpen-dicularly to the stream (Fig. 1). Eight pierced PVCtubes (5 cm diam, 120 cm length) were used aspiezometers, and tubes I and V had the lowest andhighest elevation, respectively (Fig. 2a). Piezometerswere inserted to a depth of 1.2 m after soil drilling.Soil was drilled with a stainless steel soil columncylinder with a cutting shoe and a removable cover(10 cm diam, 1 m length; Eijkelkamp; http://www.eijkelkamp.com/Portals/2/Eijkelkamp/Files/P1-21e.pdf), plus a 1-m extension rod, which were insertedinto the soil with a heavy electric-powered percussionhammer (Makita HM1800). To avoid obstruction, theupper part of each tube was covered. The water tabledepth was obtained by inserting a 1.2 m bamboo caneinside each tube and, after removal, by measuring thedry length portion. Measurements were taken month-ly, from January 2003 to April 2004.
Soil sampling for physical properties
The extracted soil cores taken from where thepiezometers were installed, were used to determinesome physical properties of soil. Soil cores from tubesI–II (site 1), IV–V (site 2), and VII–VIII (site 3) wereused, with approximately 10 l of soil sampled perpiezometer. To assess soil bulk density, soil cores
were cut and weighed every 10 cm, and 0.2 l aliquotswere taken for dry soil-weight determination. Forevery 10 cm depth, the percentage of soil gravel wasobtained by dividing the coarse earth fraction (par-ticles ≥2 mm diam) by the fine earth fraction (<2 mmdiam), and soil texture (sand, silt and clay contents)was determined through the pipette method (Gee andBauder 1986). This method consists of completelydispersing a soil sample in water, and passing itthrough a set of sieves to separate out the sandfractions. A sedimentation procedure is then used toascertain the quantities of silt and clay that had passedthrough the sieves. Because soil particles are moredense than water, they tend to sink, settling at avelocity that is proportional to their size. In the fineearth fraction, 72 determinations were conducted foreach parameter.
VIIIVIIVIVIV
III
III
372
374
376
378
380
382
0 50 100 150 200 250
Distance to stream (m)
Ele
vatio
n (m
a.s
.l.)
Site 1
Site 2
Site 3
(a)
-1,4
-1,2
-1,0
-0,8
-0,6
-0,4
-0,2
0,0
Wat
er ta
ble
dept
h (m
)
Jan 03April 03July 03Oct 03Jan 04April 04
(b)
Fig. 2 Elevation of piezometric tubes, and water table depthmeasurements at sites 1–3 (see Fig. 1). a Roman numerals referto tubes installed at sites 1, 2 and 3, with Quercus ilex treesshowing intermediate, very advanced and little decline, respec-tively. b Water table depth values obtained from January 2003to April 2004. Dotted vertical bars indicate separation amongsites
Phytoparasitica (2009) 37:303–316 307

Soil infiltration measurements
To measure the soil infiltration capacities at sites 1–3,the double-ring infiltrometer test was used (Bower1986). Briefly, this test consists of driving twoconcentric open cylinders into the ground (~30 cm),partially filling the rings with water, and thenmaintaining the water at a constant level while thewater in the rings infiltrates into the soil. The supportarea for each infiltration measurement was the area ofthe inner ring in the double-ring apparatus, which hada diameter of 30 cm. The volume of water added tothe inner ring, to maintain the water level constant, isthe volume of water that infiltrates the soil. In April2003, three tests per site and some 14 measurementsper test were conducted. Each test lasted approxi-mately 2–3 h. Before testing, the average watercontents (gravimetric measurement, 0–10 cm depth)of soils at sites 1, 2 and 3 were 12.2%, 13.6% and9.2%, respectively. The most widely used empiricalmodel to describe infiltration is the Horton modelgiven by fp = fc + (f0−fc) e−kt (Chin 2008), where fp isthe infiltration rate under ponded conditions, alsocalled the infiltration capacity; f0 is the initial(maximum) infiltration capacity; fc is the asymptotic(minimum) infiltration capacity (t→∞); and k is thedecay constant.
Soil water content measurements
Soil water content (θ) was measured on sites 1 and 3under Q. ilex trees showing different decline con-ditions. Three declining trees from site 1 and threehealthy trees from site 3 (mean scores of 3.7 and 0.3,respectively) were used (Fig. 1). For each tree, θ wasmeasured at 2 m from the north side of the tree trunkand at 40 and 80 cm depths by Time DomainReflectometry (TDR) (Tektronic model 1502 C).TDR-probes were constructed manually according toCubera and Moreno (2007). Each probe was com-prised of two 20 cm long stainless steel parallel rods,sharpened at the tip to facilitate their introduction intothe soil. Rod diameter was 0.6 cm and the separationbetween their axes was 3 cm. One rod was connectedto a conductor of a low ohm-resistance coaxial cableand the other was connected to the mesh of the cable.All connections were coated with an epoxy resin(Stuers kit EPOFIX®) which acted as an electricalinsulator, and held the rods firmly in a parallel
position. Soil was drilled as described previously,and for each tree a first probe was placed verticallyand buried at 80 cm depth in the undisturbed soil, andthen a second probe was placed vertically and buriedat 40 cm depth. Efforts were made to ensuremaximum contact between the rods and the soil.Coaxial cables 100 and 60 cm long were connected tothe first and second probes, respectively. The upper20 cm lengths of the cables were left unburied, andtheir endings striped to allow connection with theTDR. A calibration curve of the TDR-probes wasdone in the laboratory with soil samples collectedfrom the studied area. Monthly measurements of θstarted in January 2003 and finished in January 2004.
Additional TDR-probes were installed under po-tassium phosphonate-treated trees, in order to checkthe possible influence of θ on the recovery of treatedtrees. Six Q. ilex trees, rated in April 2002 as 3 (firstrating), were used. Trees belonged to subgroup (iv)that had been treated in autumn and in spring. In April2004, trees were grouped into ‘better than beforetreatments’ and ‘equal or worse than before treat-ments’ (recovery tendency). TDR-probes were in-stalled at 40- and 80-cm depths as describedpreviously, and θ was measured monthly fromJanuary 2003 to January 2004.
Data analysis
To evaluate the effect of potassium phosphonateinjections on Q. ilex growth and fruit production,multifactorial ANOVAs were performed considering‘shoot growth’ and ‘acorn production’ as dependentvariables, ‘injection treatments’, ‘first score’ and‘branch orientation’ as factors, and ‘tree diameter’ ascovariate. The Horton infiltration model (fp = fc +(f0−fc) e−kt) was fitted to each individual double-ringtest by finding the Horton parameters (f0; fc; k) thatprovide the best fit (least squares) between themeasured infiltration capacity (fp, cm h−1) versus time(t, h) and the model. To analyze soil properties amongsites, several unifactorial ANOVAs were performedconsidering ‘soil bulk density’, ‘gravel content’, ‘sandcontent’, ‘silt content’, ‘clay content’, ‘f0’, ‘fc’ and ‘k’as dependent variables, and ‘site’ as a factor. LSDtests were used to compare average values (P<0.05).
Scores of tree condition and θ values were trans-formed using the arcsine of the square root to obtainnormality. To evaluate the effect of potassium
308 Phytoparasitica (2009) 37:303–316

phosphonate injections on tree condition, repeated-measure ANCOVAs were performed using ‘trans-formed scores of tree condition’ at different dates asdependent variable (repeated-measure), ‘first score’and ‘injection treatments’ as independent variables,and ‘tree diameter’ as covariate. To evaluate the effectof θ on tree condition, repeated-measure ANCOVAswere performed using ‘θ’ at different dates asdependent variable, ‘first score’ as independentvariable, and ‘tree diameter’ as covariate. Finally, toevaluate the effect of θ on the recovery of treatedtrees, repeated-measure ANCOVAs were performedusing ‘θ’ as dependent variable, ‘recovery tendency’as independent variable, ‘tree diameter’ as covariate,and ‘date’ as repeated-measure. For all analyses, theSTATISTICA (StatSoft Inc., Tulsa, OK, USA) v.5program was used.
Results
Isolation and quantification of Phytophthoracinnamomi
In November 2002, P. cinnamomi was successfullyisolated under seven Q. ilex trees, from three, four andone soil samples of sites 1–3, respectively. From rootsamples, only one tree from site 1 showed two positiveisolations of P. cinnamomi. Colonies of Pythium spp.were isolated from rotten roots of trees located at sites1 and 3. In March 2005, P. cinnamomi was isolatedfrom soil under only two trees at site 1, where a densityof seven colonies per g of soil was estimated. InNovember 2008, P. cinnamomi was isolated from soilunder five trees (sites 1–3), and from rotten roots oftwo trees (sites 1 and 2). At this time, nine colonies ofP. cinnamomi per g of soil and 14 colonies of Py.spiculum per g of soil were obtained.
Development of visual symptoms
Over the 5 years following the first treatments, notoxicity due to potassium phosphonate was observed.The treatments had no beneficial effect on treesinitially scored as 0, 1, or 3 (Fig. 3a, b, d). Over thesame period, trees initially scored as 2 and injected inboth spring and autumn showed higher declinesymptoms than untreated control trees (P<0.05;Fig. 3c). Trees initially scored as 4 and injected in
a
a
(a)
0
1
2
3
4
Tre
e sc
ore
a
a
(b)
0
1
2
3
4
Tre
e s
core
ab
(c)
aba
b
0
1
2
3
4
Tre
e sc
ore
(d)
aa
0
1
2
3
4T
ree
scor
e
a
b
a
(e)
ab
1
2
3
4
5
Apr
il 02
July
02
Oct
02
Jan
03
Ap
ril 0
3
July
03
Oct
03
Jan
04
Apr
il 04
Apr
il 07
Tree
sco
re
Fig. 3 Symptom development of Quercus ilex trees treatedwith potassium phosphonate injections. Trees were groupedinitially according to a 0 = healthy trees, b 1 = trees showingfew decline symptoms, c 2 = trees showing moderatesymptoms, d 3 = trees showing pronounced symptoms,indicating an advanced stage of decline, and e 4 = veryadvanced decline. Trees were injected in spring (□), autumn(Δ), spring and autumn (■), or left untreated (○) (N=12).Arrows indicate treatment dates, and different letters alongright-hand y axis indicate significant differences among treat-ments at P<0.05
Phytoparasitica (2009) 37:303–316 309

autumn showed higher decline symptoms than controltrees (P<0.05; Fig. 3e). If the 240 trees are analyzedtogether, irrespective of their first score, symptoms inApril 2007 among spring-treated trees and autumn-treated trees, or among trees injected twice a year,once a year, and non-injected, were not significantlydifferent (P>0.10; data not shown).
By the end of the experiment, ~40% of theuntreated control trees and ~50% of the trees injectedwith potassium phosphonate in spring had improvedin health (Table 1). Injections in autumn andinjections in spring and autumn resulted in no treeimprovement compared with the control. A number oftrees declined in health by the end of the experiment,especially those injected in both spring and autumn.Five years after the first treatments, 10% of thecontrol trees had died (Table 1).
Effect of treatments on tree growth and acornproduction
In the first year of the experiment, trees injected inboth spring and autumn showed a significantly greatershoot growth than control trees (P<0.05; Table 2). Inthe second year, no effect of the treatments onvegetative growth was observed (Table 2). In both2002 and 2003, average growth of branches orientedto the south was greater than the average growth ofbranches oriented to the north, east and west (5.4,4.3, 4.8, 4.7 and 5.0, 3.7, 3.9, 4.2 cm yr−1, respec-tively; P<0.05). No differences in acorn productionwere observed when control and injected trees werecompared (Table 3). During both 2002 and 2003,trees scored as 4 showed less acorn production andshoot growth than healthy and low-symptomatic trees(Tables 2 and 3). In both years, average acorn
production of branches oriented to the south washigher than that of branches oriented to the north, eastand west (6.7, 4.1, 5.9, 4.1 and 9.0, 4.2, 5.7, 5.7acorns per branch, respectively; P<0.05).
Soil measurements
Mean soil bulk density at site 3 was significantly (P<0.001) higher than mean soil bulk densities at sites 1and 2 (Table 4). Site 2, at which the highest declineincidence and tree mortality was observed, had ahigher (P<0.05) percentage of gravel than sites 1 and3. The particle size of soil also varied significantly (P<0.05) among sites, although the percentages of claywere similar at all sites (Table 4). Soils at site 2 showedhigher maximum and minimum infiltration capacitiesthan soils at sites 1 and 3 (P<0.05, Table 4).
In January 2003, the water table was near the soilsurface in tubes II and VII (sites 1 and 3, respectively;Fig. 2), and only in these tubes was the water tableobserved within the top 0.2 m depth during 1 and2 months, respectively. Water table depths observedduring February and March (data not shown) wereintermediate to water table depths observed in Januaryand April 2003 (Fig. 2b). From April 2003 to April2004, the water table level of site 2 was generallybelow the maximum depth of the tubes, although thissituation occurred only from August 2003 to Novem-ber 2003 at sites 1 and 3.
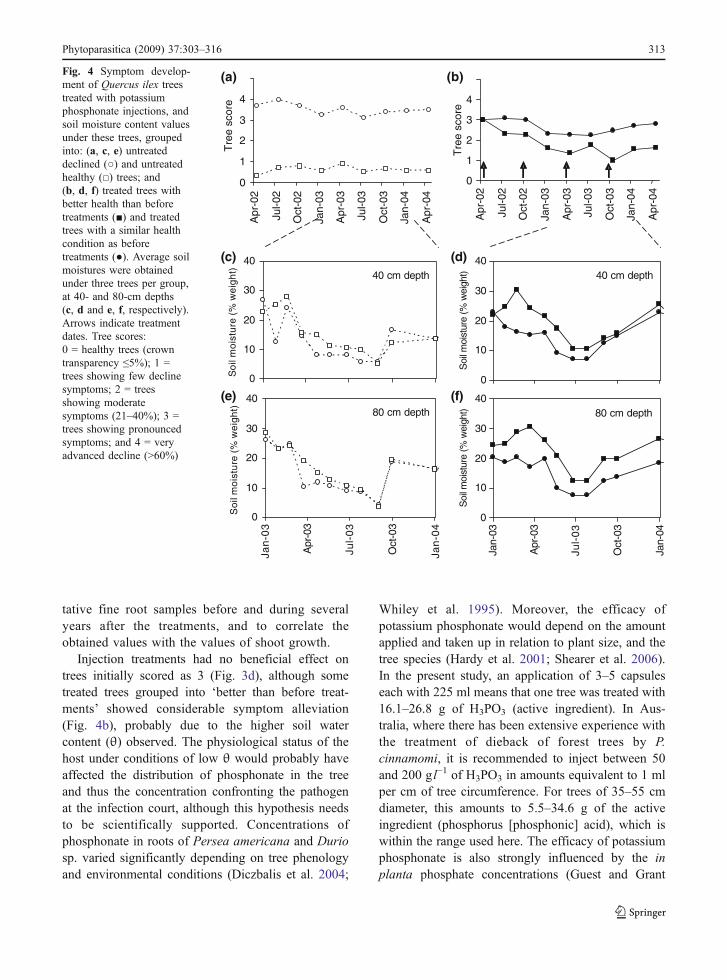
Repeated-measure ANCOVAs showed significantdifferences of θ under trees with different declineratings (Fig. 4a, c, e), at 40- and 80-cm depths (P=0.01 and P=0.04, respectively). In the same way,analysis performed with θ values measured underinjected trees with different rates of recovery fromdecline (Fig. 4b,d,f) showed that θ values under trees
Table 1 Effect of potassium phosphonate injection treatments (60 trees per treatment) on Quercus ilex trees, by comparing tree healthratings of April 2002 and April 2007
Injection treatments Trees better than before treatments Trees worse than before treatments Dead trees
(n) (%) (n) (%) (n)
Control 26 42.5 18 30.0 6
Spring 31 51.3 11 17.9 3
Autumn 19 31.6 17 28.9 8
Spring and autumn 17 28.2 23 38.5 11
310 Phytoparasitica (2009) 37:303–316

which recovered from decline were higher than the θvalues under trees which did not recover from decline,at both the 40- and 80-cm depths (P<0.001).
Discussion
Trunk injections of potassium phosphonate were notfound to alleviate symptoms of decline in Q. ilex
trees, confirming previous observations (Porras et al.2007; Tuset and Sánchez 2004). Trees initiallyshowing moderate decline symptoms continued todecline after injections in both spring and autumn.Although injections in spring resulted in a higherpercentage of trees improving in health and in fewerdead trees in comparison with the control trees, thebenefits were not significant for any category of treedecline. Trunk injection with phosphonates is partic-
Table 3 Acorn production (fruits per branch) of Quercus ilex trees treated with potassium phosphonate injections
Injection treatments Yr Tree scorea before treatments Averageb
0 1 2 3 4 (N=60)
Control (n=12) 2002 8.3 4.6 6.1 6.3 5.2 6.3 a
Spring (n=12) 2002 5.0 6.9 3.6 4.5 5.0 5.0 a
Autumn (n=12) 2002 9.5 4.4 5.6 4.4 0.4 6.0 a
Spring and autumn (n=12) 2002 4.0 6.8 5.3 2.2 0.0 4.6 a
Averageb (N=48) 2002 6.7 y 5.7 y 5.2 y 4.3 xy 2.6 x
Control (n=12) 2003 8.3 8.5 5.8 4.1 3.6 6.1 a
Spring (n=12) 2003 6.9 8.6 6.2 5.3 2.1 5.8 a
Autumn (n=12) 2003 9.7 7.5 5.8 8.1 5.6 7.3 a
Spring and autumn (n=12) 2003 9.3 7.3 7.7 4.6 0.6 5.9 a
Averageb (N=48) 2003 8.6 y 8.0 y 6.4 xy 5.5 xy 3.0 x
a 0 = healthy trees (crown transparency ≤5%); 1 = trees showing few decline symptoms, i.e., necrotic leaves, defoliation and deadbranches (crown transparency 6–20%); 2 = trees showing moderate symptoms (21–40%); 3 = trees showing pronounced symptoms,indicating an advanced stage of decline (41–60%); and 4 = very advanced decline (>60%)b Averages followed by a common letter do not differ statistically at P=0.05
Table 2 Shoot growth (cm) of Quercus ilex trees treated with potassium phosphonate injections
Injection treatments Yr Tree scorea before treatments Averageb
0 1 2 3 4 (N=60)
Control (n=12) 2002 5.1 5.0 4.4 5.0 3.3 4.7 a
Spring (n=12) 2002 5.0 4.2 5.6 5.2 4.5 4.9 a
Autumn (n=12) 2002 5.0 6.4 3.8 4.1 3.3 4.7 a
Spring and autumn (n=12) 2002 6.4 5.7 6.1 5.7 3.4 5.6 b
Averageb (N=48) 2002 5.4 y 5.3 y 5.0 y 5.0 y 3.7 x
Control (n=12) 2003 4.2 4.6 4.2 4.5 3.3 4.3 a
Spring (n=12) 2003 4.2 4.1 3.4 4.8 3.6 4.0 a
Autumn (n=12) 2003 4.9 5.6 4.8 4.4 3.0 4.7 a
Spring and autumn (n=12) 2003 4.8 4.5 3.8 4.8 3.3 4.3 a
Averageb (N=48) 2003 4.5 y 4.7 y 4.0 xy 4.6 y 3.3 x
a 0 = healthy trees (crown transparency <5%); 1 = trees showing few decline symptoms, i.e., necrotic leaves, defoliation and deadbranches (crown transparency 6–20%); 2 = trees showing moderate symptoms (21–40%); 3 = trees showing pronounced symptoms,indicating an advanced stage of decline (41–60%); and 4 = very advanced decline (>60%)b Averages followed by a common letter do not differ statistically at P=0.05
Phytoparasitica (2009) 37:303–316 311

ularly effective for the control of Phytophthoradiseases of tree crops (Diczbalis et al. 2004; Guestet al. 1995; Opoku et al. 2007; Whiley et al. 1995).However, the control of P. cinnamomi and the controlof oak decline should clearly be differentiated.Nowadays, Q. ilex stands recover from decline afterlong periods of rain, and when management practicesthat cause root damage, soil degradation, and lack ofnatural regeneration are minimized (Tuset and Sánchez2004; A. Solla, unpublished). Since P. cinnamomi hasbeen reported as the main factor of oak decline inPortugal (Moreira et al. 2000) and Spain (Brasier 1996;Brasier et al. 1993; Gallego et al. 1999; Sánchez et al.2006), and potassium phosphonate injections have beenfound to alleviate decline in Q. ilex trees in whichP. cinnamomi was isolated (Fernández-Escobar et al.1999), numerous land owners applied this treatment totheir oaks. Desperation due to widespread mortality andlack of other control measures often leads to potassiumphosphonate treatment initiation even if no Phytoph-thora isolations have been made. Our results will helpIberian foresters to reconsider the extensive use ofpotassium phosphonate treatments, even if P. cinna-momi is present in soil or in Q. ilex roots, and willencourage scientists to find alternative solutions.Nevertheless, further studies should examine if higherrates of potassium phosphonate are appropriate.
Although indicated against oak decline, potassiumphosphonate capsules are actually sold as fertilizersand not as fungicides (http://www.fertinyect.com).
Trees treated twice a year showed increasing shootgrowth during the first year after treatments,although this effect was not maintained in the secondyear. Results are in accordance with previousresearch evaluating Q. ilex shoot growth afterpotassium phosphonate treatments (Cordón et al.2001), but not with those of Fernández-Escobar et al.(1999), who observed greater growth during thesecond and third years after treatments comparedwith control trees. No improvement in acorn pro-duction was observed, and this fact should be takeninto account, since acorns are one of the mostimportant forest products of Q. ilex dehesas. To thebest of our knowledge, quantification of Q. ilexshoot growth and acorn loss due to decline (30% and60%, respectively, if comparing healthy with verydeclined trees) is described here for the first time.This information would be useful to estimate theecological and economical impacts caused by de-cline, if compared properly with incidence andintensity data available from previous surveys(Sánchez et al. 2002, 2003; Tuset and Sánchez2004; Vivas et al. unpublished). The differentialgrowth obtained depending on branch orientationagrees with recent measurements on Q. ilex trees,which show surprisingly that the canopy radius washigher on the south and west sides of the trunk thanon the east and north sides, irrespective of the siteaspect (Montero et al. 2008). It would have beeninteresting in the present study to analyze represen-
Table 4 Soil characteristics of three sites in which Quercus ilex trees show different incidence values of decay. Within rows (eachparameter), a common letter indicates no significant difference at P=0.05 between sites
Site 1 Site 2 Site 3(incidencea = 32%) (incidencea = 96%) (incidencea = 11%)
Soil bulk density(mg m−3)
1.35 a 1.47 a 1.70 b
Gravel (%) 44.8 a 64.3 b 42.7 a
Sand (%) 67.3 b 58.4 ab 48.6 a
Silt (%) 21.9 a 29.2 a 44.2 b
Clay (%) 10.8 a 12.4 a 7.2 a
f0 (cm h−1)b 39 a 145 b 32 a
fc (cm h−1)b 18 a 79 b 13 a
k (min−1)b 0.44 a 1.04 a 0.16 a
a Percentage of Q. ilex trees with symptoms of decayb Horton model parameters indicate maximum infiltration capacity (f0), minimum infiltration capacity (fc), and infiltration decay factor(k) (Chin 2008)
312 Phytoparasitica (2009) 37:303–316
tative fine root samples before and during severalyears after the treatments, and to correlate theobtained values with the values of shoot growth.
Injection treatments had no beneficial effect ontrees initially scored as 3 (Fig. 3d), although sometreated trees grouped into ‘better than before treat-ments’ showed considerable symptom alleviation(Fig. 4b), probably due to the higher soil watercontent (θ) observed. The physiological status of thehost under conditions of low θ would probably haveaffected the distribution of phosphonate in the treeand thus the concentration confronting the pathogenat the infection court, although this hypothesis needsto be scientifically supported. Concentrations ofphosphonate in roots of Persea americana and Duriosp. varied significantly depending on tree phenologyand environmental conditions (Diczbalis et al. 2004;
Whiley et al. 1995). Moreover, the efficacy ofpotassium phosphonate would depend on the amountapplied and taken up in relation to plant size, and thetree species (Hardy et al. 2001; Shearer et al. 2006).In the present study, an application of 3–5 capsuleseach with 225 ml means that one tree was treated with16.1–26.8 g of H3PO3 (active ingredient). In Aus-tralia, where there has been extensive experience withthe treatment of dieback of forest trees by P.cinnamomi, it is recommended to inject between 50and 200 g l−1 of H3PO3 in amounts equivalent to 1 mlper cm of tree circumference. For trees of 35–55 cmdiameter, this amounts to 5.5–34.6 g of the activeingredient (phosphorus [phosphonic] acid), which iswithin the range used here. The efficacy of potassiumphosphonate is also strongly influenced by the inplanta phosphate concentrations (Guest and Grant
40 cm depth
(c)
0
10
20
30
40
So
il m
ois
ture
(%
we
igh
t) 40 cm depth
(d)
0
10
20
30
40
Soi
l moi
stur
e (%
wei
ght)
80 cm depth
(e)
0
10
20
30
40
Jan
-03
Apr
-03
Jul-
03
Oct
-03
Jan
-04
So
il m
ois
ture
(%
we
igh
t) 80 cm depth
(f)
0
10
20
30
40
Jan-
03
Apr
-03
Jul-
03
Oct
-03
Jan-
04
Soi
l moi
stur
e (%
wei
ght)
(a)
0
1
2
3
4
Apr
-02
Jul-0
2
Oct
-02
Jan-
03
Apr
-03
Jul-0
3
Oct
-03
Jan-
04
Apr
-04
Tre
e sc
ore
(b)
0
1
2
3
4
Apr
-02
Jul-0
2
Oct
-02
Jan-
03
Apr
-03
Jul-0
3
Oct
-03
Jan-
04
Apr
-04
Tre
e sc
ore
Fig. 4 Symptom develop-ment of Quercus ilex treestreated with potassiumphosphonate injections, andsoil moisture content valuesunder these trees, groupedinto: (a, c, e) untreateddeclined (○) and untreatedhealthy (□) trees; and(b, d, f) treated trees withbetter health than beforetreatments (■) and treatedtrees with a similar healthcondition as beforetreatments (●). Average soilmoistures were obtainedunder three trees per group,at 40- and 80-cm depths(c, d and e, f, respectively).Arrows indicate treatmentdates. Tree scores:0 = healthy trees (crowntransparency ≤5%); 1 =trees showing few declinesymptoms; 2 = treesshowing moderatesymptoms (21–40%); 3 =trees showing pronouncedsymptoms; and 4 = veryadvanced decline (>60%)
Phytoparasitica (2009) 37:303–316 313

1991). The phosphate concentrations in Australiansoils are among the lowest in the world (Olsen Pvalues of approximately 5 mg Pkg−1 soil), which iswhy Australian plant species are highly sensitive tophytotoxicity by potassium phosphonate. In contrast,phosphate concentrations in European soils aregenerally much higher and it is most likely that thethresholds for phytotoxicity and the efficient concen-tration of potassium phosphonate are markedly higherin European plant species in comparison with Aus-tralian plant species. Measurements undertaken byMoreno and Obrador (2007) in several Q. ilex forestsclose to the study area provided Olsen and leafcontent values of P of 4.6–11.8 mg Pkg−1 soil, and0.34–0.64 mg Pg−1 DW, respectively. Although thesevalues are lower than others reported for Q. ilexforests in Europe (Moreno and Obrador 2007), itseems that more of the chemical needs to be appliedon our trees than on the Australian trees to obtain aneffective response against decline. Finally, it shouldbe taken into account that the recommendationsfollowed in Spain and Portugal (3–5 injections pertree) would probably not lead to a uniform distribu-tion of potassium phosphonate in the root system.Potassium phosphonate is transported up- and down-wards, but horizontal movement of substances islimited in plants. In Australia, it is usually recom-mended to apply one injection with 20 ml per 20 cmof circumference. With a tree of 35–55 cm diam, thiswould mean 5–9 injections, which would substantial-ly increase the efforts and costs of the treatments.
Our results support the hypothesis that the soilwater status plays a major role in Q. ilex decline. Lowwater availability for the tree root system of a Q. ilextree is expected in soils at site 2 (decay incidence of96%) because of the higher percentage of gravel,higher infiltration capacities, and greater depth to thewater table, especially during the summer, in com-parison with the soils of sites 1 and 3. In theNetherlands, Q. robur trees were found to be mostdeclined on sites with a strongly fluctuating watertable (Oosterbaan and Nabuurs 1991). In the IberianPeninsula, Q. ilex decline was associated mostly withshallow soils, with low water retention and subjectedto severe drought (Moreira et al. 2000; Moreira andMartins 2005), as observed at site 2, although somestudies report the association of oak decline with soilsin valleys, with low infiltration, and exposed to acombination of drought and waterlogging conditions
(Sánchez et al. 2002, 2003; Tuset et al. 1996), as atsite 1. Decline of Q. ilex has also been observed atsites where P. cinnamomi was not isolated (Brasier etal. 1993; Moreira and Martins 2005; Sánchez et al.2003; Tuset et al. 1996; Tuset and Sánchez 2004); e.g.Romero et al. (2007) reported only three out ofeight declined stands with positive isolations of P.cinnamomi. In a recent survey undertaken in the sameprovince as the current study, P. cinnamomi wasconfirmed at only 21 out of 48 declining Q. ilexstands (Vivas et al. unpublished), and other factors suchas soil compaction and excessive NH4 content due toovergrazing, soil hydromorphy, and mycorrhizae pres-ence are currently under study. In Dehesa de SantaAmalia no additional pests or pathogens involved in thedecline syndrome were observed, and the decline wasprobably not caused by P. cinnamomi in the first place,as the pathogen was isolated from roots of only threeout of nine trees, but by water stress. It should bestressed that P. cinnamomi was rarely isolated from site2, where the highest decline incidence and tree mortalitywas observed, and where the presence of gravel, soilinfiltration capacities, and water table depth values weresignificantly higher than at the other sites. Not all treatedtrees were tested for the presence of the pathogen sincethe main objective of the study was to test potassiumphosphonate injections for the control of decline.Furthermore, and given the size of most decayeddehesas, if all declined trees were suggested to be testedagainst Phytophthora spp. prior to treatments, thiscontrol approach would be economically impractical.
The complexity of the decline syndrome requiresthat multidisciplinary research is undertaken, and thisstudy was a first approach. We showed for the firsttime soil infiltration data on declined Q. ilex stands.Rawls et al. (1993) provided generalized estimates off0 varying from 21 to 90 cm h−1 for US soils rangingfrom fine sandy clay to standard turfed agriculturalsoil, and Chin (2008) provided values of f0 up to127 cm h−1 for loamy sand soils of Florida. The f0value obtained for site 2 (145 cm h−1), probably as aconsequence of the high gravel content, indicates thehigh capacity of infiltration of some of the soils inwhich Q. ilex trees grow. Wide-scale application ofthe Horton model is limited because of the depen-dence of the parameters on specific soil andmoisture conditions, but on a low scale would helpto achieve a better understanding of soil watermovement. Piezometers enabled us to estimate the
314 Phytoparasitica (2009) 37:303–316

duration of waterlogging and to observe differences inthe water table depths between sites, although theresults were not conclusive since the tubes were notdeep enough during the summer period. Finally, oursoil bulk density data do not support the hypothesisthat Q. ilex decline is associated with compacted soils(Cubera et al. 2009). Therefore, long-term experi-ments are recommended, in which the water tablelevels and θ are measured during alternating droughtand wet periods and related to tree symptoms, treephysiological parameters (e.g. leaf water potentialsand rates of photosynthesis; Cubera and Moreno2007; Moreno and Cubera 2008) and the amount ofP. cinnamomi colonies in the soil.
In conclusion, care must be taken when rec-ommending potassium phosphonate or other P.cinnamomi treatments, even when the pathogen isisolated from soil. Extensive application of potassiumphosphonate in the Iberian Q. ilex trees would bepossible only if additional research is undertaken,including (i) trials to test higher rates of phosphonicacid and more injection points per tree, (ii) studiesthat quantify phosphonate uptake in trees withdifferent water status, and (iii) studies focused onthe physiological status of the trees at the time of theinjection, all in relation to the effectiveness of thetreatments. Treatments in agricultural environments inwhich irrigation and fertilization are controlled shouldbe clearly differentiated from treatments in forestenvironments, especially at sites in which soils areshallow or in Mediterranean areas in which θ islimiting. Finally, the influence of soil water contenton host-pathogen interactions deserves further re-search, and pathologists should include the soil watercontent as an additional variable that may influencethe effectiveness of therapy treatments.
Acknowledgments We thank Fernando Pulido (Universidadde Extremadura) for advice on the experimental design,Francisco Miguel Martín and Marta Company for technicalassistance, and Dr. Mª Carmen Rodríguez-Molina (Centro deInvestigación Finca La Orden), Dr. Mª Ángeles Romero, Dr. MªEsperanza Sánchez and Prof. Antonio Trapero (Universidad deCórdoba) for their help in pathogen isolation. We also thankMarqués de Valduezar, the owner of the land. Funding wasprovided by Universidad de Extremadura, I Plan de Iniciación,2005. Elena Cubera was awarded a grant by Consejería deInfraestructuras y Desarrollo Tecnológico (Junta de Extrem-adura) and Fondo Social Europeo.
References
Balci, Y., & Halmschlager, E. (2003). Phytophthora species inoak ecosystems in Turkey and their association withdeclining oak trees. Plant Pathology, 52, 694–702.
Biosca, E. G., González, R., López-López, M. J., Soria, S.,Montón, C., Pérez-Laorga, E., et al. (2003). Isolation andcharacterization of Brenneria quercina, causal agent forbark canker and drippy nut of Quercus spp. in Spain.Phytopathology, 93, 485–492.
Bower, H. (1986). Intake rate: Cylinder infiltrometer. In A.Klute (Ed.), Methods of soil analysis. Part 1 (pp. 825–844). Madison, WI, USA: American Society of Agronomyand Soil Science Society of America.
Brasier, C. M. (1992). Oak tree mortality in Iberia. Nature, 360,539.
Brasier, C. M. (1996). Phytophthora cinnamomi and oak declinein Southern Europe. Environmental constraints, includingclimate change. Annales des Sciences Forestières, 53, 347–358.
Brasier, C. M., Robredo, F., & Ferraz, J. F. P. (1993). Evidencefor Phytophthora cinnamomi involvement in Iberian oakdecline. Plant Pathology, 42, 140–145.
Chin, D. A. (2008). Phenomenological models of hydrologicprocesses in south Florida. Journal of Hydrology, 349,230–243.
Cordón, S., Bravo, V., Tapias, R., López, G., & Sánchez, I. (2001).Efecto de las inyecciones de fosfonato potásico en el troncode encina (Quercus ilex subsp ballota) sobre el crecimientode ramillas y la fructificación. Proc. of the Third SpanishForest Congress (Granada, Spain), 6, 111–115.
Cubera, E., & Moreno, G. (2007). Effect of single Quercus ilextrees upon spatial and seasonal changes in soil watercontent in dehesas of central western Spain. Annals ofForest Science, 64, 355–364.
Cubera, E., Moreno, G., & Solla, A. (2009). Quercus ilex rootgrowth in response to heterogeneous conditions of soilbulk density and soil NH4-N content. Soil & TillageResearch, 103, 16–22.
Diczbalis, Y., Vawdrey, L., Alvero, G., Campagnolo, D., VanThanh, H., Van Tri, M., et al. (2004). Durian treephenology and the control of Phytophthora diseases ofdurian using phosphonate trunk injection. In A. Drenth &D. I. Guest (Eds.), Diversity and Management of Phytoph-thora in Southeast Asia. (pp. 206–216). Canberra, Australia:Australian Centre for International Agricultural Research.
Erwin, D. C., & Ribeiro, O. K. (1996). Phytophthora diseasesworldwide. St Paul, MN, USA: APS.
Fernández-Escobar, R., Gallego, F. J., Benlloch, M., Membrillo,J., Infante, J., & Pérez de Algaba, A. (1999). Treatment ofoak decline using pressurized injection capsules of anti-fungal materials. European Journal of Forest Pathology, 29,29–38.
Gallego, F. J., Pérez de Algaba, A., & Fernández-Escobar, R.(1999). Etiology of oak decline in Spain. EuropeanJournal of Forest Pathology, 29, 17–27.
Gee, G. W., & Bauder, J. W. (1986). Particle-size analysis. InA. Klute (Ed.), Methods of soil analysis. Part 1 (pp. 383–411). Madison, WI, USA: American Society of Agronomyand Soil Science Society of America.
Phytoparasitica (2009) 37:303–316 315

Guest, D., & Grant, B. (1991). The complex action ofphosphonates as antifungal agents. Biological Reviews,66, 159–187.
Guest, D. I., Pegg, K. G., & Whiley, A. W. (1995). Control ofPhytophthora diseases of tree crops using trunk-injectedphosphonates. Horticultural Reviews, 17, 299–330.
Hardy, G. E., St, J., Barrett, S., & Shearer, B. L. (2001). Thefuture of phosphite as a fungicide to control the soilborneplant pathogen Phytophthora cinnamomi in naturalecosystems. Australasian Plant Pathology, 30, 133–139.
Jeffers, N. S., & Martin, J. B. (1986). Comparison of two mediaselective for Phytophthora and Pythium species. PlantDisease, 70, 1038–1043.
Jiménez, J. J., Sánchez, J. E., Romero, M. A., Belbahri, L.,Trapero, A., Lefort, F., et al. (2008). Pathogenicity ofPythium spiculum and P. sterilum on feeder roots ofQuercus rotundifolia. Plant Pathology, 57, 369.
Jung, T., Blaschke, H., & Neumann, P. (1996). Isolation,identification and pathogenicity of Phytophthora speciesfrom declining oak stands. European Journal of ForestPathology, 26, 253–272.
Jung, T., Blaschke, H., & Oßwald, W. (2000). Involvement ofPhytophthora species in Central European oak decline andthe effect of site factors on the disease. Plant Pathology,49, 706–718.
Montero, M. J., Moreno, G., & Bertomeu, M. (2008). Lightdistribution in scattered-trees open woodlands in westernSpain. Agroforestry Systems, 73, 233–244.
Moreira, A. C., Ferraz, J. F. P., & Clegg, J. (2000). Theinvolvement of Phytophthora cinnamomi in cork and holmoak decline in Portugal. In E. M. Hansen & W. Sutton(Eds.), Phytophthora in Forest and Wildland Ecosystems(pp. 132–135). Corvallis, OR, USA: Forest ResearchLaboratory, Oregon State University.
Moreira, A. C., & Martins, J. M. S. (2005). Influence of sitefactors on the impact of Phytophthora cinnamomi in corkoak stands in Portugal. Forest Pathology, 35, 145–162.
Moreno, G., & Cubera, E. (2008). Impact of stand density onwater status and leaf gas exchange in Quercus ilex. ForestEcology and Management, 254, 78–84.
Moreno, G., & Obrador, J. J. (2007). Effects of trees andunderstorey management on soil fertility and nutritionalstatus of holm oaks in Spanish dehesas. Nutrient Cyclingin Agroecosystems, 78, 253–264.
Oosterbaan, A., & Nabuurs, G. J. (1991). Relationshipsbetween oak decline and groundwater class in TheNetherlands. Plant and Soil, 136, 87–93.
Opoku, I. Y., Akrofi, A. Y., & Appiah, A. A. (2007).Assessment of sanitation and fungicide application directedat cocoa tree trunks for the control of Phytophthora blackpod infections in pods growing in the canopy. EuropeanJournal of Plant Pathology, 117, 167–175.
Paul, B., Bala, K., Belbahri, L., Calmin, G., Sánchez-Hernández,E., & Lefort, F. (2006). A new species of Pythium withornamented oogonia: morphology, taxonomy, ITS region ofits rDNA, and its comparison with related species. FEMSMicrobiology Letters, 254, 317–323.
Porras, C. J., Pérez, J. L., Brun, P., Casas, C., Copete, J., & Pérez,R. (2007). Resultados de la aplicación de inyecciones entronco para la lucha contra la seca de encinas. CerdoIbérico, 17, 79–85.
Pulido, F. J., & Díaz, M. (2005). Regeneration of a Mediterraneanoak: a whole-cycle approach. EcoScience, 12, 92–102.
Rawls, W. J., Ahuja, L. R., Brakensiek, D. L., & Shirmohammadi,A. (1993). Infiltration and soil water movement. In D. R.Maidment (Ed.), Handbook of hydrology (pp. 5.1–5.51).New York: McGraw-Hill.
Robin, C., Desprez-Loustau, M. L., Capron, G., & Delatour, C.(1998). First record of Phytophthora cinnamomi on corkand holm oaks in France and evidence of pathogenicity.Annales des Sciences Forestières, 55, 869–883.
Rodríguez-Molina, M. C., Blanco-Santos, A., Palo-Núnez, E.J., Torres-Vila, L. M., Torres-Álvarez, E., & Suárez-de-la-Cámara, M. A. (2005). Seasonal and spatial mortalitypatterns of holm oak seedlings in a reforested soil infectedwith Phytophthora cinnamomi. Forest Pathology, 35,411–422.
Romero, M. A., Sánchez, J. E., Jiménez, J. J., Belbahri, L.,Trapero, A., Lefort, F., et al. (2007). New Pythium taxacausing root rot on Mediterranean Quercus species insouth–west Spain and Portugal. Journal of Phytopathology,155, 289–295.
Sánchez, M. E., Andicoberry, S., & Trapero, A. (2005).Pathogenicity of three Phytophthora spp. causing lateseedling rot of Quercus ilex ssp. ballota. Forest Pathology,35, 115–125.
Sánchez, M. E., Caetano, P., Ferraz, J., & Trapero, A. (2002).Phytophthora disease of Quercus ilex in south–westernSpain. Forest Pathology, 32, 5–18.
Sánchez, M. E., Caetano, P., Romero, M. A., Navarro, R. M., &Trapero, A. (2006). Phytophthora root rot as the mainfactor of oak decline in southern Spain. In C. Brasier, T.Jung & W. Oßwald (Eds.), Progress in research onPhytophthora diseases of forest trees (pp. 149–154).Farnham, Surrey, UK: Forest Research.
Sánchez, M. E., Sánchez, J. E., Navarro, R. M., Fernández, P.,& Trapero, A. (2003). Incidencia de la podredumbreradical causada por Phytophthora cinnamomi en masas deQuercus en Andalucía. Boletín de Sanidad Vegetal–Plagas, 29, 87–108.
Shearer, B. L., Fairman, R. G., & Grant, M. J. (2006). Effectiveconcentration of phosphite in controlling Phytophthoracinnamomi following stem injection of Banksia speciesand Eucalyptus marginata. Forest Pathology, 36, 119–135.
Tuset, J. J., Hinarejos, C., Mira, J. L., & Cobos, J. M. (1996).Implicación de Phytophthora cinnamomi Rands en laenfermedad de la seca de encinas y alcornoques. Boletínde Sanidad Vegetal–Plagas, 22, 491–499.
Tuset, J. J., & Sánchez, G. (2004). La seca: El decaimiento deencinas, alcornoques y otros Quercus en España. Madrid:Ediciones Mundi Prensa.
Vettraino, A. M., Barzanti, G. P., Bianco, M. C., Ragazzi, A.,Capretti, P., Paoletti, E., et al. (2002). Occurrence ofPhytophthora species in oak stands in Italy and theirassociation with declining oak trees. Forest Pathology, 32,19–28.
Whiley, A. W., Hargreaves, P. A., Pegg, K. G., Doogan, V. J.,Ruddle, J. B., Saranah, J. B., et al. (1995). Changing sinkstrength influences translocation of phosphonate in avocado(Persea americana Mill.) trees. Australian Journal ofAgricultural Research, 46, 1079–1090.
316 Phytoparasitica (2009) 37:303–316