Evaluating Pay for Performance Alignment - Home - · PDF fileEvaluating Pay for Performance...
19
© 2012 Institutional Shareholder Services Inc. All rights reserved. Page 1 Updated: February 17, 2012 Evaluating Pay for Performance Alignment ISS’ Quantitative and Qualitative Approach Gary Hewitt [email protected] Carol Bowie [email protected]
Transcript of Evaluating Pay for Performance Alignment - Home - · PDF fileEvaluating Pay for Performance...
Evaluating Pay for Performance Alignment: ISS’ Qualitative and Quantitative Approach
© 2012 Institutional Shareholder Services Inc. All rights reserved. Page 1
Updated: February 17, 2012
Evaluating Pay for Performance Alignment ISS’ Quantitative and Qualitative Approach
Gary Hewitt [email protected]
Carol Bowie [email protected]
Evaluating Pay for Performance Alignment: ISS’ Qualitative and Quantitative Approach
© 2012 Institutional Shareholder Services Inc. All rights reserved. Page 2
Updated: February 17, 2012
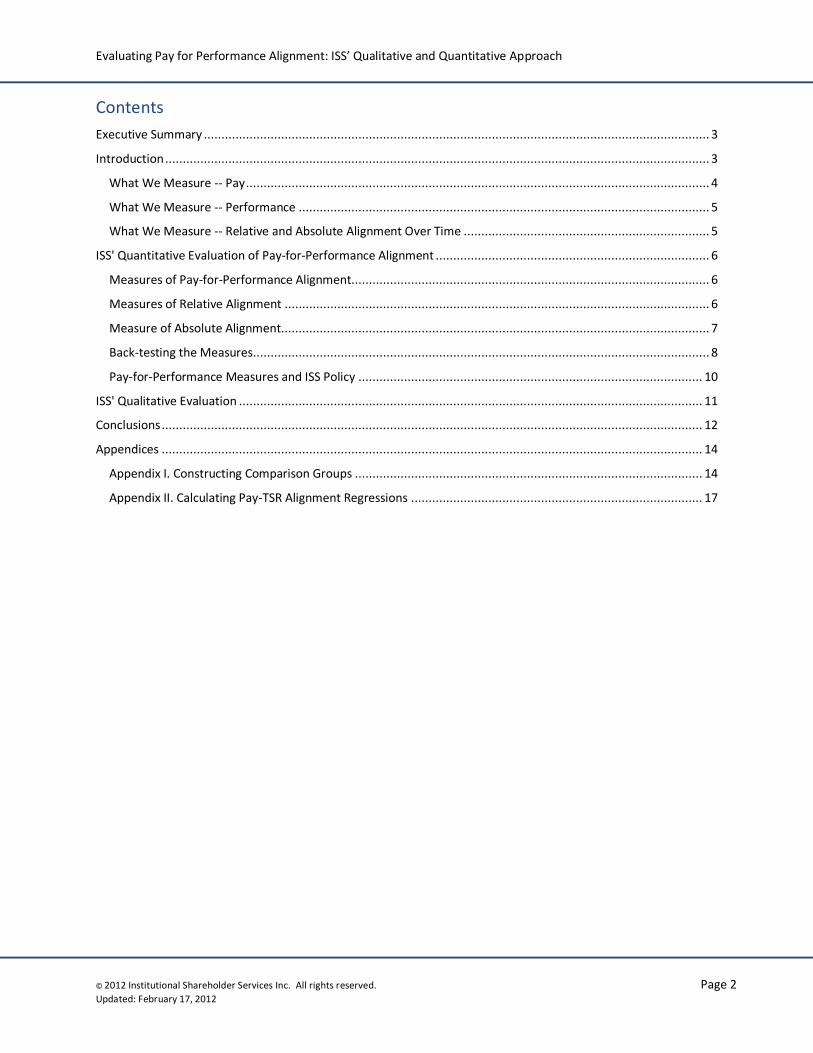
Contents
Executive Summary ................................................................................................................................................ 3
Introduction ........................................................................................................................................................... 3
What We Measure -- Pay .................................................................................................................................... 4
What We Measure -- Performance ..................................................................................................................... 5
What We Measure -- Relative and Absolute Alignment Over Time ...................................................................... 5
ISS' Quantitative Evaluation of Pay-for-Performance Alignment .............................................................................. 6
Measures of Pay-for-Performance Alignment...................................................................................................... 6
Measures of Relative Alignment ......................................................................................................................... 6
Measure of Absolute Alignment.......................................................................................................................... 7
Back-testing the Measures .................................................................................................................................. 8
Pay-for-Performance Measures and ISS Policy .................................................................................................. 10
ISS' Qualitative Evaluation .................................................................................................................................... 11
Conclusions .......................................................................................................................................................... 12
Appendices .......................................................................................................................................................... 14
Appendix I. Constructing Comparison Groups ................................................................................................... 14
Appendix II. Calculating Pay-TSR Alignment Regressions ................................................................................... 17
Evaluating Pay for Performance Alignment: ISS’ Qualitative and Quantitative Approach
© 2012 Institutional Shareholder Services Inc. All rights reserved. Page 3
Updated: February 17, 2012
Executive Summary
Investor feedback on the issue of pay-for-performance has indicated a preference for putting the focus on long-term alignment, board decision-making, and pay relative both to market peers and to absolute shareholder returns. As a result, ISS is unveiling a new approach to evaluating pay-for-performance in 2012. It comprises an initial quantitative assessment and, as appropriate, an in-depth qualitative review to determine either the likely cause of a perceived long-term disconnect between pay and performance, or factors that mitigate the initial assessment.
The quantitative methodology utilizes two components:
A relative evaluation -- primarily, rankings of CEO pay and performance relative to peers over three years, and
An absolute evaluation -- CEO pay trends relative to shareholder return trends over five years.
Both are considered from an investor's perspective in evaluating the efficacy of top executive pay packages on a long-term basis. For the relative evaluation, peer groups are designed not for pay benchmarking or stock-picking but rather to compare pay and company performance within a group of companies that are reasonably similar in terms of industry profile, size, and market capitalization. The evaluation focuses on disclosed pay and equity grants, since they represent the pay and award opportunities the board determines should be provided to its top executive each year, and should be aligned with the company's performance trends – or if not, should be appropriately performance based, as ISS' qualitative analysis will address.
The quantitative methodology, described in detail in this paper, is designed to identify outlier companies that have demonstrated significant misalignment between CEO pay and company performance over time. Extensive back-testing has also validated that this approach generally aligns with shareholder opinions as expressed through say-on-pay votes in 2011. The follow-up qualitative assessment, applied to companies with apparent pay-performance disconnect, is designed to uncover mitigating factors (such as rigorous performance-based award opportunities that are designed to drive improvement) or potential causes of the misalignment, such as problematic pay benchmarking practices.
Introduction
Escalating CEO pay packages in the last few decades have stirred considerable debate, culminating in a Congressional mandate for advisory shareholder votes on executive compensation under the Dodd-Frank Act of 2010.1 The advent of say-on-pay in the U.S. has also highlighted pay-for-performance as the most significant factor driving investors' voting decisions on the issue.2
Doubts about the strength of pay and performance alignment may stem from "agency problem" conflicts of interest, perceptions of weak board oversight and aggressive pay benchmarking; abuses such as options backdating; and most recently, concern that pay practices at some firms likely contributed to the financial meltdown that triggered the latest economic and market malaise. Further, while executive pay has increased at a fairly rapid pace since the 1980s, investor portfolios have experienced multiple market swings – booms and busts that often appear disconnected from individual executives' impact -- adding to skepticism about the pay process.
Still, in the absence of a universally accepted method to evaluate executive pay relative to performance, investor and issuer perceptions vary widely. Unlike many markets, the U.S. has no governance code establishing guidelines for pay practices, and performance may be measured on multiple dimensions. It is also clear that most institutional investors do not want to micromanage or interfere with a board's ability to devise programs that will
1 The SEC delayed implementation of advisory votes at small issuers (less than $75 million in public float) until 2013.
2 An overwhelming 94 percent of institutional respondents to ISS' 2009-2010 policy survey indicated that pay-for-performance would be a critical or important consideration for their "say on pay" vote determinations.
Evaluating Pay for Performance Alignment: ISS’ Qualitative and Quantitative Approach
© 2012 Institutional Shareholder Services Inc. All rights reserved. Page 4
Updated: February 17, 2012
help create and protect shareholder value, even while they recognize a responsibility to monitor the process.3 From a voting policy perspective, ISS has regularly polled both clients and other market participants on the issue of executive pay, and has developed evolving methodologies to detect potential pay-performance disconnects of concern to shareholders. In the last few years, the approach has utilized a quantitative methodology to identify underperforming companies -- i.e., those with both 1- and 3-year total shareholder return (TSR) below the median of peers in their 4-digit Global Industry Classification Standard (GICS) group. Underperforming companies then received an in-depth qualitative review, focused primarily on factors such as the year-over-year change in the CEO's total pay, the 5-year trend in CEO pay versus company TSR, and the strength of performance-based pay elements.
This year, a substantial majority of institutional respondents to ISS' 2011-12 policy survey confirmed two factors as very relevant to evaluating pay-for-performance alignment: pay relative to peers and pay increases that are inconsistent with the company's performance trend. Most issuer respondents also indicated that pay versus peers is an appropriate factor and that pay increases in light of company performance should be a consideration. In addition, both institutions and issuers have contended in roundtables and other feedback that pay−performance alignment should be viewed in a long-term context. It is on this basis that ISS decided to refine our approach to pay-for-performance evaluations and develop a more sophisticated methodology to drive the quantitative component of the analysis. The remainder of this paper provides an overview and rationale for the elements considered, as well as detailed discussion of the new quantitative methodology and ongoing qualitative factors.
What We Measure -- Pay
A key question in any analysis is what to analyze. Per SEC disclosure requirements, each annual meeting proxy statement includes an array of pay data, with a three-year look-back, for the five highest-paid executives including the CEO and CFO. The centerpiece of these disclosures is the Summary Compensation Table, which enumerates the key elements found in typical top executive compensation packages, including cash, indirect pay, and equity grants:
Salary
Bonus and/or Nonequity Incentive Plan Compensation4
Stock Awards (grant date value)
Stock Option Awards (grant date value)
Annual Change in Pension Value/Nonqualified Deferred Compensation Earnings (above market rate)
All Other Compensation
Other tables provide, among other details, summaries of equity- and nonequity-based grants in the last fiscal year, unexercised/unvested equity-based awards, and the realized gains of vested and exercised grants. But the Summary Compensation Table presents the most comprehensive picture of each named executive officer's total planned and earned compensation for the year – specifically, the pay and pay opportunities that the compensation committee and board determined they ought to receive. It is those decisions that investors generally wish to monitor and evaluate, since their aim is to ensure that executives will be paid fairly, but not overpaid, for the performance they ultimately deliver and sustain. ISS focuses on the CEO's pay because that package sets the "compensation pace" at most companies; also the compensation committee and board are most directly involved in and accountable for the decisions that generate the CEO's pay.
Some observers suggest that shareholders evaluate "realized" rather than granted pay in determining whether pay and performance are aligned. This comprises compensation that results (or could result) from the exercise/vesting of an executive's previously granted equity awards at a given point in time. Since equity-based awards are by far the largest component of most top managers' pay, it is true that future shareholder returns will have substantial impact on those realized values – in other words, the pay realized from equity-based awards at underperforming
3 Inferred from overwhelming support seen for annual say on pay votes; approximately 80% of companies that presented say-on-pay frequency votes in 2011 saw majority support for the annual frequency option, regardless of management's recommendation.
4 Per disclosure rules, payouts of cash awards earned on the basis of pre-established goals are reported under the "Nonequity Incentive Awards" column; other cash incentive awards are reported under the "Bonus" column.
Evaluating Pay for Performance Alignment: ISS’ Qualitative and Quantitative Approach
© 2012 Institutional Shareholder Services Inc. All rights reserved. Page 5
Updated: February 17, 2012
companies is likely to be lower than that realized by executives at better performing companies, all else being equal. Nevertheless, those values are also significantly influenced by the award opportunities themselves, which reflect the compensation level the board has determined top executives deserve and that will appropriately incentivize future performance. Since all equity-based awards are sensitive, to some degree, to market trends beyond the control of individual executives, it is important that pay elements be considered if long-term company performance is misaligned with past pay and award opportunities. In that case, shareholders may expect the board to ensure that future incentive awards are clearly designed to promote performance improvements that will lead to shareholder value creation.
Finally, in the interest of protecting their assets, investors may have another reason to monitor granted pay: corporate pay benchmarking. Companies themselves measure their executives' compensation against competitors with respect to pay and pay opportunities, not "realized" pay. The awards delivered to executives become the basis for future realizable pay.
5
Thus, in evaluating pay−performance alignment, ISS focuses on Total Compensation as reflected in the Summary Compensation Table, but utilizing a standard set of assumptions to value equity-based grants. All elements, including the Annual Change in Pension/Deferred Compensation Interest (not generally considered "direct" pay) are taken into account, since companies that do not provide components such as supplemental pensions and nonqualified deferral plans may compensate executives by making larger equity grants; thus, all elements are considered to help ensure equitable comparisons.
What We Measure -- Performance
There are, of course, myriad ways to measure corporate performance, and key metrics may vary considerably from industry to industry and from company to company depending on their particular business strategy at any given time. Investors expect that incentive plan metrics will stem from that strategy and be designed to motivate the behavior and executive decisions that will lead to its successful execution. But the key measure for investors in the context of a long-term pay-for-performance evaluation is total shareholder return (TSR).
Note that ISS does not advocate that companies use TSR as the metric underlying their incentive programs; on the contrary, shareholders may prefer that incentive awards be tied to the company's short- and long-term business goals. If the business strategy is sound and well executed, the expectation is that it will create value for shareowners over time, as reflected in long-term total shareholder returns. For this reason, TSR, which is objective and transparent, is the primary metric ISS utilizes in evaluating pay and performance alignment.
What We Measure -- Relative and Absolute Alignment Over Time
In 2011, a substantial majority of institutional respondents to ISS' policy survey confirmed two factors as important in determining pay-for-performance alignment: pay relative to peers (which 62% said is very relevant), and pay increases that are disproportionate to the company's performance trend (considered very relevant by 88% of institutional survey participants). Most issuer respondents also indicated these factors as at least somewhat relevant to a pay-for-performance evaluation.
In light of this and similar feedback in roundtables and other discussions, ISS has incorporated both perspectives into the quantitative component of its revised pay-for-performance analysis, as discussed in detail below. This ensures a balanced evaluation from both relative and absolute pay-for-performance perspectives. As noted, in cases where the quantitative assessment indicates significant pay-for-performance misalignment, an in-depth
5 A number of academic studies have found weaknesses in corporate benchmarking practices that may have the effect of
driving up CEO pay regardless of other factors. See "Compensation Benchmarking, Leapfrogs, and The Surge in Executive Pay," Thomas A. DiPrete & Greg Eirich, Columbia University and Matthew Pittinsky, Arizona State University, November 23, 2009. http://www.ssc.wisc.edu/soc/faculty/docs/diprete/frog11302009.pdf. Also "Inside the black box: the role and composition of compensation peer groups," M. Faulkender and J. Yang, Journal of Financial Economics, May 2010.
Evaluating Pay for Performance Alignment: ISS’ Qualitative and Quantitative Approach
© 2012 Institutional Shareholder Services Inc. All rights reserved. Page 6
Updated: February 17, 2012
qualitative analysis (also discussed in more detail below) is conducted to determine either the probable cause or any mitigating factors that should be considered.
ISS' Quantitative Evaluation of Pay-for-Performance Alignment
The first step in ISS’ evaluation of pay for performance has historically been a quantitative assessment of how well a company’s CEO pay has been aligned with its financial performance. This screen identifies companies that have underperformed over 1- and 3-year periods, relative to a broad industry category, combined with CEO pay increases. The screen is intended to flag companies where a potential misalignment of pay and performance may exist and therefore where additional qualitative assessment is warranted. Recommendations based on pay-for-performance evaluations are determined after that qualitative assessment.
ISS’ new quantitative pay-for-performance model maintains this approach but, based on feedback from our institutional investor clients and the market, has new factors. Broadly speaking, ISS had three main goals in developing the new pay-for-performance methodology:
Measure alignment over multiple time horizons. Business cycles and compensation plans’ performance cycles span multiple years. An assessment of alignment between shareholders and executives should accordingly see pay across timeframes that approach the length of performance and business cycles. However, it is important to note that the say-on-pay proxy resolution is typically directed at the prior year’s compensation, and special attention should be paid to recent experience.
Use multiple measures to assess alignment. No single quantitative measure can conclusively indicate that pay and performance are aligned. ISS sought, therefore, to identify multiple measures, each of which assesses a company’s pay for performance alignment from a distinct perspective. Where one or multiple measures fail to demonstrate pay for performance, a pay-for-performance concern may exist.
Provide more information about pay-for-performance concerns to investors and issuers. The current pay-for-performance screen is a binary pass/fail performance-oriented screen that is triggered for close to 30 percent of companies – less than one-third of which are ultimately determined to have a pay-for-performance disconnect of immediate concern to shareholders. The new screen is designed to provide more robust information about pay-for-performance alignment by evaluating and reporting the degree of alignment found.
Measures of Pay-for-Performance Alignment
At the core of the new quantitative methodology are three measures of alignment between executive pay and company performance: two relative measures where a company’s pay-for-performance alignment is evaluated in reference to a group of comparable companies, and one absolute measure, where alignment is evaluated independently of other companies’ performance.
The three measures, which are discussed in greater detail below, are:
Relative Degree of Alignment. This relative measure compares the percentile ranks of a company’s CEO pay and TSR performance, relative to an industry-and-size derived comparison group, over one- and three-year periods.
Multiple of Median. This relative measure expresses the prior year’s CEO pay as a multiple of the median pay of its comparison group for the same period.
Pay-TSR Alignment. This absolute measure compares the trends of the CEO’s annual pay and the value of an investment in the company over the prior five-year period.
Measures of Relative Alignment
Relative Degree of Alignment (RDA)
This measure addresses the question: Is the pay opportunity delivered to the CEO commensurate with the performance achieved by shareholders, relative to a comparable group of companies? The measure compares the percentile ranks of a company’s CEO pay and TSR performance, relative to a comparison group of 14-24 companies
Evaluating Pay for Performance Alignment: ISS’ Qualitative and Quantitative Approach
© 2012 Institutional Shareholder Services Inc. All rights reserved. Page 7
Updated: February 17, 2012
selected by ISS on the basis of size, industry, and market capitalization, over one- and three-year periods. For more information on ISS’ process for selecting peers, see Appendix I.
To determine this measure, the subject company’s percentile ranks for pay and performance are calculated for one- and three-year periods. One- and three-year pay amounts (annual and average, respectively) for each comparison company are based on the most recently disclosed three years of pay data available in the ExecComp Analytics database for that company.
Because of the sensitivity of TSR to overall market performance, annualized TSR performance for all companies (subject company and comparison companies) will be measured for the same period: that is, the one- and three-year periods ending on the last day of the month closest to the fiscal-year end of the subject company. To illustrate: if a company’s fiscal year ends on November 29, 2011, then all TSRs will be measured over the periods December 1, 2010-November 30, 2011 (for one-year) and December 1, 2008-November 30, 2011 (for three-year).
Combined percentile ranks for pay and for performance are calculated, based on a 40% weighting for the one-year and a 60% weighting for the three-year ranks. The Relative Degree of Alignment is equal to the difference between the ranks: the combined performance rank minus the combined pay rank. (Note that if three years of data are not available for the subject company, the combined measure will reflect only the one-year rankings.)
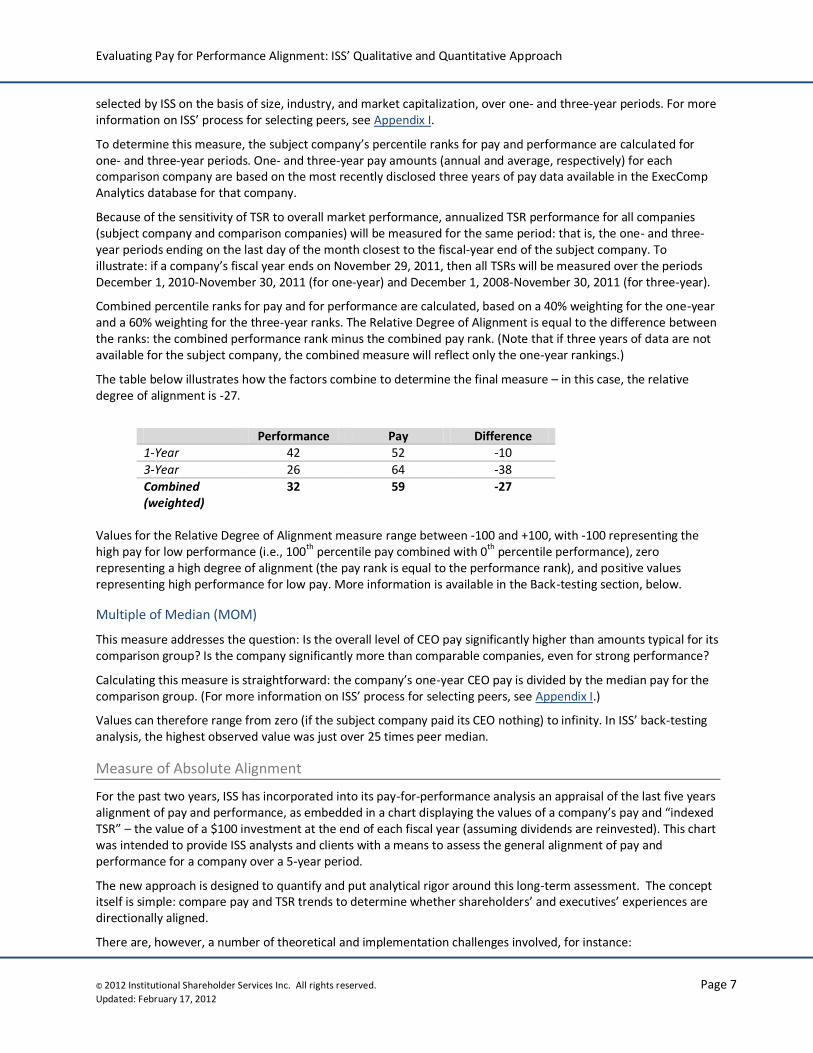
The table below illustrates how the factors combine to determine the final measure – in this case, the relative degree of alignment is -27.
Performance Pay Difference 1-Year 42 52 -10
3-Year 26 64 -38
Combined (weighted)
32 59 -27
Values for the Relative Degree of Alignment measure range between -100 and +100, with -100 representing the high pay for low performance (i.e., 100th percentile pay combined with 0th percentile performance), zero representing a high degree of alignment (the pay rank is equal to the performance rank), and positive values representing high performance for low pay. More information is available in the Back-testing section, below.
Multiple of Median (MOM)
This measure addresses the question: Is the overall level of CEO pay significantly higher than amounts typical for its comparison group? Is the company significantly more than comparable companies, even for strong performance?
Calculating this measure is straightforward: the company’s one-year CEO pay is divided by the median pay for the comparison group. (For more information on ISS’ process for selecting peers, see Appendix I.)
Values can therefore range from zero (if the subject company paid its CEO nothing) to infinity. In ISS’ back-testing analysis, the highest observed value was just over 25 times peer median.
Measure of Absolute Alignment
For the past two years, ISS has incorporated into its pay-for-performance analysis an appraisal of the last five years alignment of pay and performance, as embedded in a chart displaying the values of a company’s pay and “indexed TSR” – the value of a $100 investment at the end of each fiscal year (assuming dividends are reinvested). This chart was intended to provide ISS analysts and clients with a means to assess the general alignment of pay and performance for a company over a 5-year period.
The new approach is designed to quantify and put analytical rigor around this long-term assessment. The concept itself is simple: compare pay and TSR trends to determine whether shareholders’ and executives’ experiences are directionally aligned.
There are, however, a number of theoretical and implementation challenges involved, for instance:
Evaluating Pay for Performance Alignment: ISS’ Qualitative and Quantitative Approach
© 2012 Institutional Shareholder Services Inc. All rights reserved. Page 8
Updated: February 17, 2012
Pay and TSR are measured conceptually differently: pay as a number of dollars delivered in a year, and TSR as a percentage change over the course of a year
Pay and TSR are measured on different scales and different timeframes
Pay is “lumpy,” with significant swings on a year-to-year basis that can obscure longer-term trends
TSR measurements – even over a long term – are sensitive to the endpoints of the periods being measured
Pay-TSR Alignment (PTA)
ISS’ new measure of long-term absolute alignment is intended to tackle these challenges and address the question: have shareholders’ and executives’ experiences followed the same long-term trend? It is important to note that PTA is not designed to measure the sensitivity of CEO pay to performance – whether pay and performance go up and down together on a year-over-year basis. It is a long-term measure of directional alignment.
At a high level, the measure is calculated as the difference between the slopes of weighted linear regressions for pay and for shareholder returns over a five-year period. This difference indicates the degree to which CEO pay has changed more or less rapidly than shareholder returns over that period. For technical information on how the regressions are calculated, see Appendix II.
By using regressions to estimate the long-term trends for pay and TSR, the method avoids the pitfalls of evaluating pay and performance over time:
Performance over a fiscal year and pay granted over that period are measured in a consistent fashion, on the same scale, and are matched in time.
Volatility of pay and lumpiness of performance are smoothed but not eliminated – addressing in a consistent fashion both the “lumpy pay” problem as well as the sensitivity of TSR to choice of endpoints.
The trend lines calculated by these regressions are analogous to a 5-year “trend rate” for pay and performance, weighted to reflect recent history. The final Pay-TSR Alignment measure is simply equal to the difference: performance slope minus the pay slope. Potential values for PTA are theoretically unbounded, but in practice they range from just over -100% to just over 100%, with a slightly negative median value (see Back-testing, below, for more details).
Back-testing the Measures
To back-test these measures, ISS analyzed pay and performance data for 2,500 companies from the years 2006-2010. Comparison groups were constructed for each company, and each of the three measures was calculated, according to the methodology described above.
Relative Degree of Alignment
RDA measures are normally distributed across the back-test sample, as indicated in the chart below. The median value is indistinguishable from zero, meaning that the percentile pay and performance ranks are nearly equal for the median company in the sample.
Evaluating Pay for Performance Alignment: ISS’ Qualitative and Quantitative Approach
© 2012 Institutional Shareholder Services Inc. All rights reserved. Page 9
Updated: February 17, 2012
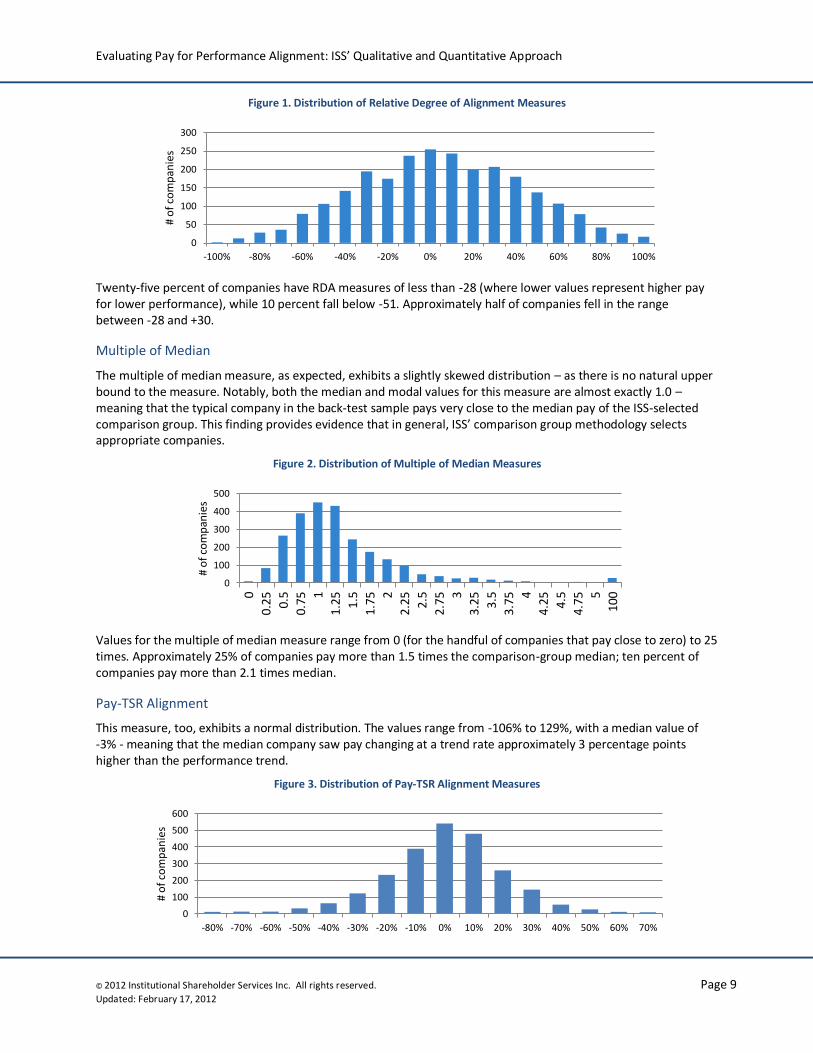
Figure 1. Distribution of Relative Degree of Alignment Measures
Twenty-five percent of companies have RDA measures of less than -28 (where lower values represent higher pay for lower performance), while 10 percent fall below -51. Approximately half of companies fell in the range between -28 and +30.
Multiple of Median
The multiple of median measure, as expected, exhibits a slightly skewed distribution – as there is no natural upper bound to the measure. Notably, both the median and modal values for this measure are almost exactly 1.0 – meaning that the typical company in the back-test sample pays very close to the median pay of the ISS-selected comparison group. This finding provides evidence that in general, ISS’ comparison group methodology selects appropriate companies.
Figure 2. Distribution of Multiple of Median Measures
Values for the multiple of median measure range from 0 (for the handful of companies that pay close to zero) to 25 times. Approximately 25% of companies pay more than 1.5 times the comparison-group median; ten percent of companies pay more than 2.1 times median.
Pay-TSR Alignment
This measure, too, exhibits a normal distribution. The values range from -106% to 129%, with a median value of -3% - meaning that the median company saw pay changing at a trend rate approximately 3 percentage points higher than the performance trend.
Figure 3. Distribution of Pay-TSR Alignment Measures
0
50
100
150
200
250
300
-100% -80% -60% -40% -20% 0% 20% 40% 60% 80% 100%
# o
f co
mp
anie
s
0
100
200
300
400
500
0
0.25
0.5
0.75
1
1.25
1.5
1.75
2
2.25
2.5
2.75
3
3.25
3.5
3.75
4
4.25
4.5
4.75
5
100
# o
f co
mp
anie
s
0
100
200
300
400
500
600
-80% -70% -60% -50% -40% -30% -20% -10% 0% 10% 20% 30% 40% 50% 60% 70%
# o
f co
mp
anie
s
Evaluating Pay for Performance Alignment: ISS’ Qualitative and Quantitative Approach
© 2012 Institutional Shareholder Services Inc. All rights reserved. Page 10
Updated: February 17, 2012
Approximately 25% of companies had PTA measures less than -16.2%, and ten percent had values under -30.6%. Half of companies had PTA measures between -16.2% and 7.7%.
Relationship to Vote Results
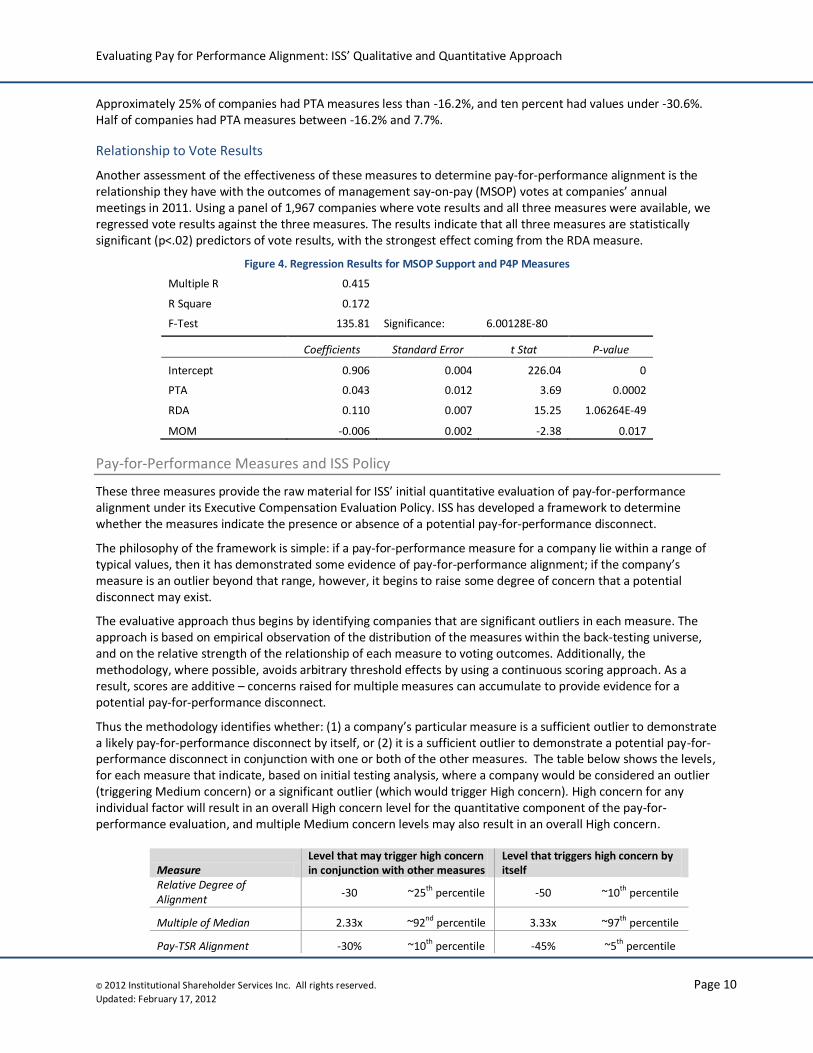
Another assessment of the effectiveness of these measures to determine pay-for-performance alignment is the relationship they have with the outcomes of management say-on-pay (MSOP) votes at companies’ annual meetings in 2011. Using a panel of 1,967 companies where vote results and all three measures were available, we regressed vote results against the three measures. The results indicate that all three measures are statistically significant (p<.02) predictors of vote results, with the strongest effect coming from the RDA measure.
Figure 4. Regression Results for MSOP Support and P4P Measures
Multiple R 0.415 R Square 0.172 F-Test 135.81 Significance: 6.00128E-80
Coefficients Standard Error t Stat P-value
Intercept 0.906 0.004 226.04 0
PTA 0.043 0.012 3.69 0.0002
RDA 0.110 0.007 15.25 1.06264E-49
MOM -0.006 0.002 -2.38 0.017
Pay-for-Performance Measures and ISS Policy
These three measures provide the raw material for ISS’ initial quantitative evaluation of pay-for-performance alignment under its Executive Compensation Evaluation Policy. ISS has developed a framework to determine whether the measures indicate the presence or absence of a potential pay-for-performance disconnect.
The philosophy of the framework is simple: if a pay-for-performance measure for a company lie within a range of typical values, then it has demonstrated some evidence of pay-for-performance alignment; if the company’s measure is an outlier beyond that range, however, it begins to raise some degree of concern that a potential disconnect may exist.
The evaluative approach thus begins by identifying companies that are significant outliers in each measure. The approach is based on empirical observation of the distribution of the measures within the back-testing universe, and on the relative strength of the relationship of each measure to voting outcomes. Additionally, the methodology, where possible, avoids arbitrary threshold effects by using a continuous scoring approach. As a result, scores are additive – concerns raised for multiple measures can accumulate to provide evidence for a potential pay-for-performance disconnect.
Thus the methodology identifies whether: (1) a company’s particular measure is a sufficient outlier to demonstrate a likely pay-for-performance disconnect by itself, or (2) it is a sufficient outlier to demonstrate a potential pay-for-performance disconnect in conjunction with one or both of the other measures. The table below shows the levels, for each measure that indicate, based on initial testing analysis, where a company would be considered an outlier (triggering Medium concern) or a significant outlier (which would trigger High concern). High concern for any individual factor will result in an overall High concern level for the quantitative component of the pay-for-performance evaluation, and multiple Medium concern levels may also result in an overall High concern.
Measure Level that may trigger high concern in conjunction with other measures
Level that triggers high concern by itself
Relative Degree of Alignment
-30 ~25th percentile -50 ~10th percentile
Multiple of Median 2.33x ~92nd percentile 3.33x ~97th percentile
Pay-TSR Alignment -30% ~10th percentile -45% ~5th percentile
Evaluating Pay for Performance Alignment: ISS’ Qualitative and Quantitative Approach
© 2012 Institutional Shareholder Services Inc. All rights reserved. Page 11
Updated: February 17, 2012
As noted, levels of concern for each measure are calibrated based on their empirical distribution and the strength of their relationship with voting results. This effectively “weights” the strongest measure (RDA) somewhat more heavily in the overall evaluation, since outlier status with respect to RDA begins at the 25th percentile (compared, for example, to outlier status with respect to PTA, which is triggered at the 10th percentile). Also note that each measure is assessed on a cumulative basis -- so that a company with an RDA measure of -28 generates a stronger concern level than a company with RDA of -20, even though neither would trigger a Medium concern.
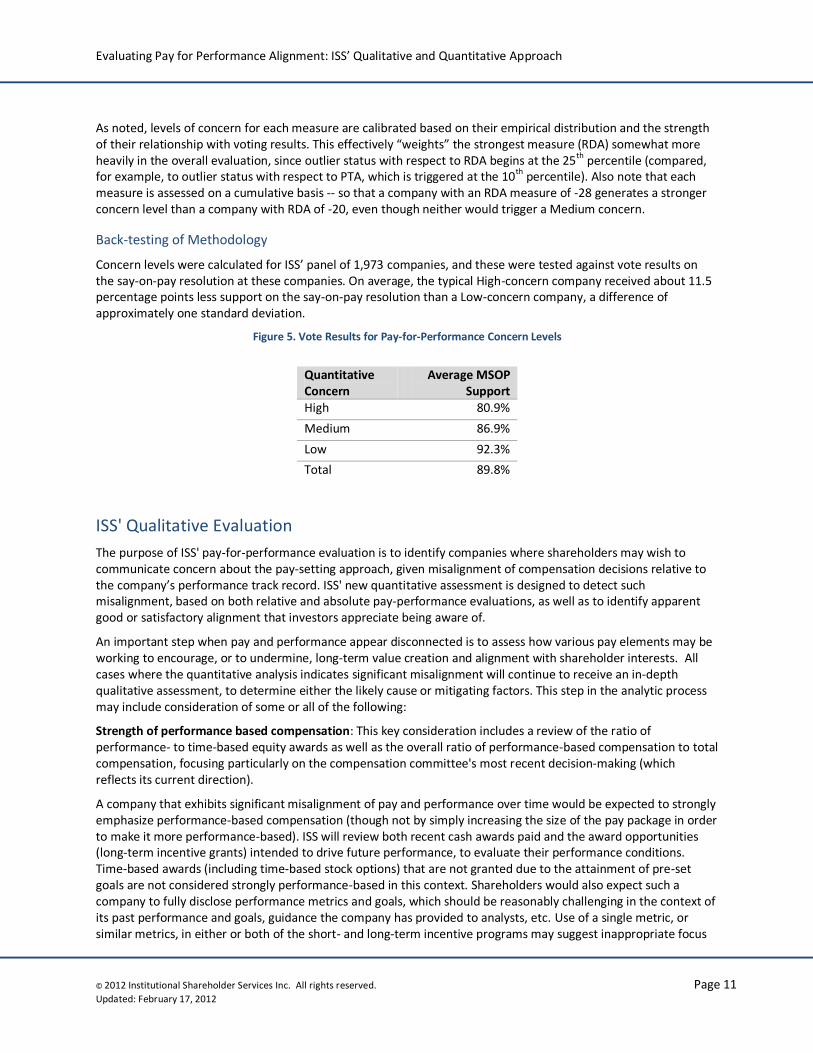
Back-testing of Methodology
Concern levels were calculated for ISS’ panel of 1,973 companies, and these were tested against vote results on the say-on-pay resolution at these companies. On average, the typical High-concern company received about 11.5 percentage points less support on the say-on-pay resolution than a Low-concern company, a difference of approximately one standard deviation.
Figure 5. Vote Results for Pay-for-Performance Concern Levels
Quantitative Concern
Average MSOP Support
High 80.9%
Medium 86.9%
Low 92.3%
Total 89.8%
ISS' Qualitative Evaluation
The purpose of ISS' pay-for-performance evaluation is to identify companies where shareholders may wish to communicate concern about the pay-setting approach, given misalignment of compensation decisions relative to the company’s performance track record. ISS' new quantitative assessment is designed to detect such misalignment, based on both relative and absolute pay-performance evaluations, as well as to identify apparent good or satisfactory alignment that investors appreciate being aware of.
An important step when pay and performance appear disconnected is to assess how various pay elements may be working to encourage, or to undermine, long-term value creation and alignment with shareholder interests. All cases where the quantitative analysis indicates significant misalignment will continue to receive an in-depth qualitative assessment, to determine either the likely cause or mitigating factors. This step in the analytic process may include consideration of some or all of the following:
Strength of performance based compensation: This key consideration includes a review of the ratio of performance- to time-based equity awards as well as the overall ratio of performance-based compensation to total compensation, focusing particularly on the compensation committee's most recent decision-making (which reflects its current direction).
A company that exhibits significant misalignment of pay and performance over time would be expected to strongly emphasize performance-based compensation (though not by simply increasing the size of the pay package in order to make it more performance-based). ISS will review both recent cash awards paid and the award opportunities (long-term incentive grants) intended to drive future performance, to evaluate their performance conditions. Time-based awards (including time-based stock options) that are not granted due to the attainment of pre-set goals are not considered strongly performance-based in this context. Shareholders would also expect such a company to fully disclose performance metrics and goals, which should be reasonably challenging in the context of its past performance and goals, guidance the company has provided to analysts, etc. Use of a single metric, or similar metrics, in either or both of the short- and long-term incentive programs may suggest inappropriate focus
Evaluating Pay for Performance Alignment: ISS’ Qualitative and Quantitative Approach
© 2012 Institutional Shareholder Services Inc. All rights reserved. Page 12
Updated: February 17, 2012
on one aspect of business results at the expense of others. If the company uses non-GAAP metrics, adjustments should be clearly disclosed (along with compelling rationale if such adjustments are nonstandard).
The company's peer group benchmarking practices: Several studies have pointed to companies' peer group benchmarking practices as a source of pay escalation that is divorced from performance considerations. Companies undertake benchmarking in order to ensure that their top management pay packages will stay competitive, in the interest of attracting and retaining key executives. While this is an important objective, there are no established standards or rules for the practice, which has been described as "more of an art than a science" by many companies. Peer selection may be influenced by many considerations. While disclosure on this issue is not robust (according to a recent analysis, only 66 percent of S&P 1500 companies clearly specify benchmark targets, and even less beyond that group), among companies that do disclose target peer group percentiles, 40 percent target above the median level for a least one pay element.
6 If a company exhibits long-term disconnect between
pay and performance, ISS closely examines its disclosed benchmarking approach to determine whether that may be a contributing factor. For example, a preponderance of self-selected peers that are larger than the subject company may drive up compensation without regard to performance. Above-median targeting may have the same effect.
Results of financial/operational metrics: If a disconnect is driven by cash pay, ISS considers the rigor of performance goals (if any) that generated the payouts. Recent (GAAP) results on metrics such as return measures and growth in revenue, profit, cash flow, etc. -- both absolute and relative to peers – may also be examined to assess the rigor of goals and whether the quantitative analysis may be anomalous (if other metrics suggest sustained superior performance). As noted above, company disclosure about the metrics, goals, and adjustments to results, should be clear and fulsome.
Special circumstances: The qualitative analysis may also consider exceptional situations, such as recruitment of a new CEO in the prior fiscal year or unusual equity grant practices (e.g., bi- or triennial awards) that may distort a quantitative analysis. We note, however, that such circumstances do not automatically invalidate other aspects of the analysis, including the quantitative results, since that methodology's long-term orientation is designed to smooth the impact of timing anomalies. Further, while shareholders may welcome a new CEO in light of lagging performance, they may nevertheless be concerned about a board that has been forced to pay dearly for outside talent but fails to appropriately link the new CEO's pay to performance improvement.
Conclusions
While most investor portfolios have yet to fully recover from the 2008-2009 market collapse, top management pay levels resumed their upward trajectory in 2010, and controversy about executive compensation continues to rage. Congress and the SEC have put the onus for monitoring it squarely in the hands of shareholders, who demonstrated through the first broad say-on-pay votes that a critical determinant of their votes is pay-for-performance alignment. Institutional investors, in particular, are approaching their responsibility carefully, recognizing that effective incentive programs are a key ingredient in the recipe for value creation. But where pay packages are clearly inefficient -- where they are providing wealth opportunities to top executives that are misaligned with shareholder return trends over time -- investors will communicate dissatisfaction.
ISS' new quantitative methodology combines two analytical perspectives – pay and performance relative to a comparison group of companies, and pay relative to absolute shareholder returns – to detect significant long-term disconnects. The comparison groups are based on a transparent methodology that reasonably accounts for company size, market cap, and general industry categorization -- not for the purpose of benchmarking pay (or picking stocks) but to evaluate whether pay is generally commensurate with market peers and performance. Extensive back-testing has validated that this two-pronged approach addresses what concerns investors. Qualitative overlays will determine whether pay-performance disconnects are being addressed with appropriately performance-based awards. While shareholders are not interested in micro-managing executive pay programs,
6 D. Cheng, Executive Pay Through A Peer Benchmarking Lens, Institutional Shareholder Services, 2011.
http://www.isscorporateservices.com/White_Paper_Request
Evaluating Pay for Performance Alignment: ISS’ Qualitative and Quantitative Approach
© 2012 Institutional Shareholder Services Inc. All rights reserved. Page 13
Updated: February 17, 2012
they have a huge stake in ensuring that they are efficient and effective. ISS' robust, transparent pay-for-performance methodology will facilitate investor evaluations of this critical aspect of corporate governance and shareholder value.
Evaluating Pay for Performance Alignment: ISS’ Qualitative and Quantitative Approach
© 2012 Institutional Shareholder Services Inc. All rights reserved. Page 14
Updated: February 17, 2012
Appendices
Appendix I. Constructing Comparison Groups
ISS constructs a comparison group of between 14 and 24 companies for each subject company covered by the Pay-For-Performance methodology. Peer groups are generally constructed with reference to the company's industry (based on GICS classification), revenue (or assets with respect to financial companies), and market value. Peer groups for all Russell 3000 companies analyzed under this methodology are constructed twice per year, based on data provided by an independent source (Research Insight Quarterly Data Download (QDD)) as of December 1 and June 1, as follows:
1. Revenue – Sum of most recent trailing 4 quarters’ revenues for each QDD date 2. Total Assets – Most recent quarter’s Total Assets for each QDD date 3. Market value – 200 day average price X shares outstanding for each QDD
The process for selecting comparison companies is as follows:
Determine a potential comparison universe for the subject company. ISS chooses companies in ISS’ ExecComp Analytics database in the same 2-digit GICS universe as the subject, between 0.45 times and 2.1 times the subject company’s annual revenues (assets for financial companies), and with market capitalizations of between 0.2 times and 5 times the subject company. The ISS ExecComp Analytics database incorporates the constituents of the Russell 3000 index, supplemented by the publicly traded peers disclosed by Russell 3000 companies in their proxies for a total of more than 4000 companies.
Select industry-close comparators from the target universe. ISS selects companies from the comparison universe that are in the subject company’s 6-digit GICS category, first selecting the companies closest in size, while where possible alternating between companies larger and smaller than the subject company so as to maintain the subject at or near the median of the chosen comparison group. If the comparison group reaches the minimum 14 members, it is considered complete; up to 24 comparison companies can be selected from the 6-digit GICS category.
If 14 comparison group members are not selected from the companies in the universe that share the subject company’s 6-digit GICS category, the process is repeated with companies in the comparison universe that share the company’s 4-digit GICS category, maintaining the company at the median position where possible, until 14 comparison companies are selected; if 14 comparison companies cannot be selected using the 4-digit GICS, then the process is repeated using the 2-digit GICS category, until 14 companies are selected.
Supplemental methodology for companies with fewer than 14 comparison companies selected. For some companies, the standard comparison-group methodology fails to identify the minimum of 14 companies. These are handled in one of two ways:
o "Super-mega" non-financial companies (over $50Bn in revenue, and at least $30Bn market capitalization). Approximately 25 non-financial companies within the Russell 3000 index have insufficient industry peers generated by the standard methodology because they are unique in being among the largest public companies and have very few (and in some cases no) industry peers close to their size. Since company size correlates strongly with top executive pay levels, these firms will comprise a special peer group of "super-mega" companies for purposes of the quantitative analysis; i.e., because they have few or no industry peers within a reasonable size range, and are also all mature companies in terms of market value, they will be compared to one another for the quantitative pay-for-performance evaluation. Industry specific performance will also be considered in any resulting qualitative review.
ISS estimates there are approximately 25 companies in this group.
o Other companies having fewer than 14 generated peers. These insufficient peer groups will be expanded by relaxing the revenue (but not market cap) parameters in the peer group selection process, while retaining peers selected under the basic methodology. Additional peer companies
Evaluating Pay for Performance Alignment: ISS’ Qualitative and Quantitative Approach
© 2012 Institutional Shareholder Services Inc. All rights reserved. Page 15
Updated: February 17, 2012
that are both larger and smaller will be added in order to maintain the subject company as close to the median size level as possible.
Exceptional cases. In exceptional cases, ISS will adjust a company’s comparison groups where certain selected comparators appear to be inappropriate (e.g., bankruptcy of a comparison company).
Frequently Asked Questions About Comparison Groups
Why does ISS select 14-24 companies?
The Relative Degree of Misalignment calculation measures percentile ranks of pay and performance for the subject company. The larger the comparison group, the finer the resolution of the percentile ranks (for instance: in a comparison group of 24, percentile ranks move in about 4-point increments, whereas they move in 10-point increments for a group of ten). We believe that using 14-company comparison groups provides sufficient resolution for the percentile measure, while also allowing us to select comparison groups for the vast majority of companies within the methodology’s size and industry constraints.
Why does ISS use .5x – 2x revenue/asset range (rounded to nearest tenth)?
There is an extensive literature that demonstrates a strong correlation between company size and CEO pay. Among executive compensation practioners, a size range of 0.5 times to 2 times size (measured by revenue or assets, as appropriate for the company’s industry) has emerged as a standard of practice. ISS has slightly expanded this range to avoid missing potential peers that are very close to this standard range. Finally, the broader (0.2x-5x) market capitalization bounds are intended to ensure that companies in the potential comparison universe from a size standpoint are not wildly divergent from the subject company.
Why does ISS use GICS?
GICS is one of the most broadly used industry classification schemes for investment professionals worldwide. Co-developed by two of the most prominent index providers (MSCI and Standard & Poors), its classifications are used by investors across the investment process – from stock selection to benchmarking to monitoring.
Why does ISS not use company peer groups?
The comparison companies selected by ISS are not intended to serve the function that a “peer group” does for a board of directors when it benchmarks executive pay. Boards use peer groups to help determine an appropriate pay package for attracting and retaining executive talent. ISS’ pay-for-performance analysis, however, is not intended to benchmark pay directly, nor is it intended to help evaluate the effectiveness of a pay package in attracting and retaining executives, nor is it intended to serve as a list of “competitors” against which a company might compare itself, or even that an investor might compare in picking individual stocks.
The ISS comparison groups are intended, rather, to help evaluate the alignment of executive pay and company performance that results from a board of directors’ pay decisions over time. These comparison groups are constructed to help determine whether a company CEO’s pay and pay opportunities – relative to similarly situated investment opportunities -- has been commensurate with the performance that the company achieved -- again, relative to similarly situated investment opportunities.
What peer group does ISS use if the standard methodology does not produce at least 14 comparator companies? (updated February 2012)
ISS' standard peer group construction methodology generally generates all or a majority of the peer companies used for relative comparisons in the quantitative component of the pay-for-performance analysis; however, minimum 14-member peer groups cannot be generated for a small proportion of companies (approximately 200). In these cases, additional customization is applied to ensure that each analysis is based on a robust comparison group. Please note the following conditions with respect to these cases: 1) Minimum peer group size: Slightly smaller peer groups (but no fewer than 12 companies) may be utilized
in some cases.
Evaluating Pay for Performance Alignment: ISS’ Qualitative and Quantitative Approach
© 2012 Institutional Shareholder Services Inc. All rights reserved. Page 16
Updated: February 17, 2012
2) Peers for 41 "super-mega" companies. These companies are unique in their industry due to large size
(revenue/assets >$50B and MV > $30B as of the Dec. 1, 2011 QDD). ISS has divided these companies into
three "super-mega" groups that may be viewed as peers for both pay and performance, as follows.
Group 1: 16 companies in the Industrial, Energy, Materials, Technology, and Telecom GICS
sectors – the peer group for each Group 1 company will be the other companies in the group.
Group 2: 15 companies in the Consumer and Health Care GICS sectors -- the peer group for each
Group 2 company will be the other companies in the group.
Group 3: the 10 largest financial companies (by assets) in the S&P 500 index – the peers for each
Group 3 company will be the other companies in the group, plus the three next largest financial
companies in the S&P index (although the standard peer group for each of those three will apply
for their analyses).
3) In the case of approximately 160 additional companies with insufficient peer groups based on the
standard methodology, ISS expanded the group using the following methodology:
Retain all peers selected in standard methodology;
Continue to maintain the peer company "pool" to include only companies within at least the
same 2-digit GICS, with MV between 0.2X and 5X the subject company MV;
Relax revenue/asset boundaries (.25x to 4x) (beginning within the 6-digit GICS group), to add
peers that are closest in revenue/assets to subject company, with the goal of adding one
additional larger peer for each additional smaller peer selected, in order to maintain the subject
company as close to the median size position as possible;
In cases of multiple peers very close in revenue/assets, select those in the smallest GICS
grouping. Select until reaching a minimum of 14 peers;
In cases where fewer than three peer companies are larger (or smaller) than the subject
company, eliminate the two smallest (or largest) peers from the revised group, to achieve a
better balance of larger and smaller companies while maintaining at least 12 peers.
Evaluating Pay for Performance Alignment: ISS’ Qualitative and Quantitative Approach
© 2012 Institutional Shareholder Services Inc. All rights reserved. Page 17
Updated: February 17, 2012
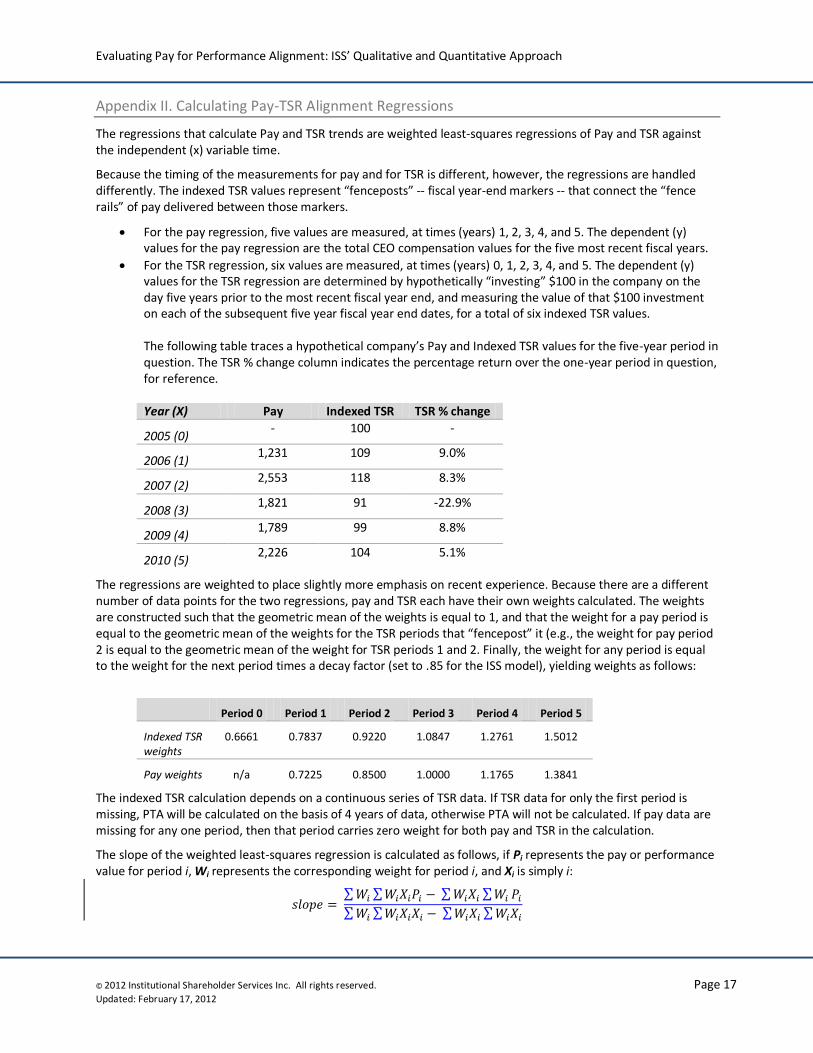
Appendix II. Calculating Pay-TSR Alignment Regressions
The regressions that calculate Pay and TSR trends are weighted least-squares regressions of Pay and TSR against the independent (x) variable time.
Because the timing of the measurements for pay and for TSR is different, however, the regressions are handled differently. The indexed TSR values represent “fenceposts” -- fiscal year-end markers -- that connect the “fence rails” of pay delivered between those markers.
For the pay regression, five values are measured, at times (years) 1, 2, 3, 4, and 5. The dependent (y) values for the pay regression are the total CEO compensation values for the five most recent fiscal years.
For the TSR regression, six values are measured, at times (years) 0, 1, 2, 3, 4, and 5. The dependent (y) values for the TSR regression are determined by hypothetically “investing” $100 in the company on the day five years prior to the most recent fiscal year end, and measuring the value of that $100 investment on each of the subsequent five year fiscal year end dates, for a total of six indexed TSR values. The following table traces a hypothetical company’s Pay and Indexed TSR values for the five-year period in question. The TSR % change column indicates the percentage return over the one-year period in question, for reference. Year (X) Pay Indexed TSR TSR % change
2005 (0) - 100 -
2006 (1) 1,231 109 9.0%
2007 (2) 2,553 118 8.3%
2008 (3) 1,821 91 -22.9%
2009 (4) 1,789 99 8.8%
2010 (5) 2,226 104 5.1%
The regressions are weighted to place slightly more emphasis on recent experience. Because there are a different number of data points for the two regressions, pay and TSR each have their own weights calculated. The weights are constructed such that the geometric mean of the weights is equal to 1, and that the weight for a pay period is equal to the geometric mean of the weights for the TSR periods that “fencepost” it (e.g., the weight for pay period 2 is equal to the geometric mean of the weight for TSR periods 1 and 2. Finally, the weight for any period is equal to the weight for the next period times a decay factor (set to .85 for the ISS model), yielding weights as follows:
Period 0 Period 1 Period 2 Period 3 Period 4 Period 5
Indexed TSR weights
0.6661 0.7837 0.9220 1.0847 1.2761 1.5012
Pay weights n/a 0.7225 0.8500 1.0000 1.1765 1.3841
The indexed TSR calculation depends on a continuous series of TSR data. If TSR data for only the first period is missing, PTA will be calculated on the basis of 4 years of data, otherwise PTA will not be calculated. If pay data are missing for any one period, then that period carries zero weight for both pay and TSR in the calculation.
The slope of the weighted least-squares regression is calculated as follows, if Pi represents the pay or performance value for period i, Wi represents the corresponding weight for period i, and Xi is simply i:
Evaluating Pay for Performance Alignment: ISS’ Qualitative and Quantitative Approach
© 2012 Institutional Shareholder Services Inc. All rights reserved. Page 18
Updated: February 17, 2012
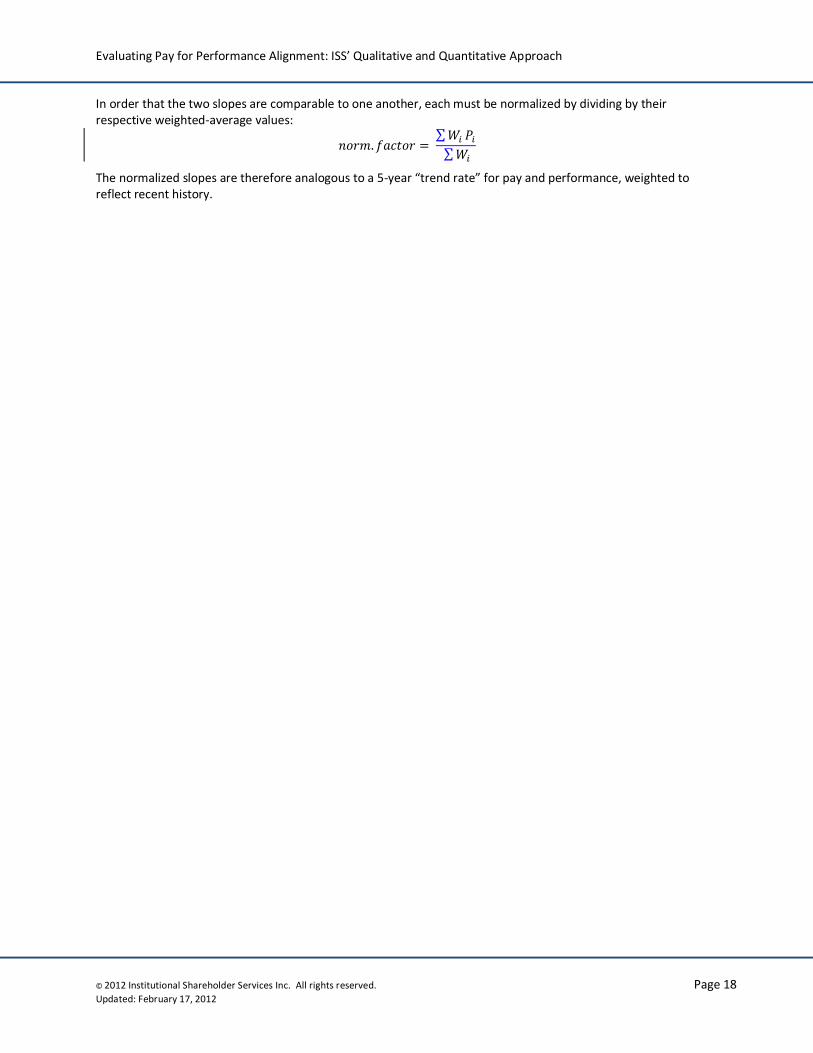
In order that the two slopes are comparable to one another, each must be normalized by dividing by their respective weighted-average values:
The normalized slopes are therefore analogous to a 5-year “trend rate” for pay and performance, weighted to reflect recent history.
Evaluating Pay for Performance Alignment: ISS’ Qualitative and Quantitative Approach
© 2012 Institutional Shareholder Services Inc. All rights reserved. Page 19
Updated: February 17, 2012
This report is provided by Institutional Shareholder Services Inc. ("ISS"), an indirect wholly-owned subsidiary of MSCI Inc. ("MSCI"). MSCI is a publicly traded company on the NYSE (Ticker: MSCI). As such, MSCI is not generally aware of whom its stockholders are at any given point in time. ISS has, however, established policies and procedures to restrict the involvement of any of MSCI's non-employee stockholders, their affiliates and board members in the content of ISS' analyses. Neither MSCI's non-employee stockholders, their affiliates nor MSCI's non-management board members are informed of the contents of any of ISS analyses prior to their publication or dissemination.
Issuers mentioned in this document may have purchased self-assessment tools and publications from ISS Corporate Services, Inc. (“ICS”), a wholly-owned subsidiary of ISS, or ICS may have provided advisory or analytical services to the issuer. No employee of ICS played a role in the preparation of this document. Any issuer that is mentioned in this document may be a client of ISS, ICS, ISS’ parent company, MSCI Inc., or a subsidiary of MSCI Inc., or may be the parent of, or affiliated with, a client of ISS, ICS, MSCI Inc., or another MSCI Inc. subsidiary. If you are an ISS institutional client, you may inquire about any issuer's use of products and services from ICS by emailing [email protected].
One, or more, of the proponents of a shareholder proposal at an upcoming meeting may be a client of ISS, ICS, ISS’ parent company, MSCI Inc., or a subsidiary of MSCI Inc., or may be the parent of, or affiliated with, a client of ISS, ICS, MSCI Inc., or another MSCI Inc. subsidiary. None of the sponsors of any shareholder proposal(s) played a role in preparing this report.
ISS may in some circumstances afford issuers, whether or not they are clients of ICS or any other MSCI subsidiary, the right to review draft research analyses so that factual inaccuracies may be corrected before the report and recommendations are finalized. Control of research analyses remains, at all times, with ISS.
This document and all of the information contained in it, including without limitation all text, data, graphs, charts (collectively, the “Information”) is the property of ISS, its subsidiaries, or in some cases third party suppliers. The Information may not be reproduced or disseminated in whole or in part without prior written permission of ISS.
The Information has not been submitted to, nor received approval from, the United States Securities and Exchange Commission or any other regulatory body. None of the Information constitutes an offer to sell (or a solicitation of an offer to buy), or a promotion or recommendation of, any security, financial product or other investment vehicle or any trading strategy, and ISS does not endorse, approve or otherwise express any opinion regarding any issuer, securities, financial products or instruments or trading strategies.
The user of the Information assumes the entire risk of any use it may make or permit to be made of the Information.
ISS MAKES NO EXPRESS OR IMPLIED WARRANTIES OR REPRESENTATIONS WITH RESPECT TO THE INFORMATION AND EXPRESSLY DISCLAIMS ALL IMPLIED WARRANTIES (INCLUDING, WITHOUT LIMITATION, ANY IMPLIED WARRANTIES OF ORIGINALITY, ACCURACY, TIMELINESS, NON-INFRINGEMENT, COMPLETENESS, MERCHANTABILITY AND FITNESS FOR A PARTICULAR PURPOSE) WITH RESPECT TO ANY OF THE INFORMATION. .
Without limiting any of the foregoing and to the maximum extent permitted by law, in no event shall ISS have any liability regarding any of the Information for any direct, indirect, special, punitive, consequential (including lost profits) or any other damages even if notified of the possibility of such damages. The foregoing shall not exclude or limit any liability that may not by applicable law be excluded or limited.