EVALUATING METHODS FOR IMPROVING NITROGEN USE EFFICIENCY...
110
EVALUATING METHODS FOR IMPROVING NITROGEN USE EFFICIENCY IN CORN AND HARD RED WINTER WHEAT By ROGER KEITH TEAL Bachelor of Science University of Tennessee at Martin Martin, Tennessee 2000 Master of Science Oklahoma State University Stillwater, Oklahoma 2002 Submitted to the Faculty of the Graduate College of the Oklahoma State University in partial fulfillment of the requirements for the Degree of DOCTOR OF PHILOSOPHY May, 2005
Transcript of EVALUATING METHODS FOR IMPROVING NITROGEN USE EFFICIENCY...

EVALUATING METHODS FOR IMPROVING
NITROGEN USE EFFICIENCY IN CORN AND HARD
RED WINTER WHEAT
By
ROGER KEITH TEAL
Bachelor of Science University of Tennessee at Martin
Martin, Tennessee 2000
Master of Science Oklahoma State University
Stillwater, Oklahoma 2002
Submitted to the Faculty of the Graduate College of the
Oklahoma State University in partial fulfillment of the requirements for
the Degree of DOCTOR OF PHILOSOPHY
May, 2005

ii
EVALUATING METHODS FOR IMPROVING
NITROGEN USE EFFICIENCY IN CORN AND HARD
RED WINTER WHEAT
Dissertation Approved:
Dr. William Raun Dissertation Adviser
Dr. Gordon Johnson
Dr. John Solie
Dr. Hailin Zhang
Dr. Gordon Emslie Dean of the Graduate College

iii
ACKNOWLEDGEMENTS First of all I would like to thank God for giving me the strength and dedication to
complete this degree, fore without His love and patience this work would not
have been possible. I am also very grateful to my fiancée, Charity Sizelove,
and my family, who’s support and encouragement made my efforts much more
effective to this research. I would also like to think the Department of Plant and
Soil Sciences for the opportunity to work and study at Oklahoma State
University. I would especially like to thank the Soil Fertility Project for their
continued support and aid in accomplishing my goals and most of all for their
friendship. Specifically, I would like to thank the following graduate and
undergraduate members of the Soil Fertility Project: Robert Mullen, Wade
Thomason, Kyle Freeman, Kent Martin, Brian Arnall, Kefyalew Girma, Jason
Lawles, Brenda Tubana, Chung Byungkyun, Shambel Moges, Paul Hodgen,
Keri Brixey, Aaron Witt, and Starr Holtz. To my committee members, Dr.
Gordon Johnson, Dr. John Solie, and Dr. Hailin Zhang, I thank you for your
assistance and guidance throughout my pursuit of this degree. Finally, but
certainly not least, I would like to thank my major adviser Dr. Bill Raun for:
allowing me to be a part of the project, an incredible amount of patience, and
the chance to make a difference.

iv
TABLE OF CONTENTS
Chapter Page
I. INFLUENCE OF HYBRID, POPULATION, AND NITROGEN RATE ON SPECTRAL PREDICTION OF CORN GRAIN YIELD
Abstract....................................................................................................1 Introduction ..............................................................................................2 Objective................................................................................................13 Materials and Methods...........................................................................13 Crop Years 2002 and 2003 Experimental sites ....................................................................13 Treatment design .....................................................................13 Sensing method .......................................................................14 Harvest method ........................................................................14 Crop Year 2004 Experimental sites ....................................................................14 Treatment design .....................................................................15 Sensing method .......................................................................15 Harvest method ........................................................................16 Data Analysis.................................................................................16 Results and Discussion..........................................................................17 Hybrid and plant population ...........................................................17 Nitrogen response .........................................................................21 Grain yield prediction .....................................................................27 Conclusions ...........................................................................................31
References ............................................................................................33 II. EFFECT OF TILLAGE AND ANHYDROUS AMMONIA APPLICATION ON
NITROGEN USE EFFICIENCY OF HARD RED WINTER WHEAT
Abstract..................................................................................................61 Introduction ............................................................................................62 Objective................................................................................................69 Materials and Methods...........................................................................69 Experimental sites .........................................................................69 Treatment design...........................................................................70 Application method ........................................................................70

v
Harvest method .............................................................................71 Analytical methods.........................................................................72 Results and Discussion..........................................................................72 Grain yield......................................................................................72 Grain N uptake...............................................................................73 Nitrogen use efficiency ..................................................................75 Additional parameters ...................................................................76 Conclusions ...........................................................................................79
References ............................................................................................81

vi
LIST OF TABLES
CHAPTER I Table Page
1. Initial surface (0-15cm) soil test results prior to experiment initiation at Greenlee Farm, Haskell, and LCB, OK...............................................41
2. Planting, fertilizing, and harvest dates at Greenlee Farm, Haskell, and LCB, OK, 2002-04............................................................................41
3. Sensing dates by growth stage at Greenlee Farm, Haskell, and
LCB, OK, 2002-04 ..................................................................................42
4. Corn grain yield treatment means by location, Haskell and LCB, OK, 2002.................................................................................................43
5. Corn grain yield treatment means by location, Haskell and LCB,
OK, 2003.................................................................................................43
6. Corn grain yield treatment means by location, Greenlee Farm, Haskell, and LCB, OK, 2004 ...................................................................44
7. Nitrogen Use Efficiency treatment means by location, Haskell and
LCB, OK, 2002........................................................................................45
8. Nitrogen Use Efficiency treatment means by location, Haskell and LCB, OK, 2003........................................................................................45
9. Nitrogen Use Efficiency treatment means by location, Greenlee
Farm, Haskell, and LCB, OK, 2004.........................................................46
CHAPTER II
1. Initial surface (0-15 cm) and sub-soil (15-30 cm) test results prior to
experiment initiation at Efaw and Lahoma OK........................................88

vii
2. Planting, fertilizer, and harvest dates at Efaw and Lahoma, OK, 2000-04...................................................................................................88
3. Grain yield treatment means and analysis of variance at Efaw,
2001-2004...............................................................................................89
4. Grain yield treatment means and analysis of variance at Lahoma, 2001-2004...............................................................................................90
5. Grain N uptake treatment means and analysis of variance at Efaw, 2001-2004...............................................................................................91
6. Grain N uptake treatment means and analysis of variance at Lahoma, 2001-2004................................................................................92
7. Nitrogen Use Efficiency treatment means and analysis of variance at Efaw, 2001-2004.................................................................................93
8. Nitrogen Use Efficiency treatment means and analysis of variance at Lahoma, 2001-2004............................................................................94
9. Soil nitrate N treatment means from post-harvest sampling in 2002
and 2004 at Efaw and Lahoma, OK........................................................95
10. Soil ammonium N treatment means from post-harvest sampling in 2002 and 2004 at Efaw and Lahoma, OK...............................................96

viii
LIST OF FIGURES
CHAPTER I Figure Page
1. Effect of plant population on red NDVI (RNDVI) over two sensor readings in three hybrids at Haskell and LCB, OK, 2002........................47
2. Effect of plant population on RNDVI over time in three hybrids at
Haskell, OK, 2003...................................................................................47
3. Relationship between RNDVI and plant population of three hybrids at the V8 growth stage over two locations with 0N treatments removed fitted to a linear-plateau model, 2003.......................................48
4. Relationship between RNDVI and plant population of three hybrids
at the R2 growth stage over two locations with 0N treatments removed fitted to a linear-plateau model, 2003.......................................48
5. Effect of plant population on GNDVI over time in the 168 kg N ha-1
pre-plant treatment of the 113-day hybrid at Haskell, OK, 2004 .............49
6. Effect of plant population on RNDVI over time in the 168 kg N ha-1 pre-plant treatment of the 113-day hybrid at Haskell, OK, 2004 .............49
7. Relationship between RNDVI and plant population for the 99-day
hybrid at the V8 growth stage over three locations with 0N treatments removed fitted to a linear-plateau model, 2004.....................50
8. Relationship between RNDVI and plant population for the 113-day
hybrid at the V8 growth stage over three locations with 0N treatments removed fitted to a linear-plateau model, 2004.....................50
9. Effect of N rate on RNDVI over two sensor readings in the high
plant population of the 113-day hybrid at Haskell, OK, 2002..................51
10. Relationship between RIRNDVI measured at the R1 growth stage and RIHARVEST over two locations, 2002 .........................................................51
11. Effect of N rate on RNDVI over time in the high plant population of
the 104-day hybrid at Haskell, OK, 2003 ................................................52 12. Relationship between RIRNDVI measured at the R2 growth stage and
RIHARVEST over two locations, 2003 .........................................................52
13. Effect of N rate on GNDVI over time in the 66,690 plants ha-1 plant population of the 113-day hybrid at Haskell, OK, 2004...........................53

ix
14. Effect of N rate on RNDVI over time in the 66,690 plants ha-1 plant
population of the 113-day hybrid at Haskell, OK, 2004...........................53
15. Relationship between RIGNDVI measured at the V8 growth stage and RIHARVEST over three locations, 2004.......................................................54
16. Relationship between RIRNDVI measured at the V8 growth stage and
RIHARVEST over three locations, 2004.......................................................54
17. Relationship between grain yield and RNDVI in the R1 growth stage over two locations, 2002 ...............................................................55
18. Relationship between RNDVI and RCV derived from RNDVI in the
R1 growth stage over two locations, 2002..............................................55
19. Relationship between grain yield and RNDVI of the V8 growth stage over two locations, 2003 ...............................................................56
20. Relationship between grain yield and RNDVI of the R2 growth
stage over two locations, 2003 ...............................................................56
21. Relationship between RNDVI and RCV derived from RNDVI of the V8 growth stage over two locations, 2003 ..............................................57
22. Relationship between RNDVI and RCV derived from RNDVI of the
R2 growth stage over two locations, 2003..............................................57
23. Relationship between corn grain yield and RNDVI at V8 growth stage for the 99-day hybrid over three locations, 2004...........................58
24. Relationship between corn grain yield and RNDVI at V8 growth
stage for the 113-day hybrid over three locations, 2004.........................58
25. Relationship between corn grain yield and RNDVI at R4 growth stage for the 99-day hybrid over three locations, 2004...........................59
26. Relationship between corn grain yield and RNDVI at R4 growth stage for the 113-day hybrid over three locations, 2004.........................59
27. Relationship between RNDVI and RCV derived from RNDVI at V8
growth stage for two hybrids over three locations, 2004.........................60
28. Relationship between RNDVI and RCV derived from RNDVI at R4 growth stage for two hybrids over three locations, 2004.........................60

x
CHAPTER II Figure Page
1. Knife applicator.......................................................................................97
2. V-blade applicator...................................................................................97
3. Effect of tillage and N method on soil compaction over four years for depths 0-30 cm at Lahoma, OK.........................................................98
4. Effect of tillage and N method on soil compaction over four years
for depths 0-30 cm at Efaw, OK..............................................................98

1
INFLUENCE OF HYBRID, POPULATION, AND NITROGEN RATE ON
SPECTRAL PREDICTION OF CORN GRAIN YIELD
ABSTRACT
With the escalation in environmental concern and cost of production,
researchers have recently focused on investigating more efficient means of
increasing grain yield while reducing fertilizer use. This study evaluated spectral
reflectance, measuring the normalized difference vegetation index (NDVI) with a
GreenSeeker™ Hand Held optical reflectance sensor as a function of corn (Zea
mays L.) hybrid, plant population, and fertilizer N rate. A linear-plateau model
existed between NDVI and plant population and the critical population at which
NDVI was no longer affected occurred between 55,000 and 60,000 plants ha –1
for the later maturing hybrids and closer to 70,000 plants ha –1 for the earliest
maturing hybrids. Vegetative response index (RINDVI) peaked between V8 and
V9 at responsive locations each year and was highly correlated with RI at harvest
(RIHARVEST) in 2004. Regression analysis indicated that the V8 growth stage was
most effective growth stage to predict grain yield, presumably because the
highest variability in NDVI occurs at the V8 growth stage. Hybrid maturity did not
effect grain yield prediction at V8, but reproductive growth stage yield prediction
will require hybrid maturity categorization. Comparisons made between the
GNDVI and RNDVI relationships with grain yield in 2004 showed no significant
differences over three locations. However, separate yield prediction models for
GNDVI and RNDVI will be required, since GNDVI values are about 10% lower
than RNDVI and would underestimate yield potential using the same model.

2
INTRODUCTION
As environmental concerns continue to escalate and agriculture
production becomes more scrutinized, new fertilizer application practices will
continue to be researched with the goal of increasing fertilizer use efficiency.
Currently, the Environmental Protection Agency (EPA) is reporting that
watersheds in all 48 states of the continental U.S. tested for nitrate nitrogen
(NO3-) groundwater contamination levels above the maximum contaminant level
(MCL), of which Oklahoma is ranked 14th (EPA, 1999a). Production of cereal
grains has largely been held responsible for this groundwater contamination, in
particular corn (Zea mays L.) production, where high nitrogen (N) rates have
been applied in high yielding environments. However, most of the corn-belt
states have lower NO3- groundwater levels than surrounding states with minimal
corn acreage. Excessive N applications to cereal grain crops continue to pollute
the environment, increasing human health risk and costing farmers needless
additional expense along with negative publicity. This exemplifies the need for
continued research to improve fertilizer use efficiency. As a function of
increasing nitrogen use efficiency (NUE) research, this study was conducted to
evaluate the potential of using a spectral reflectance normalized difference
vegetation index (NDVI) to determine N response and predict grain yield in corn.
The effects of corn hybrid, plant population, and fertilizer N rate on NDVI were
also evaluated to establish what adaptations might be necessary to use NDVI
over a wide range of field conditions.
LITERATURE REVIEW

3
Nitrogen contamination of ground water has been linked to ill effects in
humans. Short-term exposure to nitrate (NO3-) through ingestion can cause a
serious illness in infants due to the conversion of NO3- to nitrite (NO2
-) by the
body, which can interfere with the oxygen-carrying capacity of the child’s blood
(EPA, 1999b). Most cases of infant methemoglobinemia (blue baby syndrome)
are associated with exposure to NO3- in drinking water used to prepare infants'
formula at levels >20 mg/L of nitrate-nitrogen (Bosch et al., 1950; Walton, 1951).
With symptoms including shortness of breath and blueness of the skin, this can
be an acute condition in which health deteriorates rapidly over a period of days
(EPA, 1999b). Lifetime exposure at levels above the maximum contaminant
level (MCL) of 10 mg L-1 nitrate-N results in: diuresis, increased starchy deposits,
and hemorrhaging of the spleen (EPA, 1999b). Shallow groundwater unaffected
by human activities usually contains less than 2 mg L-1 of nitrate-N (Mueller and
Helsel, 1996).
Although N contamination of drinking water has the most direct impact on
human health, N runoff from watersheds has had the greatest impact on the
environment. Hypoxia and anoxia has severely stressed every major estuary
and coastal marine ecosystem around the world to the point of threshold of
change or collapse resulting in loss of fisheries, loss of biodiversity, and
alteration of food webs (Diaz, 2001). While hypoxia (the condition of low
dissolved oxygen, below 2 mg O2 L-1) and anoxia (complete absence of oxygen)
have existed throughout geological time, their appearance in shallow coastal and
estuary areas has been increasing, largely credited to the increase in

4
eutrophication (Diaz, 2001). Excess nutrient loading has been linked to
eutrophication, the production of excess organic matter (Nixon, 1995; Howarth et
al., 1996). Howarth et al. (1996) concluded that the distribution of hypoxic zones
around the world were clearly associated with developed watersheds or coastal
population centers that deliver large quantities of nutrients, most notable being N,
universally accepted as a major component of organic matter. Goolsby et al.
(2001) reported that the annual total N flux to the Gulf of Mexico for 1980-1996
was 1,568,000 t yr-1, which approximately tripled in the last 30 years, particularly
increasing between 1970 and 1983. They went further to say that during wet
years the N flux can increase as much as 50% due to flushing of NO3-
accumulated in the soils, predominantly in southern Minnesota, Iowa, Illinois,
Indiana, and Ohio (the Corn Belt), where the basins yield 1500 to more than
3100 kg N km-2 yr-1 to streams, several times the N yield outside of this region.
Raun and Johnson (1999) reported worldwide NUE estimates to be
approximately 33%, with developing countries estimated at 29% and developed
countries at 42%. As a result, N fertilizer losses were valued at about $15.9
billion dollars annually, which as of August of 2001 has increased to $20 billion
dollars annually with the price of N fertilizer nearly doubling due to the shortages
of natural gas (Raun et al., 2002). There are several paths in which N can be
lost in the N cycle, dependent heavily on the crop and environmental conditions
surrounding it. In corn for instance, the majority of the N lost has been attributed
to the plant itself via ammonia (NH3) loss through the leaves, ranging between 52
to 73% (Francis et al., 1993) as compared to wheat (Triticum aestivum L.), which

5
typically loses only about 21% through the plant (Harper et al., 1987). Hilton et
al. (1994) evaluated losses in corn from 10% in conventional tillage to 22% in no-
till due to denitrification, which occurs in cool, wet soil environments that are
typical of that in early spring of the major corn producing regions of the United
States. Surface runoff losses have been reported to range from 1 to 13%
depending on tillage system and application rate and method (Blevins et al.,
1996; Chichester and Richardson, 1992). Drury et al. (1996) measured N losses
up to 23 % of a 113 kg N ha-1 rate applied to their plots due to tile drainage,
considerably lower for that region, and insinuated that even higher levels of N
could be lost in the higher applications characteristic of that area.
Owens et al. (2000) and Kanwar et al. (1997) reported that using crop
rotation with legume crops reduced nitrate leaching over continuous corn
production, by reducing the amount of N needed to be supplied to maintain high
yield production. Precipitation use efficiency was higher for corn grown in
rotation rather than for continuous corn, leading to potentially increased NUE
from higher yielding crops (Varvel, 1994). Wienhold et al. (1995) supported this
principle by detecting that increased water use efficiency (WUE) brought forth by
supplemental irrigation in semiarid regions increased NUE via greater N
requirements of higher yielding crops. Eghball and Maranville (1991) agreed
when they reported a positive correlation between WUE and NUE in corn
production. Norwood and Currie (1996) reported higher grain yields in dryland
corn production under no-till compared to conventional tillage and that no-till is
essential for adequate yields in dry years and can still increase yields in more

6
favorable climatic conditions. Furthermore, Eckert and Martin (1994) found that
plant population had no influence on N uptake in no-till and that N uptake was
directly related to yield in corn stressed by late planting.
Tillage comparisons showed that no-till enhanced N immobilization and
reduced nitrification rates when compared to conventional-till (Doran, 1980;
Stinner et al., 1983), often resulting in less nitrate leaching (Elliott et al., 1986;
Lamb et al., 1985) and leaving less nitrate in the soil profile (Fenster and
Peterson, 1979; Dowdell and Cannell, 1975). Although there are lower nitrate
levels in soil profiles in no-till systems, studies have shown that nitrate has been
found deeper in the profiles of no-till soils (Eck and Jones, 1992) agreeing with
the findings of Edwards et al. (1990) that no-till improved soil drainage. This
suggests that while no-till has the potential to increase N uptake from the soil, the
improved drainage associated with no-till may actually increase N movement
lower in the soil profile. Rice and Smith (1982) and Rodriguez and Giambiagi
(1995) found that no-till enhances denitrification, because of the increase in soil
water supply commonly occurring in no-till, reducing aerobic activity in the soil.
Banding N increased grain yield and grain N uptake as much as 21% in
corn over broadcasting preplant N when both systems were followed by the
same midseason N applications, suggesting that placement of N close to the
seed could reduce the amount of preplant N needed to maintain high yields
(Lehrsch et al., 2000). Diez et al. (1994) reduced nitrate leaching under irrigated
corn using controlled release N fertilizers to improve NUE. Pan et al. (1984)
stated that high-yielding genotypes were unable to absorb NO3- during ear

7
development, which limited yields otherwise increased by supplies of ammonium
(NH4). Baker and Timmons (1994) along with Yadav (1997) found that splitting
application of N throughout the season improved NUE. Crop rotation, tillage and
N application methods have been generally accepted to improve NUE, but none
of them have shown the potential of increasing NUE as effectively as in-season
grain yield prediction. With accurate grain yield prediction, topdress N rates can
be adjusted to maintain the predicted yield and maximize NUE. Raun et al.
(2002) increased NUE greater than 15% (> 50% NUE) using an in-season yield
prediction algorithm in dryland winter wheat production.
Traditionally, N application rates have been made based on grain yield
goals determined from a recent 5-year crop yield average increased typically by
10 to 30% to assure adequate N for above average growing conditions (Johnson,
1991; Dahnke et al., 1988). However, setting unrealistic yield goals and not
accounting for yield variation between fields and within a field has led to
consistent, excessive N application. As a result, some fields have enough
inorganic N in the soil in semi-arid regions to supply adequate N for multiple
years of cereal crop production. Dryland winter wheat research has shown that
the percent increase in grain yield goal over the 5-year average should be based
on the amount of moisture available to the crop either at planting (Rehm &
Schmitt, 1989), or the amount of stored soil water available at depths up to 1.5 m
in areas where water is limiting (Black & Bauer, 1988).
As split applications of N became more popular, different methods have
been used to measure early season fertilizer use, as a means of deciding how

8
much more N fertilizer would be needed to meet the predetermined grain yield
goal. Several researchers looked at in-season soil test of NO3-N at a depth of 30
cm, known as presidedress NO3-N test (PSNT). Research from Vermont showed
that use of a PSNT reduced N rates without reducing grain yields in corn by
setting a N application limit, with no N sidedress applications needed when the
PSNT is above 25 mg kg-1 NO3-N (Magdoff et al., 1984; Durieux et al., 1995).
While the PSNT worked well for the northeastern USA, some adjustments were
made to the PSNT for the semi-arid regions under irrigation, particularly reducing
the no N application limit to about 15 mg kg-1 NO3-N (Spellman et al., 1996). The
PSNT test was further refined in corn production by Bundy and Andraski (1995),
when they reported that classifying soils into two categories medium and high
yield potential determined by: depth of root zone, water holding capacity, and
length of growing season, when the test values were considered in the N
responsive range. While the PSNT improved NUE, it could not produce these
results consistently, even when other soil properties were evaluated in tandem
with PSNT.
Since early research showed that cereal crops responded to N with
favorable yield increases year after year, many scientists believed that plants
responded to N the same every year and that environmental conditions only
dictated which N sinks in the soil were predominately used and the amount used
as effected by plant yield potential. This explains why yield goal has been the
basis for N application over the years, even though seasonal environmental
conditions are unpredictable. Although this theory is still largely accepted, one

9
problem that has not been thoroughly addressed with this concept until recently
is the response of plants to inorganic N fertilizer as reported by Liang and
Mackenzie (1994) among others. Instead, many scientist have spent their time
trying to determine how environmental conditions influence the N cycle in the soil
and which N sinks are used by the plants, whether it is mineralized N from
organic sources or readily-available inorganic sources from commercial fertilizer.
Currently, the development of an N mineralization potential index has been futile,
with the basic rationale that if N mineralization potential could be determined, N
recommendations could be refined (Mullen et al., 2003). Further explaining why
use of the PSNT is limited, given that the soil test for ammonium and/or nitrate
before fertilizer application is accurate, is the fact that soil test information
determined at a point in time is static and provides no prediction of mineralization
and/or immobilization occurring throughout the growing season (Mullen et al.,
2003).
Recent research has been directed towards using the crop to determine N
usage and potential deficiencies by either direct plant analysis or indirect
measures from optical sensors. Direct plant analysis has been used for some
time, but has major drawbacks, some similar to PSNT. With any direct sampling
method, laboratory analysis must be processed, which can become expensive
with extensive sampling and of course the lag-time between sampling and return
of laboratory analysis and fertilizer application (Fox et al., 1993 and Magdoff et
al., 1990). With that in mind many scientists have turned to optical sensing

10
instruments, which give real time indirect measurements of plant biomass and
leaf chlorophyll concentration.
Chlorophyll meters (SPAD meters) have been successfully used to
determine in-season N status, since chlorophyll content has been highly
correlated with leaf N concentration (Wolfe et al., 1988; Schepers et al., 1992).
With the chlorophyll meters, researchers developed an N Sufficiency index [(as-
needed treatment/ well-fertilized treatment) * 100] from which recommendations
were made for in-season N fertilizer applications when the index values fell below
95% (Blackmer and Schepers, 1995; Varvel et al., 1997). Varvel et al. (1997)
reported that maximum grain yields in corn were attained when early season
sufficiency indexes ranged between 90 and 100% up to the V8 growth stage, but
if the sufficiency index fell below 90% at V8, maximum yields were not realized
due to early season N deficiency resulting in lost yield potential. Peterson et al.
(1993) indicated that variation in chlorophyll meter measurements can range up
to 15% from plant to plant, requiring considerable measurements in order to
maintain a representative average for the field at each sampling date.
Nevertheless, the chlorophyll meter was not a viable tool for guiding N side-dress
decisions for corn in the Southern Coastal Plain, undoubtedly because there was
no variable-rate application determination in the sufficiency index used, either
apply or don’t apply (Gascho and Lee, 2002). Another drawback of the
chlorophyll meter is that by reading one leaf at a time, plant biomass cannot be
determined as with the remote sensor.

11
Using a photodiode-based remote sensor measuring canopy radiance in
the red (671nm) and near-infrared (NIR, 780nm) spectral bands, Stone et al.
(1996) developed a plant N spectral index (PNSI) for correcting in-season wheat
N deficiencies. This index, the absolute value of the inverse of the normalized
difference vegetation index (NDVI), saved between 32 and 57 kg N ha –1
compared to fixed N rates. Bausch and Duke (1996) developed an N
Reflectance Index (NRI), using a canopy reflectance ratio of NIR (760-900nm)/
green (520-600nm) for the low N area to the NIR/ green for a well N-fertilized
area, a very similar procedure to the sufficiency index differing only in how the
measurement is taken. Johnson et al. (2000) presented an N response index
(RIHarvest) to calculate the actual crop response to applied N by dividing the
highest mean yield N treatment by the mean yield check treatment. However,
RIHarvest only explains the final yield response to fertilizer N, so an in-season RI
estimate must be made in order for in-season N adjustment. Recent work has
shown that in-season normalized difference vegetation index {NDVI =
[(NIRref/NIRinc) – (Redref/Redinc)]/[(NIRref/NIRinc) + (Redref/Redinc)]} highly
correlated with final grain N uptake (Lukina et al., 2001; Raun et al., 2002).
Therefore, an in-season RI from NDVI, referred to as RINDVI (Highest mean NDVI
N treatment/ Mean NDVI check treatment), was evaluated and determined to be
a viable method for measuring the potential response to additional N (Mullen et
al., 2003).
As mentioned above, one major drawback of the RI was that it only
measured response to N and not how much N would be needed to sustain any

12
deficiencies. Therefore, Raun et al. (2002) refined an in-season estimated grain
yield (INSEY) equation by incorporating the RINDVI. They multiplied predicted
yield potential times the RINDVI to obtain predicted yield with N fertilizer. They
then worked backwards to determine N rate by subtracting estimated grain N
removal in the unfertilized from the projected N uptake in the fertilized plot. This
effectively improved NUE by over 15% when variable N rate topdress application
was compared to traditional practices at uniform N rates in winter wheat.
GopalaPillai and Tian (1999) reported that by using linear regression models on
normalized intensity (NI) of a high-resolution color infrared (CIR) field image, they
were able to predict grain yield with 55 to 91% accuracy, depending on the field
and growing season. However, their work conceded that better correlation with
yield was obtained when using CIR images taken after pollination, then those
from earlier in the season, similar to the findings of work from Bartholome (1988)
evaluating better correlation to grain yield with accumulated NDVI after booting in
millet (Panicum miliaceum L.) and grain sorghum (Sorghum bicolor L.). With the
goal of improving correlation of NDVI to grain yield, Rasmussen (1998)
integrated the product of multitemporal NDVI with photosynthetically active
radiation, but was not successful since no single regression line was valid for
consecutive years. Other yield prediction models have been developed for corn,
although they do not use in-season plant health evaluations as part of the
equation. The crop environment resource synthesis (CERES)-Maize model
simulates the major physiological processes, soil water movement processes,
and N transformation and transport processes involved in plant growth and has

13
been studied a great deal and has been determined to simulate grain N uptake
(Pang et al., 1997). The artificial neural network (ANN) model was successful in
predicting grain yield, designed to evaluate the following three aspects of 15
input factors: (1) yield trends with temperature, rainfall, soil texture, and soil pH,
(2) interaction between N application and late July rainfall, and (3) optimization of
the input factors with a genetic algorithm (Liu et al., 2001). However, both
models use extensive evaluation of multiple factors to predict final grain yield by
full season simulation, but were not accurate for mid-season grain prediction.
OBJECTIVE
This study was conducted to evaluate the influence of various corn
hybrids, plant populations, and fertilizer N rates on the use of midseason NDVI
measurements for predicting grain yield.
MATERIALS AND METHODS
Crop years 2002 and 2003
Two experimental sites were established in the spring of 2002, one near
Stillwater, OK at the Lake Carl Blackwell Agronomy Research Farm (Pulaski fine
sandy loam, course-loamy, mixed, nonacid, thermic Typic Ustifluvent), and one
near Haskell, OK at the Eastern Oklahoma Research Station (Taloka silt loam
fine, mixed, thermic Mollic Albaqiustoll). Initial soil test results are reported in
Table 1. The experiment employed a factorial arrangement within a randomized
complete block design with three replications. Individual plots measured 3.0 x
9.14 m. Ammonium nitrate (34-0-0) was surface-broadcasted by hand preplant
at rates of 0, 56, and 112 kg N ha-1.
14
Three Bacillus thuringiensis (bt) gene enhanced corn hybrids identified by
their maturity date (105-day, 109-day, and 113-day) were planted at both sites in
2002, but three different hybrids with no bt gene enhancement (104-day, 107-
day, 111-day) were planted at both sites in 2003 (planting, fertilizer, and harvest
dates are reported on Table 2). Two different seeding rates were evaluated at
both sites: at the Haskell site seeding rates of 44,460 (low) and 66,690 seeds ha-
1 (high) in 2002 and 49,400 (low) and 71,630 seeds ha-1 (high) in 2003 and at the
Lake Carl Blackwell (LCB) site seeding rates of 35,568 (low) and 51,870 seeds
ha-1 (high). All site years were planted in 76.2 cm rows with conventional tillage.
Each corn plot was sensed with a GreenSeeker™ Hand Held optical reflectance
sensor (Ntech Industries, Ukiah, CA), measuring normalized difference
vegetation index (NDVI) at different vegetative and reproductive growth stages at
both sites each year (sensing dates and growth stages with description
presented in Table 3) with the sensor nadir to the ground and approximately 70
cm above the crop canopy. Corn grain was harvested with a Massey Ferguson
8XP experimental combine, removing 2 rows x 9.14 m from the center of each
plot. A Harvest Master yield-monitoring computer installed on the combine was
used to record grain weight and moisture levels. Grain yield from each plot was
determined by adjusting grain weight to 15.5% moisture and a grain sub-sample
was taken for total N analysis.
Crop year 2004
In the spring of 2004 the experiment was reconfigured with the addition of
a third site on the Greenlee Farm near Morris, OK (Taloka silt loam fine, mixed,
15
thermic Mollic Albaqiustoll) and the relocation of the Haskell trial to an adjacent
field at the same location with the same soil description. Furthermore, plant
populations were increased from two populations to four and corn hybrids were
reduced from three hybrids to two. Initial soil test results are also reported in
Table 1. At the Greenlee Farm a P deficiency was corrected by 1surface-
boardcasting triple super phosphate (0-46-0) 45 kg P2O5 ha-1 at planting.
Individual plot size was reduced to 3.0 x 6.10 m with the purpose of sustaining
manageable labor requirements for the increased treatment size. In addition,
ammonium nitrate (34-0-0) application rates were increased to 84 and 168 kg N
ha-1 to assure N would not be a limiting factor in high N application treatments.
Two Bacillus thuringiensis (bt) gene enhanced corn hybrids identified by
their maturity date (99-day and 113-day) were planted at all three sites (planting,
fertilizer, and harvest dates are reported on Table 2). Four different seeding
rates were evaluated at all three sites: 37050, 51870, 66690, and 81510 seeds
ha-1. The Haskell and Lake Carl Blackwell sites were planted in conventional
tillage whereas the Greenlee Farm was planted in no-till, but all three sites were
planted in 76.2 cm rows. With the availability of a green NDVI sensor, both
GNDVI {GNDVI = [(NIRref/NIRinc) – (Greenref/Greeninc)] / [(NIRref/NIRinc) +
(Greenref/Greeninc)]} and RNDVI {RNDVI = [(NIRref/NIRinc) – (Redref/Redinc)] /
[(NIRref/NIRinc) + (Redref/Redinc)]} was measured at different vegetative and
reproductive growth stages at all sites (sensing dates and growth stages
presented in Table 3) with a GreenSeeker™ Hand Held optical reflectance
sensor (Ntech Industries, Ukiah, CA). The center two rows of each corn plot

16
were sensed separately with the sensor nadir to the ground and approximately
70 cm above the crop canopy. Corn grain was harvested (picked and shucked)
by hand from the center two rows of each plot separately and ear weights were
recorded for each row. Four random ears from each row were collectively
weighed, dried in a forced air oven at 66oC, and weighed again to determine
moisture levels. Following the measurement of dry weights, the four ears were
shelled by hand using a Root-Healey Manufacturing Company (Plymouth, OH)
hand-crank corn sheller and the grain weight was taken to determine an average
cob weight for each row. Finally, a grain yield from each row was calculated by
adjusting grain weight to 15.5% moisture and a grain sub-sample was taken for
total N analysis.
Data analysis
Grain samples were dried in a forced air oven at 66oC, ground to pass a
140 mesh sieve (100 um), and analyzed for total N content using a Carlo-Erba
NA 1500 automated dry combustion analyzer (Schepers et al., 1989). Nitrogen
use efficiency was determined using the difference method: dividing the
difference between the grain N uptake of the N treatment and the grain N uptake
of the check (0 N rate) by the N rate of the N treatment. Vegetative or In-season
RI (RINDVI) was calculated dividing the highest mean NDVI N treatment by the
mean NDVI check treatment. Grain or Harvest RI (RIHARVEST) was calculated
dividing the highest N treated grain yield average by the check average.
Analyses of variance and single degree of freedom contrasts were performed
using SAS (SAS, 1990). Linear and non-linear (linear-plateau) regression

17
models were used to determined the relationships present between grain yield
and NDVI as well as between NDVI and the treatment variables.
RESULTS AND DISCUSION
Hybrid and Plant Population
Crop Year 2002
In the initial year, RNDVI was measured twice at both locations. The first
reading at Haskell was taken at the 10-leaf (V10) growth stage (Table 3).
The109-day hybrid had significantly lower RNDVI than the 105-day and 113-day
hybrids. Plant population influenced RNDVI for the 109-day and 113-day hybrids
with extensively higher RNDVI values in the higher plant population (Figure 1).
However, at the second Haskell sensing (R1 growth stage, Table 3), the 105-day
hybrid had significantly higher RNDVI values than both the 109-day and 113-day
hybrids. Furthermore, plant population only influenced RNDVI in the 109-day
hybrid at the second Haskell sensing, resulting in higher RNDVI values.
Although plant biomass increased considerably between the first (V10) and
second (R1) sensor readings, RNDVI values decreased extensively due to tassel
development (Figure 1). The lighter color of the tassel decreased red light
absorbance in the crop canopy. Therefore, separate grain yield prediction curves
will be needed for the vegetative and reproductive growth stages. In addition, the
105-day hybrid, as a typical earlier maturing hybrid, was considerably smaller
than the other two hybrids at the second RNDVI reading which may have led to
the higher RNDVI values even though it did not produce the highest grain yield
(Table 4).

18
The sensor measurements at LCB were taken at 7-leaf (V7) and silking
(R1) growth stages (Table 3). The 109-day hybrid was consistently higher in
RNDVI than the other two hybrids at both LCB sensor measurements followed by
the113-day hybrid and then the 105-day which coincided with visual height
observations. Plant population increased RNDVI in all three hybrids at the first
sensing, with no effect on RNDVI at the second reading. Since the LCB site
typically receives lower summer precipitation than Haskell, the site was
considered to support lower grain yields and therefore lower plant populations
were used. The LCB site resulted in considerably lower grain yields (Table 4) as
well as lower RNDVI values. However the RNDVI trends differed from Haskell in
that plant population did not affect RNDVI measured at the R1 growth stage at
LCB, which may be attributed to apparent severe drought stress as revealed by
the exceedingly low grain yields (Table 4).
Crop Year 2003
At the Haskell site nine sensor readings were taken, starting at the 6-leaf
(V6) growth stage and ending at the dough (R4) growth stage (Table 3).
Significant differences between the hybrids in RNDVI did not occur until the 8-
leaf (V8) sensing, where the 104-day hybrid had greater RNDVI values over both
the 107-day and 111-day hybrids and the 107-day hybrid had higher RNDVI
values over the 111-day hybrid. The high plant population was significantly
greater in RNDVI for all three hybrids at the first three sensor readings: V6, V7,
and V8 (Figure 2). However, no differences were found at V10 between the 104-
day and 107-day hybrids or within the plant populations and/or N rates of either

19
hybrid. Also, no treatment differences were seen either between any of the
hybrids or within the plant populations and/or N rates of any hybrid at the 16-leaf
(V16) growth stage. Although significant treatment effects were visually present
between V10 and V16 growth stages in all three hybrids, the effects could not be
measured effectively at those stages due to complete absorbance in the red
band that occurred (Figure 2). The 111-day hybrid had higher RNDVI values
than both the 104-day and 107-day hybrids during the silking (R1) and dough
(R4) reproductive growth stages and higher RNDVI values than the 107-day
hybrid at the blister (R2) reproductive growth stage. The 104-day hybrid had
significantly greater RNDVI values than did the 107-day hybrid at R2. The high
plant population actually decreased RNDVI values in the 104-day hybrid at the
R1, milk (R3), and R4 reproductive growth stages as well as the R4 sensing of
the 107-day hybrid. However, the higher plant population increased RNDVI in
the 111-day hybrid at the R1 and R2 growth stages. While the 111-day hybrid
may have obtained significantly higher RNDVI values than either of the other two
hybrids during the reproductive growth stages, it is conceivable that this event
took place because of the maturity differences between the hybrids (as the hybrid
matures RNDVI decreased due to hastened lower leaf senescence (Figure 2),
since the 104-day and 107-day hybrids produced significantly higher grain yields
(Table 5).
At the LCB site seven sensor readings were taken, starting at the V6
growth stage and ending at the R2 growth stage (Table 3). The 107-day hybrid
was significantly lower in RNDVI than the 111-day hybrid throughout all sensor

20
(V6-R2) readings, but no statistical differences were observed between the 104-
day and 107-day hybrids except at R2 when the 104-day hybrid showed higher
RNDVI values (data not shown). The high plant population increased the RNDVI
values of all three hybrids at all sensor (V6-R2) readings (data not shown). The
red complete absorbance effect was not observed at LCB and consequently the
decease in RNDVI did not occur at tassel development, but this was essentially
due to the lower plant populations used. Plant stands were measured mid-
season to further investigate the influence of plant population on RNDVI. The V8
and R2 sensor data revealed that a linear-plateau relationship existed between
measured plant population and RNDVI for all three hybrids when combining both
sites and excluding measurements from the 0 N treatments (Figures 3 & 4). The
0 N treatments typically had increased spatial variability most likely due to
inadequate N resources, resulting in high variability in RNDVI that overshadowed
the variability associated with plant population. Therefore plant population can
influence RNDVI values at various growth stages, but as depicted in Figure 2 this
influence can be either positive (increased RNDVI) or negative (decreased
RNDVI).
Crop Year 2004
The 113-day hybrid was consistently higher than the 99-day hybrid in both
green NDVI (GNDVI) and RNDVI at all locations after the V7 growth stage, which
was consistant with grain yield. Grain yields were high in 2004 with the unusual
timely rainfall throughout the growing season; as a result the later maturing 113-
day hybrid was significantly higher in grain yield than the 99-day hybrid at all
21
three locations (Table 6). A positive linear response to plant population in both
GNDVI and RNDVI occurred for both hybrids at all nine (V5-R4) dates of sensing
readings over all three sites (Figures 5 & 6). The quadratic response to plant
population was variable between locations, hybrids, and NDVI bands, however
linear plateau relationships were seen for both hybrids at the V8 growth stage
(Figures 7 & 8). Similar effects were seen in grain yield with quadratic responses
to plant population as well (Table 6). As a result the maximum effective plant
population for grain yield was 66,690 plants ha-1 for the 113-day hybrid at all
three locations and the 99-day hybrid at the Greenlee Farm and Haskell
locations. However, the 99-day hybrid at the LCB site showed that the 81,510
plants ha-1 population produced the highest grain yield. Significant factors were
site, hybrid, and band specific, indicating that the influence of plant population on
both GNDVI and RNDVI is dependant upon environmental conditions.
Nitrogen Response
Crop Year 2002
At Haskell a positive linear response to N was seen for RNDVI in the 113-
day hybrid at the V10 reading (Figure 9), but N response was limited in the other
hybrids. While visual differences were observed in the trial at the R1 reading, no
significant trends were determined from RNDVI measurements (Figure 9).
However there was no linear response to N in grain yield for any of the three
hybrids at either plant population (Table 4). Since there was no response to N at
Haskell, poor NUE resulted with a slightly significant advantage for the 109-day
hybrid over the 113-day (Table 7). A positive linear response to N was observed

22
at LCB for the high plant population of the 109-day and 113-day hybrids at the
first (V7) sensing (as shown by the 113-day hybrid in Figure 9). At the second
(R1) LCB reading, a positive linear response was observed for the high plant
populations of all three hybrids and for the low population of the 105-day hybrid
(as shown by the 113-day hybrid in Figure 9). In grain yield a positive linear
response to N was observed at LCB for the 105-day and the 113-day hybrids at
the low plant population and for all three hybrids at the high population (Table 4).
There were no significant differences found in NUE between the hybrids at LCB
(Table 7).
In-season RI (RIRNDVI) was determined (highest mean RNDVI N treatment/
mean RNDVI check treatment) at both sensor readings and compared to final
grain yield response (RIHarvest). In-season RI data from the first sensor reading
indicated that growth stage was important in estimating RIHarvest (Figure 10). The
Haskell data shows that RIHarvest was predicted well by the RIRNDVI taken at V10
with little to no change in RIRNDVI taken at R1, but the data also shows that a
small N response was seen at Haskell as mentioned previously. The LCB
RIRNDVI taken at V7 underestimated RIHarvest for all three hybrids (Figure 10).
However, LCB RIRNDVI taken at R1 did not predict RIHarvest effectively (data not
shown).
Crop Year 2003
A positive linear RNDVI response to N occurred at Haskell in both plant
populations of all three hybrids at the V6, V7, and V8 sensor readings (as
indicated in Figure 11) and for both plant populations of the 111-day hybrid at the
23
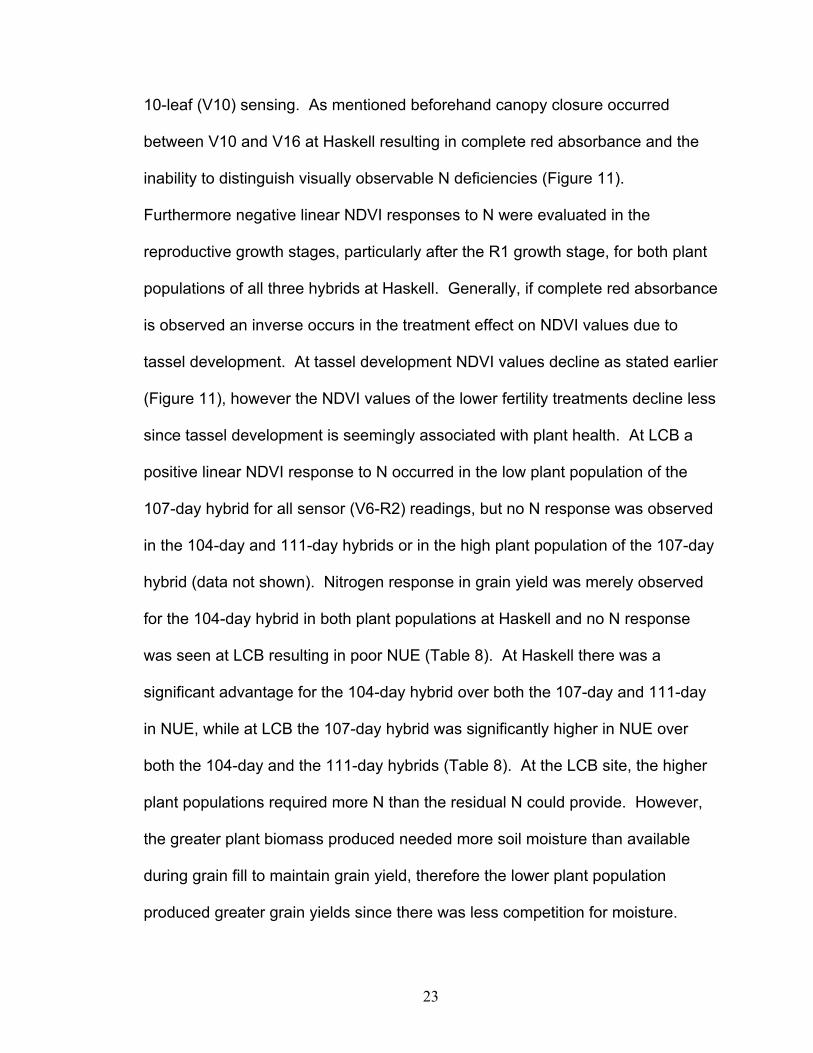
10-leaf (V10) sensing. As mentioned beforehand canopy closure occurred
between V10 and V16 at Haskell resulting in complete red absorbance and the
inability to distinguish visually observable N deficiencies (Figure 11).
Furthermore negative linear NDVI responses to N were evaluated in the
reproductive growth stages, particularly after the R1 growth stage, for both plant
populations of all three hybrids at Haskell. Generally, if complete red absorbance
is observed an inverse occurs in the treatment effect on NDVI values due to
tassel development. At tassel development NDVI values decline as stated earlier
(Figure 11), however the NDVI values of the lower fertility treatments decline less
since tassel development is seemingly associated with plant health. At LCB a
positive linear NDVI response to N occurred in the low plant population of the
107-day hybrid for all sensor (V6-R2) readings, but no N response was observed
in the 104-day and 111-day hybrids or in the high plant population of the 107-day
hybrid (data not shown). Nitrogen response in grain yield was merely observed
for the 104-day hybrid in both plant populations at Haskell and no N response
was seen at LCB resulting in poor NUE (Table 8). At Haskell there was a
significant advantage for the 104-day hybrid over both the 107-day and 111-day
in NUE, while at LCB the 107-day hybrid was significantly higher in NUE over
both the 104-day and the 111-day hybrids (Table 8). At the LCB site, the higher
plant populations required more N than the residual N could provide. However,
the greater plant biomass produced needed more soil moisture than available
during grain fill to maintain grain yield, therefore the lower plant population
produced greater grain yields since there was less competition for moisture.

24
In-season RI was determined at all sensing dates and compared to final
grain yield response (RIHarvest). The V8 sensor data produced the highest RIRNDVI
values and were therefore compared to the RIHarvest data (Figure 12). The
Haskell data shows that V8 RIRNDVI overestimated RIHarvest, but the LCB V8
RIRNDVI generally predicted RIHarvest well (Figure 12). Similar to the 2002 Haskell
RI data, the LCB V8 RIRNDVI showed a small response to N and therefore a better
relationship with RIHarvest than the 2003 Haskell data. As alluded to above and
concluded in previous research, mid-season N response may not result in higher
grain yield if environmental stress is great during grain fill and an associated
overestimates of RIHarvest.
Crop Year 2004
A highly significant interaction for NDVI between plant population and N
rate occurred in 2004 at all three locations. Positive linear GNDVI responses to
N at the Greenlee Farm were sporadic within the hybrids and growth stages,
particularly at the lower plant populations (37,050 & 51,870 plants ha-1).
Conversely, positive linear RNDVI responses to N at the Greenlee Farm were a
little more rational with mid-season (V8, V9, V12-VT) N responses in all plant
populations but the lowest (37,050 plants ha-1) of the 99-day hybrid and the
lowest and highest (81,510 plants ha-1) populations of the 113-day hybrid.
Similar results were noted in grain yield at the Greenlee Farm with the 99-day
hybrid showing no response to N at the lowest plant population; nevertheless a
quadratic response was noted at the 51,870 population and a positive linear
response at the 66,690 and 81,510 populations (Table 6). On the contrary, the

25
113-day hybrid at the Greenlee Farm showed a positive linear response to N at
the 66,690 population and a quadratic response at the 81,510 population, but no
N response was seen in the two lower populations (Table 6). Nitrogen response
was potentially underestimated for the 66,690 population and overestimated in
the 37,050 population in the 113-day hybrid.
At Haskell positive linear GNDVI and RNDVI responses to N were
observed for both hybrids in all plant populations during mid (V6-V9) and late
(R4-R5) season sensor readings, but not at V11 or R1 growth stages except for
in the low plant populations due to canopy closure (Figures 13 & 14). The
Haskell site showed a large grain yield response to N by means of a positive
linear response at the 37,050 population and a positive quadratic response at the
51,870, 66,690, and 81,510 populations (Table 6). Positive linear GNDVI
responses to N observed at LCB were inconsistent within the 113-day hybrid with
sporadic responses occurring in the 37,050 and 66,690 plant populations and
consistent responses occurring in the 51,870 and 81,510 plant populations
between V7 and R4 growth stages except for V12-VT in the 81,510 population.
Positive linear GNDVI responses to N in the 99-day hybrid were not seen for the
37,050 population the entire season or the other plant populations until the
reproductive growth stages. Similar positive linear RNDVI responses to N results
were seen for the 113-day hybrid with responses to the 51,870 and 81,510 plant
populations between V7 and R4 growth stages except for V12-VT in the 81,510
population. However the 51,870 population of the 99-day hybrid shown mid-
season positive linear RNDVI responses to N as well, otherwise the 99-day

26
hybrid along with the 37,050 and 66,690 plant populations of the 113-day hybrid
N responses were not evaluated until the reproductive stages. At the LCB site,
an N response in grain yield was noticed only for the highest plant population
(81,510 plants ha-1) with a positive linear response in the 113-day hybrid and a
positive quadratic response in the 99-day hybrid (Table 6).
At the Haskell site NUE was significantly higher for the 113-day hybrid
over the 99-day, but at the Greenlee Farm and LCB there was no difference
between the hybrids (Table 9). At all sites the highest plant populations required
the most additional N in 2004 (a positive linear response in plant population to
NUE) since more competition from plant biomass production requires more N
wither or not this increased plant biomass portrays greater grain yield per unit
area. Following the same procedure as in 2003, in-season RI was determined at
all sensor readings and compared to RIHarvest. As seen in 2003 the V8 data
produced the highest RIGNDVI (from GNDVI) and RIRNDVI (from RNDVI) values and
was compared to the RIHarvest (Figures 15 & 16). Similar trends were seen in the
high linear relationships between RIGNDVI and RIHarvest and between RIRNDVI and
RIHarvest. Both in-season RI’s (green and red) consistently underestimated
RIHarvest in both hybrids at all three locations. While the coefficients of
determination (R2) of the two relationships were identical, the slope was higher in
the RIGNDVI relationship with RIHarvest than that of the RIRNDVI, indicating that the
RNDVI estimated RIHarvest better than GNDVI by underestimating RIHarvest to a
smaller extent (Figures 15 & 16). The extent of the underestimation may be
attributed to the high grain yields observed in 2004. Nitrogen response

27
increased beyond the V8 growth stage and was maintained throughout grain fill
as a result of moderate air temperatures and timely rainfall and since detection of
treatment differences declines with canopy closure the increased N response
was not recognized by later sensor readings.
Grain Yield Prediction Crop Year 2002
Linear regression was evaluated between grain yield and RNDVI
measurements and between grain yield in 2002 (Figure 17). Although the sensor
measurements may have some inaccuracy due to not maintaining proper height
above the crop canopy (i.e. holding the sensor too close to the canopy) some
very pronounced relationships were found. While comparisons between grain
yield and RNDVI at early growth stages (V7 at LCB, V10 at Haskell) resulted in
poor relationships at both sites (data not shown), comparisons made at the later
reading (R1 growth stage) showed a very good relationship existed between
grain yield and RNDVI (Figure 17). This suggests that late-season (reproductive
stage) sensor readings could predict grain yield effectively. Furthermore,
separating the hybrids improved the relationship between grain yield and RNDVI,
but not significantly since the combined hybrid model already had a very
pronounced relationship. The R1 sensor readings may have been more effective
since tassel development was observed to be profoundly affected by plant health
and therefore narrowing the sensing field of view by holding the sensor too close
to the crop canopy would not greatly affect the RNDVI measurement from a plant
health prospective. Where as at earlier growth stages before tassel

28
development, RNDVI measurements would need to measure plant biomass
which potentially could not be done effectively if the sensor is held too close to
the crop canopy, resulting in less variability between treatments and inflated
RNDVI readings. In addition, a very profound negative linear relationship was
also found between grain yield and CV (RCV) derived from RNDVI (RCV=
RNDVI standard deviation / RNDVI mean) at the R1 sensor reading; however a
comparison between RNDVI and RCV showed a very pronounced negative
linear relationship (Figure 18). The RNDVI relationship with grain yield showed a
slight (insignificant) advantage over RCV with grain yield and as a result of the
high relationship between RNDVI and RCV no benefit would be anticipated by
combining both RNDVI and RCV to predict grain yield. Therefore mid-season
RNDVI can be utilized very effectively to predict grain yield.
Crop Year 2003
Linear regression analysis revealed that the best relationship between
grain yield and RNDVI over three hybrids occurred at the V8 growth stage in
2003 (Figure 19). These data indicate that early season grain yield prediction is
achievable and therefore side-dress N application based on grain yield prediction
is practical. Although lower than the V8 relationship, the R2 growth stage
comparison between grain yield and RNDVI also showed a well-defined
relationship supporting the 2002 results that late season yield prediction is
possible though not practical for side-dress N application (Figure 20). However,
a closer look at the R2 model (Figure 20) showed that each hybrid has a
separate linear relationship with grain yield corresponding to 2002 results. While

29
the combined model explains a considerable amount of variation, the model was
improved significantly to that of the V8 data when the hybrids were fitted with
separate curves (data not shown). Separating out the hybrids in the early
season model did not improve the relationship with grain yield, confirming that
while significant differences in NDVI occurred between the hybrids at V8 these
differences existed in grain yield as well. Consistent with 2002 data, RCV related
with grain yield very similarly to that of RNDVI at both growth stages (V8 & R2)
and like 2002 RNDVI was highly related with RCV (Figures 21 & 22). Therefore,
using RCV in grain yield prediction either combined with RNDVI or separately
had no benefit in 2003 as well. Mid-season grain yield prediction can be
achieved not only in the reproductive stages as supported by the 2002 data, but
also in earlier vegetative growth stages, particularly at V8 when side-dress N
applications can be used to maximize NUE.
Crop Year 2004
In 2004, the V8 data showed the highest positive linear relationship
between both GNDVI and RNDVI with grain yield, consistent with RNDVI in
2003. There were no significant differences between the GNDVI and RNDVI
relationships with grain yield at V8. However, the NDVI (both GNDVI & RNDVI)
relationship with grain yield was considerably higher in the 99-day hybrid
compared to the 113-day hybrid (Figures 23 & 24). Therefore developing
separate yield prediction lines for these two hybrids would have been necessary
to maintain accurate grain yield prediction. Little rationale can be given as to why
grain yield prediction was extensively enhanced in the 99-day hybrid, since the
30
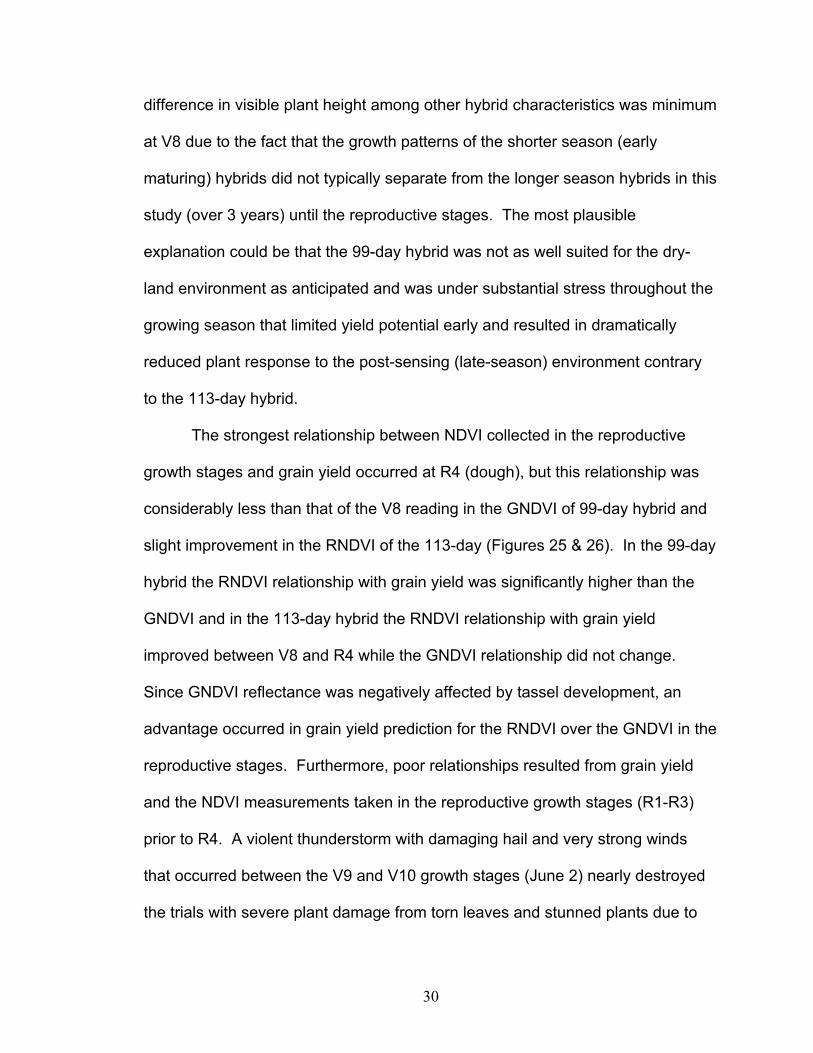
difference in visible plant height among other hybrid characteristics was minimum
at V8 due to the fact that the growth patterns of the shorter season (early
maturing) hybrids did not typically separate from the longer season hybrids in this
study (over 3 years) until the reproductive stages. The most plausible
explanation could be that the 99-day hybrid was not as well suited for the dry-
land environment as anticipated and was under substantial stress throughout the
growing season that limited yield potential early and resulted in dramatically
reduced plant response to the post-sensing (late-season) environment contrary
to the 113-day hybrid.
The strongest relationship between NDVI collected in the reproductive
growth stages and grain yield occurred at R4 (dough), but this relationship was
considerably less than that of the V8 reading in the GNDVI of 99-day hybrid and
slight improvement in the RNDVI of the 113-day (Figures 25 & 26). In the 99-day
hybrid the RNDVI relationship with grain yield was significantly higher than the
GNDVI and in the 113-day hybrid the RNDVI relationship with grain yield
improved between V8 and R4 while the GNDVI relationship did not change.
Since GNDVI reflectance was negatively affected by tassel development, an
advantage occurred in grain yield prediction for the RNDVI over the GNDVI in the
reproductive stages. Furthermore, poor relationships resulted from grain yield
and the NDVI measurements taken in the reproductive growth stages (R1-R3)
prior to R4. A violent thunderstorm with damaging hail and very strong winds
that occurred between the V9 and V10 growth stages (June 2) nearly destroyed
the trials with severe plant damage from torn leaves and stunned plants due to

31
lodging. This plant damage, as proven by the low RNDVI values at V11, resulted
in underestimation and variation in grain yield prediction during these growth
stages. However, the NDVI relationship with grain yield improved at R4
presumably due to variation in lower leave senescence associated with plant
health.
As in the preceding years, CV (both GCV & RCV) was correlated with
grain yield, but to a lesser degree than NDVI at both growth stages. NDVI was
correlated with CV as well, but not at the level of the two previous years (Figures
27 & 28). Regardless of the lower relationship between NDVI and CV, the
analysis resulted in the same findings as the preceding years that CV (GCV or
RCV) did not improve the relationship between grain yield and NDVI. Even
though the grain yield relationship with GNDVI declined significantly between V8
and R4 in the 99-day hybrid, the 2004 RNDVI data corresponds with the previous
two years that grain yield could be predicted effectively during both the
vegetative (V8) and reproductive stages.
CONCLUSIONS
The critical population at which the NDVI plateau occurred, ranged
between 55,000 and 60,000 plants ha –1 in the later maturing hybrids and closer
to 70,000 in the earliest maturing hybrids. Therefore, plant population did not
affect NDVI at populations commonly used in corn production (between 55,000
and 70,000 plants ha –1), and should not be a major concern when using NDVI to
predict grain yield unless an early maturing hybrid is used in a low plant
population. Although post-sensing environmental conditions did cause radical

32
changes in N response between vegetative measurements (RINDVI) and final yield
(RIHARVEST) at some site years, determining N response (RI) mid-season has
been proven possible at the V8 growth stage.
NDVI data from the V8 growth stage predicted grain yield most accurately
in both 2003 and 2004, presumably because the highest variability in NDVI
occurred at the V8 growth stage both years. Later vegetative growth stages may
actually contain more plant variability than V8 and could have stronger
relationships with grain yield, but canopy closure occurs shortly after V8 (V10 to
V12) and vegetative stage NDVI data collected thereafter miscues plant
variability. Well-defined relationships between NDVI and grain yield also
occurred in the reproductive growth stages, but at different growth stages each
year: R1 in 2001, R2 in 2003, and R4 in 2004. Although late-season yield
prediction is not useful for N management and limited due to temporal variability,
the potential is there for other uses.
Separating the hybrids vastly improved these reproductive relationships
with grain yield all three years, but only improved the V8 relationship with grain
yield in 2004. Hybrid maturity did not effect grain yield prediction at V8, but
reproductive growth stage yield prediction will require hybrid maturity
categorization. Finally, comparisons made between the GNDVI and RNDVI
relationships with grain yield in 2004 showed no significant differences over three
locations. Separate yield prediction models for GNDVI and RNDVI will be
required, since GNDVI values are about 10% lower than RNDVI and would
underestimate yield potential using the same model.

33
REFERENCES Aase, J.K., and J.L. Pikul. 1995. Crop and soil response to long-term tillage
practices in the northern Great Plains. Agron. J. 87:652-656. Baker, J.L. and D.R. Timmons. 1994. Fertilizer management effects on leaching
of labeled nitrogen for no-till corn in field lysimeters. J. Environ. Qual. 23:305-310.
Bartholome, E. 1988. Radiometric measurements and crop yield forecasting;
Some observations over millet and sorghum experimental plots in Mali. Int. J. Remote Sens. 9:1539-1552.
Bausch, W.C. and H.R. Duke. 1996. Remote sensing of plant nitrogen status in
corn. Trans. ASAE 39(5):1869-1875. Blevins, D.W., D.H. Wilkison, B.P. Kelly, and S.R. Silva. 1996. Movement of
nitrate fertilizer to glacial till and runoff from a claypan soil. J. Environ. Qual. 25:584-593.
Black, A.L. and A. Bauer. 1988. Setting winter wheat yield goals. P. 24-34. In
J.L. Havlin (ed) Proc. Workshop Central Great Plains Profitable Wheat Management, Wichita, KS. 17-20 Aug. 1988. Potash and Posphate Inst., Altanta, GA.
Blackmer, T.M. and J.S. Schepers. 1995. Use of a chlorophyll meter to monitor
nitrogen status and schedule fertigation for corn. J. Prod. Agric. 8(1):56-60.
Blumenthal, J.M. and M.P. Russelle. 1996. Subsoil nitrate uptake and symbiotic
dinitrogen fixation by alfalfa. Agron. J. 88:909-915. Bosch, H.M., A.B. Rosefield, R. Huston, H.R. Shipman and F.L. Woodward.
1950. Methemoglobinemia and Minnesota well supplies. J. Am. Water Works Assoc. 42: 161-170.
Bundy, L.G. and T.W. Andraski. 1995. Soil yield potential effects on
performance of soil nitrate tests. J. Prod. Agric. 8:561-568. Chichester, F.W. and C.W. Richardson. 1992. Sediment and nutrient loss from
clay soils as affected by tillage. J. Environ. Qual. 21:587-590. Dahnke, W.C., L.J. Swenson, R.J. Goos, and A.G. Leholm. 1988. Choosing a
crop yield goal. SF-822. North Dakota State Ext. Serv., Fargo.

34
Daliparthy, J., S.J. Herbert, and P.L.M. Veneman. 1994. Dairy manure applications to Alfalfa: crop response, soil nitrate, and nitrate in soil water. Agron. J. 86:927-933. Dao, T.H. 1993. Tillage and winter wheat residue management effects on water
infiltration and storage. Soil Sci. Am. J. 57:1586-1595. Diaz, R.J. 2001. Overview of Hypoxia around the World. J. Environ. Qual.
30:275-281. Diez, J.A., R. Roman, M.C. Cartagena, A. Vallejo, A. Bustos, and R. Caballero.
1994. Controlling nitrate pollution of aquifers by using different nitrogenous controlled release fertilizers in maize crop. Agric. Ecosys. and Environ. 48:49-56.
Doran, J.W. 1980. Soil microbial and biochemical changes associated with
reduced tillage. Soil Sci. Soc. Am. J. 44:765-771. Dowdell, R.J., and R.Q. Cannell. 1975. Effect of ploughing and direct drilling on
soil nitrate content. J. Soil. Sci. 26:53-61. Drury, C.F., C.S. Tan, J.D. Gaynor, T.O. Oloya, and T.W. Welacky. 1996.
Influence of controlled drainage-subirrigation on surface and tile drainage nitrate loss. J. Environ. Qual. 25:317-324.
Durieux, R.P., H.J. Brown, E.J. Stewart, J.Q. Zhao, W.E. Jokela, and F.R.
Magdoff. 1995. Implications of nitrogen management strategies for nitrate leaching potential: Roles of nitrogen source and fertilizer recommendations system. Agron. J. 87:884-887.
Eck, H. V., and O.R. Jones. 1992. Soil nitrogen status as affected by tillage,
crops, and crop sequences. Agron. J. 84:660-668. Eckert, D.J. and V.L. Martin. 1994. Yield and nitrogen requirement of no-tillage
corn as influenced by cultural practices. Agron. J. 86:1119-1123. Edwards, W.M., M.J. Shipitalo, L.B. Owens, and L.D. Norton. 1990. Effect of
Lumbricus terrestris L. burrows on hydrology of continuous no-till corn fields. Geoderma 46:73-84.
Eghball, B. and J.W. Maranville. 1991. Interactive effects of water and nitrogen
stresses on nitrogen utilization efficiency, leaf water status and yield of corn genotypes. Commun. Soil. Sci. Plant Anal., 22(13&14):1367-1382.

35
Elliott, E.T., P.W. Tracy, G.A. Peterson, and C.V. Cole. 1986. Leaching of mineralized N is less under no-till cultivation. P. 53-54. In Trans. Int. Congr. Soil Sci. 13th, Hamburg, Germany. Vol. 6. Congr. Centurum, Hamburg.
Esala, Martti and Aku Leppanen. 1998. Leaching of 15N-labeled fertilizer nitrate
in undisturbed soil columns after simulated heavy rainfall. Commun. Soil Sci. Plant Anal. 29:1221-1238.
Francis, D.D., J.S. Schepers, and M.F. Vigil. 1993. Post-anthesis nitrogen loss
from corn. Agron J. 85:659-663. Fenster, C.R., and G.A. Peterson. 1979. Effects of no-tillage fallow compared to
conventional tillage in a wheat-fallow system. Nebraska Agic. Exp. Bull. 289.
Fox, R.H., J.S. Shenk, W.P. Piekielek, M.O. Westerhaus, J.D. Toth, and K.E.
Macneal. 1993. Comparsion of near-infrared spectroscopy and other soil nitrogen availability quick tests for corn. Agron. J. 85:1049-1053.
Gascho, G.J. and R.D. Lee. 2002. Determining side-dress nitrogen
requirements of corn following broiler litter in the Southern Coastal Plain. J. Plant Nutr. 11:2361-2371.
Goolsby, D.A., W.A. Battaglin, B.T. Aulenbach, and R.P. Hooper. 2001.
Nitrogen Input to the Gulf of Mexico. J. Environ. Qual. 30:329-336. GopalaPillai, S. and L. Tian. 1999. In-field variability detection and spatial yield
modeling for corn using digital aerial imaging. Trans. ASAE 42(6):1911-1920.
Harper, L.A., R.R. Sharpe, G.W. Langdale, and J.E. Giddens. 1987. Nitrogen
cycling in a wheat crop: Soil, plant, and aerial nitrogen transport. Agron. J. 79:965-973.
Hilton, B.R., P.E. Fixen, and H.J. Woodward. 1994. Effects of tillage, nitrogen
placement, and wheel compaction on denitrification rates in the corn cyle of a corn-oats rotation. J. Plant Nutr. 17:1341-1357.
Holland, J.F., and W.L. Felton. 1989. Effect of tillage practice on grain sorghum
production in northern New South Wales. Aust. J. Exp. Agric. 29:843-848.

36
Howarth, R.W., G. Billen, D. Swaney, A. Townsend, N. Jaworski, K. Lajtha, J.A. Downing, R. Elmgren, N. Caraco, T. Jordan, F. Berendse, J. Freney, V. Kudeyarov, P. Murdoch, and Z. Zhao-Liang. 1996. Regional nitrogen budgets and reverine N & P fluxes for the drainage to the North Atlantic Ocean: Natural and human influences. Biogeochemistry 35:75-139.
Johnson, G.V. 1991. General model for predicting crop response to fertilizer.
Agron. J. 83:367-373. Johnson, G.V., W.R. Raun, and R.W. Mullen. 2000. Nitrogen use efficiency as
influenced by crop response index. P. 291. In Agronomy abstracts. ASA, CSSA, and SSSA, Madison, WI.
Jones, O.R., and T.W. Popham. 1997. Cropping and tillage systems for dryland
grain production in the southern high plains. Agron. J. 89:222-232. Kanwar, R.S., T.S. Colvin, and D.L. Karlen. 1997. Ridge, moldboard, chisel, and
no-till effects on tile water quality beneath two cropping systems. J. Prod. Agric. 10:227-234.
Kessavalou, A., J.W. Doran, W.L. Powers, T.A. Kettler, and J.H. Qian. 1996.
Bromide and nitrogen-15 tracers of nitrate leaching under irrigated corn in central Nebraska. J. Environ. Qual. 25:1008-1014.
Kirkegaard, J.A., R. Munns, R.A. James, P.A. Gardner, and J.F. Angus. 1995.
Reduced growth and yield of wheat with conservation cropping: II. Soil biological factors limit growth under direct drilling. Aust. J. Agric. Res. 46:75-88.
Lamb, J.A., G.A. Peterson, and C.R. Fenster. 1985. Wheat-fallow tillage systems
‘effect on newly cultivated grassland soils’ nitrogen budget. Soil Sci. Soc. Am. J. 49:352-356.
Lehrsch, G.A., R.E. Sojka, and D.T. Westermann. 2000. Nitrogen placement,
row spacing, and furrow irrigation water positioning effects on corn yield. Agron. J. 92:1266-1275.
Liang, B.C., M. Remillard, and A.F. MacKenzie. 1991. Plant and environment
interactions. J. Environ. Qual. 20:123-128. Liang, B.C. and A.F. MacKenzie. 1994. Corn yield, nitrogen uptake and nitrogen
use efficiency as influenced by nitrogen fertilization. Can. J. Soil Sci. 74:235-240.
Liu, J., C.E. Goering, and L. Tian. 2001. A neural network for setting target corn
yields. Trans. ASAE 44(3):705-713.

37
Lopez-Bellido, L., M. Fuentes, J.E. Castillo, F.J. Lopez-Garrido, and E.J.
Fernandez. 1996. Long-term tillage, crop rotation and nitrogen fertilizer effects on wheat yield under rainfed Mediterranean conditions. Agron. J. 88:783-791.
Lukina, E.V., K.W. Freeman, K.J. Wynn, W.E. Thomason, R.W. Mullen, A.R.
Klatt, G.V. Johnson, R.L. Elliott, M.L. Stone, J.B. Solie, and W.R. Raun. 2001. Nitrogen fertilization optimization algorithm based on in-season estimates of yield and plant nitrogen uptake. J. Plant Nutr. 24:885-898.
Magdoff, F.R., D. Ross, and J. Amadon. 1984. A soil test for nitrogen availability
to corn. Soil Sci. Soc. Am. J. 48:1301-1304. Magdoff, F.R., W.E. Jokela, R.H. Fox, and G.F. Griffin. 1990. A soil test for
nitrogen availability in the northeastern United States. Commun. Soil Sci. Plant Anal. 21:1103-1115.
Menezes, R.S.C., G.J. Gascho, W.W. Hanna, M.L. Cabrera, and J.E. Hook.
1997. Subsoil nitrate uptake by grain pearl millet. Agron. J. 89:189-194. Merrill, S.D., A.L. Black, and A. Bauer. 1996. Conservation tillage affects root
growth of dryland spring wheat under drought. Soil Sci. Am. J. 60:575-583.
Mueller, D.K. and D.R. Helsel. 1996. Nutrients in the nation’s waters: Too much
of a good thing? U.S. Geological Survey Circular 1136. National Climatic Data Center. 1994. Asheville, North Carolina.
Mullen, R.W., K.W. Freeman, W.R. Raun, G.V. Johnson, M.L. Stone, and J.B.
Solie. 2003. Identifying an in-season response index and the potential to increase wheat yield with nitrogen. Agron. J. 95:347-351.
Nixon, S.W. 1995. Coastal marine eutrophication: A definition, social causes,
and future concerns. Ophelia 41:199-219. Norwood, C.A. 1994. Profile water distribution and grain yield as affected by
cropping system and tillage. Agron. J. 86:558-563. Norwood, C.A., and R.S. Currie. 1996. Tillage, planting date, and plant
population effects on dryland corn. J. Prod. Agric. 9:119-122. Owens, L.B., R.W. Malone, M.J. Shipitalo, W.M. Edwards, and J.V. Bonta. 2000.
Lysimeter study of nitrate leaching from a corn-soybean rotation. J. Environ. Qual. 29:467-474.

38
Pan, W.L., E.J. Kamprath, R.H. Moll, and W.A. Jackson. 1984. Prolificacy in
corn: Its effects on nitrate and ammonium uptake and utilization. Soil Sci. Soc. Am. J. 48:1101-1106.
Pang, X.P., J. Letey, and L. Wu. 1997. Yield and nitrogen uptake prediction by
CERES-Maize model under semiarid conditions. Soil Sci. Soc. Am. J. 61:254-256.
Peterson, T.A., T.M. Blackmer, D.D. Francis, and J.S. Schepers. 1993. Using a
chlorophyll meter to improve N management. NebGuide G93-1171-A. Cooperative Extension, Institute of Agriculture and Natural Resources, Univ. of Nebraska-Lincoln.
Phillips, S.B., W.R. Raun, and G.V. Johnson. 1997. Seasonal and long-term
changes in nitrate-nitrogen content of well water in Oklahoma. J. Environ. Qual. 26:1632-637.
Randall, G.W., D.R. Huggins, D.J. Fuchs, D.D. Buhler, M.P. Russelle, W.P.
Koskinen, and J.L. Anderson. 1994. Cropping system effects on water, nitrate, and pesticide losses through tile drainage. Minnesota Water ’94 Conf., April 1994.
Rasmussen, M.S. 1998. Developing simple, operational, consistent NDVI-
vegetation models by applying environmental and climatic information. Part II: Crop yield assessment. Int. J. Remote Sensing 19(1):119-139.
Raun, W.R., and G.V. Johnson. 1999. Improving nitrogen use efficiency for
cereal production. Agron. J. 91:357-363. Raun, W.R., J.B. Solie, G.V. Johnson, M.L. Stone, R.W. Mullen, K.W. Freeman,
W.E. Thomason, and E.V. Lukina. 2002. Improving nitrogen use efficiency in cereal grain production with optical sensing and variable rate application. Agron. J. 94:815-820.
Rehm, G. and M. Schmitt. 1989. Setting realistic crop yield goals. Minnesota
Ext. Serv. Ag-FS-3873. Univ. of Minnesota. Rice, C.W., and M.S. Smith. 1982. Denitrification in no-till and plowed soils. Soil
Sci. Soc. Am. J. 46:1168-1173. Rodriguez, M.B., and N. Giambiagi. 1995. Denitrification in tillage and no-tillage
Pampean soils: relationships among soil water, available carbon, and nitrate and nitrous oxide production. Commun. Soil. Sci. Plant Anal. 26:3205-3220.

39
SAS Institute. 1990. SAS/STAT user’s guide. Release 6.03 ed. SAS Inst., Cary, NC.
Schepers, J.S., D.D. Francis, and M.T. Thompson. 1989. Simultaneous
determination of total C, total N, and 15N on soil and plant material. Commun. Soil Sci. Plant Anal. 20:949-959.
Schepers, J.S., D.D. Francis, M. Vigil, and F.E. Below. 1992. Comparison of
corn leaf nitrogen concentration and chlorophyll meter readings. Commun. Soil Sci. Plant Anal. 23(17-20):2173-2187.
Schuman, G.E. and L.F. Elliott. 1978. Cropping an abandoned feedlot to
prevent deep percolation of nitrate-nitrogen. Soil Sci. 126:237-243. Shrestha, R.K. and J.K. Ladha. 1998. Nitrate in groundwater and integration of
nitrogen-catch crop in rice-sweet pepper cropping system. Soil Sci. Soc. Am. J. 62:1610-1619.
Schuh, W.M., D.L. Klinkebiel, J.C. Gardner, and R.F. Meyer. 1997. Tracer and
nitrate movement to groundwater in the Northern Great Plains. J. Environ. Qual. 26:1335-1347.
Smika, D.E., and P.W. Unger. 1986. Effect of surface residues on soil water
storage. Adv. Soil. Sci. 5:111-138. Spellman, D.E., A. Rongni, D.G. Westfall, R.M. Waskom, and P.N. Soltanpour.
1996. Pre-sidedress nitrate soil testing to manage nitrogen fertility in irrigated corn in a semi-arid environment. Commun. Soil Sci. Plant Anal. 27:561-574.
Stinner, B.R., G.D. Hoyt, and R.L. Todd. 1983. Changes in soil chemical
properties following a 12-year fallow: A 2-year comparison of conventional tillage and no-tillage agroecosystems. Soil Tillage Res. 3:277-290.
Stone, M.L., J.B. Solie, W.R. Raun, R.W. Whitney, S.L. Taylor, and J.D. Ringer.
1996. Use of spectral radiance for correcting in-season fertilizer nitrogen deficiencies in winter wheat. Trans. ASAE. 39(5):1623-1631.
U.S. Environmental Protection Agency (EPA). 1999a. National Primary Drinking
Water Regulations Technical Fact Sheets. Washington, D.C.: Office of Water, Office of Ground Water and Drinking Water. http://www.epa.gov/OGWDW/hfacts.html. March
U.S. Environmental Protection Agency. 1999b. Risk of Groundwater Nitrate
Contamination. Watershed Information Network. Available at http://www.epa.gov/iwi/1999april/iii21usmap.html. April

40
Varvel, G.E. 1994. Monoculture and rotation system effects on precipitation use
efficiency in corn. Agron. J. 86:204-208. Varvel, G.E., J.S. Schepers, and D.D. Francis. 1997. Ability for in-season
correction of nitrogen deficiency in corn using chlorophyll meters. Soil Sci. Soc. Am. J. 61:1233-1239.
Waddell, J.T., and R.R. Weil. 1996. Water distribution in soil under ridge-till and
no-till corn. Soil Sci. Soc. Am. J. 60:230-237. Walton, G. 1951. Survey of literature relating to infant methemoglobinemia due to
nitrate-contaminated water. Am. J. Public Health. 41: 986-996. Weil, R.R., R.A. Weismiller, and R.S. Turner. 1990. Nirate contamination of
groundwater under irrigated Coastal Plain soils. J. Environ. Qual. 19:441-448.
Wienhold, B.J., T.P. Trooien, and G.A. Reichman. 1995. Yield and nitrogen use
efficiency of irrigated corn in the Northern Great Plains. Agron. J. 87:842-846.
Wolfe, D.W., D.W. Henderson, T.C. Hsiao, and A. Alvino. 1988. Interactive
water and nitrogen effects on senescence of maize: II. Photosynthetic decline and longevity of individual leaves. Agron. J. 80:865-870.
Yadav, S.N. 1997. Formulation and estimation of nitrate-nitrogen leaching from
corn cultivation. J. Environ. Qual. 26:808-814.

41
Table 1. Initial surface (0-15cm) soil test results prior to experiment initiation at Greenlee Farm, Haskell, and LCB, OK.
NH4-N NO3-N P K Sample ------------------- mg kg-1 ------------------- pH Haskell 2002-03 (0-15 cm) 7.65 2.66 48 136 6.18 LCB (0-15 cm) 14.28 1.63 23 239 6.13 Haskell 2004 (0-15 cm) NA 20.00 112 218 6.70 Greenlee Farm (0-15 cm) 2.65 6.26 13 147 5.67
NH4-N and NO3-N – 2 M KCL extract; P and K – Mehlich-3 extraction; pH – 1:1 soil:deionized water; NA- not available Table 2. Planting, fertilizer, and harvest dates at Greenlee Farm, Haskell, and LCB, OK, 2002-04.
Location Crop Year Planting Fertilizer
Application Grain Harvest
Haskell 2002 4-18-2002 4-16-2002 9-11-2002
LCB 2002 4-23-2002 4-23-2002 8-28-2002
Haskell 2003 4-03-2003 4-03-2003 8-20-2003
LCB 2003 4-01-2003 4-08-2003 8-07-2003
Greenlee Farm 2004 3-31-2004 3-31-2004 8-17-2004
Haskell 2004 4-01-2004 4-01-2004 8-31-2004
LCB 2004 4-03-2004 4-03-2004 8-28-2004

Table 3. Sensing dates by growth stage at Greenlee Farm, Haskell, and LCB, OK, 2002 to 2004.
Vegetative growth stages (V#) determined by number of collared leaves. Depending on hybrid and environmental conditions plants produce between 11 to 20 collared leaves (V11-V20), in 2004 only 12 collared leaves were observed before tasseling.
--------- 2002 -------- -------- 2003 -------- ---------------- 2004 --------------- Growth Stage Physiological Description Haskell LCB Haskell LCB Greenlee Haskell LCB
V5 Ear and shoot development complete --- --- --- --- 5-17-04 5-17-04 5-15-04
V6 --- --- 5-22-03 5-21-03 5-22-04 5-22-04 5-18-04 V7
Third whorl elongated, growing point above surface --- 6-15-02 5-26-03 5-24-03 5-27-04 --- 5-23-04
V8 --- --- 5-30-03 6-02-03 5-31-04 5-27-04 5-29-04 V9
Fourth whorl elongated, nutrient deficiencies appear --- --- --- 6-07-03 --- 5-31-04 6-01-04
V10 6-19-02 --- 6-6-03 --- 6-08-04 --- --- V11
Rapid biomass growth, new leaves occur every 2-3 days --- --- --- --- --- 6-08-04 ---
V12 --- --- --- --- 6-15-04 --- 6-08-04 V15-V16
Brace roots develop, ear size and kernel number determined --- --- 6-15-03 6-14-03 --- --- ---
VT (Tasseling)
Tassel development, maximum plant height, pollen shed begins --- --- --- --- --- --- ---
R1 (Silking)
Silks develop and pollination occurs, kernel fill begins 7-11-02 7-09-02 6-21-03 6-20-03 6-29-04 6-15-04 6-16-04
R2 (Blister)
Silks darken and dry, kernels white and blister shaped, starch develops --- --- 6-27-03 6-25-03 --- 6-29-04 6-26-04
R3 (Milk)
Kernels turn yellow externally, but milking internal fluid --- --- 7-7-03 --- 7-10-04 --- ---
R4 (Dough)
Kernels thicken to a paste, 50% kernel dry weight --- --- 7-18-03 --- 7-16-04 7-09-04 7-09-04
R5 (Dent)
Kernels have dented at top, the milk line appears --- --- --- --- --- 7-16-04 7-17-04
42

43
Table 4. Corn grain yield treatment means by location, Haskell and Lake Carl Blackwell, OK, 2002.
SED is the standard error of the difference between two equally replicated means. Haskell population (pop) was: 44,460 seeds ha-1 (low) and 66,690 seeds ha-1 (high). LCB (Lake Carl Blackwell) population was: 35,568 seeds ha-1 (low) and 51,870 seeds ha-1 (high).
Table 5. Corn grain yield treatment means by location, Haskell and Lake Carl Blackwell, OK, 2003.
SED is the standard error of the difference between two equally replicated means. Haskell population (pop) was: 49,400 seeds ha-1 (low) and 71,630 seeds ha-1 (high). LCB (Lake Carl Blackwell) population was: 35,568 seeds ha-1 (low) and 51,870 seeds ha-1 (high).
Treatment Haskell Lake Carl Blackwell
105-day 109-day 113-day 105-day 109-day 113-day Plant pop.
N rate (kg ha-1) ----------------------------- Mg ha-1 ----------------------------
0 5.49 4.32 5.64 1.49 1.54 2.01
56 5.25 5.07 5.47 1.71 2.07 2.54
112 5.22 4.57 5.47 2.00 1.57 2.81 Low
Hybrid Avg. 5.32 4.65 5.53 1.73 1.73 2.45
0 4.85 5.54 5.71 0.97 1.11 1.58
56 5.19 5.02 5.44 1.57 1.98 2.16
112 5.01 5.64 5.68 1.86 2.96 2.72 High
Hybrid Avg. 5.02 5.40 5.61 1.47 2.02 2.15 SED 0.15 0.52 0.38 0.24 0.36 0.25
Treatment Haskell Lake Carl Blackwell 104-day 107-day 111-day 104-day 107-day 111-day Plant
pop. N rate
(kg ha-1) -------------------------------- Mg ha-1 ------------------------------- 0 6.37 6.41 5.89 4.26 2.49 3.30 56 6.74 6.23 5.79 3.95 2.77 3.49
112 6.94 6.50 5.91 3.51 3.96 3.35 Low
Hybrid Avg. 6.68 6.38 5.86 3.91 3.07 3.38 0 6.16 6.21 5.63 3.85 3.82 3.88 56 6.92 6.17 5.50 4.88 4.89 3.18
112 6.67 6.62 5.75 4.64 4.02 3.66 High
Hybrid Avg. 6.58 6.33 5.63 4.46 4.24 3.57 SED 0.22 0.406 0.218 0.62 0.83 0.34

44
Table 6. Effect of hybrid, plant population, and N rate on grain yield by location, Greenlee Farm, Haskell, and Lake Carl Blackwell, OK, 2004.
SED is the standard error of the difference between two equally replicated means.
Treatment Greenlee Farm Haskell Lake Carl Blackwell 99-day 113-day 99-day 113-day 99-day 113-day Plant pop.
(Plant ha-1) N rate
(kg ha-1) -------------------------------- Mg ha-1 ------------------------------- 0 3.01 6.89 6.11 6.85 6.68 7.70
84 3.18 6.69 7.30 8.50 6.93 8.23 168 3.43 5.82 7.47 9.27 7.34 8.67
37,050
Hybrid Avg. 3.30 6.25 6.96 8.21 7.25 8.20 0 5.58 7.44 7.37 7.27 8.08 8.50
84 4.47 8.34 9.04 9.62 7.99 10.57 168 6.04 8.43 8.48 9.88 8.95 10.20
51,870
Hybrid Avg. 5.26 8.38 8.29 8.92 8.34 9.73 0 5.21 8.18 7.33 6.95 8.75 10.50
84 6.06 9.46 10.05 10.89 9.50 9.97 168 7.11 9.41 10.05 11.43 8.94 10.87
66,690
Hybrid Avg. 6.58 9.43 9.14 9.75 9.04 10.44 0 4.81 6.99 7.46 6.89 8.81 8.74
84 6.11 9.91 10.23 10.78 10.49 10.48 168 6.42 9.99 10.24 11.56 9.08 11.67
81,510
Hybrid Avg. 6.26 9.96 9.31 9.74 9.65 10.30 SED 0.87 1.00 0.51 0.57 1.02 1.46

45
Table 7. Nitrogen Use Efficiency treatment means by location, Haskell and Lake Carl Blackwell, OK, 2002.
NUE= (Grain N uptake of N treatment – Grain N uptake of check) / Nrate SED is the standard error of the difference between two equally replicated means. Haskell population (pop) was: 44,460 seeds ha-1 (low) and 66,690 seeds ha-1 (high). LCB (Lake Carl Blackwell) population was: 35,568 seeds ha-1 (low) and 51,870 seeds ha-1 (high).
Table 8. Nitrogen Use Efficiency treatment means by location, Haskell and Lake Carl Blackwell, OK, 2003.
NUE= (Grain N uptake of N treatment – Grain N uptake of check) / Nrate SED is the standard error of the difference between two equally replicated means. Haskell population (pop) was: 49,400 seeds ha-1 (low) and 71,630 seeds ha-1 (high). LCB (Lake Carl Blackwell) population was: 35,568 seeds ha-1 (low) and 51,870 seeds ha-1 (high).
Treatment Haskell Lake Carl Blackwell
105-day 109-day 113-day 105-day 109-day 113-day Plant pop.
N rate (kg ha-1) ----------------------------------- % ----------------------------------
56 0 22 1 16 23 22
112 2 3 0 20 7 15 Low
Hybrid Avg. 0 13 0 18 15 18
56 7 0 0 30 29 19
112 1 10 0 25 29 19 High
Hybrid Avg. 4 2 0 27 29 19 SED 6 12 9 13 7 5
Treatment Haskell Lake Carl Blackwell
104-day 107-day 111-day 104-day 107-day 111-day Plant pop.
N rate (kg ha-1) ----------------------------------- % ----------------------------------
56 22 9 8 10 6 11
112 16 9 6 0 20 5 Low
Hybrid Avg. 19 9 7 3 17 8
56 21 7 9 26 60 5
112 13 8 1 14 20 8 High
Hybrid Avg. 17 7 4 20 40 2 SED 7 10 5 12 13 8

46
Table 9. Effect of hybrid, plant population, and N rate on NUE by location, Greenlee Farm, Haskell, and Lake Carl Blackwell, OK, 2004.
NUE= (Grain N uptake of N treatment – Grain N uptake of check) / Nrate SED is the standard error of the difference between two equally replicated means.
Treatment Greenlee Farm Haskell Lake Carl Blackwell 99-day 113-day 99-day 113-day 99-day 113-day Plant pop.
(Plant ha-1) N rate
(kg ha-1) ----------------------------------- % ---------------------------------- 84 8 13 43 48 10 18 168 6 0 21 36 5 15 37,050
Hybrid Avg. 7 3 32 42 8 17 84 0 27 49 71 14 31 168 10 23 24 39 26 22 51,870
Hybrid Avg. 0 25 37 55 20 25 84 16 25 79 89 33 5 168 25 25 45 58 14 14 66,690
Hybrid Avg. 21 25 62 74 22 10 84 23 39 76 94 55 48 168 17 33 41 61 11 39 81,510
Hybrid Avg. 20 36 59 78 40 44 SED 14 20 9 12 22 20

47
Figure 1. Effect of plant population on RNDVI for two sensor readings in three hybrids at Haskell and LCB, OK, 2002.
0.25
0.35
0.45
0.55
0.65
0.75
0.85
V10 R1 V7 R1
Haskell Location LCB
RN
DVI
low pop, 105-day
high pop, 105-day
low pop, 109-day
high pop, 109-day
low pop, 113-day
high pop, 113-day
Figure 2. Effect of plant population on RNDVI over time in three hybrids at Haskell, OK, 2003.
0.45
0.5
0.55
0.6
0.65
0.7
0.75
0.8
0.85
0.9
0.95
V6 V7 V8 V10 V16 R1 R2 R3 R4
RNDV
I
low pop, 104-day high pop,104-day low pop, 107-dayhigh pop, 107-day low pop, 111-day high pop, 111-day

48
Figure 3. Relationship between RNDVI and plant population of three hybrids at the V8 growth stage over two locations with 0 N treatments removed fitted to a linear-plateau model, 2003.
Figure 4. Relationship between RNDVI and plant population of three hybrids at the R2 growth stage over two locations with 0 N treatments removed fitted to a linear-plateau model, 2003.
0
0.1
0.2
0.3
0.4
0.5
0.6
0.7
0.8
0.9
1
0 20000 40000 60000 80000 100000
Plant population (plants ha-1)
RNDV
I 104-day
107-day
111-dayLinear-Plateau Model0.8190 = 0.2113 + 1E-105 * 60759
R2 = 0.81NDVI plateau = 0.8190
Plant population joint = 60759
0
0.1
0.2
0.3
0.4
0.5
0.6
0.7
0.8
0.9
1
0 20000 40000 60000 80000 100000
Plant population (plants ha-1)
RNDV
I 104-day
107-day
111-dayLinear-Plateau Model
0.8282 = 0.5732 + 5E-107 * 53797R2 = 0.67
NDVI plateau = 0.8282Plant population joint = 53797

49
Figure 5. Effect of plant population on GNDVI over time in the 168 kg N ha-1 pre-plant treatment of the 113bt-day hybrid at Haskell, OK, 2004.
Figure 6. Effect of plant population on RNDVI over time in the 168 kg N ha-1 pre-plant treatment of the 113bt-day hybrid at Haskell, OK, 2004.
0.2
0.3
0.4
0.5
0.6
0.7
0.8
0.9
V5 V6 V8 V9 V11 R1 R2-R3 R4 R5
GND
VI
37,050 51,870 66,690 81,510
0.2
0.3
0.4
0.5
0.6
0.7
0.8
0.9
V5 V6 V8 V9 V11 R1 R2-R3 R4 R5
RNDV
I
37,050 51,870 66,690 81,510
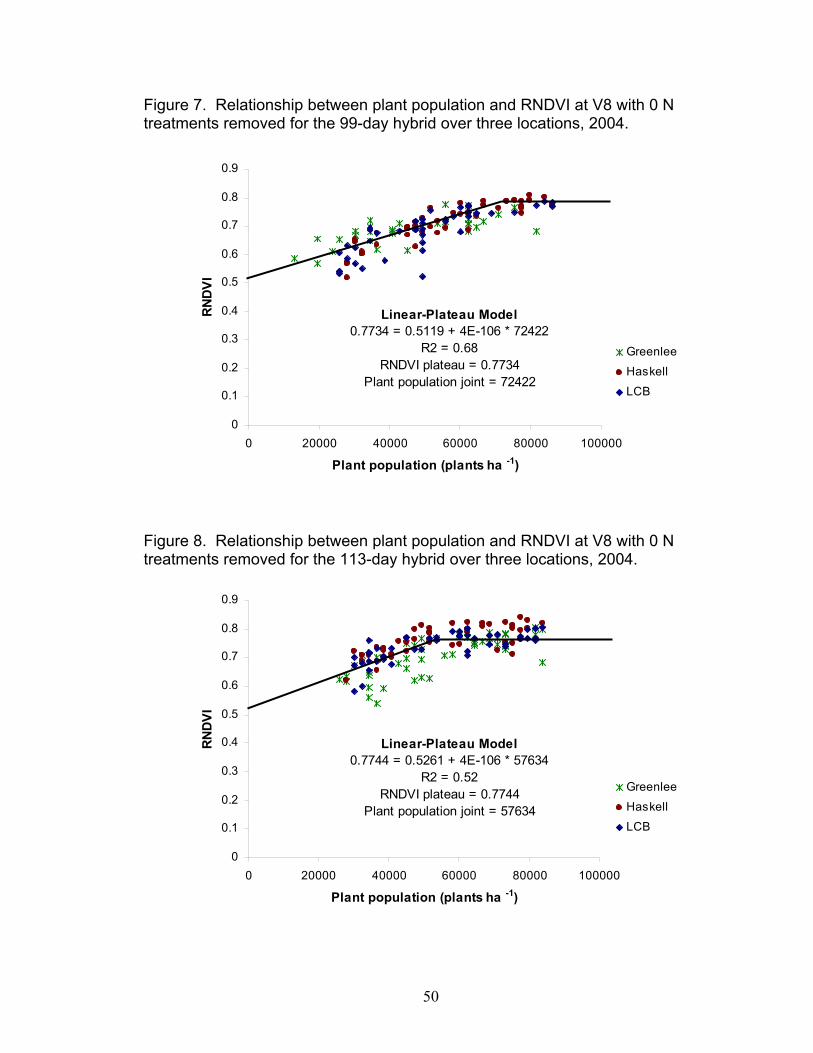
50
Figure 7. Relationship between plant population and RNDVI at V8 with 0 N treatments removed for the 99-day hybrid over three locations, 2004.
Figure 8. Relationship between plant population and RNDVI at V8 with 0 N treatments removed for the 113-day hybrid over three locations, 2004.
0
0.1
0.2
0.3
0.4
0.5
0.6
0.7
0.8
0.9
0 20000 40000 60000 80000 100000
Plant population (plants ha -1)
RND
VI
Greenlee
Haskell
LCB
Linear-Plateau Model0.7734 = 0.5119 + 4E-106 * 72422
R2 = 0.68RNDVI plateau = 0.7734
Plant population joint = 72422
0
0.1
0.2
0.3
0.4
0.5
0.6
0.7
0.8
0.9
0 20000 40000 60000 80000 100000
Plant population (plants ha -1)
RND
VI
Greenlee
Haskell
LCB
Linear-Plateau Model0.7744 = 0.5261 + 4E-106 * 57634
R2 = 0.52RNDVI plateau = 0.7744
Plant population joint = 57634
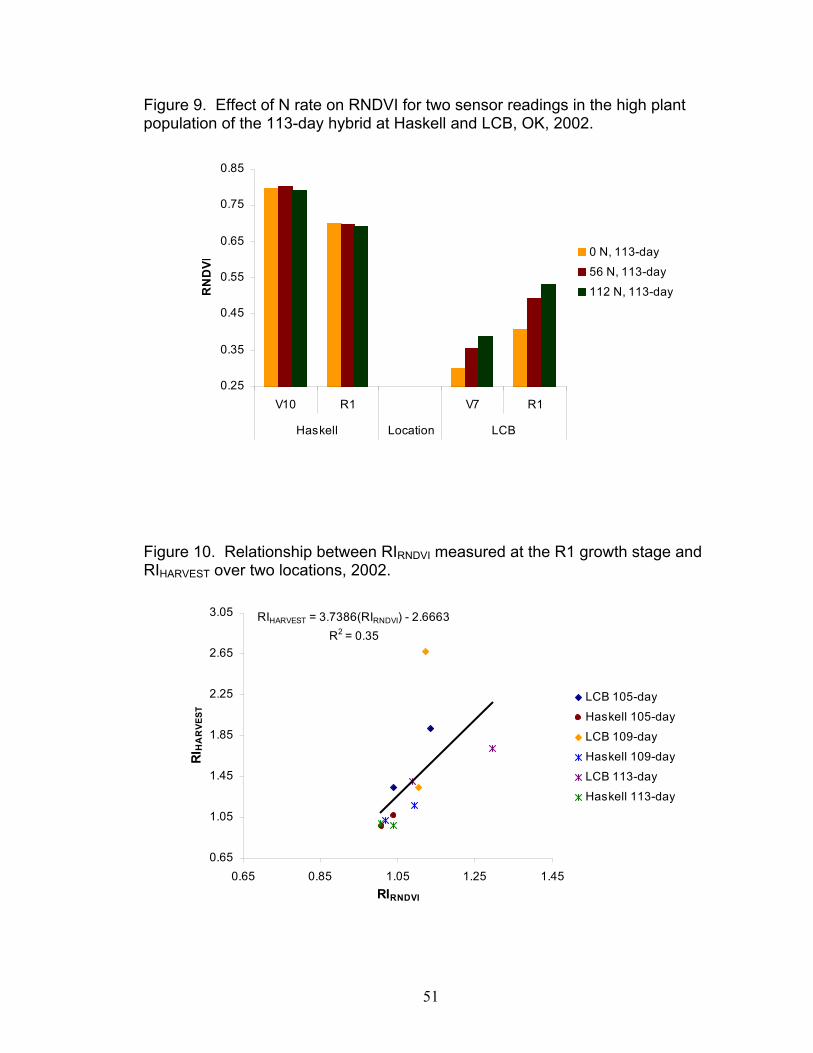
51
Figure 9. Effect of N rate on RNDVI for two sensor readings in the high plant population of the 113-day hybrid at Haskell and LCB, OK, 2002.
Figure 10. Relationship between RIRNDVI measured at the R1 growth stage and RIHARVEST over two locations, 2002.
0.25
0.35
0.45
0.55
0.65
0.75
0.85
V10 R1 V7 R1
Haskell Location LCB
RN
DVI
0 N, 113-day
56 N, 113-day
112 N, 113-day
RIHARVEST = 3.7386(RIRNDVI) - 2.6663R2 = 0.35
0.65
1.05
1.45
1.85
2.25
2.65
3.05
0.65 0.85 1.05 1.25 1.45RIRNDVI
RI H
AR
VEST
LCB 105-day
Haskell 105-day
LCB 109-day
Haskell 109-day
LCB 113-day
Haskell 113-day

52
Figure 11. Effect of N rate on RNDVI over time in the high plant population of the 104-day hybrid at Haskell, OK, 2003.
Figure 12. Relationship between RIRNDVI measured at the R2 growth stage and RIHARVEST over two locations, 2003.
0.45
0.5
0.55
0.6
0.65
0.7
0.75
0.8
0.85
0.9
0.95
V6 V7 V8 V10 V16 R1 R2 R3 R4
RND
VI
0 N 56 N 112 N
RIHARVEST = 0.7492(RIRNDVI) + 0.2252R2 = 0.20
0.65
0.85
1.05
1.25
1.45
1.65
1.85
0.65 0.85 1.05 1.25 1.45RIRNDVI
RI H
AR
VEST
LCB 104-day
Haskell 104-day
LCB 107-day
Haskell 107-dayLCB 111-day
Haskell 111-day

53
Figure 13. Effect of N rate on GNDVI over time in the 66,690 plants ha -1 plant population of the 113-day hybrid at Haskell, OK, 2004.
Figure 14. Effect of N rate on RNDVI over time in the 66,690 plants ha -1 plant population of the 113bt-day hybrid at Haskell, OK, 2004.
0.2
0.3
0.4
0.5
0.6
0.7
0.8
0.9
V5 V6 V8 V9 V11 R1 R2-R3 R4 R5
GND
VI
0 N 84 N 164 N
0.2
0.3
0.4
0.5
0.6
0.7
0.8
0.9
V5 V6 V8 V9 V11 R1 R2-R3 R4 R5
RND
VI
0 N 84 N 164 N

54
Figure 15. Relationship between RIGNDVI measured at the V8 growth stage and RIHARVEST over three locations, 2004.
Figure 16. Relationship between RIRNDVI measured at V8 growth stage and RIHARVEST over three locations, 2004.
RIHARVEST = 2.0658(RIRNDVI) - 0.9408R2 = 0.61
0.65
0.85
1.05
1.25
1.45
1.65
1.85
0.65 0.75 0.85 0.95 1.05 1.15 1.25
RIRNDVI
RI H
AR
VEST
LCB 99-day
Haskell 99-day
Greenlee 99-day
LCB 113-day
Haskell 113-day
Greenlee 113-day
RIHARVEST = 2.8342(RIGNDVI) - 1.7858R2 = 0.61
0.65
0.85
1.05
1.25
1.45
1.65
1.85
0.65 0.75 0.85 0.95 1.05 1.15 1.25
RIGNDVI
RIH
AR
VEST
LCB 99-day
Haskell 99-day
Greenlee 99-day
LCB 113-day
Haskell 113-day
Greenlee 113-day

55
Figure 17. Relationship between grain yield and RNDVI in the R1 growth stage over two locations, 2002.
Confidence intervals set at 95%.
Figure 18. Relationship between RNDVI and RCV derived from RNDVI in the R1 growth stage over two locations, 2002.
Confidence intervals set at 95%.
Grain yield = 12.866(RNDVI) - 3.9245R2 = 0.86
0
1
2
3
4
5
6
7
0.2 0.3 0.4 0.5 0.6 0.7 0.8
RNDVI
Gra
in y
ield
(Mg
ha-1
)
105-day
109-day
113-day
RCV = -80.894(RNDVI) + 66.004R2 = 0.94
0
5
10
15
20
25
30
35
40
45
0.2 0.3 0.4 0.5 0.6 0.7 0.8
RNDVI
RCV
105-day109-day
113-day
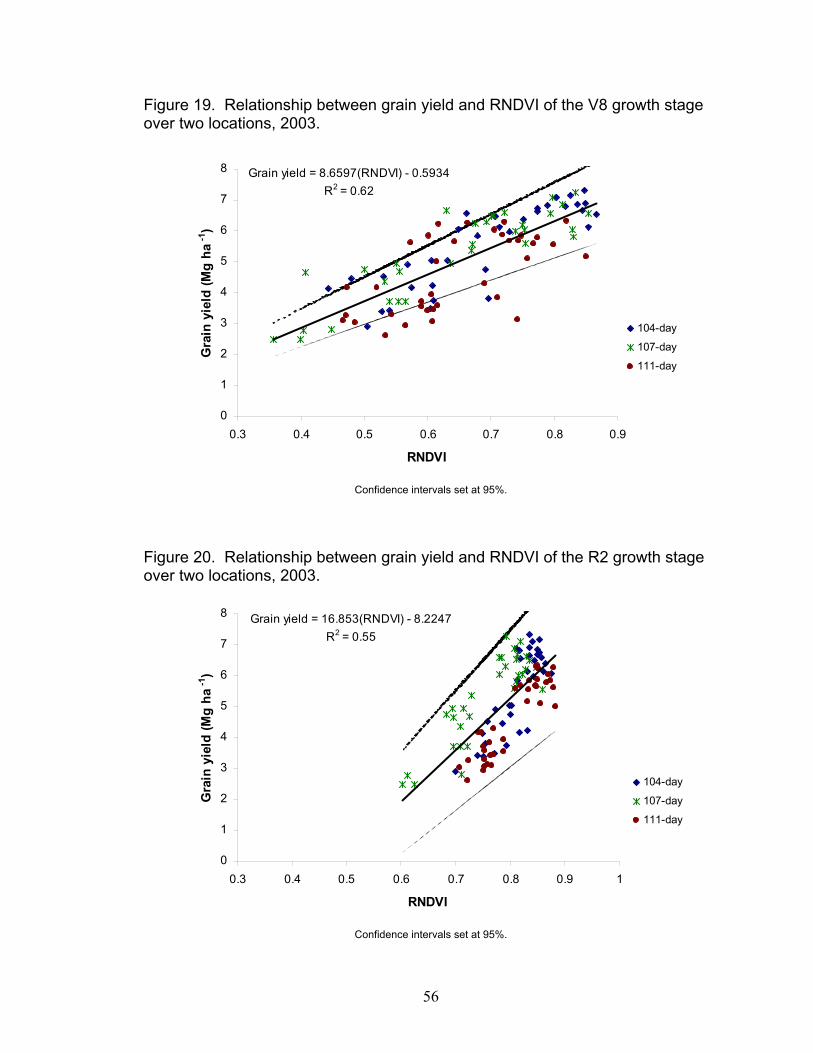
56
Figure 19. Relationship between grain yield and RNDVI of the V8 growth stage over two locations, 2003.
Confidence intervals set at 95%.
Figure 20. Relationship between grain yield and RNDVI of the R2 growth stage over two locations, 2003.
Confidence intervals set at 95%.
Grain yield = 16.853(RNDVI) - 8.2247R2 = 0.55
0
1
2
3
4
5
6
7
8
0.3 0.4 0.5 0.6 0.7 0.8 0.9 1
RNDVI
Gra
in y
ield
(Mg
ha-1
)
104-day
107-day
111-day
Grain yield = 8.6597(RNDVI) - 0.5934R2 = 0.62
0
1
2
3
4
5
6
7
8
0.3 0.4 0.5 0.6 0.7 0.8 0.9
RNDVI
Gra
in y
ield
(Mg
ha-1
)
104-day
107-day
111-day

57
Figure 21. Relationship between RNDVI and RCV derived from RNDVI of the V8 growth stage over two locations, 2003.
Confidence intervals set at 95%.
Figure 22. Relationship between RNDVI and RCV derived from RNDVI of the R2 growth stage over two locations, 2003.
Confidence intervals set at 95%.
RCV = -71.333(RNDVI) + 71.123R2 = 0.86
0
5
10
15
20
25
30
35
0.3 0.4 0.5 0.6 0.7 0.8 0.9 1
RNDVI
RCV
104-day
107-day
111-day
RCV = -75.183(RNDVI) + 70.44R2 = 0.86
0
10
20
30
40
50
60
0.3 0.4 0.5 0.6 0.7 0.8 0.9
RNDVI
RCV
104-day
107-day
111-day

58
Figure 23. Relationship between corn grain yield and RNDVI at V8 growth stage for the 99-day hybrid over three locations, 2004.
Confidence intervals set at 95%.
Figure 24. Relationship between corn grain yield and RNDVI at V8 growth stage for the 113-day hybrid over three locations, 2004.
Confidence intervals set at 95%.
Grain yield = 17.793(RNDVI) - 3.7468R2 = 0.72
0
2
4
6
8
10
12
14
0.3 0.4 0.5 0.6 0.7 0.8 0.9
RNDVI
Gra
in y
ield
(Mg
ha-1
)
Greenlee
Haskell
LCB
Grain yield = 13.303(RNDVI) - 0.1681R2 = 0.37
0
2
4
6
8
10
12
14
16
18
20
0.3 0.4 0.5 0.6 0.7 0.8 0.9
RNDVI
Gra
in y
ield
(Mg
ha-1
)
Greenlee
Haskell
LCB

59
Figure 25. Relationship between corn grain yield and RNDVI at R4 growth stage for the 99-day hybrid over three locations, 2004.
Confidence intervals set at 95%.
Figure 26. Relationship between corn grain yield and RNDVI at R4 growth stage for the 113-day hybrid over three locations, 2004.
Confidence intervals set at 95%.
Grain yield = 14.323(RNDVI) + 0.4543R2 = 0.41
0
2
4
6
8
10
12
14
16
18
20
0.2 0.3 0.4 0.5 0.6 0.7 0.8
RNDVI
Gra
in y
ield
(Mg
ha-1
)
Greenlee
Haskell
LCB
Grain yield = 19.121(RNDVI) - 2.2059R2 = 0.64
0
2
4
6
8
10
12
14
0.2 0.3 0.4 0.5 0.6 0.7 0.8
RNDVI
Gra
in y
ield
(Mg
ha-1
)
Greenlee
Haskell
LCB

60
Figure 27. Relationship between RNDVI and RCV derived from RNDVI at V8 growth stage for two hybrids over three locations, 2004.
Confidence intervals set at 95%.
Figure 28. Relationship between RNDVI and RCV derived from RNDVI at R4 growth stage for two hybrids over three locations, 2004.
Confidence intervals set at 95%.
RCV = -79.244(RNDVI) + 69.757R2 = 0.77
0
5
10
15
20
25
30
35
40
45
0.2 0.3 0.4 0.5 0.6 0.7 0.8 0.9
RNDVI
RCV
Greenlee
Haskell
LCB
RCV = -61.99(RNDVI) + 50.882R2 = 0.64
0
5
10
15
20
25
30
35
40
45
50
0.2 0.3 0.4 0.5 0.6 0.7 0.8
RNDVI
RCV
GreenleeHaskell
LCB

61
EFFECT OF TILLAGE AND ANHYDROUS AMMONIA
APPLICATION ON NITROGEN USE EFFEICIENCY
OF HARD RED WINTER WHEAT
ABSTRACT
Nitrogen use efficiency (NUE) in cereal grain production is estimated to be
33% throughout the world, and can be lower when N is applied in single, pre-
plant applications compared with split N applications. This study was conducted
to evaluate tillage system and anhydrous ammonia (AA) application methods on
yield, N uptake, and NUE in hard red winter wheat (Triticum aestivum L.), using a
narrow (10 cm) nozzle spacing on a V-blade (Noble or sweep blade) applicator
and wide (46 cm) nozzle spacing on a knife applicator. Over the four-year period
evaluated, conventional tillage was significantly higher in grain yield and grain N
uptake in five of eight site years over no-till. However, no-till was significantly
higher in grain yield and grain N uptake at Lahoma in 2003 where the highest
overall grain yield and grain N uptake was observed. Mixed results were
evaluated from NUE for tillage; four site years of no significant differences
between tillage systems and the other four site years split evenly between
conventional till and no-till. The V-blade improved NUE in no-till three site years
at Lahoma, but the knife applicator increased NUE the initial year at Efaw in no-
till. Previous crop residue disturbance averaged less than 15% for both AA
applicators all four, site years. Mid-season plant populations taken during the
2003 and 2004 crop years were insignificant three of the four site years and plant
population did not influence grain yield and NUE. No-till crop production reduced

62
soil compaction at Efaw and the V-blade applicator reduced soil compaction
within the no-till at both locations. Although the no-till system showed the
potential to produce grain yield and grain N levels comparable to conventional
tillage, conventional tillage had a distinct advantage in grain yield and grain N
uptake over the four-year duration of this study. A trend indicated that when
compared to conventional-till, no-till improved NUE the initial year or so after
establishment due to the increased demand of N for immobilization in low soil
inorganic N environments. The V-blade application method improved NUE in no-
till conditions at one site, potentially due to reduced soil compaction, but neither
AA applicator showed an advantage in conventional tillage.
INTRODUCTION
Soil erosion has been a major concern since the beginning of agriculture,
but it was not until the Great Dust Bowl of the 1930s that the problem received
worldwide attention. With so many deaths caused by black pneumonia and total
crop destruction by wind-borne soil in massive volumes, measures were taken to
make sure that this would never happen again. Among those new practices was
zero tillage. Zero tillage has been used as a means of annual crop production in
most parts of the country for well over thirty years, but not in the Southern Great
Plains. Anhydrous ammonia (AA) as a nitrogen fertilizer source is very popular in
winter wheat (Triticum aestivum L.) production in Oklahoma because of lower
cost compared to other nitrogen fertilizers. Limited published research has been
completed to show the effects of AA in winter wheat production in this area. This

63
study was conducted to determine if tillage and AA application methods affect
nitrogen use efficiency (NUE) of winter wheat in Oklahoma.
No-till was originally used as a method to stop soil erosion. Researchers
found that planting crops in previous crop stubble greatly reduced the amount of
soil removed by water and wind erosion. McGregor et al. (1992) reported that
during a 5-year period (1987 through 1991), no-till soybean yielded 44% more
than conventional-till yields. Intensive tillage has led to annual sediment
discharge of 15.9 Mg ha-1 in the southern Great Plains (Smith et al., 1991).
McGregor et al. (1992) reports indicated increasing soil losses with time under
conventional-till and decreasing soil loses with time for no-till. This study
conducted over 14 years; noted no-till soybean yields exceeded those of
conventional-till yields by 800 kg ha-1 yr-1 (McGregor et al., 1999). No-till reduced
runoff 1 to 35% over conventional-till and reduced soil loss by 23 to 77%
compared to conventional-till (McGregor et al., 1999). King et al. (1995),
McIsaac et al. (1990), Pesant et al. (1987) and Lembi et al. (1985), similarly
found that long-term no-till practices are effective and practical in reducing rill
erodibility and sediment loss. Brenneman and Laflen (1982) and Cogo et al.
(1984) concluded that residue cover reduces erosion in one of four ways: 1)
dissipation of the energy from raindrop impact: 2) slowing runoff, and increasing
flow depth, which in turn reduces the impact of raindrops: 3) absorption of some
of the forces from runoff that are usually applied to the soil surface: and 4)
creation of small reservoirs of ponded runoff causing deposition.

64
There have been several other unforeseen advantages of no-till over
conventional-till that researchers have discovered over time. Edwards et al.
(1990) found that no-till improved soil drainage, while Weersink et al. (1992)
stated that no-till reduces labor costs. Aase and Pikul (1995) found that in
annual spring wheat production, no-till was the most efficient crop and soil
management practice from the standpoint of yield, water use efficiency, soil
organic C, and bulk density. However, Mielke et al. (1986), Bruce et al. (1990),
Rhoton et al. (1993), and Vyn and Raimbault (1993) have reported that bulk
density increases under no-till versus conventional-till. Blevins et al. (1983),
Unger (1991), and Ismail et al. (1994) reported that tillage had no effect on bulk
density. Alternatively, Lal et al. (1994), Pikul and Aase (1995), and Dao (1993)
agreed with Aase and Pikul (1995) reporting that no-till reduced bulk density.
After looking at these studies in great detail, it can be concluded that no-till can
increase bulk density of soils by increasing soil compaction in saturated clay-
textured soils, but in dry clay-textured soils as well as silt and sandy soils of any
saturation level, bulk density will decrease with no-till compared to conventional-
till. There have been other controversies comparing no-till to conventional-till
systems as well as bulk density, one such argument being pH. Blevins et al.
(1977) and Dick (1983) found that pH decreased under no-till as compared to
conventional-till as nitrogen rates were increased, but Lal et al. (1994) found no
effect of tillage on pH.
Research has indicated that soil organic matter content is related to
amount of residue returned to the soil (Black, 1973; Campbell and Zentner, 1993;

65
Eghball et al., 1994; Christensen et al., 1994). In the semiarid regions where
dryland wheat is grown, soil organic carbon (C) and nitrogen (N) has declined
with years of cultivation (Dodge and Jones, 1948; Haas et al., 1957; Hobbs and
Brown, 1957; Young et al., 1960). This loss of soil organic C and N in the Great
Plains has been caused by the use of tillage and summer fallow, which have
accelerated organic matter decomposition rates and erosion (Ridley and Hedlin,
1968; Haas et al., 1957). Ismail et al. (1994), Lal et al. (1994), Christensen et al.
(1994), Unger (1991), and Wood et al. (1991) reported soil organic matter was
greater under no-till and increased with time in some instances. Lamb et al.
(1985) and Bauer and Black (1981) agreed with long-term studies where virgin
soils were put under cultivation, losses of soil organic C and N were much higher
for conventional-till than no-till systems. Allison (1973) found that most non-
legume crops acquire 30 to 100% of their N nutritional needs from soil organic
matter. Bauer and Black (1994) discovered that 1 Mg ha-1 of soil organic matter
contributed the equivalent of 15.6 kg ha-1 of wheat grain yield. Doran (1980),
Follett and Schimel (1989), Bakersman and deWit (1970), and Groffman (1984)
have reported that microbial activity is generally greater in the first few
centimeters of soil under no-till as compared to conventional-till, resulting in
reduced organic matter levels in conventional-till as compared to no-till systems.
Tillage significantly reduces the diversity of bacteria by reducing both substrate
richness and evenness (Lupwayi et al., 1998). Further comparisons showed that
no-till enhanced N immobilization and reduced nitrification rates when compared
to conventional-till (Doran, 1980; Stinner et al., 1983), often resulting in less
66
nitrate leaching (Elliott et al., 1986; Lamb et al., 1985) and leaving less nitrate in
the soil profile (Fenster and Peterson, 1979; Dowdell and Cannell, 1975).
Although there are lower nitrate levels in soil profiles in no-till systems, studies
have shown that nitrate has been found deeper in the profiles of no-till soils (Eck
and Jones, 1992).
The results of a 10-year study have shown that N-mineralization rates
were higher in annual cropping systems under no-till, than under conventional-till
(Wienhold and Halvorson, 1999). This increased mineralization is caused by
increased N stored as labile organic forms. Increased amounts of organic N will
supply more nitrogen to crops, which will result in less N required from fertilizers
as well as reduced leaching. Wienhold and Halvorson (1999) also believe that
higher N rates will increase immobilization because of the increased plant
residue resulting from the higher N rates increasing the C/N ratio of the residue.
Several other studies have shown that immobilization was higher at lower applied
N rates and crop N uptake was less with no-till systems (Kitur et al., 1984; Smith
and Sharpley, 1990; Wagger et al., 1985; Black and Reitz, 1972; Cochran et al.,
1980; Elliot et al., 1986; Dowdell and Crees, 1980; Knowles et al., 1993; Rice
and Smith, 1984). This research has also found evidence that immobilization of
surface applied N fertilizers accounts for most of the differences in N response
between no-till and conventional-till systems. Their research also shows that no-
till systems required more N fertilizer when surface applied at lower rates.
However, Fox and Bandel (1986) discovered that no-till increased mineralization
compared to conventional-till during the latter part of the growing season. Rice

67
and Smith (1982) and Rodriguez and Giambiagi (1995) found that no-till
enhances denitrification, because of the increase in soil water supply commonly
occurring in no-till, reducing the amount of aerobic activity in the soil. There are
some conflicting views between Wienhold and Halvorson (1999) and the others
stated above, but keep in mind that the Wienhold and Halvorson (1999) study
was long-term (10 years), while the others were short-term (5 years or less).
Wienhold and Halvorson were the only ones to account for the build up of soil
organic matter (OM), and it would not be possible for soil OM to be a major factor
in a short-term study.
Water use efficiency (WUE) is probably the most important advantage to
no-till systems over conventional-till. Bonfil et al. (1999) found that no-till
management over a 5-year study increased yields 62 to 67% in wheat-fallow
rotations and 18 to 75% in continuous wheat over conventional-till in semiarid
regions of Israel. Cantero-Martinez et al. (1999), Peterson et al. (1996), and
Kolberg et al. (1996) all found similar results in Australia and the Great Plains of
the United States. No-till increases WUE by reducing evaporation, increasing
water infiltration, improving soil structure, which in turn enhances root
development (Aase and Pikul, 1995; Holland and Felton, 1989; Jones and
Popham, 1997; Norwood, 1994; Smika and Unger, 1986; Waddell and Weil,
1996; Kirkegaard et al., 1995; Merrill et al., 1996; Dao, 1993; Lopez-Bellido et al.,
1996). Winter wheat is now being produced successfully and out-yielding spring
wheat in the Northern Great Plains of the United States and Canada without
requiring a fallow period, when no-till is used with adequate N fertilization

68
(Halvorson et al., 1999; Entz and Fowler, 1991). By increasing stored water in
the soil, no-till has reduced the detrimental effects of climate variability on annual
winter wheat production (Dao, 1993).
Studies have shown that deep placement of N can minimize volatilization
or immobilization losses. Placement of N is a major factor of N utilization and a
20% increase in NUE has been observed with band placement, compared to
surface broadcast (Soper et al., 1971; Toews and Soper, 1978; Tomar and
Soper, 1981). They found that N immobilization and increased N uptake could
be achieved by reducing fertilizer contact with the surface residue. Rao and Dao
(1996) found that final grain yield and grain N content were not affected by N
placement in plowed plots. No-till improved grain yield by 32% for a below the
seed row (BL) application and 15% for between the rows (BT) application. Grain
N content was increased by 33% for BL and 25% for BT as compared to a
surface broadcast application.
Anhydrous ammonia has the highest amount of fixation of all the forms of
ammonium releasing fertilizers (Young and Cattani, 1962). Since surface
applications of ammonium-based N can be lost to the atmosphere up to 70%
from volatilization (Hamid and Mahler, 1994) and nitrate more readily leaches
from the soil than ammonia (Blue and Eno, 1954), anhydrous ammonia (AA) has
the greatest potential to increase NUE in single pre-plant applications. Some
researchers have agreed that AA moves more in sandy soils with low CEC and
low moisture than finer textured soils with high CEC, but under moist conditions
and at depths over 10 cm, high rates of AA can be applied with little or no loss

69
from volatilization (Swart et al., 1971; Baker et al., 1959; Blue and Eno, 1954;
McDowell and Smith, 1958; Papendick and Parr, 1966). McDowell and Smith
(1958) found that ammonia losses were reduced considerably when the
applications were changed from 102 cm to 41 cm spacings. Swart et al. (1971)
supported this research with his own findings that show differences between 102
cm and 41 cm (greater yields and less ammonia loss at 41 cm), but no
differences between 15 cm and 41 cm. Swart et al. (1971) went on to report
while vertical movement remains constant (4 to 5 cm) regardless of N rate,
higher N rates usually cause greater lateral movement. Other research has
suggested that AA decreases pH and depletes the amount exchangeable Ca and
Mg leading to decreases in yield due to higher levels of aluminum accumulation
(Bouman et al., 1995; Robbins and Voss, 1989).
OBJECTIVE
This experiment was conducted to determine the effects of tillage and AA
application rate and placement on grain yield, grain N, and NUE of hard red
winter wheat.
MATERIALS AND METHODS
This experiment was conducted initially (2000-02) as a Master of Science
research project and continued in 2003 as part of a Doctor of Philosophy
research project. Two experimental sites were established in the fall of 2000,
one near Stillwater, OK at the Agronomy Research Station (Easpur loam fine-
loamy, mixed, superactive, thermic Fluventic Haplustoll), and one in Lahoma, OK
at the North-Central Oklahoma Research Station (Grant silt loam fine-silty,
70
mixed, thermic Udic Argiustoll). Initial soil test results are reported in Table 1.
The experiment employed an N rate by N method factorial arrangement in a
thrice replicated, randomized complete block design within each level of tillage.
Individual plots measured 3.0 x 4.6 m.
Anhydrous ammonia (82-0-0) was applied at rates of 0, 61, 123, and 185
kg N ha-1 using two different methods of injection. A rolling coulter applicator
(DMI) with five knives spaced 46 cm apart at a depth of 15 cm (Figure 1), a
method commonly used in nitrogen application of winter wheat, was used as one
method of AA application. The Noble or undercutting blade (V-Blade), an
experimental applicator, was used as the other method of AA application. The V-
blade applicator has a single coulter, centered in front of the point of the
undercutting blade, where AA was applied in 10 cm bands at a depth of 10 cm
and a total width of 1.5 meters (Figure 2). Wheat residue cover was measured
before and after AA applications on the no-till starting in 2002, using a modified,
line-intercept method as a means of determining residue disturbance by AA
application method (Morrison et al., 1997).
The winter wheat variety ‘Jagger’ was planted at both sites (planting and
fertilizer dates are reported on Table 2). At the Lahoma site, a seeding rate of 95
kg ha-1 was planted the initial year and increased to 125 kg ha-1 the second year
and was sustained through the third and fourth years in 19 cm rows within wheat
stubble from the previous year as well as conventionally worked ground. Triple
super phosphate (0-46-0) was applied pre-plant at a rate of 90 kg P2O5 ha-1 the
first two years at Lahoma to alleviate possible phosphorous deficiencies,

71
however starting in 2002 at both locations, triple super phosphate was banded
with the seed at a rate of 28 kg P2O5 ha-1. At the Efaw site, a seeding rate of 125
kg ha-1 was planted in 15 cm rows in grain sorghum stubble from the previous
summer as well as conventionally worked ground the first two years, but
beginning in 2002 the same seeding rate was planted in 18 cm rows within wheat
stubble from the previous year as well as conventionally worked ground. In this
case, conventional tillage at both sites consisted of disking throughout the
summer, and preparing the seedbed with a field cultivator.
Beginning in 2002, plant counts were taken from a 0.54 m2 area out of the
center of each plot for evaluation of plant stands as a potential independent
variable or covariate. By-plot soil samples were taken in the summer of 2002 at
0-15 cm depth and in 2004 at 0-15 and 15-30 cm to determine if tillage and/or AA
application method had an effect on soil properties. Furthermore, by-plot bulk
density measurements using a cylinder (7.5 x 15 cm) and soil compaction
measurements using an electronic cone penetrometer (SC 900 Soil Compaction
Meter, Spectrum Technologies, Inc.) at 2.5 cm intervals, to a depth of 30 cm
were taken post-harvest in 2004.
Wheat grain was harvested with a Massey Ferguson 8XP experimental
combine, removing an area of 2.0 x 4.6 m from the center of each plot. A
Harvest Master yield-monitoring computer installed on the combine was used to
record yield data. Grain yield from each plot was determined and a sub-sample
was taken for total N analysis. Response indices (RI) were calculated by dividing
the highest N treated grain yield average by the check (0 N rate) average. Grain

72
samples were dried in a forced air oven at 66oC, ground to pass a 140 mesh
sieve (100 um), and analyzed for total N content using a Carlo-Erba NA 1500
automated dry combustion analyzer (Schepers et al., 1989). Analyses of
variance and single degree of freedom contrasts were performed using SAS
(SAS, 1990).
RESULTS AND DISSCUSION
Grain Yield
Delayed planting due to inclement weather at planting time (Table 2)
resulted in poor establishment and limited tillering and wheat yield responses to
applied N were minimal in 2001 at both locations. However, grain yields were
much higher in all three of the preceding years, particularly in 2003 and 2004
when response to applied N was high. While there were no differences between
tillage systems at Efaw in 2001 and 2004, conventional tillage did result in
significantly higher grain yields at Efaw in 2002 and 2003 (Table 3). Similar
advantages in grain yield were observed for conventional tillage in 2001, 2002,
and 2004 at Lahoma, but in 2003 the no-till treatments had significantly higher
grain yields with three out of eight treatments averaging 5 Mg ha-1 (Table 4).
Grain yield was only significantly affected by N application method for the
Lahoma no-till in 2002 when the V-blade applicator increased yield over the knife
applicator, otherwise there was no significant difference between the applicators
on grain yield for either tillage system. At Efaw a positive linear response to N
using both applicators was observed in the no-till treatments in all four years
(Table 3). A positive linear trend was also observed at Efaw in the conventional

73
till treatments with the knife applicator in 2001 and 2004 and with the V-blade
applicator in 2001 (Table 3). A quadratic response to N occurred with the V-
blade applicator for conventional till in 2003 and 2004.
At Lahoma a positive linear response to N was observed with the knife
applicator for no-till in 2001 and 2004 and for conventional till in 2003 (Table 4).
Highly significant quadratic responses to N rate occurred at Lahoma with the
knife applicator for no-till in 2002 and 2003, as well as in 2004 for the
conventional till (Table 4). Quadratic N rate responses for the V-blade applicator
occurred at Lahoma for no-till in 2001, 2002, and 2004, but for conventional till in
2003. Although not specifically measured, increased N immobilization was likely
present in no-till plots. Highly significant interactions were found between tillage
and N rate in 2001, 2002, and 2004 at Lahoma, also response index (RI) values
were greater in five of eight site years for no-till when compared to conventional-
till. The lack of an interaction at the Efaw site in all four years would imply that
immobilization did not greatly affect N availability for wheat production, but N
response was high in 2003 and 2004 as were grain yields. This indicates that N
availability was only limited at Efaw during high yielding years possibly due to
limited sinks of plant available N in the soil.
Grain N Uptake
Grain N uptake was consistent with results for grain yield at both locations;
low the initial year and relativity high the following years. Grain N uptake in the
conventional tillage system was significantly higher than no-till at Efaw the first
three years, but not in 2004 (Table 5). At Lahoma there was 20 and 18 kg ha-1

74
advantages found for grain N uptake under conventional tillage compared to no-
till in 2002 and 2004, but in 2003 no-till was significantly higher in grain N uptake
than conventional till (Table 6). No significant differences were found in 2001
between the tillage practices. In 2001, knife application of AA increased grain N
uptake over that of the V-blade in no-till at Efaw, but the V-blade increased grain
N uptake over knife application of AA in conventional-till the second year. At
Lahoma in 2002, knife application of AA had an advantage in conventional-till;
conversely the V-blade had an advantage in no-till. No significant differences
were found between the AA applicators for either tillage in 2003 and 2004 at
either location.
Positive linear responses to N rate were detected in all four years at Efaw
for both applicators in the no-till (Table 5). Positive linear N responses were
observed at Efaw with the knife applicator for conventional till in 2001, 2002, and
2004. However the V-blade applicator showed a positive linear response for
conventional till just in 2001, but the V-blade applicator did show a quadratic
response for conventional till in 2004. At Lahoma, positive linear N responses
were observed with the knife applicator in 2001 and 2004 for no-till and in 2003
for conventional till (Table 6). Quadratic N responses with the knife applicator
occurred for conventional till in 2004 and for no-till in 2003. Positive N response
to the V-blade applicator at Lahoma occurred for no-till in 2003 and 2004.
However, quadratic N responses to the V-blade applicator were seen for
conventional till in 2003 and for no-till in 2001 and 2002. A significant interaction
was found between tillage and N rate at Lahoma for grain N uptake three out of

75
four years, maintaining the consistency established in grain yield that
immobilization did take place in the no-till plots.
Nitrogen Use Efficiency
Nitrogen use efficiency was generally low the first three years at Efaw and
the first two years at Lahoma. At Efaw, NUE was significantly higher for no-till in
2003 when compared to conventional till (Table 7). Nitrogen use efficiency was
significantly higher at Lahoma for the no-till in 2001, but in 2003 the conventional
till was higher (Table 8). Although at Lahoma both applicators were very
responsive to N for conventional tillage in 2003 and the knife applicator in 2004,
the V-blade applicator showed no response to N for conventional till in 2004.
This indicates that experimental error effected N response for the V-blade
applicator and created the false-positive result of no-till significantly improving
NUE in 2004. At Efaw, the knife applicator improved NUE over the V-blade in
no-till the initial year, but there were no significant differences in NUE between
the AA applicators in either tillage practice the following years. The V-blade
applicator increased NUE over knife applied AA at Lahoma in the no-till during
the 2001, 2002, and 2004 crop years.
A quadratic N response to NUE for the knife applicator was observed in
the no-till during the 2003 crop year at Efaw (Table 7). At Lahoma negative
linear N responses to NUE occurred for the knife applicator in conventional till
during the 2002, 2003, and 2004 crop years (Table 8). Negative linear N
responses to NUE were observed for the V-blade applicator at Lahoma in
conventional till the first three years and in no-till during the 2001, 2002, and

76
2004 crop years. Significant interaction between tillage and N method was
detected the initial year at Efaw as well as in 2002 and 2004 at Lahoma, further
revealing that tillage practices affected applicator efficiency.
Additional Parameters
In light of conflicting results being evaluated for the first two years of data
collection, additional parameters were measured starting in 2003. Previous crop
residue coverage was measured using a modified, line-intersect method in the
no-till at both sites before and after AA application to estimate residue
disturbance. Of the four site years of residue coverage data, a significant
difference was only found between the AA applicators at Efaw in 2003 where the
knife applicator caused less disturbance than the V-blade (data not shown).
Furthermore, residue disturbance averaged less than fifteen percent each year.
However, while the modified, line-intersect method prevented potential bias and
inaccuracy from using a visual estimate of residue coverage and disturbance, the
modified method limited accuracy to plus or minus five percent. As a result,
small differences in residue disturbance that occurred between the AA
applicators may have been overlooked.
In addition to residue coverage and disturbance, plant population was
measured mid-season during the 2003 and 2004 crop years. Significant
differences were noted for tillage and N method at Efaw in 2003 with the no-till
treatments having higher plant populations than the conventional till and V-blade
application method having higher plant populations in both tillage practices.

77
However, a linear relationship failed to exist between plant population and
residue coverage at Efaw in 2003 and no significant differences were found at
Efaw in 2004 or either year (2003-2004) at Lahoma (data not shown). This data
indicates that while plant population was influenced by AA application method at
Efaw in 2003, an additional, unidentified soil characteristic other than residue
coverage was improved by the V-blade applicator over the knife. Furthermore,
no significant differences were found between the AA applicators for grain yield
or NUE at Efaw in 2003, signifying that some other effect has caused the V-blade
advantage since plant population did not influence either grain yield or NUE.
Post-harvest by-plot soil samples were collected after the 2002 and 2004
crop years. In 2002, surface samples (0-15 cm) were taken, but in 2004 surface
and subsoil samples (15-30 cm) were collected. While complete data analysis
was conducted on the soil samples, only nitrate (NO3-N) and ammonium (NH4-N)
levels were found to be significant. The 2002 NO3-N levels at Lahoma were
significantly higher for the knife applicator in both tillage treatments (Table 9).
Furthermore, a positive linear NO3-N response to N rate was observed in the
conventional till for the knife applicator and a quadratic NO3-N response was
observed in the no-till for the knife applicator. In 2004, no significant differences
were observed in the conventional till at Lahoma, however in no-till higher NO3-N
levels were found in the surface soil over the subsoil. While at Lahoma no NO3-
N level differences occurred between the AA applicators in the no-till, quadratic
NO3-N responses to N rate were found in the surface soil with the V-blade
applicator and in the subsoil with the knife applicator (Table 9). At Efaw, the

78
2002 NO3-N levels showed a positive linear response to N rate in the
conventional till with the V-blade method, however no other significant
differences were found (Table 10). In 2004 NO3-N levels were significantly
higher at Efaw in the no-till as well as in the surface soil of both tillage systems
(Table 10). While no differences occurred between the AA applicators in 2004
NO3-N levels, positive linear NO3-N responses were found for the V-blade
applicator in the surface soil of both tillage systems.
Ammonium soil test levels at Lahoma in 2002 were significantly higher in
the no-till than the conventional till. In addition, positive linear NH4-N responses
to N rate were evaluated for the knife applicator in both tillage systems and a
quadratic NH4-N response was evaluated for the V-blade applicator in the
conventional till. In 2004 the V-blade applicator was significantly higher in
surface soil NH4-N for the conventional tillage and positive linear NH4-N
responses to N rate were found in the surface soil with the knife applicator for
both tillage systems. At Efaw NH4-N levels in 2002 were found to be significantly
higher in the no-till, but no other significant differences were seen. In 2004 at
Efaw, NH4-N levels were significantly higher in the surface soil of the no-till
otherwise no significant differences were found. Indicating that while some
significant NO3-N and NH4-N trends were found, these trends did not directly
and/or consistently affect N response in the dependent variables (grain yield and
NUE) and that some other factors were influencing N uptake in this trial.
Finally, soil compaction was evaluated after the 2004 harvest, measuring
bulk density (g cm3) and resistance (k Pa) in order to determine if tillage and/or

79
AA application method influenced soil compaction over the four-year period.
Bulk density was considerably lower at the Lahoma site compared to Efaw, but
no significant differences in bulk density were found in the treatments at either
location (data not shown). At Lahoma, the knife applicator had greater soil
compaction between the 0-15 and 25-30 cm depths in the no-till and at the 7.5
and 22.5-25 cm depths in the conventional till compared to the V-blade (Figure
5). No significant differences resulted between the tillage systems at Lahoma.
However, at Efaw no-till significantly reduced soil compaction at the 0-5 and 15-
20 cm depths (Figure 6). Furthermore, the knife applicator had greater soil
compaction between the 2.5-12.5 and 27.5-30 cm depths in no-till at Efaw
compared to the V-blade, but no differences were found between the AA
applicators in conventional till. No-till crop production reduced soil compaction at
Efaw and the V-blade applicator reduced soil compaction within the no-till at both
locations, but NUE was only improved with the V-blade in no-till at Lahoma and
no-till only improved NUE at Efaw one of four years. However, the Efaw soil
penetrometer data confirms the presence of a plough pan or root-limiting layer
characteristic of intensively tilled soil between the 12.5-17.5 cm depths across
both tillage systems (Figure 6). Potentially this explaining the limited
effectiveness of the V-blade at Efaw and a possible component of the generally
lower grain yields observed at Efaw compared to Lahoma.
CONCLUSIONS
Although the no-till system showed the potential to improve grain yield and
grain N levels compared to conventional tillage, conventional tillage had a distinct

80
advantage in grain yield and grain N uptake over the four-year duration of this
study. Nitrogen use efficiency was low at both locations the first two years of the
experiment and a trend demonstrated no-till to have an advantage the initial year
or so after establishment due to the increased demand of N for immobilization in
low soil inorganic N environments. A trend indicates that over time N response in
conventional till increased tremendously along with grain yield and eventually
exceeded no-till. Furthermore, the 61 kg ha-1 N rate appeared optimum in
conventional till while the 123 kg ha-1 N rate appeared optimum in no-till,
suggesting that no-till required higher additional N to maximize grain yield. The
V-blade applicator improved grain yield in no-till at one site. The V-blade
application method improved NUE in no-till conditions at one site, potentially due
to reduced soil compaction, but neither AA applicator showed an advantage in
conventional tillage. Previous crop residue disturbance averaged less than
fifteen percent for both AA applicators all four site years and residue disturbance
did not influence the AA application effects. Mid-season plant populations taken
during the 2003 and 2004 crop years were insignificant three of the four site
years and plant population did not influence grain yield and NUE.

81
REFERENCES Aase, J.K., and J.L. Pikul. 1995. Crop and soil response to long-term tillage
practices in the northern Great Plains. Agron. J. 87:652-656. Allison, F.E. 1973. Soil Organic Matter and its Role in Crop Production. Elsevier
Science Publishing Co., Amsterdam. Baker, J.H., M. Peech, and R.B. Musgrave. 1959. Deterimination of application
losses of anhydrous ammonia. Agron. J. 51:361-362. Bakersman, W.A.P., and C.T. deWit. 1970. Crop husbandry on naturally
compacted soils. Neth. J. Agric. Sci. 18:225-246. Bauer, A., and A.L. Black. 1981. Soil carbon, nitrogen, and bulk density
comparisons in two cropland tillage systems after 25 years and in virgin grassland. Soil Sci. Soc. Am. J. 45:1166-1170.
Bauer, A., and A.L. Black. 1994. Quantification of the effect of soil organic matter
content on soil productivity. Soil Sci. Soc. Am. J. 58:185-193. Black, A.L., and L.L. Reitz. 1972. Phosphorus and nitrate-nitrogen immobilization
by wheat straw. Agron. J. 64:782-785. Black, A.L. 1973. Soil property changes associated with crop residue
management in a wheat-fallow rotation. Soil Sci. Soc. Proc. 37:943-946. Blevins, R. L., G.W. Thomas, and P.L. Cornelius. 1977. Influence of no-tillage
and nitrogen fertilization on certain soil properties after 5 years of continuous corn. Agron. J. 69:383-386.
Blevins, R.L., G.W. Thomas, M.S. Smith, W.W. Frye, and P.L. Cornelius. 1983.
Changes in soil properties after 10 years continuous non-tilled and conventionally tilled corn. Agron. J. 3:135-146.
Blue, W.G., and C.F. Eno. 1954. Distribution and retention of anhydrous
ammonia in sandy soils. Soil Sci. Soc. Amer. Proc. 18:420-424. Bonfil, D.J., I. Mufradi, S. Klitman, and S. Asido. 1999. Wheat grain yield and soil
profile water distribution in a no-till arid environment. Agron. J. 91:368-373.
Bouman, O.T., D. Curtin, C.A. Campbell, V.O. Biederbeck, and H. Ukrainetz.
1995. Soil acidification from long-term use of anhydrous ammonia and urea. Soil Sci. Soc. Am. J. 59:1488-1494.

82
Brenneman, L.G., and J.M. Laflen. 1982. Modeling sediment deposition behind corn residue. Trans. ASAE. 25:1245-1250.
Bruce, R.R., G.W. Langdale, and A.L. Dillard. 1990. Tillage and crop rotation
effect on characteristics of a sandy surface soil. Soil Sci. Soc. Am. J. 54:1744-1747.
Campbell, C.A., and R.P. Zenter. 1993. Soil organic matter as influenced by crop
rotations and fertilization. Soil Sci. Soc. Am. J. 57:1034-1040. Cantero-Martinez, C., G.J. O’Leary, and D.J. Connor. 1999. Soil water and
nitrogen interaction in wheat in a dry season under a fallow-wheat cropping system. Australian Journal of Experimental Agriculture. 39:29-37.
Christensen, N.B., W.C. Lindemann, E. Salazar-Sosa, and L.R. Gill. 1994.
Nitrogen and carbon dynamics in no-till and stubble mulch tillage systems. Agron. J. 86:298-303.
Cochran, V.L., L.F. Elliot, and R.I. Papendick. 1980. Carbon and nitrogen
movement under surface applied wheat (Triticum aestivum) straw. Soil Sci. Soc. Am. J. 44:978-982.
Cogo, N.P., W.C. Moldenhauer, and G.R. Foster. 1984. Soil loss reductions from
conservation tillage practices. Soil Sci. Soc. Am. J. 48:368-373. Dao, T.H. 1993. Tillage and winter wheat residue management effects on water
infiltration and storage. Soil Sci. Am. J. 57:1586-1595. Dick, W.A. 1983. Organic carbon, nitrogen, and phosphorus concentrations and
pH in soil profiles as affected by tillage intensity. Soil Sci. Soc. Am. J. 47:102-107.
Dodge, D.A., and H.E. Jones. 1948. The effect of long-time fertility treatments on the nitrogen and carbon content of a prairie soil. J. Am. Soc. Agron. 40:478-485.
Doran, J.W. 1980. Soil microbial and biochemical changes associated with
reduced tillage. Soil Sci. Soc. Am. J. 44:765-771. Dowdell, R.J., and R.Q. Cannell. 1975. Effect of ploughing and direct drilling on
soil nitrate content. J. Soil. Sci. 26:53-61. Dowdell, R.J., and R. Crees. 1980. The uptake of N-labeled fertilizer by winter
wheat and its immobilization in a clay soil after direct drilling or plowing. J. Sci. Food Agric. 31:992-996.

83
Eck, H. V., and O.R. Jones. 1992. Soil nitrogen status as affected by tillage,
crops, and crop sequences. Agron. J. 84:660-668. Edwards, W.M., M.J. Shipitalo, L.B. Owens, and L.D. Norton. 1990. Effect of
Lumbricus terrestris L. burrows on hydrology of continuous no-till corn fields. Geoderma 46:73-84.
Eghball, B., L.N. Mielke, D.L. McCallister, and J.W. Doran. 1994. Distribution of
organic carbon and inorganic nitrogen in soil under various tillage and crop sequences. J. Soil Water ConServ. 49:201-205.
Elliott, E.T., P.W. Tracy, G.A. Peterson, and C.V. Cole. 1986. Leaching of
mineralized N is less under no-till cultivation. P. 53-54. In Trans. Int. Congr. Soil Sci. 13th, Hamburg, Germany. Vol. 6. Congr. Centurum, Hamburg.
Entz, M.H., and D.B. Fowler. 1991. Agronomic performance of winter versus
spring wheat. Agron. J. 83:527-532. Fenster, C.R., and G.A. Peterson. 1979. Effects of no-tillage fallow compared to
conventional tillage in a wheat-fallow system. Nebraska Agic. Exp. Bull. 289.
Follett, R.F., and D.S. Schimel. 1989. Effect of tillage practices on microbial
biomass dynamics. Soil Sci. Soc. Am. J. 53:1091-1096. Fox, R.H., and V.A. Bandel. 1986. Nitrogen utilization with no-tillage. In M.A.
Sprague and Triplett (eds) No-tillage and surface tillage agriculture, the tillage revolution. P. 117-148. John Wiley and Sons, New York.
Groffman, P.M. 1984. Nitrification and denitrification in conventional and no-
tillage soils. Soil Sci. Soc. Am. J. 49:329-334. Haas, H.J., C.E. Evans, and E.F. Miles. 1957. Carbon and nitrogen changes in
Great Plains soils as influenced by cropping and soil treatments. USDA Tech. Bull. 1164. U.S. Gov. Print. Office, Washington, DC.
Halvorson, A.D., A. L. Black, J.M. Krupinsky, and Stephen D. Merrill. 1999. Dryland winter wheat response to tillage and nitrogen within an annual cropping system. Agron. J. 91:702-707.
Hamid, A., and R.L. Mahler. 1994. The potential for volatilization losses of
applied nitrogen fertilizers from northern Idaho soils. Commun. Soil. Sci. Plant Anal. 25(3&4), 361-373.

84
Hobbs, L.A., and P.L. Brown. 1957. Nitrogen and organic carbon changes in cultivated western Kansas soils. Kansas Agric. Exp. Stn. Tech. Bull. 89.
Holland, J.F., and W.L. Felton. 1989. Effect of tillage practice on grain sorghum
production in northern New South Wales. Aust. J. Exp. Agric. 29:843-848. Ismail, I., R.L. Blevins, and W.W. Frye. 1994. Long-term no-tillage effects on soil
properties and continuous corn yields. Soil Sci. Soc. Am. J. 58:193-198. Jones, O.R., and T.W. Popham. 1997. Cropping and tillage systems for dryland
grain production in the southern high plains. Agron. J. 89:222-232. King, K.W., D.C. Flanagan, L.D. Norton, and J.M. Laflen. 1995. Rill erodibility
parameters influenced by long-term management practices. Trans. ASAE. 38:159-164.
Kirkegaard, J.A., R. Munns, R.A. James, P.A. Gardner, and J.F. Angus. 1995.
Reduced growth and yield of wheat with conservation cropping: II. Soil biological factors limit growth under direct drilling. Aust. J. Agric. Res. 46:75-88.
Kitur, B.K., M.S. Smith, R.L. Blevins, and W.W. Frye. 1984. Fate of N-depleted
ammonium nitrate applied to no-tillage and conventional tillage corn. Agron. J. 76:240-242.
Knowles, T.C., B.W. Hipp, P.S. Graff, and D.S. Marshall. 1993. Nitrogen nutrition
of rainfed winter wheat in tilled and no-till sorghum and wheat residues. Agron. J. 85:886-893.
Kolberg, R.L., N.R. Kitchen, D.G. Westfall, and G.A. Peterson. 1996. Cropping
intensity and nitrogen management impact of dryland no-till rotations in the semi-arid Western Great Plains. J. Prod. Agric. 9:517-522.
Lal, R., A.A. Mahboubi, and N.R. Fausey. 1994. Long-term tillage effect and
rotation effects on properties of a central Ohio soil. Soil Sci. Soc. Am. J. 58:517-522.
Lamb, J.A., G.A. Peterson, and C.R. Fenster. 1985. Wheat-fallow tillage systems
‘effect on newly cultivated grassland soils’ nitrogen budget. Soil Sci. Soc. Am. J. 49:352-356.
Lembi, C.A., M.D. Bri Hon, and M.A. Ross. 1985. Evaluation of nitrogen
application technique and tillage system on nitrogen runoff from an erodible soil. Technical Report 174. Purdue Univ., West Lafayette, Ind.
Lopez-Bellido, L., M. Fuentes, J.E. Castillo, F.J. Lopez-Garrido, and E.J.

85
Fernandez. 1996. Long-term tillage, crop rotation and nitrogen fertilizer effects on wheat yield under rainfed Mediterranean conditions. Agron. J. 88:783-791.
Lupwayi, N.Z., W.A. Rice, and G.W. Clayton. 1998. Soil microbial diversity and
community structure under wheat as influenced by tillage and crop rotation. Soil Biol. Biochem. 30:1733-1742.
McDowell, L. L., and G.E. Smith. 1958. The retention and reactions of anhydrous
ammonia on different soil types. Soil Sci. Soc. Amer. Proc. 22:38-42. McGregor, K.C., C.K. Mutchler, and R.K. Cullum.1992. Soil erosion effects on
soybean yields. Trans. ASAE. 35:1521-1525. McGregor, K.C., R.F. Cullum, and C.K. Mutchler. 1999. Long-term management
effects on runoff, erosion, and crop production. Trans. ASAE. 42:99-105. McIsaac, G.F., J.K. Mitchell, and M.C. Hirshi. 1990. Contour and conservation
tillage for corn and soybeans in Tama silt loam soil. Hydraulics and sediment concentrations. Trans. ASAE. 33:1541-1550.
Merrill, S.D., A.L. Black, and A. Bauer. 1996. Conservation tillage affects root
growth of dryland spring wheat under drought. Soil Sci. Am. J. 60:575-583.
Mielke, L.N., J.W. Doran, and K.A. Richards. 1986. Physical environment near
the surface of plowed and no-tilled soils. Soil Tillage Res. 7:355-366. Norwood, C. 1994. Profile water distribution and grain yield as affected by
cropping system and tillage. Agron. J. 86:558-563. Papendick, R.I. and J.F. Parr. 1966. Retention of anhydrous ammonia by soil: III.
Dispensing apparatus and resulting ammonia distribution. Soil Sci. 102:193-201.
Pesant, A.R., J.L. Dionne, and J. Genest. 1987. Soil and nutrient losses in
surface runoff from conventional and no-till corn systems. Can. J. Soil Sci. 67:835-843.
Peterson, G.A., A.J. Schlegel, D.L. Tanaka, and O.R. Jones. 1996. Precipitation
use efficiency as affected by cropping and tillage systems. J. Prod. Agric. 9:180-186.
Pikul, J.L., Jr., and J.K. Aase. 1995. Infiltration and soil properties as affected by
annual cropping in the northern Great Plains. Agron. J. 87:656-662. Rao, S.C., and T. H. Dao. 1996. Nitrogen placement and tillage effects on dry

86
matter and nitrogen accumulation and redistribution in winter wheat. Agron. J. 88:365-371.
Rhoton, F.E., R.R. Bruce, N.W. Buehring, G.B. Elkins, C.W. Langdale, and D.D.
Tyler. 1993. Chemical and physical characteristics of four soil types under conventional and no-tillage systems. Soil Tillage Res. 28:51-61.
Rice, C.W., and M.S. Smith. 1982. Denitrification in no-till and plowed soils. Soil
Sci. Soc. Am. J. 46:1168-1173. Rice, C.W., and M.S. Smith. 1984. Short-term immobilization of fertilizer nitrogen
at the surface of no-till and plowed soils. Soil Sci. Soc. Am. J. 48:295-297. Ridley, A.O., and R.A. Hedlin. 1968. Soil organic matter and crop yields as
influenced by frequency of summerfallowing. Can. J. Soil Sci. 48:315-322. Robbins, S.G., and R.D. Voss. 1989. Division S-8-fertilizer technology and use
acidic zones from ammonia application in conservation tillage systems. Soil Sci. Soc. Am. J. 53:1256-1263.
Rodriguez, M.B., and N. Giambiagi. 1995. Denitrification in tillage and no-tillage
Pampean soils: relationships among soil water, available carbon, and nitrate and nitrous oxide production. Commun. Soil. Sci. Plant Anal. 26:3205-3220.
SAS Institute. 1990. SAS/STAT user’s guide. Release 6.03 ed. SAS Inst., Cary,
NC. Schepers, J.L., and R.A. Cattani. 1962. Mineral fixation of anhydrous ammonia
by air-dry soils. Soil Sci. Soc. Am. Proc. 26:147-152. Smika, D.E., and P.W. Unger. 1986. Effect of surface residues on soil water
storage. Adv. Soil. Sci. 5:111-138. Smith, S.J., and A.N. Sharpley. 1990. Soil nitrogen mineralization in the
presense of surface and incorporated crop residues. Agron. J. 82:112-116.
Smith, S.J., A.N. Sharpley, J.W. Naney, W.A. Berg, and O.R. Jones. 1991. Water Quality impacts associated with wheat culture in the southern Plains. J. Environ. Qual. 20:244-249.
Soper, R.J., G.J. Racz, and P.I. Fehr. 1971. Nitrate nitrogen in the soil as a
means of predicting the fertilizer nitrogen requirements of barley. Can. J. Soil Sci. 51:45-49.
Stinner, B.R., G.D. Hoyt, and R.L. Todd. 1983. Changes in soil chemical

87
properties following a 12-year fallow: A 2-year comparison of conventional tillage and no-tillage agroecosystems. Soil Tillage Res. 3:277-290.
Swart, C.L., L.S. Murphy, and C.W. Swallow. 1971. Retention patterns and
effectiveness of anhydrous ammonia applied with an undercutting blade. Agron. J. 63:881-884.
Toews, W.H., and R.J. Soper. 1978. Effects of nitrogen sources, method of
placement and soil type on seedling emergence and barley crop yields. Can. J. Soil Sci. 58:311-320.
Tomar, J.S., and R.J. Soper. 1981. Fate of tagged urea N in field with different
methods of N and organic matter placement. Agron. J. 73:991-995. Unger, P.W. 1991. Organic matter, nutrient, and pH distribution in no- and
conventional-tillage semiarid soils. Agron. J. 83:186-189. Vyn, T.J., and B.A. Raimbault. 1993. Long-term effect of five tillage systems on
corn response and soil structure. Agron. J. 85:1074-1079. Waddell, J.T., and R.R. Weil. 1996. Water distribution in soil under ridge-till and
no-till corn. Soil Sci. Soc. Am. J. 60:230-237. Wagger, M.G., D.E. Kissel, and S.J. Smith. 1985. Mineralization of nitrogen from
nitrogen-15 labeled crop residues under field conditions. Soil Sci. Soc. Am. J. 49:1220-1226.
Weersink, A., M. Walker, C. Swanton, and J.E. Shaw. 1992. Costs of
conventional and conservation tillage systems. J. Soil and Water Cons. 47:328-334.
Wienhold, B.J., and A.D. Halvorson. 1999. Nitrogen mineralization responses to
cropping, tillage, and nitrogen rate in the northern great plains. Soil Sci. Soc. Am. J. 63:192-196.
Wood, C.W., D.G. Westfall, and G.A. Peterson. 1991. Soil carbon and nitrogen
on initiation of no-till cropping systems. Soil Sci. Soc. Am. J. 55:470-476. Young, R.A., J.C. Zubriski, and E.B. Norum. 1960. Influence of long-term fertility
management practices on chemical and physical properties of a Fargo clay. Soil Sci. Soc. Am. J. 24:124-128.

88
Table 1. Initial surface (0-15 cm) and sub-soil (15-30 cm) test results prior to experiment initiation at Efaw and Lahoma OK.
NH4-N NO3-N P K Sample ---------------------------- mg kg-1 --------------------------- pH Lahoma (0-15 cm) 14.35 8.86 9.34 282 5.67 Lahoma (15-30 cm) 15.78 3.89 6.49 222 6.23 Efaw (0-15 cm) 15.87 11.16 28.23 225 5.70 Efaw (15-30 cm) 13.70 7.41 7.44 190 6.35 NH4-N and NO3-N – 2 M KCL extract; P and K – Mehlich-3 extraction; pH – 1:1 soil:deionized water Table 2. Planting, fertilizer, and harvest dates at Efaw and Lahoma, OK, 2000-04.
Location Crop Year Planting Fertilizer
Application Grain Harvest
2000-2001 11-30-00 11-22-00 6-11-01
2001-2002 10-01-01 9-11-01 6-21-02
2002-2003 10-17-02 9-03-02 6-23-03
Efaw 2003-2004 9-27-03 9-18-03 6-15-04
2000-2001 11-27-00 11-27-00 6-14-01
2001-2002 10-03-01 9-04-01 6-25-02
2002-2003 10-08-02 9-06-02 6-17-03
Lahoma 2003-2004 10-16-03 9-19-03 6-12-04

89
Table 3. Grain yield treatment means and analysis of variance at Efaw, 2001-2004.
*, **, *** Significant at the 0.10, 0.05, and 0.01 levels of probability, respectively; NS is not significant. SED is the standard error of the difference between two equally replicated means. CT= conventional tillage; NT= no-till RI = highest N treated average grain yield divided by the average check (0 N rate).
Treatment 2001 2002 2003 2004 Avg.
Tillage App/
Source N rate
kg N ha-1 Grain Yield
--------------------------------- (Mg ha-1) -------------------------------- 0 2.26 3.57 3.40 3.03 3.12 61 2.27 3.59 3.82 4.18 3.46
123 2.50 3.80 3.78 4.48 3.64 Knife
185 2.53 3.64 3.68 4.98 3.71 Avg. 2.39 3.65 3.67 4.17 3.49
0 2.13 3.83 2.67 2.34 2.58 61 2.48 3.73 3.89 4.29 3.60
123 2.63 3.99 3.84 4.96 3.85 V-blade
185 2.61 3.76 3.87 4.91 3.79
CT
Avg. 2.51 3.85 3.57 4.13 3.51 CT Response Indices (RI) 1.23 1.08 1.46 2.12 1.49
0 1.90 2.98 2.67 2.48 2.57 61 2.29 3.42 3.50 3.56 3.19 123 2.55 3.66 3.04 4.54 3.50
Knife
185 2.66 3.81 3.50 4.81 3.67 Avg. 2.35 3.43 3.18 3.85 3.23
0 2.10 2.94 2.70 2.49 2.53 61 2.11 3.11 3.23 3.13 2.87 123 2.48 3.25 3.40 4.40 3.38
V-blade
185 2.44 3.67 3.56 4.78 3.61
NT
Avg. 2.28 3.24 3.22 3.70 3.12 NT Response Indices (RI) 1.40 1.25 1.32 1.94 1.42 SED 0.13 0.27 0.12 0.36 ---
Source of Variation Level of Significance Tillage NS * ** NS --- N rate *** * *** *** --- N method NS NS NS NS --- N rate * N method NS NS * NS --- Tillage * N rate NS * NS NS --- Tillage * N method NS * NS NS --- Tillage * N rate * N method NS NS NS NS --- CT, Knife vs. V-blade NS NS NS NS --- NT, Knife vs. V-blade * NS NS NS --- CT, Knife linear * NS NS *** --- NT, Knife linear *** ** *** *** --- CT, Knife quadratic NS NS NS NS --- NT, Knife quadratic NS NS NS * --- CT, V-blade linear ** NS *** *** --- NT, V-blade linear ** ** *** *** --- CT, V-blade quadratic NS NS *** *** --- NT, V-blade quadratic NS NS NS NS ---

90
Table 4. Grain yield treatment means and analysis of variance at Lahoma, 2001- 2004.
*, **, *** Significant at the 0.10, 0.05, and 0.01 levels of probability, respectively; NS is not significant. SED is the standard error of the difference between two equally replicated means. CT= conventional tillage; NT= no-till RI = highest N treated grain yield average divided by the check (0 N rate) average.
Treatment 2001 2002 2003 2004 Avg.
Tillage App/
Source N rate
kg N ha-1 Grain Yield
--------------------------------- (Mg ha-1) -------------------------------- 0 1.77 3.98 3.63 2.25 2.97 61 2.13 4.29 4.07 4.51 3.75
123 1.29 3.92 4.71 4.31 3.56 Knife
185 2.07 3.86 4.48 3.98 3.60 Avg. 1.82 4.01 4.22 3.66 3.48
0 1.90 3.74 2.28 4.24 3.15 61 2.45 4.07 4.31 4.27 3.73
123 1.70 3.80 4.50 4.04 3.51 V-blade
185 1.97 3.94 4.65 4.15 3.68
CT
Avg. 2.01 3.91 3.93 4.18 3.53 CT Response Indices (RI) 1.29 1.12 2.04 2.00 1.26
0 1.12 2.50 3.87 2.46 2.56 61 1.43 2.92 5.03 3.48 3.16 123 1.54 2.97 5.09 3.71 3.33
Knife
185 1.87 2.60 4.53 3.94 3.24 Avg. 1.49 2.79 4.63 2.86 3.10
0 0.78 2.62 4.64 1.39 1.85 61 1.68 3.33 4.80 3.10 3.10 123 1.89 3.62 4.96 3.78 3.56
V-blade
185 1.66 3.59 5.13 3.63 3.50
NT
Avg. 1.50 3.32 4.97 2.89 3.11 NT Response Indices (RI) 1.67 1.68 1.32 2.71 1.92 SED 0.31 0.20 0.42 0.46 ---
Source of Variation Level of Significance Tillage * ** *** *** --- N rate *** *** *** *** --- N method NS ** NS NS --- N rate * N method NS * NS NS --- Tillage * N rate *** ** NS ** --- Tillage * N method NS *** NS ** --- Tillage * N rate * N method NS NS NS * --- CT, Knife vs. V-blade NS NS NS NS --- NT, Knife vs. V-blade NS *** NS NS --- CT, Knife linear NS NS * *** --- NT, Knife linear ** NS ** *** --- CT, Knife quadratic NS NS NS *** --- NT, Knife quadratic NS ** *** NS --- CT, V-blade linear NS NS *** NS --- NT, V-blade linear *** *** NS *** --- CT, V-blade quadratic NS NS ** NS --- NT, V-blade quadratic *** ** NS * ---

91
Table 5. Grain N uptake treatment means and analysis of variance at Efaw, 2001-2004.
*, **, *** Significant at the 0.10, 0.05, and 0.01 levels of probability, respectively; NS is not significant. SED is the standard error of the difference between two equally replicated means. CT= conventional tillage; NT= no-till
Treatment 2001 2002 2003 2004 Avg.
Tillage App/
Source N rate
kg N ha-1 Grain N uptake
----------------------------------- (kg ha-1)---------------------------------- 0 55.9 88.7 79.8 52.1 71.2 61 58.1 91.3 88.8 93.8 85.2
123 66.8 98.7 95.4 89.5 87.3 Knife
185 65.5 99.7 87.1 127.0 94.1 Avg. 61.6 94.6 87.8 94.0 84.5
0 49.4 93.2 80.5 43.5 65.6 61 61.9 102.7 89.5 88.4 87.0
123 67.6 109.4 93.8 118.6 97.9 V-blade
185 69.6 104.5 98.9 125.7 99.5
CT
Avg. 62.1 104.9 90.6 94.1 88.2 0 41.6 69.3 56.8 42.8 53.5 61 53.5 81.9 80.3 71.5 71.8
123 69.3 91.5 62.3 90.8 81.2 Knife
185 69.9 90.0 88.4 111.8 89.8 Avg. 58.6 82.3 72.0 79.2 74.0
0 46.1 66.3 53.3 38.8 52.2 61 48.7 69.4 72.7 59.1 63.1
123 57.8 82.3 83.8 85.7 77.4 V-blade
185 59.5 103.8 90.6 117.8 93.2
NT
Avg. 53.0 80.4 73.7 81.0 71.6 SED 4.9 8.7 14.8 10.3 --- Source of Variation Level of Significance Tillage * ** *** NS --- N rate *** *** ** *** --- N method NS NS NS NS --- N rate * N method NS NS NS NS --- Tillage * N rate NS NS NS NS --- Tillage * N method * NS NS NS --- Tillage * N rate * N method NS NS NS NS --- CT, Knife vs. V-blade NS ** NS NS --- NT, Knife vs. V-blade ** NS NS NS --- CT, Knife linear ** * NS *** --- NT, Knife linear *** * *** *** --- CT, Knife quadratic NS NS NS NS --- NT, Knife quadratic NS NS NS NS --- CT, V-blade linear *** NS NS *** --- NT, V-blade linear ** *** *** *** --- CT, V-blade quadratic NS NS NS ** --- NT, V-blade quadratic NS NS NS NS ---

92
Table 6. Grain N uptake treatment means and analysis of variance at Lahoma, 2001-2004.
*, **, *** Significant at the 0.10, 0.05, and 0.01 levels of probability, respectively; NS is not significant. SED is the standard error of the difference between two equally replicated means. CT= conventional tillage; NT= no-till
Treatment 2001 2002 2003 2004 Avg.
Tillage App/
Source N rate
kg N ha-1 Grain N uptake
----------------------------------- (kg ha-1)---------------------------------- 0 41.8 101.6 70.0 55.3 67.4 61 50.4 114.6 98.1 110.0 93.3
123 33.8 116.3 119.6 116.8 96.6 Knife
185 52.7 111.1 122.3 121.6 101.9 Avg. 44.7 110.9 102.5 104.3 90.3
0 43.0 95.9 50.4 101.3 74.9 61 60.3 111.1 99.7 111.8 94.7
123 46.2 96.9 99.7 98.2 85.2 V-blade
185 51.7 102.7 107.2 106.5 92.0
CT
Avg. 50.3 102.4 89.3 104.3 87.1 0 23.9 63.2 79.3 48.5 59.0 61 34.0 71.2 101.1 83.3 70.3
123 38.6 77.6 126.6 104.1 86.7 Knife
185 47.8 68.8 119.5 116.4 88.1 Avg. 36.1 71.3 106.6 89.1 77.5
0 16.6 57.3 83.5 27.4 37.0 61 43.4 84.3 107.5 75.1 74.9
123 45.8 96.1 116.9 115.6 93.6 V-blade
185 46.1 101.0 129.3 110.7 96.8
NT
Avg. 38.0 86.5 115.2 87.2 79.2 SED 7.9 8.1 9.5 16.5 --- Source of Variation Level of Significance Tillage NS *** *** * --- N rate *** *** *** *** --- N method NS NS NS NS --- N rate * N method NS NS NS NS --- Tillage * N rate ** * NS * --- Tillage * N method NS *** * NS --- Tillage * N rate * N method NS * NS * --- CT, Knife vs. V-blade NS ** NS NS --- NT, Knife vs. V-blade NS *** NS NS --- CT, Knife linear NS NS *** *** --- NT, Knife linear ** NS *** *** --- CT, Knife quadratic NS NS NS ** --- NT, Knife quadratic NS NS ** NS --- CT, V-blade linear NS NS *** NS --- NT, V-blade linear *** *** *** *** --- CT, V-blade quadratic NS NS ** NS --- NT, V-blade quadratic ** * NS NS ---

93
Table 7. Nitrogen Use Efficiency treatment means and analysis of variance at Efaw, 2001-2004.
*, **, *** Significant at the 0.10, 0.05, and 0.01 levels of probability, respectively; NS is not significant. NUE= (Grain N uptake of N treatment – Grain N uptake of check) / N rate SED is the standard error of the difference between two equally replicated means. CT= conventional tillage; NT= no-till
Treatment 2001 2002 2003 2004 Avg.
Tillage App/
Source N rate
kg N ha-1 -------------------------------- NUE (%) --------------------------------- 61 5 4 15 68 23 123 10 8 13 30 15 Knife
185 6 6 4 41 14 Avg. 7 6 10 46 17
61 22 16 15 74 31 123 15 13 11 61 25 V-blade
185 11 6 10 45 18
CT
Avg. 16 12 12 60 25 61 21 21 39 47 32 123 23 18 10 39 24 Knife
185 16 12 17 37 21 Avg. 20 17 23 41 26
61 4 5 32 36 18 123 10 13 25 38 21 V-blade
185 7 20 20 43 23
NT
Avg. 7 13 26 39 21 SED 5 11 12 17 --- Source of Variation Level of Significance Tillage NS NS ** NS --- N rate NS NS NS NS --- N method NS NS NS NS --- N rate * N method NS NS NS NS --- Tillage * N rate NS NS NS NS --- Tillage * N method *** NS NS NS --- Tillage * N rate * N method NS NS NS NS --- CT, Knife vs. V-blade NS NS NS NS --- NT, Knife vs. V-blade *** NS NS NS --- CT, Knife linear NS NS NS NS --- NT, Knife linear NS NS *** NS --- CT, Knife quadratic NS NS NS NS --- NT, Knife quadratic NS NS ** NS --- CT, V-blade linear * NS NS NS --- NT, V-blade linear NS NS NS NS --- CT, V-blade quadratic NS NS NS NS --- NT, V-blade quadratic NS NS NS NS ---

94
Table 8. Nitrogen Use Efficiency treatment means and analysis of variance at Lahoma, 2001-2004.
*, **, *** Significant at the 0.10, 0.05, and 0.01 levels of probability, respectively; NS is not significant. NUE= (Grain N uptake of N treatment – Grain N uptake of check) / N rate SED is the standard error of the difference between two equally replicated means. CT= conventional tillage; NT= no-till
Treatment 2001 2002 2003 2004 Avg.
Tillage App/
Source N rate
kg N ha-1 -------------------------------- NUE (%) --------------------------------- 61 14 23 46 90 43
123 0 13 40 50 24 Knife
185 6 6 28 36 19 Avg. 5 14 38 59 29
61 29 23 64 20 36 123 3 1 32 0 8 V-blade
185 5 4 25 3 9
CT
Avg. 12 11 40 6 17 61 19 14 36 58 27
123 13 13 39 45 27 Knife
185 14 4 22 37 19 Avg. 15 10 32 43 24
61 44 48 39 78 53 123 24 35 27 72 39 V-blade
185 16 28 24 45 27
NT
Avg. 28 37 29 65 40 SED 7 9 10 14 --- Source of Variation Level of Significance Tillage * NS * ** --- N rate *** *** *** *** --- N method *** *** NS ** --- N rate * N method * NS NS NS --- Tillage * N rate NS NS NS NS --- Tillage * N method NS *** NS *** --- Tillage * N rate * N method NS NS NS NS --- CT, Knife vs. V-blade NS NS NS *** --- NT, Knife vs. V-blade ** *** NS * --- CT, Knife linear NS * * *** --- NT, Knife linear NS NS NS NS --- CT, Knife quadratic ** NS NS NS --- NT, Knife quadratic NS NS NS NS --- CT, V-blade linear ** ** *** NS --- NT, V-blade linear *** * NS ** --- CT, V-blade quadratic * * NS NS --- NT, V-blade quadratic NS NS NS NS ---

95
Table 9. Soil nitrate N treatment means from post-harvest sampling in 2002 and 2004 at Efaw and Lahoma, OK.
SED is the standard error of the difference between two equally replicated means. CT= conventional tillage; NT= no-till NO3-N – 2 M KCL extract In 2002 no subsoil samples (15-30 cm) were collected.
2002 2004
Efaw Lahoma Efaw Lahoma 0-15 cm 0-15 cm 0-15 cm 15-30 cm 0-15 cm 15-30 cm
Tillage App/
Source N rate
kg N ha-1 NO3
- N ----------------------------------- mg kg-1 -----------------------------------
0 10.7 10.3 7.1 5.7 12.6 14.2 61 10.2 17.9 6.7 5.8 14.1 14.4 123 9.1 17.8 7.1 7.0 13.7 11.6
Knife
185 15.0 30.5 7.3 5.6 14.4 12.5
Avg. 11.2 19.1 7.0 6.0 13.7 13.2 0 6.8 12.6 6.6 5.3 11.3 12.7
61 12.9 13.9 7.0 5.6 14.5 19.1 123 12.6 12.1 7.8 5.1 11.9 11.8
V-blade
185 15.7 15.7 8.8 6.3 13.8 16.6
CT
Avg. 12.0 13.6 7.5 5.6 12.9 15.0 0 10.7 23.2 9.7 6.4 21.4 17.4
61 16.2 16.4 10.2 6.3 12.4 11.9 123 17.2 30.6 9.5 6.1 16.6 11.9
Knife
185 17.0 49.5 8.9 6.8 15.7 12.5
Avg. 15.3 29.9 9.6 6.4 16.6 13.4 0 13.7 14.6 7.8 7.1 13.6 12.6
61 21.7 20.9 9.2 6.1 13.2 13.1 123 11.9 20.8 9.6 6.3 13.8 12.6
V-blade
185 17.4 18.6 10.8 6.0 22.4 13.7
NT
Avg. 16.2 18.7 9.4 6.4 15.7 13.0
SED 3.0 4.4 1.1 0.8 2.6 2.1

96
Table 10. Soil ammonium N treatment means from post-harvest sampling in 2002 and 2004 at Efaw and Lahoma, OK.
SED is the standard error of the difference between two equally replicated means. CT= conventional tillage; NT= no-till NH4 -N – 2 M KCL extract In 2002 no subsoil samples (15-30 cm) were collected.
2002 2004
Efaw Lahoma Efaw Lahoma 0-15 cm 0-15 cm 0-15 cm 15-30 cm 0-15 cm 15-30 cm
Tillage App/
Source N rate
kg N ha-1 NH4 - N
----------------------------------- mg kg-1 ----------------------------------- 0 13.2 8.5 5.6 4.0 5.6 8.0
61 15.1 10.1 5.8 3.2 9.6 6.1 123 15.0 10.3 4.0 3.9 8.1 6.0
Knife
185 15.0 14.8 4.5 4.3 12.2 11.4
Avg. 14.6 10.9 5.0 3.8 8.9 7.9 0 12.8 12.3 3.9 4.7 5.8 6.7
61 18.1 8.8 5.4 4.4 4.8 9.6 123 16.1 10.4 4.2 3.5 5.3 6.4
V-blade
185 20.3 12.2 6.3 9.7 5.0 10.5
CT
Avg. 16.8 10.9 4.9 5.6 5.2 8.3 0 20.3 15.2 4.6 3.3 5.6 6.6
61 21.9 13.2 4.4 4.1 6.4 3.0 123 22.4 16.8 3.7 4.0 9.7 6.7
Knife
185 24.3 20.4 5.6 4.2 13.0 10.9
Avg. 22.2 16.4 4.6 3.9 8.7 6.8 0 25.4 12.5 5.4 4.6 9.7 5.7
61 19.8 13.7 4.0 2.6 6.3 6.9 123 19.1 14.9 3.8 3.2 5.3 9.8
V-blade
185 19.2 15.4 5.7 3.6 8.9 8.8
NT
Avg. 20.9 14.1 4.7 3.5 7.5 7.8
SED 3.7 1.9 1.2 2.1 2.9 2.8

97
Figure 1. Knife applicator
Figure 2. V-blade applicator

98
Figure 3. Effect of tillage and N method on soil compaction over four years for depths 0-30 cm at Lahoma, OK.
Figure 4. Effect of tillage and N method on soil compaction over four years for depths 0-30 cm at Efaw, OK.
0
5
10
15
20
25
300 500 1000 1500
Soil Compaction (kPa)
Dept
h (c
m) NT, Knife
NT, V-blade
CT, Knife
CT, V-blade
0
5
10
15
20
25
300 500 1000 1500 2000
Soil Compaction (kPa)
Dep
th (c
m) NT, Knife
NT, V-blade
CT, Knife
CT, V-blade

VITA
Roger Keith Teal
Candidate for the Degree of
Doctor of Philosophy
Dissertation: EVALUATING METHODS FOR IMPROVING NITROGEN USE
EFFICIENCY IN CORN AND HARD RED WINTER WHEAT
Major Field: Soil Science Biographical:
Personal Data: Born in Manchester, Tennessee, on August 15, 1978. Education: Graduated from Coffee County Central High School,
Manchester, Tennessee in May 1996; received Bachelors of Science degree in Plant and Soil Science from University of Tennessee-Martin, Martin, Tennessee in May 2000. Completed the requirements for the Master of Science degree with a major in Plant and Soil Sciences at Oklahoma State University in August 2002. Completed the requirements for the Doctor of Philosophy degree with a major in Soil Science at Oklahoma State University in May 2005.
Experience: farm employee for Pine Grove Dairy, 1991-2000, Shady
Grove, Tennessee; assistant manager for Maple Creek Dairy, 1991-2000, Mud Creek, Tennessee; lab instructor for University of Tennessee-Martin, 1998-2000, Martin, Tennessee; employed by Oklahoma State University, Department of Plant and Soil Sciences as a graduate research assistant, 2000-2002.
Professional Memberships: American Society of Agronomy, Crop Science
Society of America, and Soil Science Society of America.

Name: Roger Keith Teal Date of Degree: May, 2005 Institution: Oklahoma State University Location: Stillwater, Oklahoma
Title of Study: EVALUATING METHODS FOR IMPROVING NITROGEN USE
EFFICIENCY IN CORN AND HARD RED WINTER WHEAT
Pages in Study: 98 Candidate for the Degree of Doctor of Philosophy Major Field: Soil Science Scope and Method of Study: For chapter one, Corn (Zea mays L.) experiments
were conducted to evaluate spectral reflectance, measuring the normalized difference vegetation index (NDVI) with a GreenSeeker™ Hand Held optical reflectance sensor as a function of hybrid, plant population, and fertilizer N rate. In the spring of 2004 with the addition of a third site and the availability of a green NDVI sensor, the trials were reconfigured removing one hybrid and imposing two more plant populations and the utilization of both green and red NDVI. Differences in NDVI, grain yield, grain N, and grain N uptake were investigated based on hybrid, plant population, and N rate. For chapter two, Hard red winter wheat (Triticum aestivum L.) experiments were conducted to evaluate tillage system and anhydrous ammonia application methods on yield, N uptake, and NUE, using a narrow (10 cm) nozzle spacing on a V-blade (Noble or sweep blade) applicator and wide (46 cm) nozzle spacing on a knife applicator.
Findings and Conclusions: For chapter one, the critical population at which NDVI
was no longer affected occurred between 55,000 and 60,000 plants ha –1 for the later maturing hybrids and closer to 70,000 plants ha –1 for the earliest maturing hybrids. Vegetative response index (RINDVI) at V8 was highly correlated with RI at harvest (RIHARVEST) in 2004. The V8 growth stage was most effective growth stage to predict grain yield. Hybrid maturity did not effect grain yield prediction at V8 and no significant differences occurred between the GNDVI and RNDVI relationships with grain yield in 2004. For chapter two, conventional tillage was significantly higher in grain yield and grain N uptake in five of eight site years over no-till. Mixed results were evaluated from NUE for tillage; four site years split evenly between conventional till and no-till. The V-blade improved NUE in no-till three site years at Lahoma, but the knife applicator increased NUE the initial year at Efaw in no-till. Previous crop residue disturbance averaged less than 15% for both AA applicators all four site years. No-till crop production reduced soil compaction at Efaw and the V-blade applicator reduced soil compaction within the no-till at both locations.
ADVISER’S APPROVAL: Dr. William Raun