Evaluating Losses Avoided Through Acquisition Projects · Evaluating Losses Avoided Through...
51
Evaluating Losses Avoided Through Acquisition Projects Wisconsin Property Acquisitions October 2010 Above photo subject to change FEMA WEM
Transcript of Evaluating Losses Avoided Through Acquisition Projects · Evaluating Losses Avoided Through...

Evaluating Losses Avoided Through Acquisition Projects Wisconsin Property Acquisitions
October 2010
Above photo subject to change
FEMA WEM
i
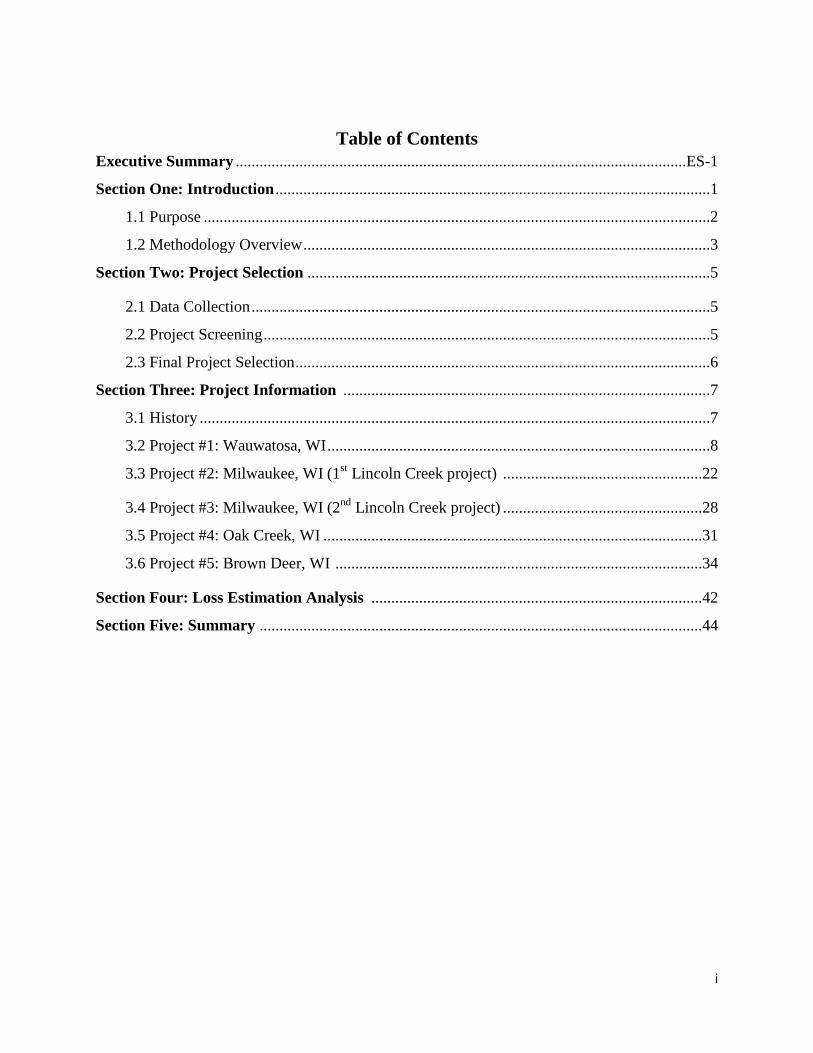
Table of Contents Executive Summary .................................................................................................................ES-1
Section One: Introduction .............................................................................................................1
1.1 Purpose ...............................................................................................................................2
1.2 Methodology Overview ......................................................................................................3
Section Two: Project Selection .....................................................................................................5
2.1 Data Collection ...................................................................................................................5
2.2 Project Screening ................................................................................................................5
2.3 Final Project Selection ........................................................................................................6
Section Three: Project Information ............................................................................................7
3.1 History ................................................................................................................................7
3.2 Project #1: Wauwatosa, WI ................................................................................................8
3.3 Project #2: Milwaukee, WI (1st
3.4 Project #3: Milwaukee, WI (2
Lincoln Creek project) ..................................................22
nd
3.5 Project #4: Oak Creek, WI ...............................................................................................31
Lincoln Creek project) ..................................................28
3.6 Project #5: Brown Deer, WI ............................................................................................34
Section Four: Loss Estimation Analysis ...................................................................................42
Section Five: Summary ...............................................................................................................44

ii
List of Figures and Tables
Figures: Figure 1.2.1 Losses Avoidance Flood Methodology Overview……………………………….3 Figure 3.2.1 Acquisition Properties with Flood Depths & USGS Stream Gauge #04087120...11 Figure 3.3.1 Acquistiion Properties in Floodplain with USGS Gauge # 04087000…………..22 Figure 3.3.2 Locations of Acquisition Properties – Updated Floodplain……………………..26 Figure 3.4.1 Acquisition Properties Located in Floodplain……………………………….......29 Figure 3.5.1 Acquisition Property Location and Floodplain…………………………………..32 Figure 3.6.1 Rainfall Frequency Maps (w/location of acquisition properties)……………......34 Figure 3.6.2 Acquisition Properties Location in Floodplain…………………………………. 36 Figure 3.6.3 Churchill Lane Properties Pre-Acquisition………………………………………37 Figure 3.6.4 Churchill Lane Properties Post-Acquisition…………………………………......37 Figure 3.6.5 Churchill Lane July 22, 2010……………………………………………………38 Figure 3.6.6 Churchill Lane and 51st
St July 22, 2010………………………………………..38
Tables:
Table 3.1.1 Disaster Declarations for Milwaukke Co…………………………………………8 Table 3.2.1 Flood Stages……………………………………………………………………... 8 Table 3.2.2 Historical Crests for Menomonee River…………………………………………. 8 Table 3.2.3 Flood Impacts in Wauwatosa, WI.………………………………………………..9 Table 3.2.4 Wauwatosa Proposed Property Acquisition Addresses & Values……….............12 Table 3.2.5 Mitigation Investment and Loss Estimaeion by Event……………………..........13 Table 3.2.6 Loss Estimation Calculations for August 6, 1998 Event………………………...13 Table 3.2.7 Loss Estimation Calculations for June 8, 2008 Event…………………………...14 Table 3.2.8 Loss Estimation Calculations for July 15, 2010 Event…………………………..15 Table 3.2.9 Loss Estimation Calculations for July 21, 1999 Event…………………………..16 Table 3.2.10 Loss Estimation Calculations for July 2, 2000 Event…………………………...17 Table 3.2.11 Loss Estimation Calculations for July 4, 2004 Event………………………….. 18 Table 3.2.12 Cumulative Loss Estimation and ROI (Wauwatosa)……..…………………..…19 Table 3.2.13 Losses Avoided - HAZUS-MH MR4 Model 100 Year Flood Event……………20 Table 3.3.1 Proposed Acquisition Projects & Values………………………………………...23 Table 3.3.2 Losses Avoided – HAZUS Modeled 100 Year Flood Event………………….. .24 Table 3.3.3 Return on Investment Calculations………………………………………………25 Table 3.3.4 Losses Avoided – HAZUS Modeled 100 Year Flood Event (after MMSD project). 27 Table 3.3.5 Loss Estimation and ROI Calculations ………………………………………….27 Table 3.4.1 Acquisition Properties……………………………………………………………28 Table 3.4.2 Loss Estimation – HAZUS Modeled 100 Year Floor Event…………………….29 Table 3.4.3 Return on Investment Calculations………………………………………………30
iii
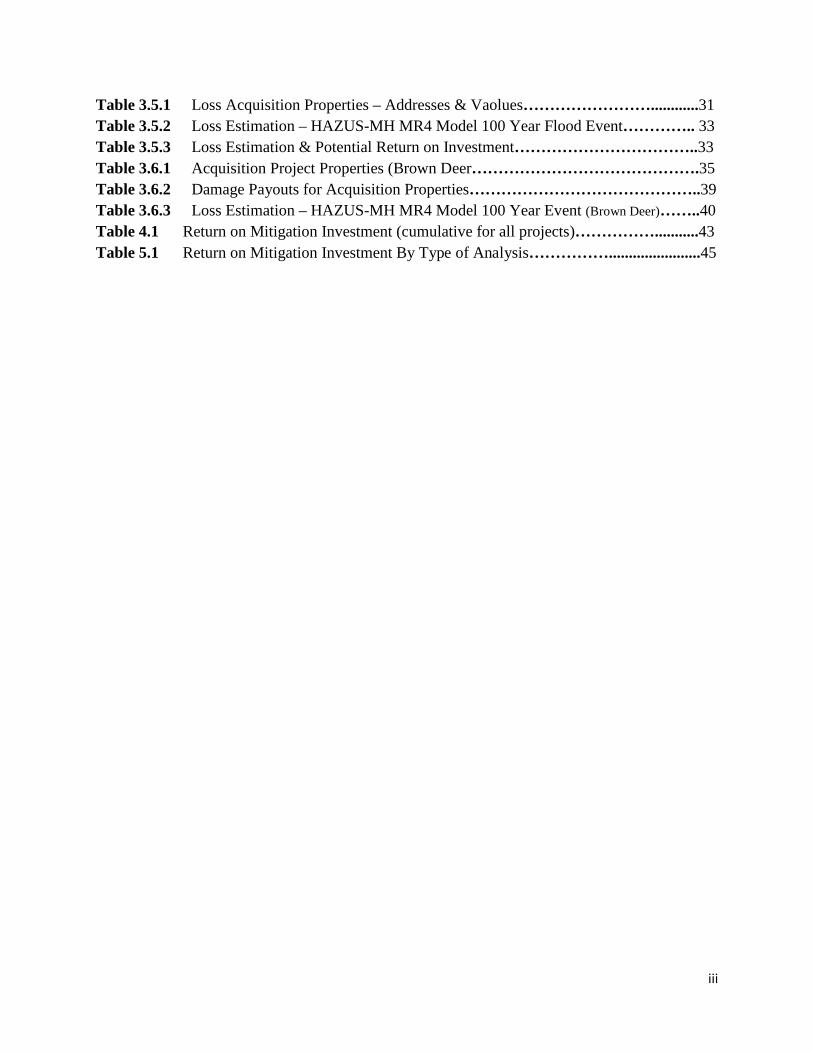
Table 3.5.1 Loss Acquisition Properties – Addresses & Vaolues……………………............31 Table 3.5.2 Loss Estimation – HAZUS-MH MR4 Model 100 Year Flood Event………….. 33 Table 3.5.3 Loss Estimation & Potential Return on Investment……………………………..33 Table 3.6.1 Acquisition Project Properties (Brown Deer…………………………………….35 Table 3.6.2 Damage Payouts for Acquisition Properties……………………………………..39 Table 3.6.3 Loss Estimation – HAZUS-MH MR4 Model 100 Year Event (Brown Deer)……..40 Table 4.1 Return on Mitigation Investment (cumulative for all projects)……………...........43 Table 5.1 Return on Mitigation Investment By Type of Analysis…………….......................45
Evaluating Losses Avoided Through Acquisition Projects
iv
Executive Summary
The Federal Emergency Management Agency (FEMA) awards mitigation grants to reduce the negative impact of natural hazards on property, people, and the environment. FEMA funds projects based on numerous factors, including a cost-effectiveness analysis of a range of hazard events. Presidential-declared disasters provide considerable funds to States and communities via the Hazard Mitigation Grant Program (HMGP). The HMGP assists States and local communities in implementing long-term hazard mitigation measures. It can be used to fund projects that protect public or private property. Under the HMGP, FEMA may contribute up to 75 percent of project costs. The community must formally agree to provide a local match in the amount of the remaining project costs (at least 25 percent). After significant funds are distributed for mitigation projects, the questions arise: Was the project truly cost effective? How effective was the project during ensuing disasters or hazard events? The Loss Avoidance Study (LAS) methodology was developed by FEMA to provide a quantitative approach to assess performance of mitigation measures. This report, Evaluating Losses Avoided through Acquisition Projects, evaluates the effectiveness of property acquisitions as a mitigation measure. In response to the flooding in Milwaukee County, local governments (with Federal and State assistance) acquired a total of 54 repetitive-loss properties. FEMA partnered with the State of Wisconsin and used the quantitative approach to complete a loss avoidance study for the acquisition projects. A total of five projects, located in Milwaukee County, were chosen during the data collection phase.
Project #1: City of Wauwatosa (23 properties) Projects #2 & 3: City of Milwaukee – two projects (19 and 2 properties in Lincoln
Creek neighborhood) Project #4: Village of Brown Deer (9 properties) Project #5: Village of Oak Creek (1 property).
For the five projects, this report contains project descriptive information and the impacts of those projects. All of the acquisition projects were funded from the Disaster Declarations (#1180 & #1238) resulting from two flood events in1997 and 1998. Phase Two involved analysis. Damage analysis was collected for these projects, resulting in an estimate in damages that would have occurred had these projects not been executed. Two separate methodologies were used to determine potential losses avoided. For the first project (Wauwatosa) information was available from Benefit Cost Analysis (BCA) reports. These provided more in-depth information than was available for the other four projects. Damage estimates were based on actual storm events and the potential losses that may have occurred had the mitigation project not taken place. For projects #2-5, FEMA’s HAZUS modeling software was used to model a 100-year flood event. This modeling assumes that most properties are damaged to some degree during a 100-year flood event. Because the first project includes multiple events, the return on investment is higher than the one-time event modeled by HAZUS for projects #2-5.
Evaluating Losses Avoided Through Acquisition Projects
v
The final phase involved reporting results. The cost associated with damages was estimated using a loss estimation analysis. These analyses calculated the dollar amount from physical damage and loss of function from pre and post mitigation. The total losses avoided were estimated at $2,155,513. The total project investment for the five projects (based on the original project cost) was $2,954,399. As a result, the collective return on investment for the flood events was 73 percent. If results are examined by type of methodology, the Wauwatosa project (actual events) yields a return on investment of 148 percent. For Projects # 2-5, the return on investment is 49 percent. Using either methodology yields significant returns on investments which will only increase as more flooding events occur, making property acquisition an effective mitigation tool.
Evaluating Losses Avoided Through Acquisition Projects
Page 1
Section I: Introduction
Whether the onset of flooding is a result of torrential rainfall or floodplain development, the State of Wisconsin has a long history of flooding. Fortunately, there are tools and techniques which, when put into effect in a timely fashion, allow us to avoid serious consequences. These tools and techniques are known as mitigation.
There are numerous possible courses of action that can be considered for a mitigation project as follows:
Mitigation is any sustainable activity or project that reduces losses for people, property, or possessions. This can be achieved through risk analysis, which results in information that provides a foundation for mitigation activities that reduce risk, and flood insurance that protects financial investment.
Do nothing – with this alternative, no costs are involved but damages and emergency response costs will continue to occur in future events.
Elevation – may be a cost-effective alternative for certain properties. Properties located in the flood fringe are elevated to the 100-year base flood elevation plus two feet of freeboard. This is not an alternative for properties located in the floodway. Future damages would be prevented to the level of protection; however, emergency response costs would continue in future events. Although property damage may be prevented, property owners most likely would not have access to their properties during flooding events.
Acquisition/Relocation/Demolition – the preferred alternative, may be the only alternative for floodway properties. Permanently mitigates damages to the property and no emergency response is required.
Acquisition is the chosen type of mitigation for this report.
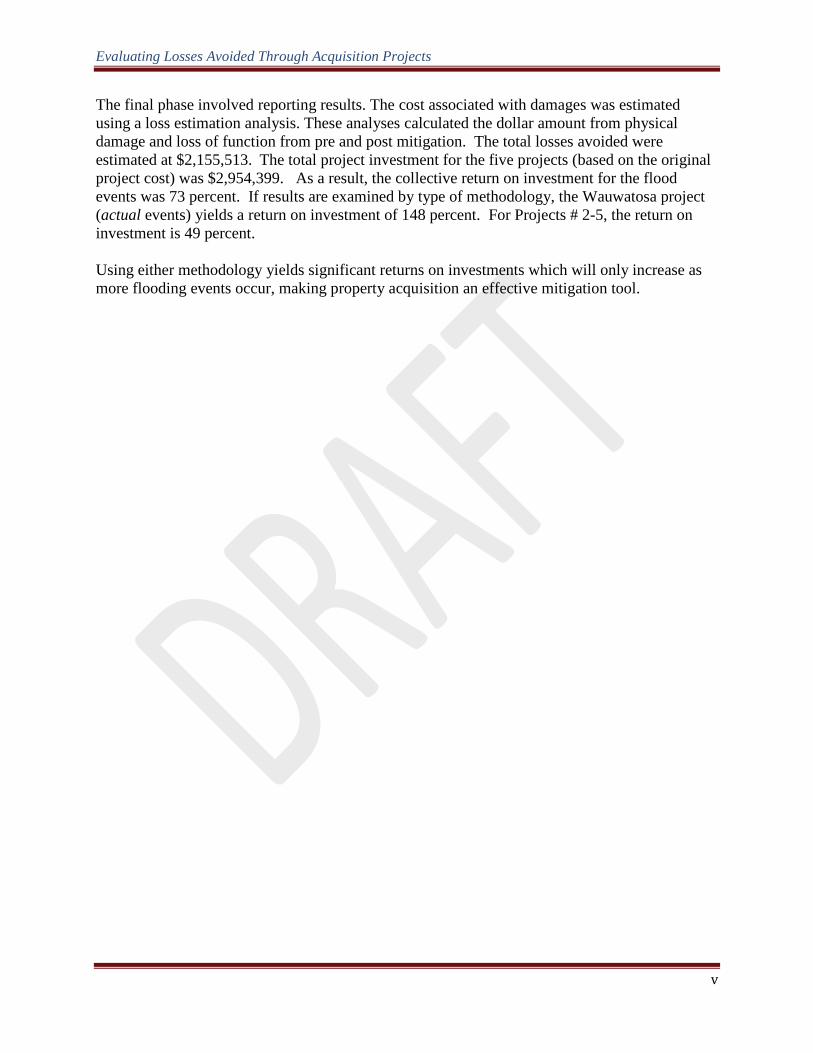
In a property acquisition project, the community buys private property, acquires title to it, and removes or relocates the structures. By law, that property is now public property and must forever remain open space land. The community can use it to create public parks, wildlife refuges, etc. but it cannot sell it to private individuals and development is limited. Property acquisitions work the same way as any other real estate transaction. Property owners who want to sell their property are given fair market value. It is a good opportunity for people who live in or near hazard areas to move to safer ground.
Removal of flood prone homes in Milwaukee County provides green space.

Evaluating Losses Avoided Through Acquisition Projects
Page 2
1.1 Purpose
The State of Wisconsin has invested millions of dollars to acquire flood-prone properties. How well is this mitigation initiative working? Can losses avoided be quantified as a direct result of implementing acquisition projects? This study seeks to provide the answers.
The scope of this study includes five projects with 54 acquisition properties that were executed in four cities in Milwaukee County and funded through FEMA’s Hazard Mitigation Grant Program (HMGP).
The study provides comprehensive documentation of “losses avoided” (damages avoided or benefits) utilizing quantitative methods. It also describes a reproducible and verifiable methodology so that results are meaningful and defensible.
Evaluating Losses Avoided Through Acquisition Projects
Page 3
1.2 Methodology Overview
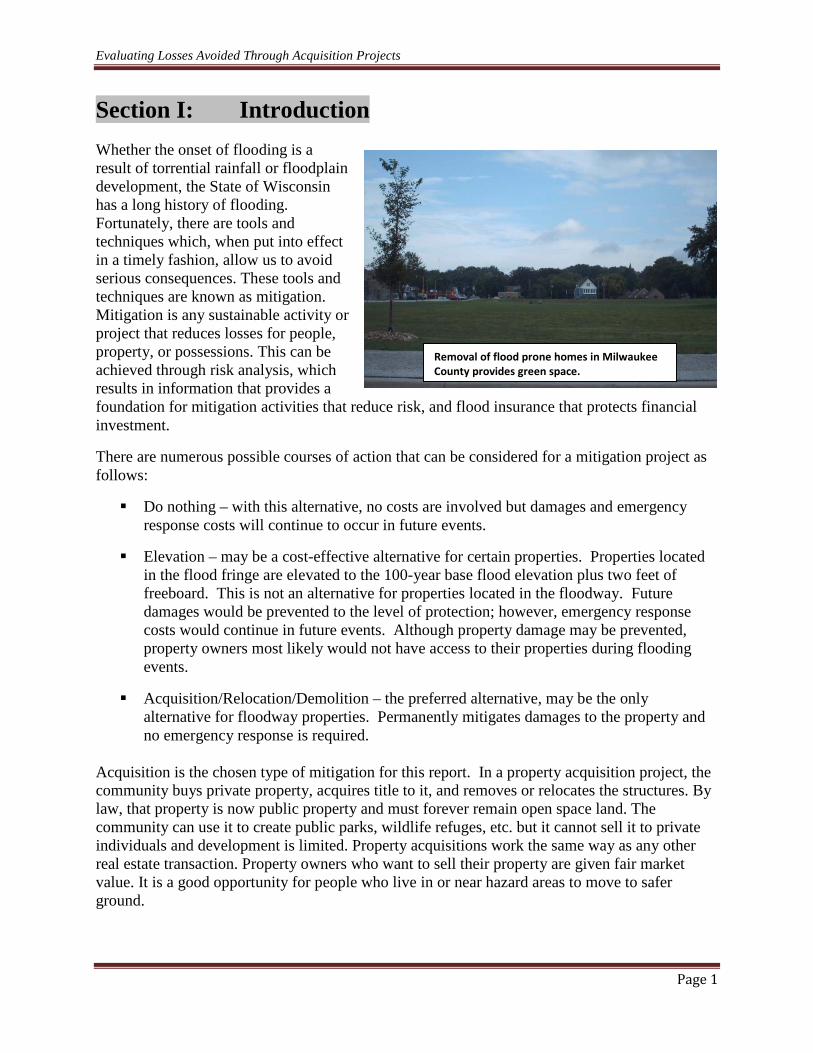
This study focused on the performance of acquisition projects and was divided into three phases: Phase 1- Data Collection, Phase 2 –Data Analysis and Phase 3 – Loss Estimation Analysis.
Figure 1.2.1
Phase 1: Data Collection includes the development of the initial project list.
Projects were selected based on parameters established for the study. The selected projects were then screened based on the availability of data necessary to complete the study. The final project list then proceeded to Phase 2.
Phase 2: Data Analysis included multiple analyses to determine if there were measurable avoided losses since the projects’ completion.
•
To calculate the flood losses avoided due to acquisition projects in Milwaukee County, it was essential to obtain pre-mitigation data on each structure to be evaluated. This data included:
• Location
• Building Value Contents Value
Phase 3: Loss Estimation Analysis involves analyzing each project for flood damage loss. Loss Estimation Analysis is the final phase of a loss avoidance study. It is conducted to estimate the avoided losses based on the effectiveness of the mitigation project during the selected storm
Loss Avoidance Study Methodology
Phase Overview for Flood Mitigation Projects
Phase 1 Data Collection
Phase 2 Data Analysis
Phase 3 Loss Estimation Analysis

Evaluating Losses Avoided Through Acquisition Projects
Page 4
event. The Loss Estimation Analysis is accomplished by calculating the amount of damage in dollars associated with the damage analysis calculated in Phase 2 of the study.
This phase includes two major tasks:
1.
When calculating losses avoided (LA), the first step is to determine the dollar value estimate of the damage that would have occurred had the mitigation project not been executed and then the estimated damage in dollars that might occur after a flood event.
Calculating Losses Avoided (LA)
2.
In determining the Return on Investment (ROI), losses avoided (LA) and project investments (PI) or acquisition costs are used. The formula used to calculate ROI is shown below.
Calculating Return On Investment (ROI)
$LA (Loss Avoided)
$PI (Project Investment or Acquisition Cost) X 100 = ROI

Evaluating Losses Avoided Through Acquisition Projects
Page 5
Section 2: Project Selection
2.1 Data Collection (Initial Project Selection)
The first step is to determine the parameters of the study. These parameters may include, but are not limited to; hazard type, area of interest and project type.
Hazard Type
Projects may be chosen and screened based on hazard type. For this study, flooding was chosen as the hazard type.
Area of Interest
Depending on the study, the area of interest could vary from a community, a county, a region of a state, etc. The entity conducting the study should identify and define the area of interest prior to project selection. For this study, four communities were identified for five separate projects on residential acquisitions. A listing of state projects was reviewed to determine areas where property acquisitions had occurred. The following communities in Milwaukee County, Wisconsin were chosen for this study:
• City of Wauwatosa • City of Milwaukee (Lincoln Creek - 2 projects) • Village of Oak Creek • Village of Brown Deer
Project type
Project selection may be based on project type. If flooding is the chosen hazard, the project type may be acquisitions, elevations or other mitigation projects. For this project, property acquisition was chosen as the project type.
2.2 Project Screening
The initial list of projects must be evaluated to determine if enough specific data and characteristics are available for the methodology being applied. If the data is not available, the project should be removed from the list.
There are three primary considerations for the project screening process: initial site visits, local preferences, and available information.
Initial Site Visit
A site visit should be done in order to conduct a preliminary assessment of the project and meet the local officials that have worked with the project and have the most knowledge of it.
Evaluating Losses Avoided Through Acquisition Projects
Page 6
Conducting the detailed data collection for Phase 2 and 3 can also be done at this time. The visit may reveal a lack of data necessary to complete the project or other resources that may be available.
Local Preferences
State or local officials may have a preference for certain projects over others. This must be taken into consideration in selecting the projects.
Available Information
Some of the projects initially selected may not have enough information in project files to proceed. FEMA and other contracting agencies have had different long-term data storage requirements since mitigation programs began. Some of the basic information such as the original funding application and financial reports are usually kept in FEMA files. Some of the more detailed information including design drawings and digital data are often not in the same files. Therefore, the person conducting the study may be required to use other resources such as local governments or contracting consultants to retrieve the information. If adequate information cannot be found, the list of possible projects may be reduced.
2.3 Final Project Selection
For this report, a listing of state projects was reviewed and communities were chosen that had a number of property acquisitions acquired with FEMA mitigation funds. Next, the occurrence of damaging events since the acquisitions occurred was taken into consideration. Multiple damage events increase the analysis potential of the project. How the analysis is completed on a project is affected by the available data on the project property. Next, available information on the damage events since the buyout occurred, i.e. stream data/gauge information, the National Climatic Data Center (NCDC) historical data, FEMA disaster declaration information, etc. was collected.
The four communities noted in Section 2.1 were chosen based on the information that was available from local, state and FEMA offices. The final project list then proceeded to Phase 2: Data Analysis.

Evaluating Losses Avoided Through Acquisition Projects
Page 7
Section 3: Project Information This section of the report provides background information on each of the acquisition projects and the impacts from the selected storm events (see Section 3.1). Information for this section comes from the FEMA project files, the National Weather Service and the State of Wisconsin Department of Military Affairs, Wisconsin Emergency Management Division. This study focuses on five projects that include 54 residential properties in Milwaukee County. The acquisition projects are:
Project #1: City of Wauwatosa (23 properties) Projects #2 & 3: City of Milwaukee – two projects (19 and 2 properties) Project #4: Village of Brown Deer (9 properties) Project #5: Village of Oak Creek (1 property).
The bodies of water that affect these cities include the Menomonee River (Wauwatosa), Lincoln Creek (City of Milwaukee) and the Root River (Oak Creek).
The first project (City of Wauwatosa) included information from a Benefit Cost Analysis (BCA) and actual flood events. Also included in the analysis of this project was HAZUS modeling. The remaining four projects did not have BCA data and HAZUS modeling was the only information used in the analysis of the return on investment on these projects.
3.1 History
Milwaukee County has been a part of five major disaster declarations within the past 13 years. All of the acquisition projects were funded from the Disaster Declarations resulting from the two events: July 1997 and August 1998 (See Table 3.1).
From the night of June 20 to the morning of June 21, 1997, a storm system passed through the southeastern portion of Wisconsin in the area of Milwaukee, Ozaukee, Washington and Waukesha Counties. This storm system generated torrential rains throughout this four-county area with rainfall ranging from five to nearly ten inches in a thirty-hour period. The most intense rainfall was centered in northern Milwaukee County. Areas within the county which were damaged significantly included Brown Deer, Glendale and Wauwatosa. The County also received significant damages to its parks and golf courses. Initial damage assessments reported $71 million to private property and $17 million to public property for a total $87 million for this four-county area.
During the period of August 4th and 7th, 1998 a series of slow-moving thunderstorms dumped five to ten inches of rain in a three to five hour period and affected a four-county area (Milwaukee, Rock, Sheboygan and Waukesha). Milwaukee County had six to ten inches of rainfall. Some of the hardest hit areas within Milwaukee County were the same areas that had been affected by flooding the previous summer.
Evaluating Losses Avoided Through Acquisition Projects
Page 8
Table 3.1.1 Disaster Declarations for Milwaukee County (used in this report) Date
Disaster Number
July 7, 1997 DR-1180
August 12, 1998 DR-1238 Source: FEMA
3.2 Project #1: Wauwatosa, WI – (Menomonee River)
Historic River Crest Data and Flood Impacts
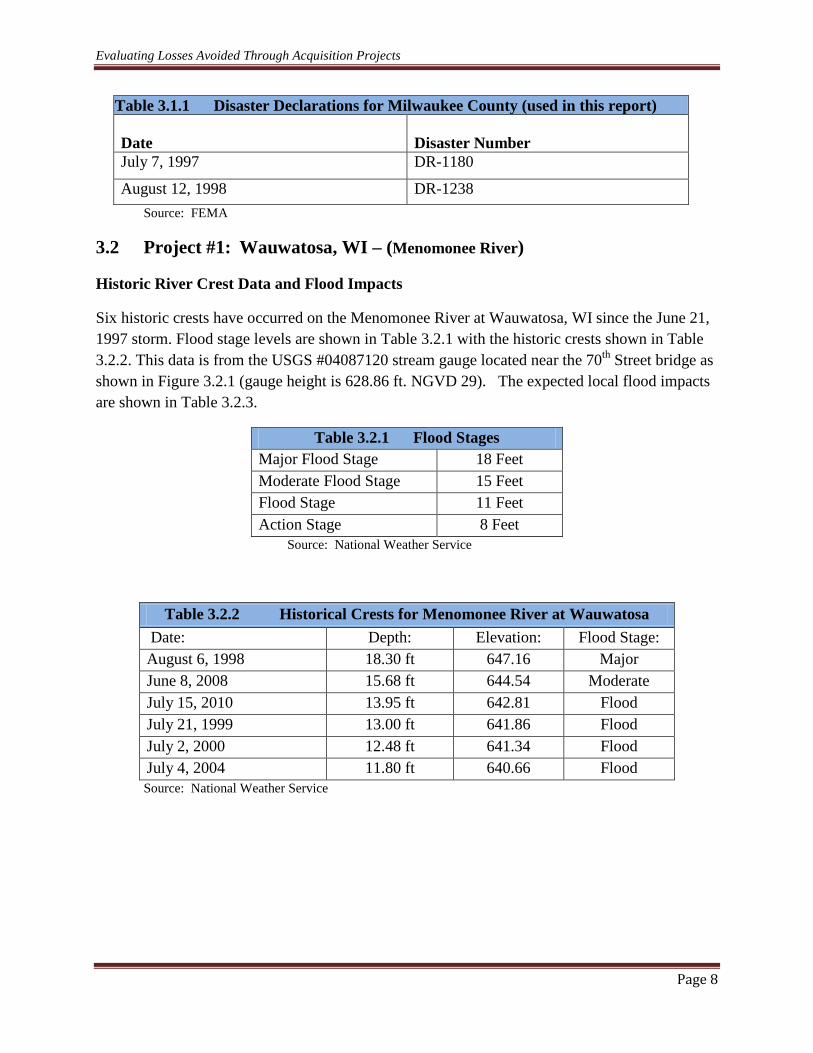
Six historic crests have occurred on the Menomonee River at Wauwatosa, WI since the June 21, 1997 storm. Flood stage levels are shown in Table 3.2.1 with the historic crests shown in Table 3.2.2. This data is from the USGS #04087120 stream gauge located near the 70th Street bridge as shown in Figure 3.2.1 (gauge height is 628.86 ft. NGVD 29). The expected local flood impacts are shown in Table 3.2.3.
Table 3.2.1 Flood Stages Major Flood Stage 18 Feet Moderate Flood Stage 15 Feet Flood Stage 11 Feet Action Stage 8 Feet
Source: National Weather Service
Table 3.2.2 Historical Crests for Menomonee River at Wauwatosa Date: Depth: Elevation: Flood Stage: August 6, 1998 18.30 ft 647.16 Major June 8, 2008 15.68 ft 644.54 Moderate July 15, 2010 13.95 ft 642.81 Flood July 21, 1999 13.00 ft 641.86 Flood July 2, 2000 12.48 ft 641.34 Flood July 4, 2004 11.80 ft 640.66 Flood
Source: National Weather Service
Evaluating Losses Avoided Through Acquisition Projects
Page 9
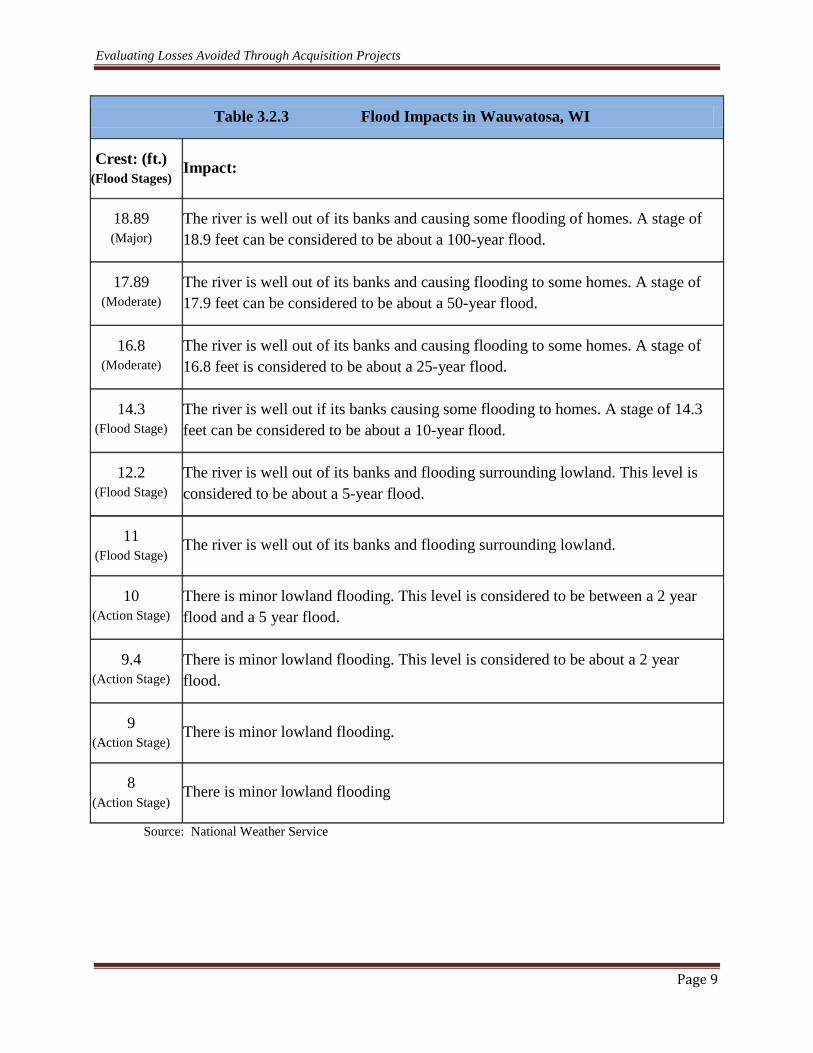
Table 3.2.3 Flood Impacts in Wauwatosa, WI
Crest: (ft.) (Flood Stages)
Impact:
18.89 (Major)
The river is well out of its banks and causing some flooding of homes. A stage of 18.9 feet can be considered to be about a 100-year flood.
17.89 (Moderate)
The river is well out of its banks and causing flooding to some homes. A stage of 17.9 feet can be considered to be about a 50-year flood.
16.8 (Moderate)
The river is well out of its banks and causing flooding to some homes. A stage of 16.8 feet is considered to be about a 25-year flood.
14.3 (Flood Stage)
The river is well out if its banks causing some flooding to homes. A stage of 14.3 feet can be considered to be about a 10-year flood.
12.2 (Flood Stage)
The river is well out of its banks and flooding surrounding lowland. This level is considered to be about a 5-year flood.
11 (Flood Stage)
The river is well out of its banks and flooding surrounding lowland.
10 (Action Stage)
There is minor lowland flooding. This level is considered to be between a 2 year flood and a 5 year flood.
9.4 (Action Stage)
There is minor lowland flooding. This level is considered to be about a 2 year flood.
9 (Action Stage)
There is minor lowland flooding.
8 (Action Stage)
There is minor lowland flooding
Source: National Weather Service

Evaluating Losses Avoided Through Acquisition Projects
Page 10
A portion of the Federal disaster aid provided for this event was funding for disaster mitigation programs. These are a variety of programs all designed to reduce or eliminate the impact of future events and may include programs such as flood proofing or acquisition. The community of Wauwatosa applied for and was awarded funding for an acquisition project (project #1180.0007) in which the community proposed buying properties that had a history of receiving damage during flood events such as the June 21st
, 1997 event. Figure 3.2.1 shows the location of acquisition properties within the flood plain, the flood depth, and the location of the USGS Gauge #04087120 and its proximity to the properties. The list of properties and addresses is provided in Table 3.2.4.

Evaluating Losses Avoided Through Acquisition Projects
Page 11
Figure 3.2.1 Acquisition Properties with Flood Depths and USGS Stream Gauge #04087120
The values represented in Table 3.2.4 will be used to calculate losses avoided for potential flooding events based on the historical crests as detailed in Table 3.2.2. Because this is an acquisition project, Losses Avoided will be equal to the total values calculated using the Damage Depth Function (DDF) from the Benefit Cost Analysis (BCA). As defined by the Army Corps

Evaluating Losses Avoided Through Acquisition Projects
Page 12
of Engineers, the Depth-Damage Function is a mathematical relationship between the depth of flood water above or below the first floor of a building and the amount of damage that can be attributed to that water.
Table 3.2.4 Wauwatosa Proposed Property Acquisition Addresses & Values* Property Address: Building Value: Contents Value: Total Value:
7013 W Chestnut St. $ 70,400 $21,120 $91,520 7029 W Chestnut St. $ 92,400 $27,720 $120,120 1195 N 71st St. $ 88,000 $44,000 $132,000 1147 N 68th St. $103,400 $31,000 $134,400 6817 River Parkway $129,900 $39,000 $168,900 1183 N 71st St. $167,200 $50,160 $217,360 7121 W Chestnut St. $179,900 $53,970 $233,870 7005 W Chestnut St. $ 70,400 $21,000 $91,400 7021 W Chestnut St. $ 92,500 $27,750 $120,250 7009 W Chestnut St. $ 57,200 $17,000 $74,200 1177 N 71st St. $102,800 $31,000 $133,800 7025 W Chestnut St. $172,800 $51,840 $224,640 1168 N 72nd St. $ 91,600 $27,500 $119,100 6825 River Parkway $179,200 $54,000 $233,200 6833 River Parkway $140,000 $33,000 $173,000 7117 W Chestnut St. $145,600 $43,680 $189,280 7127 W Chestnut St. $119,900 $35,970 $155,870 7113 W Chestnut St. $101,400 $30,420 $131,820 7037 W Chestnut St. $151,200 $45,360 $196,560 7109 W Chestnut St. $168,000 $50,400 $218,400 7033 W Chestnut St. $125,400 $37,620 $163,020 1173 N 71st St. $195,800 $59,000 $254,800 1176 N 72nd St. $143,400 $43,020 $186,420
Source: WEM – B/C Analysis, January 1998 (*Note: Values were drawn directly from the Benefit Cost Analysis (BCA) and closing documents obtained from WEM, and represent best available values for these properties. All values have been adjusted for inflation.)
The 23 properties involved in the acquisition project were in the floodway of the Menomonee River as indicated on the Flood Insurance Rate Map #550284 0005B, dated December 1, 1978. Data necessary for the analysis of the 23 properties was obtained from the State of Wisconsin, Department of Military Affairs- Wisconsin Emergency Management – Recovery Section. The physical location of the properties is described as the area of 68th and 72nd Streets south of Chestnut Street and River Parkway near Hart Park as shown in the highlighted area of Figure 3.2.1.
Evaluating Losses Avoided Through Acquisition Projects
Page 13
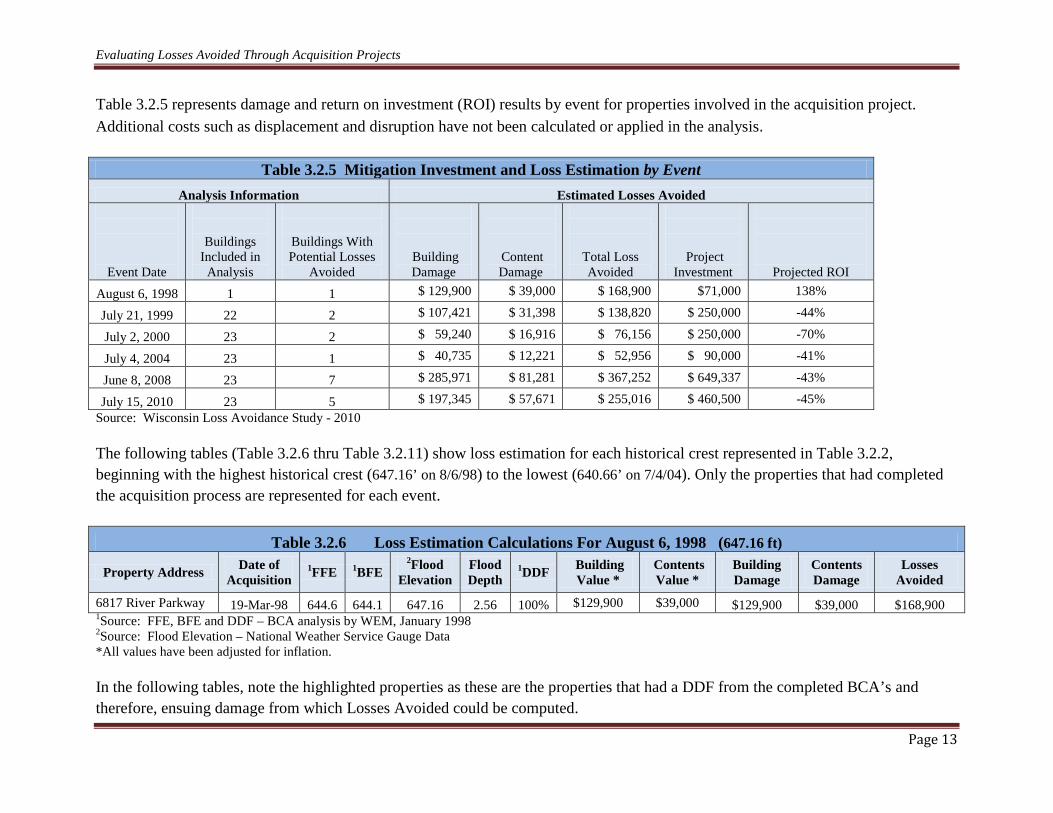
Table 3.2.5 represents damage and return on investment (ROI) results by event for properties involved in the acquisition project. Additional costs such as displacement and disruption have not been calculated or applied in the analysis.
Table 3.2.5 Mitigation Investment and Loss Estimation by Event Analysis Information Estimated Losses Avoided
Event Date
Buildings Included in
Analysis
Buildings With Potential Losses
Avoided
Building Damage
Content Damage
Total Loss Avoided
Project Investment
Projected ROI August 6, 1998 1 1 $ 129,900 $ 39,000 $ 168,900 $71,000 138%
July 21, 1999 22 2 $ 107,421 $ 31,398 $ 138,820 $ 250,000 -44%
July 2, 2000 23 2 $ 59,240 $ 16,916 $ 76,156 $ 250,000 -70%
July 4, 2004 23 1 $ 40,735 $ 12,221 $ 52,956 $ 90,000 -41%
June 8, 2008 23 7 $ 285,971 $ 81,281 $ 367,252 $ 649,337 -43%
July 15, 2010 23 5 $ 197,345 $ 57,671 $ 255,016 $ 460,500 -45% Source: Wisconsin Loss Avoidance Study - 2010
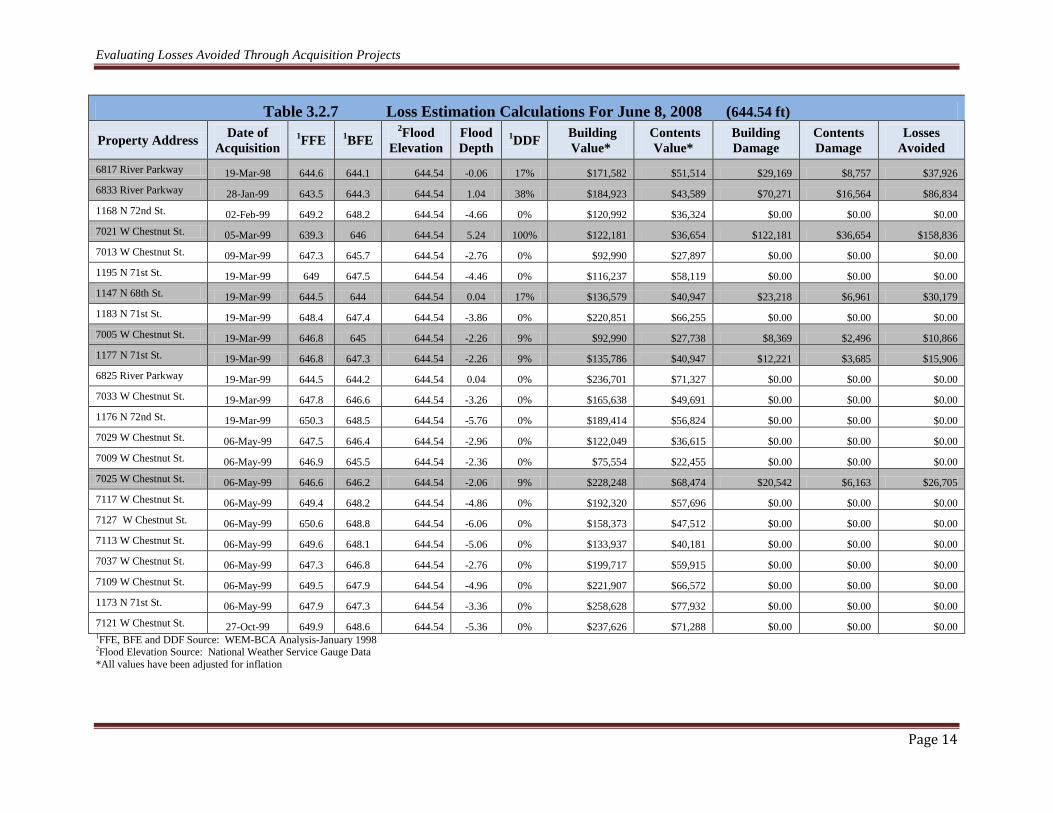
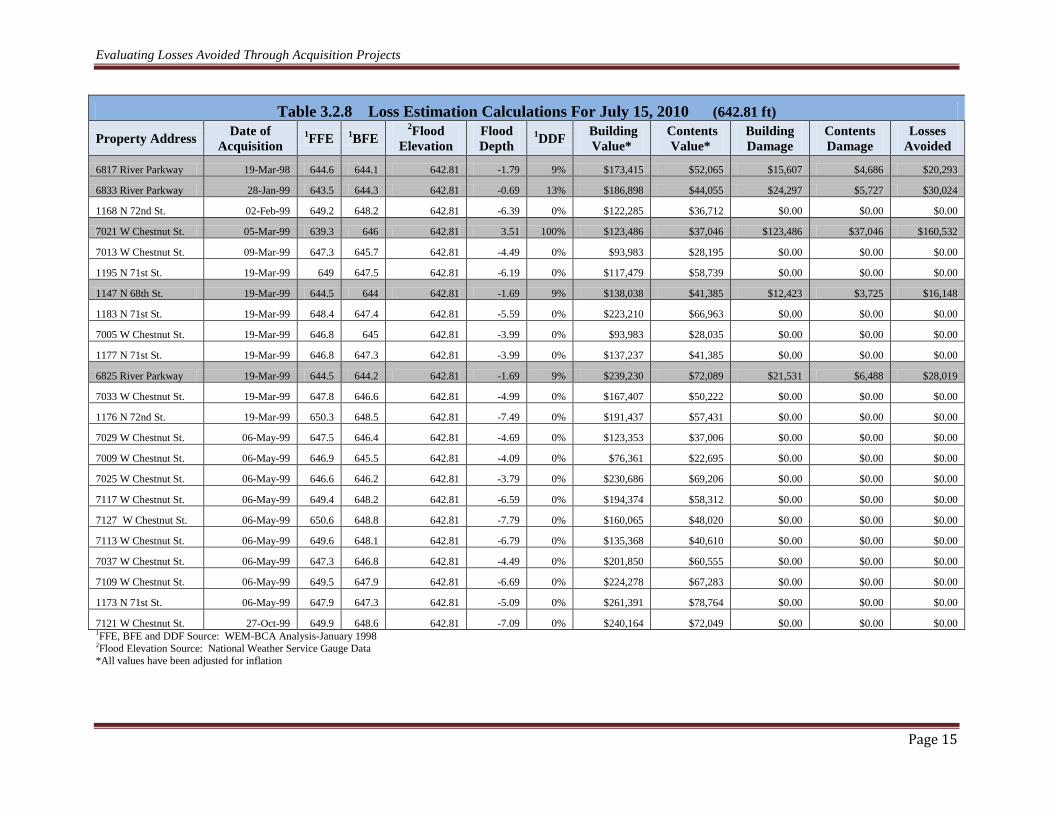
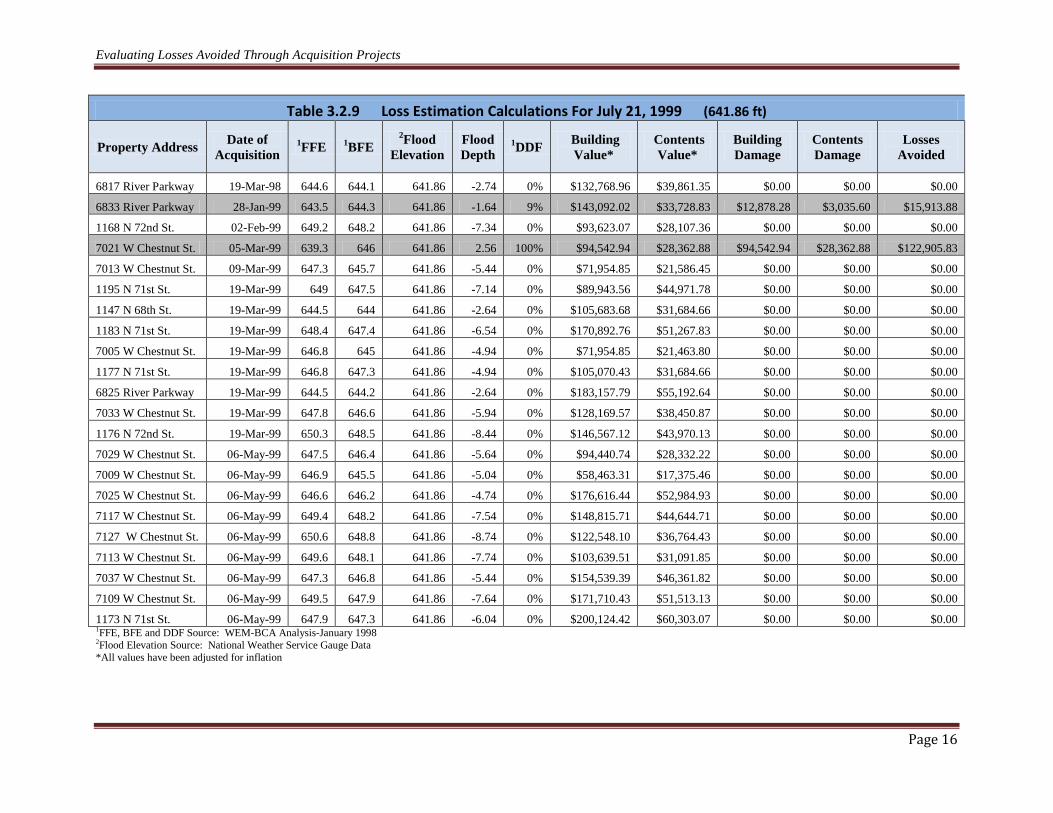
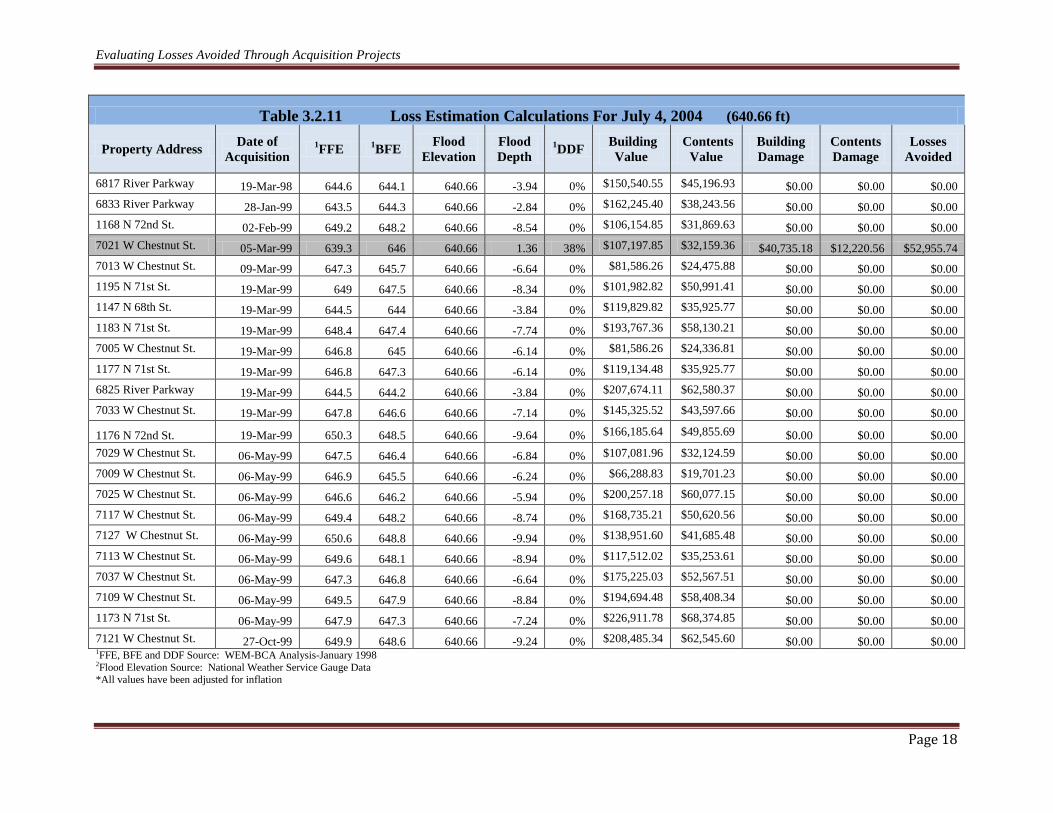
The following tables (Table 3.2.6 thru Table 3.2.11) show loss estimation for each historical crest represented in Table 3.2.2, beginning with the highest historical crest (647.16’ on 8/6/98) to the lowest (640.66’ on 7/4/04). Only the properties that had completed the acquisition process are represented for each event.
Table 3.2.6 Loss Estimation Calculations For August 6, 1998 (647.16 ft)
Property Address Date of Acquisition
1FFE 1BFE 2Flood
Elevation Flood Depth
1DDF Building Value *
Contents Value *
Building Damage
Contents Damage
Losses Avoided
6817 River Parkway 19-Mar-98 644.6 644.1 647.16 2.56 100% $129,900 $39,000 $129,900 $39,000 $168,900 1Source: FFE, BFE and DDF – BCA analysis by WEM, January 1998 2
*All values have been adjusted for inflation. Source: Flood Elevation – National Weather Service Gauge Data
In the following tables, note the highlighted properties as these are the properties that had a DDF from the completed BCA’s and therefore, ensuing damage from which Losses Avoided could be computed.
Evaluating Losses Avoided Through Acquisition Projects
Page 14
Table 3.2.7 Loss Estimation Calculations For June 8, 2008 (644.54 ft)
Property Address Date of Acquisition
1FFE 1BFE 2Flood
Elevation Flood Depth
1DDF Building Value*
Contents Value*
Building Damage
Contents Damage
Losses Avoided
6817 River Parkway 19-Mar-98 644.6 644.1 644.54 -0.06 17% $171,582 $51,514 $29,169 $8,757 $37,926 6833 River Parkway 28-Jan-99 643.5 644.3 644.54 1.04 38% $184,923 $43,589 $70,271 $16,564 $86,834 1168 N 72nd St. 02-Feb-99 649.2 648.2 644.54 -4.66 0% $120,992 $36,324 $0.00 $0.00 $0.00 7021 W Chestnut St. 05-Mar-99 639.3 646 644.54 5.24 100% $122,181 $36,654 $122,181 $36,654 $158,836 7013 W Chestnut St. 09-Mar-99 647.3 645.7 644.54 -2.76 0% $92,990 $27,897 $0.00 $0.00 $0.00 1195 N 71st St. 19-Mar-99 649 647.5 644.54 -4.46 0% $116,237 $58,119 $0.00 $0.00 $0.00 1147 N 68th St. 19-Mar-99 644.5 644 644.54 0.04 17% $136,579 $40,947 $23,218 $6,961 $30,179 1183 N 71st St. 19-Mar-99 648.4 647.4 644.54 -3.86 0% $220,851 $66,255 $0.00 $0.00 $0.00 7005 W Chestnut St. 19-Mar-99 646.8 645 644.54 -2.26 9% $92,990 $27,738 $8,369 $2,496 $10,866 1177 N 71st St. 19-Mar-99 646.8 647.3 644.54 -2.26 9% $135,786 $40,947 $12,221 $3,685 $15,906 6825 River Parkway 19-Mar-99 644.5 644.2 644.54 0.04 0% $236,701 $71,327 $0.00 $0.00 $0.00 7033 W Chestnut St. 19-Mar-99 647.8 646.6 644.54 -3.26 0% $165,638 $49,691 $0.00 $0.00 $0.00 1176 N 72nd St. 19-Mar-99 650.3 648.5 644.54 -5.76 0% $189,414 $56,824 $0.00 $0.00 $0.00 7029 W Chestnut St. 06-May-99 647.5 646.4 644.54 -2.96 0% $122,049 $36,615 $0.00 $0.00 $0.00 7009 W Chestnut St. 06-May-99 646.9 645.5 644.54 -2.36 0% $75,554 $22,455 $0.00 $0.00 $0.00 7025 W Chestnut St. 06-May-99 646.6 646.2 644.54 -2.06 9% $228,248 $68,474 $20,542 $6,163 $26,705 7117 W Chestnut St. 06-May-99 649.4 648.2 644.54 -4.86 0% $192,320 $57,696 $0.00 $0.00 $0.00 7127 W Chestnut St. 06-May-99 650.6 648.8 644.54 -6.06 0% $158,373 $47,512 $0.00 $0.00 $0.00 7113 W Chestnut St. 06-May-99 649.6 648.1 644.54 -5.06 0% $133,937 $40,181 $0.00 $0.00 $0.00 7037 W Chestnut St. 06-May-99 647.3 646.8 644.54 -2.76 0% $199,717 $59,915 $0.00 $0.00 $0.00 7109 W Chestnut St. 06-May-99 649.5 647.9 644.54 -4.96 0% $221,907 $66,572 $0.00 $0.00 $0.00 1173 N 71st St. 06-May-99 647.9 647.3 644.54 -3.36 0% $258,628 $77,932 $0.00 $0.00 $0.00 7121 W Chestnut St. 27-Oct-99 649.9 648.6 644.54 -5.36 0% $237,626 $71,288 $0.00 $0.00 $0.00 1FFE, BFE and DDF Source: WEM-BCA Analysis-January 1998 2
*All values have been adjusted for inflation Flood Elevation Source: National Weather Service Gauge Data
Evaluating Losses Avoided Through Acquisition Projects
Page 15
Table 3.2.8 Loss Estimation Calculations For July 15, 2010 (642.81 ft) Property Address Date of
Acquisition 1FFE 1BFE
2Flood Elevation
Flood Depth
1DDF Building Value*
Contents Value*
Building Damage
Contents Damage
Losses Avoided
6817 River Parkway 19-Mar-98 644.6 644.1 642.81 -1.79 9% $173,415 $52,065 $15,607 $4,686 $20,293
6833 River Parkway 28-Jan-99 643.5 644.3 642.81 -0.69 13% $186,898 $44,055 $24,297 $5,727 $30,024
1168 N 72nd St. 02-Feb-99 649.2 648.2 642.81 -6.39 0% $122,285 $36,712 $0.00 $0.00 $0.00
7021 W Chestnut St. 05-Mar-99 639.3 646 642.81 3.51 100% $123,486 $37,046 $123,486 $37,046 $160,532
7013 W Chestnut St. 09-Mar-99 647.3 645.7 642.81 -4.49 0% $93,983 $28,195 $0.00 $0.00 $0.00
1195 N 71st St. 19-Mar-99 649 647.5 642.81 -6.19 0% $117,479 $58,739 $0.00 $0.00 $0.00
1147 N 68th St. 19-Mar-99 644.5 644 642.81 -1.69 9% $138,038 $41,385 $12,423 $3,725 $16,148
1183 N 71st St. 19-Mar-99 648.4 647.4 642.81 -5.59 0% $223,210 $66,963 $0.00 $0.00 $0.00
7005 W Chestnut St. 19-Mar-99 646.8 645 642.81 -3.99 0% $93,983 $28,035 $0.00 $0.00 $0.00
1177 N 71st St. 19-Mar-99 646.8 647.3 642.81 -3.99 0% $137,237 $41,385 $0.00 $0.00 $0.00
6825 River Parkway 19-Mar-99 644.5 644.2 642.81 -1.69 9% $239,230 $72,089 $21,531 $6,488 $28,019
7033 W Chestnut St. 19-Mar-99 647.8 646.6 642.81 -4.99 0% $167,407 $50,222 $0.00 $0.00 $0.00
1176 N 72nd St. 19-Mar-99 650.3 648.5 642.81 -7.49 0% $191,437 $57,431 $0.00 $0.00 $0.00
7029 W Chestnut St. 06-May-99 647.5 646.4 642.81 -4.69 0% $123,353 $37,006 $0.00 $0.00 $0.00
7009 W Chestnut St. 06-May-99 646.9 645.5 642.81 -4.09 0% $76,361 $22,695 $0.00 $0.00 $0.00
7025 W Chestnut St. 06-May-99 646.6 646.2 642.81 -3.79 0% $230,686 $69,206 $0.00 $0.00 $0.00
7117 W Chestnut St. 06-May-99 649.4 648.2 642.81 -6.59 0% $194,374 $58,312 $0.00 $0.00 $0.00
7127 W Chestnut St. 06-May-99 650.6 648.8 642.81 -7.79 0% $160,065 $48,020 $0.00 $0.00 $0.00
7113 W Chestnut St. 06-May-99 649.6 648.1 642.81 -6.79 0% $135,368 $40,610 $0.00 $0.00 $0.00
7037 W Chestnut St. 06-May-99 647.3 646.8 642.81 -4.49 0% $201,850 $60,555 $0.00 $0.00 $0.00
7109 W Chestnut St. 06-May-99 649.5 647.9 642.81 -6.69 0% $224,278 $67,283 $0.00 $0.00 $0.00
1173 N 71st St. 06-May-99 647.9 647.3 642.81 -5.09 0% $261,391 $78,764 $0.00 $0.00 $0.00
7121 W Chestnut St. 27-Oct-99 649.9 648.6 642.81 -7.09 0% $240,164 $72,049 $0.00 $0.00 $0.00 1FFE, BFE and DDF Source: WEM-BCA Analysis-January 1998 2
*All values have been adjusted for inflation Flood Elevation Source: National Weather Service Gauge Data
Evaluating Losses Avoided Through Acquisition Projects
Page 16
Table 3.2.9 Loss Estimation Calculations For July 21, 1999 (641.86 ft)
Property Address Date of Acquisition
1FFE 1BFE 2Flood
Elevation Flood Depth
1DDF Building Value*
Contents Value*
Building Damage
Contents Damage
Losses Avoided
6817 River Parkway 19-Mar-98 644.6 644.1 641.86 -2.74 0% $132,768.96 $39,861.35 $0.00 $0.00 $0.00
6833 River Parkway 28-Jan-99 643.5 644.3 641.86 -1.64 9% $143,092.02 $33,728.83 $12,878.28 $3,035.60 $15,913.88
1168 N 72nd St. 02-Feb-99 649.2 648.2 641.86 -7.34 0% $93,623.07 $28,107.36 $0.00 $0.00 $0.00
7021 W Chestnut St. 05-Mar-99 639.3 646 641.86 2.56 100% $94,542.94 $28,362.88 $94,542.94 $28,362.88 $122,905.83
7013 W Chestnut St. 09-Mar-99 647.3 645.7 641.86 -5.44 0% $71,954.85 $21,586.45 $0.00 $0.00 $0.00
1195 N 71st St. 19-Mar-99 649 647.5 641.86 -7.14 0% $89,943.56 $44,971.78 $0.00 $0.00 $0.00
1147 N 68th St. 19-Mar-99 644.5 644 641.86 -2.64 0% $105,683.68 $31,684.66 $0.00 $0.00 $0.00
1183 N 71st St. 19-Mar-99 648.4 647.4 641.86 -6.54 0% $170,892.76 $51,267.83 $0.00 $0.00 $0.00
7005 W Chestnut St. 19-Mar-99 646.8 645 641.86 -4.94 0% $71,954.85 $21,463.80 $0.00 $0.00 $0.00
1177 N 71st St. 19-Mar-99 646.8 647.3 641.86 -4.94 0% $105,070.43 $31,684.66 $0.00 $0.00 $0.00
6825 River Parkway 19-Mar-99 644.5 644.2 641.86 -2.64 0% $183,157.79 $55,192.64 $0.00 $0.00 $0.00
7033 W Chestnut St. 19-Mar-99 647.8 646.6 641.86 -5.94 0% $128,169.57 $38,450.87 $0.00 $0.00 $0.00
1176 N 72nd St. 19-Mar-99 650.3 648.5 641.86 -8.44 0% $146,567.12 $43,970.13 $0.00 $0.00 $0.00
7029 W Chestnut St. 06-May-99 647.5 646.4 641.86 -5.64 0% $94,440.74 $28,332.22 $0.00 $0.00 $0.00
7009 W Chestnut St. 06-May-99 646.9 645.5 641.86 -5.04 0% $58,463.31 $17,375.46 $0.00 $0.00 $0.00
7025 W Chestnut St. 06-May-99 646.6 646.2 641.86 -4.74 0% $176,616.44 $52,984.93 $0.00 $0.00 $0.00
7117 W Chestnut St. 06-May-99 649.4 648.2 641.86 -7.54 0% $148,815.71 $44,644.71 $0.00 $0.00 $0.00
7127 W Chestnut St. 06-May-99 650.6 648.8 641.86 -8.74 0% $122,548.10 $36,764.43 $0.00 $0.00 $0.00
7113 W Chestnut St. 06-May-99 649.6 648.1 641.86 -7.74 0% $103,639.51 $31,091.85 $0.00 $0.00 $0.00
7037 W Chestnut St. 06-May-99 647.3 646.8 641.86 -5.44 0% $154,539.39 $46,361.82 $0.00 $0.00 $0.00
7109 W Chestnut St. 06-May-99 649.5 647.9 641.86 -7.64 0% $171,710.43 $51,513.13 $0.00 $0.00 $0.00
1173 N 71st St. 06-May-99 647.9 647.3 641.86 -6.04 0% $200,124.42 $60,303.07 $0.00 $0.00 $0.00 1FFE, BFE and DDF Source: WEM-BCA Analysis-January 1998 2
*All values have been adjusted for inflation Flood Elevation Source: National Weather Service Gauge Data

Evaluating Losses Avoided Through Acquisition Projects
Page 17
Table 3.2.10 Loss Estimation Calculations For July 2, 2000 (641.34 ft)
Property Address Date of Acquisition FFE BFE Flood
Elevation Flood Depth DDF Building
Value Contents
Value Building Damage
Contents Damage
Losses Avoided
6817 River Parkway 19-Mar-98 644.6 644.1 641.34 -3.26 0% $137,231.78 $41,201.23 $0.00 $0.00 $0.00 6833 River Parkway 28-Jan-99 643.5 644.3 641.34 -2.16 9% $147,901.84 $34,862.58 $13,311.17 $3,137.63 $16,448.80 1168 N 72nd St. 02-Feb-99 649.2 648.2 641.34 -7.86 0% $96,770.06 $29,052.15 $0.00 $0.00 $0.00 7021 W Chestnut St. 05-Mar-99 639.3 646 641.34 2.04 47% $97,720.86 $29,316.26 $45,928.80 $13,778.64 $59,707.44 7013 W Chestnut St. 09-Mar-99 647.3 645.7 641.34 -5.96 0% $74,373.50 $22,312.05 $0.00 $0.00 $0.00 1195 N 71st St. 19-Mar-99 649 647.5 641.34 -7.66 0% $92,966.87 $46,483.44 $0.00 $0.00 $0.00 1147 N 68th St. 19-Mar-99 644.5 644 641.34 -3.16 0% $109,236.07 $32,749.69 $0.00 $0.00 $0.00 1183 N 71st St. 19-Mar-99 648.4 647.4 641.34 -7.06 0% $176,637.06 $52,991.12 $0.00 $0.00 $0.00 7005 W Chestnut St. 19-Mar-99 646.8 645 641.34 -5.46 0% $74,373.50 $22,185.28 $0.00 $0.00 $0.00 1177 N 71st St. 19-Mar-99 646.8 647.3 641.34 -5.46 0% $108,602.21 $32,749.69 $0.00 $0.00 $0.00 6825 River Parkway 19-Mar-99 644.5 644.2 641.34 -3.16 0% $189,314.36 $57,047.85 $0.00 $0.00 $0.00 7033 W Chestnut St. 19-Mar-99 647.8 646.6 641.34 -6.46 0% $132,477.79 $39,743.34 $0.00 $0.00 $0.00 1176 N 72nd St. 19-Mar-99 650.3 648.5 641.34 -8.96 0% $151,493.74 $45,448.12 $0.00 $0.00 $0.00 7029 W Chestnut St. 06-May-99 647.5 646.4 641.34 -6.16 0% $97,615.21 $29,284.56 $0.00 $0.00 $0.00 7009 W Chestnut St. 06-May-99 646.9 645.5 641.34 -5.56 0% $60,428.47 $17,959.51 $0.00 $0.00 $0.00 7025 W Chestnut St. 06-May-99 646.6 646.2 641.34 -5.26 0% $182,553.13 $54,765.94 $0.00 $0.00 $0.00 7117 W Chestnut St. 06-May-99 649.4 648.2 641.34 -8.06 0% $153,817.91 $46,145.37 $0.00 $0.00 $0.00 7127 W Chestnut St. 06-May-99 650.6 648.8 641.34 -9.26 0% $126,667.36 $38,000.21 $0.00 $0.00 $0.00 7113 W Chestnut St. 06-May-99 649.6 648.1 641.34 -8.26 0% $107,123.19 $32,136.96 $0.00 $0.00 $0.00 7037 W Chestnut St. 06-May-99 647.3 646.8 641.34 -5.96 0% $159,733.99 $47,920.20 $0.00 $0.00 $0.00 7109 W Chestnut St. 06-May-99 649.5 647.9 641.34 -8.16 0% $177,482.21 $53,244.66 $0.00 $0.00 $0.00 1173 N 71st St. 06-May-99 647.9 647.3 641.34 -6.56 0% $206,851.29 $62,330.06 $0.00 $0.00 $0.00 7121 W Chestnut St. 27-Oct-99 649.9 648.6 641.34 -8.56 0% $190,053.87 $57,016.16 $0.00 $0.00 $0.00 1FFE, BFE and DDF Source: WEMA-BCA Analysis-January 1998 2
*All values have been adjusted for inflation Flood Elevation Source: National Weather Service Gauge Data
Evaluating Losses Avoided Through Acquisition Projects
Page 18
Table 3.2.11 Loss Estimation Calculations For July 4, 2004 (640.66 ft)
Property Address Date of Acquisition
1FFE 1BFE Flood Elevation
Flood Depth
1DDF Building Value
Contents Value
Building Damage
Contents Damage
Losses Avoided
6817 River Parkway 19-Mar-98 644.6 644.1 640.66 -3.94 0% $150,540.55 $45,196.93 $0.00 $0.00 $0.00 6833 River Parkway 28-Jan-99 643.5 644.3 640.66 -2.84 0% $162,245.40 $38,243.56 $0.00 $0.00 $0.00 1168 N 72nd St. 02-Feb-99 649.2 648.2 640.66 -8.54 0% $106,154.85 $31,869.63 $0.00 $0.00 $0.00 7021 W Chestnut St. 05-Mar-99 639.3 646 640.66 1.36 38% $107,197.85 $32,159.36 $40,735.18 $12,220.56 $52,955.74 7013 W Chestnut St. 09-Mar-99 647.3 645.7 640.66 -6.64 0% $81,586.26 $24,475.88 $0.00 $0.00 $0.00 1195 N 71st St. 19-Mar-99 649 647.5 640.66 -8.34 0% $101,982.82 $50,991.41 $0.00 $0.00 $0.00 1147 N 68th St. 19-Mar-99 644.5 644 640.66 -3.84 0% $119,829.82 $35,925.77 $0.00 $0.00 $0.00 1183 N 71st St. 19-Mar-99 648.4 647.4 640.66 -7.74 0% $193,767.36 $58,130.21 $0.00 $0.00 $0.00 7005 W Chestnut St. 19-Mar-99 646.8 645 640.66 -6.14 0% $81,586.26 $24,336.81 $0.00 $0.00 $0.00 1177 N 71st St. 19-Mar-99 646.8 647.3 640.66 -6.14 0% $119,134.48 $35,925.77 $0.00 $0.00 $0.00 6825 River Parkway 19-Mar-99 644.5 644.2 640.66 -3.84 0% $207,674.11 $62,580.37 $0.00 $0.00 $0.00 7033 W Chestnut St. 19-Mar-99 647.8 646.6 640.66 -7.14 0% $145,325.52 $43,597.66 $0.00 $0.00 $0.00
1176 N 72nd St. 19-Mar-99 650.3 648.5 640.66 -9.64 0% $166,185.64 $49,855.69 $0.00 $0.00 $0.00 7029 W Chestnut St. 06-May-99 647.5 646.4 640.66 -6.84 0% $107,081.96 $32,124.59 $0.00 $0.00 $0.00 7009 W Chestnut St. 06-May-99 646.9 645.5 640.66 -6.24 0% $66,288.83 $19,701.23 $0.00 $0.00 $0.00 7025 W Chestnut St. 06-May-99 646.6 646.2 640.66 -5.94 0% $200,257.18 $60,077.15 $0.00 $0.00 $0.00 7117 W Chestnut St. 06-May-99 649.4 648.2 640.66 -8.74 0% $168,735.21 $50,620.56 $0.00 $0.00 $0.00 7127 W Chestnut St. 06-May-99 650.6 648.8 640.66 -9.94 0% $138,951.60 $41,685.48 $0.00 $0.00 $0.00 7113 W Chestnut St. 06-May-99 649.6 648.1 640.66 -8.94 0% $117,512.02 $35,253.61 $0.00 $0.00 $0.00 7037 W Chestnut St. 06-May-99 647.3 646.8 640.66 -6.64 0% $175,225.03 $52,567.51 $0.00 $0.00 $0.00 7109 W Chestnut St. 06-May-99 649.5 647.9 640.66 -8.84 0% $194,694.48 $58,408.34 $0.00 $0.00 $0.00 1173 N 71st St. 06-May-99 647.9 647.3 640.66 -7.24 0% $226,911.78 $68,374.85 $0.00 $0.00 $0.00 7121 W Chestnut St. 27-Oct-99 649.9 648.6 640.66 -9.24 0% $208,485.34 $62,545.60 $0.00 $0.00 $0.00 1FFE, BFE and DDF Source: WEM-BCA Analysis-January 1998 2
*All values have been adjusted for inflation Flood Elevation Source: National Weather Service Gauge Data
Evaluating Losses Avoided Through Acquisition Projects
Page 19
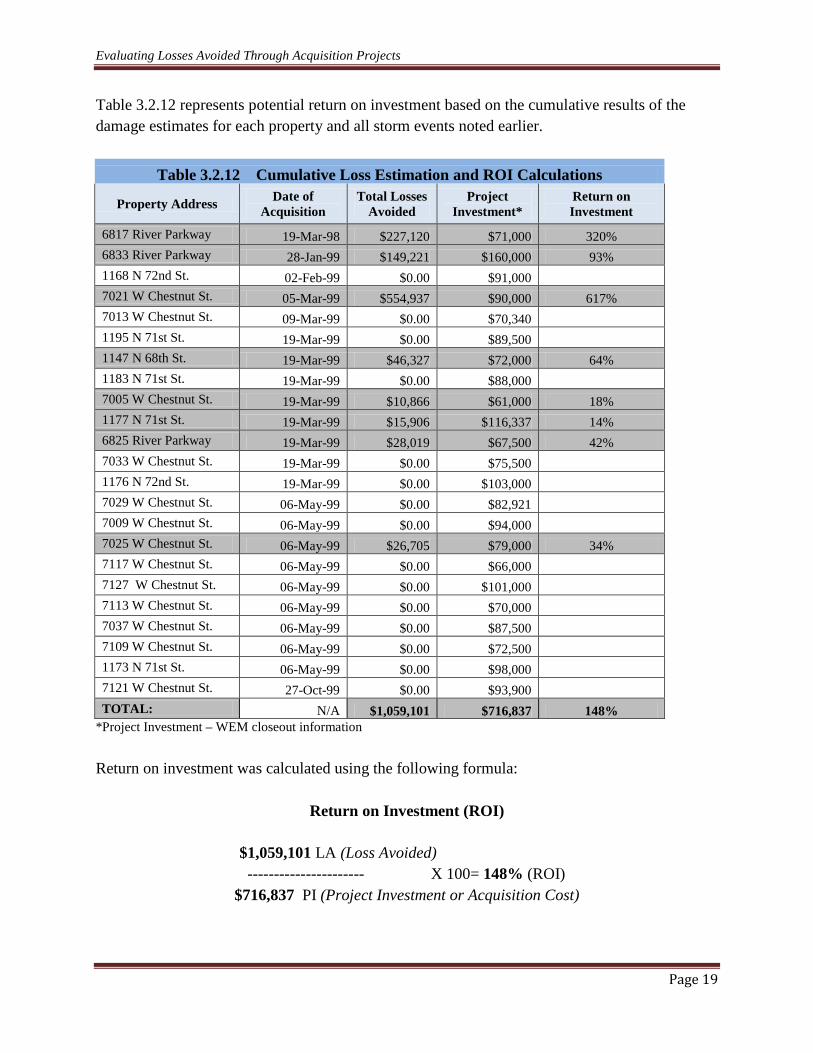
Table 3.2.12 represents potential return on investment based on the cumulative results of the damage estimates for each property and all storm events noted earlier.
Table 3.2.12 Cumulative Loss Estimation and ROI Calculations
Property Address Date of Acquisition
Total Losses Avoided
Project Investment*
Return on Investment
6817 River Parkway 19-Mar-98 $227,120 $71,000 320% 6833 River Parkway 28-Jan-99 $149,221 $160,000 93% 1168 N 72nd St. 02-Feb-99 $0.00 $91,000
7021 W Chestnut St. 05-Mar-99 $554,937 $90,000 617% 7013 W Chestnut St. 09-Mar-99 $0.00 $70,340
1195 N 71st St. 19-Mar-99 $0.00 $89,500 1147 N 68th St. 19-Mar-99 $46,327 $72,000 64%
1183 N 71st St. 19-Mar-99 $0.00 $88,000 7005 W Chestnut St. 19-Mar-99 $10,866 $61,000 18%
1177 N 71st St. 19-Mar-99 $15,906 $116,337 14% 6825 River Parkway 19-Mar-99 $28,019 $67,500 42% 7033 W Chestnut St. 19-Mar-99 $0.00 $75,500
1176 N 72nd St. 19-Mar-99 $0.00 $103,000 7029 W Chestnut St. 06-May-99 $0.00 $82,921 7009 W Chestnut St. 06-May-99 $0.00 $94,000 7025 W Chestnut St. 06-May-99 $26,705 $79,000 34%
7117 W Chestnut St. 06-May-99 $0.00 $66,000 7127 W Chestnut St. 06-May-99 $0.00 $101,000 7113 W Chestnut St. 06-May-99 $0.00 $70,000 7037 W Chestnut St. 06-May-99 $0.00 $87,500 7109 W Chestnut St. 06-May-99 $0.00 $72,500 1173 N 71st St. 06-May-99 $0.00 $98,000 7121 W Chestnut St. 27-Oct-99 $0.00 $93,900 TOTAL: N/A $1,059,101 $716,837 148%
*Project Investment – WEM closeout information
Return on investment was calculated using the following formula:
Return on Investment (ROI) $1,059,101 LA (Loss Avoided)
---------------------- X 100= 148% (ROI) $716,837 PI (Project Investment or Acquisition Cost)

Evaluating Losses Avoided Through Acquisition Projects
Page 20
Table 3.2.13, represents potential losses avoided and return on investment (ROI) for a 100 year flood event modeled using HAZUS-MH MR4.
Table 3.2.13 Losses Avoided - 100 Year HAZUS Model Flood Event
Property Address
Date of Acquisition
Building Value
HAZUS Building
Damage %
Contents Value
HAZUS Contents
Damage %
HAZUS Building Damage
HAZUS Content Damage
Losses Avoided
Project
Investment
Return on Investment
6817 River Parkway 19-Mar-98 $173,415 28.97% $52,065 28.95% $50,238 $15,073 $65,311 $71,000 92% 6833 River Parkway 28-Jan-99 $186,898 26.29% $44,055 35.43% $49,136 $15,609 $64,744 $160,000 40% 1168 N 72nd St. 02-Feb-99 $122,285 26.19% $36,712 25.26% $32,026 $9,273 $41,300 $91,000 45% 7021 W Chestnut St. 05-Mar-99 $123,486 37.90% $37,046 32.88% $46,801 $12,181 $58,982 $90,000 66% 7013 W Chestnut St. 09-Mar-99 $93,983 34.37% $28,195 28.46% $32,302 $8,024 $40,326 $70,340 57% 1195 N 71st St. 19-Mar-99 $117,479 24.51% $58,739 22.92% $28,794 $13,463 $42,257 $89,500 47% 1147 N 68th St. 19-Mar-99 $138,038 39.95% $41,385 37.95% $55,146 $15,705 $70,852 $72,000 98% 1183 N 71st St. 19-Mar-99 $223,210 28.69% $66,963 28.58% $64,039 $19,138 $83,177 $88,000 95% 7005 W Chestnut St. 19-Mar-99 $93,983 34.37% $28,05 28.46% $32,302 $7,979 $40,281 $61,000 66% 1177 N 71st St. 19-Mar-99 $137,237 29.54% $41,385 29.43% $40,540 $12,179 $52,719 $116,337 45% 6825 River Parkway 19-Mar-99 $239,230 31.02% $72,089 30.61% $74,209 $22,067 $96,276 $67,500 143% 7033 W Chestnut St. 19-Mar-99 $167,407 33.88% $50,222 32.90% $56,718 $16,523 $73,241 $75,500 97% 1176 N 72nd St. 19-Mar-99 $ 191,437 26.19% $ 57,431 25.26% $50,137 $14,507 $64,645 $103,000 63% 7029 W Chestnut St. 06-May-99 $123,353 37.90% $37,006 32.88% $46,751 $12,168 $58,918 $82,921 71% 7009 W Chestnut St. 06-May-99 $76,361 34.37% $22,695 28.46% $26,245 $6,459 $32,704 $94,000 35% 7025 W Chestnut St. 06-May-99 $230,686 33.88% $69,206 32.90% $78,156 $22,769 $100,925 $79,000 128% 7117 W Chestnut St. 06-May-99 $194,374 26.25% $58,312 25.33% $51,023 $14,770 $65,794 $66,000 100% 7127 W Chestnut St. 06-May-99 $160,065 24.26% $48,020 22.56% $38,832 $10,833 $49,665 $101,000 49% 7113 W Chestnut St. 06-May-99 $135,368 26.25% $40,610 25.33% $35,534 $10,287 $45,821 $70,000 65% 7037 W Chestnut St. 06-May-99 $201,850 32.53% $60,555 31.82% $65,662 $19,269 $84,930 $87,500 97% 7109 W Chestnut St. 06-May-99 $224,278 26.25% $67,283 25.33% $58,873 $17,043 $75,916 $72,500 105% 1173 N 71st St. 06-May-99 $261,391 26.31% $78,764 25.42% $68,772 $20,022 $88,794 $98,000 91% 7121 W Chestnut St. 27-Oct-99 $240,164 26.25% $72,049 25.33% $63,043 $18,250 $81,293 $93,900 87% TOTALS:
$1,478,870 $1,999,998 74%
Sources: WEM Property Information Sheets and FEMA – HAZUS-MH-MR4 (All values have been adjusted for inflation.)

Evaluating Losses Avoided Through Acquisition Projects
Page 21
Table 3.2.13 shows a ROI of 74%. The HAZUS model assumes damage from one 100-year flood event, not multiple events as is the case with the actual storm event data. The HAZUS model also assumes that all properties suffered damage during a 100 year flood event. Data Considerations: Some of the data shortfalls that were encountered were a lack of information on the actual property such as if there was a basement or slab foundation. Accurate property valuation for the Project Investment was difficult to arrive at as some properties did not have any valuation included as in the case of Repetitive Loss Properties where no value is needed for it to be included in an acquisition. Also, factors such as insurance money already paid on a property for damages will be subtracted from the assessed market value and will skew the property valuation that is noted for the property. Conclusion: In reviewing the HAZUS data for a 100 year flood event, the resulting potential for losses avoided is encouraging. While the analyses by actual event results have not indicated a dramatic ROI for all properties, there have not been additional flood events of the magnitude that are possible in this area. However, when viewed in the context of when the next event does happen, there is no question that there will be significant losses avoided as a result of this acquisition project. And, as time goes by, the return on investment will only continue to grow with each future damage event.
Evaluating Losses Avoided Through Acquisition Projects
Page 22
3.3 Project #2: Milwaukee, WI – (1st
On June 21, 1997, several communities in Milwaukee County experienced torrential rainfall of as much as 10 inches during a 30 hour period. This was considered in excess of the “100 year rainfall” and overwhelmed storm water systems causing flash flooding across much of the county. In the Lincoln Creek neighborhood, Lincoln Creek crested at 20.09 feet at 9 am CST on the 21
Lincoln Creek Project)
st
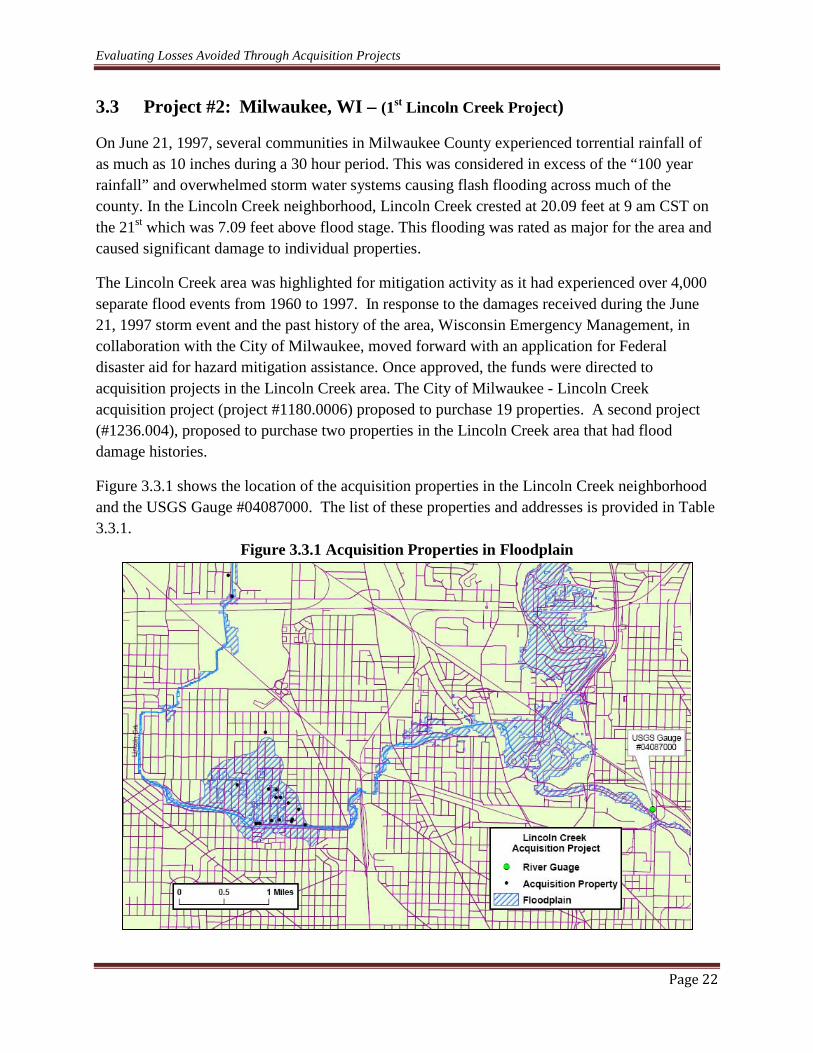
The Lincoln Creek area was highlighted for mitigation activity as it had experienced over 4,000 separate flood events from 1960 to 1997. In response to the damages received during the June 21, 1997 storm event and the past history of the area, Wisconsin Emergency Management, in collaboration with the City of Milwaukee, moved forward with an application for Federal disaster aid for hazard mitigation assistance. Once approved, the funds were directed to acquisition projects in the Lincoln Creek area. The City of Milwaukee - Lincoln Creek acquisition project (project #1180.0006) proposed to purchase 19 properties. A second project (#1236.004), proposed to purchase two properties in the Lincoln Creek area that had flood damage histories.
which was 7.09 feet above flood stage. This flooding was rated as major for the area and caused significant damage to individual properties.
Figure 3.3.1 shows the location of the acquisition properties in the Lincoln Creek neighborhood and the USGS Gauge #04087000. The list of these properties and addresses is provided in Table 3.3.1.
Figure 3.3.1 Acquisition Properties in Floodplain
Evaluating Losses Avoided Through Acquisition Projects
Page 23
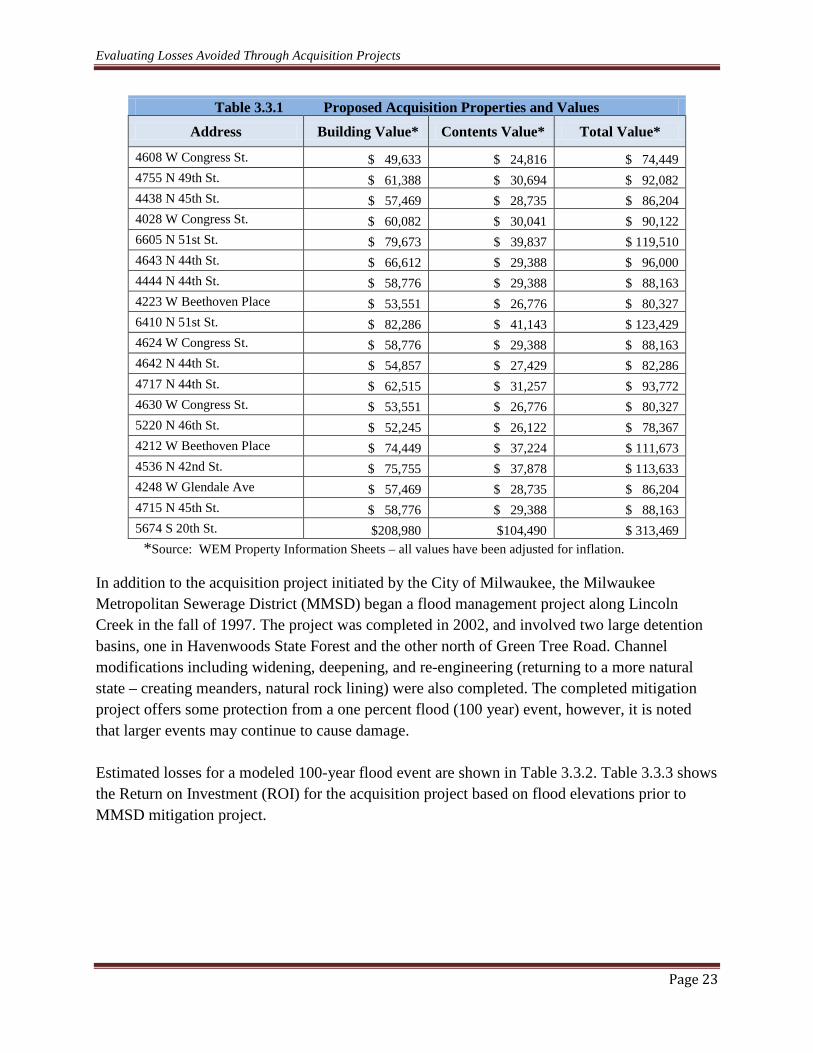
Table 3.3.1 Proposed Acquisition Properties and Values Address Building Value* Contents Value* Total Value*
4608 W Congress St. $ 49,633 $ 24,816 $ 74,449 4755 N 49th St. $ 61,388 $ 30,694 $ 92,082 4438 N 45th St. $ 57,469 $ 28,735 $ 86,204 4028 W Congress St. $ 60,082 $ 30,041 $ 90,122 6605 N 51st St. $ 79,673 $ 39,837 $ 119,510 4643 N 44th St. $ 66,612 $ 29,388 $ 96,000 4444 N 44th St. $ 58,776 $ 29,388 $ 88,163 4223 W Beethoven Place $ 53,551 $ 26,776 $ 80,327 6410 N 51st St. $ 82,286 $ 41,143 $ 123,429 4624 W Congress St. $ 58,776 $ 29,388 $ 88,163 4642 N 44th St. $ 54,857 $ 27,429 $ 82,286 4717 N 44th St. $ 62,515 $ 31,257 $ 93,772 4630 W Congress St. $ 53,551 $ 26,776 $ 80,327 5220 N 46th St. $ 52,245 $ 26,122 $ 78,367 4212 W Beethoven Place $ 74,449 $ 37,224 $ 111,673 4536 N 42nd St. $ 75,755 $ 37,878 $ 113,633 4248 W Glendale Ave $ 57,469 $ 28,735 $ 86,204 4715 N 45th St. $ 58,776 $ 29,388 $ 88,163 5674 S 20th St. $208,980 $104,490 $ 313,469
*Source: WEM Property Information Sheets – all values have been adjusted for inflation.
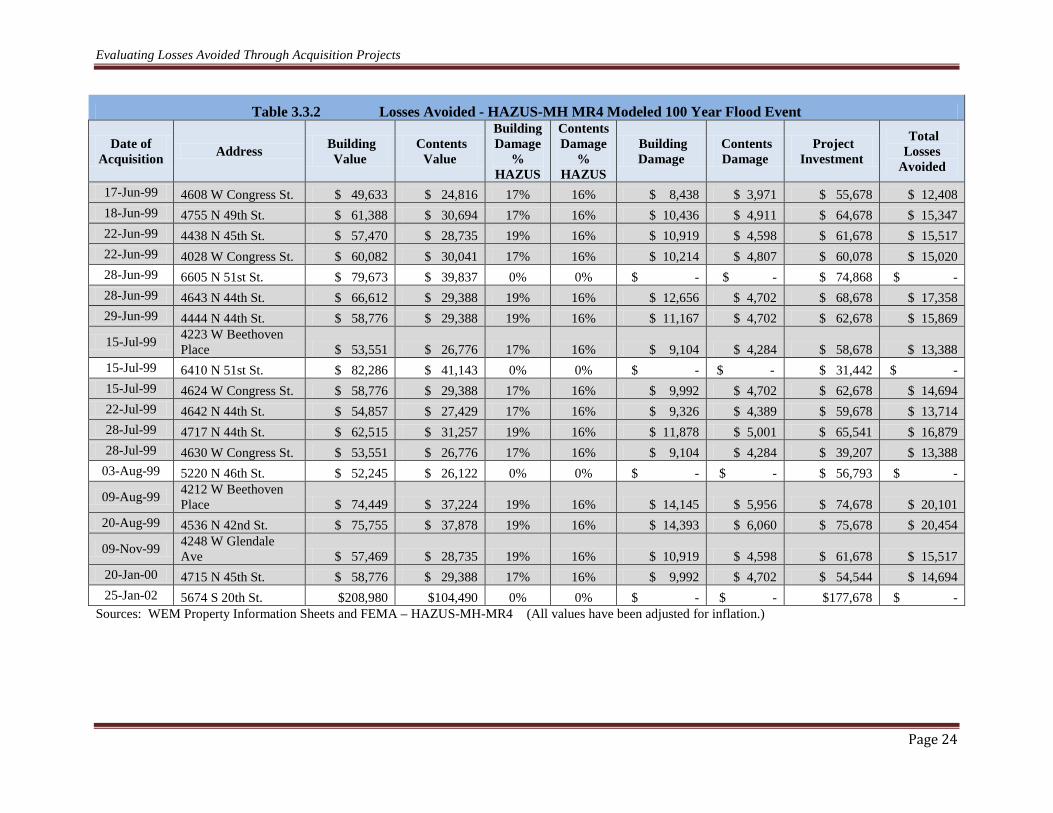
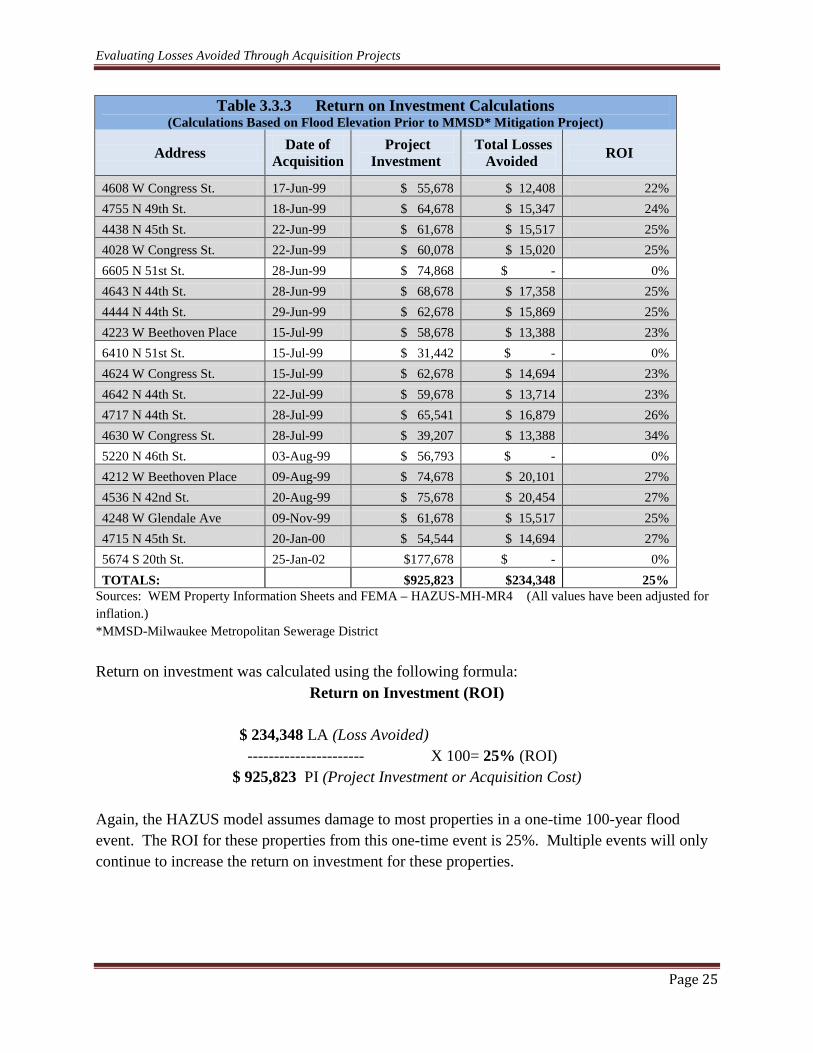
In addition to the acquisition project initiated by the City of Milwaukee, the Milwaukee Metropolitan Sewerage District (MMSD) began a flood management project along Lincoln Creek in the fall of 1997. The project was completed in 2002, and involved two large detention basins, one in Havenwoods State Forest and the other north of Green Tree Road. Channel modifications including widening, deepening, and re-engineering (returning to a more natural state – creating meanders, natural rock lining) were also completed. The completed mitigation project offers some protection from a one percent flood (100 year) event, however, it is noted that larger events may continue to cause damage. Estimated losses for a modeled 100-year flood event are shown in Table 3.3.2. Table 3.3.3 shows the Return on Investment (ROI) for the acquisition project based on flood elevations prior to MMSD mitigation project.
Evaluating Losses Avoided Through Acquisition Projects
Page 24
Table 3.3.2 Losses Avoided - HAZUS-MH MR4 Modeled 100 Year Flood Event
Date of Acquisition Address Building
Value Contents
Value
Building Damage
% HAZUS
Contents Damage
% HAZUS
Building Damage
Contents Damage
Project Investment
Total Losses
Avoided
17-Jun-99 4608 W Congress St. $ 49,633 $ 24,816 17% 16% $ 8,438 $ 3,971 $ 55,678 $ 12,408 18-Jun-99 4755 N 49th St. $ 61,388 $ 30,694 17% 16% $ 10,436 $ 4,911 $ 64,678 $ 15,347 22-Jun-99 4438 N 45th St. $ 57,470 $ 28,735 19% 16% $ 10,919 $ 4,598 $ 61,678 $ 15,517 22-Jun-99 4028 W Congress St. $ 60,082 $ 30,041 17% 16% $ 10,214 $ 4,807 $ 60,078 $ 15,020 28-Jun-99 6605 N 51st St. $ 79,673 $ 39,837 0% 0% $ - $ - $ 74,868 $ - 28-Jun-99 4643 N 44th St. $ 66,612 $ 29,388 19% 16% $ 12,656 $ 4,702 $ 68,678 $ 17,358 29-Jun-99 4444 N 44th St. $ 58,776 $ 29,388 19% 16% $ 11,167 $ 4,702 $ 62,678 $ 15,869
15-Jul-99 4223 W Beethoven Place $ 53,551 $ 26,776 17% 16% $ 9,104 $ 4,284 $ 58,678 $ 13,388
15-Jul-99 6410 N 51st St. $ 82,286 $ 41,143 0% 0% $ - $ - $ 31,442 $ - 15-Jul-99 4624 W Congress St. $ 58,776 $ 29,388 17% 16% $ 9,992 $ 4,702 $ 62,678 $ 14,694 22-Jul-99 4642 N 44th St. $ 54,857 $ 27,429 17% 16% $ 9,326 $ 4,389 $ 59,678 $ 13,714 28-Jul-99 4717 N 44th St. $ 62,515 $ 31,257 19% 16% $ 11,878 $ 5,001 $ 65,541 $ 16,879 28-Jul-99 4630 W Congress St. $ 53,551 $ 26,776 17% 16% $ 9,104 $ 4,284 $ 39,207 $ 13,388
03-Aug-99 5220 N 46th St. $ 52,245 $ 26,122 0% 0% $ - $ - $ 56,793 $ -
09-Aug-99 4212 W Beethoven Place $ 74,449 $ 37,224 19% 16% $ 14,145 $ 5,956 $ 74,678 $ 20,101
20-Aug-99 4536 N 42nd St. $ 75,755 $ 37,878 19% 16% $ 14,393 $ 6,060 $ 75,678 $ 20,454
09-Nov-99 4248 W Glendale Ave $ 57,469 $ 28,735 19% 16% $ 10,919 $ 4,598 $ 61,678 $ 15,517
20-Jan-00 4715 N 45th St. $ 58,776 $ 29,388 17% 16% $ 9,992 $ 4,702 $ 54,544 $ 14,694 25-Jan-02 5674 S 20th St. $208,980 $104,490 0% 0% $ - $ - $177,678 $ -
Sources: WEM Property Information Sheets and FEMA – HAZUS-MH-MR4 (All values have been adjusted for inflation.)
Evaluating Losses Avoided Through Acquisition Projects
Page 25
Table 3.3.3 Return on Investment Calculations (Calculations Based on Flood Elevation Prior to MMSD* Mitigation Project)
Address Date of Acquisition
Project Investment
Total Losses Avoided ROI
4608 W Congress St. 17-Jun-99 $ 55,678 $ 12,408 22% 4755 N 49th St. 18-Jun-99 $ 64,678 $ 15,347 24% 4438 N 45th St. 22-Jun-99 $ 61,678 $ 15,517 25% 4028 W Congress St. 22-Jun-99 $ 60,078 $ 15,020 25% 6605 N 51st St. 28-Jun-99 $ 74,868 $ - 0% 4643 N 44th St. 28-Jun-99 $ 68,678 $ 17,358 25% 4444 N 44th St. 29-Jun-99 $ 62,678 $ 15,869 25% 4223 W Beethoven Place 15-Jul-99 $ 58,678 $ 13,388 23% 6410 N 51st St. 15-Jul-99 $ 31,442 $ - 0% 4624 W Congress St. 15-Jul-99 $ 62,678 $ 14,694 23% 4642 N 44th St. 22-Jul-99 $ 59,678 $ 13,714 23% 4717 N 44th St. 28-Jul-99 $ 65,541 $ 16,879 26% 4630 W Congress St. 28-Jul-99 $ 39,207 $ 13,388 34% 5220 N 46th St. 03-Aug-99 $ 56,793 $ - 0% 4212 W Beethoven Place 09-Aug-99 $ 74,678 $ 20,101 27% 4536 N 42nd St. 20-Aug-99 $ 75,678 $ 20,454 27% 4248 W Glendale Ave 09-Nov-99 $ 61,678 $ 15,517 25% 4715 N 45th St. 20-Jan-00 $ 54,544 $ 14,694 27% 5674 S 20th St. 25-Jan-02 $177,678 $ - 0% TOTALS:
$925,823 $234,348 25%
Sources: WEM Property Information Sheets and FEMA – HAZUS-MH-MR4 (All values have been adjusted for inflation.) *MMSD-Milwaukee Metropolitan Sewerage District Return on investment was calculated using the following formula:
Return on Investment (ROI) $ 234,348 LA (Loss Avoided)
---------------------- X 100= 25% (ROI) $ 925,823 PI (Project Investment or Acquisition Cost)
Again, the HAZUS model assumes damage to most properties in a one-time 100-year flood event. The ROI for these properties from this one-time event is 25%. Multiple events will only continue to increase the return on investment for these properties.
Evaluating Losses Avoided Through Acquisition Projects
Page 26
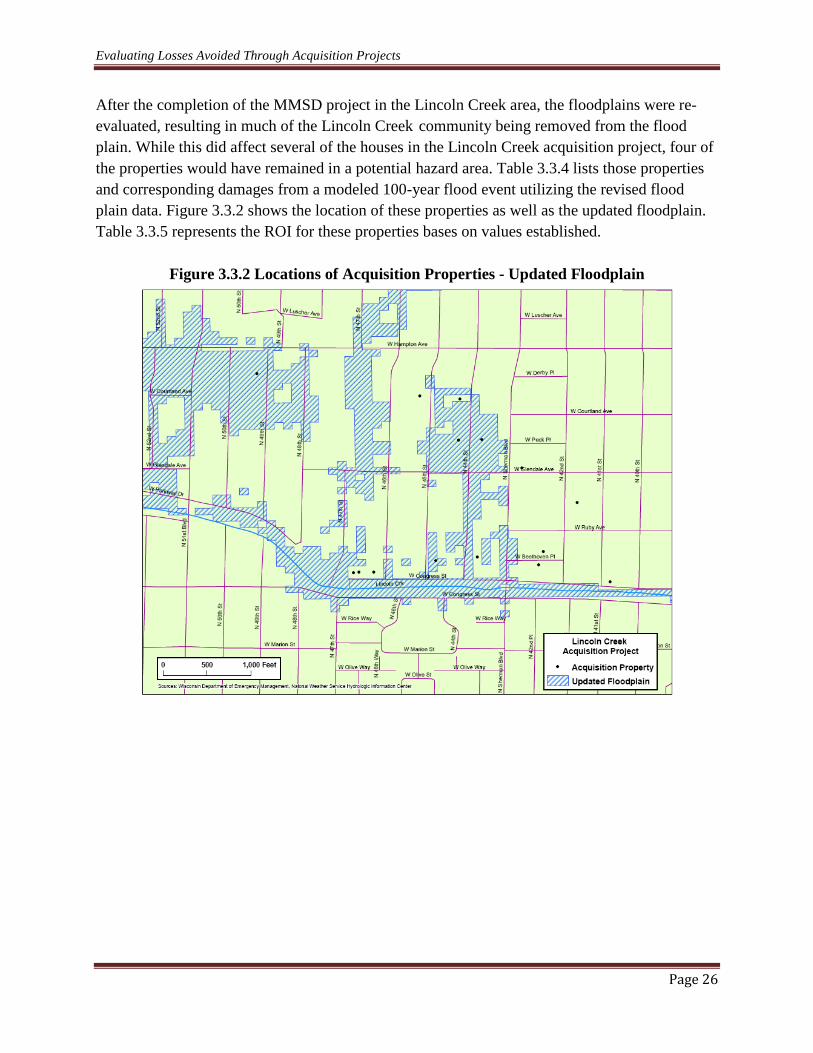
After the completion of the MMSD project in the Lincoln Creek area, the floodplains were re-evaluated, resulting in much of the Lincoln Creek community being removed from the flood plain. While this did affect several of the houses in the Lincoln Creek acquisition project, four of the properties would have remained in a potential hazard area. Table 3.3.4 lists those properties and corresponding damages from a modeled 100-year flood event utilizing the revised flood plain data. Figure 3.3.2 shows the location of these properties as well as the updated floodplain. Table 3.3.5 represents the ROI for these properties bases on values established.
Figure 3.3.2 Locations of Acquisition Properties - Updated Floodplain

Evaluating Losses Avoided Through Acquisition Projects
Page 27
Sources: WEM Property Information Sheets, FEMA-HAZUS-MH-MR4 (All values have been adjusted for inflation) *MMSD-Milwaukee Metropolitan Sewerage District
Table 3.3.5 Loss Estimation and Return on Investment Calculations (Based on Flood Elevation After MMSD* Mitigation Project)
Address Date of Acquisition
Project Investment
Total Losses Avoided ROI
4438 N 45th St. 22-Jun-99 $61,678 $ 19,557 31.71% 4755 N 49th St. 18-Jun-99 $64,678 $ 19,899 30.77% 4643 N 44th St. 28-Jun-99 $68,678 $ 19,719 28.71% 4642 N 44th St. 22-Jul-99 $59,678 $ 17,637 29.55%
Sources: WEM Property Information Sheets, FEMA-HAZUS-MH-MR4 (All values have been adjusted for inflation)
*MMSD-Milwaukee Metropolitan Sewerage District
Table 3.3.4 Losses Avoided - HAZUS-MH MR4 Modeled 100 Year Flood Event
(After MMSD* Mitigation Project Completion)
Date of Acquisition Address Building
Value Contents
Value
Building Damage
% HAZUS
Contents Damage %
HAZUS
Building Damage
Contents Damage
Project Investment
Total Losses Avoided
22-Jun-99 4438 N 45th St. $57,469 $28,735 23.37% 21.32% $ 13,431 $ 6,126 $61,678 $ 19,557 18-Jun-99 4755 N 49th St. $61,387 $30,694 22.26% 20.31% $ 13,665 $ 6,234 $64,678 $ 19,899 28-Jun-99 4643 N 44th St. $66,612 $29,388 21.41% 18.57% $ 14,262 $ 5,457 $68,678 $ 19,719 22-Jul-99 4642 N 44th St. $54,857 $27,429 22.02% 20.26% $ 12,080 $ 5,557 $59,678 $ 17,637

Evaluating Losses Avoided Through Acquisition Projects
Page 28
3.4 Project #3: Milwaukee, WI – (2nd
Table 3.4.1, contains the addresses of the acquisition project properties and the building and contents values used for the project analysis. The values were taken from the property information worksheets provided by Wisconsin Emergency Management and the City of Milwaukee and have been adjusted for inflation.
Lincoln Creek Project)
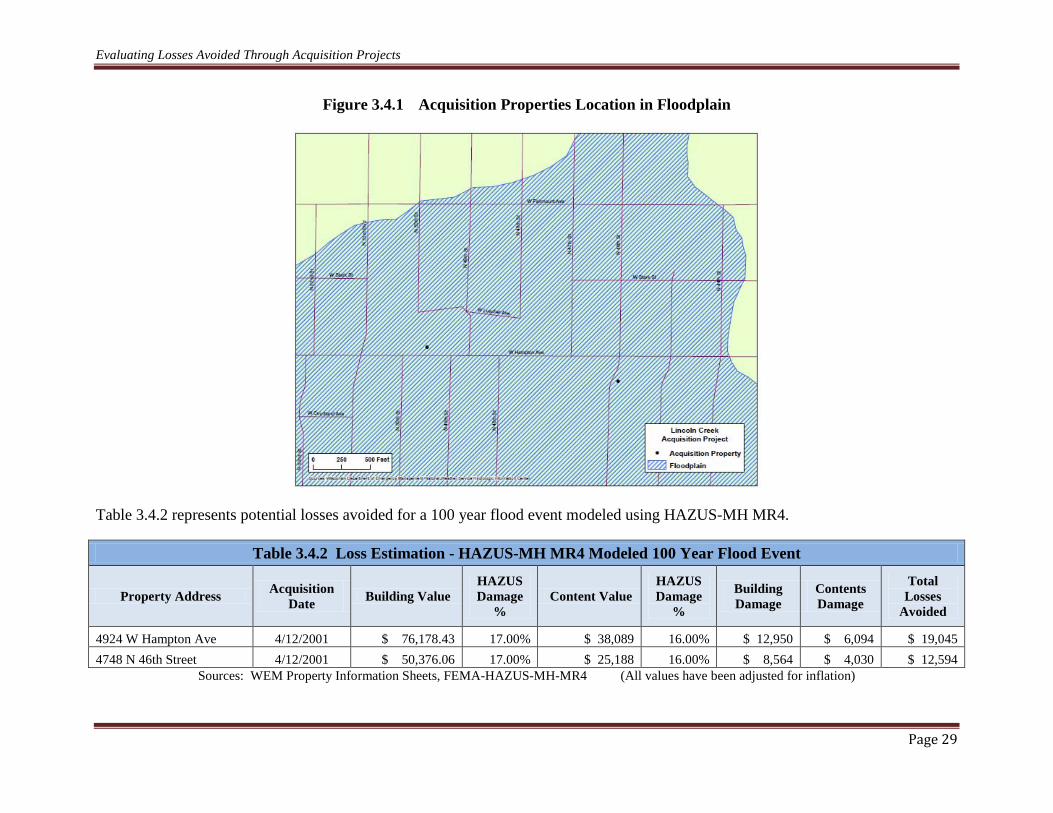
Figure 3.4.1 shows the location of acquisition properties in the Lincoln Creek area as well as the floodplain for the area. The floodplain used for this analysis is the pre 2008 floodplain.
Table 3.4.1 Acquisition Properties - Addresses and Values
Property Address Building Value
Content Value Total Value
4924 W Hampton Ave $ 76,178 $ 38,089 $ 114,268 4748 N 46th Street $ 50,376 $ 25,188 $ 75,564
Source: WEM Property Information Sheets - all values adjusted for inflation.
Evaluating Losses Avoided Through Acquisition Projects
Page 29
Figure 3.4.1 Acquisition Properties Location in Floodplain
Table 3.4.2 represents potential losses avoided for a 100 year flood event modeled using HAZUS-MH MR4.
Table 3.4.2 Loss Estimation - HAZUS-MH MR4 Modeled 100 Year Flood Event
Property Address Acquisition Date Building Value
HAZUS Damage
% Content Value
HAZUS Damage
%
Building Damage
Contents Damage
Total Losses
Avoided
4924 W Hampton Ave 4/12/2001 $ 76,178.43 17.00% $ 38,089 16.00% $ 12,950 $ 6,094 $ 19,045 4748 N 46th Street 4/12/2001 $ 50,376.06 17.00% $ 25,188 16.00% $ 8,564 $ 4,030 $ 12,594
Sources: WEM Property Information Sheets, FEMA-HAZUS-MH-MR4 (All values have been adjusted for inflation)
Evaluating Losses Avoided Through Acquisition Projects
Page 30
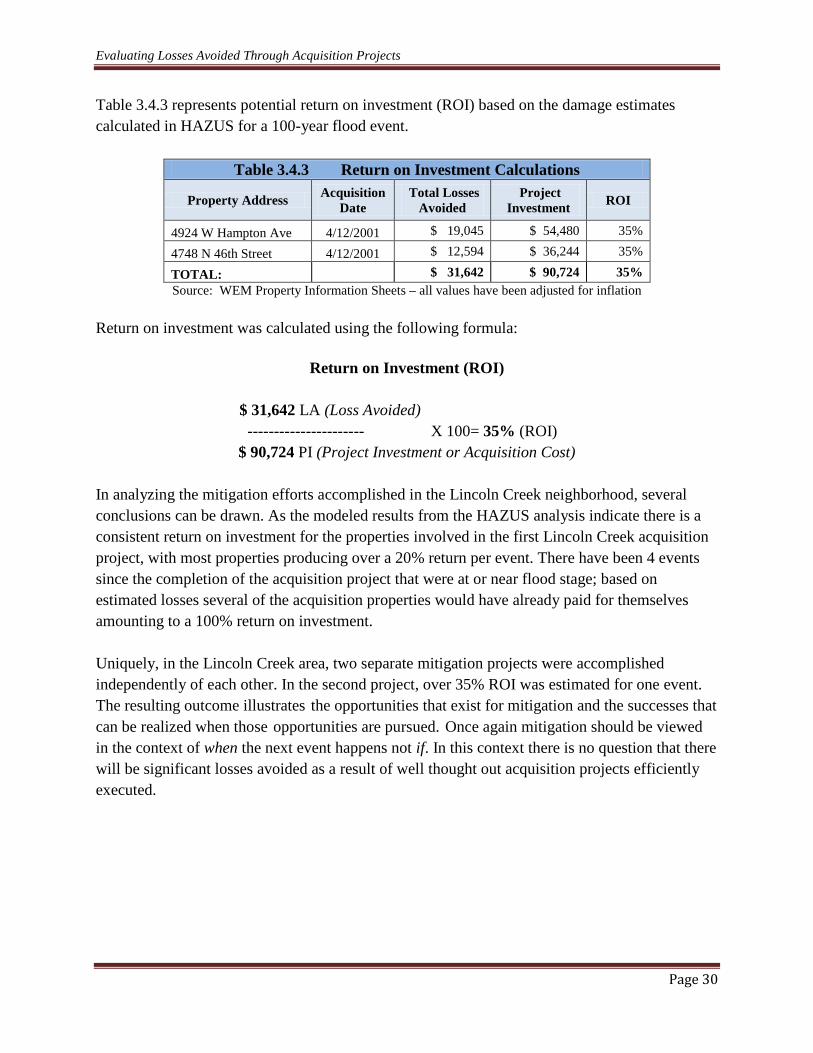
Table 3.4.3 represents potential return on investment (ROI) based on the damage estimates calculated in HAZUS for a 100-year flood event.
Table 3.4.3 Return on Investment Calculations
Property Address Acquisition Date
Total Losses Avoided
Project Investment ROI
4924 W Hampton Ave 4/12/2001 $ 19,045 $ 54,480 35%
4748 N 46th Street 4/12/2001 $ 12,594 $ 36,244 35%
TOTAL:
$ 31,642 $ 90,724 35% Source: WEM Property Information Sheets – all values have been adjusted for inflation
Return on investment was calculated using the following formula:
Return on Investment (ROI) $ 31,642 LA (Loss Avoided)
---------------------- X 100= 35% (ROI) $ 90,724 PI (Project Investment or Acquisition Cost)
In analyzing the mitigation efforts accomplished in the Lincoln Creek neighborhood, several conclusions can be drawn. As the modeled results from the HAZUS analysis indicate there is a consistent return on investment for the properties involved in the first Lincoln Creek acquisition project, with most properties producing over a 20% return per event. There have been 4 events since the completion of the acquisition project that were at or near flood stage; based on estimated losses several of the acquisition properties would have already paid for themselves amounting to a 100% return on investment. Uniquely, in the Lincoln Creek area, two separate mitigation projects were accomplished independently of each other. In the second project, over 35% ROI was estimated for one event. The resulting outcome illustrates the opportunities that exist for mitigation and the successes that can be realized when those opportunities are pursued. Once again mitigation should be viewed in the context of when the next event happens not if. In this context there is no question that there will be significant losses avoided as a result of well thought out acquisition projects efficiently executed.

Evaluating Losses Avoided Through Acquisition Projects
Page 31
3.5 Project #4: Village of Oak Creek (Oak Creek)
Keeping with the strategy developed and approved by the Wisconsin Interagency Disaster Recovery Group (IDRG), and in conjunction with Wisconsin Emergency Management and the Village of Oak Creek, an application was submitted to fund an acquisition project in the community of Oak Creek, WI. The proposed acquisition project involved one property that had a history of flood damages over a number of years and was identified by FEMA as a repetitive-loss property under the NFIP.
The application process cites flood damages in 1996, 1998, 1999, and twice in 2000. It is known that the property had flooded prior to 1996 but documentation is not available. After the flooding in May and July of 2000, it was determined the property was not habitable. The application and accompanying communication from Wisconsin Emergency Management further indicated that without acquisition, the property would continue to incur damages with flood insurance claims paid. Funds re-obligated from FEMA-1180-DR-WI were made available to accomplish the proposed acquisition.
Table 3.5.1 lists the property involved in the acquisition and the building and content value.
Table 3.5.1 Acquisition Properties - Addresses and Values
Property Address Building Value
Content Value Total Value
11040 S. Nicholson Rd $ 145,147 $72,574 $217,721 Source: WEM Property information sheets - all values have been adjusted for inflation
Evaluating Losses Avoided Through Acquisition Projects
Page 32
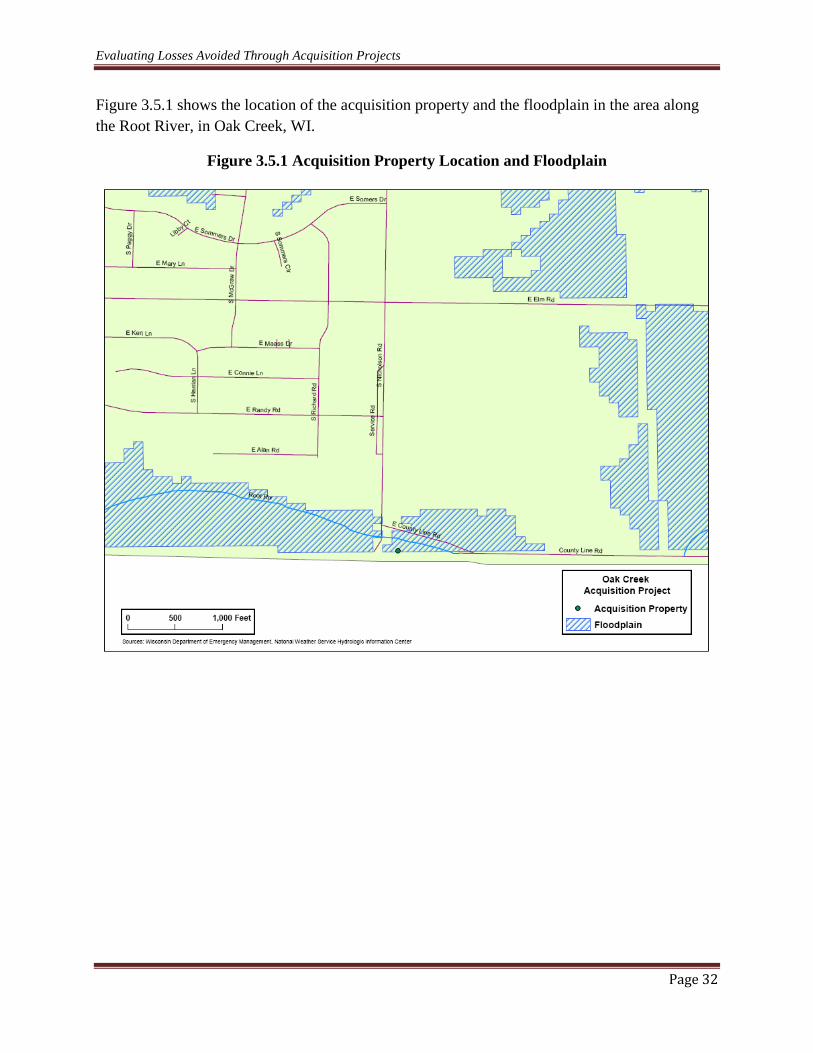
Figure 3.5.1 shows the location of the acquisition property and the floodplain in the area along the Root River, in Oak Creek, WI.
Figure 3.5.1 Acquisition Property Location and Floodplain
Evaluating Losses Avoided Through Acquisition Projects
Page 33
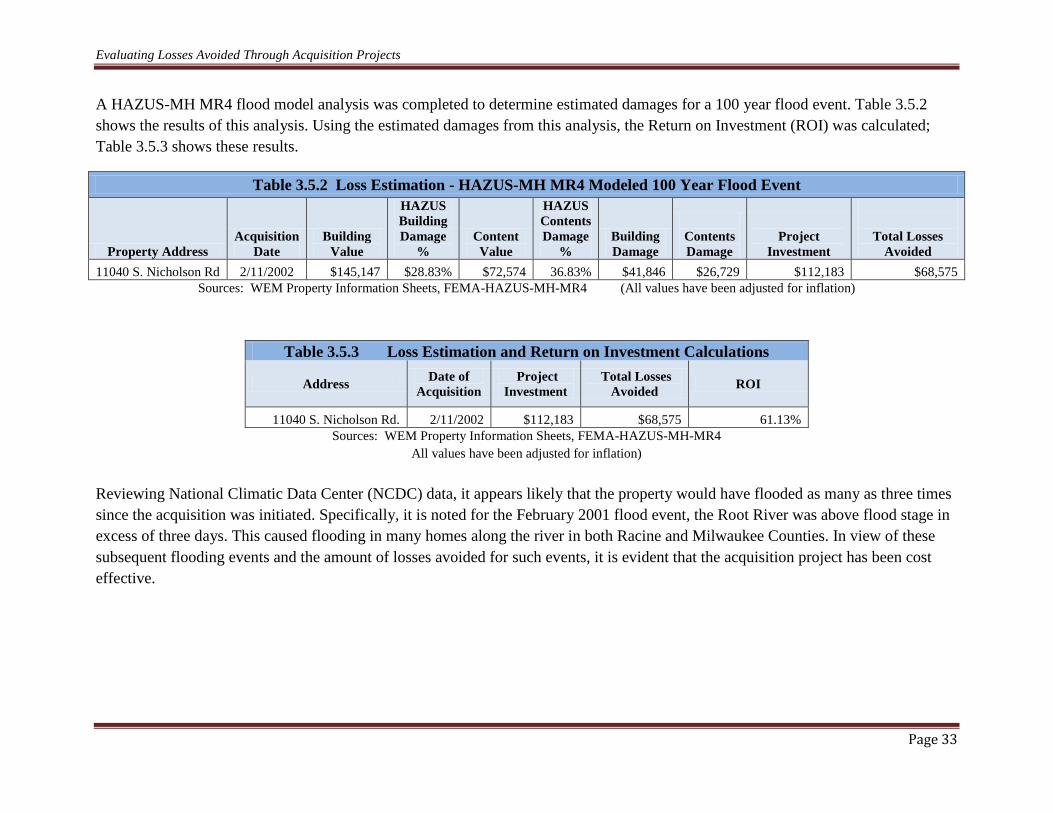
A HAZUS-MH MR4 flood model analysis was completed to determine estimated damages for a 100 year flood event. Table 3.5.2 shows the results of this analysis. Using the estimated damages from this analysis, the Return on Investment (ROI) was calculated; Table 3.5.3 shows these results.
Table 3.5.2 Loss Estimation - HAZUS-MH MR4 Modeled 100 Year Flood Event
Property Address Acquisition
Date Building
Value
HAZUS Building Damage
% Content Value
HAZUS Contents Damage
% Building Damage
Contents Damage
Project
Investment
Total Losses Avoided
11040 S. Nicholson Rd 2/11/2002 $145,147 $28.83% $72,574 36.83% $41,846 $26,729 $112,183 $68,575 Sources: WEM Property Information Sheets, FEMA-HAZUS-MH-MR4 (All values have been adjusted for inflation)
Table 3.5.3 Loss Estimation and Return on Investment Calculations
Address Date of Acquisition
Project Investment
Total Losses Avoided ROI
11040 S. Nicholson Rd. 2/11/2002 $112,183 $68,575 61.13% Sources: WEM Property Information Sheets, FEMA-HAZUS-MH-MR4
All values have been adjusted for inflation)
Reviewing National Climatic Data Center (NCDC) data, it appears likely that the property would have flooded as many as three times since the acquisition was initiated. Specifically, it is noted for the February 2001 flood event, the Root River was above flood stage in excess of three days. This caused flooding in many homes along the river in both Racine and Milwaukee Counties. In view of these subsequent flooding events and the amount of losses avoided for such events, it is evident that the acquisition project has been cost effective.
Evaluating Losses Avoided Through Acquisition Projects
Page 34
3.6 Project #5: Village of Brown Deer (South Branch)
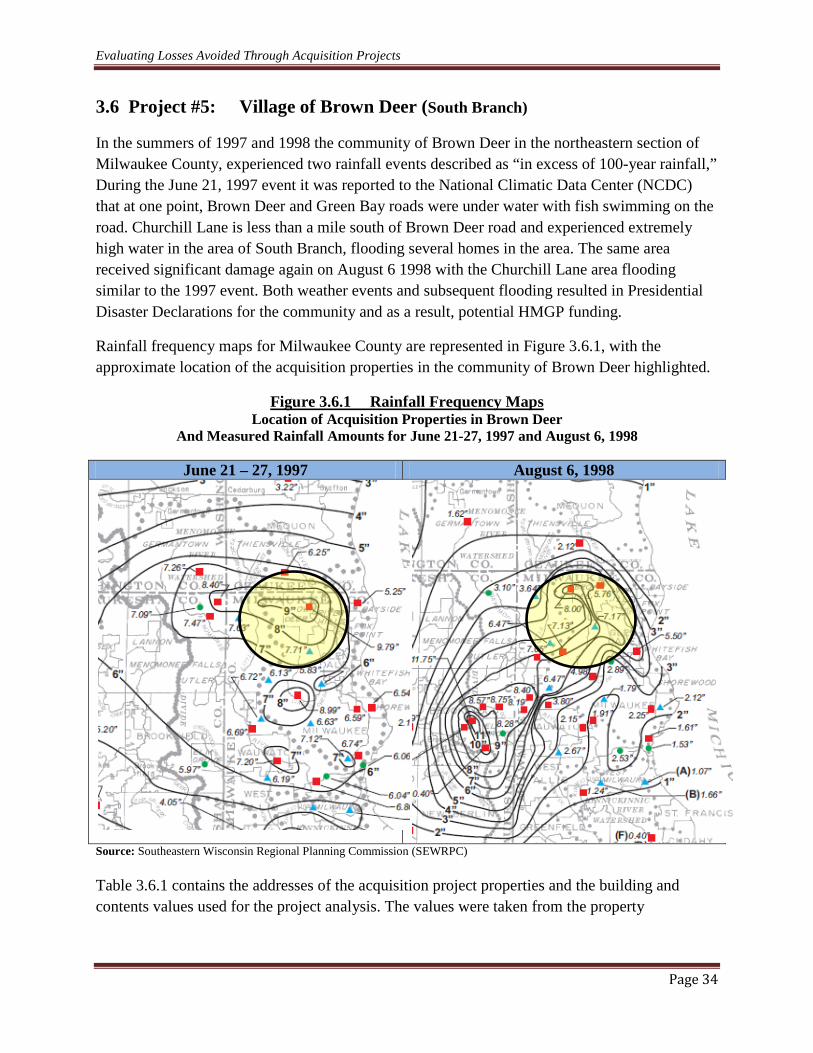
In the summers of 1997 and 1998 the community of Brown Deer in the northeastern section of Milwaukee County, experienced two rainfall events described as “in excess of 100-year rainfall,” During the June 21, 1997 event it was reported to the National Climatic Data Center (NCDC) that at one point, Brown Deer and Green Bay roads were under water with fish swimming on the road. Churchill Lane is less than a mile south of Brown Deer road and experienced extremely high water in the area of South Branch, flooding several homes in the area. The same area received significant damage again on August 6 1998 with the Churchill Lane area flooding similar to the 1997 event. Both weather events and subsequent flooding resulted in Presidential Disaster Declarations for the community and as a result, potential HMGP funding.
Rainfall frequency maps for Milwaukee County are represented in Figure 3.6.1, with the approximate location of the acquisition properties in the community of Brown Deer highlighted.
Location of Acquisition Properties in Brown Deer Figure 3.6.1 Rainfall Frequency Maps
And Measured Rainfall Amounts for June 21-27, 1997 and August 6, 1998
June 21 – 27, 1997 August 6, 1998
Source: Southeastern Wisconsin Regional Planning Commission (SEWRPC
)
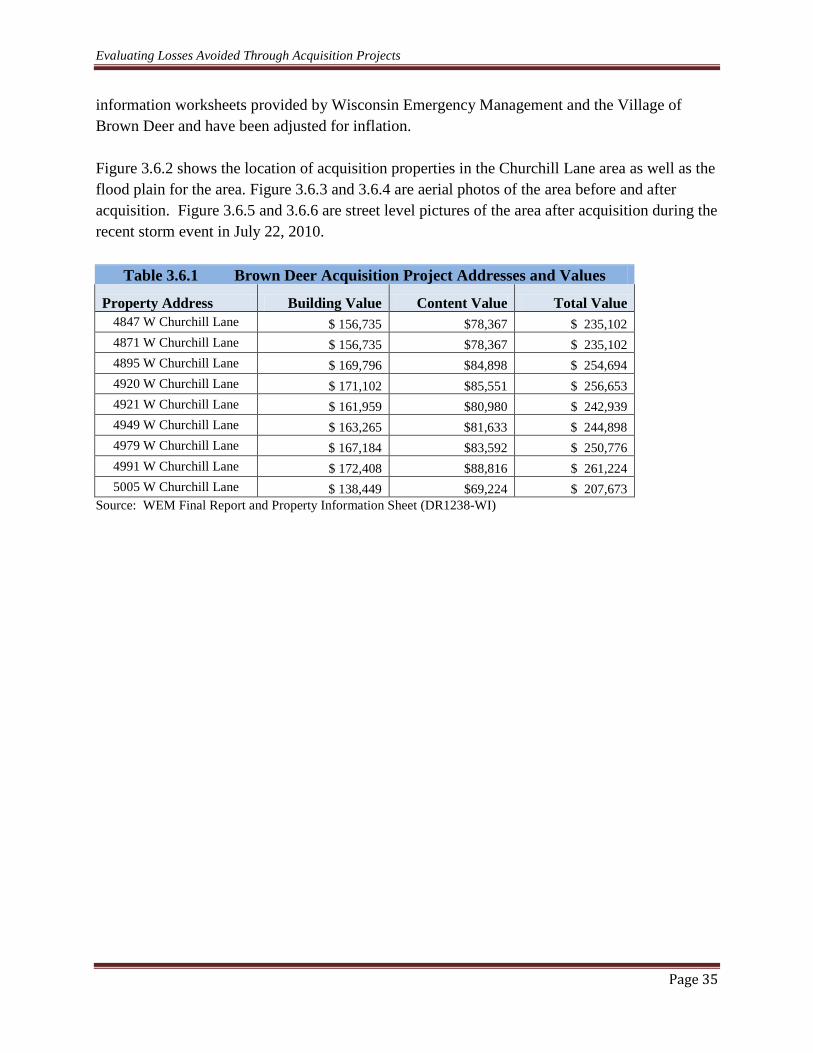
Table 3.6.1 contains the addresses of the acquisition project properties and the building and contents values used for the project analysis. The values were taken from the property
Evaluating Losses Avoided Through Acquisition Projects
Page 35
information worksheets provided by Wisconsin Emergency Management and the Village of Brown Deer and have been adjusted for inflation. Figure 3.6.2 shows the location of acquisition properties in the Churchill Lane area as well as the flood plain for the area. Figure 3.6.3 and 3.6.4 are aerial photos of the area before and after acquisition. Figure 3.6.5 and 3.6.6 are street level pictures of the area after acquisition during the recent storm event in July 22, 2010.
Table 3.6.1 Brown Deer Acquisition Project Addresses and Values
Property Address Building Value Content Value Total Value 4847 W Churchill Lane $ 156,735 $78,367 $ 235,102 4871 W Churchill Lane $ 156,735 $78,367 $ 235,102 4895 W Churchill Lane $ 169,796 $84,898 $ 254,694 4920 W Churchill Lane $ 171,102 $85,551 $ 256,653 4921 W Churchill Lane $ 161,959 $80,980 $ 242,939 4949 W Churchill Lane $ 163,265 $81,633 $ 244,898 4979 W Churchill Lane $ 167,184 $83,592 $ 250,776 4991 W Churchill Lane $ 172,408 $88,816 $ 261,224 5005 W Churchill Lane $ 138,449 $69,224 $ 207,673
Source: WEM Final Report and Property Information Sheet (DR1238-WI)

Evaluating Losses Avoided Through Acquisition Projects
Page 36
Figure 3.6.2 Acquisition Properties Location in Floodplain

Evaluating Losses Avoided Through Acquisition Projects
Page 37
Figure 3.6.3 Churchill Lane Properties Pre-Acquisition
Figure 3.6.4 Churchill Lane Properties Post-Acquisition

Evaluating Losses Avoided Through Acquisition Projects
Page 38
Figure 3.6.5 Churchill Lane July 22, 2010
Figure 3.6.6 Churchill Lane and 51st
St July 22, 2010
Evaluating Losses Avoided Through Acquisition Projects
Page 39
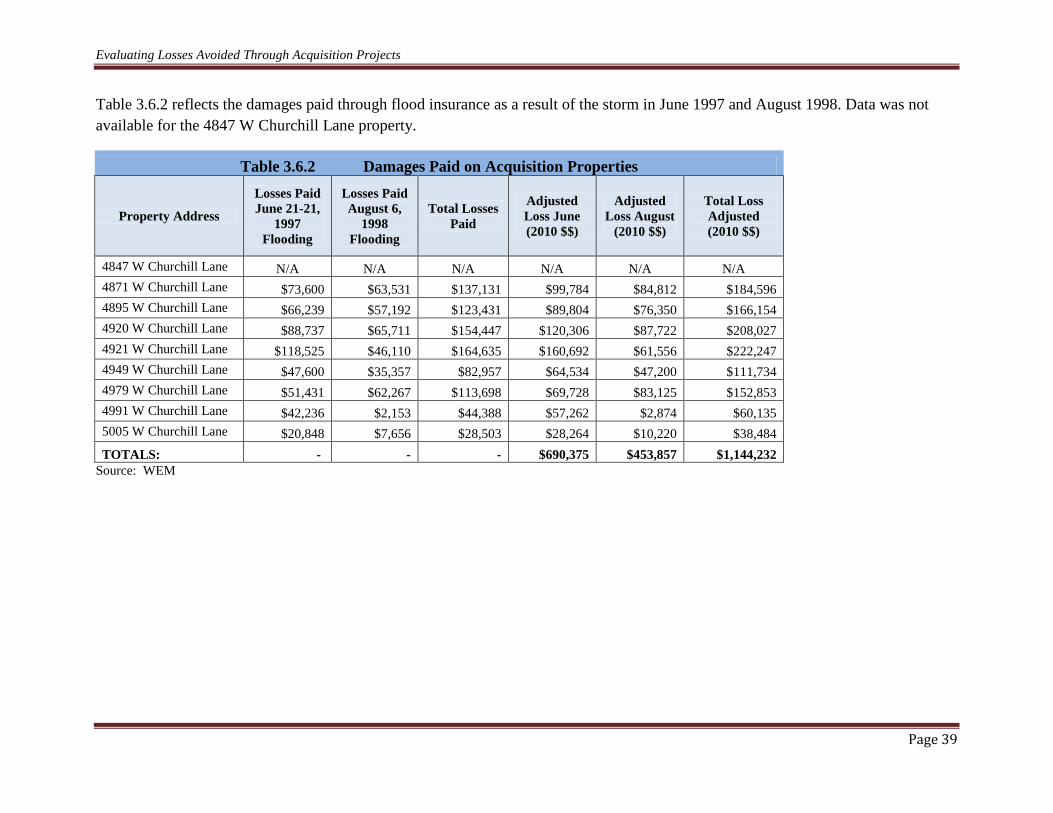
Table 3.6.2 reflects the damages paid through flood insurance as a result of the storm in June 1997 and August 1998. Data was not available for the 4847 W Churchill Lane property.
Table 3.6.2 Damages Paid on Acquisition Properties
Property Address
Losses Paid June 21-21,
1997 Flooding
Losses Paid August 6,
1998 Flooding
Total Losses Paid
Adjusted Loss June (2010 $$)
Adjusted Loss August
(2010 $$)
Total Loss Adjusted (2010 $$)
4847 W Churchill Lane N/A N/A N/A N/A N/A N/A 4871 W Churchill Lane $73,600 $63,531 $137,131 $99,784 $84,812 $184,596 4895 W Churchill Lane $66,239 $57,192 $123,431 $89,804 $76,350 $166,154 4920 W Churchill Lane $88,737 $65,711 $154,447 $120,306 $87,722 $208,027 4921 W Churchill Lane $118,525 $46,110 $164,635 $160,692 $61,556 $222,247 4949 W Churchill Lane $47,600 $35,357 $82,957 $64,534 $47,200 $111,734 4979 W Churchill Lane $51,431 $62,267 $113,698 $69,728 $83,125 $152,853 4991 W Churchill Lane $42,236 $2,153 $44,388 $57,262 $2,874 $60,135 5005 W Churchill Lane $20,848 $7,656 $28,503 $28,264 $10,220 $38,484 TOTALS: - - - $690,375 $453,857 $1,144,232
Source: WEM

Evaluating Losses Avoided Through Acquisition Projects
Page 40
Table 3.6.3 represents potential losses avoided for a 100 year flood event modeled using HAZUS-MH MR4. It also shows the potential Return on Investment (ROI) based on the damage estimates calculated in HAZUS for a 100 year flood event.
Table 3.6.3 Loss Estimation for HAZUS-MH MR4 Modeled 100 Year Flood Event
Property Address Date of Acquisition
Building Value
Building Damage
% (HAZUS)
Contents Value
Contents Damage
% (HAZUS)
Building Damage
Contents Damage
Total Losses
Avoided
Project Investment ROI
4847 W Churchill Lane 10/14/1999 $156,735 41.55% $78,367 37.26% $65,123 $29,200 $94,323 $131,880 72% 4871 W Churchill Lane 10/14/1999 $156,735 39.27% $78,367 34.52% $61,550 $27,052 $88,602 $ 81,188 109% 4895 W Churchill Lane 10/14/1999 $169,796 37.87% $84,898 32.84% $64,302 $27,880 $92,182 $ 95,796 96% 4920 W Churchill Lane 10/14/1999 $171,102 35.38% $85,551 29.73% $60,536 $25,434 $85,970 $ 97,915 88% 4921 W Churchill Lane 10/14/1999 $161,959 36.93% $80,980 31.66% $59,812 $25,638 $85,450 $133,899 64% 4949 W Churchill Lane 10/14/1999 $163,265 35.31% $81,633 29.64% $57,649 $24,196 $81,845 $106,530 77% 4979 W Churchill Lane 10/14/1999 $167,184 34.53% $83,592 28.67% $57,729 $23,966 $81,694 $103,382 79% 4991 W Churchill Lane 10/14/1999 $172,408 34.53% $88,816 28.67% $59,533 $25,464 $84,996 $147,121 58% 5005 W Churchill Lane 10/14/1999 $138,449 34.15% $69,224 28.18% $47,280 $19,507 $66,788 $121,121 55%
TOTALS:
$761,850 $1,108,831 69% Sources: WEM Property Information Sheets, FEMA-HAZUS-MH-MR4 (All values have been adjusted for inflation)
Return on investment was calculated using the following formula:
Return on Investment (ROI)
$ 761,850 LA (Loss Avoided) X 100 = 69% (ROI)
$ 1,108,831 PI (Project Investment or Acquisition Cost)

Evaluating Losses Avoided Through Acquisition Projects
Page 41
In reviewing the loss data for the two storm events prior to the community acquisition project it is important to note the comparison between actual losses (Table 3.6.2) and estimated losses from the HAZUS model run (Table 3.6.3). Damage estimates from a HAZUS model run depends largely on the accuracy of the data available to make the estimates for damages. In the HAZUS analysis for the Brown Deer acquisition it appears the data was fairly consistent and that the results, although not exact, are acceptable to estimate losses avoided for possible future events. As a result of the acquisition project in the Village of Brown Deer, and in conjunction with the Metropolitan Milwaukee Sewerage District, a detention basin was created along South Branch Creek, utilizing the properties the Village acquired. This catch basin, which functions as part of a larger system along South Branch Creek, has helped to mitigate flood damage from subsequent events throughout the northeastern section of Milwaukee County.
Other major rain events in 2004, 2008, and as recently as July 22, 2010 would most certainly have caused flooding and similar damage as the storms in 1997 and 1998. Fortunately, the mitigation projects (acquisition and detention basin) were completed in 2001 and have effectively avoided losses that would have exceeded an estimated $2.2 million dollars. It is clear that the most effective mitigation programs are those that remove properties from the flood plain. As evidenced by these projects in Milwaukee County, specifically the Brown Deer project, the positive outcomes are numerous not only for the affected residents in the community but the County as well and prove to be extremely cost effective over the lifetime of the project.

Evaluating Losses Avoided Through Acquisition Projects
Page 42
Section 4 Loss Estimation Analysis The Loss Estimation Analysis is the final phase of a loss avoidance study. This is conducted to estimate the avoided losses based on the effectiveness of the mitigation project during the storm event of interest. The Loss Estimation Analysis is accomplished by calculating the damage (in dollars) associated with the damage analysis reported in Section Two. This section briefly reviews the procedures used to determine the success of the mitigation effort set forth in this study. It includes two major tasks:
(1) Calculating Losses Avoided (LA) (2) Calculating Return On Investment (ROI)
Calculating Losses Avoided The losses avoided analysis determines the dollar value estimate of the damage that may have occurred had the mitigation project not been executed and the damage that could occur after the project was executed. The losses avoided (in dollars) were calculated by subtracting the mitigation completed from the estimated mitigation absent damages. The end result of the loss calculation was an estimated loss value for the event that actually occurred. The losses were calculated in present-day values. Calculating Return on Investment The final task in determining losses avoided is to calculate the ROI. The methodology and results may vary depending upon the number of events being analyzed for each mitigation project and the level of damage sustained during each impacting event. The bottom portion of the equation (PI) is the total project investment for the mitigation projects being evaluated. Project investment does not represent the Federal investment alone, but rather the resource investment from all parties involved. It does not include work conducted outside of the mitigation projects. The upper portion of the equation (LA) is the total losses avoided. Multiple events are being evaluated for each mitigation project. The LA represents the total losses for all the storm events evaluated. The first project (City of Wauwatosa) reflects actual event data and estimated losses avoided from those events. These events range from major to minor flooding. Projects Two through Five reflect HAZUS modeling and are based on a one-time, 100-year flood event. From this

Evaluating Losses Avoided Through Acquisition Projects
Page 43
information, it is evident that actual flooding events will result in a significant return on investment that will increase as additional flooding events occur. The diagrams below represent a numerical representation of the findings:
Table 4.1 Return on Mitigation Investment Project #: Losses
Avoided: Project Investment
Return on Investment:
#1: City of Wauwatosa $1,059,101 $ 716,837 148% #2: City of Milwaukee (1st $ 234,348 project) $ 925,823 25% #3: City of Milwaukee (2nd $ 31,639 project) $ 90,724 35% #4: Village of Oak Creek $ 68,575 $ 112,183 61% #5: Village of Brown Deer $ 761,850 $1,108,832 75% Totals: $ 2,155,513 $2,954,399 73%
Return on Mitigation Investment
$ LA ______ x 100 = % ROI $ PI
Where LA = Losses Avoided Where PI = Project Investment Where ROI = Return on Investment
Return on Mitigation Investment
$2,155,513
___________ x 100 = 73%
$2,954,399

Evaluating Losses Avoided Through Acquisition Projects
Page 44
Section 5 Summary The projects included in this report all involved acquiring properties in the flood plain and removing them. The acquired properties were then returned to green space and any future development is limited. Additionally, two of the acquisition projects were completed in conjunction with other types of mitigation projects involving a detention basin and re-engineering a creek channel.
The size of each project varied depending on circumstances unique to each community. The outcomes for each of these projects was also unique to each community and provided exceptional support for why an acquisitions project is often the best course of action for a community. The outcomes are as follows:
• City of Wauwatosa – a community park was created • City of Milwaukee – Lincoln Creek neighborhood – severely damaged structures have
been removed and replaced with green space • Village of Oak Creek – structure has been removed and assistance is no long required
from the community first responders in a flood event • Village of Brown Deer – structures have been replaced with a detention basin in
conjunction with another project which helped prevent flooding in a much broader area of the community
Without question, there is a cost associated with any acquisition project. While this cost can be analyzed in a quantitative manner for structures and contents, it is not so simple to determine associated benefits for the greater community. The costs reflected in Table 4.1 in Section 4 include varied costs associated with the analysis of the data for each project and the total of all projects with an average ROI. For example, in Project #1 (City of Wauwatosa) the losses avoided and project investment costs were taken from the actual events and actual properties that could have been affected in each event following mitigation (acquisition) of the properties. All of the acquired properties from this project did not always show damage from the event, thus they were not all included in each flood event (or the total Project Investment). For Projects #2 through #5, HAZUS modeling was conducted estimating damage for most properties for a one-time, 100-year flood event. Project investment or acquisition costs were then calculated for most, if not all, properties acquired for each of these projects. Overall, as shown in Table 4.1, the return on investment (ROI) for all five projects is estimated at 73%. This is combining the actual events of Project #1 with the one-time, 100-year events for Projects #2-5. It may be more accurate to show the ROI for Project #1 as 148% from actual events and the ROI for Projects #2-5 for HAZUS modeling as an average of 49%. (see Table 5.1 below)

Evaluating Losses Avoided Through Acquisition Projects
Page 45
Table 5.1 Return on Mitigation Investment by Type of Analysis (Actual Events vs. HAZUS modeling) Project #: Losses
Avoided: Project Investment
Return on Investment:
#1: City of Wauwatosa $1,059,101 $ 716,837 148% Total: (Project #1) $1,059,101 $ 716,837 148%
HAZUS Modeling for a 100-year flood event #2: City of Milwaukee (1st $ 234,348 project) $ 925,823 25% #3: City of Milwaukee (2nd $ 31,639 project) $ 90,724 35% #4: Village of Oak Creek $ 68,575 $ 112,183 61% #5: Village of Brown Deer $ 761,850 $1,108,832 75% Totals: (Project #2-5) $1,096,412 $2,237,562 49%
Whichever analysis is chosen (Table 4.1 or Table 5.1) the Return on Investment is significant and indicates that as flooding events occur, the ROI will continue to increase at a considerable rate and over time, will undoubtedly be much higher than the original project investment costs.
Unquestionably, when a property has been removed through acquisition, it is no longer at risk for loss from a flood event. The community no longer needs to risk people and equipment when responding to flooded residents at the acquired property. When the acquisition involves collaborative efforts such as the Brown Deer or Lincoln Creek projects, the benefit to the larger community can often go unnoticed. If these benefits are examined in addition to the direct losses avoided because of the acquisition, the benefit to the community becomes even more substantial.
Once again, as evidenced by the historical experience of flooding in areas such as Milwaukee County, the question is not if flooding will happen again, but when it happens again. Because of projects like those included in this report and on-going in communities and counties throughout the state of Wisconsin, the impact to people and property has been successfully mitigated in a very cost effective manner. While the dramatic results may not be evident for all properties in all instances, the ROI calculations support the assertion that over the course of subsequent events the cumulative benefit far outweighs the cost of these types of projects.