
Evaluating Learning-to-Rank Methods in the Web Track Adhoc ...
14
Evaluating Learning-to-Rank Methods in the Web Track Adhoc Task. Leonid Boytsov and Anna Belova [email protected], [email protected] TREC-20, November 2011, Gaithersburg, Maryland, USA Learning-to-rank methods are becoming ubiquitous in information retrieval. Their advantage lies in the ability to combine a large number of low-impact relevance signals. This requires large training and test data sets. A large test data set is also needed to verify the usefulness of specific relevance signals (using statistical methods). There are several publicly available data collections geared towards evaluation of learning-to-rank methods. These collections are large, but they typically provide a fixed set of precomputed (and often anonymized) relevance signals. In turn, computing new signals may be impossible. This limitation motivated us to experiment with learning-to-rank methods using the TREC Web adhoc collection. Specifically, we compared performance of learning-to-rank methods with performance of a hand-tuned formula (based on the same set of relevance signals). Even though the TREC data set did not have enough queries to draw definitive conclusions, the hand-tuned formula seemed to be at par with learning-to-rank methods. 1. INTRODUCTION 1.1 Motivation and Research Questions Strong relevance signals are similar to antibiotics: development, testing, and im- provement of new formulas that provide strong relevance signals take many years. On the other hand, the adversarial environment (i.e., the SEO community) con- stantly adapts to new approaches and learns how to make them less efficient. Be- cause it is not possible to wait until new ranking formulas are developed and as- sessed, a typical strategy to improve retrieval effectiveness is to combine a large number of relevance signals using a learning-to-rank method. A common belief is that this approach is extremely efficient. We wondered whether we could actually improve our standing among TREC participants by applying a general-purpose discriminative learning method. Was there sufficient training data for this objective? We were also curious about how large the gain in performance might be. It is a standard practice to compute hundreds of potential relevance signals and make a training algorithm decide which signals are good and which are not. On the other hand, it would be useful to decrease dimensionality of the data by detecting and discarding signals that do not influence rankings in a meaningful way. A lot of signals are useful, but their impact on retrieval performance is small. Can we detect such low-impact signals in a typical TREC setting? 1.2 Paper Organization In Section 1.3, it is explained why we chose the TREC Web adhoc collection over specialized learning-to-rank datasets. In Section 2, we describe our experimental settings. In particular, Section 2.3 has a description of relevance signals. The base-
Transcript of Evaluating Learning-to-Rank Methods in the Web Track Adhoc ...

Evaluating Learning-to-Rank Methods in the WebTrack Adhoc Task.
Leonid Boytsov and Anna [email protected], [email protected]
TREC-20, November 2011, Gaithersburg, Maryland, USA
Learning-to-rank methods are becoming ubiquitous in information retrieval. Their advantagelies in the ability to combine a large number of low-impact relevance signals. This requireslarge training and test data sets. A large test data set is also needed to verify the usefulness ofspecific relevance signals (using statistical methods). There are several publicly available datacollections geared towards evaluation of learning-to-rank methods. These collections are large,but they typically provide a fixed set of precomputed (and often anonymized) relevance signals.In turn, computing new signals may be impossible. This limitation motivated us to experimentwith learning-to-rank methods using the TREC Web adhoc collection. Specifically, we comparedperformance of learning-to-rank methods with performance of a hand-tuned formula (based onthe same set of relevance signals). Even though the TREC data set did not have enough queriesto draw definitive conclusions, the hand-tuned formula seemed to be at par with learning-to-rankmethods.
1. INTRODUCTION
1.1 Motivation and Research Questions
Strong relevance signals are similar to antibiotics: development, testing, and im-provement of new formulas that provide strong relevance signals take many years.On the other hand, the adversarial environment (i.e., the SEO community) con-stantly adapts to new approaches and learns how to make them less efficient. Be-cause it is not possible to wait until new ranking formulas are developed and as-sessed, a typical strategy to improve retrieval effectiveness is to combine a largenumber of relevance signals using a learning-to-rank method.
A common belief is that this approach is extremely efficient. We wonderedwhether we could actually improve our standing among TREC participants byapplying a general-purpose discriminative learning method. Was there sufficienttraining data for this objective? We were also curious about how large the gain inperformance might be.
It is a standard practice to compute hundreds of potential relevance signals andmake a training algorithm decide which signals are good and which are not. On theother hand, it would be useful to decrease dimensionality of the data by detectingand discarding signals that do not influence rankings in a meaningful way. A lotof signals are useful, but their impact on retrieval performance is small. Can wedetect such low-impact signals in a typical TREC setting?
1.2 Paper Organization
In Section 1.3, it is explained why we chose the TREC Web adhoc collection overspecialized learning-to-rank datasets. In Section 2, we describe our experimentalsettings. In particular, Section 2.3 has a description of relevance signals. The base-

2 ·
line ranking formula and learning-to-rank methods used in our work are presentedin Sections 2.4 and 2.5, respectively. Experimental results are discussed in Sec-tion 3, specifically, experiments with low-impact relevance signals are described inSection 3.2. Failure analysis is given in Section 3.3. Section 4 concludes the paper.
1.3 Why TREC?
There are several large-scale learning-to-rank data sets designed to evaluate learning-to-rank methods:
—The Microsoft learning-to-rank data set contains 30K queries from a retired train-ing set previously used by the search engine Bing.1 The semantics of all featuresis disclosed. Thus, it is known which relevance signals are represented by thesefeatures. However, there is no proximity information and it cannot be recon-structed.
—The internal Yahoo! data set (used for the learning-to-rank challenge) does con-tain proximity information, but all features are anonymized and normalized.2
—The internal Yandex data set (used in the Yandex learning-to-rank competition)is similar to the Yahoo! data set in that its features are not disclosed.3
—The Microsoft LETOR 4.0 data set employs the publicly available Gov2 collectionand two sets of queries used in the TREC conferences (2007 and 2008 One MillionQuery Track).4,5 Unfortunately, proximity information cannot be reconstructedfrom provided metadata: to be evaluated it requires full access to the Gov2collection.
Because it is very hard to manually construct an efficient ranking formula thatencompasses undisclosed and normalized features, Yahoo! and Yandex data setswere not usable for our purposes. On the other hand, the Microsoft data sets lackproximity features, which are known to be powerful relevance signals improvingthe mean average precision and ERR@20 by approximately 10% [Tao and Zhai2007; Cummins and O’Riordan 2009; Boytsov and Belova 2010]. Because we didnot have access to Gov2 and, consequently, could not enrich LETOR 4.0 withproximity scores, we decided to conduct similar experiments with the ClueWeb09adhoc data set.
2. EXPERIMENTAL SETUP AND EMPLOYED METHODS
2.1 General Notes
We indexed the smaller subset of ClueWeb09 Web adhoc collection (Category B)that contained 50M pages. Both indexing and retrieval utilities worked on a clusterof 3 three laptops (running Linux) connected to a 2TB disk storage. We used ourown retrieval and indexing software written mostly in C++. To generate differentmorphological word forms, we relied on the library from http://lemmatizer.org. We
1http://research.microsoft.com/en-us/projects/mslr/2http://learningtorankchallenge.yahoo.com/datasets.php3Internet Mathematics 2009 contest http://imat2009.yandex.ru/en/datasets4http://research.microsoft.com/en-us/um/beijing/projects/letor/5http://ir.dcs.gla.ac.uk/test collections/gov2-summary.htm
· 3
also employed third-party implementations of learning-to-rank methods (describedin Section 2.5).
The main Web adhoc performance metric in 2010 and 2011 was ERR@20 [Chapelleet al. 2009]. To assess statistical significance of results, we used the randomizationtest utility developed by Mark Smucker [Smucker et al. 2007]. The results wereconsidered significant if the p-value did not exceed 0.05.
2.2 Changes in Indexing and Retrieval Methods from 2010
Our 2011 system was based on the 2010 prototype that was capable of indexingclose word pairs efficiently [Boytsov and Belova 2010]. In addition to close wordpairs, this year we created positional postings of adjacent pairs (i.e., bigrams),where one of the words was a stop word. These bigrams are called stop pairs.
The other important changes were:
—We considerably expanded the list of relevance signals that participated in theranking formula. In particular, all the data was divided into fields, which wereindexed separately. We also modified the method of computing proximity-relatedsignals (see Section 2.3 for details).
—Instead of index-time word normalization (i.e., conversion to a base morphologicalform), we performed a retrieval-time weighted morphological query expansion. Inthat, each exact occurrence of a query word contributed to a field-specific BM25score with a weight equal to one, while other morphological forms of query wordscontributed with a weight smaller than one.
—Stop pairs were disregarded during retrieval if a query had sufficiently manynon-stop words (more than 60% of all query words).
—Instead of enforcing strictly conjunctive query semantics, we used a quorum rule:only a fraction (75%) of query words had to be present in a document. Incompletematches that missed some query words were penalized. In addition, stop pairswere treated as optional query terms and did not participate in the computationof the quorum.
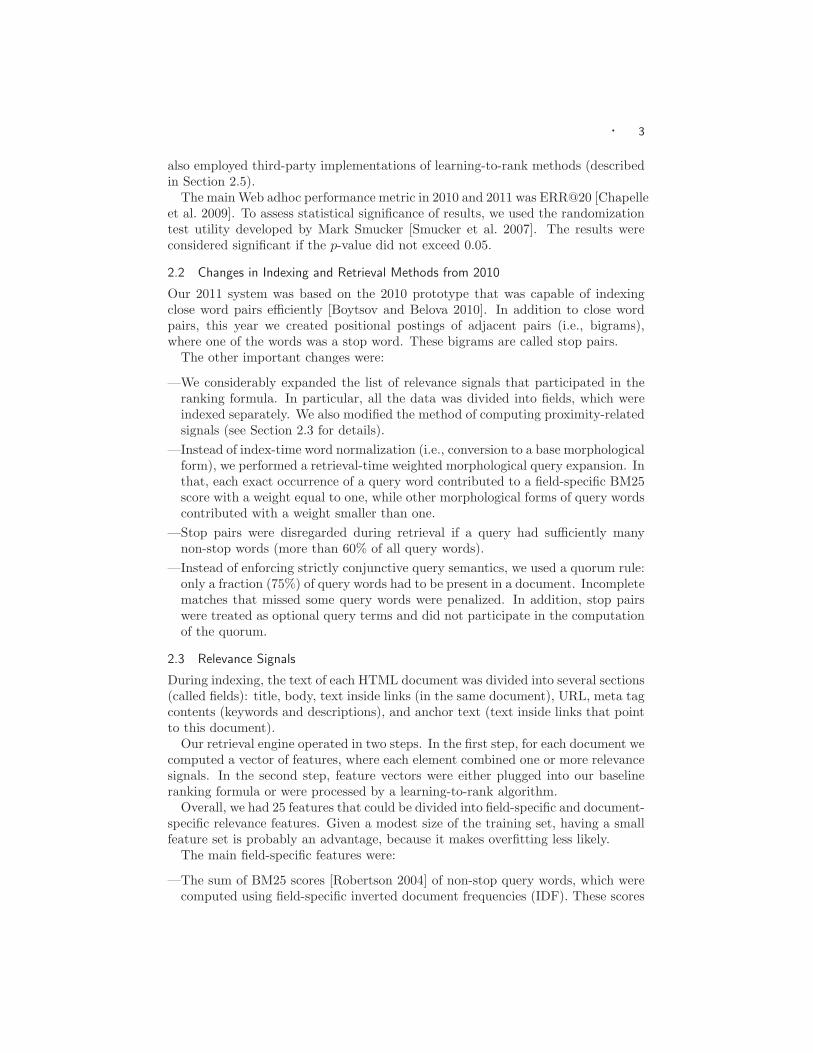
2.3 Relevance Signals
During indexing, the text of each HTML document was divided into several sections(called fields): title, body, text inside links (in the same document), URL, meta tagcontents (keywords and descriptions), and anchor text (text inside links that pointto this document).
Our retrieval engine operated in two steps. In the first step, for each document wecomputed a vector of features, where each element combined one or more relevancesignals. In the second step, feature vectors were either plugged into our baselineranking formula or were processed by a learning-to-rank algorithm.
Overall, we had 25 features that could be divided into field-specific and document-specific relevance features. Given a modest size of the training set, having a smallfeature set is probably an advantage, because it makes overfitting less likely.
The main field-specific features were:
—The sum of BM25 scores [Robertson 2004] of non-stop query words, which werecomputed using field-specific inverted document frequencies (IDF). These scores

4 ·
were incremented by BM25 scores of stop pairs;6
—The classic pair-wise proximity scores, where a contribution of a word pair wasa power function of the inverse distance between words in a document;
—Proximity scores based on the number of close word pairs in a document. A pair ofquery words was considered close if the distance between the words in a documentwas smaller than a given threshold MaxClosePairDist (in our experiments 10).
These pair-wise proximity scores are variants of the unordered BM25 bigrammodel ([Metzler and Croft 2005; Elsayed et al. 2010; He et al. 2011]). They werecomputed as follows. Given a pair of query words qi and qj (not necessarily adja-cent), we retrieved a list of all documents, where words qi and qj occured withina certain small distance. A pseudo-frequency f of the pair in a document wascomputed as a sum of values of a kernel function g(.):
f =∑
g(pos(qi), pos(qj)),
where the summation was carried out over occurrences of qi and qj in the document(in positions pos(qi) and pos(qj), respectively).
To evaluate the total contribution of qi and qj to the document weight, thepseudo-frequency f was plugged into a standard BM25 formula, where the IDF ofthe word pair (qi, qj) was computed as IDF(qi) + IDF(qj).
The classic proximity score relied on the following kernel function:
g(x, y) = |x − y|−α,
where α = 2.5 was a configurable parameter.The close-pair proximity score employed the rectangular kernel function:
g(x, y) =
{
1, if |x − y| ≤ MaxClosePairDist0, if |x − y| > MaxClosePairDist
In this case, the pseudo-frequency f is equal to the number of close pairs that occurwithin the distance MaxClosePairDist in a document.
The document-specific features included:
—Linearly transformed spam rankings provided by the Waterloo university [Cor-mack et al. 2010];
—Logarithmically transformed PageRank scores [Brin and Page 1998] provided bythe Carnegie Mellon University.7 During retrieval, these scores were additionallynormalized by the number of query words;
—A boolean flag that is true if and only if a document belongs to the Wikipedia.
2.4 Baseline Ranking Formula
The baseline ranking formula was a simple semi-linear function, where field-specificproximity scores and field-specific BM25 scores contributed as additive terms. The
6Essentially we treated these bigrams as optional query terms.7http://boston.lti.cs.cmu.edu/clueweb09/wiki/tiki-index.php?page=PageRank

· 5
overall document score was equal to
DocumentSpecificScore ×
(
∑
i
FieldWeighti × FieldScorei
)
, (1)
where FieldWeighti was a configurable parameter and the summation was carriedout over all fields. The DocumentSpecificScore was a multiplicative factor equalto the product of the spam rank score, the PageRank score, and the Wikipediascore WikiScore (WikiScore > 1 for Wikipedia pages and WikiScore = 1 for allother documents).
Each FieldScorei was a weighted sum of field-specific relevance features describedin Section 2.3. These feature-specific weights were configurable parameters (iden-tical for all fields). Overall, there were about 20 parameters that were manuallytuned using 2010 data to maximize ERR@20. Note that even if we had optimizedparameters automatically, this approach could not be classified as a discrimina-tive learning-to-rank method, because it did not rely on minimization of the lossfunction (see a definition given by Liu [2009]).
2.5 Learning-to-Rank Methods
We tested the following learning-to-rank methods:
—Non-linear SVM with polynomial and RBF kernels (package SVMLight [Joachims2002]);
—Linear SVM (package SVMRank [Joachims 2006]);
—Linear SVM (package LIBLINEAR [Fan et al. 2008]);
—Random forests (package RT-Rank [Mohan et al. 2011]);
—Gradient boosting (package RT-Rank [Mohan et al. 2011]).
The final results include linear SVM (LIBLINEAR), polynomial SVM (SVMLight),and random forests (RT-Rank). The selected methods performed best in theirrespective categories.
In our approach, we relied on the baseline method (outlined in Section 2.4) toobtain the top 30K results, which were subsequently re-ranked using a learning-to-rank algorithm. Note that each learning method employed the same set of featuresdescribed in Section 2.3.
Initially, we trained all methods using 2010 data and cross-validated using 2009data. Unfortunately, cross-validation results of all learning-to-rank methods werepoor. Therefore, we did not submit any runs produced by a learning-to-rank al-gorithm. After the official submission, we re-trained the random forests using theassessments from the Million Query Track (MQ Track). This time, the results weremuch better (see a discussion in Section 3.1).
3. EXPERIMENTAL RESULTS
3.1 Comparisons with Official Runs
We submitted two official runs: srchvrs11b and srchvrs11o. The first run wasproduced by the baseline method described in Section 2.4. The second run was
6 ·
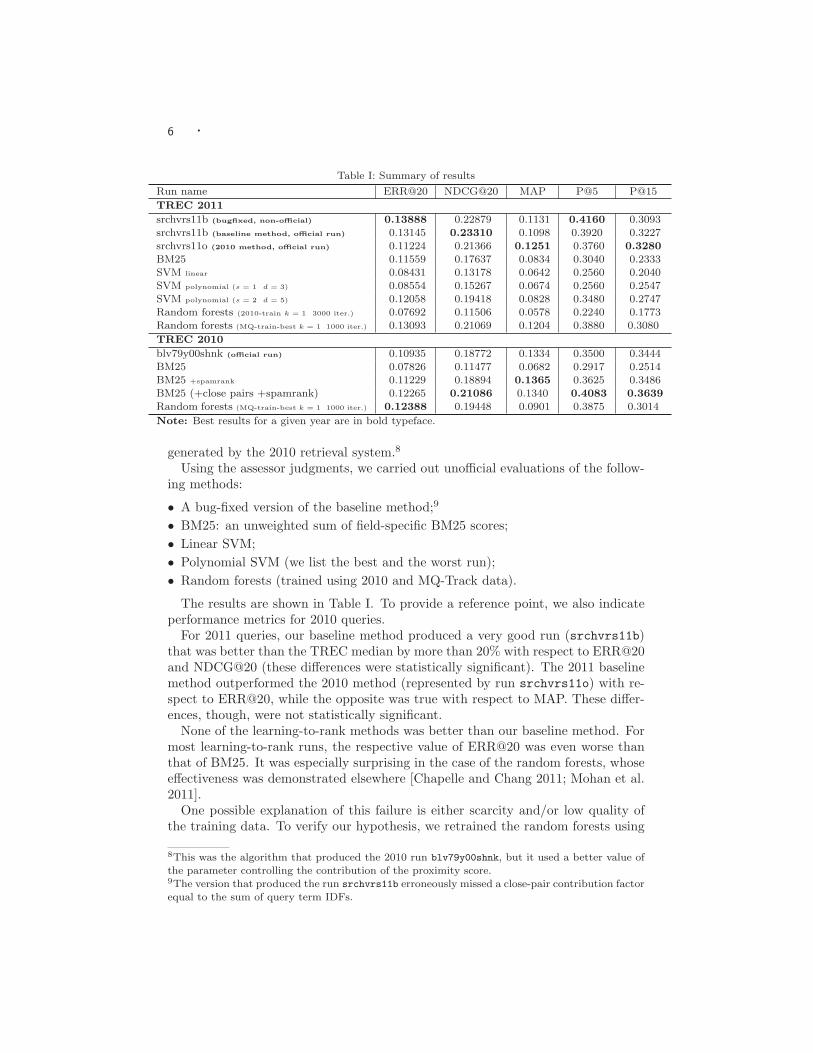
Table I: Summary of results
Run name ERR@20 NDCG@20 MAP P@5 P@15TREC 2011
srchvrs11b (bugfixed, non-official) 0.13888 0.22879 0.1131 0.4160 0.3093srchvrs11b (baseline method, official run) 0.13145 0.23310 0.1098 0.3920 0.3227srchvrs11o (2010 method, official run) 0.11224 0.21366 0.1251 0.3760 0.3280
BM25 0.11559 0.17637 0.0834 0.3040 0.2333SVM linear 0.08431 0.13178 0.0642 0.2560 0.2040SVM polynomial (s = 1 d = 3) 0.08554 0.15267 0.0674 0.2560 0.2547SVM polynomial (s = 2 d = 5) 0.12058 0.19418 0.0828 0.3480 0.2747Random forests (2010-train k = 1 3000 iter.) 0.07692 0.11506 0.0578 0.2240 0.1773Random forests (MQ-train-best k = 1 1000 iter.) 0.13093 0.21069 0.1204 0.3880 0.3080TREC 2010
blv79y00shnk (official run) 0.10935 0.18772 0.1334 0.3500 0.3444BM25 0.07826 0.11477 0.0682 0.2917 0.2514BM25 +spamrank 0.11229 0.18894 0.1365 0.3625 0.3486BM25 (+close pairs +spamrank) 0.12265 0.21086 0.1340 0.4083 0.3639
Random forests (MQ-train-best k = 1 1000 iter.) 0.12388 0.19448 0.0901 0.3875 0.3014
Note: Best results for a given year are in bold typeface.
generated by the 2010 retrieval system.8
Using the assessor judgments, we carried out unofficial evaluations of the follow-ing methods:
• A bug-fixed version of the baseline method;9
• BM25: an unweighted sum of field-specific BM25 scores;
• Linear SVM;
• Polynomial SVM (we list the best and the worst run);
• Random forests (trained using 2010 and MQ-Track data).
The results are shown in Table I. To provide a reference point, we also indicateperformance metrics for 2010 queries.
For 2011 queries, our baseline method produced a very good run (srchvrs11b)that was better than the TREC median by more than 20% with respect to ERR@20and NDCG@20 (these differences were statistically significant). The 2011 baselinemethod outperformed the 2010 method (represented by run srchvrs11o) with re-spect to ERR@20, while the opposite was true with respect to MAP. These differ-ences, though, were not statistically significant.
None of the learning-to-rank methods was better than our baseline method. Formost learning-to-rank runs, the respective value of ERR@20 was even worse thanthat of BM25. It was especially surprising in the case of the random forests, whoseeffectiveness was demonstrated elsewhere [Chapelle and Chang 2011; Mohan et al.2011].
One possible explanation of this failure is either scarcity and/or low quality ofthe training data. To verify our hypothesis, we retrained the random forests using
8This was the algorithm that produced the 2010 run blv79y00shnk, but it used a better value ofthe parameter controlling the contribution of the proximity score.9The version that produced the run srchvrs11b erroneously missed a close-pair contribution factorequal to the sum of query term IDFs.
· 7
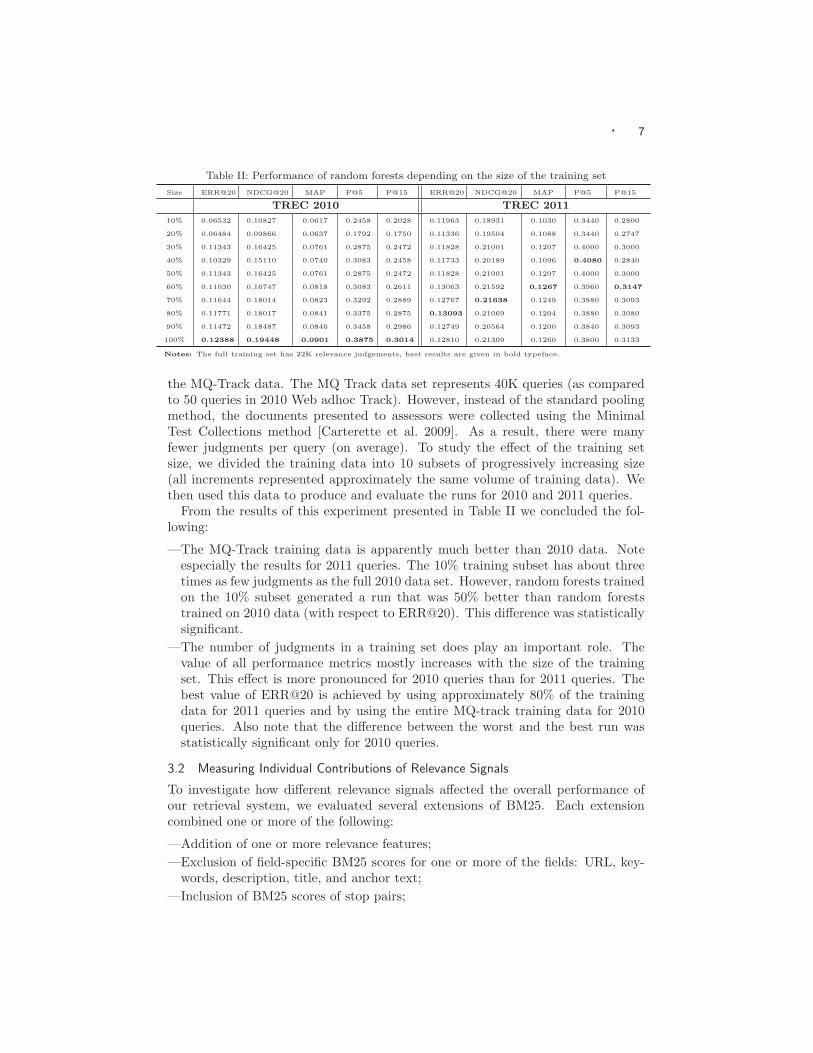
Table II: Performance of random forests depending on the size of the training set
Size ERR@20 NDCG@20 MAP P@5 P@15 ERR@20 NDCG@20 MAP P@5 P@15
TREC 2010 TREC 2011
10% 0.06532 0.10827 0.0617 0.2458 0.2028 0.11963 0.18931 0.1030 0.3440 0.2800
20% 0.06484 0.09866 0.0637 0.1792 0.1750 0.11336 0.19504 0.1088 0.3440 0.2747
30% 0.11343 0.16425 0.0761 0.2875 0.2472 0.11828 0.21001 0.1207 0.4000 0.3000
40% 0.10329 0.15110 0.0740 0.3083 0.2458 0.11733 0.20189 0.1096 0.4080 0.2840
50% 0.11343 0.16425 0.0761 0.2875 0.2472 0.11828 0.21001 0.1207 0.4000 0.3000
60% 0.11030 0.16747 0.0818 0.3083 0.2611 0.13063 0.21592 0.1267 0.3960 0.3147
70% 0.11644 0.18014 0.0823 0.3292 0.2889 0.12767 0.21638 0.1249 0.3880 0.3093
80% 0.11771 0.18017 0.0841 0.3375 0.2875 0.13093 0.21069 0.1204 0.3880 0.3080
90% 0.11472 0.18487 0.0846 0.3458 0.2986 0.12749 0.20564 0.1200 0.3840 0.3093
100% 0.12388 0.19448 0.0901 0.3875 0.3014 0.12810 0.21309 0.1260 0.3800 0.3133
Notes: The full training set has 22K relevance judgements, best results are given in bold typeface.
the MQ-Track data. The MQ Track data set represents 40K queries (as comparedto 50 queries in 2010 Web adhoc Track). However, instead of the standard poolingmethod, the documents presented to assessors were collected using the MinimalTest Collections method [Carterette et al. 2009]. As a result, there were manyfewer judgments per query (on average). To study the effect of the training setsize, we divided the training data into 10 subsets of progressively increasing size(all increments represented approximately the same volume of training data). Wethen used this data to produce and evaluate the runs for 2010 and 2011 queries.
From the results of this experiment presented in Table II we concluded the fol-lowing:
—The MQ-Track training data is apparently much better than 2010 data. Noteespecially the results for 2011 queries. The 10% training subset has about threetimes as few judgments as the full 2010 data set. However, random forests trainedon the 10% subset generated a run that was 50% better than random foreststrained on 2010 data (with respect to ERR@20). This difference was statisticallysignificant.
—The number of judgments in a training set does play an important role. Thevalue of all performance metrics mostly increases with the size of the trainingset. This effect is more pronounced for 2010 queries than for 2011 queries. Thebest value of ERR@20 is achieved by using approximately 80% of the trainingdata for 2011 queries and by using the entire MQ-track training data for 2010queries. Also note that the difference between the worst and the best run wasstatistically significant only for 2010 queries.
3.2 Measuring Individual Contributions of Relevance Signals
To investigate how different relevance signals affected the overall performance ofour retrieval system, we evaluated several extensions of BM25. Each extensioncombined one or more of the following:
—Addition of one or more relevance features;
—Exclusion of field-specific BM25 scores for one or more of the fields: URL, key-words, description, title, and anchor text;
—Inclusion of BM25 scores of stop pairs;
8 ·
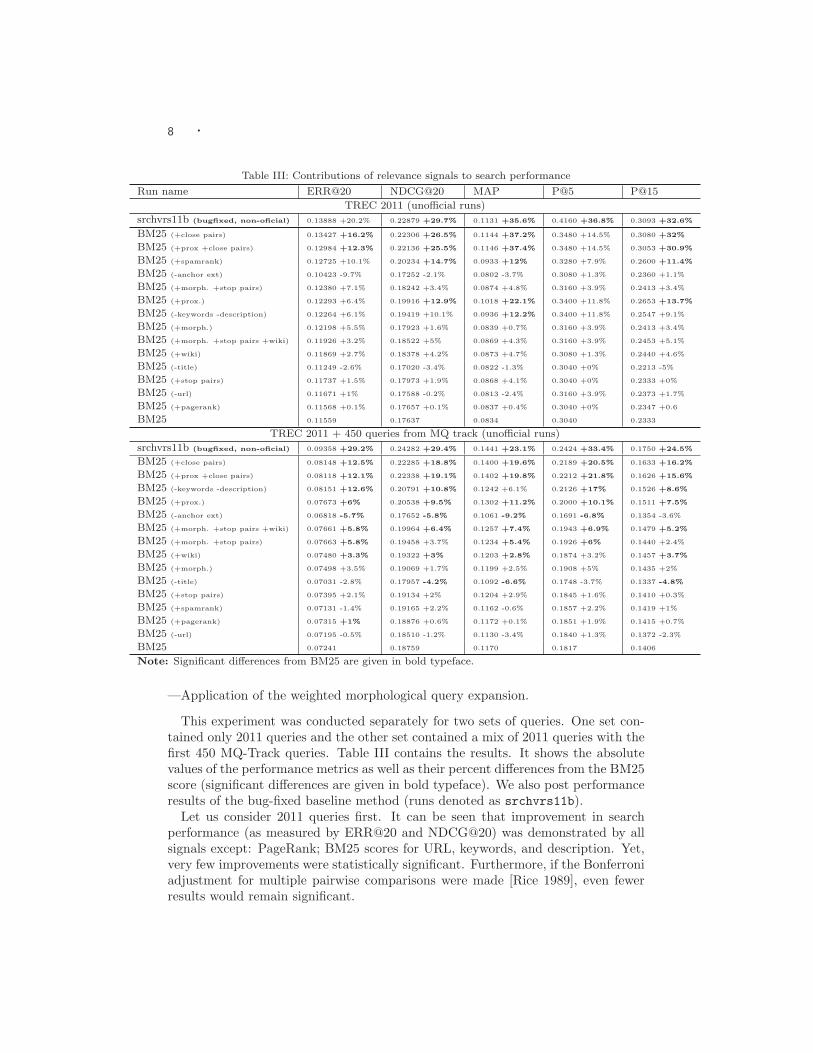
Table III: Contributions of relevance signals to search performance
Run name ERR@20 NDCG@20 MAP P@5 P@15TREC 2011 (unofficial runs)
srchvrs11b (bugfixed, non-oficial) 0.13888 +20.2% 0.22879 +29.7% 0.1131 +35.6% 0.4160 +36.8% 0.3093 +32.6%
BM25 (+close pairs) 0.13427 +16.2% 0.22306 +26.5% 0.1144 +37.2% 0.3480 +14.5% 0.3080 +32%
BM25 (+prox +close pairs) 0.12984 +12.3% 0.22136 +25.5% 0.1146 +37.4% 0.3480 +14.5% 0.3053 +30.9%
BM25 (+spamrank) 0.12725 +10.1% 0.20234 +14.7% 0.0933 +12% 0.3280 +7.9% 0.2600 +11.4%
BM25 (-anchor ext) 0.10423 -9.7% 0.17252 -2.1% 0.0802 -3.7% 0.3080 +1.3% 0.2360 +1.1%
BM25 (+morph. +stop pairs) 0.12380 +7.1% 0.18242 +3.4% 0.0874 +4.8% 0.3160 +3.9% 0.2413 +3.4%
BM25 (+prox.) 0.12293 +6.4% 0.19916 +12.9% 0.1018 +22.1% 0.3400 +11.8% 0.2653 +13.7%
BM25 (-keywords -description) 0.12264 +6.1% 0.19419 +10.1% 0.0936 +12.2% 0.3400 +11.8% 0.2547 +9.1%
BM25 (+morph.) 0.12198 +5.5% 0.17923 +1.6% 0.0839 +0.7% 0.3160 +3.9% 0.2413 +3.4%
BM25 (+morph. +stop pairs +wiki) 0.11926 +3.2% 0.18522 +5% 0.0869 +4.3% 0.3160 +3.9% 0.2453 +5.1%
BM25 (+wiki) 0.11869 +2.7% 0.18378 +4.2% 0.0873 +4.7% 0.3080 +1.3% 0.2440 +4.6%
BM25 (-title) 0.11249 -2.6% 0.17020 -3.4% 0.0822 -1.3% 0.3040 +0% 0.2213 -5%
BM25 (+stop pairs) 0.11737 +1.5% 0.17973 +1.9% 0.0868 +4.1% 0.3040 +0% 0.2333 +0%
BM25 (-url) 0.11671 +1% 0.17588 -0.2% 0.0813 -2.4% 0.3160 +3.9% 0.2373 +1.7%
BM25 (+pagerank) 0.11568 +0.1% 0.17657 +0.1% 0.0837 +0.4% 0.3040 +0% 0.2347 +0.6
BM25 0.11559 0.17637 0.0834 0.3040 0.2333
TREC 2011 + 450 queries from MQ track (unofficial runs)srchvrs11b (bugfixed, non-oficial) 0.09358 +29.2% 0.24282 +29.4% 0.1441 +23.1% 0.2424 +33.4% 0.1750 +24.5%
BM25 (+close pairs) 0.08148 +12.5% 0.22285 +18.8% 0.1400 +19.6% 0.2189 +20.5% 0.1633 +16.2%
BM25 (+prox +close pairs) 0.08118 +12.1% 0.22338 +19.1% 0.1402 +19.8% 0.2212 +21.8% 0.1626 +15.6%
BM25 (-keywords -description) 0.08151 +12.6% 0.20791 +10.8% 0.1242 +6.1% 0.2126 +17% 0.1526 +8.6%
BM25 (+prox.) 0.07673 +6% 0.20538 +9.5% 0.1302 +11.2% 0.2000 +10.1% 0.1511 +7.5%
BM25 (-anchor ext) 0.06818 -5.7% 0.17652 -5.8% 0.1061 -9.2% 0.1691 -6.8% 0.1354 -3.6%
BM25 (+morph. +stop pairs +wiki) 0.07661 +5.8% 0.19964 +6.4% 0.1257 +7.4% 0.1943 +6.9% 0.1479 +5.2%
BM25 (+morph. +stop pairs) 0.07663 +5.8% 0.19458 +3.7% 0.1234 +5.4% 0.1926 +6% 0.1440 +2.4%
BM25 (+wiki) 0.07480 +3.3% 0.19322 +3% 0.1203 +2.8% 0.1874 +3.2% 0.1457 +3.7%
BM25 (+morph.) 0.07498 +3.5% 0.19069 +1.7% 0.1199 +2.5% 0.1908 +5% 0.1435 +2%
BM25 (-title) 0.07031 -2.8% 0.17957 -4.2% 0.1092 -6.6% 0.1748 -3.7% 0.1337 -4.8%
BM25 (+stop pairs) 0.07395 +2.1% 0.19134 +2% 0.1204 +2.9% 0.1845 +1.6% 0.1410 +0.3%
BM25 (+spamrank) 0.07131 -1.4% 0.19165 +2.2% 0.1162 -0.6% 0.1857 +2.2% 0.1419 +1%
BM25 (+pagerank) 0.07315 +1% 0.18876 +0.6% 0.1172 +0.1% 0.1851 +1.9% 0.1415 +0.7%
BM25 (-url) 0.07195 -0.5% 0.18510 -1.2% 0.1130 -3.4% 0.1840 +1.3% 0.1372 -2.3%
BM25 0.07241 0.18759 0.1170 0.1817 0.1406
Note: Significant differences from BM25 are given in bold typeface.
—Application of the weighted morphological query expansion.
This experiment was conducted separately for two sets of queries. One set con-tained only 2011 queries and the other set contained a mix of 2011 queries with thefirst 450 MQ-Track queries. Table III contains the results. It shows the absolutevalues of the performance metrics as well as their percent differences from the BM25score (significant differences are given in bold typeface). We also post performanceresults of the bug-fixed baseline method (runs denoted as srchvrs11b).
Let us consider 2011 queries first. It can be seen that improvement in searchperformance (as measured by ERR@20 and NDCG@20) was demonstrated by allsignals except: PageRank; BM25 scores for URL, keywords, and description. Yet,very few improvements were statistically significant. Furthermore, if the Bonferroniadjustment for multiple pairwise comparisons were made [Rice 1989], even fewerresults would remain significant.
· 9
Except for the two proximity scores, none of the other relevance signals sig-nificantly improved over BM25 according to the following performance metrics:ERR@20, NDCG@20, and MAP. Do the low-impact signals in Table III actuallyimprove the performance of our retrieval system? To answer this question, let usexamine the results for the second set of queries, which comprises 2011 queries andMQ-Track queries. As we noted in Section 3.1, MQ-Track relevance judgementsare sparse. However, we compare very similar systems with largely overlapping re-sult sets and similar ranking functions.10 Therefore, we believe that the pruning ofjudgments in MQ-Track queries did not significantly affect our conclusions aboutrelative contributions of relevance signals.11 That said, we consider the resultsof comparisons that involve MQ-Track data only as a clue about performance ofrelevance signals.
It can be seen that for the mix of 2011 and MQ-Track queries, many more resultswere significant. Most of these results would remain valid even after the Bonferroniadjustment. Another observation is that results for both sets of queries were verysimilar. In particular, we can see that both proximity scores as well as the anchortext provided strong relevance signals. Furthermore, taking into account text ofkeywords and description considerably decreased performance in both cases. Thisaligns well with the common knowledge that these fields are abused by spammersand, consequently, many search engines ignore them.
Note the results of the three minor relevance signals – BM25 scores of stoppairs, Wikipedia scores, and morphology – for the mix of 2011 and MQ-Trackqueries. All of them increased ERR@20, but only the application of the Wikipediascores resulted in a statistically significant improvement. At the same time, therun obtained by combining these signals resulted in a significant improvement ofperformance with respect to all performance metrics. Most likely, all three signalscan be used to improve retrieval quality, but we cannot verify this fact using only500 queries.
Note especially the spam rankings. In 2010 experiments, enhancing BM25 withspam rankings increased the value of ERR@20 by 43%. The significance test, how-ever, showed that the respective p-value was 0.031, which was borderline high andwould not remain significant after the Bonferroni correction. In 2011 experiments,there was only a 10% improvement in ERR@20 and this improvement was not sta-tistically significant. In experiments with the mix of 2011 queries and MQ-trackqueries, the use spam rankings slightly decreased ERR@20 (although not signifi-cantly).
Apparently, the effect of spam rankings is not stable and additional experimentsare required to confirm the usefulness of this signal. This example also demonstratesthe importance of large-scale test collections as well the necessity for multiple-comparison adjustments.
10Specifically, there is at least a 70% overlap among the sets of top-k documents returned byBM25 and any BM25 modification tested in this experiment (for k = 10 and k = 100).11Our conjecture was confirmed by a series of simulations in which we randomly eliminated entriesfrom the 2011 qrel file (to mimic the average number of judgments per query in the mix of 2011and MQ-Track queries). In a majority of simulations, the relative performance of methods withrespect to BM25 matched that in Table III, which also conforms with previous research [Bompadaet al. 2007].
10 ·
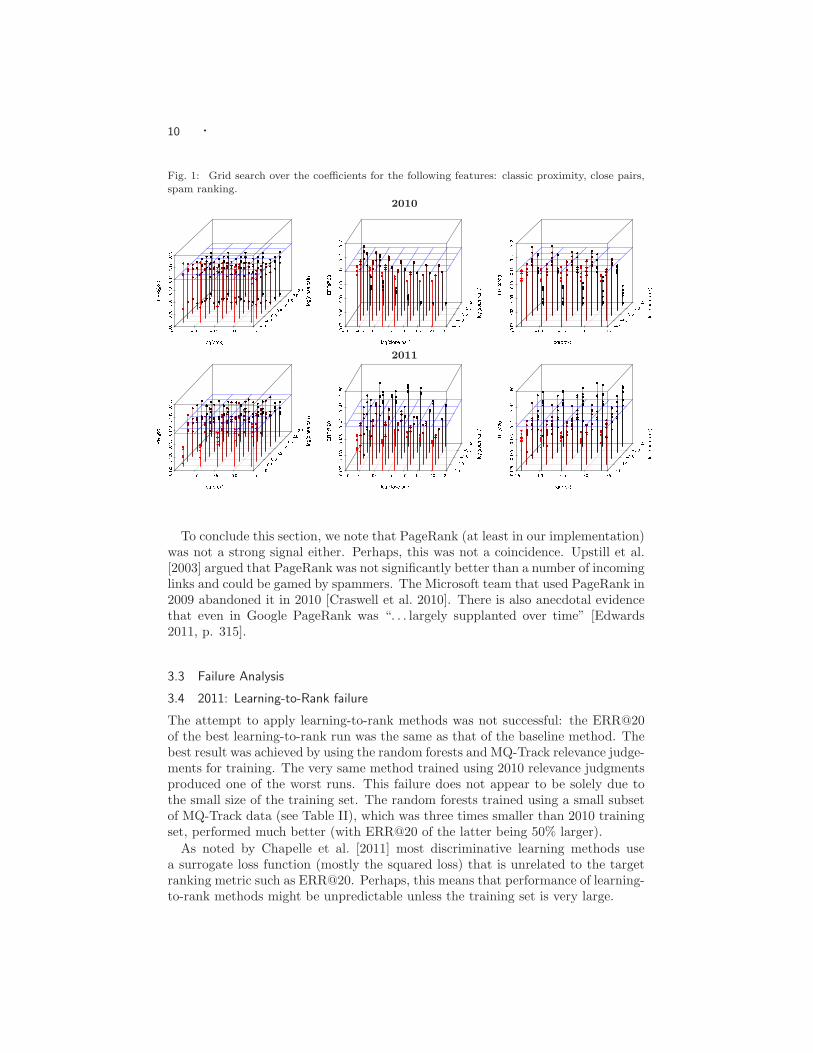
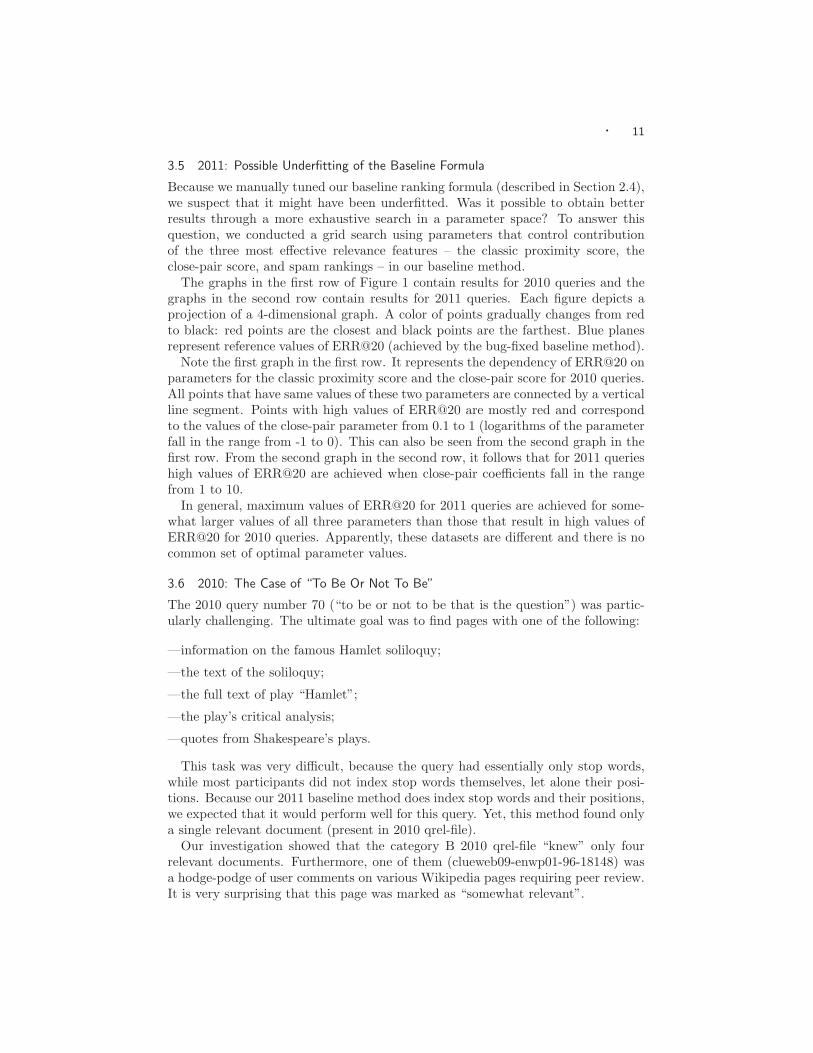
Fig. 1: Grid search over the coefficients for the following features: classic proximity, close pairs,spam ranking.
2010
2011
To conclude this section, we note that PageRank (at least in our implementation)was not a strong signal either. Perhaps, this was not a coincidence. Upstill et al.[2003] argued that PageRank was not significantly better than a number of incominglinks and could be gamed by spammers. The Microsoft team that used PageRank in2009 abandoned it in 2010 [Craswell et al. 2010]. There is also anecdotal evidencethat even in Google PageRank was “. . . largely supplanted over time” [Edwards2011, p. 315].
3.3 Failure Analysis
3.4 2011: Learning-to-Rank failure
The attempt to apply learning-to-rank methods was not successful: the ERR@20of the best learning-to-rank run was the same as that of the baseline method. Thebest result was achieved by using the random forests and MQ-Track relevance judge-ments for training. The very same method trained using 2010 relevance judgmentsproduced one of the worst runs. This failure does not appear to be solely due tothe small size of the training set. The random forests trained using a small subsetof MQ-Track data (see Table II), which was three times smaller than 2010 trainingset, performed much better (with ERR@20 of the latter being 50% larger).
As noted by Chapelle et al. [2011] most discriminative learning methods usea surrogate loss function (mostly the squared loss) that is unrelated to the targetranking metric such as ERR@20. Perhaps, this means that performance of learning-to-rank methods might be unpredictable unless the training set is very large.
· 11
3.5 2011: Possible Underfitting of the Baseline Formula
Because we manually tuned our baseline ranking formula (described in Section 2.4),we suspect that it might have been underfitted. Was it possible to obtain betterresults through a more exhaustive search in a parameter space? To answer thisquestion, we conducted a grid search using parameters that control contributionof the three most effective relevance features – the classic proximity score, theclose-pair score, and spam rankings – in our baseline method.
The graphs in the first row of Figure 1 contain results for 2010 queries and thegraphs in the second row contain results for 2011 queries. Each figure depicts aprojection of a 4-dimensional graph. A color of points gradually changes from redto black: red points are the closest and black points are the farthest. Blue planesrepresent reference values of ERR@20 (achieved by the bug-fixed baseline method).
Note the first graph in the first row. It represents the dependency of ERR@20 onparameters for the classic proximity score and the close-pair score for 2010 queries.All points that have same values of these two parameters are connected by a verticalline segment. Points with high values of ERR@20 are mostly red and correspondto the values of the close-pair parameter from 0.1 to 1 (logarithms of the parameterfall in the range from -1 to 0). This can also be seen from the second graph in thefirst row. From the second graph in the second row, it follows that for 2011 querieshigh values of ERR@20 are achieved when close-pair coefficients fall in the rangefrom 1 to 10.
In general, maximum values of ERR@20 for 2011 queries are achieved for some-what larger values of all three parameters than those that result in high values ofERR@20 for 2010 queries. Apparently, these datasets are different and there is nocommon set of optimal parameter values.
3.6 2010: The Case of “To Be Or Not To Be”
The 2010 query number 70 (“to be or not to be that is the question”) was partic-ularly challenging. The ultimate goal was to find pages with one of the following:
—information on the famous Hamlet soliloquy;
—the text of the soliloquy;
—the full text of play “Hamlet”;
—the play’s critical analysis;
—quotes from Shakespeare’s plays.
This task was very difficult, because the query had essentially only stop words,while most participants did not index stop words themselves, let alone their posi-tions. Because our 2011 baseline method does index stop words and their positions,we expected that it would perform well for this query. Yet, this method found onlya single relevant document (present in 2010 qrel-file).
Our investigation showed that the category B 2010 qrel-file “knew” only fourrelevant documents. Furthermore, one of them (clueweb09-enwp01-96-18148) wasa hodge-podge of user comments on various Wikipedia pages requiring peer review.It is very surprising that this page was marked as “somewhat relevant”.

12 ·
Fig. 2: Query 70: RelevantDocuments
(1) clueweb09-en0000-07-07458
(2) clueweb09-en0000-24-22960
(3) clueweb09-en0007-84-36482
(4) clueweb09-en0009-68-23332
(5) clueweb09-en0011-78-11392
(6) clueweb09-enwp00-93-09674
(7) clueweb09-enwp01-86-02832
(8) clueweb09-enwp02-22-13980
(9) clueweb09-enwp02-25-00811
(10) clueweb09-enwp03-20-03393
On the other hand, our 2011 method man-aged to find ten documents that, in our opin-ion, satisfied the above relevance criteria (seeFigure 2). Documents 1-6 do not duplicateeach other, but only one of them (clueweb09-en0009-68-23332) is present in the official 2010qrel-file.12
The example of query 70 indicates that in-dexing of stop pairs can help to improve thecitation-like queries that contain a lot of stop-words. Our analysis in Section 3.2 confirmedthat stop pairs could improve retrieval perfor-mance of other types of queries as well. Yet,the observed improvement was small and notstatistically significant in our experiments.
4. CONCLUSIONS
Our team experimented with several learning-to-rank methods to improve ourTREC standing. We observed that learning-to-rank methods were very sensitiveto the quality and volume of training data. They did not result in substantialimprovements over the baseline hand-tuned formula. In addition, there was littleinformation available to verify whether a given low-impact relevance signal signifi-cantly improved performance.
It was previously demonstrated that 50 queries (which is typical in a TRECsetting) were sufficient to reliably distinguish among several systems [Zobel 1998;Sanderson and Zobel 2005]. However, our experiments showed that, if differencesamong the systems were small, it might take assessments for hundreds of queriesto achieve this goal.
We conclude our analysis with the following observations:
—The Waterloo spam rankings that worked quite well in 2010, had a much smallerpositive effect in 2011. This effect was not statistically significant with respectto ERR@20 in 2011 and was borderline significant in 2010. We suppose thatadditional experiments are required to confirm the usefulness of Waterloo spamrankings.
—The close-pair proximity score that employs a rectangular kernel function was asgood as the proximity score that employed the classic proximity function. Thisfinding agrees well with our last year observations [Boytsov and Belova 2010] aswell as with the results of He et al. [2011], who conclude that “. . . given a rea-sonable threshold of the window size, simply counting the number of windowscontaining the n-gram terms is reliable enough for ad hoc retrieval.” It is note-worthy, however, that He et al. [2011] achieved a much smaller improvement overBM25 for the ClueWeb09 collection than we did (about 1% or less compared to
12It is not clear, however, if these pages were not assessed, because most stop words were notindexed, or because they were never ranked sufficiently high and, therefore, did not contribute tothe pool of relevant documents.
· 13
6-12% in our setting).
—Based on our experiments in 2010 and 2011, we also concluded that indexingof frequent close word pairs (including stop pairs) can speed up evaluation ofproximity scores. However, the resulting index can be rather large: 200-300% ofthe text size (unless this index is pruned). It maybe infeasible to store a hugebigram index in the main memory (during retrieval time). A better solution isto rely on solid state drives, which are already capable of bulk read speeds in theorder of gigabytes per second.13
ACKNOWLEDGMENTS
We thank Evangelos Kanoulas for references and the discussion on robustness ofperformance measures in the case of incomplete relevance judgements.
REFERENCES
Bompada, T., Chang, C.-C., Chen, J., Kumar, R., and Shenoy, R. 2007. On the robustness ofrelevance measures with incomplete judgments. In Proceedings of the 30th annual internationalACM SIGIR conference on Research and development in information retrieval. SIGIR ’07.ACM, New York, NY, USA, 359–366.
Boytsov, L. and Belova, A. 2010. Lessons learned from indexing close word pairs. In TREC-19:Proceedings of the Nineteenth Text REtrieval Conference.
Brin, S. and Page, L. 1998. The anatomy of a large-scale hypertextual Web search engine. Com-puter Networks and ISDN Systems 30, 17, 107 – 117. Proceedings of the Seventh InternationalWorld Wide Web Conference.
Carterette, B., Pavluy, V., Fangz, H., and Kanoulas, E. 2009. Million query track 2009overview. In TREC-18: Proceedings of the Eighteenth Text REtrieval Conference.
Chapelle, O. and Chang, Y. 2011. Yahoo! learning to rank challenge overview. In JMLR:Workshop and Conference Proceedings. Vol. 14. 1–24.
Chapelle, O., Chang, Y., and Liu, T.-Y. 2011. Future directions in learning to rank. In JMLR:Workshop and Conference Proceedings. Vol. 14. 91–100.
Chapelle, O., Metlzer, D., Zhang, Y., and Grinspan, P. 2009. Expected reciprocal rank forgraded relevance. In Proceeding of the 18th ACM conference on Information and knowledgemanagement. CIKM ’09. ACM, New York, NY, USA, 621–630.
Cormack, G. V., Smucker, M. D., and Clarke, C. L. A. 2010. Efficient and effective spamfiltering and re-ranking for large Web datasets. CoRR abs/1004.5168.
Craswell, N., Fetterly, D., and Najork, M. 2010. Microsoft research at TREC 2010Web Track. In TREC-19: Proceedings of the Nineteenth Text REtrieval Conference.
Cummins, R. and O’Riordan, C. 2009. Learning in a pairwise term-term proximity frameworkfor information retrieval. In Proceedings of the 32nd international ACM SIGIR conference onResearch and development in information retrieval. SIGIR ’09. ACM, New York, NY, USA,251–258.
Edwards, D. 2011. I’m Feeling Lucky: The Confessions of Google Employee Number 59 , Noneed. Houghton Mifflin Harcourt.
Elsayed, T., Asadi, N., Metzler, D., Wang, L., and Lin, J. 2010. UMD and USC/ISI: TREC2010 Web Track experiments with Ivory. In TREC-19: Proceedings of the Nineteenth TextREtrieval Conference.
Fan, R.-E., Chang, K.-W., Hsieh, C.-J., Wang, X.-R., and Lin, C.-J. 2008. LIBLINEAR: Alibrary for large linear classification (machine learning open source software paper). Journal ofMachine Learning Research 9, 1871–1874.
13See, e.g., http://www.storagesearch.com/ssd-fastest.html

14 ·
He, B., Huang, J. X., and Zhou, X. 2011. Modeling term proximity for probabilistic informationretrieval models. Information Sciences 181, 14, 3017 – 3031.
Joachims, T. 2002. Optimizing search engines using clickthrough data. In Proceedings of theeighth ACM SIGKDD international conference on Knowledge discovery and data mining. KDD’02. ACM, New York, NY, USA, 133–142.
Joachims, T. 2006. Training linear SVMs in linear time. In Proceedings of the 12th ACMSIGKDD international conference on Knowledge discovery and data mining. KDD ’06. ACM,New York, NY, USA, 217–226.
Liu, T.-Y. 2009. Learning to rank for information retrieval. Found. Trends Inf. Retr. 3, 225–331.
Metzler, D. and Croft, W. B. 2005. A markov random field model for term dependencies. InProceedings of the 28th annual international ACM SIGIR conference on Research and devel-opment in information retrieval. SIGIR ’05. ACM, New York, NY, USA, 472–479.
Mohan, A., Chen, Z., and Weinberger, K. Q. 2011. Web-search ranking with initialized gradi-ent boosted regression trees. Journal of Machine Learning Research, Workshop and ConferenceProceedings 14, 77–89.
Rice, W. R. 1989. Analyzing tables of statistical tests. Evolution 43, 1, 223–225.
Robertson, S. 2004. Understanding inverse document frequency: On theoretical arguments forIDF. Journal of Documentation 60, 503–520.
Sanderson, M. and Zobel, J. 2005. Information retrieval system evaluation: effort, sensitivity,and reliability. In Proceedings of the 28th annual international ACM SIGIR conference onResearch and development in information retrieval. SIGIR ’05. ACM, New York, NY, USA,162–169.
Smucker, M. D., Allan, J., and Carterette, B. 2007. A comparison of statistical significancetests for information retrieval evaluation. In Proceedings of the sixteenth ACM conference onConference on information and knowledge management. CIKM ’07. ACM, New York, NY,USA, 623–632.
Tao, T. and Zhai, C. 2007. An exploration of proximity measures in information retrieval. InSIGIR ’07: Proceedings of the 30th annual international ACM SIGIR conference on Researchand development in information retrieval. ACM, New York, NY, USA, 295–302.
Upstill, T., Craswell, N., and Hawking, D. 2003. Predicting fame and fortune: PageRank orindegree? In Proceedings of the Australasian Document Computing Symposium, ADCS2003.Canberra, Australia, 31–40.
Zobel, J. 1998. How reliable are the results of large-scale information retrieval experiments? InProceedings of the 21st annual international ACM SIGIR conference on Research and devel-opment in information retrieval. SIGIR ’98. ACM, New York, NY, USA, 307–314.


