Evaluating Kenya’s - iyfnet.org · Evaluating Kenya’s Ninaweza Program VOLUME 2: Appendices...
26
GLOBAL PARTNERSHIP FOR YOUTH EMPLOYMENT TESTING WHAT WORKS in YOUTH EMPLOYMENT: Evaluating Kenya’s Ninaweza Program VOLUME 2: Appendices APRIL 2013
Transcript of Evaluating Kenya’s - iyfnet.org · Evaluating Kenya’s Ninaweza Program VOLUME 2: Appendices...

GLOBAL PARTNERSHIPFOR YOUTH EMPLOYMENT
TesTing WhaT Works in YouTh emploYmenT:
Evaluating Kenya’s Ninaweza Program
VOLUME 2: AppendicesAPRIL 2013

The International Youth Foundation (IYF) invests in the extraordinary potential of young people. Founded in 1990, IYF
builds and maintains a worldwide community of businesses, governments, and civil-society organizations committed to
empowering youth to be healthy, productive, and engaged citizens. IYF programs are catalysts of change that help young people
obtain a quality education, gain employability skills, make healthy choices, and improve their communities. To learn more, visit
www.iyfnet.org.
The World Bank supports governments in developing countries on a wide range of child and youth development issues,
including youth employment, by conducting research, financing projects and supporting rigorous evaluation. Learn more at
www.worldbank.org/childrenandyouth.
about gpye
acknowledgements
With support from the World Bank Development Grant Facility, in 2008 the International Youth Foundation, the Youth
Employment Network, the Arab Urban Development Institute, and the Understanding Children’s Work Project joined
together to form the Global Partnership for Youth Employment (GPYE). Its goal: to build and disseminate evidence on
youth employment outcomes and effective programs to help address the challenges facing young people in their transition
to work. The GPYE leverages the technical and regional experience of its five partner organizations in youth employment
research, programming, evaluation, and policy dialogue. The partnership’s work focuses on Africa and the Middle East, regions
in need of better evidence on effective approaches to youth employment. This report is one in a series of assessments, research
studies, technical guides, and learning papers produced by the GPYE to build the evidence base for improving policies,
program design, and practices related to youth employability in the region. These resources can be accessed at www.gpye.org.
This report was prepared for IYF by Thomaz Alvares de Azevedo, Jeff Davis and Munene Charles of School-to-School
International (STS). IYF thanks STS for its dedicated work on the impact evaluation of the Ninaweza program and
acknowledges the efforts of both its international staff and Nairobi-based teams.
IYF would also like to recognize the work of its local implementing partner, African Center for Women and Information
Communication (ACWICT), and thank them for their commitment to the Ninaweza program and for their collaboration with
the local evaluation team.
Finally, we would like to thank the young women of Nairobi, Kenya who participated in the training program and collaborated
with the evaluation efforts. We recognize and applaud their success!

TABLE OF CONTENTS
APPENDICES .............................................................................................................................. 2 Appendix 1: Training Content ............................................................................................................................... 2 Appendix 2: Description of the Data Collection for Each Cohort ................................................................. 5 Appendix 3: Lessons Learned from the Data Collection .................................................................................. 9 Appendix 4: Internal Consistency of the Tests ................................................................................................ 11 Appendix 5: Difficulty and Discrimination of the Tests per Item ................................................................ 12 Appendix 6: Model for Measuring Impact of the Training ........................................................................... 18 Appendix 7: Models for Measuring Impact of the Program ......................................................................... 19 Appendix 8: M&E Tally on Employment Status ............................................................................................. 20 Appendix 9: Participants’ Support ...................................................................................................................... 21

2
APPENDICES Appendix 1: Training Content ICT Implementer: The African Centre for Women, information and Communications Technology Duration: 150 hours. Objectives: The ICT training is designed to develop technical skills in IT, digital media and web design. Computer Fundamentals (10 hours) Source of Curriculum: Microsoft unlimited potential
• Introduction to Computers Computer Hardware and Software
• Touring Microsoft XP Professional • Managing Files and folders • Exploring the web • Finding and Managing Information
I.T. Essentials – PC Hardware and Software (90 hours) Source of Curriculum: Cisco Networking Academy
• Introduction to the Personal Computer • Safe Lab Procedures and Tool Use • Computer Assembly-Step by Step • Basics of Preventive maintenance and Troubleshooting • Fundamentals of Operating Systems • Fundamentals of Laptops and Portable Devices • Fundamental Printers and Scanners • Fundamental Networks • Fundamental Security • Communication Skills • Advanced Personal Computers • Advanced Operating Systems • Advanced Laptops and Portable Devices • Advanced Printers and Scanners • Advanced Networks • Advanced Securities
Digital Media and Web Design Fundamentals (50 hours) Source of Curriculum: Microsoft unlimited potential
• Managing Music with Music Media player • Introduction to Digital Photography • Knowing and choosing your Camera

3
• Getting started with pictures • Out of the Camera and into the computer • Basic picture editing using MS Picture Manager • Techniques for fixing common flaws • Sharing your digital Photos • Making, Editing and Sharing Digital Videos • Movies with Windows Movies Maker • Planning how to start designing a website • Creating and using Pictures on the Web • Demystifying and using Basic HTML tags • Sending your websites into the real World
Life skills Source of Curriculum: I LIFE-WORK Training Manual Implementer: The African Centre for Women, information and Communications Technology Duration: 40 hours. Objectives: The life-skills training is designed to develop specific skills and knowledge.
By the end of module 1, life skills for everyday life, trainees will be able to: 1. Define the concept of emotional intelligence and use that as a conceptual framework to assess
and then describe their own level of emotional intelligence 2. Define the concept of motivation, describe the different forms of motivators which exist, and
understand the impact of motivation on their life and work. 3. Identify the main forms of human communication, explain the differences between those forms,
and the risks associated with each form, and use that to interpret their own communication actions.
4. Define the concept of cooperation and competition, understand the differences between them, identify their own cooperative and competitive acts and intents, and use that to explain how they interact with other people
By the end of module 2, life skills for employability, the trainee will be able to: 5. Define the concept of work, understand how the concept of work is changing, and link that to
their own life to identify what work they do now, what work they want to do, and what work they can do.
6. Apply their understanding of the concepts of cooperation and competition to analyze their current mode of working, individually and as a member of a team, and identify which mode of working is suitable for attaining a specific goal
7. Explain the concepts of worker, and of self-employed / entrepreneur, and the differences between them, and link that to their own life to identify whether they would choose to be a worker or an entrepreneur, and justify their choice with reasons.
8. Understand what a team is, explain how a team functions, and apply that to assess, interpret, and describe their own performance in a team-work task.

4
Module 1: Skills for everyday life Lesson 1: Orientation (60 minutes) Lesson 2: Defining life skills (60 minutes) Lesson 3: Emotions and Emotional control (90 minutes) Lesson 4: Life skills for taking good care of yourself (60 minutes) Lesson 5: Life skills for making good decisions (60 minutes) Lesson 6: Life skills for having good relationships (60 minutes) Lesson 7: Listening (120 minutes) Lesson 8: Motivation (120 minutes) Lesson 9: Personal feedback (90 minutes) Lesson 10: Body language (120 minutes) Lesson 11: Personal Planning (90 minutes) Lesson 12: Setting my Goals (90 minutes) Lesson 13: My self-assessment (60 minutes)
Module 2: Skills for the World of Work
Lesson 14: What work is work (60 minutes) Lesson 15: My first job (60 minutes) Lesson 16: Winds of change (90 minutes) Lesson 17: Workplace ethics (120 minutes) Lesson 18: Crime in the workplace (60 minutes) Lesson 19: Working for money (120 minutes) Lesson 20: Listening and communicating in the workplace (120 minutes) Lesson 21: Team work (60 minutes) Lesson 22: Me and my ideal job (120 minutes) Lesson 23: Job-searching (120 minutes) Lesson 24: Job interviews (120 minutes) Lesson 25: What employers want (60 minutes) Lesson 26: Get a CV (120 minutes) Lesson 27: My self-assessment (60 minutes)

5
Appendix 2: Description of the Data Collection for Each Cohort Cohort 1 The administration of the baseline took place from March 31st to April 10th, 2011. On March 31st, participants were invited to an orientation event. At the event, participants answered the baseline and were notified which group they were assigned and were told how the randomization occurred. This generated some distress and it was decided that in later rounds that it would be better to collect data for treatment and control in separate orientations. Participants who failed to attend the event were invited to another session during the week of April 4th. As a result of an initial turnout that was lower than expected even among the replacement group, participants originally assigned to the treatment group in Cohort 2 were invited to join Cohort 1 and attend a baseline session prior to the start of the training on April 11th, 2011. After this experience, random assignment was done only after data collection had been completed for the previous cohort. One of the main challenges was to turn applicants into participants. Of the 510 applicants invited to participate in the study, only 221 attended an orientation session and answered the baseline data collection. The administration of the Cohort 1 mid-line took place from June 14th to July 2nd, 2011. To begin the mid-line process during the week of June 6th, the data enumerators called all Cohort 1 control participants to inform them of the day, time and location of their mid-line. The control participants also received a text message two days before the date. The enumerators recorded their communication with all control participants in a tracker and used it to determine who required an additional call on the day of the mid-line. To improve retention of control participants, the mid-lines were conducted in venues close to the informal settlements. This reduced the distances that the young women had to travel. The treatment participants were administered the mid-line on the final day of their training in the training rooms at ACWICT. The experience with the administration of the mid-line suggested that the number of participants completing mid-line could be bolstered if more time, preferably two weeks instead of two days be allotted for mid-line test administration. A security problem occurred during the data collection in Kibera, when the field team and ACWICT staff were targeted by robbers. After this, the team hired a police escort during the visits to the informal settlements. In addition to hiring an escort, it was recommended that vehicles used during the visits not be repeated so that it creates an extra obstacle for the robbers to identify and target the evaluation and program staff. The administration of the end-line took place between February 6th and April 2nd, 2012. Treatment group participants were interviewed in ACWICT’s office and Control group participants were interviewed in the informal settlements where they live or in the STS’ evaluation coordinator’s office in Nairobi. For the employer focus group discussions (FGDs), only nine out of 30 employers invited for the focus group attended the discussion. While some internship employers mentioned that they were not able to attend due to other commitments, others reported that they did not think participating in a focus group would be a good use of their time. STS decided to replace the FGDs with individual interviews in the later cohorts in which internship employers would be consulted (cohorts 3 and 5). This was motivated by two reasons: Logistically, it would add more flexibility for scheduling purposes, which might result in an increased number of respondents. And technically, it would provide the participants with an environment more conducive for sharing specific ideas and concerns about the quality of the

6
work done by the Ninaweza interns.
Cohort 2 The administration of the baseline for Cohort 2 took place from June 20th to June 24th, 2011. In line with lessons learned from Cohort 1, separate orientation events were hosted for treatment and control groups. A total of 264 applicants attended the orientation. Among the 133 assigned to the treatment, only 103 would actually join the program. During the analysis of the data from Cohorts 1 and 2 it was found that a few people from other nationalities than Kenya had been accepted in the program, as well as some people who had not completed their secondary education. ACWICT agreed to improve the screening process for later cohorts. The administration of the mid-line took place from August 17th to September 30th, 2011. The same procedures as in Cohort 1 were used to maximize retention. A total of 51 control participants completed the mid-line during the meeting at the venue in the informal settlement. To increase the number of control participants, the enumerators called those who did not attend the first round to inform them of a second round to be administered at a time suitable for them either at ACWICT or the evaluation coordinators office in downtown Nairobi. The administration of the end-line took place between April 10th and June 30th, 2012. Graduation for this cohort was celebrated before the end-line data collection. During graduation, participants received their certificates and this might have jeopardized their motivation to return to ACWICT’s office during the scheduled rounds of end-line data collection. In the subsequent cohorts the end-line data collection was done before participants received their certificates.
Cohort 3 The administration of the baseline for Cohort 3 took place from August 22nd to August 29th 2011. The adjustments made to the administration of the baseline following Cohorts 1 and 2 included asking applicants to provide proof of their Kenyan citizenship and secondary school graduation. It is noteworthy that more applicants in Cohort 3 submitted their applications at the ACWICT office than in previous cohorts, where most applied with the community mobilizer in the informal settlement. Turning applicants into participants was once again challenging. After contacting about 513 applicants for the orientation session, only 179 showed up. It was decided that more flexibility should be introduced to the application process and the orientation sessions were offered at several times throughout one week. The start of the training was also postponed to allow for more applicants to complete the baseline survey. Therefore the orientation closed on the 29th of August 2011 and training commenced on the 30th of August 2011. Applicants that attended the orientation session mentioned the costs of transportation and other domestic responsibilities as the main reasons why they thought others might not have attended. Several also noted that word had gotten out that there are applicants that are called and not trained (i.e., the randomized assignment), which seem to have made a number of them lose interest. The administration of the mid-line took place from October 31st to November 30th 2011. The participants in the treatment group completed the mid-line surveys on the final day of their training in the training rooms at ACWICT, and those that missed it completed on the week of November 7th. The preparations for the mid-line data collection for those in the control group started on October 24th. Despite the same precautions being taken to maintain retention as in the previous cohorts, only 24

7
control group participants completed the mid-line at the original appointment. To increase the number of control participants, the enumerators called those who did not attend the first round to arrange for a meeting at the evaluation coordinator’s office in downtown Nairobi and a few control group participants had the tools administered to them at their workplace by the data enumerators. The administration of the end-line took place between June 18th and August 25th, 2012.
Cohort 4 The administration of the baseline for Cohort 4 took place between November 7th and November 14th 2011. Persuading applicants to become participants continued to be a challenge. Among the almost 500 applicants that were invited for the orientation, only 209 showed up. The orientation was completed on November 14th and classes started on November 15th. Follow-up phone calls with those that failed to show up at the orientation sessions indicated that the costs of transportation, bad weather and domestic emergencies were the most common reasons for the absence. A few mentioned losing interest after hearing that they could be placed in a group that would not receive the training. The administration of the Cohort 4 mid-line took place from January 26th to February 29th, 2012. The participants in the treatment group completed the mid-line surveys on the final day of their training in the training rooms at ACWICT, and those that missed it completed the surveys at ACWICT the week of January 31, 2012. Despite the same precautions taken in previous cohorts to maximize retention, only 25 control participants completed the mid-line at the venue in the informal settlement. To increase the number of control participants, the enumerator team called those who did not attend the first appointment to arrange for a meeting at the Evaluation Coordinator’s office in downtown Nairobi or at their workplace. The administration of the end-line took place between September13th and October 26th, 2012. Treatment group participants were interviewed in ACWICT’s office and Control group participants were interviewed in the informal settlements where they live, i.e., either in the STS’ evaluation coordinator’s office in Nairobi or at their workplace.
Cohort 5 The administration of the baseline for Cohort 5 took place from January 30th to February 6th 2012. The same challenge persisted with turning applicants into participants. After contacting about 420 applicants to invite them for the orientation exercise, only 181 showed up. The orientation closed on the 6th of February 2012 and training commenced on the same day. Follow-up calls with those that failed to attend the orientation session revealed that again costs of transportation and other domestic responsibilities were the main reasons for absence. Applicants mentioned again losing interest after being informed that, despite the invitation, some were not trained. The administration of the Cohort 5 mid-line took place between April 12th and May 28th. The participants in the treatment group completed the mid-line surveys on the final day of their training in the training rooms at ACWICT, and those that missed it completed the surveys at ACWICT in the week of May 23rd. Despite the same precautions being taken to maximize retention as in previous cohorts, only 30 control participants completed the mid-line at the venue in the informal settlement. To increase the number of control participants, the enumerator team called those who did not attend the first

8
appointment to arrange for a meeting at the Evaluation Coordinator’s office in downtown Nairobi or at their workplace. The administration of the end-line took place between from November 26th and December 22nd, 2012.
Cohort 6 The administration of the baseline for Cohort 6 took place between April 16th and 20th 2012. Persuading applicants to become participants was again a challenge. Only 255 people qualified as applicants and among those only 100 came to the first meeting of the week. This prompted further follow-ups. The orientation was completed on April 20th and classes started on April 23rd. The administration of the Cohort 6 mid-line took place from June 11th to July 31st 2012. The participants in the treatment group completed the mid-line surveys on the final day of their training in the training rooms at ACWICT, and those that missed it completed the surveys at ACWICT in the week of June 18th. Despite the same precautions being taken as in previous cohorts, only 23 control participants completed the mid-line at the venue in the informal settlement. To increase the number of control participants, the enumerator team called those who did not attend the first appointment to arrange for a meeting at the Evaluation Coordinator’s office in downtown Nairobi or at their workplace. The administration of the end-line took place between February11th and 28th, 2013. The data collection benefited from the graduation of the last cohort, which was celebrated with a party. Data collection was conducted before the celebration. The timeframe was compressed because data collection was scheduled to be complete before March’s general election for local representatives and president.

9
Appendix 3: Lessons Learned from the Data Collection At the end of each round of data collection, STS discussed challenges faced during data collection with the in-country Evaluation Coordinator. The following list summarizes the lessons learned from baseline, mid-line, and end-line. These lessons were used to: Improve the assessment administration process in subsequent cohorts and; provide additional context for the evaluation. Among the changes made during data collection was the introduction of travel stipends for treatment group participants. M&E data from the implementing partner shows how many treatment participants received travel support: 6 in Cohort 4; 25 in Cohort 5 and; 34 in Cohort 6. Baseline:
Dates Cohort Comments
31 Mar 11 10 Apr 11 C1
• Separating the orientation of the Treatment and Control groups. The experience from the orientation of Cohort 1 was that the control group was disappointed not to have been selected, and it was more difficult for them since they sat next to those participants who were selected. Furthermore, handling a smaller group of less than 20 participants in the orientation would be more effective than with a group of 60+ participants.
• Several attendants said they would not have shown up for the orientation had they known they were assigned to be in the Control group. This highlights the importance of not leaking assignment to participants before the orientation session during which baseline data is collected.
• The practical demonstration of the randomization process was important in convincing the participants that there was no favoritism in placing them in either the Control or Treatment group.
• Attendants said they would like if the registration period was be extended. • Difficulty in having those that applied to the program attending the orientation session. In order to
maximize number of applicants for each cohorts, random assignment to be made cohort by cohort instead of into three phases of two cohorts at the same time.
• Not all that were assigned to the treatment actually joined the program.
20 Jun 11 24 Jun 11 C2
• To prevent that the same person applies more than once, it is recommended that all applicants attach a copy of their identity card (or other identification document for those without identity cards).
22Aug 11 29 Aug 11 C3
• It may be advisable to further open up the orientation schedules after the first two days. As opposed to inviting applicants on a specific day and time when they may not be available, they could just be asked to report to ACWICT, any time within the orientation week. This may accommodate people who otherwise turn down the offer because they have been invited to attend the orientation on a day and time that they are not available.
• Applicants claimed that transportation costs were a main deterrent for attending the orientation session.
07Nov 11 14Nov 12 C4
• In case applicants continue to seek the ACWICT office to fill the application forms, it may be necessary that a new mechanism be created to ensure that all applicants receive all the relevant information about the program prior to completing the application process, such as assigning an officer at ACWICT to be in charge of the applications. This would be a similar mechanism to the one used for those recruited by community mobilizers.
• Transportation costs continue to deter participation in the program. This, compounded with increased food prices in the last couple of months, has taken a toll on the financial means necessary for many young women to participate in the program. Alternative ways for mitigating dropout and bolstering recruitment are being considered.
• Control group participants demanded that they receive training after their respective cohort completed the program.
30Jan 12 06Feb 12 C5
• The control participants continued to ask how the program benefits them directly. Though they seemed to understand the program, they remained disappointed that they will not receive any training or job placement services.
• The increase in cash reimbursement for the control participants was welcomed and it is hoped that this will reduce the dropout rate on the cohort 5 mid-line.
• Having a one-week open period for the orientation worked well in increasing the numbers showing up for the orientation.
• Applicants attending the orientation session had been properly informed during registration. This is the first cohort in which applicants demonstrate a solid understanding that some of them will get assigned to a control group that won’t receive the training.
16Apr 12 20Apr 12 C6
• Several applicants mentioned that word had gone around that there were people who never get training. Discussions with the program were held about whether compensation for the control group participants would be helpful in reducing the discontent (e.g., transportation cost, alumni

10
Dates Cohort Comments packet, etc.).
• Some applicants mentioned that they had heard of the graduation ceremony and were curious to know if control participants would also get any certificates. This suggests that the graduation ceremony had an impact in elevating the credibility of the program.
• Most applicants had been refereed by previous program participants. Mid-line:
Dates Cohort Comments
14Jun 11 02Jul 11 C1
Attrition from the baseline to the end-line, especially among Control group. Need to devise ways to emphasize the importance of not dropping out in case they are assigned to the Control group. Furthermore, the experience with the administration of the mid-line suggests that the number of participants completing the mid-line tests could be bolstered if more time, preferably two weeks instead of two days be allotted for test administration. During the data collection in Kibera, the field team and ACWICT staff were targeted by robbers. Need to hire police escort during the visits to the informal settlements. In addition to hiring an escort, it is recommended that vehicles used during the visits not be repeated so that it creates an extra obstacle for the robbers to identify and target the evaluation and program staff.
17Aug 11 30Sep 11 C2
It is advisable to provide additional support to the control participants throughout or at the completion of the program. This is in light of continued frustration and disappointment on the part of the young women in the control group for not receiving the same training as their friends in the treatment groups. For instance, the young women in the control group could receive a form of training at the completion of the project. The mid-line administration process will continue to include multiple opportunities for the young women to participate in the data collection. This should ensure that as many young women as possible will complete the mid-line and thus address the needs of the young women considering that many of them are engaged in different forms of activities which often conflict with the mid-line schedule.
31Oct11 30Nov11 C3
Job and other domestic commitments continued to pull away girls from the program. Many of the treatment group participants reported that after the start of the program they were offered jobs away from the city, which posed logistical challenges in staying in the program. Control group participants that took the mid-line were optimistic that they would be receiving some support, in training and job placement, at the end of the program. Virtually all of the control group participants who completed the mid-line survey shared this expectation. A substantial number of participants reported that the cash reimbursements intended to cover transportation costs were too low.
26Jan 12 29Feb 12 C4
The increase in cash incentive for the control participants was well received. Most were appreciative and in certain cases it seemed to contribute to an increase in the number of mid-line control participants.
26 Nov 12 22 Dec 12 C5 No comments
11 Jun 12 31Jul 12 C6 No comments
End-line:
Dates Cohort Comments
06 Feb 12 02 Apr 12 C1
Low participation of employers on the focus group discussions with internship employers. STS decided to replace FGDs with individual interviews for the future cohorts (cohorts 1, 3 and 5).This would add more flexibility for scheduling purposes, which might result in an increased number of respondents, and would provide the participants with an environment more conducing for sharing more specific ideas and concerns.
10 Apr 12 30 Jun 12 C2
Low turnout at end-line data collection. Participants mentioned that they were not motivated to return to the training site for the end-line data collection because they had already graduated. In order to mitigate these cases, it was decided that the end-line data collection should be conducted before graduation.
18 Jun 12 25 Aug 12 C3 No comments
13 Sep 12 26 Oct 12 C4 No comments
26 Nov 12 22 Dec 12 C5 No comments
11 Feb 13 28 Feb 13 C6 No comments

11
Appendix 4: Internal Consistency of the Tests ICT
Pre- Post-
Sample Size
Number of Items
Cronbach’s Alpha Sample
Size Number of Items
Cronbach’s Alpha
C1 221 45 0.81 157 45 0.82 C2 264 45 0.80 168 45 0.80 C3 177 45 0.82 122 45 0.84 C4 209 45 0.81 154 45 0.84 C5 181 45 0.76 118 45 0.80 C6 178 45 0.72 124 45 0.80 Life skills
Pre- Post-
Sample Size
Number of Items
Cronbach’s Alpha Sample
Size Number of Items
Cronbach’s Alpha
C1 221 41 0.67 157 41 0.62 C2 264 41 0.74 168 41 0.72 C3 177 41 0.75 122 41 0.72 C4 209 41 0.74 154 41 0.74 C5 181 41 0.72 118 41 0.76 C6 178 41 0.56 124 41 0.68

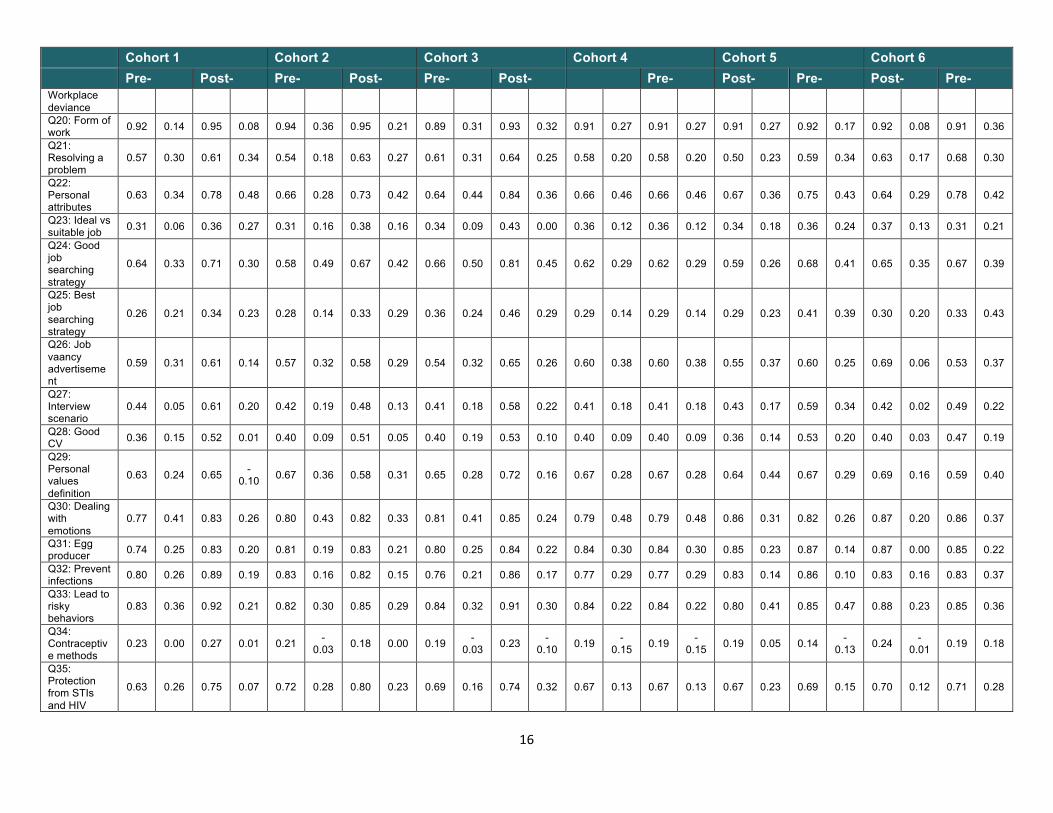
Appendix 5: Difficulty and Discrimination of the Tests per Item ICT
Cohort 1 Cohort 2 Cohort 3 Cohort 4 Cohort 5 Cohort 6 Pre- Post- Pre- Post- Pre- Post- Pre- Post- Pre- Post- Pre- Post- Item PCo
r Pbis PCor Pbis PCo
r Pbis PCor Pbis PCo
r Pbis PCor Pbis PCo
r Pbis PCor Pbis PCo
r Pbis PCor Pbis PCo
r Pbis PCor Pbis
Q1: Start button 0.07 0.06 0.06 -
0.02 0.08 0.06 0.07 -0.15 0.07 -
0.05 0.05 -0.07 0.03 0.00 0.03 0.00 0.06 -
0.10 0.02 -0.08 0.12 -
0.06 0.05 -0.16
Q2: File 0.57 0.36 0.79 0.28 0.60 0.27 0.80 0.37 0.61 0.35 0.80 0.35 0.54 0.29 0.54 0.29 0.59 0.24 0.70 0.34 0.57 0.22 0.73 0.16 Q3: Button to paste text 0.29 0.22 0.41 0.13 0.28 0.22 0.40 0.10 0.27 0.27 0.38 0.18 0.35 0.28 0.35 0.28 0.38 0.17 0.32 0.04 0.28 0.19 0.37 -
0.02 Q4:Program to write a letter 0.66 0.44 0.89 0.45 0.68 0.44 0.88 0.21 0.69 0.34 0.85 0.36 0.74 0.38 0.74 0.38 0.71 0.32 0.81 0.22 0.69 0.32 0.86 0.25
Q5: Time 0.76 0.43 0.93 0.29 0.85 0.28 0.95 0.15 0.84 0.25 0.91 0.43 0.76 0.39 0.76 0.39 0.80 0.22 0.96 0.22 0.75 0.41 0.90 0.34 Q6: Highlight a word 0.28 0.23 0.41 0.12 0.26 0.11 0.37 0.23 0.27 0.30 0.43 0.16 0.28 0.14 0.28 0.14 0.25 0.10 0.44 0.24 0.28 0.09 0.30 -
0.01 Q7: Menu in word 0.61 0.37 0.73 0.23 0.67 0.31 0.83 0.26 0.63 0.29 0.75 0.21 0.65 0.41 0.65 0.41 0.67 0.25 0.74 0.32 0.64 0.29 0.70 0.09
Q8: Delete a document 0.43 0.29 0.64 0.41 0.47 0.30 0.63 0.37 0.49 0.36 0.65 0.46 0.47 0.34 0.47 0.34 0.49 0.32 0.57 0.28 0.48 0.27 0.49 0.35
Q9: Input device 0.33 0.29 0.57 0.48 0.33 0.31 0.58 0.44 0.39 0.44 0.61 0.43 0.30 0.38 0.30 0.38 0.39 0.30 0.58 0.51 0.30 0.34 0.69 0.50
Q10: Modifiable Computer Memory
0.31 0.25 0.46 0.26 0.27 0.27 0.43 0.17 0.34 0.35 0.56 0.36 0.23 0.22 0.23 0.22 0.25 0.34 0.44 0.39 0.28 0.29 0.58 0.38
Q11: Device for data storage
0.38 0.33 0.71 0.50 0.45 0.38 0.69 0.43 0.45 0.34 0.71 0.47 0.43 0.46 0.43 0.46 0.44 0.29 0.69 0.39 0.38 0.27 0.75 0.47
Q12: Internet hardware 0.26 0.23 0.58 0.62 0.21 0.26 0.58 0.50 0.30 0.27 0.69 0.54 0.29 0.36 0.29 0.36 0.28 0.24 0.50 0.37 0.34 0.12 0.69 0.51
Q13: Output device 0.32 0.32 0.64 0.50 0.29 0.31 0.60 0.51 0.33 0.48 0.60 0.44 0.30 0.46 0.30 0.46 0.33 0.32 0.64 0.60 0.28 0.36 0.75 0.43
Q14: SATA cable 0.23 0.15 0.36 0.15 0.27 0.18 0.36 0.22 0.21 0.05 0.43 0.32 0.24 0.14 0.24 0.14 0.32 0.12 0.60 0.50 0.35 0.10 0.70 0.37
Q15: Device shown scanner
0.36 0.10 0.39 0.22 0.40 0.13 0.53 0.17 0.41 0.19 0.45 0.25 0.30 -0.03 0.30 -
0.03 0.43 0.14 0.45 0.12 0.52 0.13 0.26 0.02
Q16: Device shown laptop 0.49 0.09 0.42 0.01 0.41 0.05 0.49 -
0.02 0.43 0.03 0.50 0.16 0.28 0.07 0.28 0.07 0.46 0.02 0.47 -0.03 0.53 0.09 0.28 0.16
Q17: Type of monitor 0.33 0.34 0.48 0.41 0.34 0.32 0.57 0.35 0.40 0.32 0.61 0.41 0.34 0.34 0.34 0.34 0.27 0.32 0.47 0.47 0.39 0.16 0.62 0.41
Q18: Data storage device 0.70 0.34 0.89 0.40 0.70 0.38 0.88 0.26 0.74 0.37 0.91 0.34 0.78 0.24 0.78 0.24 0.78 0.27 0.92 0.26 0.75 0.26 0.86 0.47
Q19: Type of printer 0.43 0.31 0.71 0.56 0.41 0.38 0.80 0.43 0.44 0.43 0.79 0.51 0.44 0.38 0.44 0.38 0.44 0.34 0.61 0.68 0.44 0.31 0.74 0.45
Q20: Stores operating system
0.22 0.13 0.40 0.28 0.20 0.24 0.26 0.20 0.22 0.23 0.57 0.36 0.22 0.12 0.22 0.12 0.24 0.17 0.28 0.19 0.22 0.08 0.48 0.30

13
Cohort 1 Cohort 2 Cohort 3 Cohort 4 Cohort 5 Cohort 6 Pre- Post- Pre- Post- Pre- Post- Pre- Post- Pre- Post- Pre- Post- Q21: Interchangeable component
0.36 0.39 0.59 0.46 0.39 0.40 0.61 0.38 0.40 0.40 0.66 0.50 0.39 0.41 0.39 0.41 0.41 0.20 0.56 0.40 0.40 0.30 0.61 0.36
Q22: Protocol not linked to email
0.09 -0.10 0.24 0.23 0.06 -
0.01 0.23 0.12 0.12 -0.13 0.32 0.41 0.06 -
0.07 0.06 -0.07 0.12 -
0.11 0.16 0.27 0.08 -0.10 0.10 -
0.17
Q23: Clean CD 0.64 0.33 0.81 0.41 0.67 0.29 0.80 0.29 0.69 0.33 0.80 0.41 0.66 0.25 0.66 0.25 0.69 0.19 0.86 0.05 0.65 0.23 0.89 0.19
Q24: Aluminum ladder location
0.68 0.31 0.89 0.11 0.70 0.21 0.86 0.16 0.67 0.21 0.83 0.11 0.74 0.20 0.74 0.20 0.78 0.14 0.87 0.17 0.78 0.07 0.78 0.36
Q25: Caring for computers 0.63 0.25 0.78 0.23 0.72 0.29 0.82 0.23 0.70 0.22 0.80 0.33 0.73 0.27 0.73 0.27 0.75 0.19 0.73 0.29 0.72 0.29 0.79 0.07
Q26: Cleaning solvents 0.52 0.28 0.68 0.28 0.45 0.15 0.57 -
0.04 0.51 0.26 0.66 0.16 0.50 0.22 0.50 0.22 0.54 0.14 0.69 0.05 0.56 0.03 0.67 0.06
Q27: Screwdriver repercussion
0.06 0.11 0.19 0.37 0.06 0.05 0.08 0.19 0.03 0.02 0.23 0.24 0.04 0.04 0.04 0.04 0.04 0.03 0.10 0.18 0.07 -0.04 0.11 0.10
Q28: Updgrade installation calc.
0.72 0.34 0.82 0.14 0.75 0.38 0.81 0.29 0.77 0.31 0.89 0.25 0.76 0.37 0.76 0.37 0.77 0.35 0.81 0.20 0.81 0.25 0.85 0.23
Q29: Antivirus failure rate 0.62 0.32 0.63 0.09 0.60 0.28 0.58 0.25 0.58 0.17 0.70 0.22 0.59 0.16 0.59 0.16 0.59 0.06 0.54 0.10 0.60 0.04 0.65 0.17
Q30: Upgrade graphic cards 0.11 -
0.03 0.08 -0.12 0.09 0.06 0.13 -
0.03 0.07 0.04 0.06 -0.06 0.09 0.04 0.09 0.04 0.10 0.02 0.10 -
0.13 0.10 -0.06 0.10 -
0.30 Q31: Internet cafe usage 0.56 0.34 0.69 0.28 0.61 0.34 0.60 0.37 0.56 0.29 0.68 0.26 0.55 0.30 0.55 0.30 0.56 0.31 0.57 0.17 0.67 0.21 0.70 0.31
Q32: Protect computer from virus
0.37 0.33 0.61 0.44 0.41 0.39 0.74 0.25 0.50 0.45 0.68 0.40 0.42 0.38 0.42 0.38 0.46 0.30 0.68 0.32 0.46 0.34 0.69 0.57
Q33: Dialog boxes 0.49 0.35 0.68 0.15 0.46 0.34 0.59 0.21 0.49 0.26 0.66 0.32 0.45 0.32 0.45 0.32 0.46 0.27 0.48 0.18 0.55 0.18 0.57 0.19
Q34: Rename a file 0.21 0.23 0.38 0.31 0.29 0.21 0.44 0.38 0.26 0.41 0.43 0.30 0.34 0.28 0.34 0.28 0.29 0.41 0.33 0.28 0.28 0.19 0.42 0.17
Q35: Close word file 0.36 0.30 0.48 0.38 0.36 0.29 0.47 0.31 0.35 0.34 0.42 0.35 0.37 0.32 0.37 0.32 0.36 0.33 0.48 0.40 0.32 0.14 0.46 0.34
Q36: Open recent document
0.27 0.23 0.36 0.28 0.27 0.12 0.35 0.19 0.27 0.22 0.43 0.22 0.32 0.18 0.32 0.18 0.33 0.19 0.26 -0.05 0.32 0.16 0.24 0.11
Q37: Word processing copying text
0.51 0.37 0.66 0.27 0.48 0.42 0.67 0.39 0.53 0.35 0.76 0.36 0.56 0.42 0.56 0.42 0.52 0.44 0.55 0.36 0.58 0.34 0.62 0.37
Q38: Name box display 0.13 0.04 0.13 -
0.05 0.14 0.11 0.15 -0.04 0.13 0.16 0.11 0.05 0.15 0.17 0.15 0.17 0.17 -
0.09 0.19 -0.01 0.15 -
0.01 0.14 -0.06
Q39: Inserting rows 0.37 0.18 0.33 0.24 0.28 0.20 0.32 0.19 0.22 0.09 0.32 0.09 0.19 0.17 0.19 0.17 0.24 0.15 0.33 0.22 0.26 0.03 0.25 0.02
Q40: Enter formula 0.24 0.32 0.57 0.27 0.26 0.24 0.51 0.38 0.28 0.29 0.63 0.40 0.29 0.22 0.29 0.22 0.27 0.19 0.51 0.43 0.33 0.24 0.60 0.48
Q41: URL 0.22 0.25 0.41 0.21 0.16 0.13 0.40 0.36 0.19 0.19 0.46 0.28 0.20 0.22 0.20 0.22 0.20 0.24 0.41 0.11 0.15 0.07 0.38 0.31

14
Cohort 1 Cohort 2 Cohort 3 Cohort 4 Cohort 5 Cohort 6 Pre- Post- Pre- Post- Pre- Post- Pre- Post- Pre- Post- Pre- Post- Q42: Tool to search web 0.65 0.45 0.83 0.34 0.69 0.45 0.86 0.41 0.66 0.48 0.87 0.23 0.66 0.38 0.66 0.38 0.70 0.37 0.77 0.27 0.69 0.34 0.85 0.28
Q43: Security zone 0.39 0.19 0.53 0.26 0.35 0.20 0.49 0.12 0.33 0.21 0.48 0.12 0.32 0.24 0.32 0.24 0.38 0.09 0.47 0.10 0.42 0.18 0.50 0.22
Q44: Folder banner 0.16 0.19 0.17 0.09 0.11 0.03 0.14 -
0.22 0.13 0.08 0.21 0.00 0.12 -0.01 0.12 -
0.01 0.12 -0.01 0.14 0.09 0.16 -
0.04 0.22 -0.03
Q45: Save messages in outlook
0.38 0.26 0.47 0.24 0.38 0.15 0.55 0.15 0.40 0.28 0.52 0.30 0.45 0.21 0.45 0.21 0.46 0.26 0.42 0.06 0.39 0.19 0.49 0.15
Avearges 0.39 0.26 0.54 0.27 0.40 0.24 0.54 0.23 0.41 0.26 0.57 0.29 0.40 0.25 0.40 0.25 0.42 0.20 0.52 0.23 0.42 0.17 0.54 0.22

15
Life skills
Cohort 1 Cohort 2 Cohort 3 Cohort 4 Cohort 5 Cohort 6 Pre- Post- Pre- Post- Pre- Post- Pre- Post- Pre- Post- Pre- Item PCo
r Pbis PCor Pbis PCo
r Pbis PCor Pbis PCo
r Pbis PCor Pbis PCo
r Pbis PCor Pbis PCo
r Pbis PCor Pbis PCo
r Pbis PCor Pbis
Q1: Emotional intelligence
0.62 0.25 0.71 0.34 0.64 0.11 0.65 0.32 0.68 0.23 0.82 0.23 0.67 0.33 0.67 0.33 0.66 0.22 0.76 0.37 0.62 0.31 0.68 0.43
Q2: Mary life-skill 0.35 0.13 0.61 0.05 0.51 0.20 0.52 0.03 0.63 0.31 0.58 0.16 0.53 0.15 0.53 0.15 0.39 -
0.05 0.43 -0.03 0.40 0.08 0.30 0.18
Q3: Thinking critically 0.63 -
0.02 0.81 0.08 0.61 0.14 0.70 0.12 0.67 0.21 0.72 0.00 0.58 0.10 0.58 0.10 0.60 0.15 0.70 0.11 0.62 -0.05 0.60 0.34
Q4: Human emotion 0.18 -
0.15 0.22 -0.12 0.13 -
0.18 0.16 -0.18 0.14 -
0.20 0.21 -0.05 0.11 -
0.22 0.11 -0.22 0.13 -
0.29 0.15 -0.20 0.10 -
0.04 0.08 0.11
Q5: Elizabeth's emotion
0.70 0.01 0.72 0.08 0.69 0.14 0.66 0.07 0.68 0.08 0.61 0.06 0.71 0.12 0.71 0.12 0.74 0.19 0.71 0.20 0.76 0.07 0.77 0.22
Q6: Elizabeth's life-skill
0.35 0.05 0.38 0.27 0.39 0.15 0.37 0.10 0.36 0.00 0.46 0.17 0.37 0.23 0.37 0.23 0.30 0.10 0.35 0.29 0.39 0.08 0.42 0.06
Q7: Sadness 0.37 -0.04 0.33 -
0.07 0.32 0.07 0.29 -0.14 0.36 0.14 0.50 0.23 0.25 -
0.04 0.25 -0.04 0.35 0.00 0.39 0.17 0.30 -
0.02 0.38 0.14
Q8: Controlling anger
0.76 0.14 0.85 0.18 0.73 0.09 0.74 0.19 0.73 0.10 0.83 0.06 0.70 0.07 0.70 0.07 0.73 0.06 0.78 0.14 0.75 -0.02 0.78 0.31
Q9: Improving Listening skills
0.25 0.16 0.39 0.09 0.27 0.19 0.38 0.08 0.33 0.25 0.48 0.07 0.29 0.09 0.29 0.09 0.38 0.20 0.39 0.19 0.33 0.11 0.42 0.22
Q10: Karens social motive 0.75 0.03 0.85 0.18 0.78 0.23 0.74 0.18 0.75 0.22 0.84 0.11 0.74 0.10 0.74 0.10 0.73 0.10 0.75 0.16 0.79 0.01 0.79 0.18
Q11: Biological motive
0.16 0.14 0.35 0.37 0.17 0.09 0.18 0.07 0.23 0.16 0.39 0.30 0.17 0.16 0.17 0.16 0.20 0.14 0.25 0.19 0.19 0.09 0.18 0.04
Q12: Self-awareness 0.71 0.25 0.71 0.12 0.69 0.30 0.77 0.30 0.73 0.25 0.70 0.29 0.70 0.35 0.70 0.35 0.72 0.17 0.74 0.26 0.68 0.16 0.79 0.25
Q13: Feedback 0.64 0.21 0.66 0.19 0.63 0.18 0.75 0.26 0.65 0.17 0.79 0.29 0.65 0.16 0.65 0.16 0.64 0.14 0.56 0.20 0.64 0.18 0.69 0.19
Q14: Emotion and behavior
0.45 0.10 0.54 0.20 0.45 0.20 0.42 0.01 0.47 0.11 0.54 0.27 0.49 0.08 0.49 0.08 0.39 0.12 0.43 0.13 0.52 0.10 0.52 0.32
Q15: Education goal
0.78 0.33 0.91 0.23 0.75 0.45 0.83 0.22 0.69 0.40 0.85 0.43 0.77 0.44 0.77 0.44 0.79 0.21 0.83 0.34 0.80 0.28 0.82 0.50
Q16: Type of goal 0.67 0.12 0.77 0.10 0.71 0.17 0.74 0.09 0.66 0.14 0.77 0.09 0.63 0.17 0.63 0.17 0.70 0.17 0.76 0.08 0.69 -
0.01 0.68 0.22
Q17: Not a major force 0.59 0.29 0.72 0.29 0.54 0.30 0.64 0.29 0.57 0.26 0.67 0.31 0.63 0.23 0.63 0.23 0.55 0.29 0.70 0.27 0.56 0.25 0.66 0.43
Q18: Major force 0.86 0.31 0.94 0.14 0.88 0.38 0.92 0.36 0.86 0.43 0.92 0.37 0.86 0.36 0.86 0.36 0.84 0.38 0.89 0.29 0.92 0.13 0.86 0.36
Q19: 0.63 0.25 0.78 0.25 0.64 0.32 0.79 0.26 0.60 0.34 0.77 0.34 0.73 0.35 0.73 0.35 0.65 0.37 0.74 0.36 0.63 0.21 0.74 0.34
16
Cohort 1 Cohort 2 Cohort 3 Cohort 4 Cohort 5 Cohort 6 Pre- Post- Pre- Post- Pre- Post- Pre- Post- Pre- Post- Pre- Workplace deviance Q20: Form of work 0.92 0.14 0.95 0.08 0.94 0.36 0.95 0.21 0.89 0.31 0.93 0.32 0.91 0.27 0.91 0.27 0.91 0.27 0.92 0.17 0.92 0.08 0.91 0.36
Q21: Resolving a problem
0.57 0.30 0.61 0.34 0.54 0.18 0.63 0.27 0.61 0.31 0.64 0.25 0.58 0.20 0.58 0.20 0.50 0.23 0.59 0.34 0.63 0.17 0.68 0.30
Q22: Personal attributes
0.63 0.34 0.78 0.48 0.66 0.28 0.73 0.42 0.64 0.44 0.84 0.36 0.66 0.46 0.66 0.46 0.67 0.36 0.75 0.43 0.64 0.29 0.78 0.42
Q23: Ideal vs suitable job 0.31 0.06 0.36 0.27 0.31 0.16 0.38 0.16 0.34 0.09 0.43 0.00 0.36 0.12 0.36 0.12 0.34 0.18 0.36 0.24 0.37 0.13 0.31 0.21
Q24: Good job searching strategy
0.64 0.33 0.71 0.30 0.58 0.49 0.67 0.42 0.66 0.50 0.81 0.45 0.62 0.29 0.62 0.29 0.59 0.26 0.68 0.41 0.65 0.35 0.67 0.39
Q25: Best job searching strategy
0.26 0.21 0.34 0.23 0.28 0.14 0.33 0.29 0.36 0.24 0.46 0.29 0.29 0.14 0.29 0.14 0.29 0.23 0.41 0.39 0.30 0.20 0.33 0.43
Q26: Job vaancy advertisement
0.59 0.31 0.61 0.14 0.57 0.32 0.58 0.29 0.54 0.32 0.65 0.26 0.60 0.38 0.60 0.38 0.55 0.37 0.60 0.25 0.69 0.06 0.53 0.37
Q27: Interview scenario
0.44 0.05 0.61 0.20 0.42 0.19 0.48 0.13 0.41 0.18 0.58 0.22 0.41 0.18 0.41 0.18 0.43 0.17 0.59 0.34 0.42 0.02 0.49 0.22
Q28: Good CV 0.36 0.15 0.52 0.01 0.40 0.09 0.51 0.05 0.40 0.19 0.53 0.10 0.40 0.09 0.40 0.09 0.36 0.14 0.53 0.20 0.40 0.03 0.47 0.19
Q29: Personal values definition
0.63 0.24 0.65 -0.10 0.67 0.36 0.58 0.31 0.65 0.28 0.72 0.16 0.67 0.28 0.67 0.28 0.64 0.44 0.67 0.29 0.69 0.16 0.59 0.40
Q30: Dealing with emotions
0.77 0.41 0.83 0.26 0.80 0.43 0.82 0.33 0.81 0.41 0.85 0.24 0.79 0.48 0.79 0.48 0.86 0.31 0.82 0.26 0.87 0.20 0.86 0.37
Q31: Egg producer 0.74 0.25 0.83 0.20 0.81 0.19 0.83 0.21 0.80 0.25 0.84 0.22 0.84 0.30 0.84 0.30 0.85 0.23 0.87 0.14 0.87 0.00 0.85 0.22
Q32: Prevent infections 0.80 0.26 0.89 0.19 0.83 0.16 0.82 0.15 0.76 0.21 0.86 0.17 0.77 0.29 0.77 0.29 0.83 0.14 0.86 0.10 0.83 0.16 0.83 0.37
Q33: Lead to risky behaviors
0.83 0.36 0.92 0.21 0.82 0.30 0.85 0.29 0.84 0.32 0.91 0.30 0.84 0.22 0.84 0.22 0.80 0.41 0.85 0.47 0.88 0.23 0.85 0.36
Q34: Contraceptive methods
0.23 0.00 0.27 0.01 0.21 -0.03 0.18 0.00 0.19 -
0.03 0.23 -0.10 0.19 -
0.15 0.19 -0.15 0.19 0.05 0.14 -
0.13 0.24 -0.01 0.19 0.18
Q35: Protection from STIs and HIV
0.63 0.26 0.75 0.07 0.72 0.28 0.80 0.23 0.69 0.16 0.74 0.32 0.67 0.13 0.67 0.13 0.67 0.23 0.69 0.15 0.70 0.12 0.71 0.28

17
Cohort 1 Cohort 2 Cohort 3 Cohort 4 Cohort 5 Cohort 6 Pre- Post- Pre- Post- Pre- Post- Pre- Post- Pre- Post- Pre- Q36: HIV Transmission
0.88 0.28 0.95 0.09 0.89 0.40 0.95 0.08 0.93 0.20 0.93 0.21 0.92 0.37 0.92 0.37 0.90 0.23 0.89 0.22 0.94 0.20 0.91 0.42
Q37: Correct statement 0.50 0.20 0.54 0.18 0.53 0.25 0.56 0.23 0.46 0.28 0.59 0.25 0.50 0.28 0.50 0.28 0.49 0.22 0.61 0.31 0.45 0.25 0.58 0.37
Q38: Consequence of tobacco use
0.50 0.01 0.46 -0.12 0.55 0.03 0.47 0.12 0.51 0.00 0.41 0.10 0.49 0.15 0.49 0.15 0.48 -
0.08 0.41 0.12 0.54 -0.02 0.42 -
0.01
Q39: Meaning of sex and gender
0.49 0.19 0.47 0.11 0.48 0.25 0.49 0.20 0.44 0.28 0.52 0.05 0.43 0.10 0.43 0.10 0.48 0.25 0.55 0.31 0.47 0.19 0.42 0.39
Q40: Preventing sexual threats
0.76 0.37 0.80 0.33 0.81 0.34 0.83 0.28 0.83 0.31 0.91 0.28 0.78 0.33 0.78 0.33 0.83 0.38 0.86 0.39 0.85 0.04 0.83 0.40
Q41: Type of violence 0.45 0.18 0.55 0.12 0.48 0.01 0.45 0.20 0.40 0.20 0.48 0.23 0.42 0.12 0.42 0.12 0.39 0.06 0.39 0.04 0.44 0.06 0.40 0.17
Averages 0.57 0.18 0.65 0.16 0.58 0.21 0.61 0.18 0.58 0.22 0.67 0.21 0.58 0.20 0.58 0.20 0.57 0.19 0.62 0.22 0.60 0.12 0.60 0.28

Appendix 6: Model for Measuring Impact of the Training ICT
OLS Overall1 C1 C2 C3 C4 C5 C6 Constant 12.00*** 11.22*** 11.35*** 12.91*** 19.74*** 12.91*** 12.41*** (0.596) (1.007) (1.151) (1.342) (1.149) (1.416) (1.655) Baseline score 0.463*** 0.509*** 0.516*** 0.416*** 0.518*** 0.349*** 0.452*** (0.028) (0.052) (0.0553) (0.061) (0.0586) (0.0702) (0.077) Treatment 1 7.773*** 7.590*** --- 8.960*** --- 7.566*** --- (0.376) (0.655) --- (0.875) --- (0.817) --- Treatment 2 7.142*** --- 6.212*** --- 8.443*** --- 5.708*** (0.366) --- (0.657) --- (0.719) --- (0.83) R2 0.524 0.637 0.518 0.543 0.573 0.496 0.395 N 843 157 168 122 154 118 124
Standard errors in parentheses *p< 0.05, **p< 0.01, ***p< 0.001 (1) Coefficient and standard error linearized; survey data used cohort as strata
Life skills
OLS Overall1 C1 C2 C3 C4 C5 C6 Constant 9.11*** 10.87*** 10.22*** 11.26*** 5.794*** 7.142*** 9.440*** (0.899) (1.525) (1.371) (1.472) (1.59) (1.536) (2.56) Baseline score 0.657*** 0.620*** 0.614*** 0.601*** 0.798*** 0.721*** 0.605*** (0.035) (0.0637) (0.0555) (0.0578) (0.0608) (0.0649) (0.101) Treatment 1 2.952*** 2.246*** --- 2.539*** --- 2.672*** --- (0.288) (0.535) --- (0.636) --- (0.649) --- Treatment 2 0.155 --- 0.161 --- 0.498 --- 0.552 (0.289) --- (0.567) --- (0.549) --- (0.801) R2 0.478 0.436 0.431 0.517 0.557 0.581 0.232 N 843 157 168 122 154 118 124
(1) Coefficient and standard error linearized; survey data used cohort as strata

19
Appendix 7: Models for Measuring Impact of the Program Employment
OLS1 Logit2 Constant 0.280*** 0.389*** (0.026) (0.051) Treatment 1 0.141** 1.870** (0.049) (0.404) Treatment 2 0.086 1.484 (0.048) (0.324) R2 0.016 --- Efron's R2 --- 0.0163 N 571 571 Standard errors in parentheses * p < 0.05, ** p < 0.01, *** p < 0.001 (1) Coefficient and standard error linearized; survey data used cohort as strata (2) Exponentiated coefficients Income
OLS1 Constant 494.1*** (66.52) Baseline income 0.196 (0.249) Treatment 1 444.6** (151.4) Treatment 2 506.2** (166.9) R2 0.023 N 577 (1) Coefficient and standard error linearized; survey data used cohort as strata Confidence
(1) Exponentiated coefficients
Poisson1 Treatment 1 1.168*** 0.037 Treatment 2 1.207*** 0.036 Confident in baseline 1.161*** 0.036 Very Confident in baseline 1.269*** 0.041 (T1 vs C) & Not Confident 1.382*** 0.087 (T1 vs C) & Confident 1.059 0.051 (T1 vs C) & Very Confident 1.088 0.057 (T2 vs C) & Not Confident 1.376*** 0.086 (T2 vs C) & Confident 1.163*** 0.048 (T2 vs C) & Very Confident 1.098 0.054 Maximum Likelihood R2 0.044 N 497
20
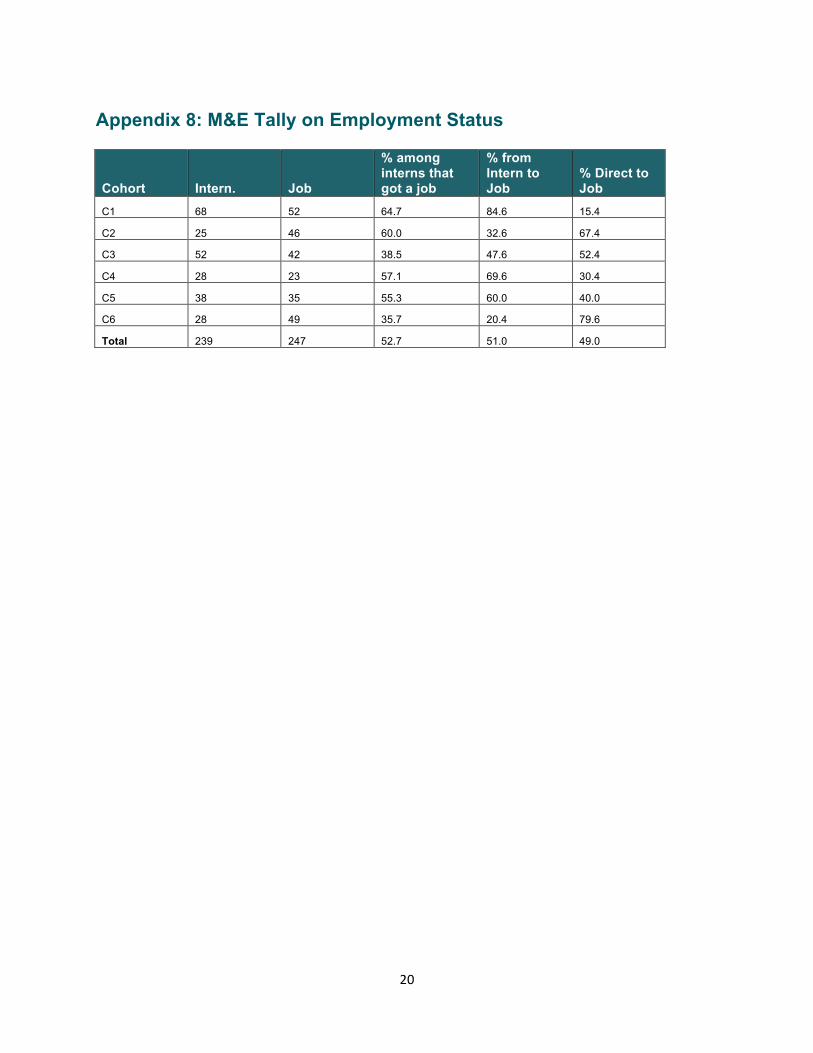
Appendix 8: M&E Tally on Employment Status
Cohort Intern. Job
% among interns that got a job
% from Intern to Job
% Direct to Job
C1 68 52 64.7 84.6 15.4
C2 25 46 60.0 32.6 67.4
C3 52 42 38.5 47.6 52.4
C4 28 23 57.1 69.6 30.4
C5 38 35 55.3 60.0 40.0
C6 28 49 35.7 20.4 79.6
Total 239 247 52.7 51.0 49.0

21
Appendix 9: Participants’ Support Support received during the Internship Program The majority of Treatment 1 participants took part in an internship and received some stipend from ACWICT throughout the internship, while less than a third of those in Treatment 2 took part in an internship. Internship
Treatment 1 Treatment 2 No. % No. % 8. Participate in an internship attachment? Yes 83 55.3 45 30.2 No 67 44.7 104 69.8 Total 150 100 149 100 Pearson chi2(1) = 19.2840 Pr = 0.000 14. Receive a stipend from ACWICT during internship? Yes 46 56.1 9 20.5 No 36 43.9 35 79.5 Total 82 100 44 100 Pearson chi2(1) = 14.7899 Pr = 0.000
Almost a third of the treatment group participants that answered the question said that they had received no support from their internship employer. Among the support provided, the most frequent were financial support (stipend, meals and transportation). Type of support received from internship employer?
Treatment 1 Treatment 2 No. % No. % 15. None Yes 26 32.1 11 25 No 55 67.9 33 75 Total 81 100 44 100 Pearson chi2(1) = 0.6895 Pr = 0.406 15. Received a stipend Yes 22 27.2 5 11.4 No 59 72.8 39 88.6 Total 81 100 44 100 Pearson chi2(1) = 4.2015 Pr = 0.040 15. Received transportation Yes 14 17.3 13 29.5 No 67 82.7 31 70.5 Total 81 100 44 100 Pearson chi2(1) = 2.5313 Pr = 0.112 15. Received meals Yes 19 23.5 17 38.6 No 62 76.5 27 61.4 Total 81 100 44 100 Pearson chi2(1) = 3.2039 Pr = 0.073 15. Attended a seminar(s) workshop(s) Yes 13 16 3 6.8 No 68 84 41 93.2 Total 81 100 44 100 Pearson chi2(1) = 2.1768 Pr = 0.140
22
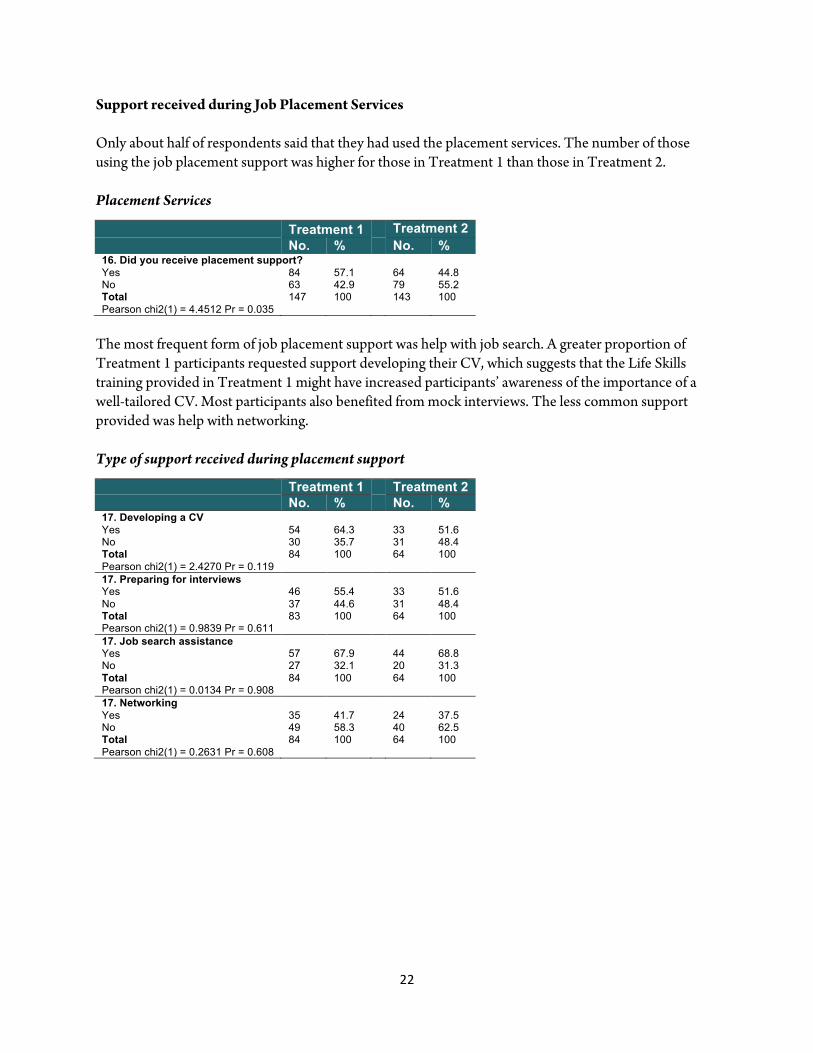
Support received during Job Placement Services Only about half of respondents said that they had used the placement services. The number of those using the job placement support was higher for those in Treatment 1 than those in Treatment 2. Placement Services
Treatment 1 Treatment 2 No. % No. % 16. Did you receive placement support? Yes 84 57.1 64 44.8 No 63 42.9 79 55.2 Total 147 100 143 100 Pearson chi2(1) = 4.4512 Pr = 0.035
The most frequent form of job placement support was help with job search. A greater proportion of Treatment 1 participants requested support developing their CV, which suggests that the Life Skills training provided in Treatment 1 might have increased participants’ awareness of the importance of a well-tailored CV. Most participants also benefited from mock interviews. The less common support provided was help with networking. Type of support received during placement support
Treatment 1 Treatment 2 No. % No. % 17. Developing a CV Yes 54 64.3 33 51.6 No 30 35.7 31 48.4 Total 84 100 64 100 Pearson chi2(1) = 2.4270 Pr = 0.119 17. Preparing for interviews Yes 46 55.4 33 51.6 No 37 44.6 31 48.4 Total 83 100 64 100 Pearson chi2(1) = 0.9839 Pr = 0.611 17. Job search assistance Yes 57 67.9 44 68.8 No 27 32.1 20 31.3 Total 84 100 64 100 Pearson chi2(1) = 0.0134 Pr = 0.908 17. Networking Yes 35 41.7 24 37.5 No 49 58.3 40 62.5 Total 84 100 64 100 Pearson chi2(1) = 0.2631 Pr = 0.608


32 South StreetBaltimore, MD 21202 USA
Tel +1 410 951 1500 www.iyfnet.org