Evaluating Influential Factors in Event Quality Using ... · factors and to facilitate provider...
6
Abstract—This research determines the influence of various dimensions and criteria of event quality. In addressing the aim of this study, a decision-making trial and evaluation laboratory (DEMATEL) is employed to construct an influential network relationship map (INRM), which then is used to illustrate the influential network of the event quality improvement model. The results indicated that entertainment dimension apparently is recognized as the main key which has most influence on other dimensions (information, transportation and environment). This improvement model is useful in establishing an influential network and a prioritization among dimensions/criteria associated with event quality in tourism industry. I. INTRODUCTION In recent decades, events have developed significantly in terms of number and size and have become such important phenomena in tourism industry. Events have offered enormous advantages to tourism industry, rapidly attracted many visitors, facilitated recreational, social and cultural experiences, increased media coverage and especially had great impact on local economic [1]-[6]. Events have stimulated economic activities, particularly increased business turnover, created employment field and enhanced local community income, as well as government revenue. In other words, events are major business including huge amounts of marketing that make many type of businesses depend on them for their success [7]. In this context, this success is derived from both direct and indirect large amount of time and money spent by visitors to attend those events. For events success are greatly affected by visitors attendance and expenditures, one of challenges that event provider need to thrive on is to design an unforgettable experiences for visitors that will create loyal visitors base. In pursuit of this stage, provider has to consistently provide a good event quality first. For result, it will deliver outstanding experience for visitors that will lead to satisfaction, revisit intention and word-of-mouth. However, good event quality is determined by many factors. Specifically, provider should perceive and examine which factors that have most impact on delivering a better event quality. Manuscript received April 13, 2013; revised June 14, 2013. Wen-Tsann Yang, Wen-Hua Liu, and Hsin-Hsien Liu are with Ph. D Program in Civil and Hydraulic Engineering, Feng Chia University, Taichung, Taiwan (e-mail: [email protected]; [email protected]; [email protected]). Lanasari is with Suci Hati School, Jakarta, Indonesia. (e-mail: [email protected]). However, when decision makers of event make decisions from multiple factors, they must carefully deliberate many aspects, such as dependency and conflicts among the items. Further, each criterion has particular influence both within dimensions and overall quality. Consequently, decision making process becomes notably sophisticated [8], [9]. How to construct an evaluation system of improvement priorities is exceptionally demanding. This research applies DEMATEL (Decision-Making Trial and Evaluation Laboratory) method to discover the influential degree among factors and to facilitate provider with improvement solutions based on those priorities. II. LITERATURE REVIEW Event quality means product and service that delivered to satisfy visitors‟ needs at the appropriate level. For quality intuitively is a measure of event success in tourism and leisure services [10], [11], hence, event providers have to set affordable quality standards to meet visitors‟ needs. Howard and Crompton [12] that applied Herzberg, Mausner, and Snyderman [13] concept of leisure study, recognized that fundamental key in visitors‟ satisfaction is affected by the tangible physical environment (superstructure and infrastructure) which is required for service performance in an event [14], [15]. These tangible environmental cues are recognized as an impulse that sway visitors‟ emotions for what they have experienced, then for the outcome, it will define their next behavior [16]. Further research by Brown [17] and Crompton & Love [10] have perceived quality in the tourism contextual as quality of performance and quality of experience. Quality of performance (quality) is the attribute of a service which is fully controlled by provider, while quality of experience (satisfaction) is the visitors‟ psychological effect that turned out from accomplishment of expectations that influenced by quality attributes and external factors. In addition, quality can affect satisfaction and in turn produce an impact on evaluation and improvement that will grow number of visitors and/or revenues [18]-[22]. Accordingly, this research justify that event quality must be take into main consideration for it directly controlled by event provider. On the contrary, provider cannot control psychological factors (moods, emotions, feelings) and external factors (weather, climate). Therefore, provider can put their attention to deliver the highest quality of performance that they can control. For example, Baker and Crompton [20] were determined 4 dimensions and 18 attributes of event quality: generic features, specific entertainment features, information sources and comfort amenities. They research indicated that quality has impact on satisfaction and satisfaction will lead to behavior intention of Evaluating Influential Factors in Event Quality Using DEMATEL Method Wen-Tsann Yang, Wen-Hua Liu, Hsin-Hsien Liu, and Lanasari 92 International Journal of Trade, Economics and Finance, Vol. 4, No. 3, June 2013 DOI: 10.7763/IJTEF.2013.V4.266 Index Terms—Event, quality, dematel (Decision-Making Trial and Evaluation Laboratory).
Transcript of Evaluating Influential Factors in Event Quality Using ... · factors and to facilitate provider...
Abstract—This research determines the influence of various
dimensions and criteria of event quality. In addressing the aim
of this study, a decision-making trial and evaluation laboratory
(DEMATEL) is employed to construct an influential network
relationship map (INRM), which then is used to illustrate the
influential network of the event quality improvement model.
The results indicated that entertainment dimension apparently
is recognized as the main key which has most influence on other
dimensions (information, transportation and environment).
This improvement model is useful in establishing an influential
network and a prioritization among dimensions/criteria
associated with event quality in tourism industry.
I. INTRODUCTION
In recent decades, events have developed significantly in
terms of number and size and have become such important
phenomena in tourism industry. Events have offered
enormous advantages to tourism industry, rapidly attracted
many visitors, facilitated recreational, social and cultural
experiences, increased media coverage and especially had
great impact on local economic [1]-[6]. Events have
stimulated economic activities, particularly increased
business turnover, created employment field and enhanced
local community income, as well as government revenue. In
other words, events are major business including huge
amounts of marketing that make many type of businesses
depend on them for their success [7]. In this context, this
success is derived from both direct and indirect large amount
of time and money spent by visitors to attend those events.
For events success are greatly affected by visitors
attendance and expenditures, one of challenges that event
provider need to thrive on is to design an unforgettable
experiences for visitors that will create loyal visitors base. In
pursuit of this stage, provider has to consistently provide a
good event quality first. For result, it will deliver outstanding
experience for visitors that will lead to satisfaction, revisit
intention and word-of-mouth. However, good event quality is
determined by many factors. Specifically, provider should
perceive and examine which factors that have most impact on
delivering a better event quality.
Manuscript received April 13, 2013; revised June 14, 2013.
Wen-Tsann Yang, Wen-Hua Liu, and Hsin-Hsien Liu are with Ph. D
Program in Civil and Hydraulic Engineering, Feng Chia University,
Taichung, Taiwan (e-mail: [email protected]; [email protected];
Lanasari is with Suci Hati School, Jakarta, Indonesia. (e-mail:
However, when decision makers of event make decisions
from multiple factors, they must carefully deliberate many
aspects, such as dependency and conflicts among the items.
Further, each criterion has particular influence both within
dimensions and overall quality. Consequently, decision
making process becomes notably sophisticated [8], [9]. How
to construct an evaluation system of improvement priorities
is exceptionally demanding. This research applies
DEMATEL (Decision-Making Trial and Evaluation
Laboratory) method to discover the influential degree among
factors and to facilitate provider with improvement solutions
based on those priorities.
II. LITERATURE REVIEW
Event quality means product and service that delivered to
satisfy visitors‟ needs at the appropriate level. For quality
intuitively is a measure of event success in tourism and
leisure services [10], [11], hence, event providers have to set
affordable quality standards to meet visitors‟ needs.
Howard and Crompton [12] that applied Herzberg,
Mausner, and Snyderman [13] concept of leisure study,
recognized that fundamental key in visitors‟ satisfaction is
affected by the tangible physical environment (superstructure
and infrastructure) which is required for service performance
in an event [14], [15]. These tangible environmental cues are
recognized as an impulse that sway visitors‟ emotions for
what they have experienced, then for the outcome, it will
define their next behavior [16]. Further research by Brown
[17] and Crompton & Love [10] have perceived quality in the
tourism contextual as quality of performance and quality of
experience. Quality of performance (quality) is the attribute
of a service which is fully controlled by provider, while
quality of experience (satisfaction) is the visitors‟
psychological effect that turned out from accomplishment of
expectations that influenced by quality attributes and external
factors. In addition, quality can affect satisfaction and in turn
produce an impact on evaluation and improvement that will
grow number of visitors and/or revenues [18]-[22].
Accordingly, this research justify that event quality must
be take into main consideration for it directly controlled by
event provider. On the contrary, provider cannot control
psychological factors (moods, emotions, feelings) and
external factors (weather, climate). Therefore, provider can
put their attention to deliver the highest quality of
performance that they can control. For example, Baker and
Crompton [20] were determined 4 dimensions and 18
attributes of event quality: generic features, specific
entertainment features, information sources and comfort
amenities. They research indicated that quality has impact on
satisfaction and satisfaction will lead to behavior intention of
Evaluating Influential Factors in Event Quality Using
DEMATEL Method
Wen-Tsann Yang, Wen-Hua Liu, Hsin-Hsien Liu, and Lanasari
92
International Journal of Trade, Economics and Finance, Vol. 4, No. 3, June 2013
DOI: 10.7763/IJTEF.2013.V4.266
Index Terms—Event, quality, dematel (Decision-Making
Trial and Evaluation Laboratory).
visitors. Moreover, Crompton [15] was assessed six factors
of event quality. Although this research had inconclusive
results, but the assessment of those factors offered intuitive
information and helpful direction for further research.
Further, Cole and Chancellor [23] were defined 3 factors
(entertainment, amenities and programs) which consist of 15
criteria, where the result showed that entertainment had more
effects than the remaining factors. Consequently, it suggested
that provider should constantly examine and improve the
event quality based on various factors related. The previous
event studies have emphasized an evaluation system that
interprets the assessment of dimensions and criteria in this
research.
III. METHODOLOGY
The DEMATEL method which generally used to solve the
complicated and intertwined problems in MCDM is proposed
in this research to confirm the effect of each factor and
influential relationships between them.
A. Data Collection
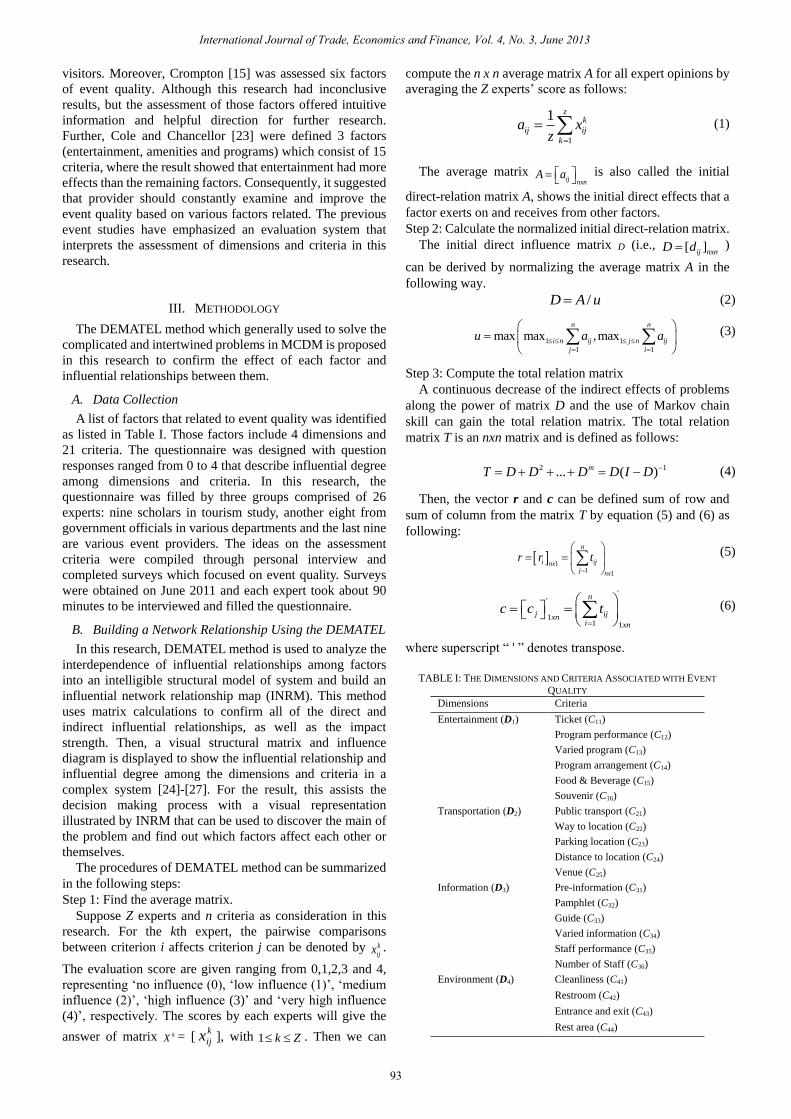
A list of factors that related to event quality was identified
as listed in Table I. Those factors include 4 dimensions and
21 criteria. The questionnaire was designed with question
responses ranged from 0 to 4 that describe influential degree
among dimensions and criteria. In this research, the
questionnaire was filled by three groups comprised of 26
experts: nine scholars in tourism study, another eight from
government officials in various departments and the last nine
are various event providers. The ideas on the assessment
criteria were compiled through personal interview and
completed surveys which focused on event quality. Surveys
were obtained on June 2011 and each expert took about 90
minutes to be interviewed and filled the questionnaire.
B. Building a Network Relationship Using the DEMATEL
In this research, DEMATEL method is used to analyze the
interdependence of influential relationships among factors
into an intelligible structural model of system and build an
influential network relationship map (INRM). This method
uses matrix calculations to confirm all of the direct and
indirect influential relationships, as well as the impact
strength. Then, a visual structural matrix and influence
diagram is displayed to show the influential relationship and
influential degree among the dimensions and criteria in a
complex system [24]-[27]. For the result, this assists the
decision making process with a visual representation
illustrated by INRM that can be used to discover the main of
the problem and find out which factors affect each other or
themselves.
The procedures of DEMATEL method can be summarized
in the following steps:
Step 1: Find the average matrix.
Suppose Z experts and n criteria as consideration in this
research. For the kth expert, the pairwise comparisons
between criterion i affects criterion j can be denoted by k
ijx .
The evaluation score are given ranging from 0,1,2,3 and 4,
representing „no influence (0), „low influence (1)‟, „medium
influence (2)‟, „high influence (3)‟ and „very high influence
(4)‟, respectively. The scores by each experts will give the
answer of matrix kX = [k
ijx ], with 1 k Z . Then we can
compute the n x n average matrix A for all expert opinions by
averaging the Z experts‟ score as follows:
1
1 zk
ij ij
k
a xz
(1)
The average matrix ij nxn
A a is also called the initial
direct-relation matrix A, shows the initial direct effects that a
factor exerts on and receives from other factors.
Step 2: Calculate the normalized initial direct-relation matrix.
The initial direct influence matrix D (i.e., [ ]ij nxnD d )
can be derived by normalizing the average matrix A in the
following way.
/D A u (2)
1 1
1 1
max max ,maxn n
i n ij j n ij
j i
u a a
(3)
Step 3: Compute the total relation matrix
A continuous decrease of the indirect effects of problems
along the power of matrix D and the use of Markov chain
skill can gain the total relation matrix. The total relation
matrix T is an nxn matrix and is defined as follows:
2 1... ( )mT D D D D I D (4)
Then, the vector r and c can be defined sum of row and
sum of column from the matrix T by equation (5) and (6) as
following:
1
1 1
n
i ijnxj nx
r r t
(5)
'
'
11 1
n
j ijxni xn
c c t
(6)
where superscript “ ' ” denotes transpose.
TABLE I: THE DIMENSIONS AND CRITERIA ASSOCIATED WITH EVENT
QUALITY
Dimensions Criteria
Entertainment (D1) Ticket (C11)
Program performance (C12)
Varied program (C13)
Program arrangement (C14)
Food & Beverage (C15)
Souvenir (C16)
Transportation (D2) Public transport (C21)
Way to location (C22)
Parking location (C23)
Distance to location (C24)
Venue (C25)
Information (D3) Pre-information (C31)
Pamphlet (C32)
Guide (C33)
Varied information (C34)
Staff performance (C35)
Number of Staff (C36)
Environment (D4) Cleanliness (C41)
Restroom (C42)
Entrance and exit (C43)
Rest area (C44)
93
International Journal of Trade, Economics and Finance, Vol. 4, No. 3, June 2013
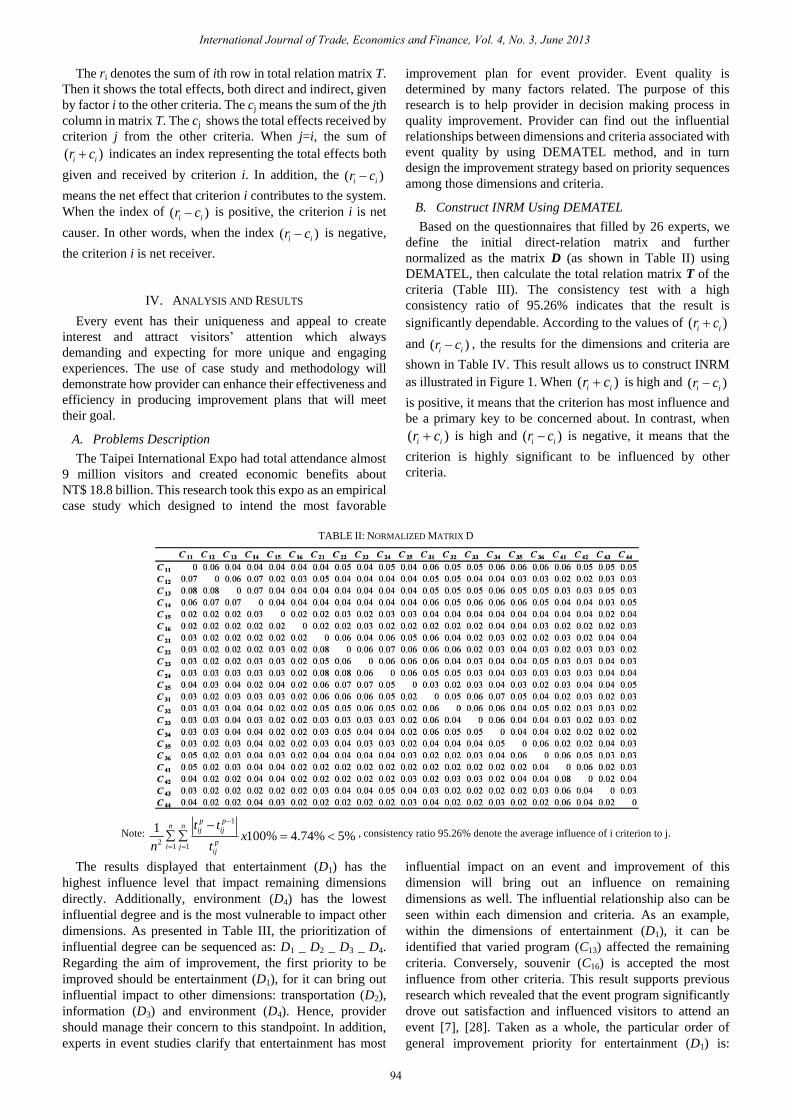
The ri denotes the sum of ith row in total relation matrix T.
Then it shows the total effects, both direct and indirect, given
by factor i to the other criteria. The cj means the sum of the jth
column in matrix T. The cj shows the total effects received by
criterion j from the other criteria. When j=i, the sum of
( )i ir c indicates an index representing the total effects both
given and received by criterion i. In addition, the ( )i ir c
means the net effect that criterion i contributes to the system.
When the index of ( )i ir c is positive, the criterion i is net
causer. In other words, when the index ( )i ir c is negative,
the criterion i is net receiver.
IV. ANALYSIS AND RESULTS
Every event has their uniqueness and appeal to create
interest and attract visitors‟ attention which always
demanding and expecting for more unique and engaging
experiences. The use of case study and methodology will
demonstrate how provider can enhance their effectiveness and
efficiency in producing improvement plans that will meet
their goal.
A. Problems Description
The Taipei International Expo had total attendance almost
9 million visitors and created economic benefits about
NT$ 18.8 billion. This research took this expo as an empirical
case study which designed to intend the most favorable
improvement plan for event provider. Event quality is
determined by many factors related. The purpose of this
research is to help provider in decision making process in
quality improvement. Provider can find out the influential
relationships between dimensions and criteria associated with
event quality by using DEMATEL method, and in turn
design the improvement strategy based on priority sequences
among those dimensions and criteria.
B. Construct INRM Using DEMATEL
Based on the questionnaires that filled by 26 experts, we
define the initial direct-relation matrix and further
normalized as the matrix D (as shown in Table II) using
DEMATEL, then calculate the total relation matrix T of the
criteria (Table III). The consistency test with a high
consistency ratio of 95.26% indicates that the result is
significantly dependable. According to the values of ( )i ir c
and ( )i ir c , the results for the dimensions and criteria are
shown in Table IV. This result allows us to construct INRM
as illustrated in Figure 1. When ( )i ir c is high and ( )i ir c
is positive, it means that the criterion has most influence and
be a primary key to be concerned about. In contrast, when
( )i ir c is high and ( )i ir c is negative, it means that the
criterion is highly significant to be influenced by other
criteria.
TABLE II: NORMALIZED MATRIX D
Note:
1
21 1
1100% 4.74% 5%
p pn n
ij ij
pi j
ij
t tx
n t
, consistency ratio 95.26% denote the average influence of i criterion to j.
The results displayed that entertainment (D1) has the
highest influence level that impact remaining dimensions
directly. Additionally, environment (D4) has the lowest
influential degree and is the most vulnerable to impact other
dimensions. As presented in Table III, the prioritization of
influential degree can be sequenced as: D1 _ D2 _ D3 _ D4.
Regarding the aim of improvement, the first priority to be
improved should be entertainment (D1), for it can bring out
influential impact to other dimensions: transportation (D2),
information (D3) and environment (D4). Hence, provider
should manage their concern to this standpoint. In addition,
experts in event studies clarify that entertainment has most
influential impact on an event and improvement of this
dimension will bring out an influence on remaining
dimensions as well. The influential relationship also can be
seen within each dimension and criteria. As an example,
within the dimensions of entertainment (D1), it can be
identified that varied program (C13) affected the remaining
criteria. Conversely, souvenir (C16) is accepted the most
influence from other criteria. This result supports previous
research which revealed that the event program significantly
drove out satisfaction and influenced visitors to attend an
event [7], [28]. Taken as a whole, the particular order of
general improvement priority for entertainment (D1) is:
94
International Journal of Trade, Economics and Finance, Vol. 4, No. 3, June 2013
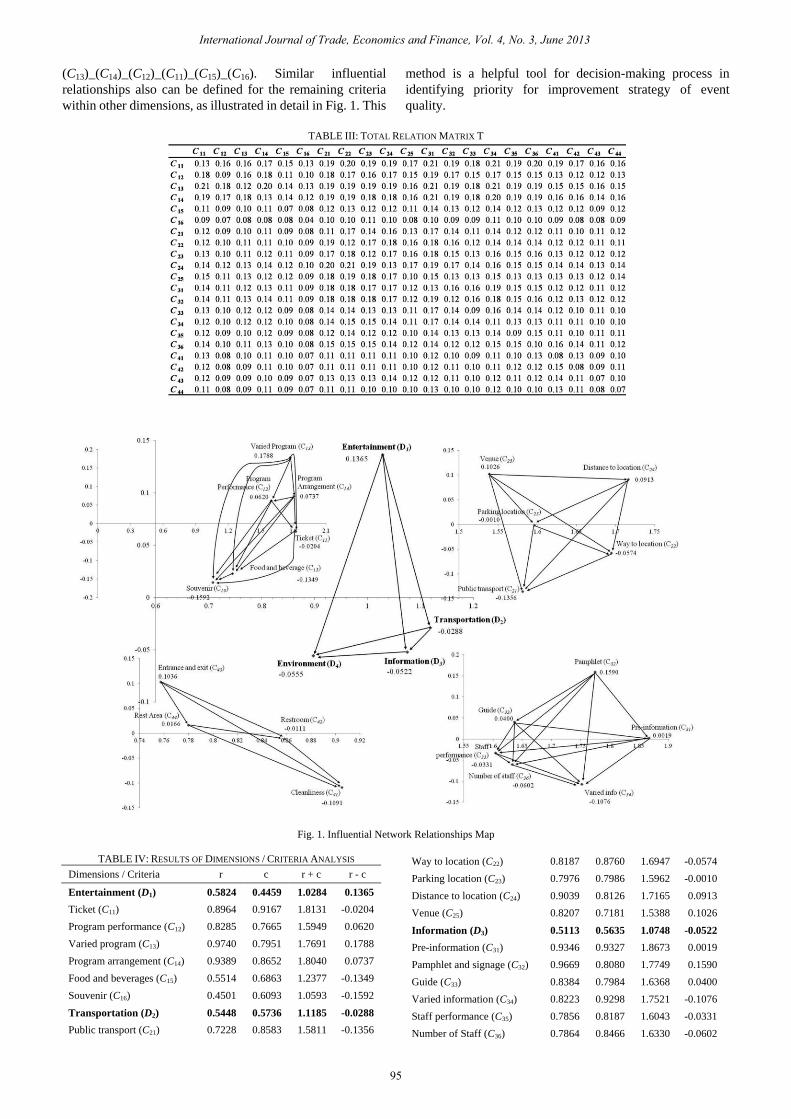
(C13)_(C14)_(C12)_(C11)_(C15)_(C16). Similar influential
relationships also can be defined for the remaining criteria
within other dimensions, as illustrated in detail in Fig. 1. This
method is a helpful tool for decision-making process in
identifying priority for improvement strategy of event
quality.
TABLE III: TOTAL RELATION MATRIX T
Fig. 1. Influential Network Relationships Map
TABLE IV: RESULTS OF DIMENSIONS / CRITERIA ANALYSIS
Dimensions / Criteria r c r + c r - c
Entertainment (D1) 0.5824 0.4459 1.0284 0.1365
Ticket (C11) 0.8964 0.9167 1.8131 -0.0204
Program performance (C12) 0.8285 0.7665 1.5949 0.0620
Varied program (C13) 0.9740 0.7951 1.7691 0.1788
Program arrangement (C14) 0.9389 0.8652 1.8040 0.0737
Food and beverages (C15) 0.5514 0.6863 1.2377 -0.1349
Souvenir (C16) 0.4501 0.6093 1.0593 -0.1592
Transportation (D2) 0.5448 0.5736 1.1185 -0.0288
Public transport (C21) 0.7228 0.8583 1.5811 -0.1356
Way to location (C22) 0.8187 0.8760 1.6947 -0.0574
Parking location (C23) 0.7976 0.7986 1.5962 -0.0010
Distance to location (C24) 0.9039 0.8126 1.7165 0.0913
Venue (C25) 0.8207 0.7181 1.5388 0.1026
Information (D3) 0.5113 0.5635 1.0748 -0.0522
Pre-information (C31) 0.9346 0.9327 1.8673 0.0019
Pamphlet and signage (C32) 0.9669 0.8080 1.7749 0.1590
Guide (C33) 0.8384 0.7984 1.6368 0.0400
Varied information (C34) 0.8223 0.9298 1.7521 -0.1076
Staff performance (C35) 0.7856 0.8187 1.6043 -0.0331
Number of Staff (C36) 0.7864 0.8466 1.6330 -0.0602
95
International Journal of Trade, Economics and Finance, Vol. 4, No. 3, June 2013
Environment (D4) 0.4212 0.4767 0.8978 -0.0555
Cleanliness (C41) 0.3980 0.5072 0.9052 -0.1091
Restroom (C42) 0.4236 0.4347 0.8583 -0.0111
Entrance and exit (C43) 0.4304 0.3268 0.7572 0.1036
Rest area (C44) 0.3981 0.3815 0.7796 0.0166
V. CONCLUSION
At present, event providers constantly put efforts in
providing satisfactory environment for visitors. When
provider can deliver more satisfying product and service
quality, then they will be capable taking lead among
competitive circumstances in event industries. However,
different types or characteristics of events including the
factors of event quality may or may not same, but those
factors are various and complicated. So, the methodologies
should be taken as consideration in order to achieve the goal.
Getz [29] noted that the approaches from various research
methodologies are found to be useful in establishing event
structure. This research applied DEMATEL method to
construct an influence relationships system, which can assist
decision makers to directly evaluate and improve factors of
events according to their influential degree.
However, the results of this research may not be
generalized to other types of events because probably there is
sampling error in one sampling event. Future research may
take other objects, industry fields or methodologies for
gaining knowledge, obtaining useful insights and advancing
concepts in event studies. The application of DEMATEL can
support provider to discover the prioritization of event
quality improvement and direct their attention to create a
better event quality.
REFERENCES
[1] D. Getz, Festivals, Special Events, in Khan, M. A., Olsen, M. D. and T.
Var, (Eds), Encyclopedia of Hospitality and Tourism, Van Nostrand
Reinhold, New York, NY, 1993, pp. 789-810.
[2] J. L. Crompton and S. L. McKay, “Measuring the economic impacts of
festivals and events: Some myths, misapplications and ethical
dilemmas,” Festival Management & Event Tourism, vol. 2, no.1, pp.
33–43, 1994.
[3] D. Getz, Event Management and Event Tourism, New York: Cognizant
Communication, 1997.
[4] D. Felsenstein and A. Fleischer, “Local Festivals and Tourism
Promotion: The Role of Public Assistance and Visitor Expenditure,”
Journal of Travel Research, vol. 41, no.4, pp. 385-392, 2003.
[5] C. Lee, Y. Lee, and B. Wicks, “Segmentation of festival motivation by
nationality and satisfaction,” Tourism Management, vol. 25, no. 1, pp.
61-70, 2004.
[6] B. McKercher, W. Mei, and T. Tse, “Are short duration festivals tourist
attractions?” Journal of Sustainable Tourism, vol. 14, no. 1, pp. 55-66,
2006.
[7] Y. Lee, C. Lee, S. Lee, and B. Babin, “Festivalscapes and patrons‟
emotions, satisfaction and loyalty,” Journal of Business Research, vol.
61, no. 1, pp. 56-64, 2008.
[8] Y. W. Chen, and G. H. Tzeng, “Using fuzzy integral for evaluating
subjectively perceived travel costs in a traffic assignment model”,
European Journal of Operational Research, vol. 130, pp. 653–664,
2001.
[9] G. H. Tzeng and J. J. Huang, Multiple Attribute Decision Making:
Methods and application, New York: CRC Press, Taylor & Francis
publishing group, 2011.
[10] J. L. Crompton and L. Love, “The Predictive Validity of Alternative
Approaches to Evaluating Quality of a Festival,” Journal of Travel
Research, vol. 34, no. 1, pp. 11-24, 1995.
[11] D. Getz, M. O‟Neill, and J. Carlsen, “Service Quality Evaluation at
Events through Service Mapping,” Journal of Travel Research, vol. 39,
pp. 380-390, 2001.
[12] D. R. Howard, and J. L. Crompton, Financing, Managing, and
Marketing Recreation and Park Resources, Wm. C. Brown Company,
Dubuque, Iowa, 1980.
[13] F. Herzberg, B. Mausner, and B. B. Snyderman, The motivation to
work, New. York: Wiley, 1959.
[14] M. Bitner, “Evaluating Service Encounters: The Effects of Physical
Surroundings and Employee Responses,” Journal of Marketing, vol.
54, April, pp. 69-82, 1990.
[15] J. L. Crompton, “Adapting Herzberg: A Conceptualization of the
Effects of Hygiene and Motivator Attributes on Perceptions of Event
Quality,” Journal of Travel Research, vol. 41, pp. 305-310, 2003.
[16] A. Mehrabian and J. Russell, An Approach to Environmental
Psychology, Cambridge, Mass.: MIT Press, 1974.
[17] P. J. Brown, “Quality in Recreation Experience, in Outdoor Recreation
Benchmark 1988: Proceedings of the National Recreation Forum, A.
H. Watson (ed.), Tampa, Florida, USDA Forest Service, General
Technical Report SE-52, 1988.
[18] J. L. Crompton and S. L. McKay, “Motives of visitors attending
festival events,” Annals of Tourism Research, vol. 6, no. 4, pp. 425-39,
1997.
[19] R. D. Childress and J. L. Crompton, “A comparison of alternative
direct and discrepancy approaches to measuring quality of performance
at a festival,” Journal of Tourism Research,, vol. 36, no. 2, pp. 43-57,
1997.
[20] D. A. Baker and J. L. Crompton, “Quality, satisfaction and behavioral
intentions,” Annals of Tourism Research, vol. 27, no. 3, pp. 785-804,
2000.
[21] S. T. Cole and J. L. Crompton, “A conceptualization of the
relationships between service quality and visitor satisfaction, and their
links to destination selection,” Leisure Studies, vol. 22, pp. 65-80,
2003.
[22] Y. S. Yoon, J. S. Lee, and C. K. Lee, “Measuring festival quality and
value affecting visitors‟ satisfaction and loyalty using a structural
approach,” International Journal of Hospitality Management, vol. 29
pp. 335–342, 2010.
[23] S. T. Cole and H. C. Chancellor, “Examining the festival attributes that
impact visitor experience, satisfaction and re-visit intention,” Journal
of Vacation Marketing, vol. 15, pp. 323-333, 2009.
[24] V. Y. C. Chen, H. P. Lien, C. H. Liu, J. J. H. Liou, G. H. Tzeng, and L.
S. Lang, “Fuzzy MCDM approach for selecting the best
environment-watershed plan,” Applied soft computing, vol. 11, pp.
265-275, 2011.
[25] C. H. Huang, G. H. Tzeng, and W. R. Ho, “System on chip design
service e-business value maximization through a novel MCDM
framework,” Expert Systems with Applications, vol. 38, pp. 7947-7962,
2011.
[26] C. Y. Huang, J. Z. Shyu, and G. H. Tzeng, “Reconfiguring the
innovation policyportfolios for Taiwan‟s SIP mall industry,”
Technovation, vol. 27, pp. 744-765, 2007.
[27] J. L. Yang and G. H. Tzeng, “An integrated MCDM technique
combined with DEMATEL for a novel cluster-weighted with ANP
method,” Expert Systems with Applications, vol. 38, pp. 1417-1424,
2011.
[28] F. Saleh and C. Ryan, “Jazz And Knitwear: Factors That Attract
Tourists To Festivals,” Tourism Management, vol. 14, no. 4, pp.
289-297, 1993.
[29] D. Getz, “Event tourism: Definition, evolution, and research,” Tourism
Management, vol. 29, pp. 403–428, 2008.
Wen-Tsann Yang was born in Taipei, Taiwan on
December 9th, 1955. He finished his M.S degree of
Forestry from University of Montana, Missoula,
Montana, USA in 1984, and earned Ph. D degree of
Geography from Southern Illinois University,
Carbondale, Illinois, USA in 1992. After his study in
USA, he went back to Taiwan to serve as an associate
professor in Department of Land management at Feng
Chia University, Taichung, Taiwan. He has been
teaching some courses such as: Environment and Ecology, Commercial
Recreation Management in undergraduate program, and Recreation Theories,
Graduate Seminar and Conflict Management in graduate program for more
than 20 years. Besides teaching, he has continued conducting research
financially supported by National Science Council in Taiwan. The major
study topics including: visitors‟ littering behaviors in recreation areas,
ecotourism planning and management in aboriginal tribal areas, sexual
leisure in metropolitan areas, and so on.
He was a co-author of a book with other 19 authors, titled as “Leisure and
Recreation: Theories and Practices”, edited by Dr. Ou with 1st edition in
2007 and 2nd edition in 2011, respectively published by Chien-Tsen Cultural
Business Co. New Taipei City, Taiwan. Various articles based on his studies
96
International Journal of Trade, Economics and Finance, Vol. 4, No. 3, June 2013
were published both in different journals and conference proceedings. The
future study in which he is interested would be topics relevant to emotional
labor in service business, such as managers of recreation areas, real estate
agents and/or tour guides.
Dr. Yang has been serving as executive councilor in the board of Outdoor
Recreation Association in Taiwan, Member of the Evaluation Team in
Taiwan Tourism Bureau, Paper Reviewer of Journal of Outdoor Recreation
Studies in Taiwan, and so on for many years. In addition, he won Excellent
Teacher Award from Feng Chia University, Taichung Taiwan in 1997,
Contribution Award 2011 and 2012 from Overseas Mandarin Council in
Taiwan.
Wen-Hua Liu was born in Taipei, Taiwan on April 25th,
1969. He has a master‟s degree of tourism management
from Chinese Culture University, Taipei, Taiwan in
2008. He is currently a third year PhD student at Feng
Chia University, Taichung, Taiwan in Civil and
Hydraulic Engineering with resource management as
major field of study.
He started his own business in human resources and
travel services industries. Besides, he has been teaching
Tourism English at Taipei College of Maritime Technology for the past five
years, and has been actively teaching Travel and Industry Management at
Feng Chia University, Taichung, Taiwan since 2012.
He has published several papers based on the Ph. D research which focus
on fields of tourism and recreation, as well as other fields related to resource
management. His research interests are including tourism management and
MCDM (Multiple Criteria Decision Making) methods.
Hsin-Hsien Liu was born in Taichung, Taiwan on
October 8th, 1981. He was graduated from Feng Chia
University Ph. D. program in Civil and Hydraulic
Engineering, Taichung, Taiwan in 2012, with the
railway industry reform as major field of study.
He had worked as research assistant in Research
Center of Traffic Accident Appraisal (RCTAA) and
Advanced Traffic Management Center in Feng Chia
University, Taichung Taiwan during 2006-2012. He
also has been teaching Transportation data analysis and Transportation
decision making analysis during 2011-2012 at Department of Transportation
Technology and Management, Feng-Chia University, Taichung, Taiwan.
Currently, he has been serving in the army to be the Substitute Military
Service since December 2012.
He has published several papers which about transportation safety and
railway operation used data mining and MCDM methods. His research
interests contain railway industry operation and reform, traffic accident
safety and analysis, multiple criteria decision making and data mining.
Lanasari was born in Jakarta, Indonesia on March 13th,
1985. She was graduated from SMUK Kalam Kudus I
Senior High School, Jakarta, Indonesia, in 2002, major
in science. She was studied abroad at Feng Chia
University, Taichung, Taiwan in 2012, with Tourism
and Hospitality Management as major field of study.
She had worked as Finance and Accounting Staff at
a company in Jakarta, Indonesia for five years. She also
has been teaching since 2008 at Suci Hati School,
Jakarta, Indonesia, responsible for educating junior
high school students in several subjects (Mathematic, Science and Chinese
language).
She is interested in social sciences, statistic study and research
methodologies, such as MCDM (Multiple Criteria Decision Making)
methods.
97
International Journal of Trade, Economics and Finance, Vol. 4, No. 3, June 2013