EVALUATING GEORGIA’S COMPACTION REQUIREMENTS FOR STONE MATRIX … · EVALUATING GEORGIA’S...
42
FINAL REPORT EVALUATING GEORGIA’S COMPACTION REQUIREMENTS FOR STONE MATRIX ASPHALT MIXTURES By: Randy C. West Jason R. Moore June 2006
Transcript of EVALUATING GEORGIA’S COMPACTION REQUIREMENTS FOR STONE MATRIX … · EVALUATING GEORGIA’S...
FINAL REPORT
EVALUATING GEORGIA’S COMPACTION REQUIREMENTS FOR STONE MATRIX ASPHALT MIXTURES
By:
Randy C. West Jason R. Moore June 2006
EVALUATING GEORGIA’S COMPACTION REQUIREMENTS FOR STONE MATRIX ASPHALT MIXTURES
By
Randy C. West Assistant Director
National Center for Asphalt Technology Auburn University, Alabama
and
Jason R. Moore
Research Engineer National Center for Asphalt Technology
Auburn University, Alabama
Sponsored by
The Georgia Department of Transportation
June 2006
i
1.Report No.: FHWA-GA-06-2036
2. Government Accession No.:
3. Recipient's Catalog No.:
5. Report Date: June 2006
4. Title and Subtitle: Evaluating Georgia DOT’s Compaction Requirements for Stone Matrix Asphalt Mixes
6. Performing Organization Code:
7. Author(s): Randy C. West, Ph.D., P.E. Jason R. Moore
8. Performing Organ. Report No.: 2036
10. Work Unit No.:
9. Performing Organization Name and Address: National Center for Asphalt Technology 277 Technology Parkway Auburn, AL 36830
11. Contract or Grant No.: SPR00-0006-00(358) 13. Type of Report and Period Covered: Final; August 2004 – May 2006
12. Sponsoring Agency Name and Address: Georgia Department of Transportation Office of Materials and Research 15 Kennedy Drive Forest Park, GA 30297-2534
14. Sponsoring Agency Code:
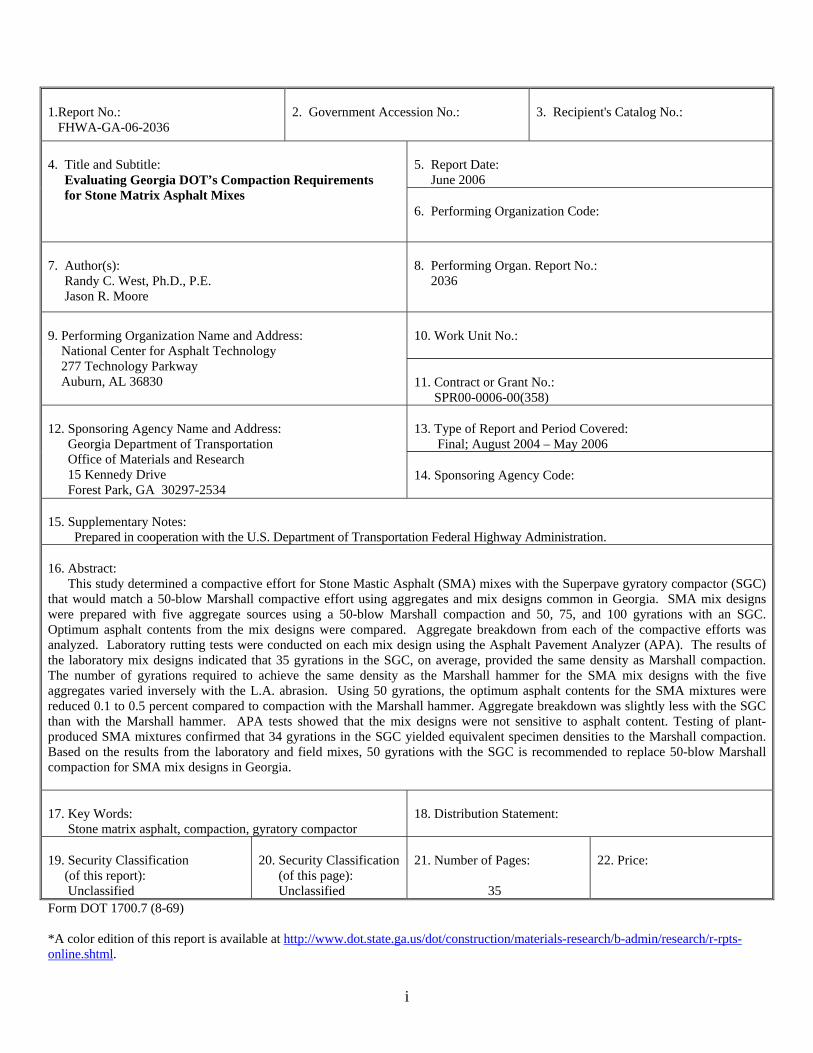
15. Supplementary Notes: Prepared in cooperation with the U.S. Department of Transportation Federal Highway Administration. 16. Abstract: This study determined a compactive effort for Stone Mastic Asphalt (SMA) mixes with the Superpave gyratory compactor (SGC) that would match a 50-blow Marshall compactive effort using aggregates and mix designs common in Georgia. SMA mix designs were prepared with five aggregate sources using a 50-blow Marshall compaction and 50, 75, and 100 gyrations with an SGC. Optimum asphalt contents from the mix designs were compared. Aggregate breakdown from each of the compactive efforts was analyzed. Laboratory rutting tests were conducted on each mix design using the Asphalt Pavement Analyzer (APA). The results of the laboratory mix designs indicated that 35 gyrations in the SGC, on average, provided the same density as Marshall compaction. The number of gyrations required to achieve the same density as the Marshall hammer for the SMA mix designs with the five aggregates varied inversely with the L.A. abrasion. Using 50 gyrations, the optimum asphalt contents for the SMA mixtures were reduced 0.1 to 0.5 percent compared to compaction with the Marshall hammer. Aggregate breakdown was slightly less with the SGC than with the Marshall hammer. APA tests showed that the mix designs were not sensitive to asphalt content. Testing of plant-produced SMA mixtures confirmed that 34 gyrations in the SGC yielded equivalent specimen densities to the Marshall compaction. Based on the results from the laboratory and field mixes, 50 gyrations with the SGC is recommended to replace 50-blow Marshall compaction for SMA mix designs in Georgia. 17. Key Words: Stone matrix asphalt, compaction, gyratory compactor
18. Distribution Statement:
19. Security Classification (of this report): Unclassified
20. Security Classification (of this page): Unclassified
21. Number of Pages:
35
22. Price:
Form DOT 1700.7 (8-69) *A color edition of this report is available at http://www.dot.state.ga.us/dot/construction/materials-research/b-admin/research/r-rpts-online.shtml.

DISCLAIMER
The contents of this report reflect the views of the author who is solely responsible for the facts and accuracy of the data presented herein. The contents do not necessarily reflect the official view of the National Center for Asphalt Technology, Auburn University, the Georgia Department of Transportation, or the Federal Highway Administration. This report does not constitute a standard, specification, or regulation.
i

TABLE OF CONTENTS
EXECUTIVE SUMMARY ......................................................................................... iii INTRODUCTION .........................................................................................................1 Background........................................................................................................1 Purpose...............................................................................................................2 Scope..................................................................................................................2 Literature Review...............................................................................................2 EXPERIMENTAL PLAN .............................................................................................6 Task 1 – Material Selection ...............................................................................7 Task 2 – Prepare Mix Designs ...........................................................................7 Task 3 – Performance Testing ...........................................................................8 Task 4 – Field Verification of Ndesign Level .......................................................8 RESULTS AND ANALYSIS........................................................................................9 Laboratory Mix Design......................................................................................9 APA Testing of Laboratory Mix Designs........................................................16 Aggregate Breakdown for Laboratory Mix Designs .......................................16 Field Verification of Ndesign Level....................................................................20 Aggregate Breakdown for Field SMA Mixtures .............................................24 APA Testing on Field SMA Mixtures .............................................................25 Discussion of Results.......................................................................................25 Influence of SGC Angle of Gyration ...............................................................27 Summary ..........................................................................................................28 CONCLUSIONS AND RECOMMENDATIONS ......................................................29 Conclusions......................................................................................................29 Recommendations............................................................................................29 REFERENCES ............................................................................................................30 APPENDIX..................................................................................................................32
ii

EXECUTIVE SUMMARY Since the early 1990’s when Stone Matrix Asphalt (SMA) mixtures were first introduced into the United States, the Georgia Department of Transportation (GDOT) has been a leader in the use of SMA and has influenced several other states in the performance benefits of this mix type for heavy loaded pavements. SMA mixtures have now performed well in Georgia for more than a decade. Following the practices of European countries where SMA was developed, the mix design procedure used in Georgia and most other states in the U.S. has been based on the 50 blow Marshall hammer compactive effort. Since the use of the Marshall compaction procedure has declined significantly with the implementation of Superpave, there has been an interest for some time to change the compaction method to utilize the Superpave gyratory compactor (SGC) in place of the Marshall hammer for the design and quality control testing of SMA. Previous research at NCAT attempted to correlate the 50 blow Marshall hammer compactive effort to compaction in the Superpave gyratory compactor. Recommendations were made in NCHRP 9-8 to use 100 gyrations for aggregates having L.A. abrasion loss values of 30 percent or less, and 70 gyrations for aggregates having L.A. abrasion loss values greater than 30 percent. In the AASHTO procedure for SMA mix design, the standard compactive effort was set at 100 gyrations and a footnote was added that permits the use of 75 gyrations for aggregates having L.A. abrasion values greater than 30. More recent research with a variety of aggregates used in Alabama found that 70 gyrations on average in the SGC yielded the best overall match to Marshall compaction. However, as with the previous study, the scatter of the data was fairly wide and the number of equivalent gyrations for the mixtures studied was shown to be influenced by aggregate source and the maximum aggregate size. The objective of this study was to determine a compactive effort with the SGC that would match the 50 blow Marshall hammer using aggregates and mix designs common in Georgia. To accomplish this objective, SMA mix designs were prepared with five approved SMA aggregate sources using the 50 blow Marshall compactive effort and using 50, 75, and 100 gyrations with a SGC. Optimum asphalt contents from the mix designs were compared. To evaluate the potential of over compaction in the SGC, comparisons of aggregate breakdown from each of the compactive efforts were analyzed. To assure that the mixtures achieved good stone-on-stone contact, laboratory rutting tests were conducted on each of the mix designs. The results of the laboratory prepared mix designs indicate that 35 gyrations in the SGC generally provided the same laboratory density as the Marshall hammer compaction. This result was considerably lower than expected. At 50 gyrations, the optimum asphalt contents for the SMA mixtures were reduced by 0.1 to 0.5 percent compared to mix designs with Marshall compaction. However, four of the five mix designs with 50 gyrations met all of the GDOT SMA mix specifications. The criterion that the one mix failed was the minimum asphalt content. Aggregate breakdown was slightly less with the SGC compared to the Marshall hammer. Tests to evaluate the rutting potential using the Asphalt Pavement Analyzer showed that the mix designs were not sensitive to asphalt content and all tests easily passed the GDOT requirement. Further testing and analysis with several plant produced SMA mixtures confirmed that about 35 gyrations in the SGC yielded equivalent specimen densities to the Marshall hammer. On
iii
average, the field mixtures required 34 gyrations to match the density from the Marshall hammer. As with the laboratory results, analysis of the aggregate breakdown for the plant produced mixtures showed that compaction in the SGC caused less breakdown than compaction with the Marshall hammer. Slightly more breakdown was evident as gyrations increased from 50 to 100. All of the samples made with the field mixtures performed well in the APA tests. Based on the results and the lab and field mixes, 50 gyrations with the SGC is recommended to replace 50 blow Marshall hammer for SMA mix design in Georgia. Fifty gyration mixtures have been used in some locations, most notably at the NCAT test track, and have performed very well.
iv

EVALUATING GEORGIA’S COMPACTION REQUIREMENTS FOR STONE MATRIX ASPHALT MIXTURES
Randy C. West and Jason R. Moore
INTRODUCTION
Background Stone Matrix Asphalt (SMA) has been used for over a decade in the United States as a premium asphalt mixture to resist rutting and cracking on many heavy traffic roadways. SMA was originally developed in Germany in the 1960’s to combat studded tires (1). A 1990 study tour of European paving practices found many countries using the SMA mix technology. SMA mixtures were introduced in the United States in 1991 when Georgia, Indiana, Michigan, Missouri, and Wisconsin constructed SMA projects. By 1997, over 100 SMA projects had been placed in the United States representing over three million tons of mix (2). The technical basis for SMA is a stone skeleton with stone-on-stone contact, unlike traditional dense graded mixes where aggregates tend to “float” in the mix with little contact between the larger aggregate particles. The coarse aggregate must be hard, durable, and roughly cubical in shape when crushed. The stone-on-stone contact between the high quality aggregate resists the shear forces created by the applied loads creating a very rut resistant pavement. SMA also typically utilizes a modified binder and some type of fiber to prevent the binder from draining off of the aggregate, especially during handling and construction. High percentages of mineral filler and binder create a glue-like mastic to hold the stone together and fill in the spaces between the coarse aggregate skeleton. This mastic filled skeleton prevents water intrusion and provides excellent durability. SMA has been increasing in popularity in the United States, and 28 states now utilize SMA, which has been reported to provide a 20 to 30 percent increase in pavement life over conventional pavements (2). In 1994, the Georgia Department of Transportation (GDOT) initiated a policy to use SMA on all interstates and other highways with greater than 30,000 Equivalent Single Axle Loads (ESALs) over a twenty year design period. In Georgia, current specifications allow SMA mixtures to be designed either by Marshall hammer or using 50 gyrations in a Superpave gyratory compactor (SGC). Various previous studies have recommended gyratory compaction levels from 70 to 100 gyrations for SMA mix design (3-6). Although a few states have attempted to use gyratory compactors for SMA mix design, most agencies and or contractors in the U.S continue to use 50 blow Marshall for the design of SMA mixes.
1
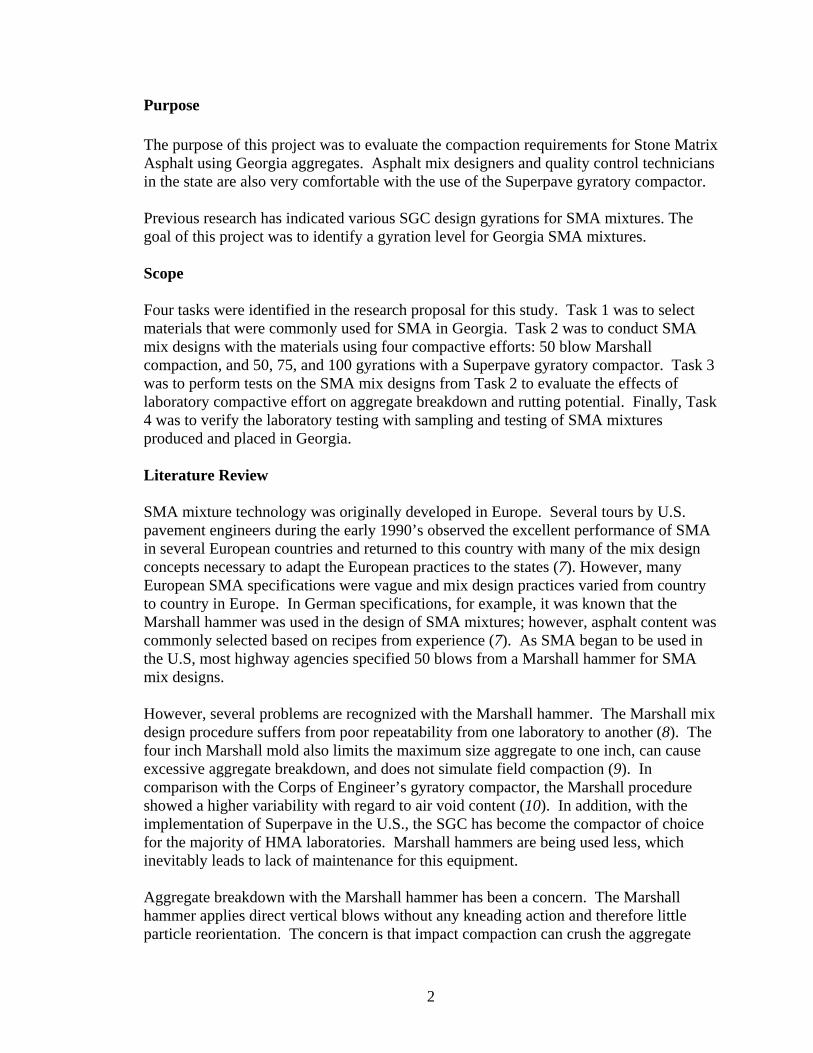
Purpose The purpose of this project was to evaluate the compaction requirements for Stone Matrix Asphalt using Georgia aggregates. Asphalt mix designers and quality control technicians in the state are also very comfortable with the use of the Superpave gyratory compactor. Previous research has indicated various SGC design gyrations for SMA mixtures. The goal of this project was to identify a gyration level for Georgia SMA mixtures.
Scope Four tasks were identified in the research proposal for this study. Task 1 was to select materials that were commonly used for SMA in Georgia. Task 2 was to conduct SMA mix designs with the materials using four compactive efforts: 50 blow Marshall compaction, and 50, 75, and 100 gyrations with a Superpave gyratory compactor. Task 3 was to perform tests on the SMA mix designs from Task 2 to evaluate the effects of laboratory compactive effort on aggregate breakdown and rutting potential. Finally, Task 4 was to verify the laboratory testing with sampling and testing of SMA mixtures produced and placed in Georgia. Literature Review
SMA mixture technology was originally developed in Europe. Several tours by U.S. pavement engineers during the early 1990’s observed the excellent performance of SMA in several European countries and returned to this country with many of the mix design concepts necessary to adapt the European practices to the states (7). However, many European SMA specifications were vague and mix design practices varied from country to country in Europe. In German specifications, for example, it was known that the Marshall hammer was used in the design of SMA mixtures; however, asphalt content was commonly selected based on recipes from experience (7). As SMA began to be used in the U.S, most highway agencies specified 50 blows from a Marshall hammer for SMA mix designs. However, several problems are recognized with the Marshall hammer. The Marshall mix design procedure suffers from poor repeatability from one laboratory to another (8). The four inch Marshall mold also limits the maximum size aggregate to one inch, can cause excessive aggregate breakdown, and does not simulate field compaction (9). In comparison with the Corps of Engineer’s gyratory compactor, the Marshall procedure showed a higher variability with regard to air void content (10). In addition, with the implementation of Superpave in the U.S., the SGC has become the compactor of choice for the majority of HMA laboratories. Marshall hammers are being used less, which inevitably leads to lack of maintenance for this equipment. Aggregate breakdown with the Marshall hammer has been a concern. The Marshall hammer applies direct vertical blows without any kneading action and therefore little particle reorientation. The concern is that impact compaction can crush the aggregate
2

more than field roller compaction. In Evaluation of Laboratory Properties of SMA Mixtures, Brown and Manglorkar (11) discuss twelve states that placed SMA mixtures in 1993. All of the states used 50 blows with a Marshall hammer. It was reasoned that 75 blows would break down the aggregate more and would not result in a significant increase in density compared to 50 blows. Brown reported that as Marshall blow count increases breakdown significantly increases, but as gyrations increase breakdown increases only slightly. The study also compared aggregate breakdown from 50 blow Marshall to 100 gyrations with the SGC. The SGC resulted in less aggregate breakdown (4). Some laboratory aggregate breakdown is acceptable if it is comparable with the aggregate breakdown found during construction. When the aggregate breakdown becomes excessive, a mixture may not be able to meet minimum VMA requirements (12). Prowell found that in Virginia, density increases with a 9.5mm SMA beyond the point where stone-on-stone contact was achieved is most likely due to aggregate breakdown (6). The Los Angeles abrasion loss (L.A. abrasion) is an important aggregate characteristic for good SMA performance. This test provides an indication of the toughness and degradation resistance of an aggregate. Some studies show a fairly good correlation between L.A. abrasion and aggregate breakdown during lab compaction. An increase in L.A. abrasion generally corresponds to an increase in aggregate breakdown for both Marshall and Superpave gyratory compactors (13). The SMA Technical Working Group recommended a maximum L.A. abrasion value of 30 percent to minimize aggregate breakdown (14). The National Asphalt Pavement Association publication Designing and Constructing SMA Mixtures (2) suggests that L.A. abrasion values less than 30 percent should receive 100 gyrations for design and L.A. abrasion values between 30 and 45 percent should be designed at 75 gyrations. This widely referenced publication also states that aggregates with L.A. abrasion values greater than 30 percent should not be used in the wearing course (2). Several states, including Georgia, have had a great deal of success with SMA mixtures containing aggregates with L.A. abrasion values above 30 percent. Georgia and Wisconsin allow a maximum L.A. abrasion value of 45 percent (15,16). Alabama allows aggregates with L.A. abrasion values up to 48 percent (17). Volumetric properties of SMA mixtures are influenced by the compaction type and effort. Most agencies require a minimum VMA of 17.0 percent for SMA mixtures, regardless of the compactor type and effort. VMA of a given mixture is directly related to compactive effort. Brown et. al. (18) showed that increasing the number of gyrations by 25 generally reduced VMA by one percent. Another key volumetric property used in the design of SMA mixtures is the voids in coarse aggregate ratio (VCA ratio) (19). The VCA ratio was developed to ensure stone-on-stone contact of the coarse aggregate in an SMA mixture. This parameter can also be affected by aggregate breakdown. If the coarse aggregate degrades, the calculated VCA ratio will decrease due to the smaller particles of aggregate filling in the voids. If the compacted mixture has excessive breakdown and is compared with the voids in coarse aggregate compacted by the dry rodded condition (VCAdrc), the VCA ratio may appear to be acceptable, when in fact the mixture has only achieved the acceptable VCA ratio because of the aggregate breakdown.
3

SGC: y = 0.3732x - 3.3991R2 = 0.8609
Marshall: y = 0.3192x + 1.6599R2 = 0.6324
-2.0
2.0
6.0
10.0
14.0
18.0
22.0
26.0
10 20 30 40 50 60
LA Abasion value, %
4.75
mm
Sie
ve B
reak
dow
n, %
Figure 1. Correlations of Aggregate Breakdown During Lab Compaction
and Aggregate Toughness from NCHRP 9-8 One of the tasks in NCHRP 9-8, Designing Stone Matrix Asphalt Mixtures, was to correlate the 50 blow Marshall hammer compaction to compaction in the SGC (4). For this task, SMA mixtures from eleven field projects across the U.S. were sampled and compacted with the Marshall hammer to 50 blows and with the SGC to 100 gyrations. From the gyratory data, the bulk specific gravity of the mixture, Gmb, was back-calculated to 50, 60, 70, 80, and 90 gyrations. This data was used to develop the correlation shown in Figure 2. Although there was significant variability in the data from the field project mixtures, it was estimated that on average 78 gyrations in the SGC would provide the same density as 50 blows of the Marshall hammer (7). Back-calculation of Gmb for coarse-graded and SMA mixtures is known to cause an error which over predicts the Gmb at lower numbers of gyrations. Correcting this error would be expected to result in fewer gyrations to match the Marshall hammer.
4

y = 0.0006x + 0.9539R2 = 0.4241
0.950
0.960
0.970
0.980
0.990
1.000
1.010
1.020
1.030
1.040
40 50 60 70 80 90 100 110
Number of Gyrations
Gm
b R
atio
(Gyr
ator
y G
mb
/ Mar
shal
l Gm
b)
( )
Figure 2. Comparison of Densities Compacted with 50=Blows of the Marshall
Hammer and 100 Gyrations of the SGC- All Data (Ref. 7) A few U.S. highway agencies now use the SGC for laboratory compaction for SMA. Maryland, which has been at the forefront of SMA usage in the U.S, has used 100 gyrations for its SMA mixtures for several years (20). Prowell recommended 75 gyrations for 9.5mm NMAS SMA mixes in Virginia (6). Colorado allows either a 50 blow Marshall hammer or 100 gyrations from a Superpave gyratory compactor (21). NCAT recently completed a study for the Alabama Department of Transportation on this issue and recommended 70 gyrations for SMA mix design and quality control (5). The NCAT test track has also provided good information on SMA mix design and performance. In the original cycle of the test track built in 2000, five test sections were built using SMA. Aggregate types in the SMA sections ranged from granite to gravel and blends of limestone, slag and limestone, slag, and sandstone. All of the SMA mix designs for these sections utilized a 50 blow Marshall compactive effort. The track performance of the SMA sections was excellent under the heavy traffic loading on this facility. The Georgia DOT sponsored a pair of sections in the first cycle which compared the granite SMA to a Superpave mixture using aggregates from the same source. No significant difference was noted in the performance of the SMA and Superpave sections (22). In the second cycle of the test track, eight new SMA test sections were placed. Two sections used the same mixture and were part of the structural experiment. These SMA mixtures were also designed using a 50 blow Marshall hammer. Three new sections were placed using a 75 gyration mix design. These sections compared different aggregate sources in Missouri. The other three SMA sections placed in 2003 were designed with 50 gyrations in the SGC. All of these sections also performed very well with negligible
5
rutting and no signs of cracking or raveling (23). The excellent test track performance is evidence that 50 and 75 gyrations can be used to satisfactorily design SMA mixtures.
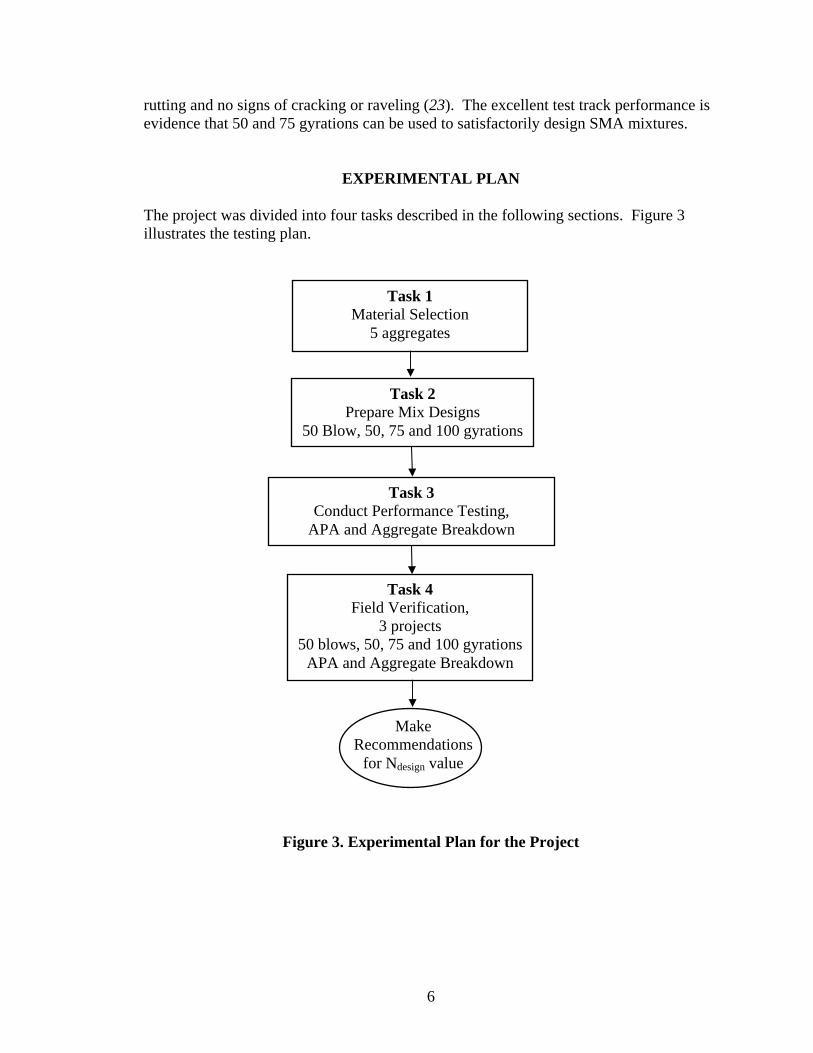
EXPERIMENTAL PLAN The project was divided into four tasks described in the following sections. Figure 3 illustrates the testing plan.
Task 1 Material Selection
5 aggregates
Task 2 Prepare Mix Designs
50 Blow, 50, 75 and 100 gyrations
Task 3 Conduct Performance Testing,
APA and Aggregate Breakdown
Task 4 Field Verification,
3 projects 50 blows, 50, 75 and 100 gyrations
APA and Aggregate Breakdown
Make Recommendations
for Ndesign value
Figure 3. Experimental Plan for the Project
6

Task 1-Material Selection Materials commonly used for SMA mixtures in Georgia were used in the study. The five aggregate sources used in the laboratory phase of the study are shown in Table 1. These aggregates cover a range of Los Angeles abrasion values and Flat & Elongated percentages within the Georgia specifications for SMA aggregates. Note that the data presented in Table 1 are from tests conducted at NCAT. The GDOT maximum limit for L.A. abrasion is 45 percent, and the maximum limit for flat and elongated particles at the 3:1 ratio is 20 percent (15). Due to these limitations, only seven quarries are currently able to produce SMA stone. Boral Materials Type C Fly Ash was used as the mineral filler in all laboratory prepared mixes. Cellulose fiber from Interfibe, added at 0.3 percent by weight of mixture, was used to minimize draindown. One percent hydrated lime was added to all mixes as required by GDOT specifications, and a PG 76-22 asphalt binder modified with styrene-butadiene-styrene (SBS) was used as the asphalt binder.
Table 1. Properties of Aggregates Used for Laboratory Designed SMA Mixes
Source Gsca1 Gsfa
2 LA Abrasion, %
Flat & Elongated3
% > 3:1 Camak 2.633 2.634 33 19.3 Candler 2.600 2.577 39 12.6
Lithia Springs 2.600 2.627 31 16.8 Mountain View 2.637 2.604 44 14.0
Ruby 2.720 2.722 16 17.3 1Bulk Specific Gravity of Coarse Aggregate 2 Bulk Specific Gravity of Fine Aggregate
3 Flat and Elongated, by count, length greater than three times average thickness Task 2- Prepare Mix Designs The selected materials were combined to produce gradations similar to GDOT approved mix designs. Table 2 shows the gradations for these mixes and the gradation limits from GDOT specification 828.2.02 Stone Matrix Asphalt Mixtures. The materials were mixed and compacted in accordance with the GDOT specification. Optimum asphalt contents were determined for each blend gradation to yield 3.5% air voids using a 50 blow Marshall hammer and 50, 75, and 100 gyrations with the SGC. A flat-faced, static Marshall hammer was used to compact samples with 50 blows per side. A Pine Instrument Co. model AFG1A Superpave gyratory compactor was used to compact the SMA samples to 50, 75, and 100 gyrations.
7

Table 2. Gradations Used in Laboratory Mix Designs Sieve Spec. Range Camak Candler Lithia Sp. Mtn. View Ruby
19 mm 100 100 100 100 100 100 12.5 mm 85-100 95 87 90 98 99 9.5 mm 50-75 63 56 62 64 72
4.75 mm 20-28 24 23 24 24 25 2.36 mm 16-24 18 16 19 20 19 1.18 mm -- 15 16 16 17 15 0.60 mm -- 13 14 14 15 13 0.30 mm 10-20 12 13 13 14 12
0.015 mm -- 10 11 12 10 11 0.075 mm 8-12 8.4 9.6 10.3 8.6 8.8
Task 3 – Performance Testing Mix designs completed with the gyratory compactor were prepared at the respective optimum binder contents corresponding to each Ndesign level to test for rutting potential with the Asphalt Pavement Analyzer (APA). These samples were prepared and tested according to GDT 115. Aggregate breakdown was also examined. Mix design samples compacted with the Marshall hammer and at each Ndesign level with the SGC were heated and broken down. The asphalt was then burned from the aggregate using the NCAT Ignition Oven and a sieve analysis was performed on the aggregate. Gradations were also performed on aggregate from samples of uncompacted mix after solvent extraction and the NCAT Ignition Oven to verify that there was no breakdown of the aggregate due to the ignition oven test. Task 4 – Field Verification of Ndesign Level In Task 4, three SMA projects in Georgia were sampled for verification of the laboratory phase. For each project, SMA mix from four consecutive days was sampled to include typical production variations. Samples were taken at the same time that a quality control sample was taken. Four cores corresponding to each sampled lot were also taken after the mix was placed and compacted on the roadway. The job mix formulas and quality control data for the samples were provided by the contractor (job mix formulas are shown in the appendix). For each project, the uncompacted plant mix from each of the four lots was compacted to 50 blows with the Marshall hammer and 50, 75 and 100 gyrations with the SGC. The bulk specific gravity of compacted samples was determined using AASHTO T-166. The maximum theoretical specific gravity for each sample was determined using AASHTO
8

T-209. The two sets of gyratory compacted samples representing the greatest range in characteristics were chosen for testing in the APA. This was determined by examining the contractor’s quality control data, the core densities, and the bulk specific gravities of the lab compacted samples. The samples were tested in the APA using the same test conditions used for the laboratory designed mixtures. Loose mix samples, cores, and the other lab compacted samples were used to evaluate aggregate breakdown.
RESULTS AND ANALYSIS
Laboratory Mix Designs
The most common analysis technique for comparing different laboratory compactive efforts has been to compare specimen densities resulting from the compaction methods. Specimen bulk specific gravity, Gmb, the ratio of the specimen density to the density of water, is simply an alternative expression of density. Table 3 shows the average bulk specific gravity results from the mix design testing for the five aggregate sources.
Table 3. Average Specimen Bulk Specific Gravities for the SMA Mixes with the Different Compactive Efforts
Asphalt Content, % Source Compaction 5.0 5.5 6.0 6.5 7.0 7.5 8.0
Marshall 2.265 2.263 2.292 50 Gyr. 2.278 2.288 2.297 75 Gyr. 2.307 2.316 2.339
Camak
100 Gyr. 2.321 2.332 2.335 Marshall 2.273 2.274 2.286 50 Gyr. 2.284 2.296 2.300 75 Gyr. 2.301 2.312 2.325
Candler
100 Gyr. 2.326 2.332 2.342 Marshall 2.267 2.273 2.266 50 Gyr. 2.278 2.290 2.300 75 Gyr. 2.295 2.324 2.319
Lithia Springs
100 Gyr. 2.326 2.328 2.333 Marshall 2.299 2.309 2.313 50 Gyr. 2.318 2.336 2.346 75 Gyr. 2.346 2.365 2.369
Mtn. View
100 Gyr. 2.366 2.384 2.379 Marshall 2.350 2.357 2.262 50 Gyr. 2.337 2.351 2.353 75 Gyr. 2.344 2.359 2.362
Ruby
100 Gyr. 2.386 2.398 2.401
9

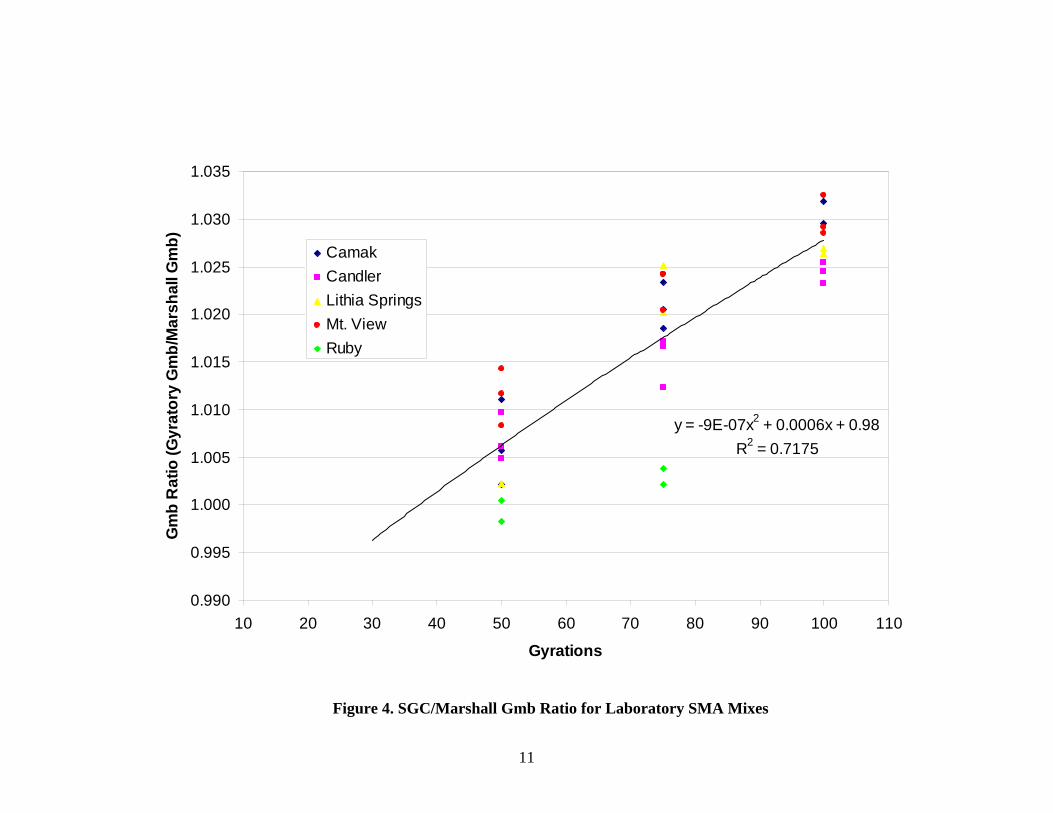
To compare the compactive effort between the Marshall hammer and the Superpave gyratory compactor, analyses were made of Gmb ratios. Gmb ratios were calculated by dividing the average Gmb of gyratory samples by the average Gmb of the Marshall samples. For this analysis to be valid, it was necessary for the asphalt content be the same for the samples in the numerator and the denominator. Gmb ratios were calculated for each gyration level. Figure 4 shows the graph of Gmb ratio versus gyrations for all of the laboratory designed mixes. The graph shows a regression for all the mixture data combined which indicates that 35 gyrations, on average, in the SGC yields the same density as 50 blows with a Marshall hammer. This result is much lower than expected. Other studies have found that 60 to 80 gyrations in the SGC typically yields equivalent specimen densities to the 50 blow Marshall hammer. Linear regressions for the data were also computed for each of the five mixtures individually. The regressions based on the individual mixes are summarized in Table 4.
10
Table 4. Regressions for Gmb Ratio and Gyrations for the Five Lab SMA Mixtures
To investigate the reason for the relatively low and wide range of equivalent gyrations, several mix and aggregate characteristics were evaluated. The factor that had greatest influence on the equivalent gyrations was the L.A. abrasion of the coarse aggregate. Figure 5 indicates that the relationship is quite strong between LA. abrasion and the number of gyrations to achieve a density equivalent to the Marshall hammer. Aggregates with higher L.A. abrasion values are less resistant to compaction in the stone-on-stone condition in SMA mixtures allowing the mix to achieve a higher density in fewer gyrations. However, this higher density is achieved as a consequence of more breakdown of the aggregate as will be discussed in a later section.
Source Regression Equation R2
Predicted Gyrations for Gmb Ratio = 1
Camak Gmb Ratio = 0.0005(gyr.) + 0.9823 0.92 35
Candler Gmb Ratio = 0.0004(gyr.) + 0.9892 0.94 27
Lithia Springs Gmb Ratio = 0.0004(gyr.) + 0.9848 0.79 38
Mtn. View Gmb Ratio = 0.0004(gyr.) + 0.9935 0.92 16
Ruby Gmb Ratio = 0.0001(gyr.) + 0.9921 0.78 79
y = -9E-07x2 + 0.0006x + 0.98R2 = 0.7175
0.990
0.995
1.000
1.005
1.010
1.015
1.020
1.025
1.030
1.035
10 20 30 40 50 60 70 80 90 100 110
Gyrations
Gm
b R
atio
(Gyr
ator
y G
mb/
Mar
shal
l Gm
b) CamakCandlerLithia SpringsMt. ViewRuby
Figure 4. SGC/Marshall Gmb Ratio for Laboratory SMA Mixes
11

y = -2.2262x + 111.7R2 = 0.9783
0
10
20
30
40
50
60
70
80
90
10 15 20 25 30 35 40 45 50
L.A. Abrasion
Equi
vale
nt G
yrat
ions
Figure 5. Correlation Between L.A. Abrasion and Gyrations to Achieve the
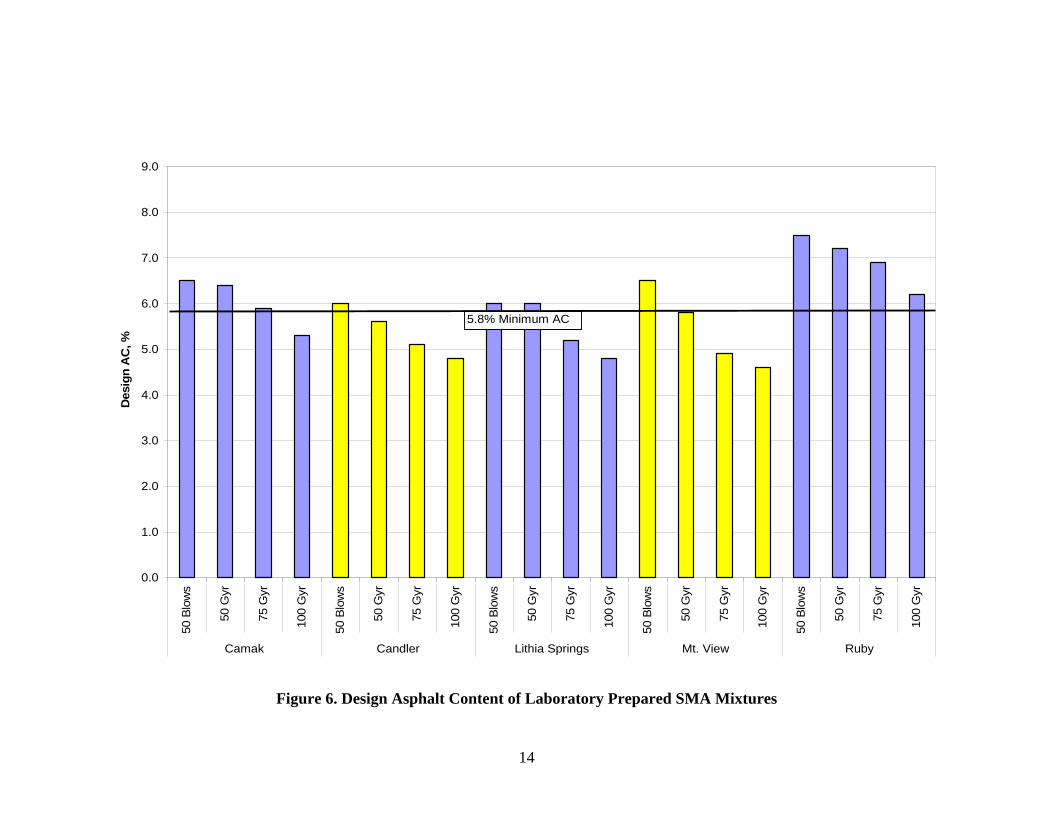
Same Density as with a 50 Blow Marshall Hammer Further analysis was made of the laboratory mixtures to determine the asphalt content to achieve a target air void content of 3.5 percent. A summary of the “optimum” asphalt contents and voids filled with asphalt (VFA) for the laboratory mix designs with the five aggregate sources is shown in Table 5. The GDOT mix design binder content range for 12.5 mm SMA mixes is 5.8 to 7.5 percent and the VFA range is 70 to 90 percent. The results that do not meet these mix design specifications are shown in bold. From this summary, it can easily be seen that four of the five aggregates did not meet the minimum asphalt content using 100 gyrations and three of the five mixtures did not met the minimum asphalt content at 75 gyrations. Only the Candler aggregate did not meet the minimum asphalt content requirement at 50 gyrations with a target air void content of 3.5 percent. If the Candler mix had been designed at the minimum air void content of 3.0 percent, it probably would have met the minimum asphalt content requirement. All of the mixes at each compactive effort met the VFA requirement.
12

13
Table 5. Summary of SMA Mix Designs with Different Compactive Efforts Marshall 50 Gyr. 75 Gyr. 100 Gyr. Agg.
Source Opt. Pb VFA Opt. Pb VFA Opt. Pb VFA Opt. Pb VFA
Camak 6.5 81 6.4 80 5.9 80 5.3 77 Candler 6.0 80 5.6 78 5.1 77 4.8 76
Lithia Spr. 6.2 80 6.0 80 5.2 77 4.8 76 Mtn. View 6.3 81 5.8 79 5.5 78 4.9 76
Ruby 7.5 83 7.2 81 6.8 81 6.2 77 A bar graph of the design asphalt contents is shown in Figure 6. As can be seen from this graph, the design asphalt content decreases as the gyratory compactive effort increases. On average, the design asphalt content of the SMA mixtures decreased about 0.5 percent with each 25 gyrations. Figure 7 shows the VFA results for the laboratory mix designs. Calculations for VFA used the effective specific gravities of the aggregates as normally done for asphalt mixture volumetrics in Georgia. For most of the laboratory mixtures, VFA decreased slightly as the number of gyrations was increased.
0.0
1.0
2.0
3.0
4.0
5.0
6.0
7.0
8.0
9.0
50 B
low
s
50 G
yr
75 G
yr
100
Gyr
50 B
low
s
50 G
yr
75 G
yr
100
Gyr
50 B
low
s
50 G
yr
75 G
yr
100
Gyr
50 B
low
s
50 G
yr
75 G
yr
100
Gyr
50 B
low
s
50 G
yr
75 G
yr
100
Gyr
Camak Candler Lithia Springs Mt. View Ruby
Des
ign
AC
, %
5.8% Minimum AC
Figure 6. Design Asphalt Content of Laboratory Prepared SMA Mixtures
14

0
10
20
30
40
50
60
70
80
90
100
50 B
low
s
50 G
yr
75 G
yr
100
Gyr
50 B
low
s
50 G
yr
75 G
yr
100
Gyr
50 B
low
s
50 G
yr
75 G
yr
100
Gyr
50 B
low
s
50 G
yr
75 G
yr
100
Gyr
50 B
low
s
50 G
yr
75 G
yr
100
Gyr
Camak Candler Lithia Springs Mt. View Ruby
VFA
Gse
, %
70% Minimum
90% Maximum
Figure 7. VFA of Laboratory Prepared SMA Mixtures
15

APA Testing of Laboratory Mix Designs
Each of the SGC mix designs was tested in the APA in accordance with GDT 115 to examine their rutting susceptibility. This test is intended to provide an indication of how the mixtures would perform with regard to rutting under heavy traffic loading. Test samples were compacted in the SGC to the three gyration levels at their respective design asphalt contents as described in the previous section. Results of the APA testing are summarized in Table 6.
Table 6. APA Tests Results for Gyratory Mix Designs APA Rut Depths, mm
Aggregate Source Mix Design Gyrations
Design Asphalt Content, %
Average Air Voids, % Average Std. Dev.
50 6.4 3.7 2.7 0.7 75 5.9 3.3 2.3 0.3 Camak
100 5.3 3.4 3.1 0.6 50 5.6 3.4 3.7 1.2 75 5.1 3.4 3.7 1.4
Candler
100 4.8 3.2 1.7 0.5 50 6.0 3.3 4.0 1.4 75 5.2 3.3 3.1 0.6
Lithia Springs
100 4.8 3.3 2.1 0.7 50 5.8 4.0 3.6 0.7 75 5.5 3.9 1.1 0.4
Mountain View
100 4.9 3.6 3.5 0.8 50 7.2 4.3 2.8 0.8 75 6.8 4.1 2.1 0.5
Ruby
100 6.2 4.1 0.9 0.3 GDOT’s specification requires APA rut depths of 5 mm or less for Level C and D mix designs. All of the SMA mixtures designed in this study easily met this criterion. The data also indicates that there was not a trend of increased rutting potential as asphalt content increases or compactive effort in the SGC decreases. This finding is supported by field experience with SMA mixtures, which has indicated that as long as an SMA mixture retains stone-on-stone contact within the aggregate skeleton, its rutting resistance is insensitive to asphalt content. Aggregate Breakdown for Laboratory Mix Designs Aggregate breakdown during laboratory compaction was also evaluated. For this analysis, aggregate breakdown was calculated as the change in percent passing on two sieves: the 4.75 mm sieve and the 0.075 mm sieve. The 4.75 mm sieve is the breakpoint sieve for 12.5 mm SMA mixtures and is the sieve size that defines a break in the aggregate gradation between the fine aggregate and the coarse aggregate. Breakdown of the gradation in an SMA can reduce the stone-on-stone contact needed for good mix stability and alter the aggregate skeleton such that the VMA of the mixture collapses.
16

17
Aggregate breakdown results for the laboratory designed mixes are shown in Figures 8 and 9, for the 4.75 mm and 0.075 mm sieve, respectively. The aggregate breakdown on the breakpoint sieve for the lab mix designs ranged from 2.4 to 14.9 percent. As can be seen, the amount of breakdown is most significantly influenced by the aggregate source. As has been shown in other SMA studies, aggregate breakdown during lab compaction is significantly affected by the LA abrasion value for the aggregate. The data for these mixtures fit well with the correlations shown in Figure 1. Breakdown is also dependent on the compactive effort. The results generally indicate that Marshall hammer compaction causes more aggregate breakdown than the SGC and that as gyrations increase in the SGC, breakdown increases for each aggregate source. The change in percent passing the 0.075 mm (No. 200) sieve for the lab compacted samples ranged from 0.2 to 3.4 percent. These data also show that the increase in the percent passing the 0.075 mm sieve is mostly dependant on the aggregate source. The Camak and Mountain View aggregates had the highest amount of breakdown on the 0.075 mm sieve. The increase in - 0.075 mm material is likely due to grinding type abrasion of aggregate particles and would therefore be related to the grain size and mineralogy of the granite aggregates. Only in the case of the Ruby aggregate is the increase in percent passing the 0.075 mm sieve less for Marshall compaction compared to 50 gyrations in the SGC. Some aggregate breakdown is expected and is not a problem as long as it does not significantly exceed the breakdown which occurs during placement and compaction on the roadway. Since these mixes were not placed in the field, it is not known which compaction method would give similar breakdown as that seen in the field.

0.0
2.0
4.0
6.0
8.0
10.0
12.0
14.0
16.0
50 B
low
s
50 G
yrat
ions
75 G
yrat
ions
100
Gyr
atio
ns
50 B
low
s
50 G
yrat
ions
75 G
yrat
ions
100
Gyr
atio
ns
50 B
low
s
50 G
yrat
ions
75 G
yrat
ions
100
Gyr
atio
ns
50 B
low
s
50 G
yrat
ions
75 G
yrat
ions
100
Gyr
atio
ns
50 B
low
s
50 G
yrat
ions
75 G
yrat
ions
100
Gyr
atio
ns
Camak Candler Lithia Springs Mt. View Ruby
Perc
ent B
reak
dow
n on
the
Brea
kpoi
nt S
ieve
Figure 8. Aggregate Breakdown on the 4.75 mm Sieve for the Laboratory Mix Designs
18

0.0
0.5
1.0
1.5
2.0
2.5
3.0
3.5
4.0
50 B
low
s
50 G
yr
75 G
yr
100
Gyr
50 B
low
s
50 G
yr
75 G
yr
100
Gyr
50 B
low
s
50 G
yr
75 G
yr
100
Gyr
50 B
low
s
50 G
yr
75 G
yr
100
Gyr
50 B
low
s
50 G
yr
75 G
yr
100
Gyr
Camak Candler Lithia Springs Mt. View Ruby
Incr
ease
in 0
.075
mm
due
to B
reak
dow
n
Figure 9. Increase in Percent Passing 0.075 mm Sieve Due to Compaction in the Laboratory for the Lab Mixtures
19
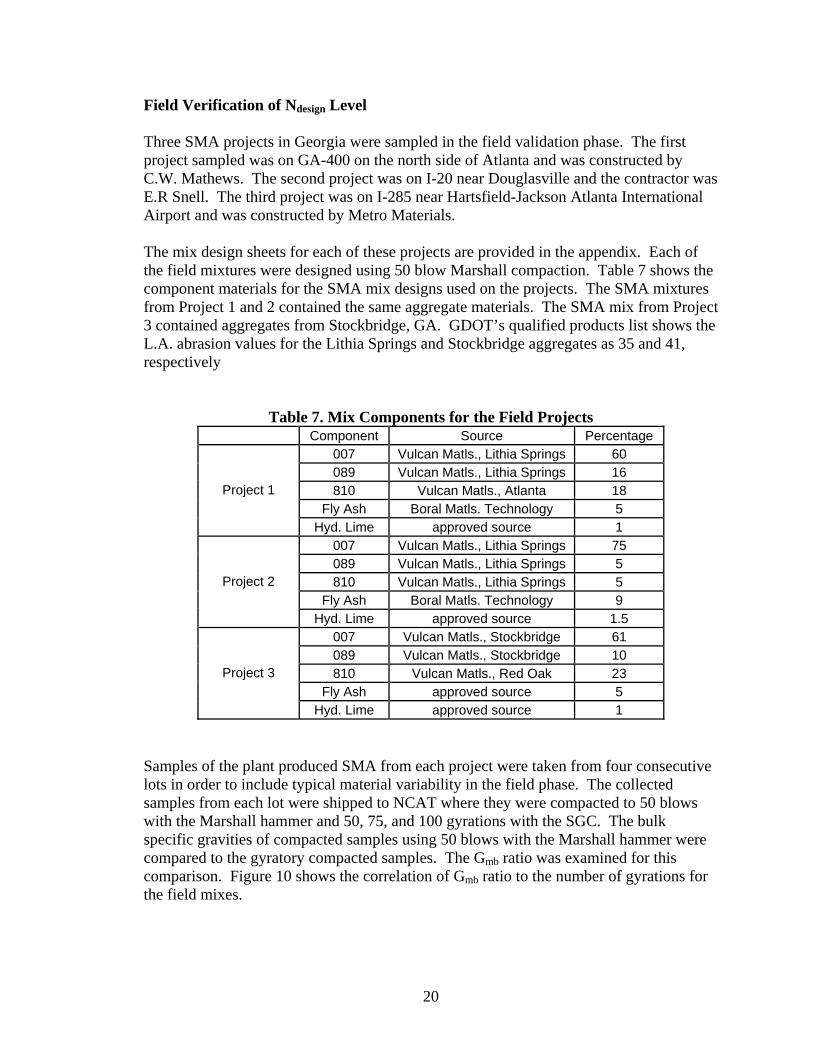
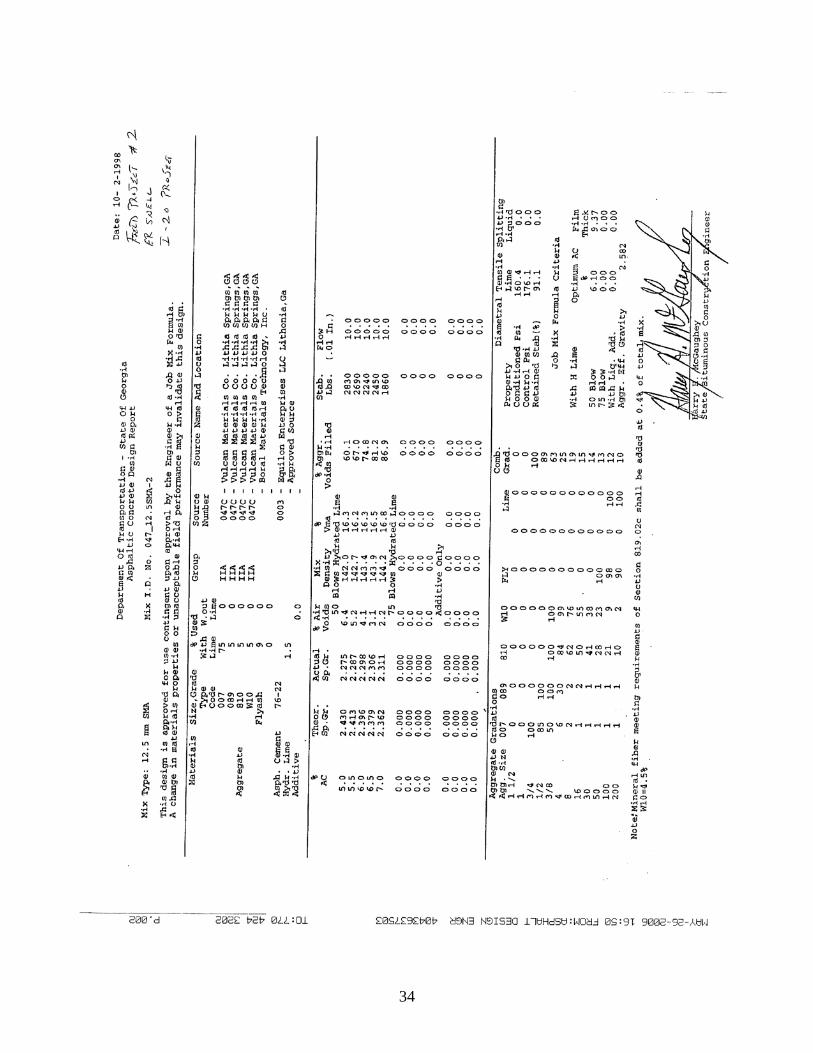
Field Verification of Ndesign Level Three SMA projects in Georgia were sampled in the field validation phase. The first project sampled was on GA-400 on the north side of Atlanta and was constructed by C.W. Mathews. The second project was on I-20 near Douglasville and the contractor was E.R Snell. The third project was on I-285 near Hartsfield-Jackson Atlanta International Airport and was constructed by Metro Materials. The mix design sheets for each of these projects are provided in the appendix. Each of the field mixtures were designed using 50 blow Marshall compaction. Table 7 shows the component materials for the SMA mix designs used on the projects. The SMA mixtures from Project 1 and 2 contained the same aggregate materials. The SMA mix from Project 3 contained aggregates from Stockbridge, GA. GDOT’s qualified products list shows the L.A. abrasion values for the Lithia Springs and Stockbridge aggregates as 35 and 41, respectively
Table 7. Mix Components for the Field Projects Component Source Percentage
007 Vulcan Matls., Lithia Springs 60 089 Vulcan Matls., Lithia Springs 16 810 Vulcan Matls., Atlanta 18
Fly Ash Boral Matls. Technology 5 Project 1
Hyd. Lime approved source 1 007 Vulcan Matls., Lithia Springs 75 089 Vulcan Matls., Lithia Springs 5 810 Vulcan Matls., Lithia Springs 5
Fly Ash Boral Matls. Technology 9 Project 2
Hyd. Lime approved source 1.5 007 Vulcan Matls., Stockbridge 61 089 Vulcan Matls., Stockbridge 10 810 Vulcan Matls., Red Oak 23
Fly Ash approved source 5 Project 3
Hyd. Lime approved source 1
Samples of the plant produced SMA from each project were taken from four consecutive lots in order to include typical material variability in the field phase. The collected samples from each lot were shipped to NCAT where they were compacted to 50 blows with the Marshall hammer and 50, 75, and 100 gyrations with the SGC. The bulk specific gravities of compacted samples using 50 blows with the Marshall hammer were compared to the gyratory compacted samples. The Gmb ratio was examined for this comparison. Figure 10 shows the correlation of Gmb ratio to the number of gyrations for the field mixes.
20

21
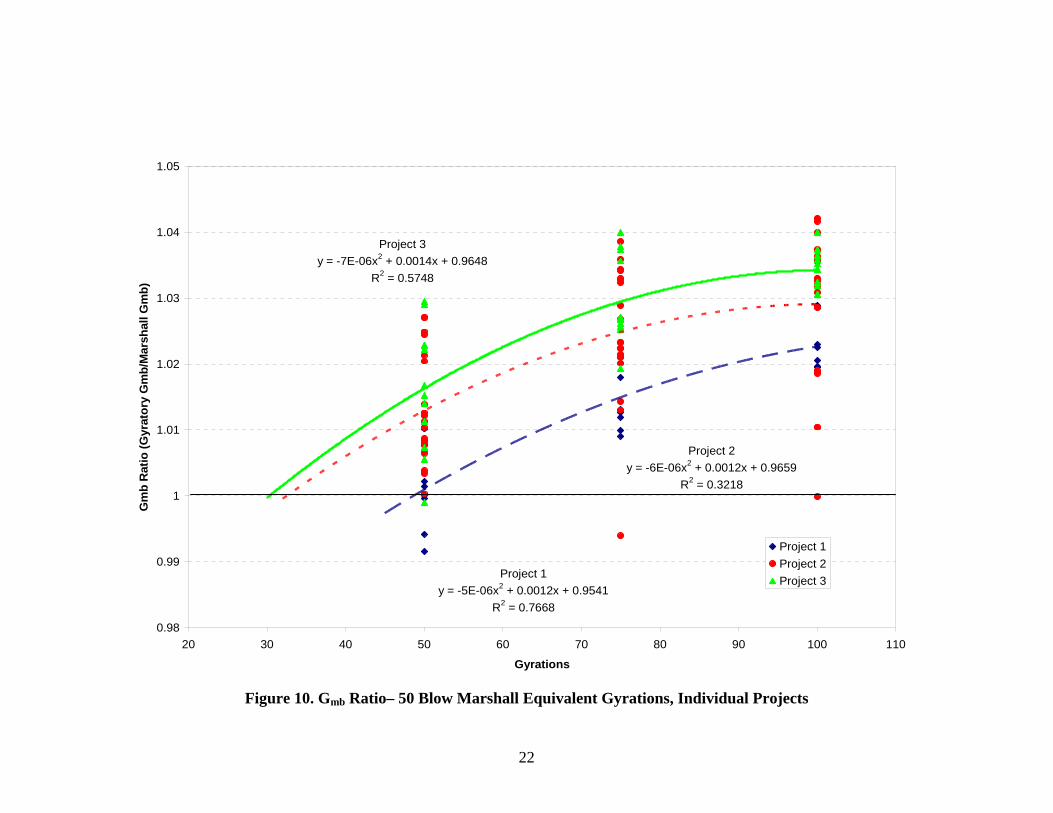
The range of equivalent gyrations for the field produced mixes was from 30-48. The Gmb ratio versus gyrations for all of the field data combined is shown in Figure 11. The regression of this data indicates that an average of 34 gyrations in the SGC provided an equivalent density to the Marshall hammer.
Project 3 y = -7E-06x2 + 0.0014x + 0.9648
R2 = 0.5748
Project 2y = -6E-06x2 + 0.0012x + 0.9659
R2 = 0.3218
Project 1y = -5E-06x2 + 0.0012x + 0.9541
R2 = 0.7668
0.98
0.99
1
1.01
1.02
1.03
1.04
1.05
20 30 40 50 60 70 80 90 100 110
Gyrations
Gm
b R
atio
(Gyr
ator
y G
mb/
Mar
shal
l Gm
b)
Project 1Project 2Project 3
Figure 10. Gmb Ratio– 50 Blow Marshall Equivalent Gyrations, Individual Projects
22
y = -6E-06x2 + 0.0013x + 0.9632R2 = 0.3814
0.98
0.99
1
1.01
1.02
1.03
1.04
1.05
30 40 50 60 70 80 90 100 110
Gyrations
Gm
b R
atio
(Gyr
ator
y G
mb/
Mar
shal
l Gm
b)
34
Figure 11. Gmb Ratio- 50 Blow Marshall Equivalent Gyrations, All Projects
23
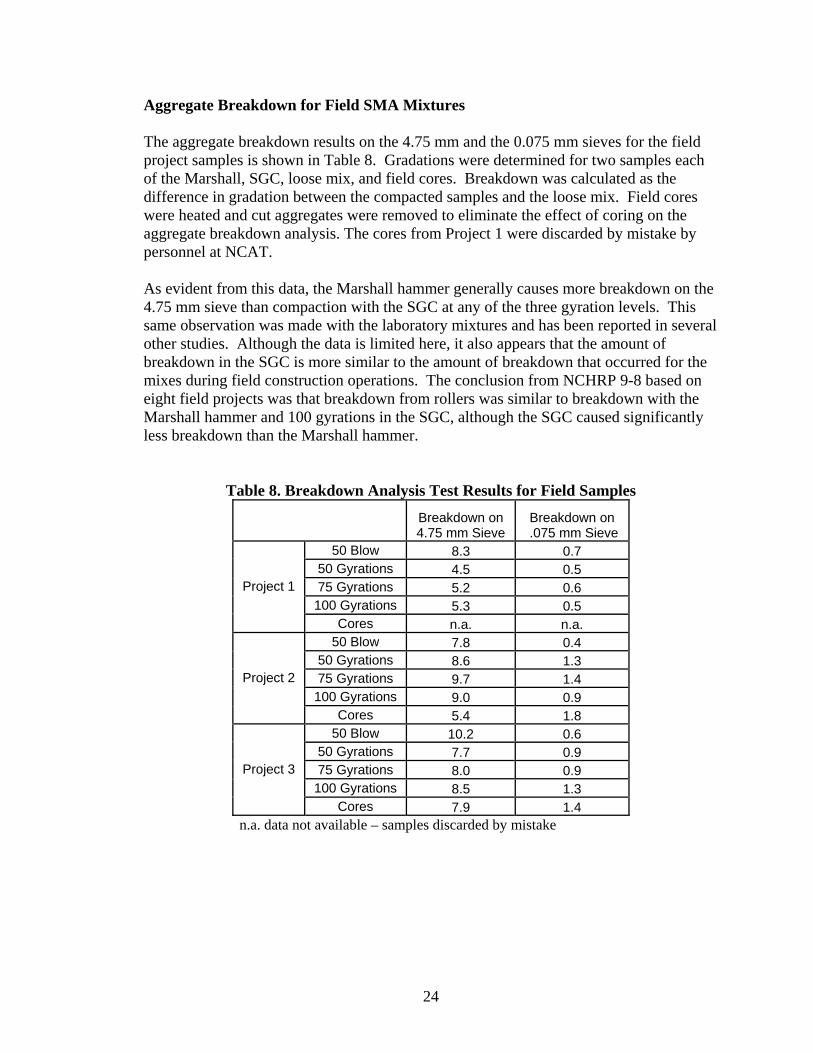
Aggregate Breakdown for Field SMA Mixtures The aggregate breakdown results on the 4.75 mm and the 0.075 mm sieves for the field project samples is shown in Table 8. Gradations were determined for two samples each of the Marshall, SGC, loose mix, and field cores. Breakdown was calculated as the difference in gradation between the compacted samples and the loose mix. Field cores were heated and cut aggregates were removed to eliminate the effect of coring on the aggregate breakdown analysis. The cores from Project 1 were discarded by mistake by personnel at NCAT. As evident from this data, the Marshall hammer generally causes more breakdown on the 4.75 mm sieve than compaction with the SGC at any of the three gyration levels. This same observation was made with the laboratory mixtures and has been reported in several other studies. Although the data is limited here, it also appears that the amount of breakdown in the SGC is more similar to the amount of breakdown that occurred for the mixes during field construction operations. The conclusion from NCHRP 9-8 based on eight field projects was that breakdown from rollers was similar to breakdown with the Marshall hammer and 100 gyrations in the SGC, although the SGC caused significantly less breakdown than the Marshall hammer.
Table 8. Breakdown Analysis Test Results for Field Samples
Breakdown on 4.75 mm Sieve
Breakdown on .075 mm Sieve
50 Blow 8.3 0.7 50 Gyrations 4.5 0.5 75 Gyrations 5.2 0.6
100 Gyrations 5.3 0.5 Project 1
Cores n.a. n.a. 50 Blow 7.8 0.4
50 Gyrations 8.6 1.3 75 Gyrations 9.7 1.4
100 Gyrations 9.0 0.9 Project 2
Cores 5.4 1.8 50 Blow 10.2 0.6
50 Gyrations 7.7 0.9 75 Gyrations 8.0 0.9
100 Gyrations 8.5 1.3 Project 3
Cores 7.9 1.4 n.a. data not available – samples discarded by mistake
24

APA Testing on Field SMA Mixtures The results of the APA testing on the field samples are shown in Table 9. APA tests were only performed on samples from two lots for each project. The two samples were selected which had the greatest range in quality control results. APA tests were conducted using the same testing conditions as the laboratory designed samples. However, the air void contents of the specimens were the actual air voids achieved during compaction to the three levels with the SGC. Therefore, there was a decrease in air void content of the APA samples for increasing levels of gyrations. From the table it can be seen that all of the rut depths were low. All of the field samples easily met the 5.0 mm maximum rut depth requirement. The results show that SMA mixtures are generally very rut resistant despite the range of air voids and quality control variations in the mixtures.
Table 9. Field Sample Rut Depths from APA Tests
Gyration Level
Average Air Voids, %
Average Rut Depth, mm
Std. Dev. of Rut Depth, mm
50 Gyrations 4.4 2.2 1.0 75 Gyrations 3.2 2.4 0.5 Field Project 1 100 Gyrations 2.3 2.3 1.3 50 Gyrations 4.9 2.3 1.5 75 Gyrations 4.0 2.3 1.3 Field Project 2 100 Gyrations 3.3 1.5 1.5 50 Gyrations 4.4 2.9 1.2 75 Gyrations 3.2 1.7 0.5 Field Project 3 100 Gyrations 2.7 1.9 1.2
Discussion of Results
The first phase of this project examined the number of gyrations with the SGC (Ndesign) to give the same density and mix design results as SMA mix designs conducted with the Marshall hammer. SMA mix designs were first completed with a 50-blow Marshall hammer compactive effort. SMA mixtures were designed using five aggregate sources commonly used for SMA in Georgia. The same gradations were then used to determine the asphalt content to achieve 3.5% air voids using three gyration levels (50, 75 and 100 gyrations) in the SGC. The primary technique for comparing the SGC mix designs to the Marshall mix designs was to determine the number of gyrations that provided the same density as the 50 blow Marshall hammer. For the individual SMA mixtures, the number of gyrations required to reach the same density as the 50blow Marshall compaction ranged from 16 to 79. A strong correlation exists between the number of equivalent gyrations and the L.A.
25

abrasion value for the coarse aggregate. Based on a regression through the combined data set using five aggregate sources, 35 gyrations was found to give the best match to the density from Marshall compaction. Results of tests on field produced SMA mixtures in Georgia confirmed the relatively low number of required gyrations to match Marshall compaction. From the analysis of the laboratory mix designs, it was observed that the design asphalt content of the SMA mixtures decreased about 0.5 percent on average for every 25 gyration increase. The SMA mixes designed with 50 gyrations, therefore, resulted in the highest asphalt contents for the three gyration levels tested. Using a target air void content of 3.5 percent, the design asphalt contents using 50 gyrations were from 0.1 to 0.5 percent lower than when the Marshall hammer was used. The two mixtures with the greatest difference in design asphalt contents between 50 gyrations and 50 blow Marshall were the mixes using aggregates from Candler and Mountain View. These sources have the highest L.A. abrasion values among the aggregates tested. Another factor which affects specimen density is the reorientation of aggregate particles. Other studies have shown that gyratory compaction is more efficient in reorienting flat or elongated particles than Marshall compaction. For mixtures with a high coarse aggregate content like SMA, differences in orientation of aggregates can explain why compaction in a SGC can yield significantl higher specimen densities than the Marshall hammer. Aggregate breakdown is a key concern for SMA mix designs given the critical nature of the stone on stone contact. The breakdown analysis of the laboratory and field samples showed that the Marshall samples generally had slightly more aggregate breakdown than the 50 gyration SGC samples. Of the five mixtures designed in the laboratory, the aggregates with the greatest amount of breakdown were those from Candler and Mountain View. When more aggregate breakdown occurs in mix design samples, it is more difficult to achieve VMA for any SMA gradation and the optimum asphalt content will be lower. Only a limited amount of data was available to evaluate the breakdown that occurs in the field during construction. The results from the two projects that did have data regarding field construction aggregate degradation indicated that the breakdown in the SGC was similar to breakdown by rollers. Although the amount of aggregate breakdown which occurs in the field will likely be dependent on the number of roller passes, the use of vibratory or static rolling, as well as the aggregate toughness, it is important for the breakdown in the laboratory to be similar to what is normally expected in the field. Rutting potential tests on the gyratory mix designs were conducted using the Asphalt Pavement Analyzer using GDT 115. These results showed that these SMA mixtures were very rut resistant. This is to be expected since the asphalt contents for the gyratory mix designs were lower than for the Marshall mix designs. The data indicated that the rutting potential of the mixtures were not sensitive to changes in asphalt content. All of the samples made with the field mixtures performed also performed very well in the APA tests. There was no significant difference in APA rut depths found between samples of the same mixture compacted to different gyrations. The low APA rut depths for the field
26

samples also indicate that the mixtures are not sensitive to normal mixture variations which occur during SMA production. Influence of SGC Angle of Gyration When evaluating compaction of asphalt mixtures in an SGC, it is critical to consider the effect of the internal angle for the compactor. All samples compacted with the SGC in this study were compacted with one machine, Pine AFG1A Serial Number 1193, which has had a measured internal angle of 1.23 degrees as measured with the Dynamic Angle Validator. Recently, the specification for Superpave gyratory compactors, AASHTO T 312, was amended to allow either external angel calibration or internal angle calibration (24). It is believed that using internal angle calibrations will help minimize differences in density which can occur with different SGC’s. The internal angle specified by AASHTO T-312 is 1.16±0.02°. There is a good probability that using an internal angle calibration of SGC’s will become the standard in the future. Prowell developed a relationship between the dynamic internal angle (DIA) and Gmb using a 19.0 mm nominal maximum aggregate size granite mixture. The relationship stated that for every 0.01 degree change in internal angle, there was a 0.001 change in Gmb (25). A gyration adjustment chart was developed from this relationship and the regression between Gmb Ratio and gyrations from Figure 4. The adjustment chart is shown in Figure 12. To adjust the gyrations for the NCAT AFG1A with an internal angle of 1.23º to an internal angle of 1.16º, the chart is entered from the x-axis at 1.16º and followed up to intersect the line, then left to the y-axis. This indicates that about six gyrations should be added to the results from the AFG1A to achieve the same density at the lower angle. Adding this correction to the equivalent gyrations determined to be 35 from the previous analysis yields 41 gyrations.
CF = -76.55 x DIA + 94.45
-10-9-8-7-6-5-4-3-2-10123456789
10
1.12 1.14 1.16 1.18 1.20 1.22 1.24 1.26 1.28 1.30 1.32 1.34
Dynamic Internal Angle
Cor
rect
ion
Fact
or (G
yrat
ions
)
Pine Model AFG1A Serial
Figure 12. Dynamic Internal Angle Correction Factor Chart
27

Summary In the first part of this study, SMA designs were performed using 50 blows from a static, flat faced, mechanical Marshall hammer and in accordance with GDOT specification 828.2.02. The mix designs were prepared with five granite aggregate sources in Georgia meeting the GDOT requirements for SMA. These mixes were then compacted in a Pine Model AFG1A SGC with 50, 75 and 100 gyrations. The design asphalt content to yield 3.5% air voids and corresponding VFA were determined for each SGC compactive effort. These mix designs were evaluated with respect to aggregate degradation, and rutting in the APA test. Findings from the analysis of the laboratory mix designs are as follows:
• The number of gyrations required to obtain an equivalent density as with 50 blows of the Marshall hammer ranged from 16 to 79 for the five SMA mixtures evaluated in the study. This range of equivalent gyrations was found to be strongly influenced by the aggregate’s resistance to degradation. The data shows that 35 gyrations with the SGC, on average, provided the same density as 50 blows from a Marshall hammer.
• SMA mix designs with the gyratory compactor yielded lower optimum asphalt contents than the same mix compacted with the Marshall hammer. At 50 gyrations, the optimum asphalt contents ranged from 5.6 to 7.2 percent. The minimum asphalt content currently allowed by GDOT specifications is 5.8 percent. As the number of design gyrations increased from 50 to 75, and 75 to 100, the optimum asphalt contents dropped by 0.5 percent on average.
• The SMA mix designs completed using the SGC had good rutting resistance in the APA test. The rutting potential of the mixtures did not appear to be sensitive to changes in asphalt content over the range evaluated.
• 50 gyrations with the Superpave gyratory compactor causes slightly less aggregate breakdown compared to 50 blows with the Marshall hammer.
In the second part of the study, testing and analysis was based on mixtures obtained from three SMA projects in Georgia. Each of these field mixtures had been designed by the GDOT using Marshall compaction. The field SMA samples were compacted in the SGC at 50, 75, and 100 gyrations. Analysis was also conducted with regard to aggregate breakdown and rutting resistance with the APA test. Findings from the analysis of the work with the field SMA mixtures are as follows:
• 34 gyrations with the SGC, on average, provided the same compacted density as 50 blows with the Marshall hammer. This verified the results of the analysis from the laboratory mix designs.
• All of the field SMA mixtures performed well in the Asphalt Pavement Analyzer. • The SGC caused less aggregate breakdown than the Marshall hammer and
appears to be similar to the amount of breakdown that occurs during field construction.
Gyratory compaction of asphalt mixtures is sensitive to the angle of gyration. The Pine SGC used in this study has an internal angle of 1.23º, which is typical for this model of gyratory compactor. A correction was made to the equivalent gyrations result from the laboratory analysis based on the change in density that this machine would be expected to
28
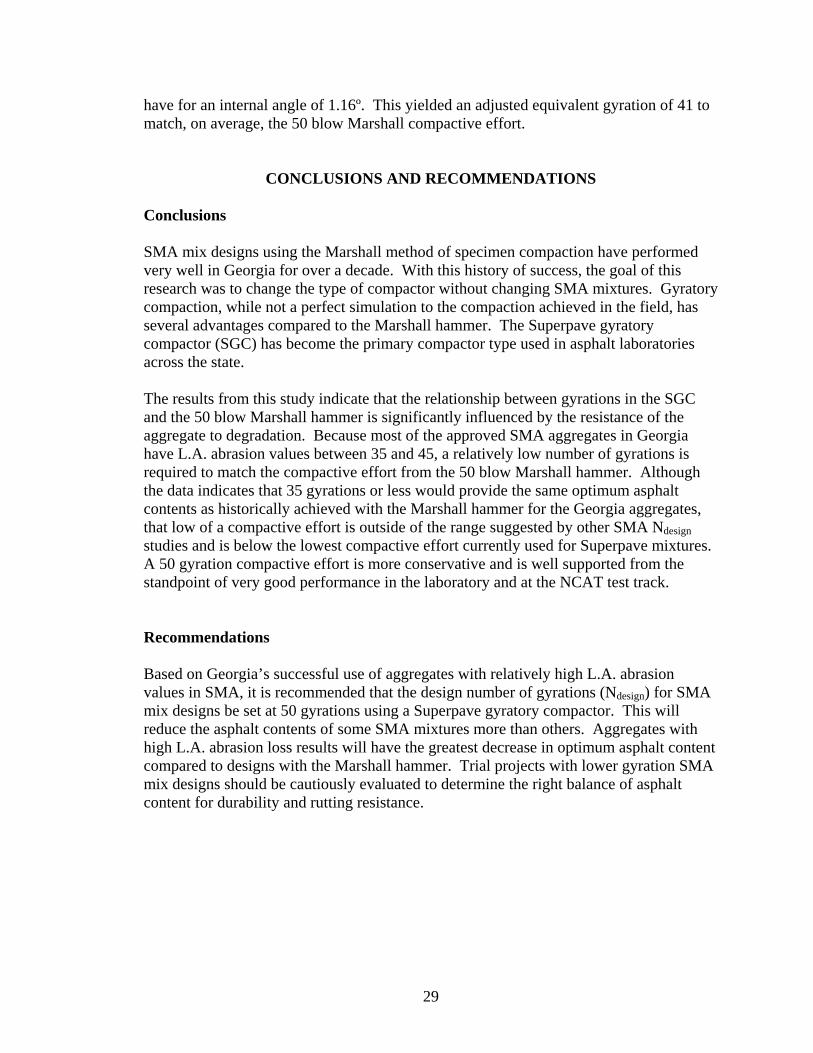
have for an internal angle of 1.16º. This yielded an adjusted equivalent gyration of 41 to match, on average, the 50 blow Marshall compactive effort.
CONCLUSIONS AND RECOMMENDATIONS
Conclusions SMA mix designs using the Marshall method of specimen compaction have performed very well in Georgia for over a decade. With this history of success, the goal of this research was to change the type of compactor without changing SMA mixtures. Gyratory compaction, while not a perfect simulation to the compaction achieved in the field, has several advantages compared to the Marshall hammer. The Superpave gyratory compactor (SGC) has become the primary compactor type used in asphalt laboratories across the state. The results from this study indicate that the relationship between gyrations in the SGC and the 50 blow Marshall hammer is significantly influenced by the resistance of the aggregate to degradation. Because most of the approved SMA aggregates in Georgia have L.A. abrasion values between 35 and 45, a relatively low number of gyrations is required to match the compactive effort from the 50 blow Marshall hammer. Although the data indicates that 35 gyrations or less would provide the same optimum asphalt contents as historically achieved with the Marshall hammer for the Georgia aggregates, that low of a compactive effort is outside of the range suggested by other SMA Ndesign studies and is below the lowest compactive effort currently used for Superpave mixtures. A 50 gyration compactive effort is more conservative and is well supported from the standpoint of very good performance in the laboratory and at the NCAT test track. Recommendations Based on Georgia’s successful use of aggregates with relatively high L.A. abrasion values in SMA, it is recommended that the design number of gyrations (Ndesign) for SMA mix designs be set at 50 gyrations using a Superpave gyratory compactor. This will reduce the asphalt contents of some SMA mixtures more than others. Aggregates with high L.A. abrasion loss results will have the greatest decrease in optimum asphalt content compared to designs with the Marshall hammer. Trial projects with lower gyration SMA mix designs should be cautiously evaluated to determine the right balance of asphalt content for durability and rutting resistance.
29

REFERENCES
1. Bellin, P.A.F., “Use of Stone Mastic Asphalt in Germany,” paper presented to Transportation Research Board Committee A2F02, 71st Annual Meeting, Washington D.C., January 1992.
2. Designing and Constructing SMA Mixtures – State-of-the Practice, National Asphalt Pavement Association, Quality Improvement Series 122, March 2002.
3. Brown, E. Ray, and L.A. Cooley, Jr., Designing Stone-Matrix Asphalt Mixtures for Rut-Resistant Pavements, National Cooperative Highway Research Program Report 425, Transportation Research Board, National Research Council, 1999.
4. Brown, E. Ray, L.A. Cooley, Jr., and T.A. Lynn, Designing Stone Matrix Asphalt Mixtures Volume II(C) – Research Results for Phase II, Final Report, National Cooperative Highway Research Program, July 1998.
5. West, R.C. and R.S. James, “Determining Ndesign for SMA Mixtures in Alabama” draft report, National Center for Asphalt Technology, May, 2005.
6. Prowell, B. D., L. A. Cooley, Jr., and Richard J. Schreck Virginia’s Experience with 9.5 mm NMAS SMA Transportation Research Record No. 1813 Transportation Research Board, National Research Council, 2002.
7. Report on the 1990 European Asphalt Study Tour, AASHTO, FHWA, NAPA, TAI, TRB, report published by AASHTO, June 1991.
8. Stone Mastic Asphalt Technology Synopsis and Work Plan, Draft, Test and Evaluation Project No. 18, FHWA Office of Technology Applications, April 1991.
9. Consuegra, A., D.N. Little, H. Von Quintus, and J. Burati, “Comparative Evaluation of Laboratory Compaction Devices Based on Their Ability to Produce Mixtures with Engineering Properties Similar to Those Produced in the Field,” Asphalt Mixtures and Asphalt Chemistry, Transportation Research Record 1228, 1989.
10. Brown, E.R. and R.B. Mallick, Stone Matrix Asphalt –Properties Related to Mixture Designs, National Center for Asphalt Technology, National Asphalt Paving Association Research and Education Foundation, September 1994.
11. Brown, E.R. and H. Manglorkar, Evaluation of Laboratory Properties of SMA
Mixtures, National Center for Asphalt Technology, National Asphalt Paving Association Research and Education Foundation, October 1993.
12. Ruth, B.E., R.C. West, S. Huang and I.E. Moroni, Minimum Aggregate Quality
Levels for Stone Mastic Asphalt Mixtures, Department of Civil Engineering, University of Florida, June 1995.
30

13. Brown, E.R., J.E. Haddock, R.B. Mallick and T.A. Lynn, Development of a Mixture Design Procedure for Stone Matrix Asphalt, Journal of Association of Asphalt Paving Technologists, Vol. 66, 1997.
14. Minutes of the SMA Technical Working Group Meeting, November 16 and 17,
1993, Atlanta, Georgia, Office of Technology Applications, January 4, 1994. 15. The Source, Georgia DOT Standard Specifications,
http://tomcat2.dot.state.ga.us/thesource/contract/index.html
16. Special Provision No. 01-0170 (Stone Matrix Asphalt), Alabama Standard Specifications, 2001 Edition, October 2001.
17. Schmiedlin, R. B. and D. L. Bischoff, Stone Matrix Asphalt- The Wisconsin
Experience, Wisconsin Department of Transportation, January 2002.
18. Brown, E.R., M.S. Buchanan, M.A. Anderson and G. Huber, Evaluation of the Superpave Gyratory Compaction Procedure, National Cooperative Highway Research Program 9-9, Transportation Research Record, 1998.
19. Brown, E.R. and J.E. Haddock, A Method to Ensure Stone-on Stone Contact in Stone Matrix Asphalt Paving Mixtures, Presented at the 1997 Annual Meeting of the Transportation Research Board, Washington, D.C. 1997.
20. Michael, L., G. Burke and C.W. Schwartz, Performance of Stone Matrix Asphalt
Pavements in Maryland, Journal of Association of Asphalt Paving Technologists, Vol. 72, 2003.
21. Harmelink, D., Stone Mastic Asphalt in Colorado, Colorado Department of
Transportation Research, April 2001.
22. Brown, E.R., L.A. Cooley Jr., D. Hanson, C. Lynn, B. Powell, B. Prowell, and D. Watson, NCAT Test Track Design, Construction, and Performance, NCAT Report 02-12, November 2002.
23. Timm, D.H., R.C. West, A.L. Priest, B. Powell, I. Selvaraj, J. Zhang, and E.R. Brown, Phase II NCAT Test Track Results, Phase II Pavement Test Track Conference, November, 2005.
24. Standard Specifications for Transportation Materials and Methods of Sampling and Testing, Part 2A and 2B, American Association of State Highway and Transportation Officials, 24th Edition, Washington, D.C., 2004.
25. Prowell, B.D, E.R. Brown, and M. Huner, Evaluation of the Internal Angle of
Gyration of Superpave Gyratory Compactors in Alabama, National Center for Asphalt Technology, Report 03-04, National Asphalt Paving Association, December, 2003.
31

APPENDIX
Field Project Mix Designs
32

33
34

35