EVALUATING EFFECTS OF ZINPRO PERFORMANCE MINERALS ON PERFORMANCE...
74
EVALUATING EFFECTS OF ZINPRO PERFORMANCE MINERALS ® ON PERFORMANCE AND CARCASS CHARACTERISTICS OF STEERS FED FINISHING DIETS DESIGNED FOR NATURAL BEEF PRODUCTION By CHEYANNE COGGINS Master of Science in Animal Science Oklahoma State University Stillwater, Oklahoma 2009 Submitted to the Faculty of the Graduate College of the Oklahoma State University in partial fulfillment of the requirements for the Degree of MASTER OF SCIENCE December, 2009
Transcript of EVALUATING EFFECTS OF ZINPRO PERFORMANCE MINERALS ON PERFORMANCE...

EVALUATING EFFECTS OF ZINPRO
PERFORMANCE MINERALS® ON PERFORMANCE
AND CARCASS CHARACTERISTICS OF STEERS FED
FINISHING DIETS DESIGNED FOR NATURAL BEEF
PRODUCTION
By
CHEYANNE COGGINS
Master of Science in Animal Science
Oklahoma State University
Stillwater, Oklahoma
2009
Submitted to the Faculty of the Graduate College of the
Oklahoma State University in partial fulfillment of the requirements for
the Degree of MASTER OF SCIENCE
December, 2009
ii
EVALUATING EFFECTS OF ZINPRO
PERFORMANCE MINERALS® ON PERFORMANCE
AND CARCASS CHARACTERISTICS OF STEERS FED
FINISHING DIETS DESIGNED FOR NATURAL BEEF
PRODUCTION
Thesis Approved:
J. Brad Morgan
Thesis Adviser
Deb VanOverbeke
Clint Krehbiel
A. Gordon Emslie
Dean of the Graduate College
iii
ACKNOWLEDGMENTS
I would like to thank some of the people who have helped me along the way to
get to where I am today. First and foremost, our Lord who created this wonderful world
and guided me along the right path. My parents who raised me to always strive to be my
best and never give up no matter how long and hard the road may be. My husband Drew
for supporting me in my decision to attend graduate school and for always loving me no
matter what.
Next, my professors for helping me develop personally and professionally as well
as being an encouraging force in my life. My fellow graduate students for long hours and
extra weekends put in outside of their regular schedules. All of the lab workers for their
help with my research. Our lab tech, Kris, for all of her help and guidance.
Last, but not least, to my employers and co-workers at Advance Food Company
for their kind words and support. And to Oklahoma State University for accepting me as
an undergraduate and graduate student, and allowing me to fulfill a lifelong dream.

iv
TABLE OF CONTENTS
Chapter Page I. INTRODUCTION ......................................................................................................8
II. REVIEW OF LITERATURE..................................................................................10 The importance of trace minerals in the diet of beef cattle ....................................10 Effects of trace minerals on growth and performance of beef cattle .....................11 Effects of trace minerals on immune function of cattle .........................................14 Effects of trace minerals on carcass characteristics of feedlot cattle .....................15 Consumer acceptability and shear force ................................................................17 Consumer acceptability and lean color ..................................................................18 Statement of the problem .......................................................................................21 Approach to the problem .......................................................................................21 III. METHODOLOGY ................................................................................................22 Abstract ..................................................................................................................22 Introduction ............................................................................................................23 Materials and Methods ...........................................................................................25
v
Chapter Page
IV. FINDINGS .............................................................................................................31 Performance Data...................................................................................................31 Carcass Data...........................................................................................................32 Cook and Shear Data .............................................................................................33 Lean Color Data .....................................................................................................33 Trace Mineral Data ................................................................................................34 V. CONCLUSION ......................................................................................................35 REFERENCES ............................................................................................................66 APPENDICES .............................................................................................................70

vi
LIST OF TABLES
Table Page 1: Animal trial information ..........................................................................................36 2: Experimental diet and nutrient composition……………………………………….37 3: Feedlot performance (load 1) ……………………………………………………...38 4: Feedlot performance (load 2)………………………………………………………39 5: Feedlot performance (load 3)………………………………………………………40 6: Carcass characteristics (harvest group 1)…………………………………………..41 7: Carcass characteristics (harvest group 2)…………………………………………..42 8: Carcass characteristics (harvest group 3)…………………………………………..43 9: Cook loss and WBS………………………………………………………………...44 10: Trace mineral content (harvest group 1)…………………………………………..45 11: Trace mineral content (harvest group 2)…………………………………………..46 12: Trace mineral content (harvest group 3)…………………………………………..47

vii
LIST OF FIGURES
Figure Page 1: Muscle color (harvest group 1) ................................................................................48 2: Muscle color (harvest group 2) ................................................................................49 3: Muscle color (harvest group 3) ................................................................................50 4: Surface discoloration (harvest group 1) ...................................................................51 5: Surface discoloration (harvest group 2) ...................................................................52 6: Surface discoloration (harvest group 3) ...................................................................53 7: Overall acceptability (harvest group 1) ...................................................................54 8: Overall acceptability (harvest group 2) ...................................................................55 9: Overall acceptability (harvest group 3) ...................................................................56 10: L* values (harvest group 1) ...................................................................................57 11: L* values (harvest group 2) ...................................................................................58 12: L* values (harvest group 3) ...................................................................................59 13: a* values (harvest group 1) ....................................................................................60 14: a* values (harvest group 2) ....................................................................................61 15: a* values (harvest group 3) ………………………………………………………62 16: b* values (harvest group 1) ....................................................................................63 17: b* values (harvest group 2) ....................................................................................64 18: b* values (harvest group 3) ....................................................................................65
8
CHAPTER I
INTRODUCTION
Over the past several years, the prevalence of natural and organic products,
including meat, has been on the rise. Loosely defined, the difference between natural and
organic products is that naturally raised animals cannot be given antibiotics or growth
hormones while organic is a government certified program which requires the
aforementioned with the addition of an organic diet with no pesticides. A consumer study
conducted by Abt Associates Inc. (1997) showed that 43 percent of consumers
considered hormones used in poultry or livestock production a serious health risk when
asked specifically about them. According to Food Technology (Sloan, 1996), natural food
product sales increased 22.7% in 1994 and 22.6% in 1995, reaching a total of $9.17
billion in sales. This shows that consumers are taking an active approach to eating foods
that are supposed to be better for them.
As recently as January 2009, the United States Department of Agriculture
(USDA) established and published a set of voluntary standards for naturally raised
livestock. Prior to the publication of this standard, the definition of a natural meat product
was not well defined. The standards give producers a way to distinguish their products to
consumers seeking meat products from naturally raised livestock (USDA, 2009). The
only requirements for the standard of naturally raised is that the animals must never be
given growth promotants or antibiotics and must never be fed mammalian, avian and
aquatic by-products derived from the harvest process. This standard was intended to be
used alone or in conjunction with other marketing programs, such as “grass-fed” (USDA,

9
2009). Due to these guidelines, producers who wish to offer these types of products to
consumers need a method of increasing performance and immune function of their cattle
without the use of antibiotics and growth promoting hormones.
The introduction of a new form of trace mineral, which includes zinc in the form
of zinc methionine, known as an organic or chelated form sparked research interest in the
effects of this type of mineral on growth and performance of beef cattle. Organic
minerals are thought to be more bioavailable and therefore are more effectively absorbed
and utilized by the cattle. Research has shown that a slight increase in overall
performance of the cattle can be seen with the use of organic trace minerals as well as
improving some carcass characteristics, such as marbling, 12th rib fat and ribeye area.
However, no research has been published concerning the effects of trace mineral source
on meat quality of finishing cattle, which is the intent of this study.

10
CHAPTER II
REVIEW OF LITERATURE
The Importance of Trace Minerals in the Diet of Beef Cattle
Trace minerals are essential to various functions of cattle, including growth of
various tissues, immune function, and reproduction. Zinc and copper are especially
important as enzyme co-factors in the immune system, which are necessary for
immunoglobulin production. Manganese is also important to the immune system, and
deficiencies can affect immunoglobulin enzyme activity by affecting T-cell and B-cell
response (Coffey, 1993). Manganese has also been found to be important in conception
and maintenance of pregnancy in cows. Deficiency of this mineral can lead to problems
conceiving and carrying the fetus to full term. Copper and zinc are also important to
reproductive efficiency with regards to follicle maturation time (Manspeaker and Robl,
1993).
Minerals, especially zinc, are essential for DNA replication, which is necessary
for growth of tissues (Boling, 1993). Lack of essential minerals can also cause improper
function of enzymes which are needed for protein synthesis. Nutrient absorption from the
intestine and cellular uptake are dependent on minerals as well. Most minerals are
dependent on each other through a synergistic relationship; therefore, the deficiency of
just one mineral can retard growth, even if all other nutrient requirements are met
(Boling, 1993).
During the finishing phase, trace minerals should be supplemented to the diet,
especially when low-quality forages are provided as the roughage source (Bentley et al.,
11
1954). The addition of minerals, including iron, copper, cobalt, manganese and zinc, in
cattle finishing rations has been shown to increase gains of both steers and heifers. This
was specifically seen when the trace mineral mixture was added to corn-based rations
compared to sorghum-based rations, which is most likely due to differences in trace
mineral content of the grains (Oltjen et al., 1959). According to Bentley et al. (1954),
improvements in growth and performance appear to be due to improved rumen function.
Upon analysis of ruminal contents, cattle that were supplemented with amino acid
chelated minerals had higher amylase and cellulase activity with decreased methane
production (Boling, 1993). Therefore, chelated minerals may increase rumen efficiency.
Certain minerals have been shown to have an effect on adipogenesis and
adipocyte differentiation (Kawachi, 2006). Zinc, in particular, has been shown to have
insulin-like effects which promotes adipocyte differentiation, and enhances adipogenesis
in 3T3-L1 adipose cells (Tanaka et al., 2001). Zinc has also been shown to promote
adipocyte differentiation by inhibition of nitric oxide production (Kawachi, 2006).
Magnesium has also been reported to increase marbling when fed above dietary
recommended levels (Ramirez and Zinn, 2000 as cited by Kawachi, 2006).
The Effects of Trace Minerals on Growth and Performance of Beef Cattle
Several studies have been conducted in the past to determine the effects of an
organic source of trace mineral on growth, reproductive performance and feedlot
performance of cattle. According to Spears (1996), these organic forms of minerals are
more bioavailable and, therefore, may be metabolized differently from inorganic forms,

12
which may alter some metabolic processes. This was observed by lower urinary zinc
excretion in lambs given zinc methionine over zinc oxide (Spears, 1989) and in increased
tissue zinc concentrations when zinc proteinate was supplemented to lambs at high
concentrations over zinc sulfate (Cao et al., 2000). Rojas et al. (1995) also found that
organic forms of zinc (zinc lysine and zinc methionine) have greater availability than zinc
sulfate which is considered the most available inorganic source in sheep and suggested
that these organic forms may be metabolized differently in some tissues.
Organic trace minerals can occur in many forms such as metal amino acid
complexes, metal amino acid chelates, proteinates, and metal amino acid chelates, which
are the least common (Spears, 1996). Current research has shown that some small
differences can be seen in reproductive performance and growth of cattle consuming
these types of organic trace minerals as well as some differences in carcass characteristics
between organic and inorganic supplemented cattle.
Early research conducted by Greene et al. (1988) on zinc oxide compared to zinc
methionine suggested that zinc source had no effect on average daily gain of the cattle.
These results agree with Rust (1985) and Martin et al. (1987); however, this contradicts
results of Spears and Samsell (1986) which showed higher average daily gains for heifers
fed zinc methionine. Spears (1989) also observed that heifers tended to gain faster and
more efficiently when supplemented with zinc methionine compared with zinc oxide over
a 126-d feeding trial. Other studies involving zinc supplementation suggested that zinc
source had no effect on average daily gain during the finishing period (Malcolm-Callis et
al., 2000). Engle and Spears (2000) also observed no differences in overall performance,
in terms of average daily gains, daily feed intake and feed:gain of growing and finishing

13
steers supplemented with copper sulfate, copper citrate, copper proteinate, or copper
chloride (2000). Some differences were seen in average daily gains during the finishing
phase, with Cu citrate calves gaining faster than Cu sulfate calves (Engle and Spears,
2000).
Ahola et al. (2005a) observed that trace mineral source of cows did not affect calf
performance; however, females did show higher estrous cyclicity prior to artificial
insemination, although pregnancy rate was not affected. This contradicts research by
Stanton et al. (2000) and Kropp (1990) which showed that calves from cows receiving
organic trace minerals, had higher pre-weaning average daily gains and greater weaning
body weight. Ahola et al. (2004) also observed that over a two-year period, cows
supplemented with an organic source of minerals had higher pregnancy rates than those
supplemented with inorganic minerals when bred upon observed estrus; however, body
condition was not affected by treatment. In that same study, calf performance was also
assessed, and contradicting observations occurred between year one and year two (Ahola
et al., 2004). In year one, cows in the inorganic group had more kilograms of calf weaned
per cow exposed, and the converse was observed in year two (Ahola et al., 2004). In
contrast, Muehlenbien and others (2001) reported no statistical differences in cow
reproductive performance or weaning weights of their calves from cows supplemented
with organic and inorganic sources of copper.
The effect of zinc source was assessed by Spears and Kegley in 2002, which
showed differences between zinc oxide supplemented calves and zinc proteinate
supplemented calves. During the growing phase, significant differences were seen
between the control calves that were given no supplement, and the zinc supplemented
14
calves with regards to average daily gains. This would suggest that zinc, in any form is
essential to early growth. During the finishing phase, zinc proteinate (15%) supplemented
calves had higher average daily gains than zinc oxide supplemented calves and gained
more efficiently (Spears and Kegley, 2002).
The effects of trace mineral supplementation in the presence of antagonists on calf
performance were observed in stressed calves. Both source of trace mineral and level of
intake were manipulated to determine if the type of mineral or amount received would
affect growth and performance. This study observed that feed consumption, average daily
gain and feed efficiency were not affected by trace mineral source and level (Stanton et
al., 2001).
The Effects of Trace Minerals on Immune Function of Cattle Trace minerals are an important factor of immune function. Both zinc and copper
serve as essential enzyme co-factors in the immune system. Research has shown that
deficiencies in these trace minerals can lead to decreased immune response (Coffey,
1993). Since cattle that are to be considered naturally raised are not to be given growth
promotants or antibiotics, a possible method of boosting immune function is necessary to
prevent increased morbidity and mortality in these cattle. It has been established that
trace minerals are important to immune function, especially zinc, which in severe
deficiency is known to cause immunosupression (Chesters, 1997). Spain (1993) observed
that supplementation of zinc as 50 percent zinc proteinate resulted in fewer new
mammary gland infections based on somatic cell counts and bacteriological culture of
15
milk samples (Spears and Kegley, 2002). Therefore, using organic or chelated forms of
trace minerals, specifically zinc, may improve immune function.
In 2002, Spears and Kegley reported that zinc source had no effect on immune
function, but suggested severe zinc deficiency reduced lymphocyte response in lambs as
written by Droke and Spears (1993). Zinc requirements appeared to be higher in order to
achieve maximum growth than for increased immune response in growing steers (Spears
and Kegley, 2002).
The Effects of Trace Minerals on Carcass Characteristics of Feedlot Cattle
Although carcass characteristics of organic versus inorganic-supplemented
animals have not been as thoroughly investigated, several studies have included these
parameters. Early research conducted by Greene et al. (1988) showed that steers
supplemented with zinc methionine, which is the organic form, exhibited more marbling
and thus higher quality grades than those supplemented with zinc oxide. Zinc
supplementation has been shown to increase quality grade and marbling with a tendency
to increase yield grade and 12th rib fat thickness as well. Along with this, supplementing
with organic forms of zinc, such as zinc proteinate, increases hot carcass weights (HCW),
dressing percentage, and ribeye area (Spears and Kegley, 2002). The response seen in this
research was most likely due to the large difference in zinc concentrations of the control
diet and the supplemented diets.
Research performed by Stanton et al. (2001) on varying levels and sources of
trace minerals showed that while most of the carcass characteristics were not affected by
16
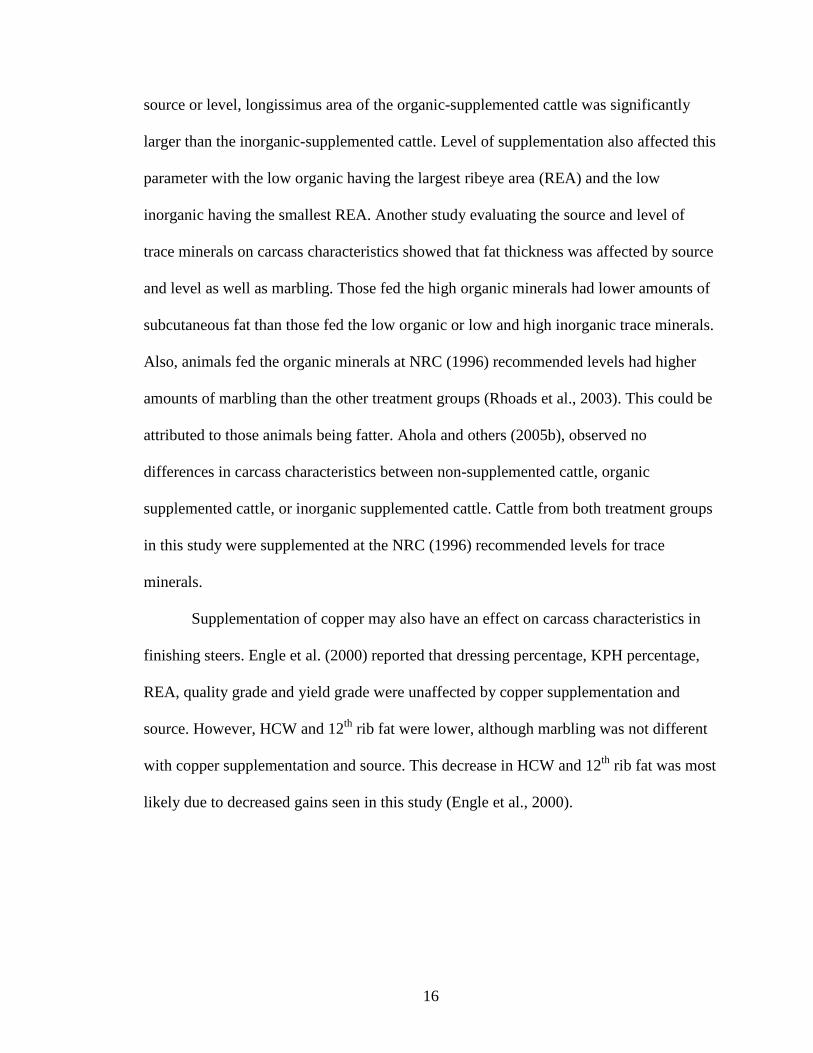
source or level, longissimus area of the organic-supplemented cattle was significantly
larger than the inorganic-supplemented cattle. Level of supplementation also affected this
parameter with the low organic having the largest ribeye area (REA) and the low
inorganic having the smallest REA. Another study evaluating the source and level of
trace minerals on carcass characteristics showed that fat thickness was affected by source
and level as well as marbling. Those fed the high organic minerals had lower amounts of
subcutaneous fat than those fed the low organic or low and high inorganic trace minerals.
Also, animals fed the organic minerals at NRC (1996) recommended levels had higher
amounts of marbling than the other treatment groups (Rhoads et al., 2003). This could be
attributed to those animals being fatter. Ahola and others (2005b), observed no
differences in carcass characteristics between non-supplemented cattle, organic
supplemented cattle, or inorganic supplemented cattle. Cattle from both treatment groups
in this study were supplemented at the NRC (1996) recommended levels for trace
minerals.
Supplementation of copper may also have an effect on carcass characteristics in
finishing steers. Engle et al. (2000) reported that dressing percentage, KPH percentage,
REA, quality grade and yield grade were unaffected by copper supplementation and
source. However, HCW and 12th rib fat were lower, although marbling was not different
with copper supplementation and source. This decrease in HCW and 12th rib fat was most
likely due to decreased gains seen in this study (Engle et al., 2000).

17
Consumer Acceptability of Beef Related to Warner-Bratzler Shear Force and
Tenderness
Miller et al. (1995) stated that tenderness is the most important palatability
attribute of meat and a primary determinant of meat quality (1987). Tenderness is
considered to be one of the major factors of consumer satisfaction of meat products,
along with juiciness, which can also affect tenderness ratings and flavor. Beef tenderness
is influenced by several factors including collagen content, heat stability and myofibrillar
structure of the muscle (Muchenje et al., 2009). Variations in tenderness can also be
attributed to other factors such as breeding and feeding conditions (Miller et al., 1995).
Most often, Warner-Bratzler shear force (WBS) is used as a measure of
tenderness in meat products, which is used to simulate the force it takes for a person to
bite a piece of meat. Typically, as WBS decreases, consumer acceptability, by way of
tenderness ratings, increases (Miller et al., 1995). In 2001, Miller et al. established a scale
of consumer thresholds for beef tenderness. These researchers determined that strip
steaks having a WBS value of 3.0 kg or less were considered tender and would have a
consumer acceptability rating of 100 percent (Miller et al., 1995). It was also established
that steaks with a WBS between 4.3 and 4.9 kg would decrease the consumer
acceptability rating to below 86 percent (Miller et al., 1995). This suggested that steaks
with an average WBS value of approximately 4.6 kg or greater would be unacceptable to
consumers and would be considered “tough” (Miller et al., 1995). They also observed
that steaks with a WBS of 4.9 kg were rated as slightly tough or moderately tough, which
could be explained by the influence of flavor and juiciness which differed between the
samples (Miller et al., 2001).
18
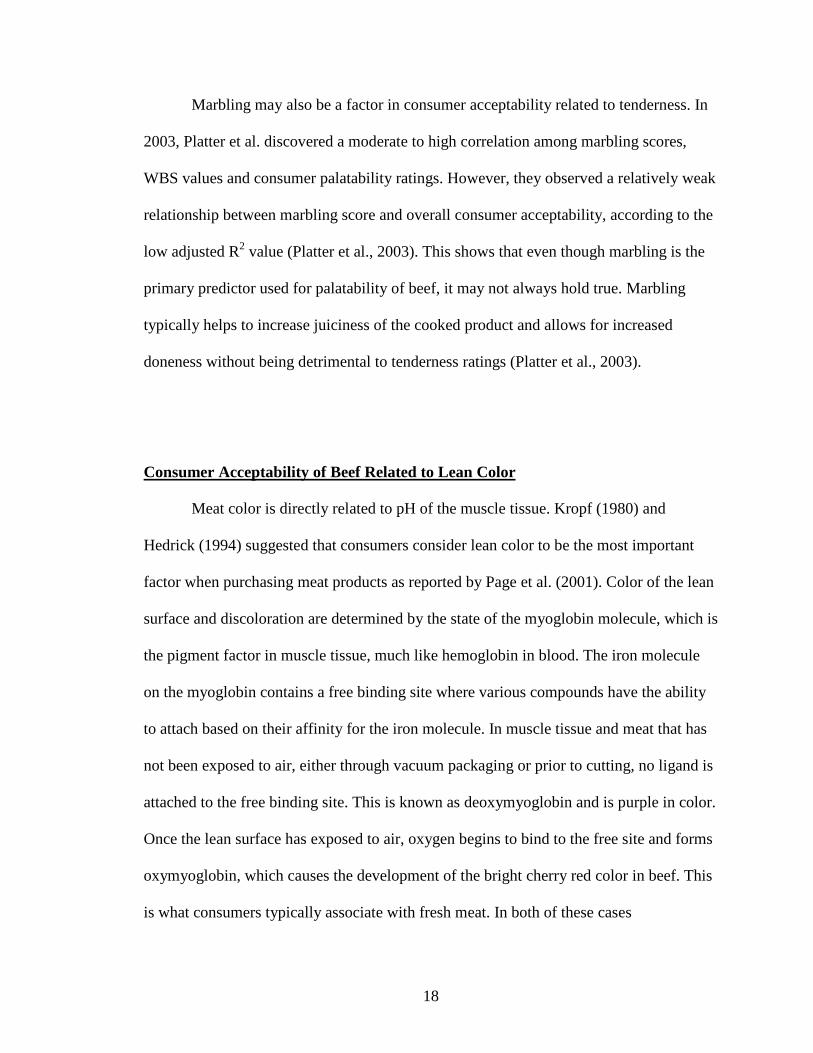
Marbling may also be a factor in consumer acceptability related to tenderness. In
2003, Platter et al. discovered a moderate to high correlation among marbling scores,
WBS values and consumer palatability ratings. However, they observed a relatively weak
relationship between marbling score and overall consumer acceptability, according to the
low adjusted R2 value (Platter et al., 2003). This shows that even though marbling is the
primary predictor used for palatability of beef, it may not always hold true. Marbling
typically helps to increase juiciness of the cooked product and allows for increased
doneness without being detrimental to tenderness ratings (Platter et al., 2003).
Consumer Acceptability of Beef Related to Lean Color
Meat color is directly related to pH of the muscle tissue. Kropf (1980) and
Hedrick (1994) suggested that consumers consider lean color to be the most important
factor when purchasing meat products as reported by Page et al. (2001). Color of the lean
surface and discoloration are determined by the state of the myoglobin molecule, which is
the pigment factor in muscle tissue, much like hemoglobin in blood. The iron molecule
on the myoglobin contains a free binding site where various compounds have the ability
to attach based on their affinity for the iron molecule. In muscle tissue and meat that has
not been exposed to air, either through vacuum packaging or prior to cutting, no ligand is
attached to the free binding site. This is known as deoxymyoglobin and is purple in color.
Once the lean surface has exposed to air, oxygen begins to bind to the free site and forms
oxymyoglobin, which causes the development of the bright cherry red color in beef. This
is what consumers typically associate with fresh meat. In both of these cases

19
(deoxymyoglobin and oxymyoglobin), the iron molecule is in the reduced, or ferrous
form. Once the iron undergoes oxidation through loss of an electron, it becomes the ferric
form and causes discoloration of the meat. A layer of this metmyoglobin is found
between the surface oxymyoglobin and the interior deoxymyoglobin, which gradually
thickens and moves toward the surface of the lean. Development of metmyoglobin and
ultimately surface discoloration is dependent on temperature, pH, oxygen partial
pressure, reducing activity and sometimes, microbial activity (Mancini and Hunt, 2005).
This surface discoloration is associated with discounts of nearly 15% of all retail beef,
totaling annual revenue losses of approximately $1 billion (Smith et al., 2000).
According to Muchenje et al. (2009) most color measurements are taken using the
Commission International De I’Eclairage (CIE) color system, which utilizes the L*, a*
and b* coordinates on the color scale. L* values measure light to dark (100 = white, 0 =
black); a* measures redness/greenness (positive = red, negative = green) and b* measures
yellowness/blueness (positive = yellow, negative = blue). Zhang et al. (2005) showed that
higher pH values of meat correlate to lower L*, a*, b*, hue angle (degrees) and chroma
(saturation) values. This can be seen in Dark, Firm and Dry (DFD) beef which typically
has abnormally high pH values (Muchenje et al., 2009; Page et al., 2001). Page et al.
(2001) also showed that lean maturity is most highly correlated with L* values.
Trained sensory panels for color can also be utilized to determine consumer
acceptability based on visual appearance and discoloration of the product. In 2001,
Carpenter et al. reported a strong association between color preference and purchasing
intent with consumers discriminating against beef that was not red in color. These authors
also observed that meat packaged with film contact, such as with polyvinyl chloride film

20
(PVC) overwrap was perceived to be more red than when packaged with headspace, as
with modified atmosphere packaging (MAP) (Carpenter et al., 2001). Fat and bone color
can also contribute to overall product appearance (Mancini and Hunt, 2005). According
to Arnold et al. (1992), a subjective color panel should be used to apply inferences to the
human assessment of beef discoloration. They also noted that using the days to threshold
method, the data from visual panels and spectrophotometry gives similar estimates of
retail display life for longissimus steaks (Arnold et al., 1992). Therefore, in order to
correctly assess visual lean color and consumer acceptability of meat, both objective and
subjective methods of color measurement should be used.
Currently, no research has been performed to determine if source of trace mineral
has an effect on lean color or retail-case life; however, one could hypothesize that it
would have little, if any, affect. Typical factors that affect meat color include enzymes,
diet (forage vs. grain) and age of the animal as well as pre-harvest handling (Muchenje et
al., 2009). Even if consumers prefer naturally raised or grass-fed beef for the perceived
health reasons (Abt Associates Inc., 1997), Muir et al. (1998) reported that meat from
grass-fed animals is darker than from grain-fed animals. This could have some effect on
consumer preference if purchasing a “natural, grass-fed” product. Walshe et al. (2006),
showed that steaks from conventionally raised beef were more lipid and color stable than
those from organically raised beef. This was thought to be due to the organic steaks
having a higher fat content within the muscle tissue (Walshe et al., 2006).

21
Statement of the Problem
In order for cattle to be considered “naturally raised” at harvest, they cannot be
fed any animal byproducts, or given any antibiotics or growth promoting hormones. Due
to this, cattle feeders are faced with the challenge of decreased performance and
increased morbidity and mortality. Little is known about how this approach to production
affects meat quality and there is limited research has been done on effects on carcass
quality and prevalence of liver abscesses.
Approach to the Problem
Since previous research (Spears and Samsell, 1986; Spears, 1989; Spears, 1996;
Stanton et al., 2000; Spears and Kegley, 2002) has shown that an organic or chelated
form of mineral can increase performance and immune function as well as improving
some carcass characteristics, we wanted to investigate the effect of these minerals in a
natural production system. Meat quality was also a concern, and therefore several factors
were considered including retail-case life, tenderness, and trace mineral content of the
meat.
22
CHAPTER III
EVALUATING EFFECTS OF ZINPRO PERFORMANCE MINERALS® ON PERFORMANCE AND CARCASS CHARACTERISTICS OF STEERS FED
FINISHING DIETS DESIGNED FOR NATURAL BEEF PRODUCTION
C.L. Coggins, D.L. VanOverbeke, B.P. Holland, C.R. Krehbiel, C.K. Larson, and J.B. Morgan
ABSTRACT
One hundred sixteen steers, (harvest 1, n = 42 and harvest 2, n = 38, and harvest 3, n =
36, respectively) were used to evaluate the effect of organic Zinpro Performance
Minerals® on performance, carcass characteristics, tenderness and retail-case life of
longissimus steaks. Steers were blocked by initial weight and assigned one of two
treatment groups, inorganic (ING) or Zinpro (ZPM) trace mineral supplements, at
weaning. Each group was fed to a compositional endpoint and harvested at a commercial
facility. Strip loins (IMPS #180) were collected upon harvest and aged for 14 d. Carcass
characteristics, retail-case life, Warner-Bratzler shear force (WBS), and trace mineral
content were evaluated. In group one, carcass adjusted average daily gain (ADG) and dry
matter intake (DMI) were greater (P < 0.05) for ING steers and gain to feed (G:F) tended
to be greater (P = 0.06) for the entire trial period compared to ZPM steers. In harvest
group two, body weight (BW), ADG, DMI and G:F were similar among treatments;
however, ING steers tended to gain more efficiently (P = 0.07) than ZPM steers. Only
DMI tended to be greater (P = 0.09) in ING steers for the entire trial period with all other
measurements being similar (P > 0.05). No differences (P > 0.05) were observed between

23
treatment groups for strip loin steak WBS and cooking loss percentage. In harvest group
one, ING had significantly (P < 0.05) greater hot carcass weights (HCW) and tended to
have more 12th rib fat (P = 0.07) than ZPM. Kidney, pelvic and heart fat percentage
(KPH) tended to be lower (P = 0.07) in ING compared to ZPM. All carcass traits were
similar in harvest group three. No differences (P > 0.05) were found for liver
condemnation percentages. No differences (P > 0.05) were found for the subjective color
evaluation or a* and b* values between treatments. Steers in ING initial harvest group
had higher (P < 0.05) L* values than the organic contemporaries. Trace mineral analysis
revealed no differences (P > 0.05) between treatments for Ca, Na, Fe, Cu, or Mn content.
In harvest group one, Zn content tended to be greater (P = 0.07) and Ni was greater (P <
0.05) in ING. For harvest group two, S, Mg, K and P were greater (P < 0.05) for ING
compared with ZPM. Supplementing with an organic source of trace minerals while
eliminating antibiotics and growth hormones can be done without any negative effects on
carcass quality or tenderness.
INTRODUCTION
With increased consumer demand for naturally raised or finished beef, cattle must
not be supplemented with or given antibiotics, and they must not be given growth
promotants in order to meet these qualifications. This, in turn, decreases feedlot
performance and may also affect morbidity and mortality. Previous research has shown
some increased performance when cattle are supplemented with an organic form of trace
minerals, especially when zinc methionine was supplemented as the zinc source. These
minerals are known as chelates and can exist as metal amino acid complexes (e.g. zinc

24
methionine), proteinates, metal amino acid chelates, or metal polysaccharide complexes
(Spears, 1996). Zinpro performance minerals are a mixture of metal amino acid
complexes which includes zinc, manganese, copper and cobalt (Zinpro, 2006).
It has also been shown that supplementation of cattle with an organic or chelated
trace mineral can have an effect on carcass characteristics such as decreasing 12th rib fat
thickness (Rhoades et al., 2003), increasing marbling (Greene et al., 1988), and
increasing yield with greater hot carcass weights, dressing percentage and ribeye areas
(Spears and Kegley, 2002). Currently, no known previous research has been conducted
on the effect of trace mineral source on meat quality.
The objectives of this study were to determine if Zinpro performance minerals
could improve animal growth and performance and carcass characteristics, without the
addition of antibiotics or ionophores or the administration of growth implants, and if
ZPM had any effect on meat quality, including retail-case life, tenderness and trace
mineral content.

25
MATERIALS AND METHODS
Animals
Three sets of weaned steer calves (n = 43, n = 38 and n = 37, respectively) were
obtained from the University of Arkansas spring and fall calving herds for three
consecutive calving seasons. These cows are currently being utilized to evaluate the
effects of Availa® 4 mineral compared to an isoinorganic mineral on cow and calf
performance. All calves were subjected to a 42 d conditioning program that included
vaccination and trace mineral nutrition treatments. Calves remained in their designated
groups from which they originated at birth, inorganic (ING) or ZPM (Availa-4),
throughout the study, and these represent the three harvest groups mentioned later.
Treatment Allotment
Approximately 1 h after arrival at Willard Sparks Beef Research Center,
individual body weights were taken and recorded. Cattle were processed approximately
24 h after arrival including vaccinations for viral respiratory pathogens and deworming.
Calves were sorted into pens, blocked based on body weight into two blocks (block 1 =
light weight, block 2 = heavy weight) and randomly assigned a pen. Pens were randomly
assigned to treatments, and each treatment group consisted of 4 pens per harvest group.
Diet
No inophores or antibiotics were fed during the study and no implants were given
so that cattle could qualify as “natural fed cattle at harvest.” Feeding of experimental
diets began 1 d after processing and pen allotment. Feed (Table 2) was mixed every 3 to 5

26
days and stored in a commodity bay. Feed was hand weighed, and delivered twice daily.
Steers were gradually adapted to a final 91% concentrate diet in a step-up fashion. Diet
samples were taken and 28 d intervals. Samples were composited, and analyzed for N,
starch, ash (AOAC, 1990), ADF (Goering and Van Soest, 1970) and mineral content.
Animal Health
All steers were monitored daily for clinical signs of morbidity by a licensed
veterinarian and qualified feedlot personnel. Evaluators assigned a severity score of 1 to 4
during evaluation. Any animal with a severity score of 2 or greater and a rectal
temperature of 40oC or higher received an antimicrobial according to label directions,
using the correct body weight obtained for the proper dosage. For a severity score of 3 or
4, regardless of rectal temperature, cattle received an antimicrobial. These cattle were
then removed from the study due to restrictions on antibiotic treatment.
Data Collection
Interim shrunk body weights were collected and recorded at 28-d intervals. These
weights were recorded at 28, 56, 84, 112 and 140 d on feed to assess performance of the
cattle. Other measurements taken prior to harvest included average daily gain (ADG),
feed consumption per pen, dry matter feed conversion per pen, morbidity and mortality.
The cattle were harvested in three groups, according to the group they were received in.
All black-hided cattle were harvested at a commercial facility (Creekstone Farms, Inc.,
Arkansas City, KS), and all other cattle (n = 4) were harvested at Oklahoma State
University Food and Ag Products Center (FAPC). Carcass measurements were obtained

27
by trained Oklahoma State University personnel, which included hot carcass weight,
longissimus muscle area and marbling score of the split lean surface at the 12th/13th rib
interface, percentage of kidney, pelvic and heart (KPH) fat, fat thickness at the ¾
measure opposite the split lean surface between the 12th and 13th rib, USDA yield and
quality grades, and liver condemnation percentages.
Strip Loin Collection and Sample Preparation
After carcass data collection, carcasses were fabricated according to Institutional
Meat Purchasing Specifications (IMPS; USDA, 1996), and strip loins (IMPS #180) were
individually identified, collected, vacuum packaged, returned to FAPC and aged 14 d
postmortem at approximately 2oC. Following aging, the anterior end of the strip loins
were faced, and two 100 g samples from each strip face were obtained, vacuum packaged
and placed in a blast freezer (-20oC) for subsequent trace mineral analysis. The anterior
2.54 cm steak was then cut and packaged for simulated retail display. The next 2.54 cm
steak was cut, vacuum packaged and frozen at -20oC for subsequent shear force analysis.
Trace Mineral Analysis
Samples for trace mineral analysis were cut into cubes and frozen in whirl-paks.
These were then ground, weighed, and submitted to the Oklahoma State University Soil,
Water, and Forage Analytical Laboratory for trace mineral analysis. The samples were
digested on a digestion block at 125oC for 4 h using 10 mL of 10% trace-metal-grade
nitric acid. Upon digestion the samples were brought to a volume of 50 mL with
deionized water and read using Inductively Coupled Plasma (ICP) Spectroscopy. All

28
trace mineral analysis was performed on an as-is basis, which included zinc, manganese,
copper. Analysis of macro-minerals included calcium, sodium, phosphorus, iron and
sulfur.
Warner-Bratzler Shear Force
Steaks were allowed to temper for 24 h at 4oC prior to cooking. Steaks were
broiled in an impingement oven (model 1132-000-A; Lincoln Impinger, Fort Wayne, IN)
at 180oC for approximately 13 minutes to a final internal temperature of 70oC. Individual
steak weights were recorded prior to and following cooking to determine cook loss
percentages. After steaks were allowed to cool for at least two hours to 25oC, six 1.27 cm
diameter cores were removed parallel to the muscle fiber orientation from each steak.
Each core was sheared once by a Warner-Bratzler head attached to an Instron Universal
Testing Machine (model 4502; Instron Corp., Canton, MA) at a crosshead speed of 200
mm/min. Peak force (kg) of cores were recorded by an IBM PS2 (Model 55 SX) using
software provided by the Instron Corp. (Canton, MA).
Simulated Retail Display and Color Evaluation
After the retail display steaks were over-wrapped with PVC, the steaks were
placed in retail display cases maintained at 2oC ± 1, under lighting conditions (Phillips
Delux Warm White Florescent lamps, 24 h/d, the surface of the meat was exposed to 900
to 1365 lux) recommended by AMSA (1991) to simulate retail display conditions. Each
steak was objectively and subjectively evaluated for color attributes at 12 h intervals
during retail display.

29
Objective Color Evaluation
Color of each steak was measured using a HunterLab MiniScan XE hand-held
spectrophotometer equipped with a 6 mm aperture (HunterLab Associates, Inc., Reston,
VA) to determine values for CIE L* (brightness; 0 = black, 100 = white), a*
(redness/greenness; positive values = red, negative values = green), and b*
(yellowness/blueness; positive values = yellow, negative values = blue) following
procedures of the Commission Internationale de I’Eclairage (CIE, 1976). Three readings
for each of L*, a* and b* were averaged for each steak at the beginning of retail display
and once every 12 h during display.
Subjective Color Evaluation
Color was subjectively evaluated by a 6 person trained panel of Oklahoma State
University personnel; panelists were trained using a system of open discussion and a
procedure outlined by Lavelle et al. (1995). Evaluators assigned scores to each steak for
muscle color, overall appearance and surface discoloration at each evaluation time.
Muscle color (oxygenated pigment) was characterized on an 8-point scale (8 = extremely
bright cherry red; 1 = extremely dark red) as outlined in the Guidelines for Meat Color
Evaluation (AMSA, 1991). Scores for overall appearance (8 = extremely desirable; 1 =
extremely undesirable) and surface discoloration (7 = 100% discoloration; 1 = no
discoloration) were also assigned according to AMSA (1991) guidelines. Steaks were
evaluated until at least 80% of the steaks were assigned a mean overall appearance score
of 3 (moderately undesirable) or lower.
30
Statistical Analysis
Only data from cattle that completed the study was analyzed using SAS Release
9.1 (SAS Institute Inc., Cary, NC) with a significance level of α = 0.05; means were
separated by TRT using LS means. All performance data was analyzed using the Proc
Mixed procedure with pen as the experimental unit. Data for carcass characteristics, cook
loss, and Warner-Bratzler Shears were analyzed using the Proc Mixed procedure with
treatment (TRT) and block (BLK) as fixed effects and animal ID as a random effect.
Color data was analyzed using repeated measures with hour of display as the repeated
measure. All carcass data was initially analyzed as a pooled set of data over all harvest
groups and after finding harvest group to be significant with no harvest group x treatment
interaction, these groups were then separated.

31
CHAPTER IV
RESULTS AND DISCUSSION
Performance
Although 118 steers entered the study, one died and one was removed from the
trial after being treated with antibiotics. All data from these 2 steers was removed from
analysis. The largest differences for average daily gain (ADG), dry matter intake (DMI),
and gain to feed (G:F) were seen in harvest group one (Table 3). Although no significant
differences were seen for final body weight (BW), steers in ING were initially greater in
BW (P < 0.05) than the ZPM steers. They also had greater BW at 28 d (P < 0.05);
however, there were no differences in the remaining 28 d interval weights. Although
there was a significant difference in the carcass adjusted ADG, no differences were seen
throughout the 195 d trial period. Dry matter intake was significantly greater (P < 0.05) in
the ING steers throughout the trial, being significant at the final stages of feeding rather
than early in the trial. Adjusted gain to feed tended to be greater (P = 0.06) in the ING
steers throughout the trial with significance occurring at 57 to 112 d and 29 to 195 d.
Although no differences (P > 0.05) were observed between the two treatments for
BW, ADG, DMI or G:F in group two (Table 4), steers in ING tended to gain more
efficiently (P = 0.07) from 29-56 d of the 152 d trial. Average Daily Gain and G:F were
similar between the treatments in group three; however, DMI tended to be greater (P =
0.09) in ING steers than ZPM throughout the 187 d trial with the largest difference seen

32
from 141 to 187 d. There was also a significant difference seen for BW at day 84 with
ING being greater (P < 0.05) than ZPM.
Carcass Characteristics
No significant differences (P > 0.05) were observed for marbling or liver
condemnation rates in all three harvest groups (Tables 6 through 8). This data was similar
to work performed by Malcolm-Callis et al. (2000), Stanton et al. (2001) and Ahola et al.
(2005b) where source of mineral had no effect (P > 0.05) on marbling scores and
subsequent quality grades. This is different, however, than a study comparing zinc
methionine and zinc oxide where zinc methionine supplemented steers had greater
marbling scores than zinc oxide supplemented steers (Greene et al., 1988). There was a
trend for greater REA in the heavy weight block of harvest groups one (P = 0.09) and
three (P = 0.07), but no difference (P > 0.05) between the two treatments within harvest
group two (Table 7). For 12th rib fat thickness, the cattle in the inorganic treatment
tended (P = 0.07) to have greater amounts of 12th rib fat within the initial harvest group
than the ZPM cattle (Table 6). This was also seen, as expected, for preliminary yield
grade (PYG), which is directly related to 12th rib fat thickness. In harvest group one; the
ING cattle had significantly greater (P < 0.05) hot carcass weights (HCW) than the ZPM
cattle, which was most likely due to more 12th rib fat in ING cattle (Table 6). These
results were similar to Rhoades et al. when cattle fed organic minerals at 1.5 times the
NRC recommended levels had less (P < 0.05) 12th rib fat than those fed organic minerals
at the NRC recommended levels or cattle fed inorganic minerals (2003). Malcolm-Callis
et al. similarly found that steers supplemented with an organic source of zinc had less (P

33
< 0.10) 12th rib fat than those supplemented with zinc sulfate (2000). However, this is
contradicted by a study from Greene et al. which reported that zinc oxide supplemented
steers tended to have less (P < 0.10) 12th rib fat than zinc methionine supplemented steers
(1988). In this study in harvest group one, ZPM cattle tended (P = 0.07) to have slightly
greater amounts of kidney, pelvic and heart fat percentage (KPH) than their ING
contemporaries (Table 6). No differences (P > 0.05) were observed between treatments in
harvest group two or three (Tables 7 and 8). No differences (P > 0.05) were observed for
PYG, fat thickness, YG, marbling, or percentages of quality grades for harvest group
three (Table 8).
Cook and Shear Data
No significant differences (P > 0.05) were seen for cook loss or WBS between
treatments (Table 9). When treatment groups were analyzed together, harvest group two
had greater (P < 0.05) shear force values than the initial harvest group, and therefore had
less tender steaks. This was most likely due to the greater amount of marbling in harvest
group one. Within harvest group three, no significant differences were found between the
treatments for cook loss percentage or shear force. All three harvest groups and
treatments were within an acceptable range for tenderness having WBS values of 3.75 kg
or less as seen in Table 9.
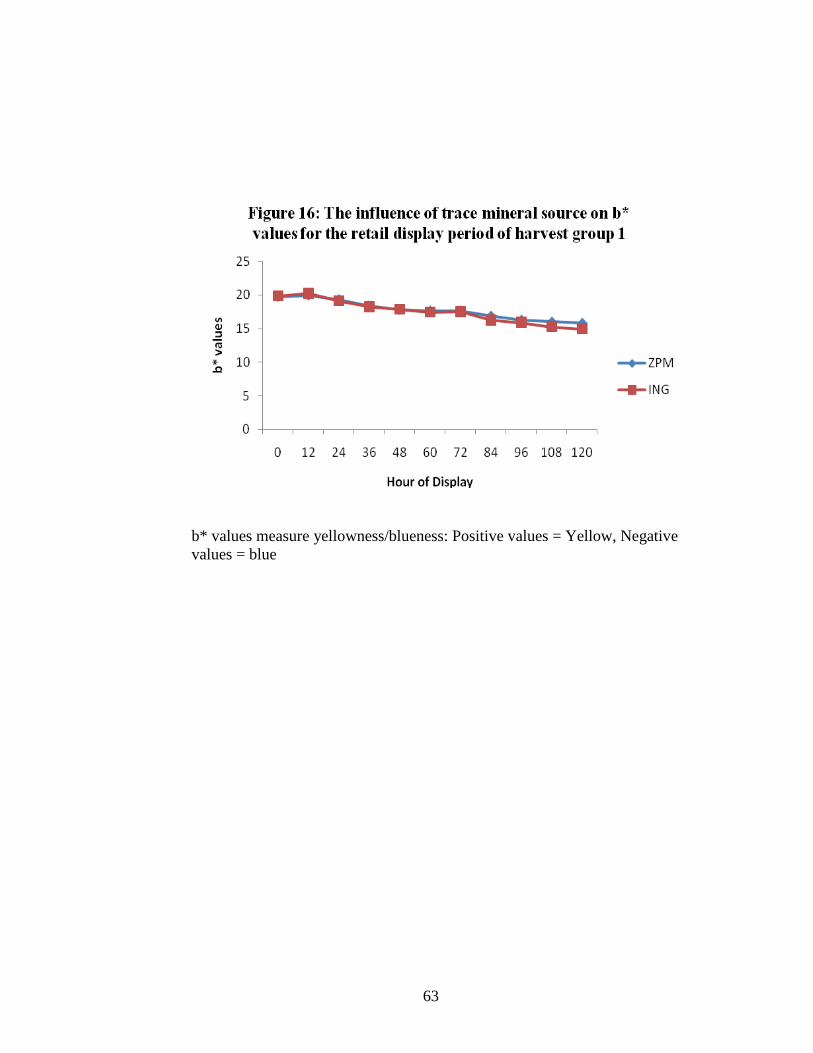
Lean Color Data
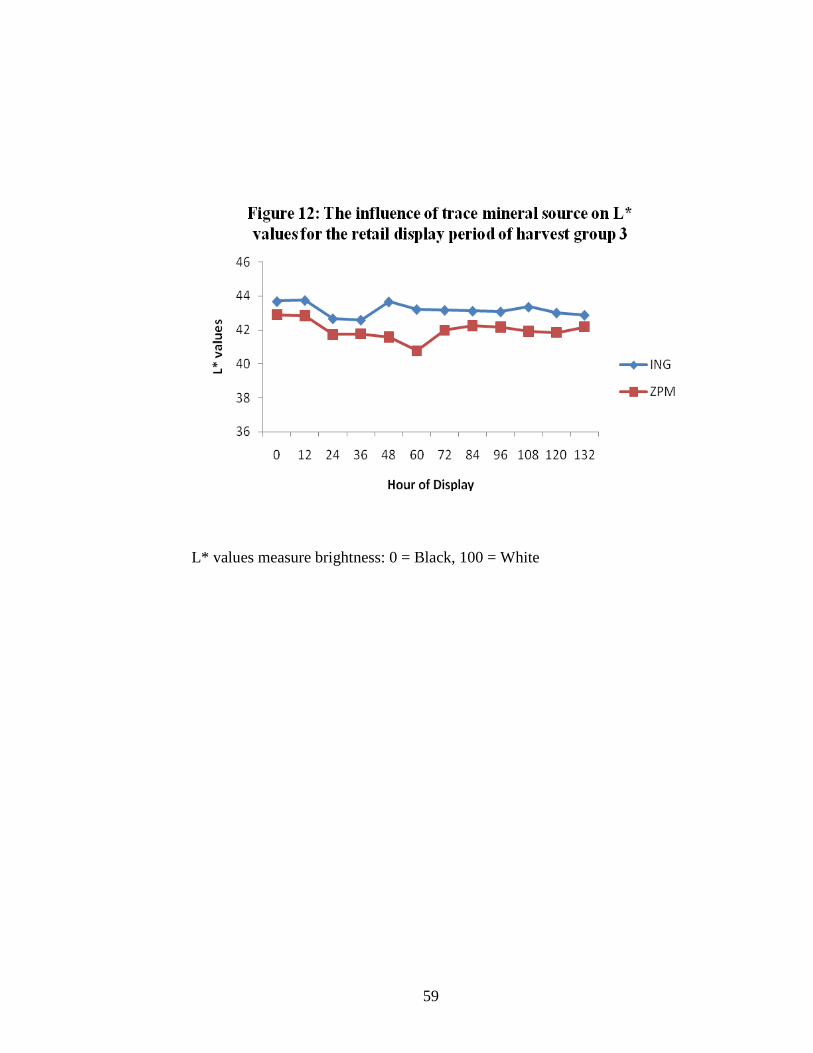
In harvest group one, L* values were significantly greater (P < 0.05) in the ING
group than the ZPM group; therefore, the steaks were lighter in color within the ING

34
treatment (Figure 10). This could be due to differences in marbling scores between the
two groups. In harvest group three, there no significant differences (P < 0.05) between
treatments. No significant differences (P > 0.05) were observed for a* or b* values
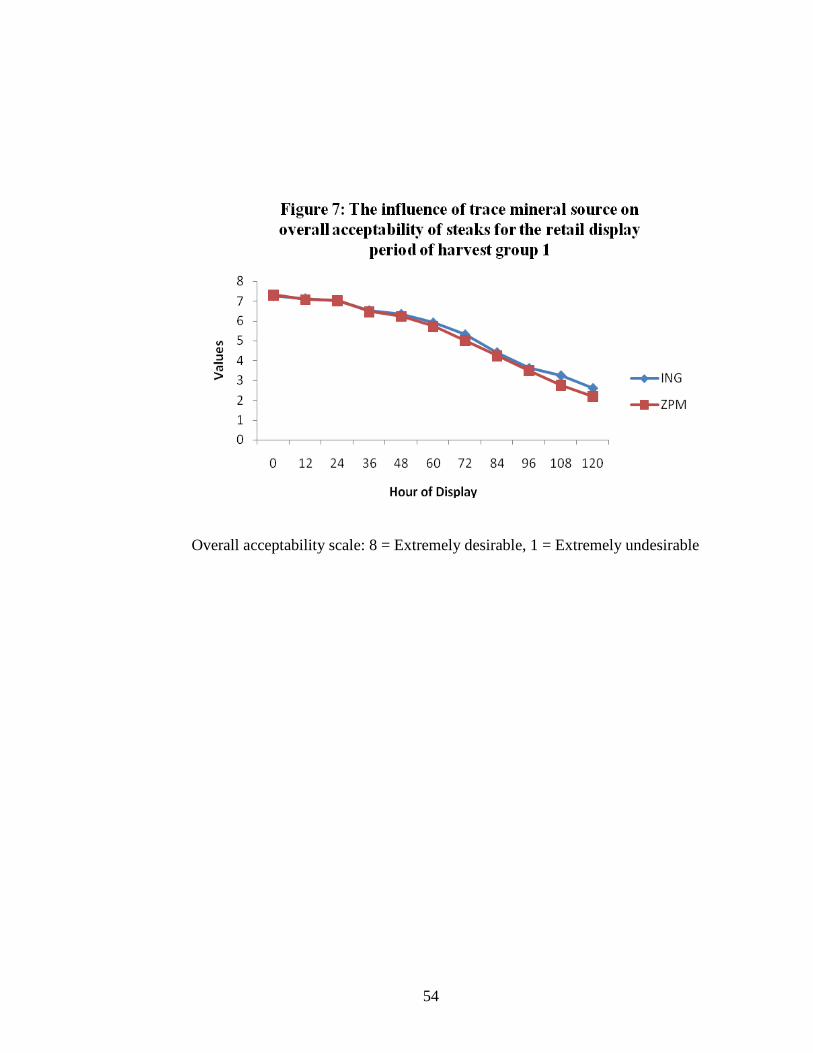
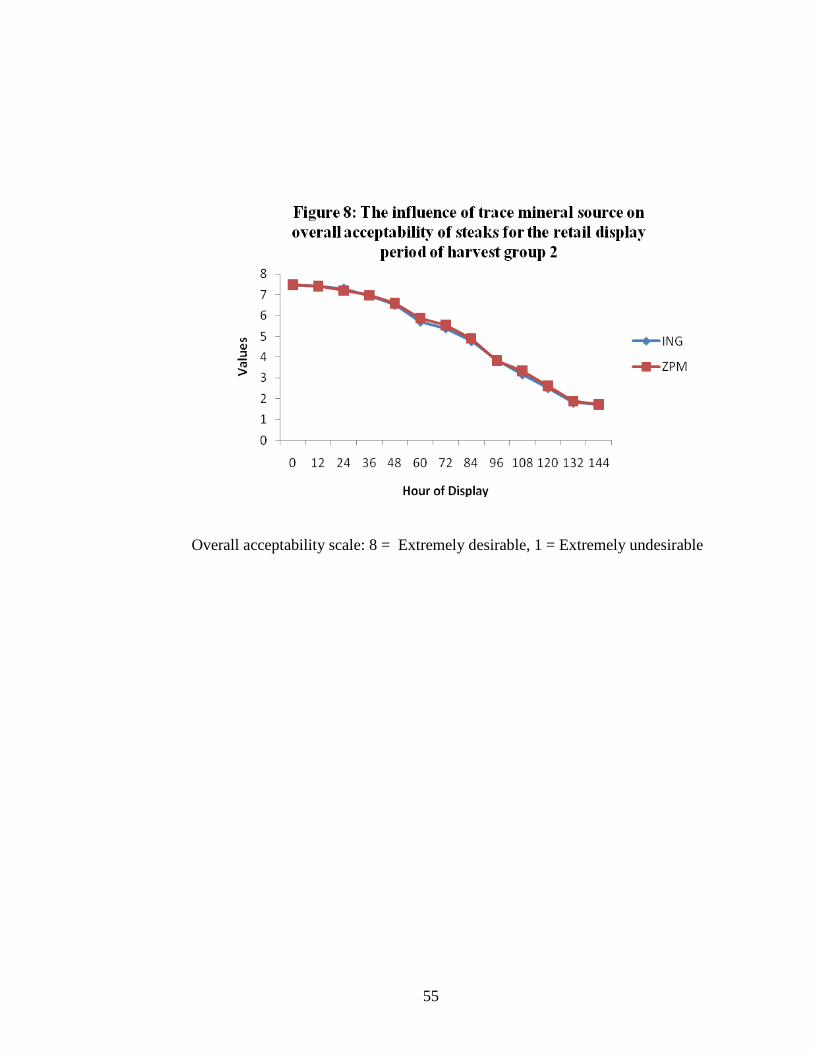
between treatments in all three harvest groups (Figures 13 through 18). No differences (P
> 0.05) were observed for lean color, surface discoloration, or overall appearance using
the subjective color evaluation for all three harvest groups (Figures 1 through 9).
Trace Mineral Analysis
No significant differences (P > 0.05) were observed for calcium, sodium, iron,
copper, or manganese between treatments in harvest groups one and two (Tables 10 and
11). In harvest group one, there was a trend (P = 0.07) for the inorganic treatment group
to have higher levels of zinc in the muscle tissue than the organic group. Also in the
initial harvest group, nickel was significantly higher (P < 0.05) in the inorganic group
(Table 10). In harvest group two, sulfur, magnesium, potassium and phosphorus were
higher (P < 0.05) in the inorganic group than ZPM (Table 11). This could be due to the
increased utilization of the minerals by the animal, so less would be deposited in the
muscle tissue. No significant differences were found between the treatments within
harvest group three for any of the minerals listed above (Table 12).
35
CHAPTER V
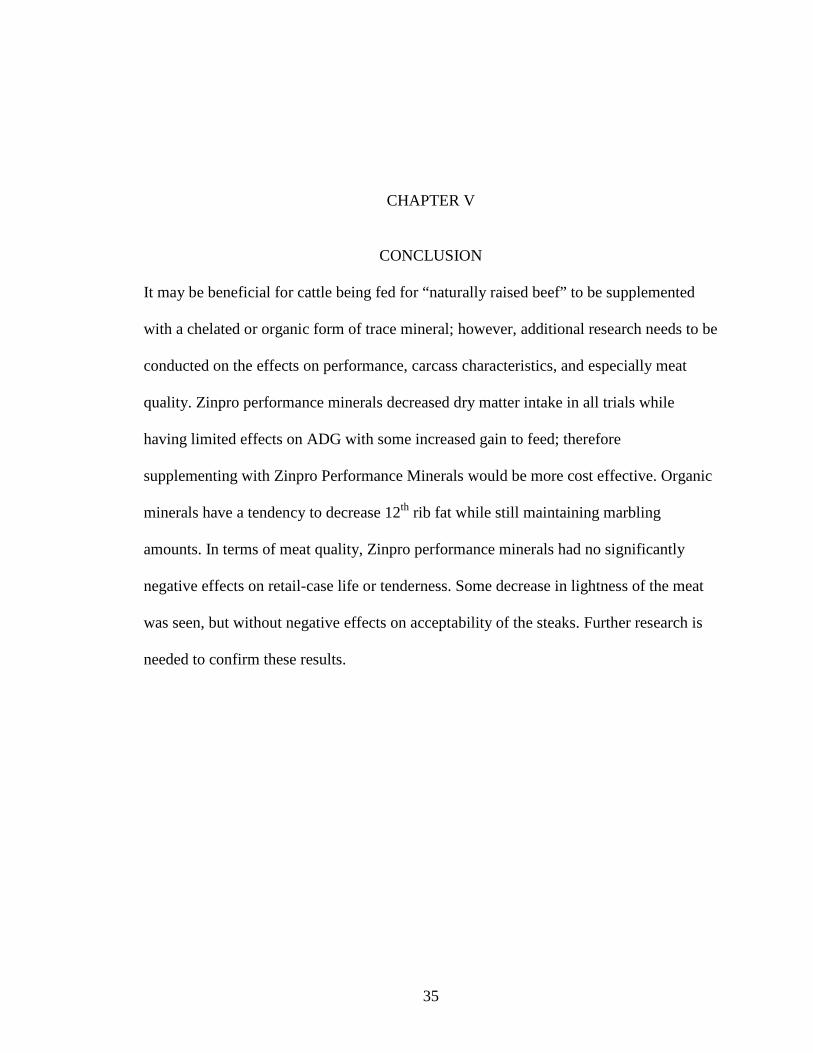
CONCLUSION
It may be beneficial for cattle being fed for “naturally raised beef” to be supplemented
with a chelated or organic form of trace mineral; however, additional research needs to be
conducted on the effects on performance, carcass characteristics, and especially meat
quality. Zinpro performance minerals decreased dry matter intake in all trials while
having limited effects on ADG with some increased gain to feed; therefore
supplementing with Zinpro Performance Minerals would be more cost effective. Organic
minerals have a tendency to decrease 12th rib fat while still maintaining marbling
amounts. In terms of meat quality, Zinpro performance minerals had no significantly
negative effects on retail-case life or tenderness. Some decrease in lightness of the meat
was seen, but without negative effects on acceptability of the steaks. Further research is
needed to confirm these results.

36
Table 1. Arrival date, days on feed, and number of animals received. Number of Animals Date Received DOF Initial BW,
kg Inorganica Organica
Load 1 9/5/2007 195 266 ± 24.9 17 26 Load 2 1/30/2008 152 293 ± 30.3 22 16 Load 3 8/21/2008 187 275 ± 29.6 19 18 aOrganic treatment contained Availa 4 during the adaptation period and zinc methionine for the remainder of the feeding period. Inorganic treatment diet was formulated to contain equal concentrations of zinc, manganese, copper, and cobalt or zinc from traditional sources to the Organic treatment diets during the adaptation and finishing periods, respectively.

37
Table 2. Experimental diets and nutrient composition. Item Step 1 Step 2 Step 3 Finisher Dry rolled corn 47.0 52.0 57.0 61.5 DDGS 5.0 10.0 15.0 20.0 Synergy 19-14 3.5 3.5 3.5 4.5 Ground Alfalfa 40.0 30.0 20.0 10.0 Dry supplement 4.5a 4.5a 4.5a 5.0b
Nutrient Compositionc Dry matter, % 86.8 86.9 87.0 86.8 NEm, Mcal/kg 1.84 1.93 2.02 2.12 NEg, Mcal/kg 1.15 1.23 1.30 1.37 Crude protein, % 14.7 14.9 15.02 15.25 Fat, % 4.2 4.7 5.3 6.0 NDF, % 24.9 23.1 21.2 18.9 Calcium, % 0.89 0.75 0.60 0.70 Phosphorus, % 0.31 0.33 0.35 0.37 Zinc, mg/kg 74.0 74.0 74.1 93.2 Cobalt, mg/kg 1.95 1.95 1.95 0.1 Copper, mg/kg 29.7 31.7 33.7 32.8 Manganese, mg/kg 54.7 52.0 49.4 40.1 a Pelletted supplement contained, for the Inorganic treatment: ground corn, 61.4%; wheat middlings, 16.7%; calcium carbonate, 14.4%; salt, 5.6%; thiamine 10, 1.20%; zinc sulfate, 0.3267%; copper sulfate, 0.1667%; manganous oxide, 0.1089%; vitamin (A-30,000 IU/g), 0.0711%; vitamin E, (50%), 0.0489%; and cobalt carbonate, 0.0089%. Supplement for the Organic treatment contained: ground corn, 59.7%; wheat middlings, 16.7%; calcium carbonate, 14.4%; salt, 5.6%; thiamine 10, 1.20%; and Availa 4 (Zinpro, Inc.), 2.28%. b Pelletted supplement contained for the Inorganic treatment: ground corn ,49.8%; calcium carbonate, 26.0%; wheat middlings 15.0%; salt 5.0%; potassium chloride 2.4%; thiamine 10, (1.0880%); zinc sulfate, 0.4000%; copper sulfate, 0.1200%; manganous oxide, 0.0700%; vitamin A (30,000% IU/g), 0.0640%; vitamin E (50%), 0.0440%. Supplement for the Organic treatment contained: ground corn ,48.8%; calcium carbonate, 26.0%; wheat middlings 15.0%; salt 5.0%; potassium chloride 2.4%; thiamine 10, (1.0880%); copper sulfate, 0.1200%; manganous oxide, 0.0700%; vitamin A (30,000% IU/g), 0.0640%; vitamin E (50%), 0.0440%, and zinc methionine (Zinpro, Inc.). c All values on a DM basis, except DM, and calculated using NRC (2000) values.

38
Table 3. Feedlot performance of steers fed inorganic or organic complexes of trace minerals (Load 1). Inorganic Organic SEMa P > F BW, kg d 0 282.2 258.3 16.52 <0.001 d 28 320.4 297.4 14.53 0.001 d 56b 359.9 361.5 18.46 0.97 d 84b 413.1 410.6 9.98 0.92 d 112b 442.3 450.7 4.09 0.24 d 140b 483.8 498.1 5.38 0.15 d 168 523.9 512.3 14.96 0.27 d 195b 541.4 547.6 5.78 0.52 Adj. Finalb 543.4 545.9 5.52 0.78 ADG, kg/d 0 – 28 1.36 1.39 0.12 0.85 29 – 56 1.87 1.83 0.16 0.83 57 – 84 1.79 1.86 0.07 0.49 85 – 112 1.09 1.38 0.11 0.08 113 – 140b 1.49 1.57 0.17 0.46 141 – 168 0.91 1.03 0.22 0.38 169 – 195 1.11 0.84 0.14 0.16 29 – 195 1.40 1.42 0.03 0.52 0 – 195 1.39 1.42 0.03 0.52 Adj. 0 – 195 1.41 1.40 0.73 0.03 DMI, kg/d 0 – 28 8.20 7.22 0.25 0.03 29 – 56 10.11 8.90 0.55 0.17 57 – 84 10.65 10.13 0.23 0.16 85 – 112 10.73 10.49 0.32 0.61 113 – 140 10.35 10.09 0.42 0.62 141 – 168 10.16 10.18 0.27 0.97 169 – 195 10.57 9.78 0.19 0.03 29 – 195 10.43 9.90 0.19 0.09 0 – 195 11.28 10.57 0.20 0.05 G:F, kg:kg 0 – 28 0.167 0.194 0.016 0.27 29 – 56 0.187 0.212 0.026 0.51 57 – 84 0.168 0.184 0.004 0.03 85 – 112 0.101 0.132 0.007 0.02 113 – 140b 0.147 0.163 0.014 0.49 141 – 168b 0.106 0.086 0.009 0.22 169 – 195 0.105 0.087 0.014 0.36 29 – 195 b 0.133 0.145 0.003 0.08 0 – 195 0.124 0.134 0.003 0.04 Adj. 0 – 195 0.125 0.133 0.002 0.06
aStandard error of the least squares means. bInitial body weight included as a covariate.

39
Table 4. Feedlot performance of steers fed inorganic or organic complexes of trace minerals (Load 2). Inorganic Organic SEMa P > F BW, kg d 0 291 293 24.22 0.50 d 28 348 347 26.34 0.88 d 56b 397 400 4.76 0.65 d 84b 446 447 5.75 0.87 d 112b 488 486 3.12 0.61 d 152b 529 535 6.57 0.58 Adj. Final 538 526 26.77 0.58 ADG, kg/d 0 – 28 2.05 1.96 0.10 0.55 29 – 56 1.70 1.92 0.20 0.21 57 – 84 1.75 1.69 0.18 0.81 85 – 112 1.52 1.38 0.16 0.57 113 – 152 1.03 1.22 0.13 0.34 29 – 152 1.45 1.52 0.05 0.34 0 – 152b 1.56 1.60 0.04 0.58 Adj. 0 – 152 1.63 1.53 0.10 0.52 DMI, kg/d 0 – 28 8.48 8.43 0.68 0.91 29 – 56 10.95 10.65 1.29 0.60 57 – 84 12.00 11.87 0.66 0.87 85 – 112 11.52 11.28 0.43 0.58 113 – 152 10.15 10.38 0.16 0.36 29 – 152 11.06 10.98 0.54 0.84 0 – 152 10.58 10.51 0.56 0.84 G:F, kg:kg 0 – 28 0.243 0.232 0.011 0.34 29 – 56 0.157 0.180 0.007 0.07 57 – 84 0.145 0.144 0.016 0.95 85 – 112 0.132 0.123 0.015 0.68 113 – 152 0.101 0.118 0.012 0.39 29 – 152 0.132 0.139 0.004 0.35 0 – 152 0.148 0.153 0.005 0.38 Adj. 0 – 152 0.154 0.147 0.010 0.68 aStandard error of the least squares means. bProbability of significance of using initial BW as a covariate.

40
Table 5. Feedlot performance of steers fed inorganic or organic complexes of trace minerals (Load 3). Inorganic Organic SEMa P > F BW, kg d 0 274 275 23.23 0.93 d 28b 317 309 3.66 0.18 d 56b 368 360 12.84 0.10 d 84b 422 401 5.46 0.04 d 112b 457 440 7.70 0.18 d 140b 485 473 5.91 0.21 d 187b 542 527 7.09 0.18 Adj. Finalb 544 526 9.30 0.22 ADG, kg/d 0 – 28 1.51 1.22 0.28 0.18 29 – 56 1.82 1.82 0.18 0.99 57 – 84 1.96 1.47 0.24 0.17 85 – 112 1.22 1.41 0.16 0.44 113 – 140 1.00 1.18 0.27 0.62 141 – 187 1.22 1.14 0.08 0.55 29 – 195 1.42 1.37 0.04 0.44 0 – 187b 1.43 1.35 0.04 0.18 Adj. 0 – 187b 1.44 1.34 0.05 0.22 DMI, kg/d 0 – 28 7.19 6.57 0.54 0.50 29 – 56 9.39 9.01 0.68 0.34 57 – 84 10.68 10.01 0.35 0.23 85 – 112 10.32 9.60 0.39 0.24 113 – 140 10.31 9.79 0.25 0.19 141 – 187 9.47 8.84 0.22 0.09 29 – 187 9.97 9.38 0.22 0.08 0 – 187 9.55 9.00 0.25 0.09 G:F, kg:kg 0 – 28 0.206 0.179 0.026 0.29 29 – 56 0.196 0.205 0.032 0.76 57 – 84 0.185 0.144 0.027 0.19 85 – 112 0.118 0.147 0.015 0.19 113 – 140 0.096 0.123 0.023 0.51 141 – 187 0.128 0.129 0.009 0.96 29 – 187 0.142 0.146 0.003 0.42 0 – 187 0.150 0.150 0.002 0.91 Adj. 0 – 187 0.150 0.149 0.004 0.86
aStandard error of the least squares means. bInitial body weight included as a covariate.

41
Table 6: Carcass Data (Harvest group 1)
Item Inorganic Organic SEM P-Value HCW, kg 362.28a 344.45b 6.15 0.006 FT 0.70 0.61 0.05 0.07 PYG 3.77 3.55 0.12 0.06 KPH 1.92 2.28 0.19 0.07 REA 12.11 12.04 0.27 0.80 YG 3.79 3.52 0.19 0.16 Marbling1 680.25 651.70 37.51 0.45
a,b Means within a row with uncommon superscripts differ (P ≤ 0.05) 1Marbling scores were determined by the USDA grading service using a scale of: 300-390 = Slight (USDA Select), 400-490 = Small (USDA Choice-), 500-590 = Modest (USDA Choice0), 600-690 = Moderate (USDA Choice+), 700-790 = Slightly Abundant (USDA Prime-), 800-890 = Moderately Abundant (USDA Prime0), 900-990 = Abundant (USDA Prime+)

42
Table 7: Carcass Data (Harvest Group 2)
Item Inorganic Organic SEM P-Value HCW, kg 346.23 330.77 12.24 0.21 FT 0.60 0.55 0.04 0.25 PYG 3.44 3.28 0.11 0.17 KPH 1.63 1.75 0.12 0.35 REA 11.80 12.00 0.35 0.57 YG 3.43 3.23 0.17 0.23 Marbling1 444.38 468.75 22.46 0.29
1Marbling scores were determined by the USDA grading service using a scale of: 300-390 = Slight (USDA Select), 400-490 = Small (USDA Choice-), 500-590 = Modest (USDA Choice0), 600-690 = Moderate (USDA Choice+), 700-790 = Slightly Abundant (USDA Prime-), 800-890 = Moderately Abundant (USDA Prime0), 900-990 = Abundant (USDA Prime+)

43
Table 8: Carcass Data (Harvest Group 3)
Item Inorganic Organic SEM P-Value HCW, kg 349.39 337.48 7.82 0.14 FT, cm 1.43 1.24 0.12 0.14 PYG 3.37 3.18 0.13 0.16 KPH 1.84 2.15 0.19 0.12 REA, cm 33.02 33.30 1.09 0.82 YG 3.03 2.76 0.20 0.19 Marbling1 460.00 484.00 32.13 0.46
1Marbling scores were determined by the USDA grading service using a scale of: 300-390 = Slight (USDA Select), 400-490 = Small (USDA Choice-), 500-590 = Modest (USDA Choice0), 600-690 = Moderate (USDA Choice+), 700-790 = Slightly Abundant (USDA Prime-), 800-890 = Moderately Abundant (USDA Prime0), 900-990 = Abundant (USDA Prime+)

44
Table 9: Cook loss percentage and Warner-Bratzler Shear Force Item Inorganic Organic SEM P-Value Harvest Group 1 Cook loss1 22.76 23.31 0.83 0.51 WBS 3.30 3.37 0.13 0.59 Harvest Group 2 Cook loss1 31.12 30.66 0.93 0.62 WBS 3.75 3.52 0.20 0.23 Harvest Group 3 Cook loss1 26.98 27.04 0.62 0.91 WBS 3.53 3.45 0.12 0.52
* No significant differences were found 1 Measurements taken by weights prior to and after cooking a Cook loss = (final weight – initial weight/ initial weight) * 100%

45
Table 10: Trace Mineral Content of Longissimus Steaks (Harvest Group 1)
Item Inorganic ZPM SEM P-Value Copper 0.657 0.857 0.22 0.38 Zinc 33.40 30.37 1.63 0.07 Manganese 0.15 0.12 0.03 0.73 Iron 16.31 15.49 1.47 0.15 Nickel 1.12a 0.80b 0.13 0.02 Calcium 0.0079 0.0078 0.001 0.97 Sodium 0.069 0.068 0.008 0.85 Magnesium 0.023 0.023 0.001 0.45 Phosphorus 0.265 0.242 0.03 0.46 Sulfur 0.21 0.20 0.008 0.20 Potassium 0.37 0.36 0.015 0.30 a, b Columns with unlike superscripts differ by P < 0.05

46
Table 11: Trace Mineral Content of Longissimus steaks (Harvest Group 2)
Item Inorganic ZPM SEM P-Value Copper 0.600 0.944 0.27 0.20 Zinc 39.33 37.75 3.26 0.63 Manganese 0.034 0.025 0.013 0.54 Iron 13.54 13.30 0.76 0.75 Nickel 0.24 0.15 0.09 0.33 Calcium 0.0064 0.0059 0.0006 0.43 Sodium 0.053 0.051 0.002 0.16 Magnesium 0.023a 0.022b 0.0004 0.02 Phosphorus 0.189a 0.180b 0.004 0.02 Sulfur 0.210a 0.190b 0.004 0.004 Potassium 0.345a 0.312b 0.016 0.04 a, b Columns with unlike superscripts differ by P < 0.05

47
Table 12: Trace Mineral Content of Longissimus steaks (Harvest Group 3)
Item Inorganic ZPM SEM P-Value Copper 0.38 0.29 0.09 0.35 Zinc 34.63 36.58 1.98 0.33 Manganese 0.016 0.023 0.013 0.62 Iron 13.51 14.07 0.82 0.50 Nickel 0.12 0.07 0.07 0.52 Calcium 0.004 0.004 0.0004 0.96 Sodium 0.049 0.049 0.002 0.88 Magnesium 0.018 0.018 0.001 0.93 Phosphorus 0.205 0.206 0.006 0.92 Sulfur 0.21 0.21 0.005 0.53 Potassium 0.34 0.34 0.009 0.92 * No significant differences

48
Muscle color scale: 8 = extremely bright cherry red, 1 = extremely dark red

49
Muscle color scale: 8 = bright cherry red, 1 = extremely dark red

50
Muscle color scale: 8 = extremely bright cherry red, 1 = extremely dark red

51
Surface discoloration scale: 1 = no discoloration, 7 = Total discoloration (100%)

52
Surface discoloration scale: 1 = no discoloration, 7 = total discoloration (100%)

53
Surface discoloration scale: 1 = No discoloration, 7 = Total discoloration (100%)
54
Overall acceptability scale: 8 = Extremely desirable, 1 = Extremely undesirable
55
Overall acceptability scale: 8 = Extremely desirable, 1 = Extremely undesirable

56
Overall acceptability scale: 8 = Extremely desirable, 1 = Extremely undesirable

57
L* values measure brightness: 0 = Black, 100 = White

58
L* values measure brightness: 0 = Black, 100 = White
59
L* values measure brightness: 0 = Black, 100 = White

60
a * values measure redness/greenness: Positive values = Red, Negative values = Green

61
a* values measure redness/greenness: Positive values = Red, Negative values = Green

62
a* values measure redness/greenness: Positive values = Red, Negative values = Green
63
b* values measure yellowness/blueness: Positive values = Yellow, Negative values = blue

64
b* values measure yellowness/blueness: Positive values = Yellow, Negative values = Blue

65
b* values measure yellowness/blueness: Positive values = Yellow, Negative values = Blue
66
REFERENCES
Abt Associates Inc. 1997. Trends in the United States, consumer attitudes and the supermarket. Food Marketing Institute, Washington, DC.
Ahola, J. K., D. S. Baker, P. D. Burns, J. C. Whittier, and T. E. Engle. 2005a. Effects of
copper, zinc, and manganese source on mineral status, reproduction, immunity, and calf performance in young beef females over a two-year period. The Prof. Anim. Scientist 21:297-304.
Ahola, J. K., D. S. Baker, P. D. Burns, R. G. Mortimer, R. M. Enns, J. C. Whittier, T. W.
Geary, and T. E. Engle. 2004. Effect of copper, zinc, and manganese supplementation and source on reproduction, mineral status, and performance in grazing beef cattle over a two-year period. J. Anim. Sci. 82:2375-2383.
Ahola, J. K., L. R. Sharpe, K. L. Dorton, P. D. Burns, T. L. Stanton, and T. E. Engle.
2005a. Effects of lifetime copper, zinc, and manganese supplementation and source on performance, mineral status, immunity, and carcass characteristics of feedlot cattle. The Prof. Anim. Scientist 21:305-317.
Arnold, R. N., K. K. Scheller, S. C. Arp, S. N. Williams, and D. M. Schaefer. 1992.
Visual and spectrophotometric evaluations of beef color stability. J. Food Sci. 57(2):518-520.
Bentley, O. G., M. Moinuddin, T. V. Hershberger, E. W. Klosterman, and A. L. Moxon.
1954. The effect of trace minerals on growth performance and vitamin B12 synthesis of steers. J. Anim. Sci. 13:789-801.
Boling, J. A. 1993. The feeding of amino acid chelate supplements to beef calves. Brown, T. F. and L. K. Zeringue. 1994. Laboratory evaluations of solubility and
structural integrity of complexed and chelated trace mineral supplements. J. Dairy Sci. 77:181-189.
Carpenter, C. E., D. P. Cornforth, and D. Whittier. 2001. Consumer preferences for beef
color and packaging did not affect eating satisfaction. Meat Science 57(4):359-363.
Coffey, R. T. 1993. The use of amino acid chelates to enhance the immune system.

67
Engle, T. E., J. W. Spears, T. A. Armstrong, C. L. Wright and J. Odle. 2000. Effects of dietary copper source and concentration on carcass characteristics and lipid and cholesterol metabolism in growing and finishing steers. J. Anim. Sci. 78:1053-1059.
Greene, L. W., K. D. Lunt, F. M. Byers, N. K. Chirase, C. E. Richmond, R. E. Knutson and G. T. Schelling. 1988. Performance and carcass quality of steers supplemented with zinc oxide or zinc methionine. J. Anim. Sci. 66:1818-1823.
Hedrick, H. B., E. D. Aberle, J. C. Forrest, M. D. Judge, and R. A. Merkel. 1994.
Principles of Meat Science. erd ed. Kendall/Hunt Publishing Company, Dubuque, IA.
Kawachi, H. 2006. Micronutrients affecting adipogenesis in beef cattle. Anim. Sci.
Journal 77:463-471. Kropf, D. H. 1980. Effects of retail display conditions on meat color. In: Proc. 33rd Recip.
Meat Conf., West Lafayette, IN. pp 15-32. Kropp, J. R. 1990. Reproductive performance of first-calf heifers supplemented with
amino acid chelate minerals. Oklahoma Agric. Exp. Sta. Res. Rep., MP-129: 35. Malcolm-Callis, K. J., G. C. Duff, S. A. Gunter, E. B. Kegley and D. A. Vermeire. 2000.
Effects of supplemental zinc concentration and source on performance, carcass characteristics, and serum values in finishing beef steers. J. Anim. Sci. 78:2801-2808.
Mancini, R. A. and M. C. Hunt. 2005. Current research in meat color. Meat Science
71:100-121. Manspeaker, J. E. and M. G. Robl. 1993. The use of amino acid chelates in bovine
fertility and embryonic viability. Martin, J. J., C. A. Strasia, D. R. Gill, R. B. Hicks, K. Ridenour, G. Dolezal, and F. N.
Owens. 1987. Effect of zinc methionine on live performance and carcass merit of feedlot steers. Oklahoma Agric. Exp. Sta. MP-119:344-350. Stillwater, OK.
Miller, M. F., L. C. Hoover, K. D. Cook, A. L. Guerra, K. L. Huffman, K. S. Tinney, C.
B. Ramsey, H. C. Brittin, and L. M. Huffman. 1995. Consumer acceptability of beef steak tenderness in the home and restaurant. J. Food Sci. 60(5):963-965.
Miller, M. F., M. A. Carr, C. B. Ramsey, K. L. Crockett, and L. C. Hoover. 2001.
Consumer thresholds for establishing the value of beef tenderness. J. Anim. Sci. 79:3062-3068.
Muchenje, V., K. Dzama, M. Chimonyo, P. E. Strydom, A. Hugo, and J. G. Raats. 2009.
Food Chem. 112:279-289.

68
Muehlenbien, E. L., D. R. Brink, G. H. Deutscher, M. P. Carlson, and A. B. Johnson. 2001. Effects of inorganic and organic copper supplemented to first-calf cows on cow reproduction and calf health and performance. J. Anim. Sci. 79:1650-1659.
Oltjen, R. R., E. F. Smith, B. A. Koch, and F. H. Baker. 1959. The value of supplemental
trace minerals in cattle fattening rations. J. Anim. Sci. 18:1196-1200. Page, J. K., D. M. Wulf, and T. R. Schwotzer. 2001. A survey of beef muscle color and
pH. J. Anim. Sci. 79:678-687. Page, J. K., D. M. Wulf, and T. R. Schwotzer. 2001. A survey of beef muscle color and
pH. J. Anim. Sci. 79:678-687. Perry, T. W., W. M. Beeson, W. H. Smith, and M. T. Mohler. 1968. Value of zinc
supplementation of natural rations for fattening beef cattle. J. Anim. Sci. 27:1674-1677.
Rhoads, A. R., T. L. Stanton, T. E. Engle and C. V. Kimberling. 2003. Effects of
concentration and source of trace minerals on performance, immunity, mineral and lipid metabolism, and carcass characteristics of beef steers. The Prof. Anim. Scientist 19:150-158.
Rojas, L. X., L. R. McDowell, R. J. Cousins, F. G. Martin, N. S. Wilkinson, A. B.
Johnson, and J. B. Velasquez. 1995. Relative bioavailability of two organic and two inorganic zinc sources fed to sheep. J. Anim. Sci. 73:1202-1207.
Rust, S. R. 1985. Effects of zinc methionine and grain processing on performance of
growing-fattening steers. J. Anim. Sci. 61(Suppl. 1):482 (Abstr). SAS. 2009. SAS User’s Guide: Statistics. SAS Inst. Inc., Cary, NC. Sloan, A. E. 1996. Going au naturel? Food Tech. 50:26. Smith, G. C., K. E. Belk, J. N. Sofos, J. D. Tatum and S. N. Williams. 2000. Economic
implications of improved color stability in beef. In E. A. Decker, C. Faustman, and C. J. Lopez-Bote (Eds.), Antioxidants in muscle foods: Nutritional strategies to improve quality. New York, Wiley Interscience. pp 397-426.
Spain, J. N., D. Hardin, B. Steevans and J. Thorne. 1993. Effect of organic zinc
supplementation on milk somatic cell count and incidence of mammary gland infections of lactating dairy cows. J. Dairy Sci. 76 (Suppl. 1): in press (abstr.).
Spears, J. W. 1989. Zinc methionine for ruminants: relative bioavailability of zinc in
lambs and effects of growth and performance of growing heifers. J. Anim. Sci. 67:835-843.

69
Spears, J. W. 1996. Organic trace minerals in ruminant nutrition. Anim. Feed Sci. Tech. 58: 151-163.
Spears, J. W. and E. B. Kegley. 2002. Effect of zinc source (zinc oxide vs zinc
proteinate) and level on performance, carcass characteristics, and immune response of growing and finishing steers. J. Anim. Sci. 80:2747-2752.
Stanton, T. L., D. Schutz, and C. Swenson. 2001. Trace mineral supplementation in the
presence of antagonists on growth performance, health, and carcass characteristics on transport-stressed calves. Prof. Anim. Sci. 17:101-108.
Stanton, T. L., J. C. Whittier, T. W. Geary, C. V. Kimberling, and A. B. Johnson. 2000.
Effects of trace mineral supplementation on cow-calf performance, reproduction, and immune function. Prof. Anim. Sci. 16:121.
Tanaka, S., E. Takahashi, T. Matsui, and H. Yano. 2001. Zinc promotes adipocyte
differentiation in vitro. Asian-Australasian J. Anim. Sci. 14:966-969. USDA. 2009. United States standards for livestock and meat marketing claims, naturally
raised claim for livestock and the meat and meat products derived from such livestock. In Federal Register 74(12):3541-3545.
Walshe, B. E., E. M. Sheehan, C. M. Delahunty, P. A. Morrissey, and J. P. Kerry. 2006.
Composition, sensory and shelf life stability analyses of Longissimus dorsi muscle from steers reared under organic and conventional production systems. Meat Science 73:319-325.
Ward, J. D. and J. W. Spears. 1997. Long-term effects of consumption of low-copper
diets with or without supplemental molybdenum on copper status, performance and carcass characteristics of cattle. J. Anim. Sci. 75:3057-3065.
Ward, J. D., J. W. Spears, and E. B. Kegley. 1993. Effect of copper level and source
(copper lysine vs copper sulfate) on copper status, performance, and immune response in growing steers fed diets with or without supplemental molybdenum and sulfur. J. Anim. Sci. 71:2748-2755.
Zhang, S. X., M. M. Farouk, O. A. Young, K. J. Wieliczko, and C. Podmore. 2005.
Functional stability of frozen normal and high pH beef. Meat Science 69:765-772.

70
APPENDICES
Appendix 1: Color Score Sheet .……………………………………………………….71


VITA
Cheyanne Lee Coggins
Candidate for the Degree of
Master of Science Thesis: EVALUATING EFFECTS OF ZINPRO PERFORMANCE MINERALS® ON PERFORMANCE AND CARCASS CHARACTERISTICS OF STEERS FED FINISHING DIETS DESIGNED FOR NATURAL BEEF PRODUCTION Major Field: Animal Science Biographical:
Personal Data: Born in Atlanta, Georgia on June 5, 1985 to Thomas and Elisabeth Coggins.
Education: Graduated from Central High School in Carrollton, Georgia in May
2003; received Bachelor of Science degree in Animal Science from Oklahoma State University, Stillwater, Oklahoma in December 2006; Completed the requirements for the Master of Science in Animal Science at Oklahoma State University, Stillwater, Oklahoma in December, 2009.
Experience: Professional Memberships: American Meat Science Association
ADVISER’S APPROVAL: Dr. J. Brad Morgan
Name: Cheyanne Coggins Date of Degree: December, 2009 Institution: Oklahoma State University Location: Stillwater, Oklahoma Title of Study: EVALUATING EFFECTS OF ZINPRO PERFORMANCE MINERALS®
ON PERFORMANCE AND CARCASS CHARACTERISTICS OF STEERS FED FINISHING DIETS DESIGNED FOR NATURAL BEEF PRODUCTION
Pages in Study: 72 Candidate for the Degree of Master of Science
Major Field: Animal Science Scope and Method of Study: One hundred sixteen steers, (harvest 1, n = 42 and harvest 2,
n = 38, and harvest 3, n = 36, respectively) were used to evaluate the effect of organic Zinpro Performance Minerals® on performance, carcass characteristics, tenderness and retail-case life of longissimus steaks. Steers were blocked by initial weight and assigned one of two treatment groups, inorganic (ING) or Zinpro (ZPM) trace mineral supplements, at weaning. Each group was fed to a compositional endpoint and harvested at a commercial facility. Strip loins (IMPS #180) were collected upon harvest and aged for 14 d. Carcass characteristics, retail-case life, Warner-Bratzler shear force (WBS), and trace mineral content were evaluated.
Findings and Conclusions: In group one, carcass adjusted average daily gain (ADG) and
dry matter intake (DMI) were greater (P < 0.05) for ING steers and gain to feed (G:F) tended to be greater (P = 0.06) for the entire trial period compared to ZPM steers. In harvest group two, body weight (BW), ADG, DMI and G:F were similar among treatments; however, ING steers tended to gain more efficiently (P = 0.07) than ZPM steers. Only DMI tended to be greater (P = 0.09) in ING steers for the entire trial period with all other measurements being similar (P > 0.05). No differences (P > 0.05) were observed between treatment groups for strip loin steak WBS and cooking loss percentage. In harvest group one, ING had significantly (P < 0.05) greater hot carcass weights (HCW) and tended to have more 12th rib fat (P = 0.07) than ZPM. Kidney, pelvic and heart fat percentage (KPH) tended to be lower (P = 0.07) in ING compared to ZPM. All carcass traits were similar in harvest group three. No differences (P > 0.05) were found for the subjective color evaluation or a* and b* values between treatments. Steers in ING initial harvest group had higher (P < 0.05) L* values than the organic contemporaries. Trace mineral analysis revealed no differences (P > 0.05) between treatments for Ca, Na, Fe, Cu, or Mn content. In harvest group one, Zn content tended to be greater (P = 0.07) and Ni was greater (P < 0.05) in ING. For harvest group two, S, Mg, K and P were greater (P < 0.05) for ING compared with ZPM.

ADVISER’S APPROVAL: Dr. J. Brad Morgan