Evaluating Economical Dynamic Exciters for Bridge Vibration … · 2018-03-09 · SOUND &...
6
www.SandV.com SOUND & VIBRATION/NOVEMBER 2014 11 Quantitative data describing condition and performance is es- sential for evaluating the structural health of bridges. Dynamic testing is a common approach for globally characterizing bridges in a quantitative sense. Dynamic testing is most commonly ac- complished for full-scale bridge structures through either forced vibration testing or ambient vibration testing methods. Forced vibration testing offers many advantages but is generally not a practical or economical approach for many bridges due to the high cost of providing controlled excitation, limits to the excitation that can be supplied, and interference with the normal operation of the bridge. We have been investigating the feasibility of using low-cost, small-scale dynamic exciters for forced vibration testing of short- to medium-span bridges. The exciters being evaluated have a unit cost that is comparable to a typical accelerometer and could be deployed in numbers using a spatially distributed setup for forced vibration testing. This article presents and describes the results of a laboratory evaluation program conducted for these devices. Their capabilities and operating characteristics are compared with a laboratory-quality linear mass shaker. The preliminary results of a vibration test using these devices on an in-service highway bridge are also discussed. The aged and deteriorated condition of transportation infrastruc- ture is a well-publicized issue facing the United States. Current reports indicate that about 10%, or nearly 60,000, of our nation’s bridges are structurally deficient. 1 The difficulty of maintaining the bridge population is compounded by limited funding for repair or replacement. The national concern regarding the budget deficit and the strong push in Washington to cut costs wherever possible impact the ability of transportation agencies to adequately care for their bridges. Therefore, it is critical that the limited available funding be spent on bridges that have the greatest need for struc- tural improvement. It is difficult for bridge owners to determine which of their bridg- es are most in need of repair or replacement, because the condition evaluation and assessment data they typically have available is the result of subjective biennial inspections. The greatest limitation of the biennial inspection process is that it is almost always limited to visual identification and characterization of localized defects. Additionally, despite the best efforts of owners to provide guid- ance to inspectors, it is neither possible to consistently provide a qualitative value for the condition of a single type of structural component, nor for the condition of an entire bridge. A quantita- tive determination of bridge condition would be highly useful for supporting operational and maintenance management decisions if it can be based on the actual global behavior of the structure and if the information can be consistently developed across the bridge inventory. Dynamic testing is a quantitative and global characterization method that can be used to help establish the condition of bridges. It is the process of measuring the time-varying responses of a struc- ture due to external dynamic excitation. Typically, the measured acceleration responses from different locations on a bridge are used to identify modal characteristics such as the natural frequencies, mode shapes, and damping ratios. These characteristics are system properties of a structure and are functions of its mass, stiffness, and damping. Changes in the structure due to damage, deterioration, and environmental effects are reflected by changes in the observed dynamic properties. Many researchers are working to develop algorithms that can identify damage severity and location from Evaluating Economical Dynamic Exciters for Bridge Vibration Testing dynamic testing results. With these data in hand, operating agen- cies could better rank the condition of their bridge inventory and apply their limited funding to the structures with the greatest need. Dynamic testing and modal analysis of aerospace and automotive systems has been successfully used for decades. In these industries, the evaluation is often performed in a controlled laboratory setting with the test subject well isolated from ambient dynamic input. Both input and responses of the test subject are measured, and the desired modal properties are determined. Attempting to use the same process for civil engineering structures is logical, but a significant challenge is to adequately excite structures of the scale of typical civil works. Exciting all of the desired modes of a large bridge, building, or dam from a single input location requires a large excitation device. 2 In addition to their high cost and low availability, such devices also present logistical challenges, since their large size requires the use of cranes or other specialized equipment to place them in the desired positions on a structure. Imparting large forces from a discrete location on a structure is more likely to excite structural nonlinearities, making it more difficult to identify the linear modal characteristics. 3 Data inconsistency can also be a problem when excitation is only provided at one discrete location on a structure at a time. First, the equipment setup change that is required in moving from location to location impacts the data. 4 Second, the time elapsed between different test setups can allow time-varying structural character- istics such as temperature to skew the identification results. For these and other reasons, researchers have explored other means of dynamic excitation for civil structures. Significant research has been performed on output-only analysis methods in which the external dynamic excitation is not measured. The modal parameters can be extracted from the output mea- surements with the assumption that the excitation is stationary, broadband, and uncorrelated to prior system responses. 5 In the case of bridges, the input is typically ambient excitation from the operating traffic and natural sources such as wind, microtremors, etc. A significant limitation of output-only analysis methods is that modal scaling cannot be calculated directly from the measure- ments, 6 since it requires knowledge of the input force. The inability to determine modal scaling leads to the inability to calculate modal flexibility and can further limit the utility of the results for various damage detection algorithms. Another potential issue with ambient excitation is that the as- sumption of a stationary, broadband input may be violated for a given test, and since the input is not measured this violation is unlikely to be detected or its impact evaluated. Finally, the vehicu- lar traffic that is a major source of ambient dynamic excitation for in-service bridges leads to random changes in the mass and damp- ing characteristics of short- to medium-span bridges, violating the assumption of a time-invariant structure. One potential solution that would allow measurable excitation for certain types of civil structures could be to use an array of moderately sized controlled excitation devices spatially distributed on the structure along with the accelerometers used to record the vibration responses. This type of dynamic testing is referred to as multiple-input, multiple-output (MIMO) and has a number of advantages. First, an array of spatially distributed shakers would require less force to be input at each location, reducing the excitation of nonlin- earities. Also, collecting many FRF columns simultaneously greatly improves data consistency, since time variations in structure properties and setup changes are eliminated. Finally, the use of measurable inputs enables the calculation of modal scaling and Eric V. Fernstrom and Jessica L. Carreiro, University of Arkansas, Fayetteville, Arkansas Kirk A. Grimmelsman, Pennoni Associates Inc., Philadelphia, Pennsylvania Based on a paper presented at IMAC XXXI, the 31st International Modal Analysis Conference, Garden Grove, CA, February 2013.
Transcript of Evaluating Economical Dynamic Exciters for Bridge Vibration … · 2018-03-09 · SOUND &...
www.SandV.com SOUND & VIBRATION/NOVEMBER 2014 11
Quantitative data describing condition and performance is es-sential for evaluating the structural health of bridges. Dynamic testing is a common approach for globally characterizing bridges in a quantitative sense. Dynamic testing is most commonly ac-complished for full-scale bridge structures through either forced vibration testing or ambient vibration testing methods. Forced vibration testing offers many advantages but is generally not a practical or economical approach for many bridges due to the high cost of providing controlled excitation, limits to the excitation that can be supplied, and interference with the normal operation of the bridge. We have been investigating the feasibility of using low-cost, small-scale dynamic exciters for forced vibration testing of short- to medium-span bridges. The exciters being evaluated have a unit cost that is comparable to a typical accelerometer and could be deployed in numbers using a spatially distributed setup for forced vibration testing. This article presents and describes the results of a laboratory evaluation program conducted for these devices. Their capabilities and operating characteristics are compared with a laboratory-quality linear mass shaker. The preliminary results of a vibration test using these devices on an in-service highway bridge are also discussed.
The aged and deteriorated condition of transportation infrastruc-ture is a well-publicized issue facing the United States. Current reports indicate that about 10%, or nearly 60,000, of our nation’s bridges are structurally deficient.1 The difficulty of maintaining the bridge population is compounded by limited funding for repair or replacement. The national concern regarding the budget deficit and the strong push in Washington to cut costs wherever possible impact the ability of transportation agencies to adequately care for their bridges. Therefore, it is critical that the limited available funding be spent on bridges that have the greatest need for struc-tural improvement.
It is difficult for bridge owners to determine which of their bridg-es are most in need of repair or replacement, because the condition evaluation and assessment data they typically have available is the result of subjective biennial inspections. The greatest limitation of the biennial inspection process is that it is almost always limited to visual identification and characterization of localized defects. Additionally, despite the best efforts of owners to provide guid-ance to inspectors, it is neither possible to consistently provide a qualitative value for the condition of a single type of structural component, nor for the condition of an entire bridge. A quantita-tive determination of bridge condition would be highly useful for supporting operational and maintenance management decisions if it can be based on the actual global behavior of the structure and if the information can be consistently developed across the bridge inventory.
Dynamic testing is a quantitative and global characterization method that can be used to help establish the condition of bridges. It is the process of measuring the time-varying responses of a struc-ture due to external dynamic excitation. Typically, the measured acceleration responses from different locations on a bridge are used to identify modal characteristics such as the natural frequencies, mode shapes, and damping ratios. These characteristics are system properties of a structure and are functions of its mass, stiffness, and damping. Changes in the structure due to damage, deterioration, and environmental effects are reflected by changes in the observed dynamic properties. Many researchers are working to develop algorithms that can identify damage severity and location from
Evaluating Economical Dynamic Exciters for Bridge Vibration Testing
dynamic testing results. With these data in hand, operating agen-cies could better rank the condition of their bridge inventory and apply their limited funding to the structures with the greatest need.
Dynamic testing and modal analysis of aerospace and automotive systems has been successfully used for decades. In these industries, the evaluation is often performed in a controlled laboratory setting with the test subject well isolated from ambient dynamic input. Both input and responses of the test subject are measured, and the desired modal properties are determined. Attempting to use the same process for civil engineering structures is logical, but a significant challenge is to adequately excite structures of the scale of typical civil works. Exciting all of the desired modes of a large bridge, building, or dam from a single input location requires a large excitation device.2
In addition to their high cost and low availability, such devices also present logistical challenges, since their large size requires the use of cranes or other specialized equipment to place them in the desired positions on a structure. Imparting large forces from a discrete location on a structure is more likely to excite structural nonlinearities, making it more difficult to identify the linear modal characteristics.3
Data inconsistency can also be a problem when excitation is only provided at one discrete location on a structure at a time. First, the equipment setup change that is required in moving from location to location impacts the data.4 Second, the time elapsed between different test setups can allow time-varying structural character-istics such as temperature to skew the identification results. For these and other reasons, researchers have explored other means of dynamic excitation for civil structures.
Significant research has been performed on output-only analysis methods in which the external dynamic excitation is not measured. The modal parameters can be extracted from the output mea-surements with the assumption that the excitation is stationary, broadband, and uncorrelated to prior system responses.5 In the case of bridges, the input is typically ambient excitation from the operating traffic and natural sources such as wind, microtremors, etc. A significant limitation of output-only analysis methods is that modal scaling cannot be calculated directly from the measure-ments,6 since it requires knowledge of the input force. The inability to determine modal scaling leads to the inability to calculate modal flexibility and can further limit the utility of the results for various damage detection algorithms.
Another potential issue with ambient excitation is that the as-sumption of a stationary, broadband input may be violated for a given test, and since the input is not measured this violation is unlikely to be detected or its impact evaluated. Finally, the vehicu-lar traffic that is a major source of ambient dynamic excitation for in-service bridges leads to random changes in the mass and damp-ing characteristics of short- to medium-span bridges, violating the assumption of a time-invariant structure.
One potential solution that would allow measurable excitation for certain types of civil structures could be to use an array of moderately sized controlled excitation devices spatially distributed on the structure along with the accelerometers used to record the vibration responses.
This type of dynamic testing is referred to as multiple-input, multiple-output (MIMO) and has a number of advantages. First, an array of spatially distributed shakers would require less force to be input at each location, reducing the excitation of nonlin-earities. Also, collecting many FRF columns simultaneously greatly improves data consistency, since time variations in structure properties and setup changes are eliminated. Finally, the use of measurable inputs enables the calculation of modal scaling and
Eric V. Fernstrom and Jessica L. Carreiro, University of Arkansas, Fayetteville, ArkansasKirk A. Grimmelsman, Pennoni Associates Inc., Philadelphia, Pennsylvania
Based on a paper presented at IMAC XXXI, the 31st International Modal Analysis Conference, Garden Grove, CA, February 2013.
www.SandV.com12 SOUND & VIBRATION/NOVEMBER 2014
modal flexibility.The major drawback of MIMO testing of civil structures has
always been cost. Many researchers use laboratory-grade com-mercial shakers as excitation devices when performing MIMO tests. A commonly used shaker from APS Dynamics costs about $13,000 for a device that can impart 187 N (42 lbf) of dynamic force over a broad frequency range. A similar shaker available from APS Dynamics that can provide 445 N (100 lbf) costs about $18,000. Some researchers have built one-off shakers and impact devices that are far more expensive. The costs of these shakers and the associated challenges in effectively deploying them on civil structures appears to have significantly limited MIMO testing ap-plications for civil structures. Few examples of this type of testing are found in the literature.
We propose here that an array of low-cost electrodynamic shak-ers could be used to provide controlled and measurable dynamic excitation to certain classes of civil structures and would enable more robust and reliable dynamic analysis. The basic idea is to greatly reduce costs by using a widely available consumer product that has real price competition to serve as the controlled dynamic excitation device.
The device we propose for this purpose is best described as a tactile transducer. Tactile transducers are devices used in home theater applications to shake the floor or furniture to mimic situa-tions in movie scenes. The tactile quality of the shaking enhances the experience of watching the movie by more deeply immers-ing the viewer’s senses. These devices retail for prices generally ranging from $50 to $1,000. One model of tactile transducer con-sidered for this study has a unit cost of about $200 and provides approximately 133 N (30 lbf) of peak dynamic force. Note that the frequency range of the tactile transducers is generally aligned with the natural modes of interest for many common types of short- to medium-span bridges (~5 to 50 Hz).
The estimated cost per excitation location including a power supply, amplifier, and shaker is on the order of $500, which com-pares very favorably with the laboratory shaker prices described previously. A review of the published literature did not find any researchers using or attempting to use such low-cost, commercially available excitation devices for MIMO testing of civil structures.
This article summarizes the results of a laboratory testing and evaluation program that was undertaken to establish the operating characteristics of several commercially available tactile transduc-ers. The main objective of the evaluation program was to determine if such devices could be feasibly used for MIMO dynamic testing of short- to medium-span bridges. A related objective was to aid in selecting a transducer/amplifier pair that would provide acceptable excitation force amplitudes in the frequency range of interest, and that would reliably reproduce the swept-sine and burst random signals that are typical for modal testing of bridges.
Some limited data recorded with these transducers for a full-scale bridge were also evaluated to assess the practicality of this approach for real, in-service bridge structures. The outcome of this testing provided the fundamental operational and perfor-mance characteristics necessary to move forward with design and development of a low-cost, 16-channel, MIMO excitation system that would be suitable for controlled dynamic testing of short- to medium-span bridges.
Devices EvaluatedMost of the tactile transducers surveyed for this study were
small-scale, proof-mass type dynamic shaker devices that are in-tended to make theater and gaming experiences more immersive. Low-frequency sounds from movies or video games are sent to the tactile transducers and they create a rumbling sensation. This is accomplished by attaching the transducers to the underside of floors or furniture so that the low frequency rumble can be felt by the audience. The devices are widely and commercially available for use in home theater applications, 4D amusement park rides, and traditional theaters. There are a number of manufacturers that market these devices, and as a result, their cost is competitive. The market includes a variety of product sizes, power ratings, packag-ing options, and price ranges, but a point of commonality is that
practically all tactile transducers use a voice coil as the principal motive system. In the parlance of vibration testing, these shakers are of the electrodynamic type; however, they are not specifically designed to meet the high expectations of the vibration testing community. Thus, their operating characteristics and responses to various excitation signals must be evaluated by the user before they can be used for dynamic testing applications.
Three different tactile transducers were selected as good repre-sentatives for the broad array of options available on the market. The initial selection of the devices to be evaluated in this study was based on online consumer feedback, price, and manufacturer specifications of power handling. The specific devices evaluated in this study will be referred to as Shaker 1, 2, and 3 throughout this article and are shown in Figure 1. It should be noted that the largest of the devices tested measured less than 150 mm (6 in) in any dimension and weighs 4.5 kg (10 lb). The devices are relatively unobtrusive and would be easy to deploy on structures such as bridges.
Shaker 1 and Shaker 2 are similar in style and represent the most common type of tactile transducer. They consist of a rugged metal housing with integral cooling fins and all moving parts are located within the enclosure. Unlike a traditional shaker used for modal analysis of manufactured systems and components, there is no armature and no method to directly monitor the position, velocity, or acceleration of the moving mass. These two shakers are produced by different manufacturers and have significantly different specified power handling capabilities. Shaker 1 can be operated continuously at 400 watts RMS, while Shaker 2 can only handle 50 watts. As a result, it is not surprising that Shaker 2 is about a quarter of the cost of Shaker 1.
Shaker 3 is of a different style and is more similar to a typical laboratory shaker. This device does not have a moving mass con-tained within a rugged packaging, but instead features a load table that is intended to support the leg of a chair or couch to impart the dynamic excitation. The load table is equivalent to an armature, and this enables measuring the shaker movements. Also, the load table allows the addition of mass, which provides the ability to modify the force output and natural frequency of the shaker. This device can handle 30 watts RMS.
An intrinsic and cost-plus component of any shaker system is the power amplifier. Three inexpensive commercial audio amplifiers were paired with the shakers for this testing program, and they will be referred to as Amp 1, 2, and 3. Amp 1 is a single-channel device with an output power of 500 watts RMS, which pairs well with Shaker 1. Amp 2 is a similarly powerful device but has two chan-nels and a different manufacturer. Amp 3 is much less expensive, less powerful at 70 watts, and pairs with Shakers 2 and 3. Most amplifiers used for vibration testing can be set up to provide either a voltage output (voltage mode) or a current output (current mode) in proportion to the input signal. The subsequent velocity of the moving mass is proportional to voltage, and the acceleration (and force) is proportional to the current. Audio amplifiers do not have the capability to operate in current mode, so voltage mode is used throughout this study.
Figure 1. Front, left to right: Shaker 1, Shaker 2, Shaker 3; Rear: APS 113HF.
www.SandV.com SOUND & VIBRATION/NOVEMBER 2014 13
An APS Dynamics 113-HF shaker paired with an APS 145 ampli-fier was also subject to the same shaker tests. This electrodynamic shaker system is representative of the types of high-quality (and more expensive) laboratory shakers used in vibration and modal testing. Reaction masses of 9 kg (20 lb) were attached to the shaker for all tests, and the APS amplifier was operated in voltage mode for all tests. The APS shaker results are presented as a point of comparison for the tactile transducers. Table 1 summarizes various nominal specifications of the devices tested.
Testing CriteriaTactile transducers are essentially audio components, and
manufacturers provide specifications that are generally aligned with traditional subwoofer characteristics. These specifications are not typically the same as those provided by makers of shakers for vibration and modal testing. As such, a controlled laboratory testing program was performed to establish the characteristics of the tactile transducers. The first step in this process was to establish what characteristics would be most important for modal testing of bridges. These important characteristics could then be used as selection criteria for choosing the best device for an expanded MIMO testing system.
The most important characteristic of the shakers for bridge test-ing is the force output in the frequency range of interest. Bridges and other civil structures are massive, and a significant amount of input force is needed to adequately excite such structures beyond the ambient input level. These large structures also typically have low-frequency modes that are best excited by low-frequency input. So the maximum force that could be produced at various frequen-cies, and especially at low frequencies, was tested and evaluated.
Another important characteristic is the ability of the shaker to accurately reproduce input signals that are typical to modal testing. These signals often include swept-sine and burst random excitations. For testing the reproduction of sinusoidal signals, the periodogram was used to measure the energy content at both the input frequency and at other frequencies, and the signal-to-noise ratio was calculated for the measured outputs from the devices. To evaluate the reproduction of a broadband random input signal, the energy content at all frequencies within the range of interest must be compared.
The performance of the amplifier also impacts the shaker performance. Amplifier testing was performed to establish the characteristics of these devices as well. These tests included gain across the frequency range of interest, reproduction of sinusoidal signals, and reproduction of random signals. Finally, the shakers and amplifiers were evaluated for other criteria, including cost, perceived durability, and ease of use.
Test Methods, Results and DiscussionThe subsections below describe the specific test methods that
were employed and discuss the outcome of each test for both the shakers and the amplifiers. The results are considered in relation to the potential use of these devices in a MIMO array for dynamic testing of civil structures. The tests/criteria subsections are:• Shaker force output• Shaker sinusoid reproduction• Shaker burst random reproduction
• Amplifier gain• Amplifier sinusoid reproduction• Amplifier burst random reproduction• Other considerations
For all tests, the signals were generated by an Agilent 33220A arbitrary waveform generator, and data were acquired by a Na-tional Instruments PXI 4472B DAQ card. All data processing was performed in Matlab®.
Shaker Force Output. As noted previously, the most important characteristic for the shakers is their ability to provide adequate excitation force over the frequency band of interest, which was taken as 0 to 100 Hz for this testing. This test was performed by attaching each shaker to an aluminum plate that was supported on three dynamic force transducers in a tripod arrangement. Si-nusoidal signals were sent to Amp 1 and from there to the shaker. The power sent to the shaker was also monitored. With a discrete frequency input, gain was increased until the shaker “bottomed out” due to its stroke being exceeded or until the maximum rec-ommended RMS power was reached, whichever came first. The output from the three force transducers was summed, and the total force was recorded for 4 seconds. The mean RMS value of this measured force was then taken as the maximum force available at the frequency under consideration.
Figure 2 illustrates the maximum RMS force that each shaker produced over the frequency range. The APS shaker is capable of producing 220 N (50 lbf) at a frequency of 4 Hz in voltage mode. The force gradually falls off to a low of about 130 N (30 lbf) at 50 Hz before peaking at 440 N (100 lbf) (off graph) at the natural frequency of the shaker. The shape of the APS force response dem-onstrates the highly nonlinear nature of force output in relation to frequency. The factors that limit the force also change depending on frequency. The force is limited by the shaker stroke length up to about 3 Hz, and this particular shaker has a long 158 mm (6.25 in) stroke. Above 3 Hz the force is limited by the amplifier power. It is clear that the APS shaker can produce significantly more force than any of the tactile transducers evaluated.
Of the three different tactile transducers evaluated, Shaker 1 provided the highest level of force at low frequencies. The force rises nearly linearly from zero at 1 Hz to about 90 N (20 lbf) RMS at 29 Hz and then gradually decreases with increasing frequency. The tactile transducers all have a short stroke, and this limits the low-frequency force they can produce without bottoming out. Shaker 1 is limited by its stroke up to 25 Hz, and above 25 Hz, the force is limited by the power capacity of the shaker. Compared to the other tactile transducers, Shaker 1 has a much broader peak in the vicinity of its natural frequency and can provide much greater force across the range of 30 to 80 Hz.
Shaker 2 produces the least force of all of the shakers across the entire frequency range. The force is stroke limited below 5 Hz and is limited by the 70-watt shaker power capacity above this. This shaker provides very little force at low frequencies, with less than 9 N (2 lbf) RMS at 20 Hz. The force has a strong peak at the 27-Hz shaker natural frequency and then quickly drops down to about 13 N (3 lbf) RMS at higher frequencies.
Shaker 3 differs in its construction from the other two shakers in that it has a load plate and is meant to carry additional mass. This allows a broad range of experiments to understand how the force output varies with increments of additional mass and how the reproduction quality varies simultaneously. The results
Table 1. General information for tested shakers and ampliers.
SHAKER INFORMATION Rated Nominal Name Price RMS Power Impedance WeightShaker 1 $200 400 W 4 Ohm 4.5 kg (10 lb)Shaker 2 $40 50 W 4 Ohm 1.4 kg (3 lb)Shaker 3 $500 30 W 6 Ohm 1.8 kg (4 lb)APS 113HF $12,940 w/amp 600 W 2 Ohm 47 kg (103 lb)
AMPLIFIER INFORMATION Rated Name Price RMS Power Channels WeightAmp 1 $150 500 W x 1 3.1 kg (6.9 lb)Amp 2 $120 480 W x 2 3.8 kg (8.4 lb)Amp 3 $50 70 W x 1 2.5 kg (5.6 lb)
Figure 2. RMS force output for subject shakers in frequency range of interest.
RM
S Fo
rce,
N
250
200
150
100
50
0 0 10 20 30 40 50 60 70 80 90 100 Frequency, Hz
APS 113HFShaker 1Shaker 2Shaker 3
www.SandV.com14 SOUND & VIBRATION/NOVEMBER 2014
shown are with an added mass of 1.03 kg (2.26 lb) of aluminum disks (the powerful fixed magnets in the shaker precluded the use of ferrous metals for added mass). The shaker force is generally stroke limited at frequencies near and below the peak force and is limited by the shaker power capacity at higher frequencies. The added mass allows high forces to be generated relative to power consumption, and the magnitude of the mass allows the peak to be adjusted to particular frequencies. However, the force fall-off is significant away from the sharp peak at the natural frequency of the shaker/mass system.
Overall, the short stroke lengths of the tactile transducers pre-clude them from producing high forces at low frequencies without bottoming out. Of the three transducers tested, Shaker 1 provides the largest force at low frequencies and provides the most consis-tent force response across the frequency band of interest. Shaker 3 provides the unique ability to have its peak force output tuned to a particular frequency by adding mass, and provides a high level of force given its low power input. Shaker 2 and Shaker 3 both provide a very consistent level of force at higher frequencies. Note that due to the small sizes and low cost of the shakers, multiple shakers could be located at each input location on a bridge to increase the total force output.
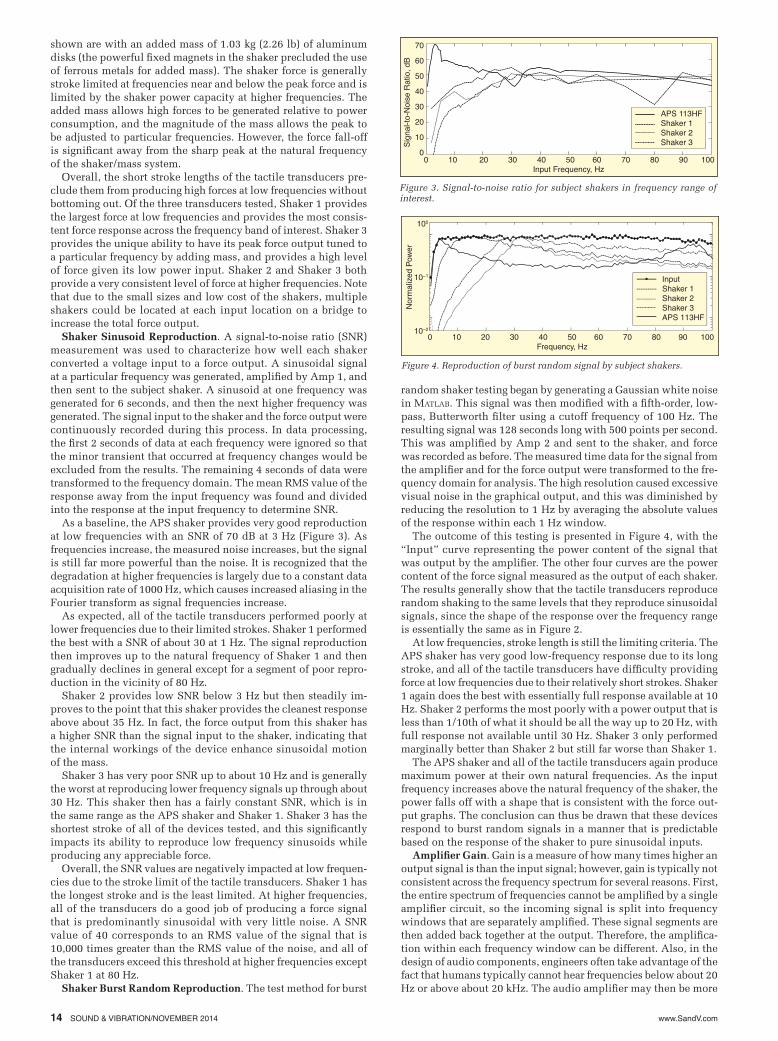
Shaker Sinusoid Reproduction. A signal-to-noise ratio (SNR) measurement was used to characterize how well each shaker converted a voltage input to a force output. A sinusoidal signal at a particular frequency was generated, amplified by Amp 1, and then sent to the subject shaker. A sinusoid at one frequency was generated for 6 seconds, and then the next higher frequency was generated. The signal input to the shaker and the force output were continuously recorded during this process. In data processing, the first 2 seconds of data at each frequency were ignored so that the minor transient that occurred at frequency changes would be excluded from the results. The remaining 4 seconds of data were transformed to the frequency domain. The mean RMS value of the response away from the input frequency was found and divided into the response at the input frequency to determine SNR.
As a baseline, the APS shaker provides very good reproduction at low frequencies with an SNR of 70 dB at 3 Hz (Figure 3). As frequencies increase, the measured noise increases, but the signal is still far more powerful than the noise. It is recognized that the degradation at higher frequencies is largely due to a constant data acquisition rate of 1000 Hz, which causes increased aliasing in the Fourier transform as signal frequencies increase.
As expected, all of the tactile transducers performed poorly at lower frequencies due to their limited strokes. Shaker 1 performed the best with a SNR of about 30 at 1 Hz. The signal reproduction then improves up to the natural frequency of Shaker 1 and then gradually declines in general except for a segment of poor repro-duction in the vicinity of 80 Hz.
Shaker 2 provides low SNR below 3 Hz but then steadily im-proves to the point that this shaker provides the cleanest response above about 35 Hz. In fact, the force output from this shaker has a higher SNR than the signal input to the shaker, indicating that the internal workings of the device enhance sinusoidal motion of the mass.
Shaker 3 has very poor SNR up to about 10 Hz and is generally the worst at reproducing lower frequency signals up through about 30 Hz. This shaker then has a fairly constant SNR, which is in the same range as the APS shaker and Shaker 1. Shaker 3 has the shortest stroke of all of the devices tested, and this significantly impacts its ability to reproduce low frequency sinusoids while producing any appreciable force.
Overall, the SNR values are negatively impacted at low frequen-cies due to the stroke limit of the tactile transducers. Shaker 1 has the longest stroke and is the least limited. At higher frequencies, all of the transducers do a good job of producing a force signal that is predominantly sinusoidal with very little noise. A SNR value of 40 corresponds to an RMS value of the signal that is 10,000 times greater than the RMS value of the noise, and all of the transducers exceed this threshold at higher frequencies except Shaker 1 at 80 Hz.
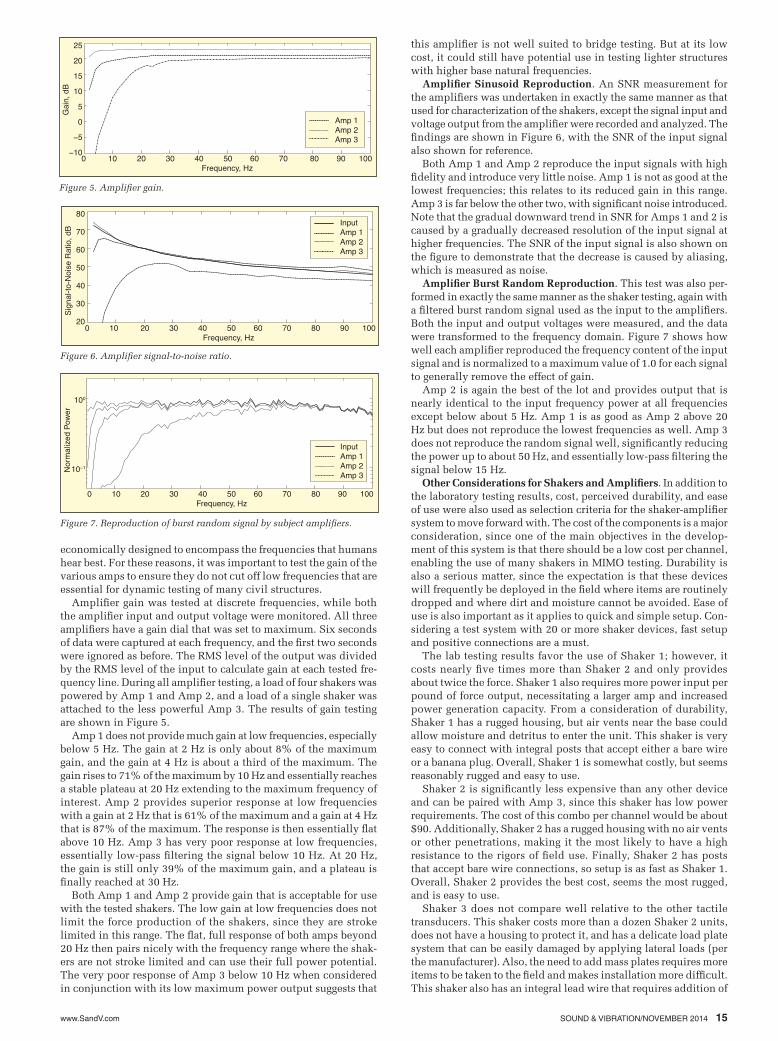
Shaker Burst Random Reproduction. The test method for burst
random shaker testing began by generating a Gaussian white noise in Matlab. This signal was then modified with a fifth-order, low-pass, Butterworth filter using a cutoff frequency of 100 Hz. The resulting signal was 128 seconds long with 500 points per second. This was amplified by Amp 2 and sent to the shaker, and force was recorded as before. The measured time data for the signal from the amplifier and for the force output were transformed to the fre-quency domain for analysis. The high resolution caused excessive visual noise in the graphical output, and this was diminished by reducing the resolution to 1 Hz by averaging the absolute values of the response within each 1 Hz window.
The outcome of this testing is presented in Figure 4, with the “Input” curve representing the power content of the signal that was output by the amplifier. The other four curves are the power content of the force signal measured as the output of each shaker. The results generally show that the tactile transducers reproduce random shaking to the same levels that they reproduce sinusoidal signals, since the shape of the response over the frequency range is essentially the same as in Figure 2.
At low frequencies, stroke length is still the limiting criteria. The APS shaker has very good low-frequency response due to its long stroke, and all of the tactile transducers have difficulty providing force at low frequencies due to their relatively short strokes. Shaker 1 again does the best with essentially full response available at 10 Hz. Shaker 2 performs the most poorly with a power output that is less than 1/10th of what it should be all the way up to 20 Hz, with full response not available until 30 Hz. Shaker 3 only performed marginally better than Shaker 2 but still far worse than Shaker 1.
The APS shaker and all of the tactile transducers again produce maximum power at their own natural frequencies. As the input frequency increases above the natural frequency of the shaker, the power falls off with a shape that is consistent with the force out-put graphs. The conclusion can thus be drawn that these devices respond to burst random signals in a manner that is predictable based on the response of the shaker to pure sinusoidal inputs.
Amplifier Gain. Gain is a measure of how many times higher an output signal is than the input signal; however, gain is typically not consistent across the frequency spectrum for several reasons. First, the entire spectrum of frequencies cannot be amplified by a single amplifier circuit, so the incoming signal is split into frequency windows that are separately amplified. These signal segments are then added back together at the output. Therefore, the amplifica-tion within each frequency window can be different. Also, in the design of audio components, engineers often take advantage of the fact that humans typically cannot hear frequencies below about 20 Hz or above about 20 kHz. The audio amplifier may then be more
Figure 3. Signal-to-noise ratio for subject shakers in frequency range of interest.
Sign
al-to
-Noi
se R
atio
, dB
70
60
50
40
30
20
10
00 10 20 30 40 50 60 70 80 90 100 Input Frequency, Hz
APS 113HFShaker 1Shaker 2Shaker 3
Figure 4. Reproduction of burst random signal by subject shakers.
Nor
mal
ized
Pow
er
0 10 20 30 40 50 60 70 80 90 100 Frequency, Hz
InputShaker 1Shaker 2Shaker 3APS 113HF
100
10−1
10−2
www.SandV.com SOUND & VIBRATION/NOVEMBER 2014 15
economically designed to encompass the frequencies that humans hear best. For these reasons, it was important to test the gain of the various amps to ensure they do not cut off low frequencies that are essential for dynamic testing of many civil structures.
Amplifier gain was tested at discrete frequencies, while both the amplifier input and output voltage were monitored. All three amplifiers have a gain dial that was set to maximum. Six seconds of data were captured at each frequency, and the first two seconds were ignored as before. The RMS level of the output was divided by the RMS level of the input to calculate gain at each tested fre-quency line. During all amplifier testing, a load of four shakers was powered by Amp 1 and Amp 2, and a load of a single shaker was attached to the less powerful Amp 3. The results of gain testing are shown in Figure 5.
Amp 1 does not provide much gain at low frequencies, especially below 5 Hz. The gain at 2 Hz is only about 8% of the maximum gain, and the gain at 4 Hz is about a third of the maximum. The gain rises to 71% of the maximum by 10 Hz and essentially reaches a stable plateau at 20 Hz extending to the maximum frequency of interest. Amp 2 provides superior response at low frequencies with a gain at 2 Hz that is 61% of the maximum and a gain at 4 Hz that is 87% of the maximum. The response is then essentially flat above 10 Hz. Amp 3 has very poor response at low frequencies, essentially low-pass filtering the signal below 10 Hz. At 20 Hz, the gain is still only 39% of the maximum gain, and a plateau is finally reached at 30 Hz.
Both Amp 1 and Amp 2 provide gain that is acceptable for use with the tested shakers. The low gain at low frequencies does not limit the force production of the shakers, since they are stroke limited in this range. The flat, full response of both amps beyond 20 Hz then pairs nicely with the frequency range where the shak-ers are not stroke limited and can use their full power potential. The very poor response of Amp 3 below 10 Hz when considered in conjunction with its low maximum power output suggests that
this amplifier is not well suited to bridge testing. But at its low cost, it could still have potential use in testing lighter structures with higher base natural frequencies.
Amplifier Sinusoid Reproduction. An SNR measurement for the amplifiers was undertaken in exactly the same manner as that used for characterization of the shakers, except the signal input and voltage output from the amplifier were recorded and analyzed. The findings are shown in Figure 6, with the SNR of the input signal also shown for reference.
Both Amp 1 and Amp 2 reproduce the input signals with high fidelity and introduce very little noise. Amp 1 is not as good at the lowest frequencies; this relates to its reduced gain in this range. Amp 3 is far below the other two, with significant noise introduced. Note that the gradual downward trend in SNR for Amps 1 and 2 is caused by a gradually decreased resolution of the input signal at higher frequencies. The SNR of the input signal is also shown on the figure to demonstrate that the decrease is caused by aliasing, which is measured as noise.
Amplifier Burst Random Reproduction. This test was also per-formed in exactly the same manner as the shaker testing, again with a filtered burst random signal used as the input to the amplifiers. Both the input and output voltages were measured, and the data were transformed to the frequency domain. Figure 7 shows how well each amplifier reproduced the frequency content of the input signal and is normalized to a maximum value of 1.0 for each signal to generally remove the effect of gain.
Amp 2 is again the best of the lot and provides output that is nearly identical to the input frequency power at all frequencies except below about 5 Hz. Amp 1 is as good as Amp 2 above 20 Hz but does not reproduce the lowest frequencies as well. Amp 3 does not reproduce the random signal well, significantly reducing the power up to about 50 Hz, and essentially low-pass filtering the signal below 15 Hz.
Other Considerations for Shakers and Amplifiers. In addition to the laboratory testing results, cost, perceived durability, and ease of use were also used as selection criteria for the shaker-amplifier system to move forward with. The cost of the components is a major consideration, since one of the main objectives in the develop-ment of this system is that there should be a low cost per channel, enabling the use of many shakers in MIMO testing. Durability is also a serious matter, since the expectation is that these devices will frequently be deployed in the field where items are routinely dropped and where dirt and moisture cannot be avoided. Ease of use is also important as it applies to quick and simple setup. Con-sidering a test system with 20 or more shaker devices, fast setup and positive connections are a must.
The lab testing results favor the use of Shaker 1; however, it costs nearly five times more than Shaker 2 and only provides about twice the force. Shaker 1 also requires more power input per pound of force output, necessitating a larger amp and increased power generation capacity. From a consideration of durability, Shaker 1 has a rugged housing, but air vents near the base could allow moisture and detritus to enter the unit. This shaker is very easy to connect with integral posts that accept either a bare wire or a banana plug. Overall, Shaker 1 is somewhat costly, but seems reasonably rugged and easy to use.
Shaker 2 is significantly less expensive than any other device and can be paired with Amp 3, since this shaker has low power requirements. The cost of this combo per channel would be about $90. Additionally, Shaker 2 has a rugged housing with no air vents or other penetrations, making it the most likely to have a high resistance to the rigors of field use. Finally, Shaker 2 has posts that accept bare wire connections, so setup is as fast as Shaker 1. Overall, Shaker 2 provides the best cost, seems the most rugged, and is easy to use.
Shaker 3 does not compare well relative to the other tactile transducers. This shaker costs more than a dozen Shaker 2 units, does not have a housing to protect it, and has a delicate load plate system that can be easily damaged by applying lateral loads (per the manufacturer). Also, the need to add mass plates requires more items to be taken to the field and makes installation more difficult. This shaker also has an integral lead wire that requires addition of
Figure 5. Amplifier gain.
Gai
n, d
B
25
20
15
10
5
0
−5
−100 10 20 30 40 50 60 70 80 90 100 Frequency, Hz
Amp 1Amp 2Amp 3
Figure 6. Amplifier signal-to-noise ratio.
Sign
al-to
-Noi
se R
atio
, dB
80
70
60
50
40
30
200 10 20 30 40 50 60 70 80 90 100 Frequency, Hz
InputAmp 1Amp 2Amp 3
Figure 7. Reproduction of burst random signal by subject amplifiers.
Nor
mal
ized
Pow
er
0 10 20 30 40 50 60 70 80 90 100 Frequency, Hz
InputAmp 1Amp 2Amp 3
100
10−1

www.SandV.com16 SOUND & VIBRATION/NOVEMBER 2014
swept sine signals were provided as excitation signals. No vehicles crossed the bridge while the measurement data were acquired.
This was a qualitative test with the sole intention of ensuring that the excitation of the span due to one shaker was significantly greater than the ambient excitation. As such, the force output from the tactile transducers was not measured, the inputs were not adjusted or tuned to ensure maximum force output, and multiple input locations were not used.
Figure 9 shows a typical measured time history for the burst random excitation taken from an accelerometer located about 6.5 m (21 ft) away from the shaker (and on a different girder). The low excitation level with the shaker not operating is seen at the beginning and end of the figure, while the acceleration is much greater during operation of the shaker during the burst signal. The mean RMS acceleration measured with only ambient inputs (no traffic) was 0.00041 g over the entire array of 28 accelerometers. The mean RMS acceleration measured with the burst random signal was 0.0035 g and with the sine sweep was 0.0041 g for the entire array. Therefore, the test demonstrated that a single tactile transducer could provide excitation about 10 times greater in magnitude than the ambient excitation (due to natural sources) on a typical medium-length bridge.
ConclusionsThis article reports on an early milestone in the process of de-
veloping a novel, low-cost MIMO system intended for testing of short- and medium-span bridges. The laboratory tests and other device characteristics discussed were intended to enable selection of a tactile transducer shaking device and an amplifier to drive it. In the final analysis, low-frequency response is the most important segment of the spectrum for the intended bridge testing. As such, Shaker 1 and Amp 2 were selected, since they have the best signal reproduction of the tested devices at low frequencies. Shaker 1 not only provides the highest forces at low frequencies, it also has the flattest force peak around its own natural frequency, and imparts low noise to sinusoidal and random signals. Both Amp1 and Amp 2 are powerful enough to drive the selected shaker, but Amp 2 has better gain at low frequencies, imparts less noise at low frequen-cies, and reproduces random signals very well. Price, perceived durability, and ease of use are also considered and also support selection of Shaker 1 and Amp 2.
The functionality of the proposed MIMO system was also tested at a basic level by ensuring that the force produced by the selected shakers could excite an actual bridge to reasonable levels in excess of ambient noise. The outcome of this validation testing was that excitation from the use of one of these shakers provided bridge accelerations that were significantly higher than the ambient background noise in the structure.
At the time of this writing, MIMO testing of a laboratory-scale bridge model using an array of these shakers is underway, and full testing of an in-service highway bridge is being planned. The success of this novel and affordable MIMO testing system has the potential to democratize experimental modal analysis by lowering the cost of entry and also has the potential to enable better management of bridge assets via global characterization of structural responses.
References1. Barbaccia, T. Grady, “The State of Our Bridges,” Better Roads, 81(11), pp
8-9, 11-12, 15-19, 2011.2. Cunha, A., and Caetano, E., “Experimental Modal Analysis of Civil En-
gineering Structures,” Sound & Vibration, 40(6), 12-20, 2006.3. Avitabile, P., “Is There Really a Difference Running a Modal Test with
MIMO as Opposed to SISO?,” Experimental Techniques, 35(4), 1-2, 2011.4. Avitabile, P., “So if I Use Multiple Reference Vs Single Reference FRFs,
Is There Really a Difference in Modal Parameters?,” Experimental Tech-niques, 35(5), 1-2, 2011.
5. Giraldo, D. F., Song, W., Dyke, S. J., and Caicedo, J. M., “Modal Identifi-cation through Ambient Vibration: Comparative Study,” J. Eng .Mech., 135(8), 759-770, 2009.
6. Gul, M., and Catbas, F. N., “Ambient Vibration Data Analysis for Structural Identification and Global Condition Assessment,” J. Eng. Mech., 134(8), 650-662, 2008.
The authors can be reached at: [email protected].
Figure 9. Burst random acceleration time history using one shaker; (a) no shaker and no traffic, (b) shaker induced.
Figure 8. Plan view (top) and photo of bridge.
Outputlocation
Shaker location
W27 x 94 (Typ.)W27 x 94 (Typ.)
C12
x 2
9.7
(Typ
.)
7.5
ft (T
yp.)
27 ft
50 ft
10 ft 10 ft15 ft 15 ft
a connector for speedy field setup. Overall, Shaker 3 is expensive and is not a good choice for field use.
Amp 1 and Amp 2 are both very similar units in that they have a comparable size, similar controls and connections, and comparable power ratings (per channel). However, Amp 2 provides a much better cost in that a single unit can drive two shakers with separate signals, while Amp 1 can only handle one excitation signal. This results in a cost per input location of $60 for Amp 2 compared to $150 for Amp 1. Amp 3 is of a different form than the other two and cannot compete with their power output. However, paired with Shaker 2, there is an opportunity to provide a very low cost array of shakers for excitation of structures with base frequencies greater than about 15 Hz.
Full-Scale ValidationThe laboratory testing program provides much information
about the proposed shaker system, but it is desirable to ensure the force output is adequate to excite an actual bridge. As such, a brief test was performed on an in-service highway bridge that was undergoing other vibration testing (Figure 8). A single, simply supported span of a 10-span river crossing was outfitted with 28 accelerometers, and an APS shaker was used to perform SIMO testing at multiple input locations. The tested bridge is composed of a concrete deck composite with four rolled steel girders. The span length is 15.24 m (50 ft) and the deck width is 8.23 m (27 ft). At the conclusion of the SIMO testing, a Shaker 1 unit was attached to the north fascia girder at midspan, and a burst random and a