Risk Analysis for Disposing Nonhazardous Oil Field Wastes ...

H&
S F
ile: A
CE
10 R
esid
uals
Pre
sent
atio
n B
arbo
e.pp
tx
H&
S Fi
le:
AC
E10
Res
idu
als
Pre
sen
tati
on
Bar
bo
e.p
ptx
EVALUATING ALTERNATIVES FOR DISPOSING OF
WATER PLANT SOLIDS INTO A WASTEWATER PLANT
Matthew Valade, P.E. July 25, 2014

H&
S F
ile: A
CE
10 R
esid
uals
Pre
sent
atio
n B
arbo
e.pp
tx
Presentation Outline
• Project Background • Why Dewater Croton Residuals Offsite? • Pilot Study at Hunts Point WWTP • Final Resolution • Conclusions

H&
S F
ile: A
CE
10 R
esid
uals
Pre
sent
atio
n B
arbo
e.pp
tx
New York Water Supply: Tunnels and Aqueducts
3

H&
S F
ile: A
CE
10 R
esid
uals
Pre
sent
atio
n B
arbo
e.pp
tx
Croton WTP - A Brief History
• 1842 – Croton begins supplying water to NYC • 1997 – Consent Order required Croton filtration • 1999 – Mosholu Golf Course (Bronx) site selected • 2001 – Design stopped due to legal clarification of
use of public park land – this design included residuals dewatering facilities on site
• 2002-04 – Several sites evaluated – MGC again selected but smaller footprint required Design does not include on site residuals dewatering
• 2005 – Construction work for Croton WTP begins • 2014 – Startup is underway
H&
S F
ile: A
CE
10 R
esid
uals
Pre
sent
atio
n B
arbo
e.pp
tx
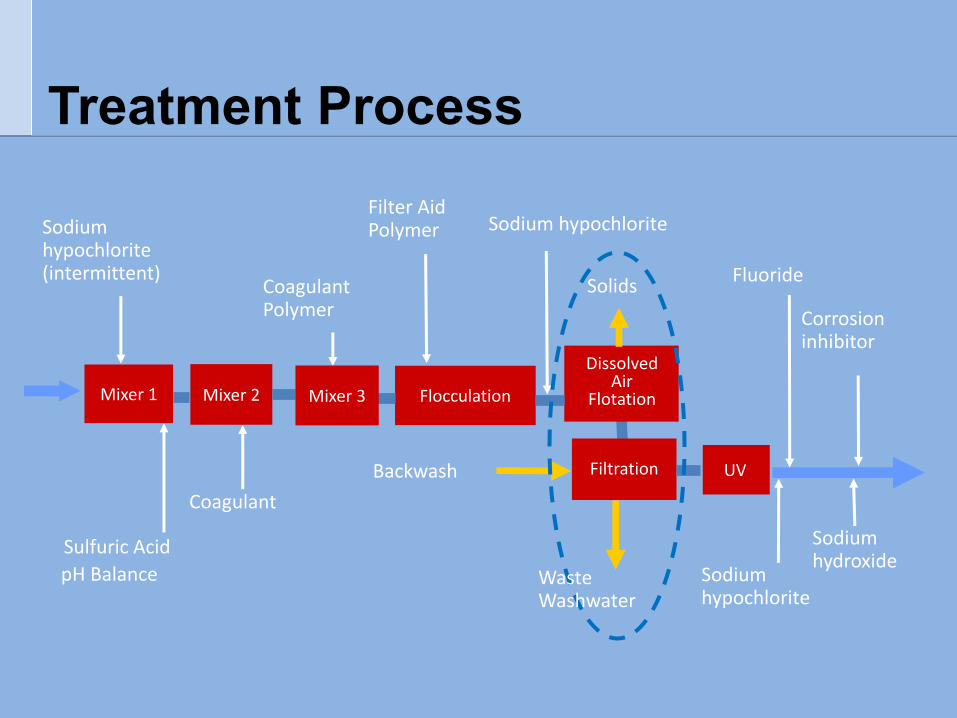
Coagulant
Backwash Filtration
Solids
Dissolved Air
Flotation Mixer 1 Flocculation
Fluoride
UV
Sulfuric Acid
Mixer 2
Coagulant Polymer
Sodium hypochlorite (intermittent)
Filter Aid Polymer
Sodium hypochlorite
Sodium hydroxide
Corrosion inhibitor
Mixer 3
Sodium hypochlorite
pH Balance Waste Washwater
Treatment Process

H&
S F
ile: A
CE
10 R
esid
uals
Pre
sent
atio
n B
arbo
e.pp
tx
Woodlawn Cemetery
Plant Site
Jerome Avenue
Mosholu Golf Course
Woodlawn Train Station
Jerome Park Reservoir
Photograph taken in 2004 before construction
Overview of the Facility Location

H&
S F
ile: A
CE
10 R
esid
uals
Pre
sent
atio
n B
arbo
e.pp
tx
Croton Water Treatment Plant

H&
S F
ile: A
CE
10 R
esid
uals
Pre
sent
atio
n B
arbo
e.pp
tx
Final Excavation - July 6, 2007
N
Raw Water Tunnel
Treated Water Tunnel
555-ft
683-ft
9.2 Acres
90-ft

H&
S F
ile: A
CE
10 R
esid
uals
Pre
sent
atio
n B
arbo
e.pp
tx
Construction – as of May 2010

H&
S F
ile: A
CE
10 R
esid
uals
Pre
sent
atio
n B
arbo
e.pp
tx
Construction – as of May 2014

H&
S F
ile: A
CE
10 R
esid
uals
Pre
sent
atio
n B
arbo
e.pp
tx
Why Dispose Croton Residuals Offsite?
• Dewatering residuals on-site: Limited space on site No truck access to Operating Level below
grade • Concerns with truck exhaust • Space Constraints
Reduce truck traffic to and from the WTP Considerably higher Cap/Op costs
• Issues with dewatering Croton residuals on-site led DEP to consider dewatering residuals offsite at Hunts Point WWTP

H&
S F
ile: A
CE
10 R
esid
uals
Pre
sent
atio
n B
arbo
e.pp
tx
• Discharging Directly to Sewer was Banned
• Closest WWTP to site • Existing Dewatering Facility • Sufficient space for any
required facilities • Sufficient Dewatering capacity
13 dewatering centrifuges Space for 3 new centrifuges
• 7.5 mile Force Main Required
Why Hunts Point?
Hunts Point WWTP
Croton WTP

H&
S F
ile: A
CE
10 R
esid
uals
Pre
sent
atio
n B
arbo
e.pp
tx
Croton WTP Flow and Residuals
Solids Loads Croton WTP
Flow, MGD
Total Suspended
Solids, lb/day
Average Design Conditions
144 17,300
Maximum Design Conditions
290 44,500

H&
S F
ile: A
CE
10 R
esid
uals
Pre
sent
atio
n B
arbo
e.pp
tx
Characteristics of Croton WTP Residuals
WTP Residuals Dissolved Solids Parameter Concentration
TSS 30 mg/l
Aluminum 1,700 mg/l
Iron 150 mg/l
Manganese 55 mg/l
Heavy Metals Trace Amount
Toxic Or hazardous None
pH ~ 6.2 units
Aluminum Hydroxide 50%
Organic 41%
Other inert (metals, non-organic solids) 9%

H&
S F
ile: A
CE
10 R
esid
uals
Pre
sent
atio
n B
arbo
e.pp
tx
Hunts Point WWTP Background
• Biosolids loads Hunts Point WWTP: 100,000 lb/day Imported Sludge: 214,000 lb/day
• Dewaters thickened, digested biosolids Hunts Point and imported biosolids from
other NYCDEP WWTPs separately • Pelletize dewatered biosolids prior to off
site disposal

H&
S F
ile: A
CE
10 R
esid
uals
Pre
sent
atio
n B
arbo
e.pp
tx
Croton Residuals Dewatering Alternatives at Hunts Point
• Separate Dewatering Dewater water treatment residuals and wastewater
biosolids sludge separately
• Blend Croton residuals with Hunts Point sludge Introduce at primary/secondary settling and
dewater water treatment residuals and wastewater biosolids sludge together

H&
S F
ile: A
CE
10 R
esid
uals
Pre
sent
atio
n B
arbo
e.pp
tx
Separate Dewatering Advantages Disadvantages
• Uses specific conditioning for WTP residuals
• No effect on WWTP biosolids dewatering
• Requires new polymer system and dedicated centrifuges
• May impact cake disposal options
• Pilot testing needed to confirm impacts
• Net decrease likely in % solids in cake
• Requires dedicated storage for alum sludge

H&
S F
ile: A
CE
10 R
esid
uals
Pre
sent
atio
n B
arbo
e.pp
tx
Blended Dewatering Advantages Disadvantages
• Use existing polymer to condition the two sludges
• Use existing centrifuges • Possible to blend the
Croton WTP sludge with Hunts Point sludge prior to dewatering
• Possibility of lower dewatered cake percent being produced with blended sludge
H&
S F
ile: A
CE
10 R
esid
uals
Pre
sent
atio
n B
arbo
e.pp
tx
Effects of Aluminum Hydroxide on Wastewater
• Limited Research/Literature
• Therefore, it was decided to pilot test to study the alternatives
• Full scale using existing Hunts Point WWTP dewatering centrifuges
• BioWin Computer Modeling used to estimate theoretical effects of introducing WTP residuals to Hunts Point WWTP process

H&
S F
ile: A
CE
10 R
esid
uals
Pre
sent
atio
n B
arbo
e.pp
tx
Hunts Point WW Process Concerns
• BNR Consent Order requiring Total Nitrogen (TN) to under 44,200 lb/d at 2017 influent flows and loads
• Biowin Analysis included three Croton Residual addition points Primary Settling Tanks Final Settling Tanks Gravity Thickeners

H&
S F
ile: A
CE
10 R
esid
uals
Pre
sent
atio
n B
arbo
e.pp
tx
Biowin Model Predictions (1 of 2)
• Primary Settling (PS) Tanks Increased sludge settling Increased solids can potentially overload Gravity
Thickeners & Digesters, and decrease sludge quality from Gravity Thickeners
Increases CBOD removal (source of carbon for denitrification process in BNR treatment)
78% increase in PS load, reduces HRT and VSS destruction in digesters, increased methanol demand

H&
S F
ile: A
CE
10 R
esid
uals
Pre
sent
atio
n B
arbo
e.pp
tx
Biowin Model Predictions (2 of 2)
• Final Settling Tanks (FSTs) Addition prior to FST’s increased solids loading to
clarifiers, lower effective SRT (30% drop) 38% higher solids to digesters, reduced HRT and
VSS destruction • Gravity Thickeners
Potentially higher removal of solids (+37%) No significant drop in PE VSS/TSS ratio, no SRT
effects, no increased methanol demand Solids Loading Rates matched WEF MOP Best Alternative of 3 Locations

H&
S F
ile: A
CE
10 R
esid
uals
Pre
sent
atio
n B
arbo
e.pp
tx
Previous Bench Scale Tests
• Results Separate Dewatering Results:
• WWTP ~ 22 to 27%
• WTP ~ 18 to 20%
Combined Dewatering Results • Indicated that dewatered solids from combining
sludges ranged between 8 – 22%

H&
S F
ile: A
CE
10 R
esid
uals
Pre
sent
atio
n B
arbo
e.pp
tx
Pilot Study Scope
• Dewatered alum residuals from Warner WTP at Hunts Point WWTP Warner WTP: similar raw water quality & treatment
process to Croton WTP 6,000 gallon truck for residuals 2.5-3% solids
• Study polymer types and dosage rates that produce high solids cake Polymer for Alum Sludge: Flopam NE1619 Polymer for Wastewater Sludge: Flopam NE1516

H&
S F
ile: A
CE
10 R
esid
uals
Pre
sent
atio
n B
arbo
e.pp
tx
WTP Residuals vs. WWTP Biosolids
• Critical difference that dictates sludge conditioning is Difference in the cationic demand between alum
residuals and anaerobically digested biosolids WTP (alum) residuals has a low cationic charge Anaerobically digested biosolids has a high cationic
charge Therefore need to study both single (WTP residuals
alone) and dual conditioning (combined WTP residuals with WWTP biosolids)

H&
S F
ile: A
CE
10 R
esid
uals
Pre
sent
atio
n B
arbo
e.pp
tx
Single & Dual Charge Conditioning
• Single Conditioning 80% Charge Existing WWTP Polymer, a
High Charge Cationic Polymer
• Dual Conditioning 10% Cationic Charge Polymer 80% Cationic Charge Existing WWTP
Polymer

H&
S F
ile: A
CE
10 R
esid
uals
Pre
sent
atio
n B
arbo
e.pp
tx
Preliminary Jar Testing
• Results: Existing Polymer was effective for dewatering the blended sludge
• Recommended using both types of charged polymers to maximize cake solids
• Pilot Test: 10% charge polymer into alum feed
80% charge Polymer into WWTP biosolid feed.

H&
S F
ile: A
CE
10 R
esid
uals
Pre
sent
atio
n B
arbo
e.pp
tx
Figure 1: Pilot Test Design
Existing Polymer
Polymer Feed Pump
Existing Tank
Existing Metering
Pump
Polymer Tote
Polymer Make Down
System
Alum Sludge Aquarium WTP
Alum Feed Pump
M
Imported Sludge
Hunt’s Point
Sludge Feed
Centrifuge
Drain
Dewatering
Centrate
Dewatered Cake
Figure 1: Pilot Test Design

H&
S F
ile: A
CE
10 R
esid
uals
Pre
sent
atio
n B
arbo
e.pp
tx
Figure 2: Pilot Arrangement

H&
S F
ile: A
CE
10 R
esid
uals
Pre
sent
atio
n B
arbo
e.pp
tx
Figure 3: Polymer System

H&
S F
ile: A
CE
10 R
esid
uals
Pre
sent
atio
n B
arbo
e.pp
tx
Single Conditioning Results (Not Optimized)
• As alum residuals:biosolids INCREASED Cake solids DECREASED (polymer constant).
• The lowest cake solids was 22.6% at 4:1 alum to wastewater sludge ratio
H&
S F
ile: A
CE
10 R
esid
uals
Pre
sent
atio
n B
arbo
e.pp
tx
Dual Conditioning Results
Results at 16-38% alum to wastewater sludge ratios 6:1 blended sludge ratio produced a high cake solids
(29%) with 60 lb/DT (neat) Existing Polymer and 45 lb/DT (neat) 10% charge polymer.
4:1 blended sludge ratio, the same cake solids were produced but required 20-30% more polymer
2.5:1 blended sludge ratio, increase in the polymer dosage did not increase the cake solids.

H&
S F
ile: A
CE
10 R
esid
uals
Pre
sent
atio
n B
arbo
e.pp
tx
Figure 4: Recommended Operations

H&
S F
ile: A
CE
10 R
esid
uals
Pre
sent
atio
n B
arbo
e.pp
tx
Conclusions
• Dual conditioning produced better cake Maximum Flexibility
Allows the flexibility to treat the solids mixture with a proper combination of low and high charge polymers.
• And…..confirmation of existing Hunts Point dewatering equipment will work on Croton WTP residuals, BUT…

H&
S F
ile: A
CE
10 R
esid
uals
Pre
sent
atio
n B
arbo
e.pp
tx
Direct Sewer Discharge Part Deux
• NYC DEP Operating Bureau allows Croton Sludge to be pumped to sewer
• Existing infrastructure has been utilized • Sludge monitoring via industrial
discharge permit: routine sampling req'd • Monitoring of BNR process at WI WWTP
shows no impact to treatment • Pumping strategy during Wet Weather
to mitigate CSO events

H&
S F
ile: A
CE
10 R
esid
uals
Pre
sent
atio
n B
arbo
e.pp
tx
Overview of the Facility Location
Ward’s Island WWTP
Hunt’s Point WWTP
Croton WTP

H&
S F
ile: A
CE
10 R
esid
uals
Pre
sent
atio
n B
arbo
e.pp
tx
Questions?
Thank you!

H&
S F
ile: A
CE
10 R
esid
uals
Pre
sent
atio
n B
arbo
e.pp
tx
Alum Sludge Addition Impacts
• On Gravity Thickening Need higher GT underflow to digesters Solids Loading Rate does not exceed WEF
MOP values (7.1 to 9.5 lb/ft^2/d)
• On Digestion 5,000-10,000 lb/day additional must be landfilled
due to: • Under 15-day HRT requirement reducing %VSS destruction • Hunt’s Point won’t meet PSRP compliance for Class B sludge with
current online infrastructure May reduce digester performance with
decrease in total gas production, Methane production, COD reduction, and organic N decomposition

H&
S F
ile: A
CE
10 R
esid
uals
Pre
sent
atio
n B
arbo
e.pp
tx
Alum Sludge Addition Impacts
• On Dewatering Increase digested sludge load 60-70% Evaluation whether centrifuge capacity exists for
additional sludge load necessary Combined sludge produces cake solids of 24%
• On Biological Nitrogen Removal (BNR) Potential decrease in ammonia production
• Beneficial reduction of influent N load to secondary treatment
• May inhibit nitrification which would require supplemental Sodium Hydroxide


![Safety Guidelines - Mitsubishi Electric...supply input power again. [Disposal Precautions] When disposing of this product, treat it as industrial waste. When disposing of batteries,](https://static.fdocuments.in/doc/165x107/5e8d6f3a42e11d36771954d0/safety-guidelines-mitsubishi-electric-supply-input-power-again-disposal.jpg)


![008. Frederic Valade - Regina Nevazutilor [1937]](https://static.fdocuments.in/doc/165x107/55cf991e550346d0339bb33f/008-frederic-valade-regina-nevazutilor-1937.jpg)