Evaluating Active Interventions to Reduce Student ... than traditional procrastination is the...
85
Evaluating Active Interventions to Reduce Student Procrastination Joshua D. Martin Thesis submitted to the Faculty of the Virginia Polytechnic Institute and State University in partial fulfillment of the requirements for the degree of Master of Science in Computer Science and Applications Stephen H. Edwards, Chair Manuel A. P´ erez-Qui˜ nones Clifford A. Shaffer April 30, 2015 Blacksburg, Virginia Keywords: procrastination, self-regulation, self-efficacy, scheduling, schedule sheets, reflective writing, active learning, e-mail alerts Copyright 2015, Joshua D. Martin
Transcript of Evaluating Active Interventions to Reduce Student ... than traditional procrastination is the...

Evaluating Active Interventions to Reduce Student Procrastination
Joshua D. Martin
Thesis submitted to the Faculty of theVirginia Polytechnic Institute and State University
in partial fulfillment of the requirements for the degree of
Master of Sciencein
Computer Science and Applications
Stephen H. Edwards, ChairManuel A. Perez-Quinones
Clifford A. Shaffer
April 30, 2015Blacksburg, Virginia
Keywords: procrastination, self-regulation, self-efficacy, scheduling, schedule sheets,reflective writing, active learning, e-mail alerts
Copyright 2015, Joshua D. Martin
Evaluating Active Interventions to Reduce Student Procrastination
Joshua D. Martin
(ABSTRACT)
Procrastination is a pervasive problem in education. In computer science, procrastinationand lack of necessary time management skills to complete programming projects are viewedas primary causes of student attrition. The most effective techniques known to reduceprocrastination are resource-intensive and do not scale well to large classrooms.
In this thesis, we examine three course interventions designed to both reduce procrastinationand be scalable for large classrooms. Reflective writing assignments require students toreflect on their time management choices and how these choices impact their classroomperformance. Schedule sheets force students to plan out their work on an assignment. E-mailalerts inform students of their current progress as they work on their projects, and provideideas on improving their work behavior if their progress is found to be unsatisfactory. Weimplemented these interventions in a junior-level course on data structures. The study wasconducted over two semesters and 330 students agreed to participate in the study. Datacollected from these students formed the basis of our analysis of the interventions.
We found a statistically significant relationship between the time a project was completedand the quality of that work, with late work being of lower quality. We also found that thee-mail alert intervention had a statistically significant effect on reducing the number of latesubmissions. This result occurred despite students responded negatively to the treatment.

Acknowledgments
This work is supported in part by the National Science Foundation under grant DUE-1245334. Any opinions, findings, conclusions, or recommendations expressed in this materialare those of the authors and do not necessarily reflect the views of the National Science Foun-dation.
iii

Contents
1 Introduction 1
1.1 Procrastination Impact and Causes . . . . . . . . . . . . . . . . . . . . . . . 1
1.2 Difficulties with Current Techniques to Fight Procrastination . . . . . . . . . 2
1.3 Research Problem . . . . . . . . . . . . . . . . . . . . . . . . . . . . . . . . . 2
1.4 Organization of this Document . . . . . . . . . . . . . . . . . . . . . . . . . 3
2 Literature Review 4
2.1 Procrastination Definition . . . . . . . . . . . . . . . . . . . . . . . . . . . . 4
2.2 Historical References to Procrastination . . . . . . . . . . . . . . . . . . . . . 4
2.3 Modern Procrastination Research . . . . . . . . . . . . . . . . . . . . . . . . 5
2.3.1 Causes . . . . . . . . . . . . . . . . . . . . . . . . . . . . . . . . . . . 5
2.3.2 Theories . . . . . . . . . . . . . . . . . . . . . . . . . . . . . . . . . . 6
2.4 Previous Efforts to Study Procrastination in the Classroom . . . . . . . . . . 6
2.4.1 Strategies for Achievement . . . . . . . . . . . . . . . . . . . . . . . . 7
2.4.2 Task Management Groups . . . . . . . . . . . . . . . . . . . . . . . . 7
2.4.3 Extra Credit Opportunities . . . . . . . . . . . . . . . . . . . . . . . 8
2.4.4 Web-CAT . . . . . . . . . . . . . . . . . . . . . . . . . . . . . . . . . 8
3 Reflective Writing 10
3.1 Background . . . . . . . . . . . . . . . . . . . . . . . . . . . . . . . . . . . . 10
3.2 Implementation . . . . . . . . . . . . . . . . . . . . . . . . . . . . . . . . . . 11
3.3 Experimental Design . . . . . . . . . . . . . . . . . . . . . . . . . . . . . . . 11
iv
3.4 Student Response . . . . . . . . . . . . . . . . . . . . . . . . . . . . . . . . . 12
3.4.1 Student Feedback . . . . . . . . . . . . . . . . . . . . . . . . . . . . . 12
3.4.2 Reflective Response Themes . . . . . . . . . . . . . . . . . . . . . . . 13
4 Schedule Sheets 19
4.1 Background . . . . . . . . . . . . . . . . . . . . . . . . . . . . . . . . . . . . 19
4.2 Implementation . . . . . . . . . . . . . . . . . . . . . . . . . . . . . . . . . . 20
4.3 Experimental Design . . . . . . . . . . . . . . . . . . . . . . . . . . . . . . . 21
4.4 Student Response . . . . . . . . . . . . . . . . . . . . . . . . . . . . . . . . . 22
4.4.1 Student Feedback . . . . . . . . . . . . . . . . . . . . . . . . . . . . . 22
4.4.2 Schedule Accuracy . . . . . . . . . . . . . . . . . . . . . . . . . . . . 23
4.4.3 Schedule Errors . . . . . . . . . . . . . . . . . . . . . . . . . . . . . . 24
5 E-mail Alerts 25
5.1 Background . . . . . . . . . . . . . . . . . . . . . . . . . . . . . . . . . . . . 25
5.2 Implementation . . . . . . . . . . . . . . . . . . . . . . . . . . . . . . . . . . 26
5.3 Experimental Design . . . . . . . . . . . . . . . . . . . . . . . . . . . . . . . 27
5.4 Student Response . . . . . . . . . . . . . . . . . . . . . . . . . . . . . . . . . 27
5.4.1 Student Feedback . . . . . . . . . . . . . . . . . . . . . . . . . . . . . 27
5.4.2 Alert Analysis . . . . . . . . . . . . . . . . . . . . . . . . . . . . . . . 29
6 Evaluation 30
6.1 Intervention Analysis . . . . . . . . . . . . . . . . . . . . . . . . . . . . . . . 31
6.1.1 Interventions Impact on On-time Status . . . . . . . . . . . . . . . . 32
6.1.2 Intervention Impact on First Submission Time . . . . . . . . . . . . . 34
6.1.3 Intervention Impact on Final Submission Time . . . . . . . . . . . . . 36
6.1.4 Intervention Impact on Solution Correctness . . . . . . . . . . . . . . 37
6.1.5 Intervention Impact on Reference Tests Passed . . . . . . . . . . . . . 39
6.1.6 Intervention Impact on Coverage Achieved . . . . . . . . . . . . . . . 42
6.1.7 Intervention Impact on Submission Number . . . . . . . . . . . . . . 44
v

6.1.8 Intervention Impact on Solution Size . . . . . . . . . . . . . . . . . . 46
6.1.9 Intervention Impact on Code Size (Test) . . . . . . . . . . . . . . . . 48
6.1.10 Procrastination Score of Each Treatment Group . . . . . . . . . . . . 49
6.2 On-time Submission Analysis . . . . . . . . . . . . . . . . . . . . . . . . . . 50
6.2.1 On-time Impact on Reference Test Pass Rate . . . . . . . . . . . . . 51
6.2.2 On-time Impact on Code Coverage . . . . . . . . . . . . . . . . . . . 53
6.2.3 On-time Impact on Correctness Score . . . . . . . . . . . . . . . . . . 54
6.2.4 On-time Impact on TA Score . . . . . . . . . . . . . . . . . . . . . . 55
6.2.5 On-time Impact on Solution Size . . . . . . . . . . . . . . . . . . . . 56
6.2.6 On-time Impact on Test Size . . . . . . . . . . . . . . . . . . . . . . . 57
6.2.7 Late Impact on Submission Number . . . . . . . . . . . . . . . . . . . 58
6.2.8 Procrastination Tendency Impact on Lateness . . . . . . . . . . . . . 59
6.2.9 Combined Start Time and Work Rate Examination . . . . . . . . . . 59
6.3 Analysis Limitations . . . . . . . . . . . . . . . . . . . . . . . . . . . . . . . 61
6.3.1 Semester Influence . . . . . . . . . . . . . . . . . . . . . . . . . . . . 61
6.3.2 Assignment Influence . . . . . . . . . . . . . . . . . . . . . . . . . . . 62
6.3.3 Inherent Student Quality . . . . . . . . . . . . . . . . . . . . . . . . . 62
6.3.4 Web-CAT Data Limitations . . . . . . . . . . . . . . . . . . . . . . . 63
7 Conclusions 64
7.1 Experimental Results . . . . . . . . . . . . . . . . . . . . . . . . . . . . . . . 64
7.2 Contributions . . . . . . . . . . . . . . . . . . . . . . . . . . . . . . . . . . . 65
7.3 Future Work . . . . . . . . . . . . . . . . . . . . . . . . . . . . . . . . . . . . 65
Bibliography 65
A Sample E-mail Alerts 69
A.1 E-mail Alert Example: Student with No Web-CAT Submissions . . . . . . . 69
A.2 E-mail Alert Example: Student Making Insufficient Progress . . . . . . . . . 70
A.3 E-mail Alert Example: Student Making Good Progress . . . . . . . . . . . . 70
vi
B Reflective Writing Assignment 71
B.1 Reflective Writing Prompts . . . . . . . . . . . . . . . . . . . . . . . . . . . 71
C Schedule Sheet Assignment 72
C.1 Schedule Sheet Entry Instructions . . . . . . . . . . . . . . . . . . . . . . . . 72
vii

List of Figures
3.1 The composite score responses to the feedback survey for the reflective writingtreatment. Values closer to 1 indicate greater appreciation for the treatment,while values closer to 0 indicate the opposite. . . . . . . . . . . . . . . . . . . 13
3.2 The breakdown of responses related to time management strategy combinedfor question 1 and 3. . . . . . . . . . . . . . . . . . . . . . . . . . . . . . . . 16
3.3 The breakdown of responses to question 3. . . . . . . . . . . . . . . . . . . . 17
4.1 The composite score responses to the feedback survey for the schedule sheettreatment. Values closer to 1 indicate greater appreciation for the treatment,while values closer to 0 indicate the opposite. . . . . . . . . . . . . . . . . . . 22
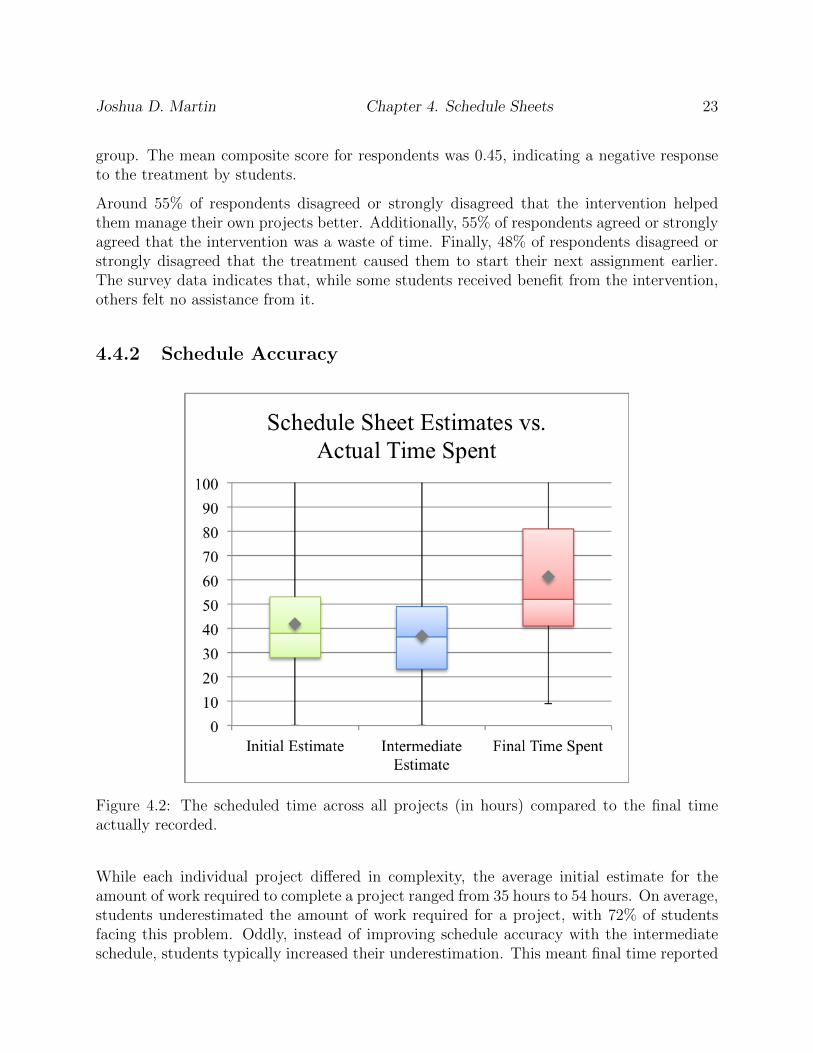
4.2 The scheduled time across all projects (in hours) compared to the final timeactually recorded. . . . . . . . . . . . . . . . . . . . . . . . . . . . . . . . . . 23
5.1 The composite score responses to the feedback survey for the e-mail alerttreatment. Values closer to 1 indicate greater appreciation for the treatment,while values closer to 0 indicate the opposite. . . . . . . . . . . . . . . . . . . 28
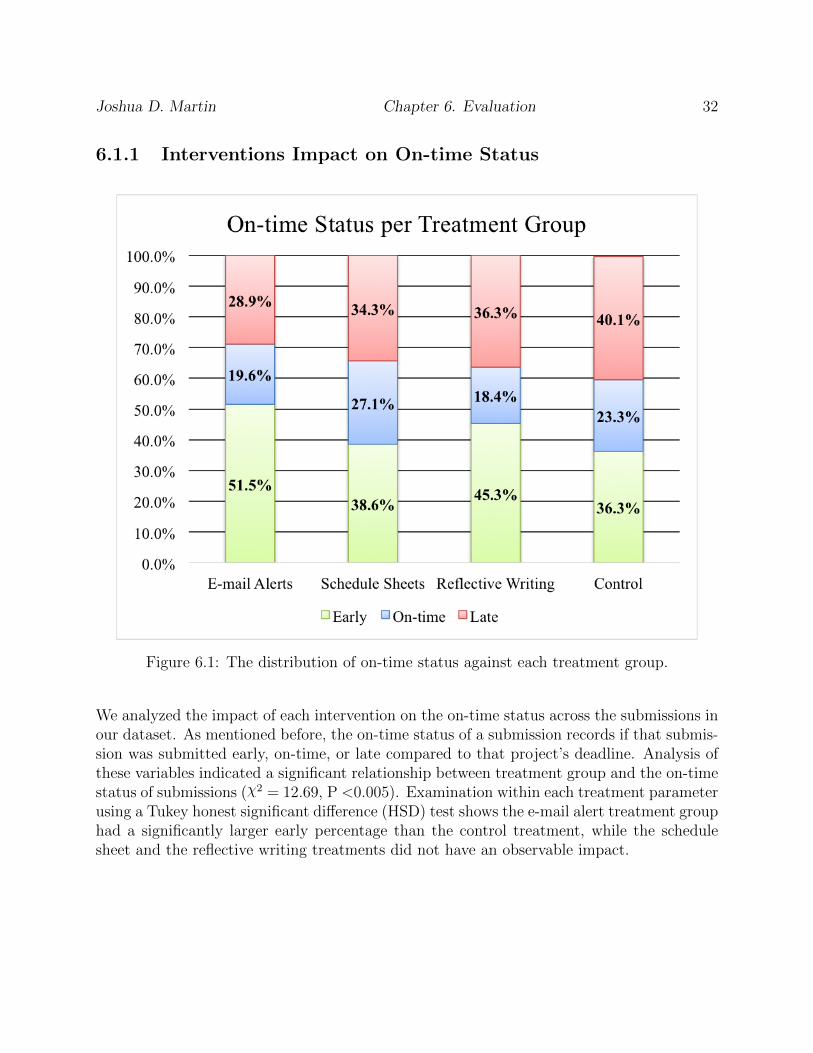
6.1 The distribution of on-time status against each treatment group. . . . . . . . 32
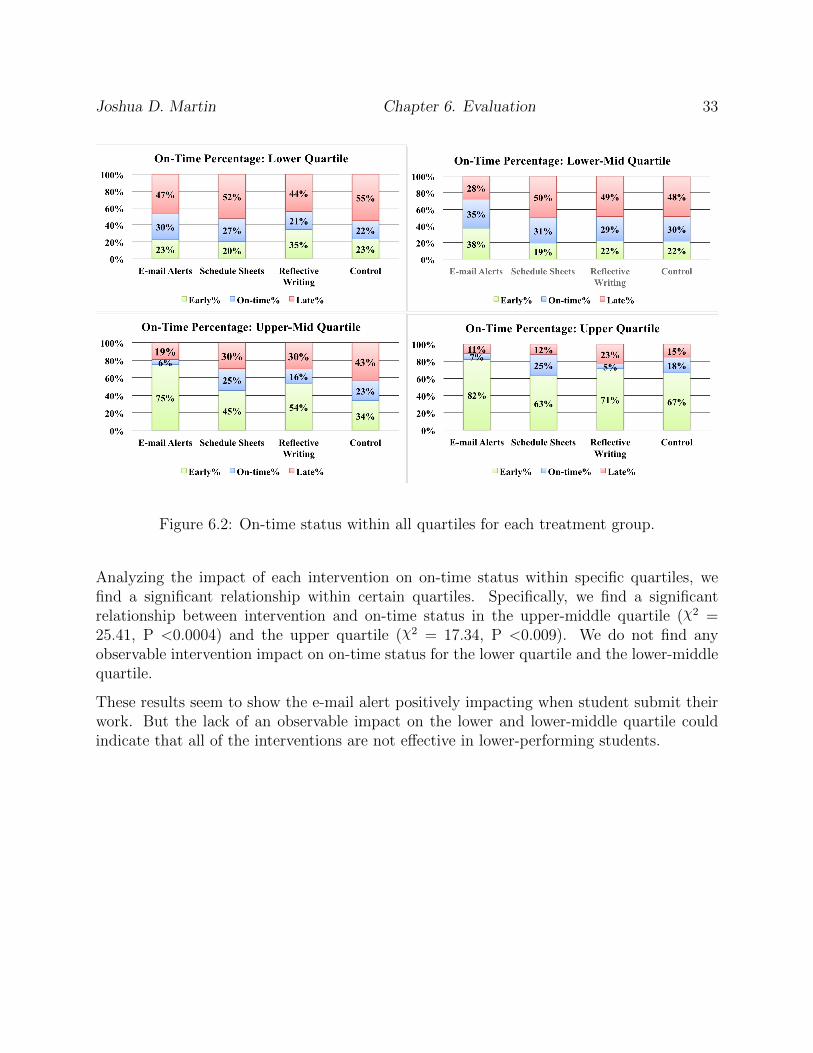
6.2 On-time status within all quartiles for each treatment group. . . . . . . . . . 33
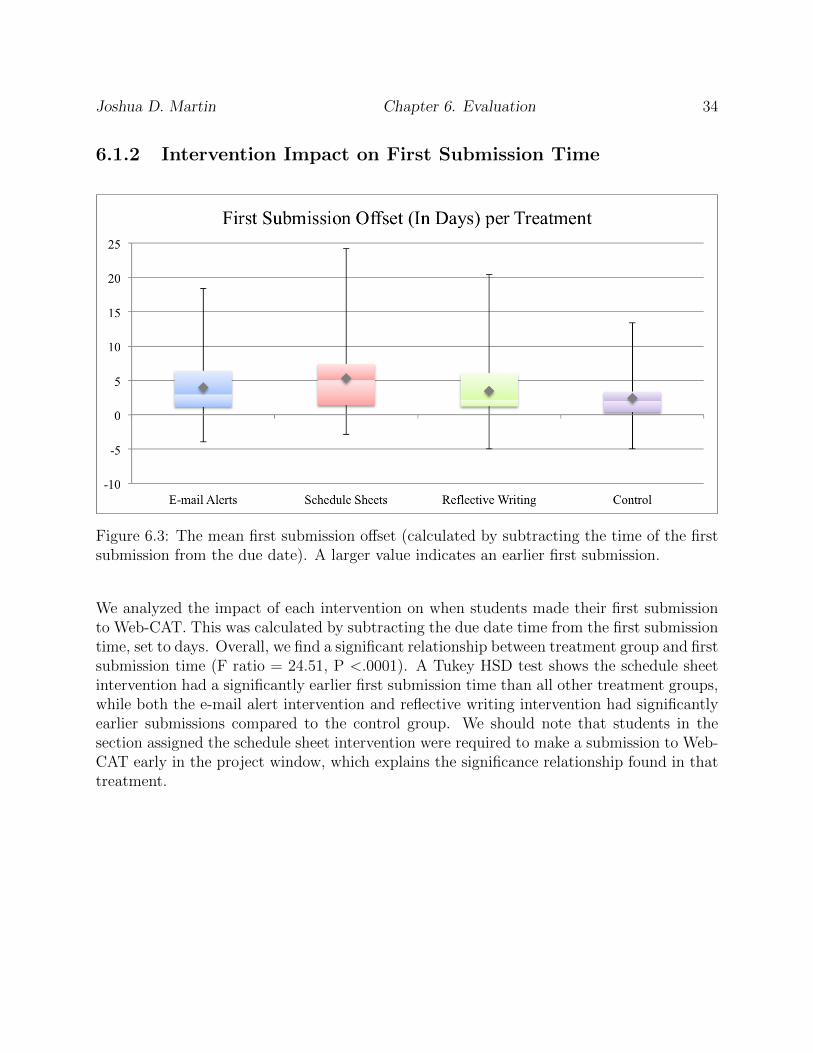
6.3 The mean first submission offset (calculated by subtracting the time of thefirst submission from the due date). A larger value indicates an earlier firstsubmission. . . . . . . . . . . . . . . . . . . . . . . . . . . . . . . . . . . . . 34
6.4 First submission time within all quartiles for each treatment group. . . . . . 35
6.5 The final submission values (in days) per treatment group. A negative valueindicates that the submission time was before the deadline, and a positivevalue indicates that the submission time was after the deadline. . . . . . . . 36
6.6 Correctness score for each treatment group. . . . . . . . . . . . . . . . . . . 37
viii

6.7 Percentage of reference tests passed for each treatment group. . . . . . . . . 39
6.8 The percentage of reference tests passed within all quartiles for each treatmentgroup. . . . . . . . . . . . . . . . . . . . . . . . . . . . . . . . . . . . . . . . 40
6.9 Percentage of test coverage achieved for each treatment group. . . . . . . . . 42
6.10 Percentage of code covered by tests within all quartiles for each treatmentgroup. . . . . . . . . . . . . . . . . . . . . . . . . . . . . . . . . . . . . . . . 43
6.11 The number of project submissions for each treatment group. . . . . . . . . . 44
6.12 The number of submissions within all quartiles for each treatment group. . . 45
6.13 The solution size for each treatment group. The values are taken from thefinal Web-CAT submission. . . . . . . . . . . . . . . . . . . . . . . . . . . . . 46
6.14 The normalized solution size within all quartiles for each treatment group. . 47
6.15 The test code size for each treatment group. The values are taken from thefinal submission to Web-CAT. . . . . . . . . . . . . . . . . . . . . . . . . . . 48
6.16 The normalized test code size within all quartiles for each treatment group. . 49
6.17 The procrastination survey score for each treatment group. . . . . . . . . . . 50
6.18 The percentage of reference tests passed for each on-time status category. . . 51
6.19 The percentage of reference tests passed within all quartiles for each on-timestatus category. . . . . . . . . . . . . . . . . . . . . . . . . . . . . . . . . . . 52
6.20 The percentage of code covered by tests for each on-time status category. . . 53
6.21 The correctness score for each on-time status category. . . . . . . . . . . . . 54
6.22 The value of the score given by the course TA for each on-time status category. 55
6.23 The normalized solution size for each on-time status category. . . . . . . . . 56
6.24 The normalized test code size for each on-time status category. . . . . . . . . 57
6.25 The mean number of submissions for each on-time status category. . . . . . . 58
6.26 The score of a procrastination survey for each on-time status category of theproject. The higher the score, the more likely a student was to procrastinate. 59
6.27 First submission solution size ratio versus the percentage of reference testspassed. . . . . . . . . . . . . . . . . . . . . . . . . . . . . . . . . . . . . . . . 60
6.28 First submission time versus the percentage of reference tests passed. A neg-ative value indicates an earlier submission, while a positive value indicates alater submission. . . . . . . . . . . . . . . . . . . . . . . . . . . . . . . . . . 61
ix

6.29 Combined first submission time and first submission solution size versus thepercentage of reference tests passed. . . . . . . . . . . . . . . . . . . . . . . . 62
x

Chapter 1
Introduction
Procrastination is a ubiquitous problem in education. Many students find it difficult to com-plete assignments on time. This can cause students to receive poor grades in the classroom,negatively impacting their academic performance. In particular, many computer science ed-ucators describe procrastination as a common reason students do not succeed in class [7].Additionally, the concept of late night debugging sessions and last minute project completionseems to be ingrained in the culture of computer science. Students give many reasons forprocrastinating, and many potential causes of procrastination have been identified [22][13].Researchers have also examined different ways to combat procrastination [25][19]. Thesetechniques have varying degrees of applicability and success. In this paper, we discuss previ-ous research regarding procrastination and introduce our own active interventions to combatprocrastination in CS courses. We then analyze the impact of these treatments on studentprocrastination and other aspects of submitted project solutions.
1.1 Procrastination Impact and Causes
Procrastination can be defined multiple ways, but we define it here as “voluntarily delayingan intended course of action despite expecting to be worse off for the delay” [22]. Evenworse than traditional procrastination is the behavior of negative procrastinators. Negativeprocrastinators are defined as those who procrastinate to the extent they experience negativeconsequences from their behavior. This class of procrastinator is more likely to turn in worklate, receive lower scores, report greater stress and health concerns, and visit health-careprofessionals more often [23].
The negative impact of procrastination on student performance is directly shown in academicliterature. In a study examining the performance of 1,101 CS students over a five year period,a statistically significant correlation was found between when students started working on aproject and their work quality. Students who started earlier on assignments were significantly
1
Joshua D. Martin Chapter 1. Introduction 2
more likely to earn a good grade, in this case an A or B letter grade, compared to assignmentswhere these same students started working later [9].
Despite procrastination having such a profound impact on students, there is still a lack ofunderstanding about the behavior [13]. Research has determined that procrastination shouldbe considered a personality trait [22], and multiple tools have been developed to measure anindividual’s procrastination tendency [14][24]. A number of potential causes have also beenexamined, including self-efficacy, self-esteem, self-regulation, fear of failure, task aversion,task rewards, neuroticism, and impulsiveness [22].
1.2 Difficulties with Current Techniques to Fight Pro-
crastination
Previous attempts at combating procrastination were targeted at smaller groups. Tuckman,who utilized a “study skills” course to teach students various theories about procrastination,found the course on average increased a student’s GPA compared to a control group ofstudents [26]. His work clearly shows a degree of success, but it is unfeasible to assume thatevery student who struggles with procrastination will have time to take a course. Indeed,given the large number of undergraduate students who procrastinate on coursework, anysolution to reduce procrastination will need the ability to reach a large number of students.
Because the most effective strategies to deal with procrastination involve supplementarycourse or workshop material on motivation and time management strategies, there remainsa distinct gap of scalable techniques to fight this issue.
1.3 Research Problem
In this thesis, we design and evaluate three different scalable techniques to combat procras-tination among students. These interventions are reflective writing assignments, schedulesheets, and e-mail situational awareness alerts.
The reflective writing assignments were inspired by active learning techniques. Studentscompleted these writing assignments outside of class before a programming assignment wascompleted. The schedule sheet intervention utilized an online system where students esti-mated the amount of time required to complete a project. The e-mail alert interventionconsisted of an automated notification system which sent students information about theircurrent work progress at specified intervals.
To assist with the implementation of these interventions, we utilized the Web-CAT au-tomated grading platform to integrate data collection about each assignment. Web-CATprovides a number of assignment analysis and data collection tools that proved useful in

Joshua D. Martin Chapter 1. Introduction 3
gathering information about the impact of each intervention. Furthermore, both the schedulesheet and situational awareness interventions were implemented as plugins to the Web-CATsystem, allowing both interventions to take advantage of the information collected whenproviding feedback to students.
By integrating our interventions into Web-CAT, we were able to collect a rich dataset onstudent submissions. The data include many different aspects of each student solution,such as information on student submission behavior, project grades, final grades, and othercharacteristics. We examined potential correlations between the results from each of thetested intervention groups, and ran statistical tests to see which of the interventions proved tobe the best at changing individual behaviors. Additionally, we examined specific informationrelated to each intervention to understand the individual impacts. This includes feedbackcollected from a survey given to students. The survey asked students in each of the treatmentgroups multiple questions regarding their own personal feelings about the interventions. Thenature of the treatments themselves also generated extra data, such as problems students hadcreating appropriate schedules or the common themes students discusses in their reflectivewriting assignments. We discuss this specific information in the following chapters.
We previously published a cursory analysis of these interventions in the 2015 Conference onInnovation & Technology in Computer Science Education. This initial examination of thedata collected found a positive correlation between the e-mail situational awareness alerttreatment and the on-time status of a submission [7]. This paper examines the impact ofthese interventions more extensively and in-depth, building off of the results found in ourearlier work.
1.4 Organization of this Document
In Chapter 2, we discuss the literature that influenced our research and provide examples ofprevious techniques used to combat procrastination in the classroom. This includes coursesdeveloped to teach students study skills and workshops developed to provide students withinformation about procrastination. In Chapter 3, we begin our discussion of the activeinterventions we explored with an overview of the reflective writing intervention. In Chapter4, we discuss our creation of a schedule sheet system implemented as a plugin to the Web-CAT grading system. In Chapter 5, we describe the email alert intervention setup, alsoimplemented as a plugin to the Web-CAT system. Chapter 6 evaluates each of our fourdifferent intervention groups (the three active alert groups described above and a fourthcontrol group). This evaluation includes examination of multiple time-based factors, suchas when a student started submitting work to Web-CAT and how early or late their finalsubmissions were. Chapter 6 also examines the impact of lateness on various project qualityindicators. Finally, Chapter 7 summarizes the research performed and discusses potentialfuture research that can be conducted on this subject.

Chapter 2
Literature Review
Procrastination impacts almost everyone, but its effect can be most acutely felt amongstudents [13]. There has been a significant amount of research done on procrastination.More important for this paper, the procrastination research includes studies on methodsto combat procrastination, particularly among students in computer science. This priorresearch was crucial in framing our approach to combat procrastination. But despite all ofthis work, procrastination is still a relatively poorly understood problem.
2.1 Procrastination Definition
When discussing procrastination the best place to begin is to define the phenomenon. Steeldescribes two connotations of the term procrastination [22]. One less commonly used de-scription of procrastination describes the behavior as a positive force. By delaying a decision,one can gain additional information to make a more informed decision [3].
However, we focus on the typical definition of procrastination. This is summarized by Steelas “to voluntarily delay an intended course of action despite expecting to be worse off for thedelay”. This definition ensures procrastination is treated differently from positive decisionavoidance, as one is expecting the delay will ultimately harm their outcome, rather thanenhance it [22]. Whenever we refer to procrastination in this paper, we mean this definition.
2.2 Historical References to Procrastination
Procrastination has long been identified as a problem in human behavior. In Steel’s metaanalysis of procrastination, he finds one of the earliest references to procrastination in thewritings of Hesiod. Hesiod was one of the first recorded Greek poets, assumed to have
4
Joshua D. Martin Chapter 2. Literature Review 5
been active between 750 B.C. and 650 B.C. His words directly warn against putting offone’s work until the next day, indicating procrastination was a problem even in ancientGreece. Steel also cites the famous Roman orator Cicero, who discussed procrastinationwhile speaking against his political rival Marcus Antonius. A slightly more recent referenceto procrastination comes from Samuel Johnson, who in 1751 described procrastination as“one of the general weaknesses, which, in spite of the instruction of moralists...prevail to agreater or lesser degree in every mind” [22].
Milgram wrote the first historical analysis on procrastination. He argued that procrastinationrose from the numerous commitments and deadlines required by technologically advancedsocieties. Agrarian societies, being undeveloped, did not suffer so much from procrastination[16]. Ferrari et al. made a similar argument, stating that procrastination was more acute insocieties that were industrialized, but that it existed throughout history [10].
2.3 Modern Procrastination Research
While procrastination has been studied since ancient times, it is still relatively poorly un-derstood. Several studies researched various aspects of procrastination, including causes,effects, and ways to prevent it. We summarize these potential causes, theories, and studiesin this section.
2.3.1 Causes
Steel describes numerous possible causes for procrastination [22]. One possible cause is re-lated to individual task characteristics. A study by Briody found about 50% of people statinga task characteristic caused their procrastination [6]. Researchers have examined two specifictask characteristics and their effect on procrastination: timing of rewards/punishments andaversiveness. Studies have shown that an event is less likely to impact one’s decision makingthe longer away it is in terms of time. As a result, time is often considered a prime cause forprocrastination. In addition, the aversiveness of a task also impacts the desire to completea task. Intuitively, more aversive tasks are less likely to be completed and more likely to beput off.
In addition to individual characteristics of a specific task, individual personality traits alsoseem to influence procrastination. There has been enough research to determine that ten-dency to procrastinate is an individual personality trait. Multiple tests have been developedto deduce the level of this trait. One such test, developed by Tuckman, was used in ourfeedback surveys to examine student procrastination tendency [24]. Additionally, Ellis andKnaus studied low frustration tolerance and its impact on procrastination. Their researchsuggested that this behavior is a main source of procrastination [18]. Irrational thinking alsoseems to play a role in procrastination, as research has shown strong correlation between

Joshua D. Martin Chapter 2. Literature Review 6
irrational beliefs and procrastination tendency [5].
2.3.2 Theories
The various causes examined to explain procrastination have led to researchers formulatingmany different theories to explain the behavior. Procrastinating on decisions has been the-orized as a way for people to avoid confrontations [11]. One study examined the impact ofparental procrastination on student behavior, and found that students tended to procras-tinate more than their parents. No concrete reason was given, but a few possibilities suchas parents being compelled to present themselves in a more favorable light to their children[15]. A study by Rothblum et al. examined academic procrastination and found that highprocrastinators had significantly lower behavioral measures of self control compared withlow procrastinators [17].
Perhaps one of the most complete theories of procrastination was proposed by Steel andKonig. They proposed a comprehensive theory of procrastination known as Temporal Moti-vation Theory (TMT). TMT attempts to incorporate motivational formulations with time.Specifically, TMT incorporates four different factors to describe one’s utility, or how desir-able a task is for an individual. TMT describes utility as a result of four factors: expectancy(E ), value (V ), delay (D), and sensitivity to delay (Γ). Taken together, E and V indicatehow desirable a task is. Both D and Γ capture how time influences the desire to work on atask. The greater the value of delay, the more likely one is to put off a task, therefore utilityshrinks. This is multiplied by one’s own individual sensitivity to delay. When combinedtogether, the following formula was defined:
Utility =E X V
ΓD
This formula captures how students prefer tasks that are enjoyable and can be completed,while tasks resulting in a far-off benefit are less preferred [22]. Steel demonstrates the validityof TMT by showing each of TMT’s four components strongly correlating with procrastina-tion. Our own research is based on this theory of procrastination.
2.4 Previous Efforts to Study Procrastination in the
Classroom
There have been several previous studies to examine procrastination’s impact in the class-room. These studies inspired some of our mechanisms to measure the reach of procrastina-tion. While many of the studies showed techniques that had some degree of success, theywere often infeasible to implement on a large scale.

Joshua D. Martin Chapter 2. Literature Review 7
2.4.1 Strategies for Achievement
Strategies for Achievement is elective course offered by the Ohio State University. Thecourse is designed to work as a behavioral intervention to assist students in developing andimplementing study skills and good time management. The course met for 4.5 hours perweek for 10 weeks. The course was not a traditional course, but instead was a hybrid mixof on-line and in-class content based on the Active Discovery and Participation throughTechnology instructional model (ADAPT). Most of the students taking the course werestruggling academically. One-third of the students had a GPA under 2.2 (on a 4 point scale)[26].
The results for the course were positive. The improvements in student ability were measuredin three different ways against a control group of other students at the university who didnot take the course. Three factors were measured: mean GPA of the same term, mean GPAof the same term without the study skills course grade, and GPA of the following term. Ineach of these terms, there was an increase in GPA compared to the control group [26].
While this technique shows clear success, it is obviously resource intensive. Instructors areneeded to run the course and students need extra time in their schedule to take the course.It would seem infeasible to make all students who struggle with procrastination take a courselike this, especially when so many students procrastinate.
2.4.2 Task Management Groups
Task management groups are another technique used to reduce procrastination. The tech-nique is targeted at students who are struggling with study tasks like preparing for an exam,and is commonly used at Dutch universities.
Typically, students meet in small groups ( 12 students) weekly for 1.5 hour long sessions.Groups are supervised by a student counselor. Students in the group split up long termtasks into short term goals which must be completed each week. This training helps studentsdevelop the necessary skills for managing long term goals [26].
Student feedback to these study groups is largely positive. Students joined the groupsbecause they were procrastinating (with an average score of 4.3 on a 1 to 5 procrastinationscale with 5 being the highest level of procrastination). Most participants left their groupsbecause they felt more confident in their own ability to not procrastinate. However, studieshave shown the groups did not eliminate procrastination behavior entirely. The groups seemto offer a way to keep procrastination at bay instead of a more comprehensive way of changingstudent behavior [26].

Joshua D. Martin Chapter 2. Literature Review 8
2.4.3 Extra Credit Opportunities
Another technique used to reduce student procrastination is to offer extra credit to studentsfor completing an assignment early. For example, computer science courses at VirginiaTech have sometimes given additional points to students who finish their work ahead ofthe deadline. This is a scalable incentive, making it an ideal way to potentially combatprocrastination.
However, a study analyzing the impact of giving extra credit for earlier work showed nosignificant difference in the time spent on a project between students who were offered extracredit and those who weren’t. In fact, a within subjects comparison of students showedstudents who were not offered extra credit actually submitted their work significantly earliercompared to when they were offered extra credit [1]. This indicates extra credit is not theidea solution we are looking for.
Furthermore, there are ethical concerns regarding the use of extra credit. There is a concernthat any extra credit awarded will be disproportionately earned by students who do notneed it. This can enlarge the gap between strong or high performing students and strugglingstudents. If this effect occurs, the bonus gained from extra credit can add a systemic biasthat further disadvantages struggling students [1]. This bias provides further evidence thatoffering extra credit is not an ideal solution when attempting to reduce procrastinationbehavior.
2.4.4 Web-CAT
A concept that influenced our own previous work is systematic data collection. This involvescollecting information from students as they develop a project, in order to better analyzetheir performance and check for signs of procrastination before it becomes a larger problem.In order to implement this collection, we use Web-CAT. Web-CAT is an automatic gradingtool that provides a number of assignment analysis and data collection capabilities basedon the Eclipse BIRT project [2] [12]. Web-CAT provides students with automatic feedbackeach time they submit a potential solution to an assignment, which encourages students tosubmit early and often. Furthermore, Web-CAT enables instructors to grade students basedon how they test their code. This enables instructors to allow unlimited submissions for aparticular assignment, while still teaching students the importance of code testing. Web-CAT also enables instructors to collect information about student progress throughout thelife of an assignment, as each submission for an assignment records information about thetime of submission, adherence to required coding standards, presence of required documen-tation, number of student tests written, number of student tests passed, statement coverageachieved, branch coverage achieved, and the size of the submission [8].
In an earlier experiment, Web-CAT was used to examine student performance. Specifically,Web-CAT data collected from 10 previous semesters was used to analyze student submission
Joshua D. Martin Chapter 2. Literature Review 9
behavior. This dataset was split into two groups, program submissions scoring in the A/Brange and submissions scoring in the C/D/F range. All students who performed exclusively inthe A/B or C/D/F range were removed from the set to isolate average performing studentsfrom consistently high or low performers. Using the remaining students, the differencebetween the first submission time for each group was examined. The A/B group had asignificantly earlier average first submission compared to the C/D/F group, with the A/Bgroup submitting 37.7 hours earlier than the other group [9].
This research demonstrates that students who start earlier on an assignment receive earliergrades than when they start later on an assignment. Such a result supports the importanceof starting work early, which further emphasizes the impact of student procrastination. Ifstudents who start earlier get higher grades than when they start later on assignments, it issafe to say procrastination can directly lead to lower grades on project assignments.

Chapter 3
Reflective Writing
The first intervention that we examined involved reflective writing. The specific interventionis inspired by active learning techniques. Reflective writing provides students with activereflection on their work while engaging students about their own time management behaviorand how it effects their performance. Students were given each writing assignment whena programming assignment was issued. Each writing assignment contained four promptswith questions regarding the time management and testing strategies the students wouldimplement. The writing assignments were submitted online using a one page form.
In this chapter, we provide specific information about the reflective writing intervention.This includes a discussion of active learning, how the reflective writing assignments wereimplemented, experimental details, and specific feedback that we received from studentsabout this intervention. We also examine common themes gathered from each reflectivewriting assignment response.
3.1 Background
The reflective writing intervention was inspired by the active learning technique called a“minute paper” [4][21]. The one-minute paper (OMP) is a short assignment typically as-signed at the end of a class by an instructor. The OMP traditionally asks a student twoquestions: “What was the most important thing you learned today” and“What questionwas not answered?” [21]. Students are suppose to finish these papers in a few minutes andinstructors collect and review the papers to address concerns in the next class.
OMPs can be modified in a number of ways, such as asking different questions, not gradingsubmissions, or making submissions anonymous. OMPs can also be performed in groups orassigned at different time frames during the class.
Students benefit from an OMP by being given an opportunity to voice potential concerns
10

Joshua D. Martin Chapter 3. Reflective Writing 11
with what they have learned. If a student feels they missed out on a particular concept, theinstructor will quickly learn of this by simply reviewing the OMP responses. For instructors,using OMPs offers an opportunity to examine how effective they were able to get conceptsacross to students. An OMP is an example of active learning, a technique in which studentsengage in activities to absorb classroom content. The assignment allows students who aredaunted by a large lecture to ask questions directly to the instructor. The instructor alsogets feedback on what students feel was the most important lesson from that day’s class. Butperhaps most critically, an OMP enables students to reflect on what they learned. This isimportant, as research has shown reflection to be an important component of adult learning.
There is significant evidence that the OMP has a positive impact on student work in theclassroom. Surveys of teachers indicate an OMP was viewed as a valuable mechanism toobtain timely feedback from students regarding their educational experience. Studies of stu-dent groups who completed an OMP versus those who didn’t showed that regular completionof OMPs was associated with a statistically significant gain on essay quiz performance [21].
3.2 Implementation
Instead of issuing a paper with a single prompt, the prompt was expanded to four ques-tions based on feedback from the instructors. Instead of giving the writing assignment inclass, students were instructed to complete their reflective writing assignments on-line, via aQualtrics survey. The surveys were collected shortly after each project’s due date had passed.The questions on each survey asked students to reflect on the time strategies implementedin their previous programming assignments and strategies they would implement for theirnext assignment. In the case of the first assignment, where students had yet to work onan assignment for the course, the response was focused on the last significant programmingproject completed in a previous semester. This led to the intervention being inspired by theoriginal use of an OMP, but it limited the “think/pair/share” concept that underpins thetraditional OMP implementation, as students were not necessarily in close proximity whenthe responses were written. However, this did allow the reflective writing responses to beeasily input by the student and collected by the instructor, as opposed to traditional, writtenresponses.
The four prompts listed for all of the reflective writing assignments can be found in AppendixB.
3.3 Experimental Design
To analyze the responses that we collected from the Qualtrics survey, we performed quali-tative analysis on the data. This entailed reading each of the survey responses and finding
Joshua D. Martin Chapter 3. Reflective Writing 12
common themes in the responses. These themes were used as codes to determine the mostcommon response content, and inform us about the typical impact of the interventions onstudents.
3.4 Student Response
3.4.1 Student Feedback
To assess student feedback on this treatment, we issued a survey to participants at the endof the semester. The survey questions were on a five point Likert scale, with 1 indicating thestudent “Strongly Disagreed” with the question, a 3 indicated the student had a “Neutral”opinion to the question, while a 5 indicated the student “Strongly Agreed” with the question.For some questions, a higher response score indicated the students viewed the treatmentpositively. For other questions, a higher score meant the student viewed the treatmentnegatively. We therefore used a normalized scale factoring in responses to all questions. Inthis scale, a number closer to 1 indicates a student was mostly pleased with the treatment,while a number closer to 0 indicates a student was mostly displeased with the treatment.The same survey was issued to all treatment groups after the semester finished.

Joshua D. Martin Chapter 3. Reflective Writing 13
Figure 3.1: The composite score responses to the feedback survey for the reflective writingtreatment. Values closer to 1 indicate greater appreciation for the treatment, while valuescloser to 0 indicate the opposite.
Figure 3.1 shows the composite score for each survey responder in the reflective writingtreatment group. The mean of these scores is 0.6, indicating that students in this group hada neutral opinion of the treatment. Analyzing the responses, students seem to agree that thetreatment helped them manage their own projects better, with around 59% of respondentsagreeing or strongly agreeing with that question. Students also seemed to disagree with theidea that the intervention was a waste of time, with 59% of students disagreeing or stronglydisagreeing with that question. Finally, when students were asked if the intervention causedthem to start at least one assignment sooner, 69% of students either agreed or stronglyagreed. This seems to indicate that students valued the impact of the reflection on theirwork.
3.4.2 Reflective Response Themes
Analyzing the responses each student submitted for the reflective writing responses, we findseveral common themes in each of the questions. We list each theme for the questions below.

Joshua D. Martin Chapter 3. Reflective Writing 14
Note that each response could contain multiple themes.
The themes for question one and question three were nearly identical, as each theme relatedto time management strategies used by the students. We list these themes below:
• Early Start - Responses with this theme indicated a key element of strategy was tostart early on an assignment. The actual time varied from student to student, but eachresponse focused on the importance of more time to complete an assignment. (64%)
• Teamwork - Responses with this theme emphasized working with teammates to com-plete a project. This includes good teamwork communication, managing code usingversion control, pair-programming, and other techniques. (18%)
• Design/Plan/Schedule - Responses with this theme described the importance of plan-ning one’s work ahead of time. This included the use of schedules to set goals, ordesigning a solution before beginning to code. (18%)
• Visit TA or Office Hours - Responses with this theme emphasized the importanceof asking the course TA questions and visiting office hours to talk with the courseinstructor. (16%)
• No Plan - Responses with this theme did not use a time management plan. Studentsfrequently complained of rushing at the end of a project and suffering from poor per-formance due to procrastination, although a few students indicated the lack of timemanagement did not matter. (9%)
• Code and Test - Responses with this theme reported writing a small amount of code andthen immediately testing it. Some responses reported using test driven developmentinstead. (8%)
• Split up work - Responses with this theme described splitting up work into smallerchunks to make working on a large assignment easier. (7%)
Question two asked students how effective their testing strategy was for the previous project.We found the most common themes in the responses to this question and list them below:
• Effective Strategy - These responses indicated students felt their time managementstrategy was effective in producing a solution. (60%)
• Good Quality - Responses in this category indicated their strategy yielded a solutionwith good code quality. (50%)
• In-effective Strategy - These responses indicated students felt their time managementstrategy was in-effective in producing a solution. (37%)

Joshua D. Martin Chapter 3. Reflective Writing 15
• Poor Quality - These responses indicated the time management strategy used yieldedsolutions with poor code quality. (27%)
• Lack of Stress - These responses indicated the time management strategy used led toa less stressful project experience. (19%)
• Hardship - These responses indicated the time management strategy used led studentsto face significant hardship or stress while working on a project. (13%)
Students responded to question four by stating what testing strategy they planned to use onthe upcoming project. We found the most common themes in these responses and list thembelow:
• Iterative Testing - Responses with this theme emphasized a “test as you code” strategy.(54%)
• Test Earlier and More - Responses with this theme emphasized testing earlier in thedevelopment cycle and writing more tests overall. (27%)
• Unit Testing - Responses with this theme explicitly indicated the importance of unittesting in their testing strategy. (12%)
• No Plan - Responses with this theme emphasized a lack of test plan. Some responsesindicated brute forcing a test by calling functions with different inputs manually. Oth-ers discussed writing tests after finishing the project code. (6%)
• Teamwork - Responses with this theme place emphasis on testing with team members.This included a variety of strategies such as separating development and testing, orhaving each team member write separate tests for different units of code. (6%)

Joshua D. Martin Chapter 3. Reflective Writing 16
Figure 3.2: The breakdown of responses related to time management strategy combined forquestion 1 and 3.

Joshua D. Martin Chapter 3. Reflective Writing 17
Figure 3.3: The breakdown of responses to question 3.
Examining these numbers, we seem to find that students understand good time manage-ment techniques, but typically fail to incorporate these skills when working on programmingprojects. For example, many students reported understanding the value of starting theirwork early, with 64% of all responses across both question 1 and 3 mentioning this theme.However, analyzing just question 3 (asking students their strategy for the next assignment),we find a large number of students mentioning they plan to start early because they hada negative experience while working on their last assignment. Furthermore, in 27% of re-sponses for question 1 students indicated they procrastinated on their previous assignment.This contrasts with the 2% of responses for question 3 that indicated students planned tostart late on their work for the next assignment.
Figure 3.3 shows the breakdown of responses related to what time management strategystudents mentioned for question 3. This graph shows what percentage of responses mentioned

Joshua D. Martin Chapter 3. Reflective Writing 18
a strategy because a student had a positive experience with their previous project, or whichstudents are planing to change to a new strategy because their previous strategy failed.“Positive” responses indicate the student is planning to use the time management strategy forthe next project because it worked well form the on the previous one. “Negative” responsesindicate students are planning to use the strategy because they had a negative experienceon the last project and are trying to change their behavior
Analysis of the concrete impact of this intervention (based on when students began or finishedtheir work) can be found in the evaluation chapter.

Chapter 4
Schedule Sheets
Our second active intervention uses schedule sheets. The use of schedule sheets in computerscience classrooms is not new. Virginia Tech’s own computer science course instructors havepreviously used schedule sheets in our advanced data structures course. The schedules werebased on Spolsky’s “painless schedule” sheets [20]. Survey data collected to measure studentresponses to the schedules indicate feelings toward the technique are mixed. The purposeof these sheets is to assist in the development of time management skills, forcing studentsto consider how they will break a large project up into smaller pieces. It also encouragesstudents to self-monitor their own progress and track their pace throughout a semester.
4.1 Background
The concept behind using schedule sheets in a course is to break down each programmingassignment into different tasks, with each task representing some functionality required tomake the project work. In a previous experiment using schedules, students were given leewaywith the of creation of the tasks and sub-tasks that made up the entire schedule. Studentswere required to create the schedules in mind with their partner, as pair programming wasalso necessitated for the course. Therefore, other columns on the sheets were dedicated toindicating which student in the pair would be responsible for what task. Additional columnsincluded the self-imposed deadline for the task, the expected amount of time the task wouldtake, the time spent so far on the task, and the expected time remaining on the task [19].
This experiment examined multiple factors examining how the use of schedule sheets im-pacted the time management of students. The research found students who turned in all oftheir schedules achieved a significantly higher score compared to students who omitted theirschedules. Furthermore, the students who scored below the class mean put in less than 50%of their initial work before the final week of the project, while the vast majority of studentswho scored above the class mean put in more than 37% of the initial work before the final
19
Joshua D. Martin Chapter 4. Schedule Sheets 20
week. While these results seemed to indicate schedules assisted in making students managetheir time better, the sheets did not have any significant impact on overall class performance[19].
4.2 Implementation
Our own implementation for schedule sheets was designed to be easily scalable across anysize classroom. In order to effectively administer the schedules and accomplish this task, wedesigned and implemented an electronic schedule sheet entry system for students to submittheir schedules online. There are a number of advantages to integrating the schedules intoan electronic system. The first is convenience for the student. Submitting electronicallymeans students can always view their own schedules without the need to make a physicalcopy. Students are also able to easily adjust their schedules to accommodate plan changes.Another advantage of an electronic schedule sheet system is immediate feedback. Schedulessubmitted online can provide students with feedback on the feasibility of their schedules.This helps ensure that students create realistic schedules and do not work on the basis of aflawed time plan.
In order to provide students with accurate schedule feedback, we implemented our sched-ule sheet system as a Web-CAT plugin. Because Web-CAT stores information about eachassignment and project submission, our schedule sheet plugin can view deadlines, examineexpected amounts of work versus a student’s scheduled amount of work, and other factors.
The schedule sheet plugin works similarly to the previous paper schedule sheets. Students listthe components or features that they expect their solution will contain. Each componentor feature has three separate activities associated with its implementation: design, code,test. Students list the estimated time to complete these activities as well as their anticipateddeadlines. After filling in all requisite information, the students can check their work bypressing a button. This begins an analysis by the system, which performs sanity checks onthe student’s proposed schedule. All of the checks are designed to inform the student of thefeasibility of their schedule. This includes determining if a student has scheduled more workthat is reasonable between the current date and their proposed deadline for each component.Additional checks examine if a schedule has either too few or too many components and if theschedule has all expected components completed before the project deadline. Once a studentis finished modifying the schedule, they submit it through the system and a final validationcheck is performed. The entire instructions for creating and modifying these schedules canbe found in Appendix C.
On subsequent schedule sheets, students are asked about the actual time spent on eachactivity for the components and if the activity is finished. They then input new estimatesfor time spent on each activity and new personal deadlines. The sanity checks performedon the first schedule sheet submission are then repeated on the modified schedule. When

Joshua D. Martin Chapter 4. Schedule Sheets 21
the student finally turns in a project solution, they subsequently turn in a final schedulerepresenting the actual amount of time worked on a given project.
The major benefit to this new implementation of the schedule sheet intervention is theadditional data generated by each schedule sheet submission. Whenever the sanity checksare run on a potential schedule, information about that schedule is saved, including any errorsor warnings generated by the checks. This provides valuable data to instructors regardingthe effectiveness of the intervention. By providing immediate feedback on schedules, studentscan modify their work habits immediately instead of after receiving their project grade.
4.3 Experimental Design
In our experiment with schedule sheets, we assigned one section of CS3114 at Virginia Techto serve as the experimental section for this intervention during Fall 2014. Each project inthis course lasted for approximately four weeks from the initial project handout to the finalsubmission deadline. The students were required to fill out an initial schedule sheet shortlyafter each project was first assigned. Typically this schedule sheet was due within a week ofthe project being assigned. Students also turned in an intermediate schedule sheet, typicallya week before the project was due. As discussed in the previous chapter, this schedule sheetassignment allows students to update their estimates and pieces of work. A final schedulesheet is required after the project has been turned in to list the actual hours worked andfinal components finished.
The intent with these schedule sheets is to assist students with managing deadlines. By uti-lizing schedule sheets, students will form, express, manage, and track smaller-scale deadlinesthemselves. Based on the TMT theory of procrastination, tasks that have a deadline duelater will make that task less attractive for one to put effort in. This helps to eliminate thefar off deadline research has shown to negatively impact student will to complete a task [22].The schedule sheet system will, ideally, provide students with a visualized task breakdownto see a project as a set of individual tasks rather than a monolithic unit.
In order to examine if this intervention worked, we need to gather data on how studentsused the sheets and their work behavior over the semester. Collecting data from these sheetswas relatively simple due to the design of the system. When students pressed the “checkmy work” button to receive immediate feedback, the data collection saved off informationregarding the warnings or errors students received. This information was invaluable becauseit enabled analysis of the specific intervention in addition to the overall impact on latenessand performance. Gathering information on errors and warnings related to the schedulegives us the ability to see how students were trying to use schedules, not just the lateness ofindividual tasks.
The design of the schedule sheet system meant that schedule accuracy was limited to infor-mation that the students volunteered. The instructors noticed early on that some students

Joshua D. Martin Chapter 4. Schedule Sheets 22
tried to abuse the schedules by inputting incorrect schedule information or schedules thatobviously did not reflect reality. In an attempt to mitigate this, we updated our sanity checksto include additional verification regarding schedules. Ultimately, students were required toself-report the time spent on each component of their project. This information may or maynot be accurate, and there is little that an instructor can do to verify it.
4.4 Student Response
4.4.1 Student Feedback
For assessment of student feedback, we used the exact same survey given to the reflectivewriting treatment group to gain insight into the student opinion of the treatment.
Figure 4.1: The composite score responses to the feedback survey for the schedule sheettreatment. Values closer to 1 indicate greater appreciation for the treatment, while valuescloser to 0 indicate the opposite.
This figure shows the composite score for the survey responses in the schedule sheet treatment
Joshua D. Martin Chapter 4. Schedule Sheets 23
group. The mean composite score for respondents was 0.45, indicating a negative responseto the treatment by students.
Around 55% of respondents disagreed or strongly disagreed that the intervention helpedthem manage their own projects better. Additionally, 55% of respondents agreed or stronglyagreed that the intervention was a waste of time. Finally, 48% of respondents disagreed orstrongly disagreed that the treatment caused them to start their next assignment earlier.The survey data indicates that, while some students received benefit from the intervention,others felt no assistance from it.
4.4.2 Schedule Accuracy
Figure 4.2: The scheduled time across all projects (in hours) compared to the final timeactually recorded.
While each individual project differed in complexity, the average initial estimate for theamount of work required to complete a project ranged from 35 hours to 54 hours. On average,students underestimated the amount of work required for a project, with 72% of studentsfacing this problem. Oddly, instead of improving schedule accuracy with the intermediateschedule, students typically increased their underestimation. This meant final time reported
Joshua D. Martin Chapter 4. Schedule Sheets 24
was, on average, much greater than students anticipated. These results are visualized inFigure 4.2.
Examining the impact of the accuracy of the final submitted sheet on the time studentssubmitted their projects to Web-CAT, we find a significant relationship between these factors(F ratio = 17.79, P <0.0001). Students who underestimated their work typically submittedtheir solutions later, while students who overestimated their work typically submitted theirsolutions earlier.
Ideally, students would get better at making schedules as they progressed throughout thesemester. This would indicate students learned how to create more accurate schedule bylearning from their mistakes on earlier schedules. We did find the accuracy of a schedule wassignificantly related to the individual assignment the schedule was created for (F ratio =10.41, P <0.0001). Students typically had the largest underestimation of work for the firstproject, followed by a slightly smaller underestimation for the second project. The rest ofthe projects had smaller underestimations. While this would initially seem to support theidea students created better schedules as the semester went on, this analysis did not accountfor the differences in project difficulty. One would expect certain projects would be moredifficult for students to accurately estimate the amount of work required compared to others.
4.4.3 Schedule Errors
Despite extensive error checking logic, only two types of errors were recorded for the schedulesstudents submitted. The first error notified students that an updated personal deadline wasneeded for an incomplete activity. The other notified students a component or feature wastoo large, indicating the student had not appropriately split up their work. The distributionof the number errors was extremely uneven. The median number of errors for the first errorrecorded was 0 (compared with a mean of 2), and the number required to reach the 90%mark was 6. For the second error type, the median number of errors was 2 (with the meanbeing 3). The mean number of errors for the sheets saw a significant drop off for the finalsubmission, with mean number dropping to less than 1 for the first error type and the meanequaling 1 for the second error type.

Chapter 5
E-mail Alerts
Our third intervention used e-mail alerts to automatically send an alert to students at pre-determined times before a project is due. Each alert is custom generated for the intendedstudent (or student pair if two students are working on a project jointly), and contains in-formation regarding what progress had been made on the project. The alert also containsgeneric feedback based on the assessed progress, including if a student is at risk of poorperformance on the project due to procrastination.
5.1 Background
Previous research has shown that instructors admonishing their students to start program-ming projects early and spread their workload throughout the project time frame has littleimpact on student behavior. The limitations of instructor advice helped to inspire our uniqueapproach to project feedback. Our goal with the active intervention system was to providebetter feedback directly to students through the life cycle of a project. By giving students ac-curate and up-to-date information about the shortcomings of their effort at a given time, wehoped to overcome the inherent limits an instructor has when advising students to completework early. It is infeasible for an instructor in a class of 70 - 90 students to give personalizedadvice for all students.
As discussed previously, procrastination is ultimately a failure of self-regulation. By provid-ing students with up-to-date information regarding their efforts on a particular programmingproject, we hoped that student attention towards self-regulation would increase. Studentsreceiving these alerts would immediately understand the impact of their choices on theirproject grades, as each alert would specify effort, or lack there of, on particular elements ofsolutions submitted so far.
Furthermore, we hope that the alerts would enable students to contextualize their own
25

Joshua D. Martin Chapter 5. Email Alerts 26
progress on a project with the progress expected from them. It can be difficult for computerscience students to know exactly how much effort is required to make good progress towardsa project solution. Providing alerts that explain to students the effort required to makesuch progress will enable students to see where their performance fits into the larger goal ofproject completion. It is reasonable to assume this new-found contextualization of projectprogress will also increase a student’s expectation of successfully completing a task. Steel’sTMT suggests this approach will reduce the tendency of a student to procrastinate on atask.
5.2 Implementation
In order to implement the e-mail alert intervention effectively, we needed accurate and up-to-date information about a student’s latest submission for a project. By using Web-CAT,we were able to collect this information with relative ease. Each submission to Web-CATprovides an instructor with a wealth of information. This includes lines of code written, unittest coverage, style adherence, and other facts. Therefore we integrated the intervention intoWeb-CAT to take advantage of this data when evaluating the system.
The first step to generate an email alert comes from a static analysis of the Web-CATsubmission itself. Based upon this submission, we analyzed four different factors of studentprogress. These factors were the amount of code written (relative to a specific target size),the proportion of instructor written reference tests passed, the degree of testing performed,and the number of static analysis checks failed.
Based upon these values, a student’s code was ranked according to a five point internal scale.A “Good” rating indicated that the student was making sufficient progress towards a viableproject solution. A “Neutral” rating indicated the student was performing to the baselineexpectations for the amount of time remaining. A “Bad” rating indicated the student was notmaking sufficient progress towards a working solution given the amount of time remaining onthe project. A “Poor” rating indicated a student was making almost no progress, perhapsmaking only a few submissions to Web-CAT before the alert was sent. An “Undefined”rating indicated a student had yet to make any project submissions.
These ratings were only used for internal logic to generate a custom email alert. There weretwo options for the e-mail subject header, depending on the students progress. If studentprogress was deemed adequate overall, the subject line would be phrased as: “CS 3114:Your progress on Project 2”. If progress was not deemed satisfactory, the subject line wouldinstead be phrased as: “CS 3114: You may be at risk on Project 2”. Finally, a studentwho did not make satisfactory progress and was very close to the deadline would receivethe following message: “CS 3114: You are at risk on Project 2”. These subject lines weredesigned to strike a balance between drawing students to read and notice the alerts whilesimultaneously avoiding needlessly scaring them.

Joshua D. Martin Chapter 5. Email Alerts 27
The body of each message was tailored based on the ratings assigned during the analysisphase. Examples of alerts received by students are included in Appendix A.
5.3 Experimental Design
Collecting data from the email alerts was a simple process because of the alert integrationinto Web-CAT. Each time an alert was sent, it was tied to a particular Web-CAT submissionfrom the student or student pair working on the project. If a student (or student pair) didnot submit any work at the time the alert was sent, the submission object would be null.
Each submission object contains a wide variety of information related to the work performedon a project. This information was not only used to generate each alert, but it was also usedas data to discover if this intervention positively impacts student procrastination. Data wecollected from the submissions showed when students made their first submission, how muchcode was contained in that submission, and if students submitted earlier as the semesterwent along. We examine such data in the next chapter.
5.4 Student Response
5.4.1 Student Feedback
To assess student feedback for the treatment, we issued the same survey given to the othertwo treatment groups at the end of the semester. Students were asked to answer eachquestion on a five point Likert scale, with one corresponding to “Strongly Disagree” and fivecorresponding to “Strongly Agree”. To make statistical analysis of the survey data easier, weused a normalized scale to indicate how positive or negative a student viewed the treatment.A score closer 1.0 indicates a student viewed the treatment positively, while a score closerto 0 indicates a student viewed the treatment negatively.

Joshua D. Martin Chapter 5. Email Alerts 28
Figure 5.1: The composite score responses to the feedback survey for the e-mail alert treat-ment. Values closer to 1 indicate greater appreciation for the treatment, while values closerto 0 indicate the opposite.
Figure 5.1 shows the composite score for each survey response in the e-mail alert treatment.The mean composite score was 0.41, indicating a negative response by students for thistreatment.
Overall, student responses to the e-mail alert treatment were negative. 56% of respondentsindicated they disagreed or strongly disagreed that the intervention helped them managetheir own projects better. Additionally, 62% of respondents agreed or strongly agreed thee-mail alert intervention was a waste of time. Finally, 44% of respondents agreed or stronglyagreed that the intervention caused them to start their next assignment earlier.

Joshua D. Martin Chapter 5. Email Alerts 29
5.4.2 Alert Analysis
Students who received the e-mail alerts typically received a set of three alerts: one sevendays before the assignment due date, one four days before the due date, and one two daysbefore the due date. Two of the assignments had an additional alert sent out ten days beforethe project was due.
The majority of the e-mails sent out contained the “form letter” response for an undefinedsubmission because the students had yet to submit their work to Web-CAT. In fact, only6–18% of students had made a Web-CAT submission one week before the project deadline.Four days before the deadline, 17–33% of students made a submission. That number grewto almost half of students by two days before the deadline.
We found that students who had made at least one Web-CAT submission when there werefour days before the deadline had a significantly higher project grade than students who didnot have a Web-CAT submission by that point (F ratio = 12.9, P = 0.0004). This gradecomparison did not include any extra credit incentives for those who submitted early.
Chapter 6
Evaluation
To analyze the data that we collected, we used a variety of statistical tests and comparisonsto examine multiple potential intervention impacts. Our primary purpose was to examine ifany of the interventions positively impacted the timelines of student work. Our hypothesiswas students in the treatment groups would show less late submissions and more earliersubmissions compared to the control group.
Additionally, we examined the impact of lateness on different dimensions of project submis-sions. Prior research indicates late work often receives lower scores across these dimensions[9], and we wanted to confirm this link existed in our own study.
To define lateness, we split each final submission into three categories reflecting the on-timestatus of that project submission. Projects submitted more than 24 hours before the deadlinewere marked as “early”, projects submitted within 24 hours of the deadline were marked as“on-time”, while projects submitted after the deadline were marked as “late”.
Our dataset consisted of 330 students across four sections of a junior-level data structurescourse. These sections were split between Fall 2013 and Fall 2014, with the control andreflective writing groups falling in the former while the schedule sheet and e-mail alertgroups fell into the later. The students consented to us using their data in the study. Eachtreatment group completed four different programming projects. The projects had varyingdegrees of difficulty, with projects 1 and 3 being somewhat less complex, while projects 2and 4 were somewhat more complex. All of the treatment groups were given the exact sameassignments within the same semester, but between semesters the assignments were different.However, they were still designed to be of comparable difficulty. The same instructor taughtall of the treatment groups.
For all the projects offered in each section, students were offered a 10% extra credit bonusfor completing their assignments at least 24 hours before the project deadline. There wasno corresponding penalty for late work, but students were given a “time bank” of late daysto self grant a 1 day extension on an assignment deadline. Students received a small, fixed
30
Joshua D. Martin Chapter 6. Evaluation 31
amount of these “bank days”, but if a student used all of these days, late work would be nolonger accepted.
In order to more accurately analyze the dataset, our main analysis only examined studentswho completed all four project and did not drop or withdraw from the course. The ideabehind this was to eliminate the impact of any student who did not place any effort into aproject, which would skew our results. The number of students who fell into this categoryamounted to 82, which represented 25% of the population. The amount of students whodropped or withdrew was much larger in the 2014 semester, with 78% of the students removedfrom our analysis belonging to that semester. In terms of the number of projects, thetotal dataset represented 1142 project submissions. Our reduction decreased the number ofprojects to 992, roughly a 13% reduction in total project amount. After the reductions, thesize of each treatment group remained roughly equal (control N = 60, reflective writing N =64, schedule sheets N = 59, e-mail alerts N = 65).
In an attempt to limit the impact of external factors on our analysis, we also split thedata into quartiles based on the final numeric semester score assigned to each student. Thegoal of this split was to perform analysis between students of similar capability. We chosethe final semester score students received because we felt it best represented a student’sentire capability, as the final score of the course took into account project scores and examscores. In each section of our analysis, we first performed analysis on the reduced datasetand then subsequently performed analysis within quartiles of this group. Analyzing withineach quartile is a within subjects comparison, and reduces the bias the “good student effect”might have on our results.
Some of the analysis comparisons we ran indicated the semester had a significant bias onthe factors we were analyzing. When we saw this influence occur, we performed another,separate analysis to confirm that fact and see if there were significant differences within eachsemester. We also discuss possible reasons for this semester bias.
6.1 Intervention Analysis
In this section, we summarize the analysis that we performed on the impact of each inter-vention. Specifically, we focus on measuring intervention treatments with respect to timeand submission attributes such as project size or reference test pass rate. The submissionattributes were gathered by examining statistics collected by Web-CAT for each submission.
Joshua D. Martin Chapter 6. Evaluation 32
6.1.1 Interventions Impact on On-time Status
Figure 6.1: The distribution of on-time status against each treatment group.
We analyzed the impact of each intervention on the on-time status across the submissions inour dataset. As mentioned before, the on-time status of a submission records if that submis-sion was submitted early, on-time, or late compared to that project’s deadline. Analysis ofthese variables indicated a significant relationship between treatment group and the on-timestatus of submissions (χ2 = 12.69, P <0.005). Examination within each treatment parameterusing a Tukey honest significant difference (HSD) test shows the e-mail alert treatment grouphad a significantly larger early percentage than the control treatment, while the schedulesheet and the reflective writing treatments did not have an observable impact.
Joshua D. Martin Chapter 6. Evaluation 33
Figure 6.2: On-time status within all quartiles for each treatment group.
Analyzing the impact of each intervention on on-time status within specific quartiles, wefind a significant relationship within certain quartiles. Specifically, we find a significantrelationship between intervention and on-time status in the upper-middle quartile (χ2 =25.41, P <0.0004) and the upper quartile (χ2 = 17.34, P <0.009). We do not find anyobservable intervention impact on on-time status for the lower quartile and the lower-middlequartile.
These results seem to show the e-mail alert positively impacting when student submit theirwork. But the lack of an observable impact on the lower and lower-middle quartile couldindicate that all of the interventions are not effective in lower-performing students.
Joshua D. Martin Chapter 6. Evaluation 34
6.1.2 Intervention Impact on First Submission Time
Figure 6.3: The mean first submission offset (calculated by subtracting the time of the firstsubmission from the due date). A larger value indicates an earlier first submission.
We analyzed the impact of each intervention on when students made their first submissionto Web-CAT. This was calculated by subtracting the due date time from the first submissiontime, set to days. Overall, we find a significant relationship between treatment group and firstsubmission time (F ratio = 24.51, P <.0001). A Tukey HSD test shows the schedule sheetintervention had a significantly earlier first submission time than all other treatment groups,while both the e-mail alert intervention and reflective writing intervention had significantlyearlier submissions compared to the control group. We should note that students in thesection assigned the schedule sheet intervention were required to make a submission to Web-CAT early in the project window, which explains the significance relationship found in thattreatment.

Joshua D. Martin Chapter 6. Evaluation 35
Figure 6.4: First submission time within all quartiles for each treatment group.
Analyzing the impact of intervention on the first submission time within quartiles, we finda significant relationship in each quartile. Specifically, we found this in the lower quartile(F ratio = 5.44, P <.001); lower-middle quartile (F ratio = 7.75, P <.0001); upper-middlequartile (F ratio = 8.98, P <.0001), and upper quartile (F ratio = 7.36, P <.0001).
The result we find here shows a positive impact for all of the interventions. Having allthree interventions show a significantly earlier submission time compared to the controltreatment is an indication these interventions are influencing students to start their workearlier. This is very definition of procrastination reduction. However, the results are skewedby the requirement of the schedule sheet treatment group to make a submission to Web-CATsoon after the projects were assigned.

Joshua D. Martin Chapter 6. Evaluation 36
6.1.3 Intervention Impact on Final Submission Time
Figure 6.5: The final submission values (in days) per treatment group. A negative valueindicates that the submission time was before the deadline, and a positive value indicatesthat the submission time was after the deadline.
We now analyze intervention impact on submission time by examining the impact of eachintervention on the final submission time of a project. This serves as a continuous value foron-time status. Instead of putting project submissions into three discrete bins as we do withon-time status, we measure the final submission time as the raw value a student actuallysubmitted. Analysis yields a relationship that is significant (F ratio = 3.67, P <0.012).A Tukey HSD test to examine each separate treatment group shows that the e-mail alertintervention had a significantly earlier final submission time when compared to the controltreatment. There was no observable impact on final submission time for any other treatmentgroup.

Joshua D. Martin Chapter 6. Evaluation 37
Analyzing the impact of each intervention on the final submission time within each quartile,we find almost no observable impact. The only quartile that did show a significant relation-ship was the upper-middle treatment (F ratio = 2.90, P <0.035). A Tukey HSD test withinthis quartile revealed no observable difference between the intervention groups.
These results are positive for the e-mail alert intervention. The significant relationships wereexpected due to the significant relationship found between on-time status and interventionalready. But the lack of a significant relationship between final submission time and inter-vention within any quartile shows the impact of treatment might be influenced by inherentstudent quality, not just the intervention.
6.1.4 Intervention Impact on Solution Correctness
Figure 6.6: Correctness score for each treatment group.
Analyzing the impact of intervention on the correctness score earned by a submission, wefind a significant relationship (F ratio = 13.87, P <0.0001). Using a Tukey HSD test tocompare the effects of the different treatments, we find the schedule sheet treatment grouphad a significantly higher correctness score compared with all other treatment groups.
Expanding our analysis to examine the correctness score within each quartile, we find asignificant relationship in the lower-middle (F ratio = 3.86, P <0.01), the upper-middle (Fratio = 6.73, P <0.0002), and the upper quartiles (F ratio = 5.29, P <0.002). Using a

Joshua D. Martin Chapter 6. Evaluation 38
Tukey HSD test to compare treatments within each quartile, we found the schedule sheettreatment had a significantly higher correctness score compared to the control group. Thisindicates that the impact of intervention on correctness was significant despite inherentstudent capability.
Examining the overall graph of solution correctness, it seems the semester has a significantimpact on the correctness score range. In particular, the treatment groups for Fall 2013 (thereflective writing and control groups) had a very small third quartile range of correctness scorevalue. To check this, we split our analysis by semester to examine the treatment groups intheir own semesters. We found a significant relationship between treatment and correctnessin Fall 2014 (F ratio = 10.08, P <.002) but we did not find a significant relationship in Fall2013 (F ratio = 0.21, P <0.65). This confirms that semester did indeed have an influence onthese results. This is because the solution correctness score is influenced by the reference testscore, which also shows a semester influence. We described this influence when we analyzethe impact of treatment on the reference test pass rate.
Overall, these results are positive for the schedule sheet treatment. Based on the initialanalysis and the quartile analysis, it seems the schedule sheet treatment is positively im-pacting the quality of project solutions. But our results are certainly being influenced bywhich semester the treatments were issued in, which must be accounted for.
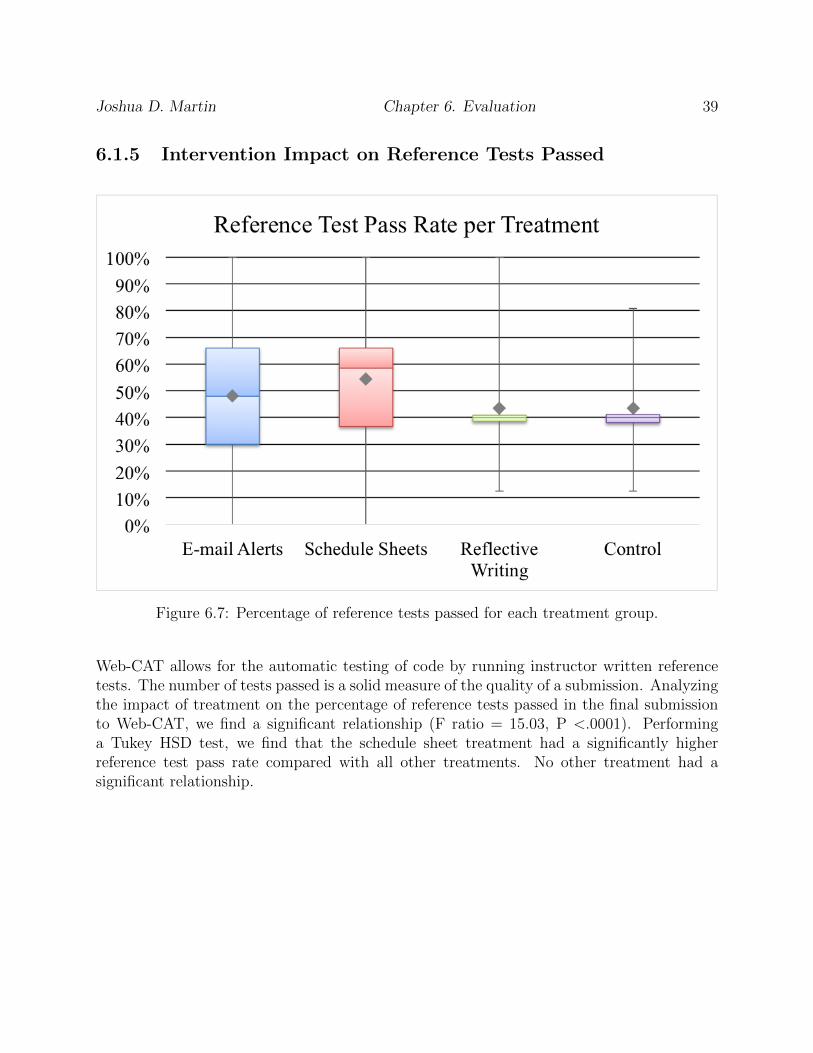
Joshua D. Martin Chapter 6. Evaluation 39
6.1.5 Intervention Impact on Reference Tests Passed
Figure 6.7: Percentage of reference tests passed for each treatment group.
Web-CAT allows for the automatic testing of code by running instructor written referencetests. The number of tests passed is a solid measure of the quality of a submission. Analyzingthe impact of treatment on the percentage of reference tests passed in the final submissionto Web-CAT, we find a significant relationship (F ratio = 15.03, P <.0001). Performinga Tukey HSD test, we find that the schedule sheet treatment had a significantly higherreference test pass rate compared with all other treatments. No other treatment had asignificant relationship.
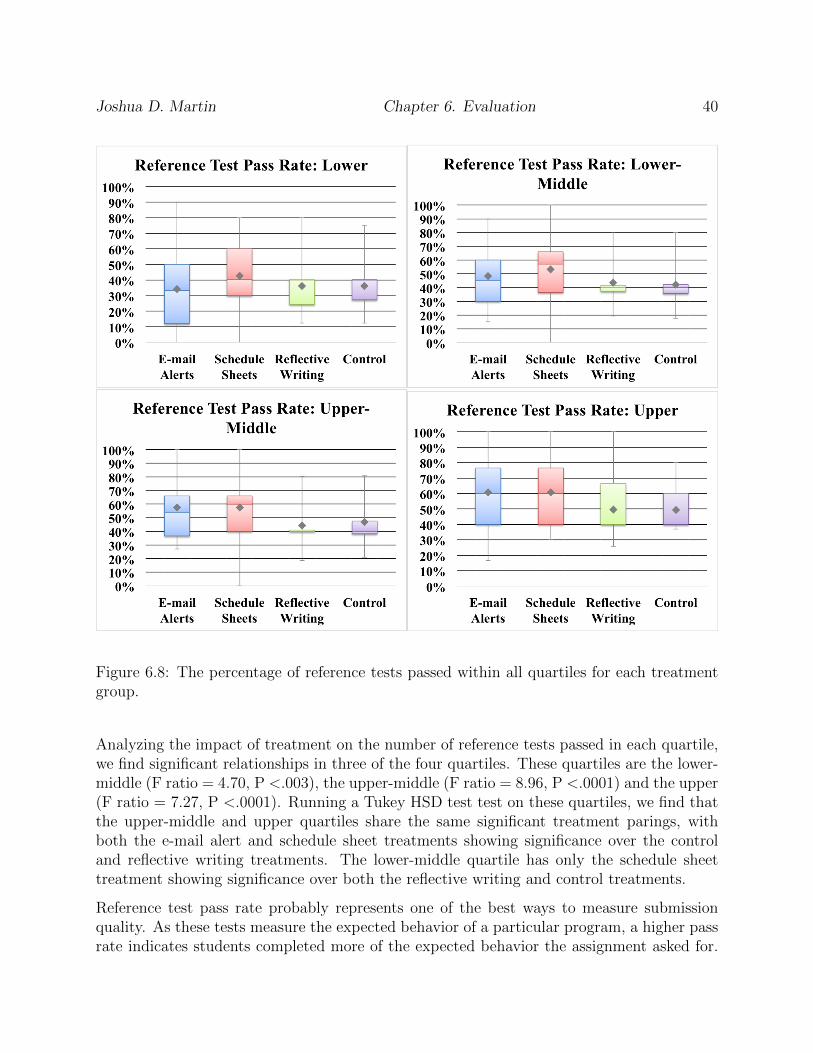
Joshua D. Martin Chapter 6. Evaluation 40
Figure 6.8: The percentage of reference tests passed within all quartiles for each treatmentgroup.
Analyzing the impact of treatment on the number of reference tests passed in each quartile,we find significant relationships in three of the four quartiles. These quartiles are the lower-middle (F ratio = 4.70, P <.003), the upper-middle (F ratio = 8.96, P <.0001) and the upper(F ratio = 7.27, P <.0001). Running a Tukey HSD test test on these quartiles, we find thatthe upper-middle and upper quartiles share the same significant treatment parings, withboth the e-mail alert and schedule sheet treatments showing significance over the controland reflective writing treatments. The lower-middle quartile has only the schedule sheettreatment showing significance over both the reflective writing and control treatments.
Reference test pass rate probably represents one of the best ways to measure submissionquality. As these tests measure the expected behavior of a particular program, a higher passrate indicates students completed more of the expected behavior the assignment asked for.
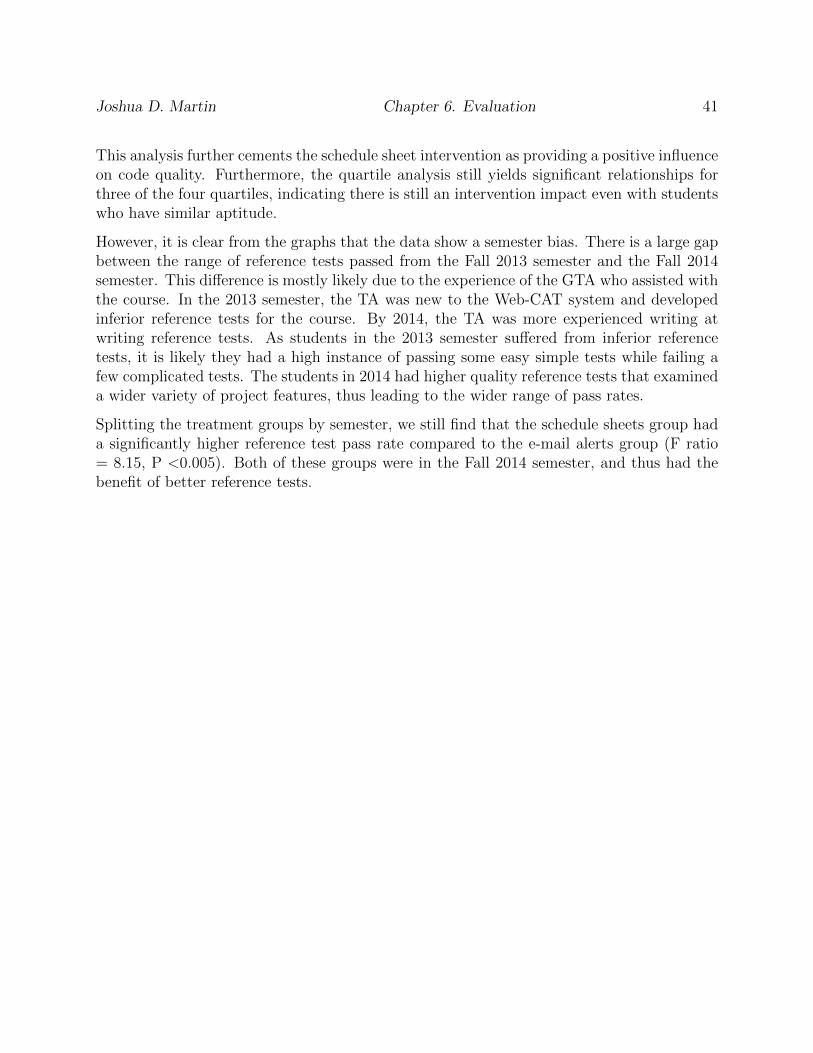
Joshua D. Martin Chapter 6. Evaluation 41
This analysis further cements the schedule sheet intervention as providing a positive influenceon code quality. Furthermore, the quartile analysis still yields significant relationships forthree of the four quartiles, indicating there is still an intervention impact even with studentswho have similar aptitude.
However, it is clear from the graphs that the data show a semester bias. There is a large gapbetween the range of reference tests passed from the Fall 2013 semester and the Fall 2014semester. This difference is mostly likely due to the experience of the GTA who assisted withthe course. In the 2013 semester, the TA was new to the Web-CAT system and developedinferior reference tests for the course. By 2014, the TA was more experienced writing atwriting reference tests. As students in the 2013 semester suffered from inferior referencetests, it is likely they had a high instance of passing some easy simple tests while failing afew complicated tests. The students in 2014 had higher quality reference tests that examineda wider variety of project features, thus leading to the wider range of pass rates.
Splitting the treatment groups by semester, we still find that the schedule sheets group hada significantly higher reference test pass rate compared to the e-mail alerts group (F ratio= 8.15, P <0.005). Both of these groups were in the Fall 2014 semester, and thus had thebenefit of better reference tests.

Joshua D. Martin Chapter 6. Evaluation 42
6.1.6 Intervention Impact on Coverage Achieved
Figure 6.9: Percentage of test coverage achieved for each treatment group.
When analyzing the impact of each intervention on the coverage achieved over tests, we finda significant relationship (F ratio = 3.79, P <.01). Performing a Tukey HSD test, we findthe reflective writing intervention has significantly higher coverage compared to the e-mailalert intervention. No other treatment pairing showed any significant difference.

Joshua D. Martin Chapter 6. Evaluation 43
Figure 6.10: Percentage of code covered by tests within all quartiles for each treatmentgroup.
Analysis of intervention impact on coverage achieved by quartile, we only find a significantrelationship between the top two quartiles, upper-middle and upper. For the upper quartile,the control and reflective writing group were significant over e-mail alerts and schedule sheets.For the upper-middle quartile, the reflective writing and e-mail treatments are significantlygreater than the control group only.
Coverage achieved by student tests also provide a good metric for code quality, as idealtesting should cover all possible execution paths. Based on this analysis, it does not seemthat there was a strong pattern between treatment group and code coverage. We shouldnote that code coverage is a metric students can optimize for. Because they are the writersof their own unit tests, they can simply add extra test code and re-submit to Web-CAT. Asa result, the code coverage rate across all interventions was fairly high (mean above 90 forall treatments) and it would be difficult to consistently find any single intervention havingan impact.
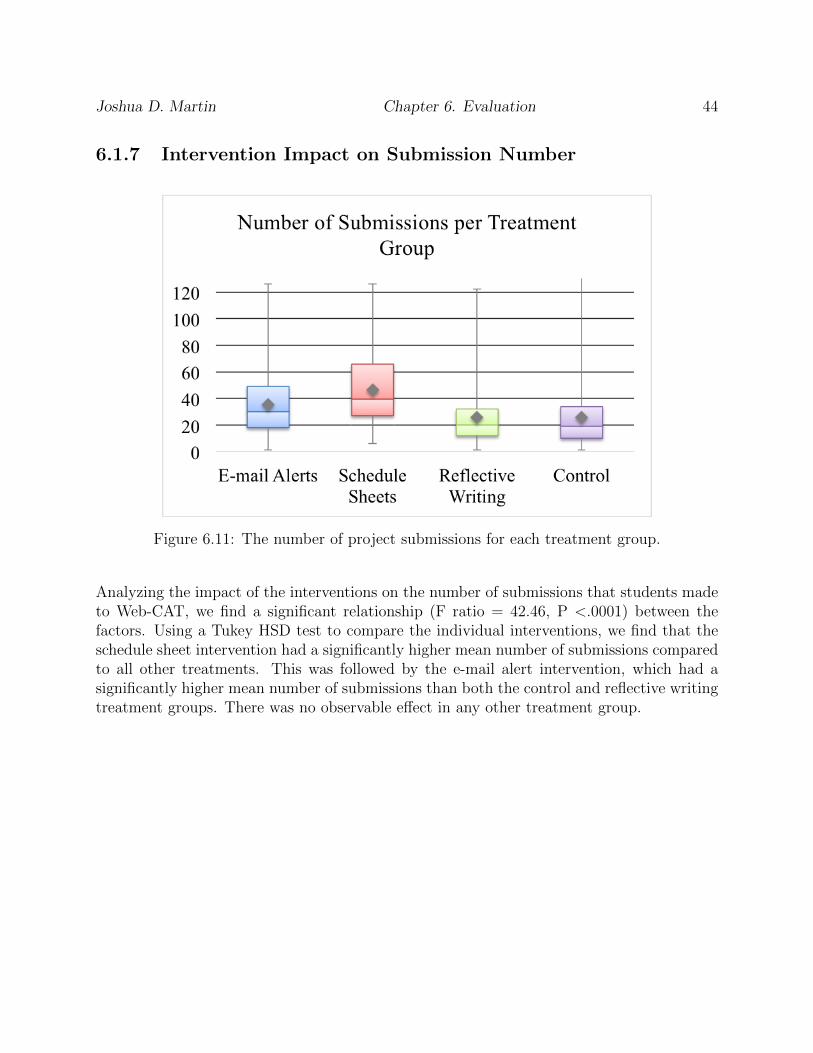
Joshua D. Martin Chapter 6. Evaluation 44
6.1.7 Intervention Impact on Submission Number
Figure 6.11: The number of project submissions for each treatment group.
Analyzing the impact of the interventions on the number of submissions that students madeto Web-CAT, we find a significant relationship (F ratio = 42.46, P <.0001) between thefactors. Using a Tukey HSD test to compare the individual interventions, we find that theschedule sheet intervention had a significantly higher mean number of submissions comparedto all other treatments. This was followed by the e-mail alert intervention, which had asignificantly higher mean number of submissions than both the control and reflective writingtreatment groups. There was no observable effect in any other treatment group.

Joshua D. Martin Chapter 6. Evaluation 45
Figure 6.12: The number of submissions within all quartiles for each treatment group.
Analyzing the impact of intervention on the number of Web-CAT submissions per projectwithin each quartile, we find a significant relationship between the factors in every quartile(Lower F ratio = 6.77, P <.0002; Lower-Middle F ratio = 16.71, P <.0001; Upper-Middle Fratio = 11.61, P <.0001; Upper F ratio = 9.91, P <.0001). A Tukey HSD test reveals differentsignificant intervention pairings for each quartile. For the lower quartile, the schedule sheettreatment group has a significantly larger number of submissions compared to both thereflective writing and control groups, while the e-mail alert intervention has a significantlylarger number of submissions over the control group only. For the lower-middle quartile,the schedule sheet group shows a significantly greater number of submissions over both thecontrol and reflective writing treatment, while the e-mail alert treatment had significantlygreater average number of submissions over the reflective writing treatment. For the upper-middle quartile, the schedule sheet treatment was found to be significant over all othertreatments, while the e-mail alert and control treatments were significant over the reflectivewriting treatment. Finally, in the upper quartile, the schedule sheet treatment was found tobe significant over reflective writing and control treatments.
Our initial hypothesis for this analysis is that more Web-CAT submissions correlate to higherquality on a student’s final submission. This would make any potential impact treatmentgroup had on the overall number of Web-CAT submissions very important. While we didfind a significant relationship between the number of Web-CAT submissions and referencetests passed for all students, reducing our dataset to remove those students who dropped orwithdrew from the course removed this finding, potentially making our findings moot.
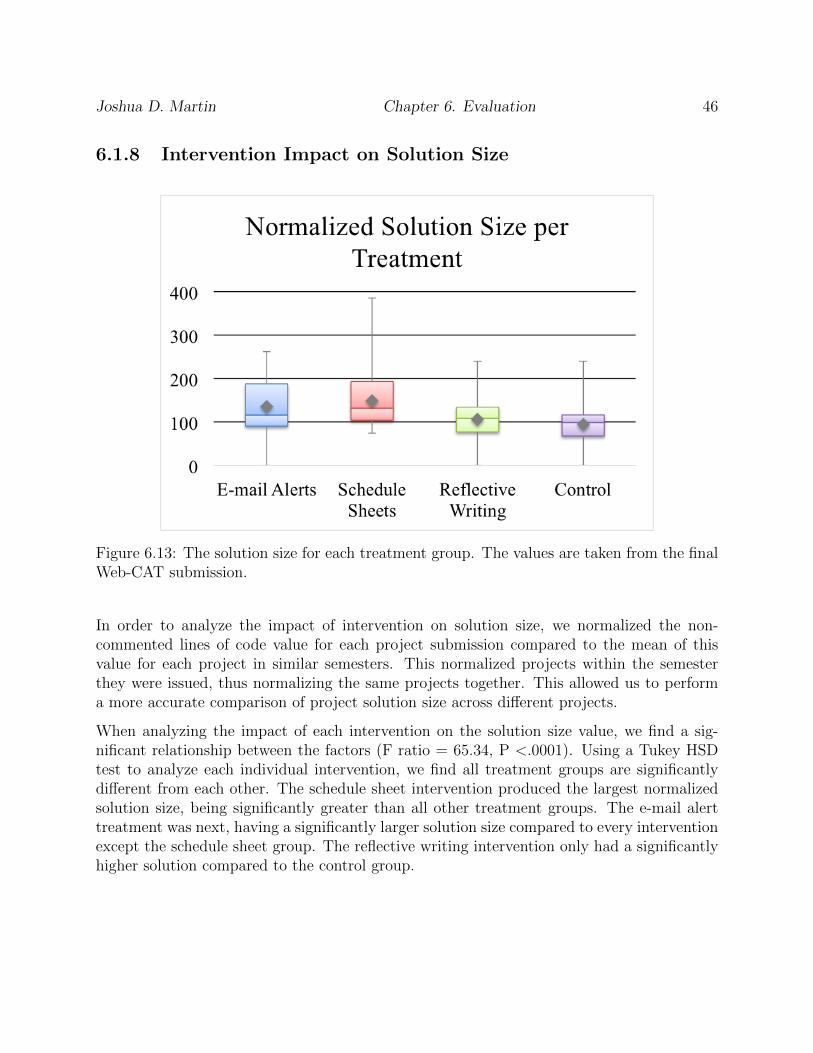
Joshua D. Martin Chapter 6. Evaluation 46
6.1.8 Intervention Impact on Solution Size
Figure 6.13: The solution size for each treatment group. The values are taken from the finalWeb-CAT submission.
In order to analyze the impact of intervention on solution size, we normalized the non-commented lines of code value for each project submission compared to the mean of thisvalue for each project in similar semesters. This normalized projects within the semesterthey were issued, thus normalizing the same projects together. This allowed us to performa more accurate comparison of project solution size across different projects.
When analyzing the impact of each intervention on the solution size value, we find a sig-nificant relationship between the factors (F ratio = 65.34, P <.0001). Using a Tukey HSDtest to analyze each individual intervention, we find all treatment groups are significantlydifferent from each other. The schedule sheet intervention produced the largest normalizedsolution size, being significantly greater than all other treatment groups. The e-mail alerttreatment was next, having a significantly larger solution size compared to every interventionexcept the schedule sheet group. The reflective writing intervention only had a significantlyhigher solution compared to the control group.
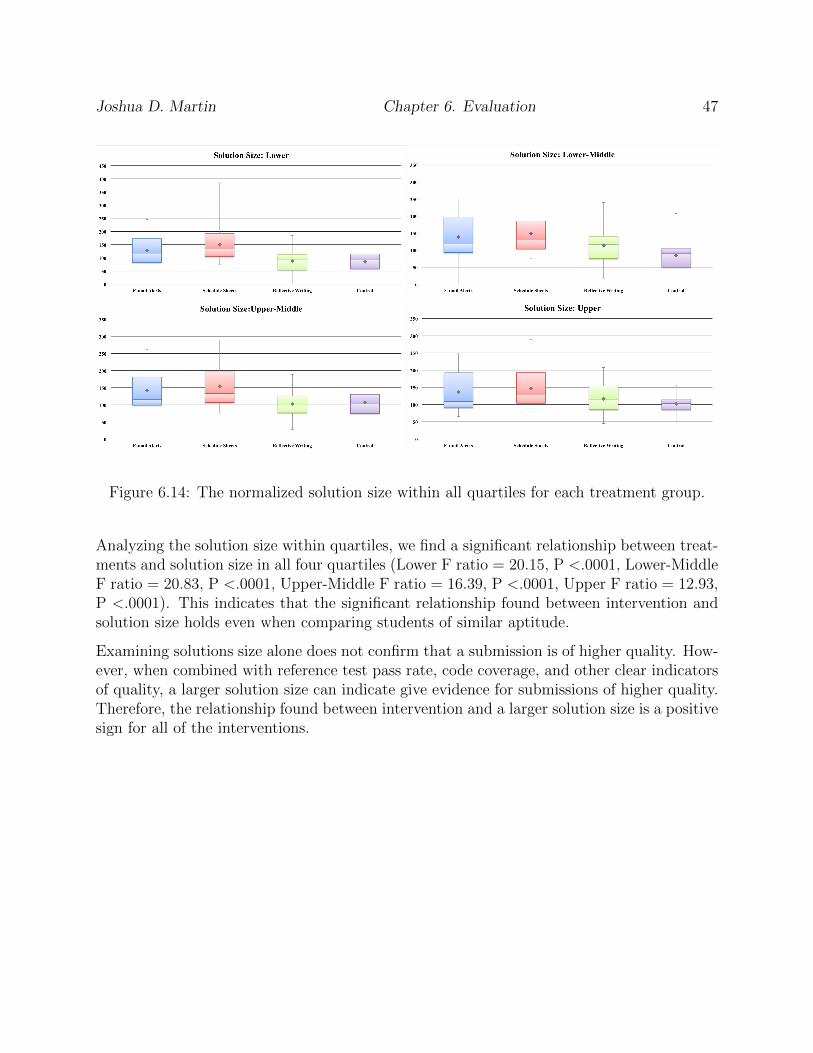
Joshua D. Martin Chapter 6. Evaluation 47
Figure 6.14: The normalized solution size within all quartiles for each treatment group.
Analyzing the solution size within quartiles, we find a significant relationship between treat-ments and solution size in all four quartiles (Lower F ratio = 20.15, P <.0001, Lower-MiddleF ratio = 20.83, P <.0001, Upper-Middle F ratio = 16.39, P <.0001, Upper F ratio = 12.93,P <.0001). This indicates that the significant relationship found between intervention andsolution size holds even when comparing students of similar aptitude.
Examining solutions size alone does not confirm that a submission is of higher quality. How-ever, when combined with reference test pass rate, code coverage, and other clear indicatorsof quality, a larger solution size can indicate give evidence for submissions of higher quality.Therefore, the relationship found between intervention and a larger solution size is a positivesign for all of the interventions.

Joshua D. Martin Chapter 6. Evaluation 48
6.1.9 Intervention Impact on Code Size (Test)
Figure 6.15: The test code size for each treatment group. The values are taken from thefinal submission to Web-CAT.
When analyzing the intervention impact on test code size, we find a significant relationship(F ratio = 8.16, P <.0001). Running a Tukey HSD test to find relationships between eachseparate intervention, we find the schedule sheet intervention had significantly higher testcode compared to both the control and e-mail alert groups. The reflective writing treatmentalso had significantly higher test code size compared to the e-mail alert treatment group.

Joshua D. Martin Chapter 6. Evaluation 49
Figure 6.16: The normalized test code size within all quartiles for each treatment group.
Analyzing the impact of intervention on test size within each quartile, we find interventionhas a significant impact on test size in three quartiles (Lower F ratio = 2.81, P <.039; Lower-Middle F Ratio = 3.72, P <.012; Upper-Middle F ratio = 6.88, P <.0002). In the upperquartile, there was no observable impact of treatment on test size.
Again, we find similar significant results for test size as we did for solution size. Studentsmust write a larger number of tests for a larger solution in order to accurately test thatsolution. The quartile comparisons show no sign difference, thus we can say this relationshipis most likely due to the treatments themselves and not other factors. While test size cannotbe used as a direct measure of submission quality, combining the metric with other qualityindicators provides a more complete picture of each submission.
6.1.10 Procrastination Score of Each Treatment Group
At the beginning of each section included in our experiment, we tested students using theprocrastination scale measurement quiz developed by Tuckman. This scale ranks studentsbased on their tendency to procrastinate, with a lower score (closer to 0) indicating a studentis less likely to procrastinate and a higher score (closer to 1.0) indicating the student is morelikely to procrastinate. This scale has been previously shown to correlate well with a studentsprocrastination habits.

Joshua D. Martin Chapter 6. Evaluation 50
Figure 6.17: The procrastination survey score for each treatment group.
To examine if any single treatment group had a population that was significantly more likelyto procrastinate, we analyzed the procrastination scale scores received by the treatmentgroups. These results showed only the e-mail alert treatment group had a significantly higherprocrastination score compared to the reflective writing treatment (e-mail alert mean = .62,reflective writing mean = .57). All other treatment groups had no significantly differentprocrastination scores, indicating the analysis we performed was mostly on students with asimilar tendency to procrastinate.
6.2 On-time Submission Analysis
In this section, we examine the impact of on-time status on various elements of submissionquality. As explained earlier in this thesis, on-time status records if a project submission wassubmitted more than 1 day before the deadline, within 24 hours of the deadline, or after thedeadline. We use this as a basic measure of lateness, and by examining different aspects ofproject quality, we hope to confirm that late work has significantly lower quality comparedto earlier work.

Joshua D. Martin Chapter 6. Evaluation 51
6.2.1 On-time Impact on Reference Test Pass Rate
Figure 6.18: The percentage of reference tests passed for each on-time status category.
Analyzing the impact of on-time status on reference test pass rate, we find a significantrelationship (F ratio = 30.90, P <0.0001). Projects that were submitted early had a signifi-cantly greater reference test pass rate than projects submitted late, which seems to confirmour initial hypothesis.
One potential limitation to this analysis is that “good students” simply do better work andfinish earlier, and therefore receive higher scores than weaker students, who are unable tofinish their work earlier due to the struggles they encounter when trying to complete anassignment. To help remove this potential impact, we removed students who only submittedtheir work early or late. With the remaining students, we performed a within-subjectscomparison of the reference test pass rate that compared the pass rate achieved for bothearly and late work for the same student. With this comparison, we still found the on-timestatus of a submission to be a significant factor in the percentage of reference tests passed(F ratio = 13.7, P <0.0001).
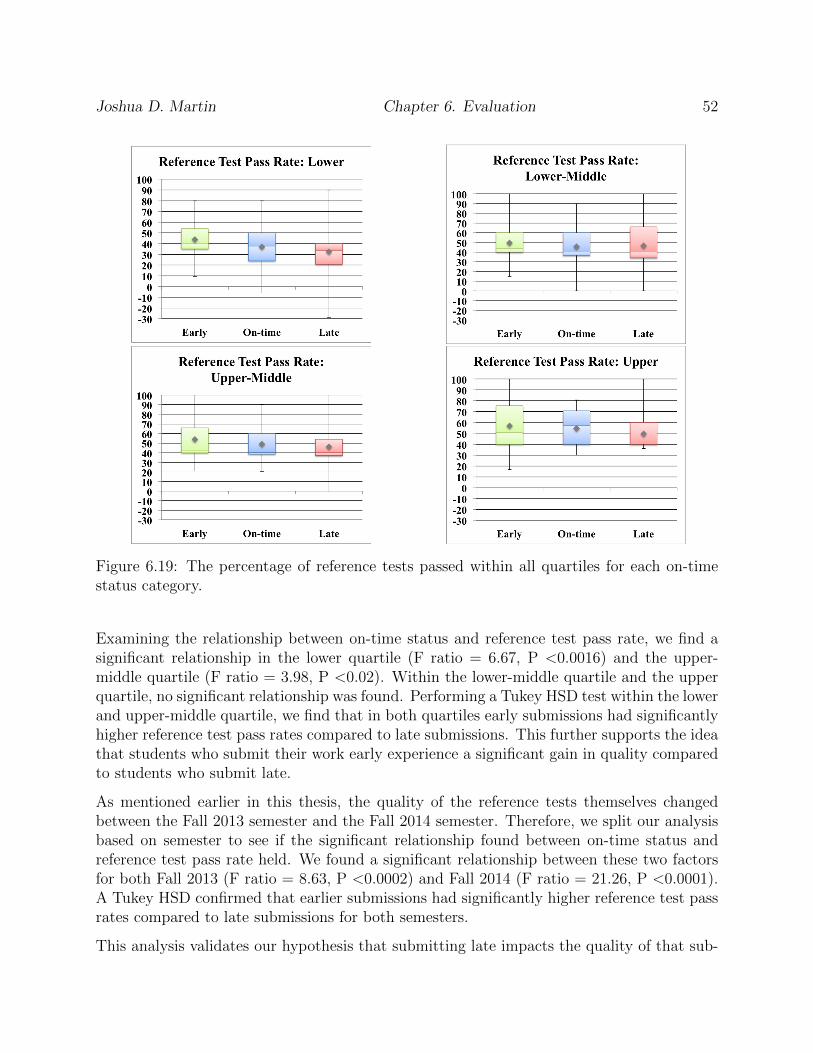
Joshua D. Martin Chapter 6. Evaluation 52
Figure 6.19: The percentage of reference tests passed within all quartiles for each on-timestatus category.
Examining the relationship between on-time status and reference test pass rate, we find asignificant relationship in the lower quartile (F ratio = 6.67, P <0.0016) and the upper-middle quartile (F ratio = 3.98, P <0.02). Within the lower-middle quartile and the upperquartile, no significant relationship was found. Performing a Tukey HSD test within the lowerand upper-middle quartile, we find that in both quartiles early submissions had significantlyhigher reference test pass rates compared to late submissions. This further supports the ideathat students who submit their work early experience a significant gain in quality comparedto students who submit late.
As mentioned earlier in this thesis, the quality of the reference tests themselves changedbetween the Fall 2013 semester and the Fall 2014 semester. Therefore, we split our analysisbased on semester to see if the significant relationship found between on-time status andreference test pass rate held. We found a significant relationship between these two factorsfor both Fall 2013 (F ratio = 8.63, P <0.0002) and Fall 2014 (F ratio = 21.26, P <0.0001).A Tukey HSD confirmed that earlier submissions had significantly higher reference test passrates compared to late submissions for both semesters.
This analysis validates our hypothesis that submitting late impacts the quality of that sub-
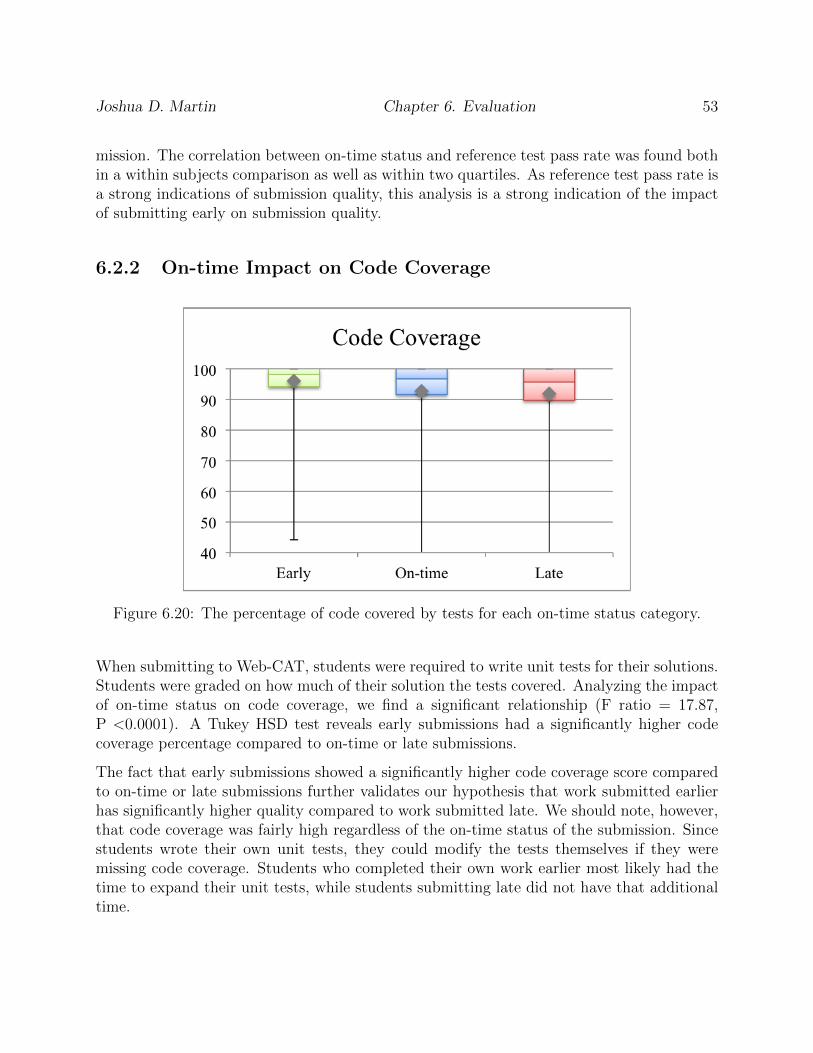
Joshua D. Martin Chapter 6. Evaluation 53
mission. The correlation between on-time status and reference test pass rate was found bothin a within subjects comparison as well as within two quartiles. As reference test pass rate isa strong indications of submission quality, this analysis is a strong indication of the impactof submitting early on submission quality.
6.2.2 On-time Impact on Code Coverage
Figure 6.20: The percentage of code covered by tests for each on-time status category.
When submitting to Web-CAT, students were required to write unit tests for their solutions.Students were graded on how much of their solution the tests covered. Analyzing the impactof on-time status on code coverage, we find a significant relationship (F ratio = 17.87,P <0.0001). A Tukey HSD test reveals early submissions had a significantly higher codecoverage percentage compared to on-time or late submissions.
The fact that early submissions showed a significantly higher code coverage score comparedto on-time or late submissions further validates our hypothesis that work submitted earlierhas significantly higher quality compared to work submitted late. We should note, however,that code coverage was fairly high regardless of the on-time status of the submission. Sincestudents wrote their own unit tests, they could modify the tests themselves if they weremissing code coverage. Students who completed their own work earlier most likely had thetime to expand their unit tests, while students submitting late did not have that additionaltime.
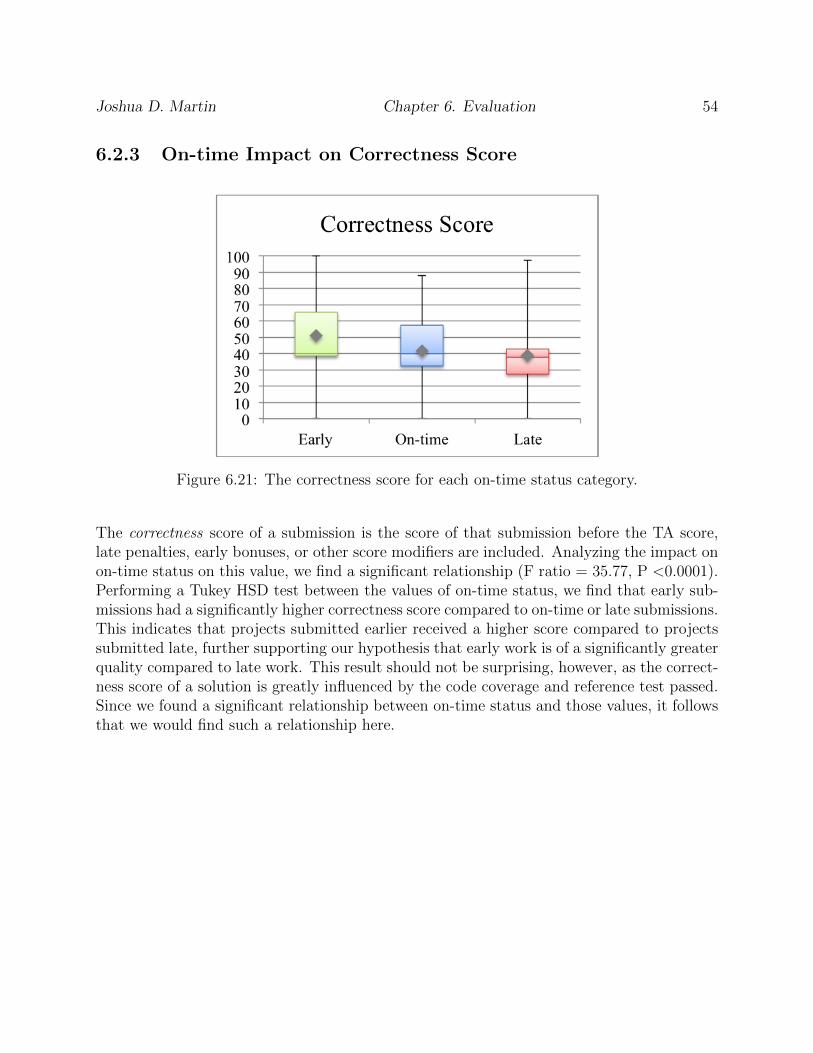
Joshua D. Martin Chapter 6. Evaluation 54
6.2.3 On-time Impact on Correctness Score
Figure 6.21: The correctness score for each on-time status category.
The correctness score of a submission is the score of that submission before the TA score,late penalties, early bonuses, or other score modifiers are included. Analyzing the impact onon-time status on this value, we find a significant relationship (F ratio = 35.77, P <0.0001).Performing a Tukey HSD test between the values of on-time status, we find that early sub-missions had a significantly higher correctness score compared to on-time or late submissions.This indicates that projects submitted earlier received a higher score compared to projectssubmitted late, further supporting our hypothesis that early work is of a significantly greaterquality compared to late work. This result should not be surprising, however, as the correct-ness score of a solution is greatly influenced by the code coverage and reference test passed.Since we found a significant relationship between on-time status and those values, it followsthat we would find such a relationship here.

Joshua D. Martin Chapter 6. Evaluation 55
6.2.4 On-time Impact on TA Score
Figure 6.22: The value of the score given by the course TA for each on-time status category.
When analyzing the impact of on-time status on the score given by the teaching assistants,we find no significant relationship (F ratio 1.06, P <0.63). This indicates that the overalltime a project was submitted had little to no impact on the score assigned by the TA forthe course. The mean scores for all types of assignments were virtually identical, with 45.96for early submissions, 44.11 for on-time submissions, and 45.77 for late assignments.
We should note that the requirements for the TA grades varied between semesters. For Fall2013, the TAs graded each submission based on style adherence as well as design choices,while in Fall 2014 the TAs only graded the design of a submission. To account for this,we split the TA grades by semesters and analyzed the impact of on-time status within eachsemester. For Fall 2013, we found early submissions had a significantly higher TA score thanon-time submissions. We found no significant relationship between early submissions andlate submissions. In Fall 2014, we found no significant relationship between on-time statusand TA score. Overall, it seems the course TAs assigned similar grades to submissionsregardless of it they were on-time.
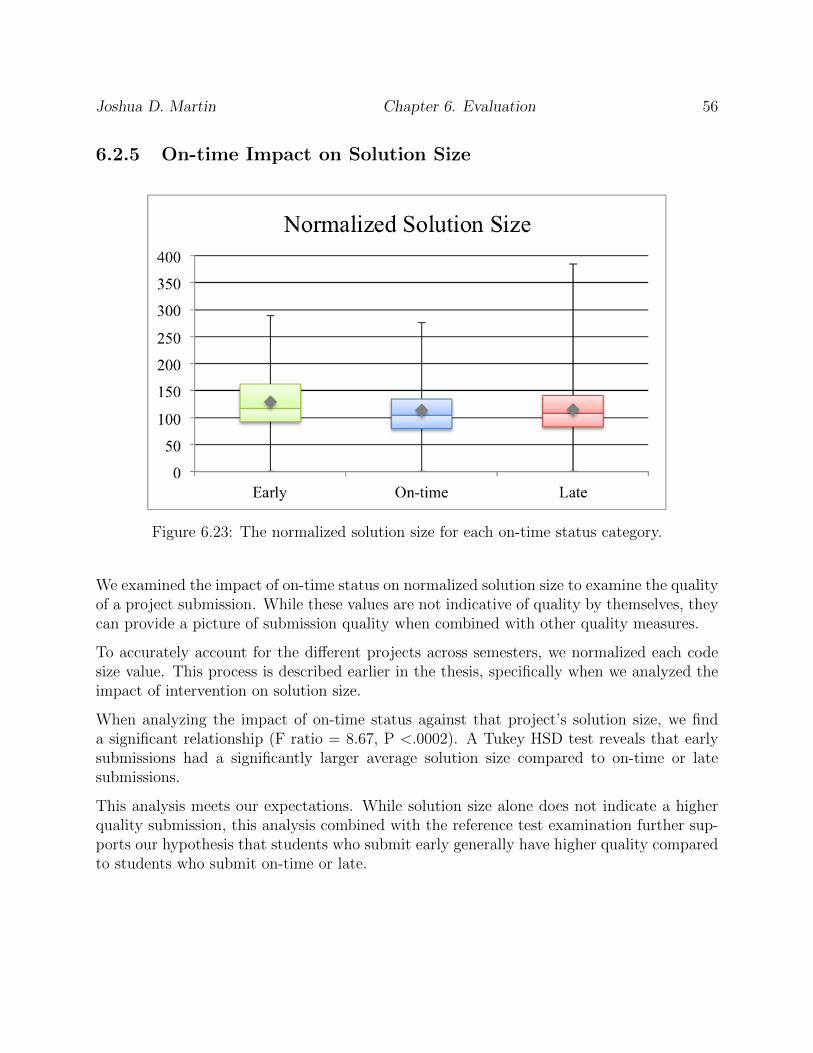
Joshua D. Martin Chapter 6. Evaluation 56
6.2.5 On-time Impact on Solution Size
Figure 6.23: The normalized solution size for each on-time status category.
We examined the impact of on-time status on normalized solution size to examine the qualityof a project submission. While these values are not indicative of quality by themselves, theycan provide a picture of submission quality when combined with other quality measures.
To accurately account for the different projects across semesters, we normalized each codesize value. This process is described earlier in the thesis, specifically when we analyzed theimpact of intervention on solution size.
When analyzing the impact of on-time status against that project’s solution size, we finda significant relationship (F ratio = 8.67, P <.0002). A Tukey HSD test reveals that earlysubmissions had a significantly larger average solution size compared to on-time or latesubmissions.
This analysis meets our expectations. While solution size alone does not indicate a higherquality submission, this analysis combined with the reference test examination further sup-ports our hypothesis that students who submit early generally have higher quality comparedto students who submit on-time or late.

Joshua D. Martin Chapter 6. Evaluation 57
6.2.6 On-time Impact on Test Size
Figure 6.24: The normalized test code size for each on-time status category.
Analyzing the impact of on-time status on the test size of a submission, we find no significantrelationship (F ratio 0.76, P <.47). This indicates that students who submitted both earlyand late typically wrote similar amounts of code to test their solutions.
This analysis is surprising, as we found a significant relationship between early submissionsand solution size. Since test size and solution size are strongly correlated, we reasonedthis value would also be significantly greater for early submissions. A lack of a significantrelationship could simply indicate students tested there code roughly the same, regardlessof when they submitted.
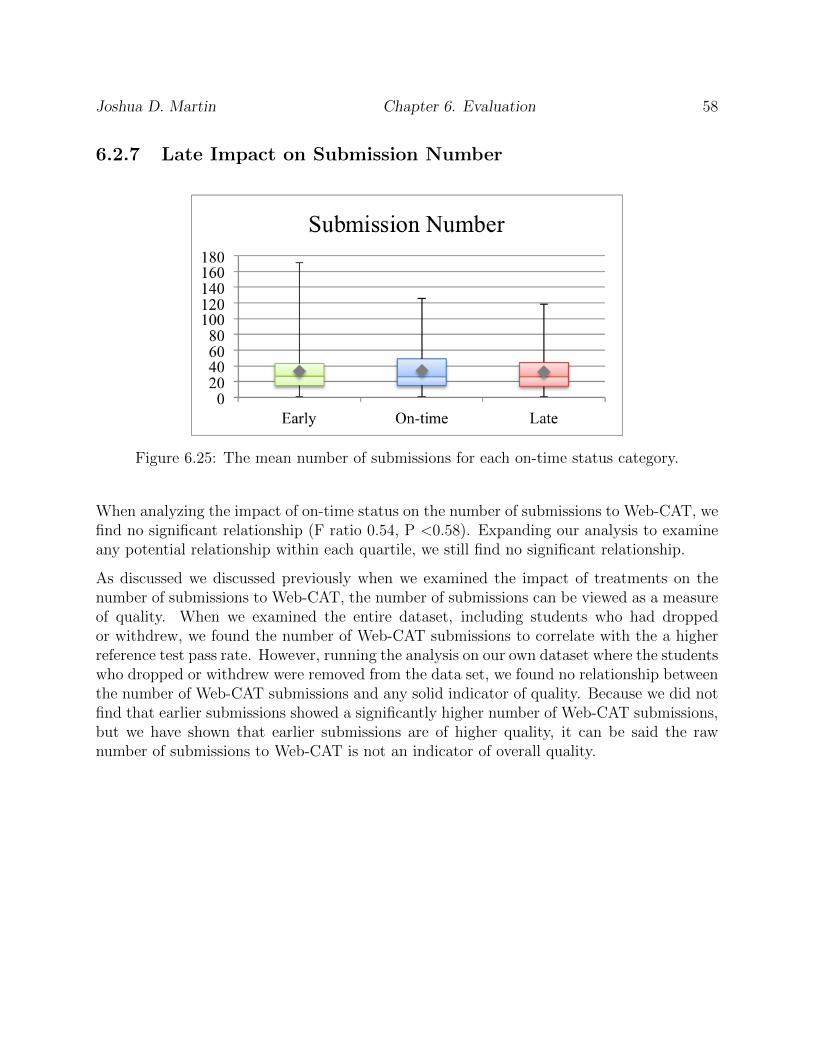
Joshua D. Martin Chapter 6. Evaluation 58
6.2.7 Late Impact on Submission Number
Figure 6.25: The mean number of submissions for each on-time status category.
When analyzing the impact of on-time status on the number of submissions to Web-CAT, wefind no significant relationship (F ratio 0.54, P <0.58). Expanding our analysis to examineany potential relationship within each quartile, we still find no significant relationship.
As discussed we discussed previously when we examined the impact of treatments on thenumber of submissions to Web-CAT, the number of submissions can be viewed as a measureof quality. When we examined the entire dataset, including students who had droppedor withdrew, we found the number of Web-CAT submissions to correlate with the a higherreference test pass rate. However, running the analysis on our own dataset where the studentswho dropped or withdrew were removed from the data set, we found no relationship betweenthe number of Web-CAT submissions and any solid indicator of quality. Because we did notfind that earlier submissions showed a significantly higher number of Web-CAT submissions,but we have shown that earlier submissions are of higher quality, it can be said the rawnumber of submissions to Web-CAT is not an indicator of overall quality.
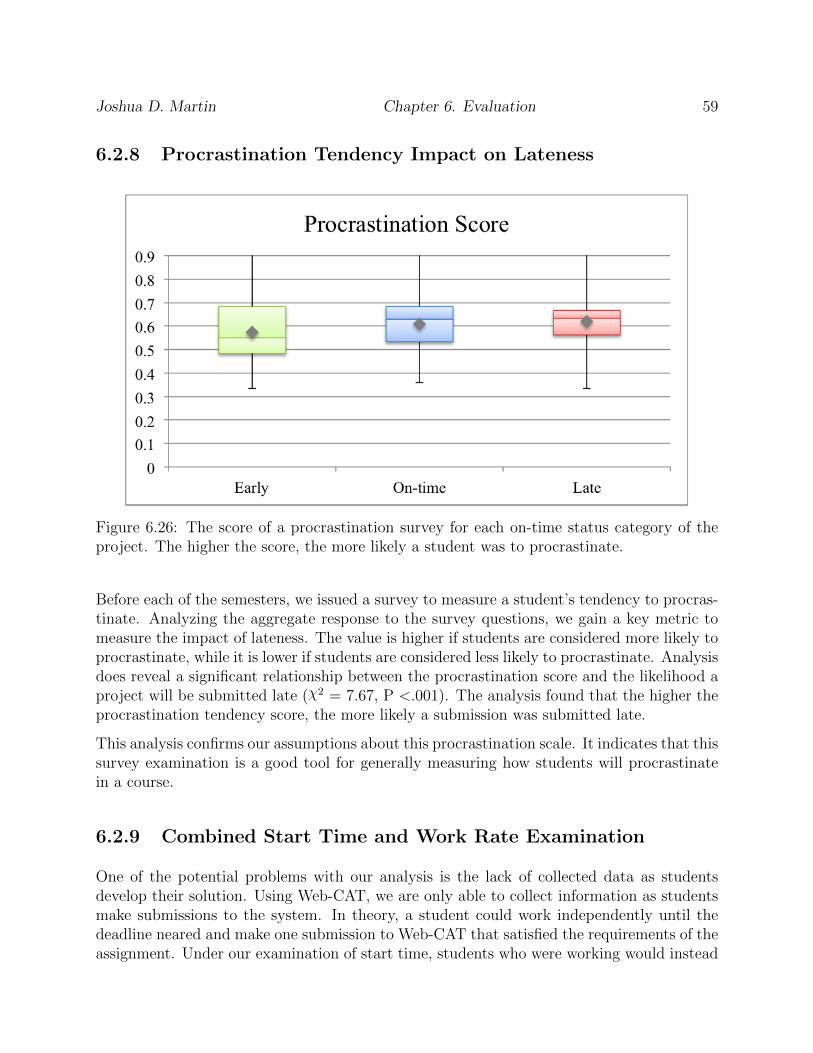
Joshua D. Martin Chapter 6. Evaluation 59
6.2.8 Procrastination Tendency Impact on Lateness
Figure 6.26: The score of a procrastination survey for each on-time status category of theproject. The higher the score, the more likely a student was to procrastinate.
Before each of the semesters, we issued a survey to measure a student’s tendency to procras-tinate. Analyzing the aggregate response to the survey questions, we gain a key metric tomeasure the impact of lateness. The value is higher if students are considered more likely toprocrastinate, while it is lower if students are considered less likely to procrastinate. Analysisdoes reveal a significant relationship between the procrastination score and the likelihood aproject will be submitted late (χ2 = 7.67, P <.001). The analysis found that the higher theprocrastination tendency score, the more likely a submission was submitted late.
This analysis confirms our assumptions about this procrastination scale. It indicates that thissurvey examination is a good tool for generally measuring how students will procrastinatein a course.
6.2.9 Combined Start Time and Work Rate Examination
One of the potential problems with our analysis is the lack of collected data as studentsdevelop their solution. Using Web-CAT, we are only able to collect information as studentsmake submissions to the system. In theory, a student could work independently until thedeadline neared and make one submission to Web-CAT that satisfied the requirements of theassignment. Under our examination of start time, students who were working would instead

Joshua D. Martin Chapter 6. Evaluation 60
Figure 6.27: First submission solution size ratio versus the percentage of reference testspassed.
be considered procrastinators. In an attempt to measure how much work students completedbefore they began submitted to Web-CAT, we created a ratio of the solution size recordedby the first Web-CAT solution and the solution size recorded for the final submission. Thisvalue gives us a rough estimate of how much of a solution a student has completed whenthey make their first Web-CAT submission. Combining this with the time a first submissionwas made gives us a metric that is higher for students who submit their work earlier andlower for students who submit their work later.
We analyzed the impact of this metric against the reference test pass rate to see if thiswas a good indicator of overall submission quality. We also examined solution size andfirst submission time individually against reference test pass rate. Overall we found thatnone of these factors had a solidly significant relationship with the pass rate of referencetests. Eliminating the Fall 2013 semester group, to reduce the influence any poorly writtenreference tests might have, we still found no significant relationship. As our results ourinconclusive, it seems attempting to measure the amount of student work in addition towhen they begin submitting to Web-CAT does not yield a viable method of examining howgreat or little a student is procrastinating.

Joshua D. Martin Chapter 6. Evaluation 61
Figure 6.28: First submission time versus the percentage of reference tests passed. A negativevalue indicates an earlier submission, while a positive value indicates a later submission.
6.3 Analysis Limitations
6.3.1 Semester Influence
Our analysis was limited by a variety of factors we were unable to control for. One suchlimitation was the potential semester influence. While the sections in each of the differentsemesters had many common elements, such as the same instructor, lead GTA, and the sameoverall number of projects, the instructor did feel the projects for the 2014 semester weremore difficult compared to the 2013 semester. Furthermore, the projects had a differentcomplexity component between semesters. While the projects in 2014 were designed to beof similar complexity to those in 2013, the instructor did notice that students had a greaterchallenge in 2014 completing the projects compared to students in 2013. This is evidencedby the larger number of students who dropped or withdrew from the course, which wasdiscussed at the beginning this chapter. Finally, as discussed when analyzing the impactof treatments on the reference test pass rate, the quality of reference tests were differentbetween the semesters. This was due to the experience of the GTA who was writing thetests, and probably negatively influenced the pass rates of students in the 2013 section.

Joshua D. Martin Chapter 6. Evaluation 62
Figure 6.29: Combined first submission time and first submission solution size versus thepercentage of reference tests passed.
6.3.2 Assignment Influence
Overall, the projects for the course we used to test our interventions are designed to be easilycompleted so long as a student understands the core concepts behind them. These projectsare used as teaching tools, not as an example of a complex real-world problem which mightrequire a larger effort from students. The lack of large challenge with these projects mightskew the overall influence of our interventions, as students might be more able to not managetheir time appropriately but still succeed in the course. This would limit our observation ofany significant effect these interventions might have on time management. While we cannoteliminate this potential influence from our analysis, it is an important factor to considerwhen examining our results.
6.3.3 Inherent Student Quality
Our analysis was designed to avoid the influence of the “good student effect”. The ideabehind this concept is that some students will do inherently well regardless of almost anyexternal factor. These “good students” could throw off any analysis by simply outperforminganother group of students, despite their performance not being related to any of the inter-
Joshua D. Martin Chapter 6. Evaluation 63
ventions we studied. In order to limit this effect, we performed a within subjects comparisonwhen analyzing the impact of late submissions by reducing our analysis to students whosubmitted assignments both early and late. While that analysis accounted for students ofdifferent aptitude, it did not account for differences between the assignments themselves. Wealso had this problem with our quartile analysis. The quartiles did account for assignmentdifferences, as the quartiles contained results from all assignments. However, it could bethat the final semester grade received by a student is not the best indication of their overallquality. This may hinder the accuracy of our analysis.
6.3.4 Web-CAT Data Limitations
One of the biggest limitations of our analysis came from the inherent limitations of theWeb-CAT grading system. Web-CAT is a powerful tool that collects a large amount of dataeach time a student submits work for a project. However, Web-CAT is limited to collectingdata when students submit to the system. Theoretically, students can work completelyindependently of Web-CAT and submit their work right before a project is due. This wouldnot allow us to accurately predict the level of efforts students are placing into each project.The only way to overcome this limitation is to collect information as students develop, ideallydirectly from their IDE. We discuss this potential in our chapter on future work.

Chapter 7
Conclusions
In this paper, we have described three different interventions designed to reduce studentprocrastination in computer science classrooms. These interventions are designed to bescalable, and therefore can be easily implemented in other programming based courses.
7.1 Experimental Results
Based on our analysis of the impact of these interventions, it seems the e-mail alert inter-vention positively impacted when students submitted their final work to Web-CAT. Further-more, the e-mail alert intervention also had an impact on when students began submittingto Web-CAT, which is an indicator of when these students began working on their projects.Students starting their work earlier indicates a reduction in procrastination behavior, whichcan be seen as a success for the e-mail alert intervention. However, students did subjectivelyreport they did not appreciate the treatment and felt it was a waste of time. This indicatesthere may be additional work required to modify the e-mail alerts so students feel more isgained from them.
Trying to analyze the impact of these interventions on project quality was a harder task.Overall, we did find submissions in some treatment groups, particularly the schedule sheettreatment group, to be of higher quality compared to the others. However, the influence ofpoorly written reference tests on the Fall 2013 semester makes this analysis suspect. Tryingto eliminate that source of bias might allow us to confirm these results.
We were able to confirm that work submitted later was of lower quality, especially whencompared to earlier submitted work. This is an important confirmation as it underscores theimportance of students starting early, as well as the threat procrastination poses to studentsuccess.
64
Joshua D. Martin Chapter 7. Conclusion 65
7.2 Contributions
The primary contribution of this work is the creation and analysis of three scalable tech-niques to reduce student procrastination. Previous work shown to reduce procrastinationhas not been designed to be effectively implemented in large classrooms. With large num-bers of students procrastinating, techniques to reduce procrastination will be more effectiveif they can be easily targeted to more students. This research shows a way to make this hap-pen. Furthermore, our success with e-mail alerts introduces a novel intervention to reduceprocrastination that can be built upon in future research.
7.3 Future Work
Overall, our positive findings for these treatments indicate that they can be used as a valuabletool to reduce student procrastination, although most likely in a modified form. Usingactive collection to measure precisely how successful students program while unsuccessfulstudents fail could vastly improve the e-mail alert intervention by improving the messagesstudents receive. Instead of most students receiving a default message indicating their failureto submit to Web-CAT, they could instead receive nuanced messages containing relevantstatistical information on their current progress relative to ideal progress. Instructors wouldalso benefit from this information, as they could quickly identify struggling students andintervene before the impact of procrastination became irreversible.
One way to collect this information would be to monitor student programming behaviorwithin their IDE. Currently, we only examine student submissions to Web-CAT. While thisprovides valuable information, it does not record certain fine grained details that would becaptured within an IDE. With this capability in addition to the Web-CAT data, we couldaccurately model a successful student throughout the semester. With this model, moreaccurate e-mail alerts could be sent to students, perhaps increasing their own appreciationof the intervention as well as its effectiveness.

Bibliography
[1] Allevato, A., and Edwards, S. H. The effects of extra credit opportunities onstudent procrastination. In Frontiers in Education Conference, 2013 IEEE (2013),IEEE, pp. 1831–1836.
[2] Allevato, A., Thornton, M., Edwards, S. H., and Perez-Quinones, M. A.Mining data from an automated grading and testing system by adding rich reportingcapabilities. EDM 8 (2008), 167–176.
[3] Bernstein, P. L., and Bernstein Peter, L. Against the gods: The remarkablestory of risk. Wiley New York, 1996.
[4] Bonwell, C. C., and Eison, J. A. Active Learning: Creating Excitement in theClassroom. 1991 ASHE-ERIC Higher Education Reports. ERIC, 1991.
[5] Bridges, K. R., and Roig, M. Academic procrastination and irrational thinking:A re-examination with context controlled. Personality and Individual Differences 22, 6(1997), 941–944.
[6] Briody, R. An exploratory study of procrastination. PhD thesis, ProQuest Information& Learning, 1980.
[7] Edwards, S., Martin, J., and Shaffer, C. A. Examining classroom interventionsto reduce procrastination. In In Proceedings of the 2015 Conference on Innovation &Technology in Computer Science Education (ITiCSE ’15) (NY, NY, USA, 2015), ACM.to appear.
[8] Edwards, S. H., and Perez-Quinones, M. A. Web-cat: automatically gradingprogramming assignments. In ACM SIGCSE Bulletin (2008), vol. 40, ACM, pp. 328–328.
[9] Edwards, S. H., Snyder, J., Perez-Quinones, M. A., Allevato, A., Kim,D., and Tretola, B. Comparing effective and ineffective behaviors of student pro-grammers. In Proceedings of the fifth international workshop on Computing educationresearch workshop (2009), ACM, pp. 3–14.
66

Joshua D. Martin Bibliography 67
[10] Ferrari, J., Johnson, J., and McCown, W. Procrastination and Task Avoidance:Theory, Research, and Treatment. Issues in Clinical Child Psychology. Springer, 1995.
[11] Ferrari, J. R. Compulsive procrastination: Some self-reported characteristics. Psy-chological reports 68, 2 (1991), 455–458.
[12] Foundation, T. E. BIRT Project: Business Intelligence and Reporting Tools, 2008.
[13] Klassen, R. M., Krawchuk, L. L., and Rajani, S. Academic procrastination ofundergraduates: Low self-efficacy to self-regulate predicts higher levels of procrastina-tion. Contemporary Educational Psychology 33, 4 (2008), 915–931.
[14] Lay, C. H. At last, my research article on procrastination. Journal of research inpersonality 20, 4 (1986), 474–495.
[15] Milgram, N. N., Mey-Tal, G., and Levison, Y. Procrastination, generalized orspecific, in college students and their parents. Personality and Individual Differences25, 2 (1998), 297–316.
[16] Milgram, S., Sabini, J. E., and Silver, M. E. The individual in a social world:Essays and experiments . Mcgraw-Hill Book Company, 1992.
[17] Rothblum, E. D., Solomon, L. J., and Murakami, J. Affective, cognitive, andbehavioral differences between high and low procrastinators. Journal of counselingpsychology 33, 4 (1986), 387.
[18] Schouwenburg, H. C., and Lay, C. H. Trait procrastination and the big-fivefactors of personality. Personality and Individual Differences 18, 4 (1995), 481–490.
[19] Shaffer, C. A., and Edwards, S. H. Scheduling, pair programming and studentprogramming assignment performance. IEEE Transactions on Education 1, 11 (2007),1–6.
[20] Spolsky, J. Joel on Software. Apress, 2004.
[21] Stead, D. R. A review of the one-minute paper. Active Learning in Higher Education6, 2 (2005), 118–131.
[22] Steel, P. The nature of procrastination: a meta-analytic and theoretical review ofquintessential self-regulatory failure. Psychological bulletin 133, 1 (2007), 65.
[23] Tice, D. M., and Baumeister, R. F. Longitudinal study of procrastination, per-formance, stress, and health: The costs and benefits of dawdling. Psychological Science(1997), 454–458.
[24] Tuckman, B. W. The development and concurrent validity of the procrastinationscale. Educational and psychological measurement 51, 2 (1991), 473–480.

Joshua D. Martin Bibliography 68
[25] Tuckman, B. W. Relations of academic procrastination, rationalizations, and perfor-mance in a web course with deadlines 1. Psychological Reports 96, 3c (2005), 1015–1021.
[26] Tuckman, B. W., and Schouwenburg, H. C. Behavioral interventions for reducingprocrastination among university students.

Appendix A
Sample E-mail Alerts
The following appendix section contains samples of e-mail alerts sent to students. The alertswere part of the e-mail alert intervention. The description of how the alerts were generatedand context for their meaning can be found in chapter 5, section 2.
A.1 E-mail Alert Example: Student with No Web-
CAT Submissions
Subject: CS 3114: You may be at risk on Project 1
This notification is to increase your awareness of your current progress on Project 1 comparedto the rest of the class. Project 1 is due in 7 days.
You have not submitted any work to Web-CAT for analysis on Project 1. As a result, thereis no way to assess your progress relative to the rest of the class, indicating you may be atrisk for performing poorly on the assignment.
Historical data from many programming classes like this one indicate that when a studentstarts earlier, he or she earns higher scores on average than when the same student startslater.
If you have not begun work on the project, it is important to do so as soon as possible.If you have already started work, we encourage you to submit to Web-CAT and self-checkyour work early and often. Remember to incrementally test as you write code as well, sinceleaving testing for later also increases the risk of performing poorly.
We wish you the best of luck as you work to complete this assignment.
– Web-CAT Situational Awareness Service
69
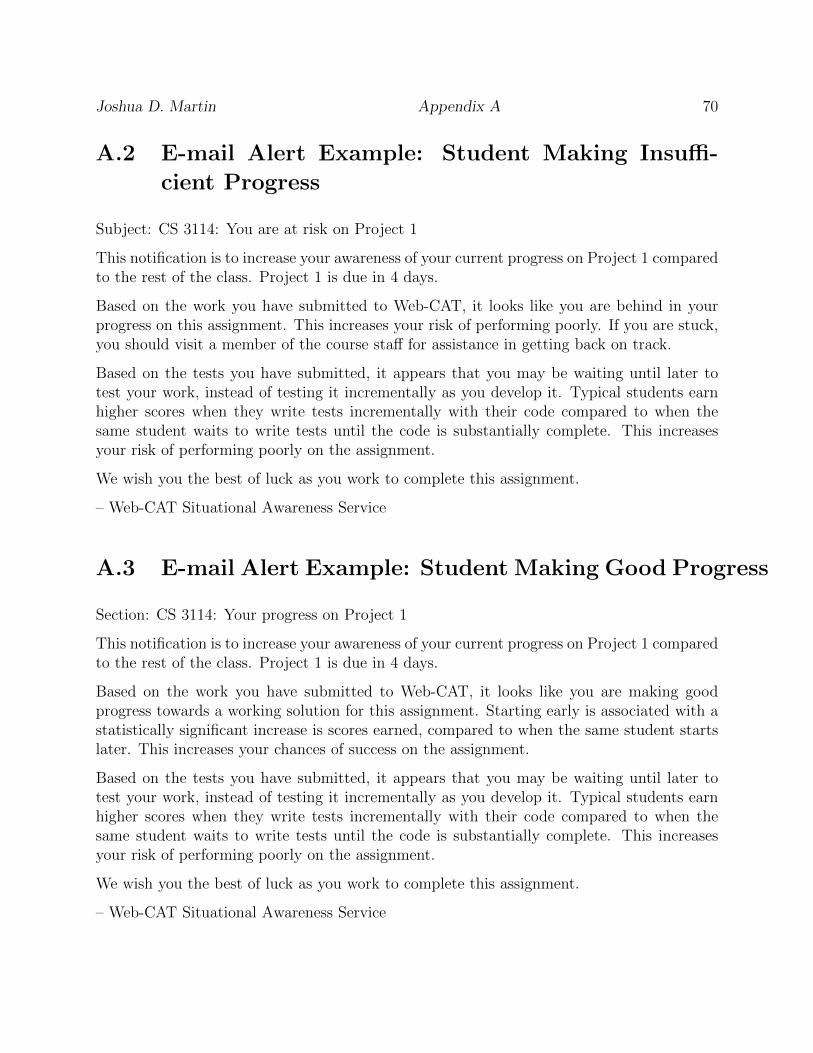
Joshua D. Martin Appendix A 70
A.2 E-mail Alert Example: Student Making Insuffi-
cient Progress
Subject: CS 3114: You are at risk on Project 1
This notification is to increase your awareness of your current progress on Project 1 comparedto the rest of the class. Project 1 is due in 4 days.
Based on the work you have submitted to Web-CAT, it looks like you are behind in yourprogress on this assignment. This increases your risk of performing poorly. If you are stuck,you should visit a member of the course staff for assistance in getting back on track.
Based on the tests you have submitted, it appears that you may be waiting until later totest your work, instead of testing it incrementally as you develop it. Typical students earnhigher scores when they write tests incrementally with their code compared to when thesame student waits to write tests until the code is substantially complete. This increasesyour risk of performing poorly on the assignment.
We wish you the best of luck as you work to complete this assignment.
– Web-CAT Situational Awareness Service
A.3 E-mail Alert Example: Student Making Good Progress
Section: CS 3114: Your progress on Project 1
This notification is to increase your awareness of your current progress on Project 1 comparedto the rest of the class. Project 1 is due in 4 days.
Based on the work you have submitted to Web-CAT, it looks like you are making goodprogress towards a working solution for this assignment. Starting early is associated with astatistically significant increase is scores earned, compared to when the same student startslater. This increases your chances of success on the assignment.
Based on the tests you have submitted, it appears that you may be waiting until later totest your work, instead of testing it incrementally as you develop it. Typical students earnhigher scores when they write tests incrementally with their code compared to when thesame student waits to write tests until the code is substantially complete. This increasesyour risk of performing poorly on the assignment.
We wish you the best of luck as you work to complete this assignment.
– Web-CAT Situational Awareness Service

Appendix B
Reflective Writing Assignment
B.1 Reflective Writing Prompts
This assignment involves writing one-paragraph responses to four questions regarding thelast programming assignment you completed for this class, and should only take you about15-20 minutes to complete.
Consider the following questions and answer each one in a separate paragraph.
1. On the last software project you worked on for a class, consider when you began workingon it, the way that you spent your time, and how you managed yourself as you workto complete the project. Then describe the key elements of the plan or strategy youused to manage your time on that project.
2. Again considering the most recent software project you completed for a class, describehow your strategy for managing your time on the project affected the quality of yourwork or your ability to achieve your goals on the project.
3. Reflecting on your experience with past projects, describe the strategy or plan youintend to use for managing your time on the next software project that you will do forthis class.
4. Again considering the most recent software project you completed for a class, a) de-scribe your development strategy that you used to implement and test the program,b) describe how your development strategy affected the quality of your work or yourability to achieve your goals on the project, and c) describe any different strategy toimplement and test your program that you will use for the next software project thatyou will do for this class.
71

Appendix C
Schedule Sheet Assignment
C.1 Schedule Sheet Entry Instructions
For all projects this semester, you will be required to create and update a schedule for theproject. For each project, there will be three phases.
1. Toward the end of the first week of the project life cycle, you will create an initialschedule.
2. About a week before the project is due, you will create a revised schedule.
3. When you make your the final submission for your project, you will submit the finalsheet to document your time spent.
The schedule sheets themselves are online forms created at Web-CAT.
In the first phase, you will break your project down in to as many identifiable “pieces” asyou can. The more pieces, the better. The first schedule looks like this:
72

Joshua D. Martin Appendix C 73
Explicitly separating “phases” (design/code/test) for each task helps you to explicitly con-sider the necessary effort for each of these separate activities. Feel free to add other phasesas appropriate, perhaps such as “debug” separate from “test”.
On the later schedules, you will fill out two forms. The first looks like this and is only usedfor reporting effort expended so far:
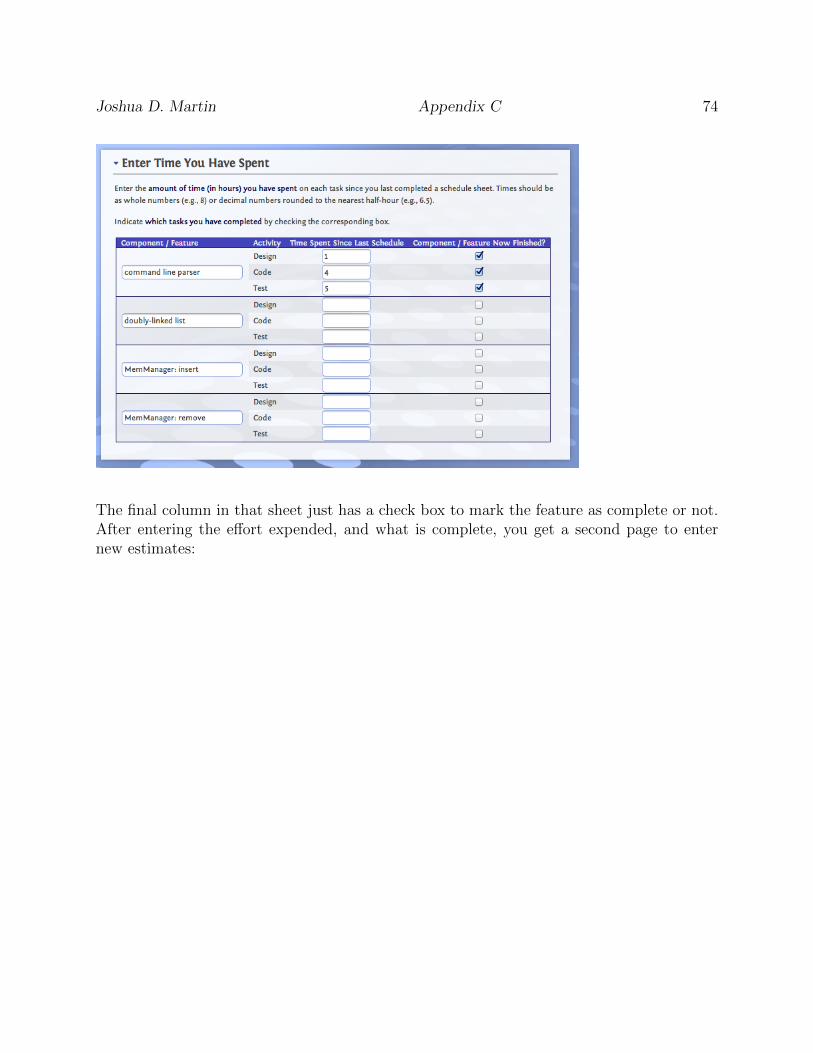
Joshua D. Martin Appendix C 74
The final column in that sheet just has a check box to mark the feature as complete or not.After entering the effort expended, and what is complete, you get a second page to enternew estimates:

Joshua D. Martin Appendix C 75
In this table, all but the rightmost two columns will already be filled in, and you will onlyenter the last two columns (and only for unfinished tasks–finished tasks wouldn’t require anyinfo).
The second page will contain appropriate highlighting/etc. to point out missed personaldeadlines, places where time invested exceeds the previous estimate, etc.
When you enter your “final” schedule after finishing the assignment, you will fill out onlythe first table (time spent since last schedule) rather than both tables.