Comprehensive School Improvement Plan South Laurel Middle ...

AC 2008-2810: EVALUATING A COMPREHENSIVE MIDDLE SCHOOLOUTREACH PROGRAM—THE RESULTS
Juanita Jo Matkins, College of William and MaryJuanita Jo Matkins is an Assistant Professor of Science Education at the College of William andMary. She was a K-12 teacher for 18 years, and the Virginia recipient of the 1995 PresidentialAward for Excellence in Secondary Science Teaching. She has written and published severalpapers and reports on various issues in teacher education, including assessment, gender andmulticultural issues in science education.
John A. McLaughlin, McLauglin AssociatesJohn McLaughlin is a senior consultant in strategic planning, performance measurement, andprogram evaluation. He is presently working on several project including the EnvironmentalProtection Agency, Health and Human Services Administration on Aging and Centers forMedicare and Medicaid Services, as well serving as the lead evaluation consultant to sevennational centers
Eugene Brown, Virginia Polytechnic Institute and State University Eugene Brown is Professor of Mechanical Engineering at Virginia Tech. In addition to theVirginia Demonstration Project, he has worked on a number of STEM outreach programs and haspublished several papers describing these activities. He teaches undergraduate and graduatecourses in thermodynamics and fluid mechanics.
Gail Hardinge, College of William and MaryGail Hardinge is an educational psychologist who has worked with the Va. Department ofEducation's Training and Technical Assistance Centers, at the College of William and Mary,providing professional development programs for teachers. She has worked in public educationfor twenty-two years and is an adjunct Assistant Professor at William and Mary, teaching coursesin collaborative consultation and assessment, as well serving as the college's VDP ProjectCoordinator.
Nancy West, College of William and MaryNancy West is the Curriculum Specialist on the Virginia Demonstration Project at the College ofWilliam and Mary. Her background includes teaching, from high school chemistry to communitycollege and college-level teaching of geology and science instructional methods. She has servedas coordinator of mathematics and science curriculum for a school district. Her interests andexperience focus on field studies and problem-based learning.
Robert Stiegler, Naval Surface Warfare Center, Dahlgren DivisionRobert Stiegler is currently supporting the USMC Targeting and Engagement Systems and theOffice of Naval Research, N-STAR initiative. His recent career experience has included serviceas a program manager for USMC science and technology programs, Science Advisor to theCommanding General, Fleet Marine Forces Atlantic, and Head, NAVSEA Combat SystemsSafety and Engineering Division.
Kirk Jenne, Office of Naval ResearchKirk Jenne is the director of the N-STAR (Naval Research--Science and Technology forAmerica's Readiness) program at the Office of Naval Research. He is on a rotational assignmentfrom the Naval Undersea Warfare Center in Newport, Rhode Island. His research interests are inocean engineering, materials, and underwater acoustics and sensors.
© American Society for Engineering Education, 2008
Page 13.572.1

© American Society for Engineering Education, 2008
Page 13.572.2

Evaluating a Comprehensive Middle School Outreach Program—
The Results
Abstract
In the three years of its existence, the Virginia Demonstration Project, a middle school STEM outreach program supported by the Office of Naval Research, has grown to reach more than 3000 7th and 8th graders in its academic year and summer camp programs, to involve more than 80 science and math teachers in its professional development activities, and to employ the services of nearly 50 Navy scientists and engineers who work side-by-side with the teachers in the classroom as facilitators, mentors, and role models. This paper describes how, in the context of a comprehensive logic model, comparison-group, pre- and post-testing, and focus group mixed-method (quantitative and qualitative) studies have been used to determine in a statistically significant fashion how the interventions of which this program consists can be tied to the measured achievements. Changes in the skills, knowledge, and attitudes of the teachers and students will be described as well as the influence of this program on changing student attitudes toward possible STEM careers. The human subjects-based research was conducted with the approval of the Institutional Review Board of the College of William & Mary. The results show that as a result of participating in the program, students have an increased interest in pursuing STEM careers and that they exhibit increased knowledge in and ability to use science and mathematics. Teachers indicate a high level of support for problem-based learning, which is a fundamental component of the program. The results are presented in a form of valuable results and broadly transferable methodologies that will inform a variety of K12 STEM outreach activities. The Program
Many studies have confirmed that America’s educational system is lacking. Listed under the title “Some Worrisome Indicators” in the Executive Summary of the National Academy of Engineering’s Rising Above the Gathering Storm (2005)1
, three particularly compelling statements can be found: 1) “Fewer than one-third of US 4th grade and 8th grade students performed at or above a level called “proficient” in mathematics, 2) “US 12th graders recently performed below the international average for 21 countries on a test of general knowledge in mathematics and science,” and 3) “In 1999, only 41% of US 8th grade students received instruction from a mathematics teacher who specialized in mathematics, considerably lower than the international average of 71%.” There is clearly ample room for improvement here. Segal and Yochelson (2006)2 remind us: “Top-down federal spending alone will not win the race for global leadership in science and technology. It will take a hands-on commitment from all involved in the US innovation enterprise to build world-class talent from the bottom up.” P
age 13.572.3

As if anticipating a need for such a “bottom up” commitment, in 2004, the Office of Naval Research established the Virginia Demonstration Project (VDP) as a part of its Naval Research—Science and Technology for America’s Readiness (N-STAR) program3. The VDP is a mentor-based, educational outreach program that uses Navy scientists and engineers working alongside teachers in the classroom to increase the level of interest among middle-school children in pursuing careers in science and engineering. This innovative, community-level program was funded by a Congressional appropriation sponsored by Senator John Warner (R-VA) and uses the scientists and engineers at the Naval Surface Warfare Center, Dahlgren Division (NSWC-DD) as mentors and role models. Over the four years that this program has been in existence, approximately $4.7M of federal funding has been received, split more or less equally between the school systems and NSWC-DD. By the end of the 2006-2007 school year, 3042 students, 86 teachers and 48 scientists and engineers had participated in the VDP. Fifty school counselors had participated in the counselor education programs. Ten different sets of professional development training activities were provided to professional co-teaching teams. Seventh and eighth graders in the public school systems in three counties immediately surrounding the NSWCDD were involved. These were Stafford, King George, and Spotsylvania counties. The Navy Perspective
From a Navy perspective, the essential feature of the Virginia Demonstration Project was to determine whether Naval Warfare Center scientists and engineers could effectively team with teachers in the classroom to stimulate a greater long-term interest among middle school students in science and mathematics. The VDP addresses the strategic vulnerability that our future Navy will face as a result of these generational, educational, and budgetary realities. The program is exploring whether working scientists and engineers with their real-world experiences can help shape positive perceptions about math and science among middle school students. More specifically, the VDP is testing whether we can inspire more young people to see the value and relevancy of a future career in science or engineering by:
• Showing pre-teens and teens that math and science are fascinating, fun, and socially relevant;
• Encouraging female and minority students to challenge uninformed thinking about their natural aptitudes in math, science, or engineering;
• Providing middle school teachers with opportunities to team teach with practicing scientists and engineers; and
• Leveraging the mentor-rich environment that we still have in our Naval Warfare Centers to help draw new talent into our science and technology workforce.
How Did We Do This?
The VDP has both an in-school and a summer school component. Forming the heart of the in-class component were Robotic Challenges that required the solution of problems having both a
Page 13.572.4

societal and Navy focus using LEGO MINDSTORMS equipment. The summer school component featured advanced Robotic Challenges and specially-constructed Breakout Experiments, which were used to illustrate specific mathematics and science topics. The Robotics Challenges were modeled after the activities of the FIRST LEGO League (FLL), a highly successful program that operates robotics competitions both throughout the US and internationally. With the help of the faculty from the School of Education of the College of William and Mary (W&M), two Robotics Challenges have been developed and supporting lesson plans and a companion Student Robotics Manual have been written. Landmines!, was directed at eighth graders, and focused on using robotics in mine-clearing, rescue, retrieval, and construction operations. The societal connection was provided by the humanitarian aspects of the (then current) news of the tragedy of the tsunami in Southeast Asia which required the location and retrieval of land and sea mines that were scattered by the event. The second Robotics Challenge, Crisis at a Coral Reef, was directed at seventh graders, and involved protecting marine animals from injuries resulting from an oil spill from a grounded freighter. This scenario was again inspired by a natural disaster--the recent hurricanes in the Gulf region of the US. Faculty from the School of Education of the College of William and Mary also provided professional development workshops on co-teaching, structuring and leading cooperative learning groups, and curricular connections for the robotics scenarios. With the help of the Navy mentors, faculty from William & Mary trained the teachers in the use of the LEGO MINDSTORMS kits and ROBOLAB software, which was the focus in much of the classroom and summer camp activities. As teachers became more familiar and comfortable with the project strategies and activities, professional development evolved into being offered mostly by the school divisions in collaboration with William & Mary faculty. In 2006-2007, much of the professional development was provided by experienced VDP teachers in the school divisions themselves. The Breakout Experiments used in the summer-camp program were selected to demonstrate a wide variety of science- and physics-based phenomena, involve appropriate math and problem solving tasks, provide team building opportunities, and be of interest and fun to a diverse group of students both with regard to gender and ability. An additional (and important aspect) was that the experiments were to exhibit a close connection to the Virginia Standards of Learning (SOL). The Navy mentors play a vital role in making both the in-class and the summer school components of the VDP work. Their technical expertise assists the teachers in making science and math more approachable and meaningful for their students, and their presence brings the professional world of the scientist and engineer into the classroom and thus enables the students to gain an appreciation of what engineers and scientists do. In the public educational system in the United States where less than half of the 8th grade math classes are taught by those with specialized mathematics training, the mentors can play a vital role in contributing to the building of an environment where students and teachers are willing to work together to create a truly collaborative learning community. Even in the three school systems in the VDP, where most of the mathematics teachers were highly qualified according to state and federal standards, the mentors played a critical role in meeting the goals of the project. P
age 13.572.5

Multiple strategies were adopted in both the academic year program and the summer camps to ensure females and minority students could benefit from the activities. The robotics scenarios were developed purposefully to show real-world benefits of science, mathematics, and engineering. The in-classroom implementation was considered a fundamental component since regular public school classes (neither advanced nor special education classes) are a heterogeneous mix of gender, race, ethnicity, and ability. The purposeful use of cooperative learning groups required students to vary their roles as researchers, builders, programmers, and prevented division of labor based on bias. Model lesson plans were developed by the William & Mary faculty to introduce all members of a cooperative learning group or team to building and programming before the robotics challenges were implemented. Competition was minimized in the in-classroom implementation, and was only a small component of the breakout experiments in the summer camps. Recruitment of Navy mentors included an effort to attract female, minority, and young professionals, as well as other scientists and engineers who welcomed the challenge of working toward the VDP goals. Anecdotal information told us that we were having a positive effect on at least some students and their teachers. It told us that the program was making a difference in the way students view careers in science and engineering and that many of the teachers involved in the program have embraced problem-based learning as the preferred method of instruction. In addition, there was documented evidence of success (albeit limited) of how effective the project was in stimulating a greater long-term interest among middle school students in science and mathematics and, more importantly, what features of the program were responsible for these effects.
Program Core Elements
In order to carry out a more systematic assessment if the program, it became clear that we would need to agree on what the core elements of the program were, what the nature of the “intervention” was, and how we wanted to define success. Only then would we be able to collect information that would enable us to properly evaluate the program. With this in mind, the College of William & Mary contracted for the services of a professional educational program evaluator who is the second author of this paper. The VDP Steering Committee agreed that the core elements of the program on which its evaluation would be based were:
1. To generate and sustain the interest and excitement of adolescents in careers in mathematics, physics, engineering and or other sciences;
2. To enhance the effectiveness of science and mathematics instruction; 3. To strengthen family and school support for students’ (particularly females and minority
students) achievement and interests in career paths in mathematics, science, technology and engineering;
4. To develop a cadre of Navy scientists and engineers for continuous outreach to educational communities as a part of their professional responsibilities; and
5. To develop, document, and evaluate the project.
Page 13.572.6
Program Evaluation
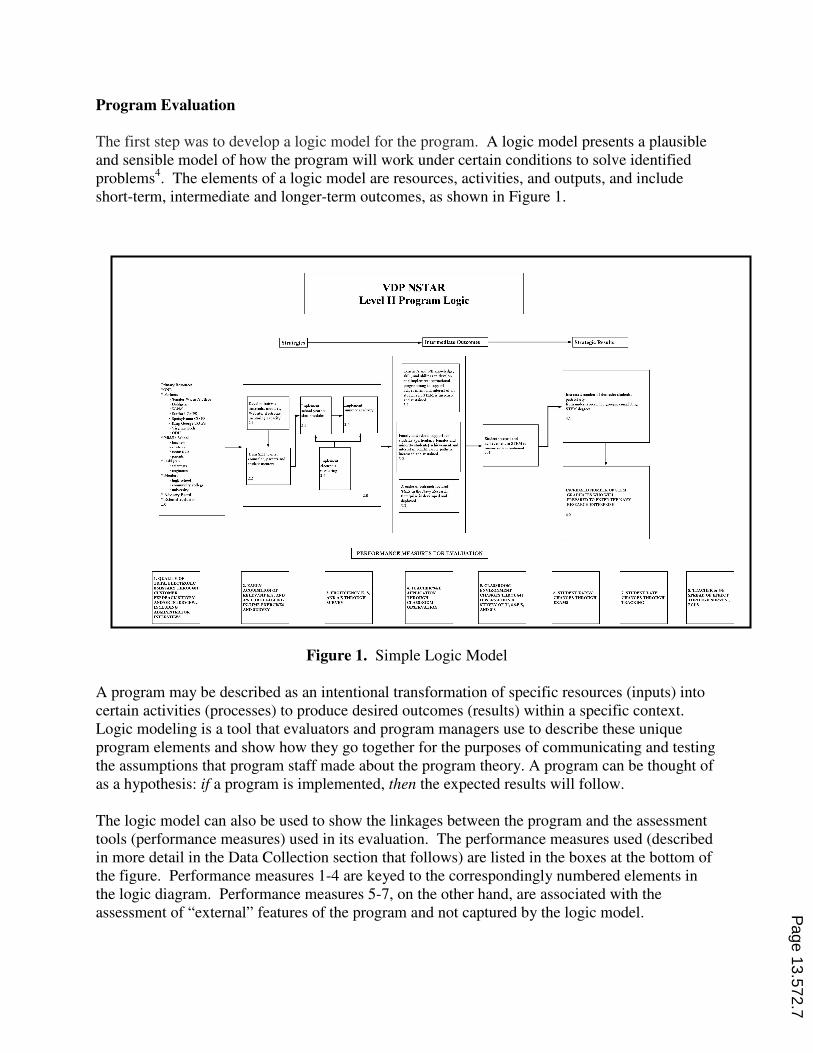
The first step was to develop a logic model for the program. A logic model presents a plausible and sensible model of how the program will work under certain conditions to solve identified problems4. The elements of a logic model are resources, activities, and outputs, and include short-term, intermediate and longer-term outcomes, as shown in Figure 1.
Figure 1. Simple Logic Model A program may be described as an intentional transformation of specific resources (inputs) into certain activities (processes) to produce desired outcomes (results) within a specific context. Logic modeling is a tool that evaluators and program managers use to describe these unique program elements and show how they go together for the purposes of communicating and testing the assumptions that program staff made about the program theory. A program can be thought of as a hypothesis: if a program is implemented, then the expected results will follow. The logic model can also be used to show the linkages between the program and the assessment tools (performance measures) used in its evaluation. The performance measures used (described in more detail in the Data Collection section that follows) are listed in the boxes at the bottom of the figure. Performance measures 1-4 are keyed to the correspondingly numbered elements in the logic diagram. Performance measures 5-7, on the other hand, are associated with the assessment of “external” features of the program and not captured by the logic model.
Page 13.572.7

Data Collection
Data was collected through a triangulated assessment approach, which included pre/post measures in the form of the N-STAR VDP Confidence and Satisfaction Survey, and content-based student questionnaires. There were four content-based questionnaires: mathematics, coral reefs, landmines, and robotics. Items were written for the first three questionnaires using Virginia Standards of Learning for mathematics and science, and the robotics questionnaire required students to respond to programming questions. In addition, teachers were administered pre/post efficacy assessments and all participants--teachers, students, scientists, engineers, and administrators--participated in structured focus groups. Structured observations were conducted in all three school divisions using The Classroom Observation Scale-Adapted (COS-A). Some classes received a pre/post COS-A in order to make comparisons over time. Prior to utilizing the COS-A, observers participated in a training to practice evaluating teacher and student classroom behavior. During observations, two observers independently rated students and teachers, then completed a consensus form. Pre/post parent surveys were administered during both the Stafford and King George summer camps. Student SOL data was also reviewed, when available. The Simple Logic Model was used to guide evaluation. The strategies and intermediate outcomes (Figure 1) were evaluated using various instruments. When appropriate valid and reliable instruments were available, they were adapted and used. When such instruments were not available, William & Mary faculty developed instruments for use in the project. Teacher self-confidence was measured using an instrument adapted from the Science Teaching Efficacy Belief Instrument (STEBI) developed by Enochs and Riggs (1990)7. Fidelity of implementation of the VDP activities was assessed with the Classroom Observation Scale, an observation instrument developed and validated by the W&M Center for Gifted Education (VanTassel-Baska, et al., 2004)5 Student confidence and satisfaction was measured using items from a survey developed by Cejka (2005)6 with additional items written by the W&M faculty. Other surveys used to measure student, teacher, and mentor confidence, attitudes, intentions, and satisfaction, were developed by W&M faculty. These surveys, questionnaires, and scales were administered when VDP professional development occurred, when VDP activities occurred, and when teacher and engineer groups gathered to discuss the results of implementation of VDP activities. William & Mary faculty developed a set of tests to evaluate student gain in two areas of classroom content, mathematics and science. These tests focused on content specific to curricular adaptations of the robotics scenarios. For example, the seventh grade science test dealt with understandings of coral reef ecosystems. In addition, a five-item test was developed to measure gain in programming skills. Queries about the instruments should be directed to the authors. Structured focus group interviews and interviews with administrators, teachers, and engineers were conducted by William & Mary faculty and staff and by members of the evaluation team. Student focus groups consisted of up to 10 students from a school, and administrators were asked to provide a diverse selection of students using the criteria (1) students who participated in VDP activities and (2) students with the potential to talk fluently about their experiences. All P
age 13.572.8

interviews were recorded, transcribed, and the transcriptions were analyzed for factors that supported the development of the Intermediate Outcomes in the logic model. Evaluations of the VDP were conducted in all three participating public school divisions. Information was obtained from students, teachers, technology specialists, parents, administrators in the 2006-2007 academic year and in the summer camps held the subsequent summer. When possible, pre and post test measures were used; however, there were variables such as inclement weather and teacher schedules that impacted the consistency of administration. Within each school section below, the reader is provided with an overview of instrumentation and the most salient aspects of the data collected. The complete set of evaluation results is available upon request from the authors. In an ideal world with a perfect project all the data would yield results that are undeniably conclusive. Social science researchers evaluate results from projects that reflect the complexity of human beings and human organizations. Thus, it did not surprise the authors to find results that were encouraging, puzzling, and sometimes mildly disappointing. In the following sections the authors have tried to provide a balanced reporting of the results from each school division while focusing on the critical aspects for considering future application of VDP approaches in other school divisions. With respect to the underlying goal of the VDP project, that is, to increase the number of students who go on to STEM careers, it is difficult to determine what changes in student intention and attitude would be sufficient to say this goal will be met in the future. While there were both quantitative and specifically qualitative data that suggests positive outcomes from the VDP, longitudinal studies will provide the true supporting evidence of whether changes in career choice will be evidenced. During a post implementation interview, scientist/engineer mentors provided a reality-check in terms of desired outcomes when they observed that a large increase in students pursuing STEM careers was unlikely. During the interviews they remarked that “even
an increase from 5% to 7% would be great!” Encouragingly, intermediate results to that effect are reported in this paper. Because of contextual variations across school divisions included in the program, the results will be presented as an embedded case study approach where individual divisions served as nested cases in the three-school division program.
Results
King George County King George is a rapidly transitioning rural county located between the Washington/Richmond metropolitan area and Virginia’s Northern Neck. There is one middle school. The school district had an enrollment of 3,979 in 2007 with 67.3% Caucasian, 24.1% African American, and 3.1% Hispanic. About 18% of students are economically disadvantaged and 11% are students with disabilities. The Naval Surface Warfare Center –Dahlgren Division (NSWC-DD) is located in King George County and is a major employer.
Page 13.572.9

Teachers in King George County Middle School implemented in-class VDP lessons during the 2006-2007 school year and also organized and delivered a summer camp for interested students. The implementation of Virginia Demonstration Project lessons in the King George classrooms occurred between middle November and middle April. The entire seventh grade class in King George County participated. In addition, King George held a summer camp where campers explored advanced-level Robotics Challenges for five days. The campers were selected from students in the 7th grade, with applications approved on a first-come, first-accepted, basis.
Type of Implementation Approximate Student Hours Number of Students
Involved
In-class 40 277 Summer Camp 35 26
Table 1. Implementation—King George County Schools.
In Classroom Content-Based Student Achievement
King George students completed mathematics, science, and robotics tests both before and after VDP implementation. These instruments were developed by William & Mary faculty to sample student knowledge and not the mastery of items at a typical classroom level. Thus 70% of the total possible score, for example a score of 7 in the first element of the table below, was not the goal. Rather, it was hoped that by exploring the robotics challenges, doing the research associated with the problem scenario, and participating in other complementary VDP lessons, students would register information gains at a measurable level. The mean scores for students in the science, mathematics, and robotics measures developed for the VDP increased from pre- to post-implementation. Observed increases from pre-to-post were all statistically significant at the 0.001 level. On average, the mean gain was about 1 point, with the greatest gain seen in mathematics (1.14) and the least in science (.84).
Measure Pre Post
Content Mean SD Mean SD t Sig
Science (possible score=10) (N=97)
4.52 1.62 5.66 1.57 7.26 .001
Mathematics (possible score=5) (N=105)
2.48 1.54 3.32 1.90 4.86 .001
Robotics (possible score=5) (N=85)
1.51 1.26 2.62 1.23 7.90 .001
Table 2. Content-Based Student Achievement—King George County Schools.
Page 13.572.10

In-Classroom Standardized Test Student Achievement The state of Virginia has instituted a testing program in all public schools in the state based on the Virginia Standards of Learning (SOL). Schools where 70% of the students do not pass the tests are at risk at many levels, including loss of autonomy resulting from being taken over by state officials. Of the three divisions involved in the VDP, King George school division was most concerned about SOL scores, understandably. In 2005-2006, neither the 7th nor the 8th grade math scores at King George Middle School met the criteria for meeting state standards in mathematics. As shown in the table below, the 7th grade SOL mathematics scores at King George Middle School in the first year of full VDP implementation reflected a significant increase from the previous year, from 32% passing the test in 2005-2006 to 53% passing in 2006-2007. The eighth grade at King George included students who participated in VDP the previous year, and they increased their pass rate on the Virginia mathematics SOL test to an impressive 82 percent.
Category 2005-2006 2006-2007
7th Grade, All Students 32% 53% 8th Grade, All Students 68% 82%
Table 3. Virginia SOL Mathematics—King George County Schools.
Though the items on the SOL tests were not directly related to VDP activities, administrators in King George had predicted improvement in the SOL scores as a result of VDP activities. When asked about a connection of VDP to student academic success, the Principal of King George Middle School responded: “Our scores on the SOL were in the 30
th percentile on last year’s
administration. We have to show that the N-STAR [VDP] goals were in line with the SOL goals
and objectives. Ms. West [a W&M trainer] has been here on a regular basis working with both
math and science teachers to ensure that we can infuse the N-STAR [VDP] curriculum and align
it with our own curriculum. It has worked really well. SOL tests take place in two weeks. You
usually lose students in math at this time of the year. However, I would say that our 7th
grade
students are rejuvenated.” After the SOL test results were published, the Assistant Principal commented that he credited VDP activities with the increased scores of the seventh graders.
In Classroom Student Confidence
The W&M staff developed the Confidence Satisfaction Questionnaire, which was administered to students at the completion of their academic year experience (N=189). The first section of the post assessment asked students to indicate the degree to which they liked mathematics and science, after experiencing the VDP lessons. Students were asked their level of agreement with positive statements regarding their attitudes. The data can be found below:
Page 13.572.11

Item Mean (Scale of 1-4) Standard Deviation
1. I really like math. 2.94 .879 2. I really like science 3.20 .692
The scale used was: 1 = Strongly Disagree; 2 = Disagree; 3 = Agree; 4 = Strongly Agree.
Table 4. Students’ STEM Interests Post-VDP —King George County Schools
A group of King George seventh graders were interviewed near the end of the academic year, and their comments revealed a wide range of affective, cognitive, and aspirational outcomes from doing the VDP lessons in their classes. They recognized that they had gained skill in solving problems, noting “You learn from your mistakes and you have to figure out how to solve
the problems by yourself.” Students became aware of their own ability to create programs, which came as a surprise to several; “I didn’t know I could program, but I did because I won 4
th place.
I didn’t realize I was so good.” These seventh graders recognized that the VDP lessons had enabled them to learn to appreciate other students who were different, to put aside cultural biases stemming from gender and other differences, and to become a contributing member of a team. One student observed, “The boys in
our group figured out that the two girls in the group could actually program.” Another said, “I
learned to cooperate with people who are different.” When asked what part of the project could be taken into other classes, a seventh grade responded, “the relationship with new friends. You
get to know them better and get along better.” Students reported affective gains that seemed to be based on their individual needs. One said, “I
learned how to be dependent on other people and not just do everything myself.” With regard to working in groups; “It taught me how to work in a group. I was a little shy at first.” Another commented, “I learned the independence of being able to know that I can do it.”
Summer Camp Results
The 25 King George students who participated in the week-long summer camp were a group of rising eighth graders. They had participated in VDP lessons in 2006-2007 as 7th graders, and had then submitted applications for the summer camp. The first 25 applications were accepted. Their interest in science, technology, engineering, and mathematics (STEM) topics at the beginning of the 2007 summer camp was reflected in consistently higher levels of affinity with these topics, compared to the 189 students who had participated in the earlier (2006-2007 academic year) VDP activities (Table 4). There is obviously an element of self-selection here, whether it is due to the parents who registered their children for the summer program or due to the students themselves is unclear.
Item Mean (Scale of 1-4) Standard Deviation
1. I really like math. 3.42 .584 2. I really like science 3.48 .653
Table 5. Students’ STEM Interests Pre-Summer Camp—King George County Schools
Page 13.572.12

In perhaps the most noteworthy responses from King George students relating to the VDP goals, campers at the end of camp indicated an increase in the probability that they would seek a career in a STEM-related field. The students stated that, when they entered camp, the probability was about half (3.00) that they would pursue a STEM career. At the end of camp the mean rating was 3.58. This increase of 0.58 pre-camp to post-camp is statistically significant at the 0.001 level. A sampling of the responses to survey questions about the camp activities shows that the campers consistently agreed that they learned key STEM skills as a result of being at the VDP camp.
As a result of participating camp, students: Mean Standard Deviation
Learned more about robotics. 3.38 .496 Learned more about what scientists & engineers do in their jobs.
3.27 .604
Learned more about working as part of a team. 3.23 .765 Learned more about real world issues. 3.04 .871 Were a valuable member of a team. 3.42 .504
The scale used was: 1 = Strongly Disagree; 2 = Disagree; 3 = Agree; 4 = Strongly Agree.
Table 6. Learning from Robotics Challenges—King George County Schools
The students rated the camp activities with respect to contributing to their learning. Student mean ratings indicated that all the camp daily activities were useful. The low mean rating was 2.96 (Egg drop contest) and the high was 3.42 (Research).
Camp Daily Activity Mean Standard Deviation
Electronics (Alarm System) 3.15 .732 Egg Drop Construction 3.04 .774 Egg Drop Contest 2.96 .824 Research 3.42 .578
The scale used was: 1 = Not at all Useful, 2 = Not Useful, 3 = Useful, 4 = Very Useful.
Table 7. Learning from Breakout Experiments—King George County Schools
Finally, campers provided a rating of their general satisfaction with their camp experience. The mean rating for general satisfaction was 8.09 on a 10-point scale.
Teacher Perspectives
Three seventh grade mathematics and three seventh grade science teachers at King George Middle School participated in VDP training and activities in the academic year 2006-2007. The three science teachers had some experience with VDP prior to the training; the three mathematics teachers had no such experience. Evaluation consisted of collection of teacher input judging the effectiveness of professional development and of the implementation of VDP activities in the
Page 13.572.13

classroom. The professional development consisted of after school and Saturday morning sessions that focused on VDP goals, strategies for directing cooperative learning groups, basic programming with ROBOLAB, introducing robotics and programming to students, co-teaching with other teachers and Navy mentors, and using the coral reef curriculum set. The results showed that teachers believed the professional development activities taught them skills relevant to the VDP. The items below represent a survey administered at the beginning and close of professional development sessions in the fall of 2006. Teachers were asked to rate their perception of their own level of expertise in the topics described.
Measure Pre Post
Items Mean SD Mean SD
1. Using co-teaching strategies in a class setting 2.33 1.37 3.17 .983 2. Using problem-based learning 2.33 .816 3.17 .408 3. Robotics programming 1.67 .816 2.50 .548 4. Using cooperative learning groups in your
classes 2.50 1.38 3.00 .632
5. Teaching N-STAR Scenarios 1.50 .837 2.33 .516
The rating scale was: 1=Explorer; 2=Novice; 3=Integrator; and, 4=Expert.
Table 8. Teacher Perspectives—King George County Schools
Teachers were interviewed near the end of the school year, and they commented on satisfying aspects of the project. One teacher reported, “My students asked for N-STAR [VDP] every week
and were no longer scared of math and science. That’s success!” Another measure of success from the teachers’ perspective was student gain in interpersonal skills, reflected in the comment, “success [was evident] when the greater majority of students learned to cooperate with people
they don’t know or normally get along with.” Administrators’ Perspectives
The principal of King George Middle School was new to her role this year but had been the assistant principal the previous year (2005-06), so she had some familiarity for implementing the VDP program in 2006-07. The assistant principal had known of the VDP during its first year of implementation but had not been directly involved. The principal and the assistant principal were interviewed separately. Both administrators commented positively on the impact of the program on both teachers and students. They remarked on impacts on classroom practice, student affect and student knowledge gain. They said: “It [VDP] is a good opportunity to use problem-based
learning in the classroom. It is an excellent way to get the classroom involved instead of just
giving the students notes. It is very hands-on.” And added: “It not only benefits the students
academically, but it is fun as well.” On a personal level: “It is a motivation for students. They
take ownership in the final product. The teachers also take pride in the program.” And finally, they said: “N-STAR [VDP] definitely brought in collaborative teaching. At first, some of the
math teachers were hesitant to combine with the science teachers. However, they all came
together and learned a lot. Some of the teachers do not like to give up control. In the end, all of
the teachers enjoyed the program and look forward to doing it again.”
Page 13.572.14

Sustainability of programs after external support ends is always an important question. Willingness to continue the program under these circumstances is a valid indicator of the value administrators place on the program and its results. Both administrators indicated that the program would be continued. The Principal observed, “Yes, King George Middle School would
still offer the program. I am very creative. A lot of it is not money. It is planning and we could
continue with and build on what we have in place now. We could have the teachers collaborate
over the summer and I could offer them comp time. I am not above grant writing either. It
seems there may be funding still next year.” The Assistant Principal noted, “We were planning
to continue it. We are going to use the materials from this year and do our own in-house staff
development. With the science and math teachers already doing the program and being trained
in it, we are pretty confident that we can pull it off. We would only need to buy the replacement
items. We had planned to continue it into next year regardless.” In summary, the comments and observations of the two school administrators demonstrate that they saw great value in the VDP program. Both seem well aware of the program’s intent and the strategies used to achieve projected VDP outcomes. Collaborative teaching, problem-based learning, and cooperative learning are evident. However the long-term connection between participation in the VDP and academic achievement and future employment decisions is less clear at this time. Yet, both have every intention of continuing the program even if funding is decreased or eliminated. Stafford County Stafford County is a mostly suburban area on the Interstate 95 corridor between Richmond and Washington, DC. One of the fastest growing counties in the state, school enrollment in 2007 was 26,582, with student population distribution at 64% Caucasian, 20.6% African-American and 8.8% are Hispanic. 16.3% of the student population is economically disadvantaged, 2.7% are English Language Learners, and 8.7% are students with disabilities. There are seven middle schools in Stafford County, and all have implemented the VDP project activities in the past. Stafford administrative staff and teachers were partners with the Navy and the College of William & Mary in developing the project, and Stafford was the first school system to pilot the VDP activities, in the spring of 2004. Stafford successfully implemented VDP activities in all middle schools in both the fall and spring semesters of 2005-2006. When news was received of the 2006-2007 budget cuts which meant a lack of engineer/mentor support, Stafford personnel decided to use available resources to sponsor a set of summer camps. In addition, several Stafford teachers chose to implement VDP activities in their classrooms without the previously enjoyed formal support of administrators. Evaluations were conducted of the two approaches used in Stafford County in 2006-2007: (1) the voluntary in-class program and (2) the summer camp. For the summer camp, applications were solicited from seventh grade students, and 115 campers were selected on a first-come, first-chosen basis. Students spent approximately 40 hours in VDP activities during the summer camp. Parents were also included in about four hours of selected VDP activities during the summer camp.
Page 13.572.15

Type of Implementation Approximate Student hours Number of Students
Involved
In-class 8-20 ~250 Summer Camp 40 115
Table 9. Implementation—Stafford County Schools
Teacher Perspectives—In Classroom Program
In the previous year of the VDP (2005-2006), about 50 Stafford County teachers led VDP activities in their classrooms. Despite the cut in federal funding for mentors and materials in 2006-2007 and the system-wide decision to put available resources toward the summer camp, eight teachers, most of whom had previous experience with VDP, volunteered to teach VDP robotics lessons in their classrooms. These lessons occurred at three different middle schools in Stafford, near the end of the 2006-2007 school year. The mode of implementation varied by teacher and school, with one five-teacher team implementing VDP lessons in all core content area classrooms (mathematics, science, language arts, and social studies), and teachers at other schools implementing mostly independently in their own classrooms. All the VDP lessons occurred after the end-of-year SOL testing was completed. The amount of student time allotted varied from an approximate low of 8 hours to a high of about 20 hours devoted to the lessons. Due to the abbreviated nature of the voluntary implementation some critical aspects of the VDP program were not emphasized. There were few efforts to develop career awareness in students, and little research into the problem scenario. The diversity of the implementation resulted from the volunteer nature of the in-class program. For these teachers, implementing the VDP lessons voluntarily meant coordinating the lessons and acquiring the materials needed without any extra time allotted to do so. The fact that ten classroom teachers accomplished this is, in itself, a result that must be noted. One teacher noted: “One of our biggest problems this year is that some of us had to stay until 6:30-7:00 at night just
to get it organized --- it took a lot of our personal time.”
Interviews were conducted with these ten teachers to determine why they took on the challenge of adding VDP lessons into their curriculum. They noted that students last year (2005-2006) had enjoyed and benefited greatly from the VDP lessons, and they didn’t want their 2006-2007 students to miss out. The teachers believed the problem solving and discovery aspects of the VDP lessons were beneficial to their students. No engineers participated formally in the lessons, though one engineer, who had worked with the teachers in the past, dropped by to check on the progress of the lessons. The robotics challenges used were really simple, possible due to the lack of time and absence of engineers. When teachers were asked about the impact of the activities on the students, their comments illustrated the appeal of the VDP activities to diverse populations, including special education students. One teacher remarked that special education students performed well with the VDP activities, “There were 135 students including special ed, 50 special education kids involved.
The ones you would expect to be special in this program are not. They are good with the robots
Page 13.572.16

with the hands-on, very excited with the programming.” Parents of special needs students were excited about the program. In the words of a Stafford teacher, “I had two parents of special
needs students that were ecstatic that their kids got to do what every other kid did, and they got
to meet other people.” Another teacher responded when asked about gender impact, “Several
girls got involved in programming. A couple who did not excel in academics at all really took off
in programming.” Despite the challenges involved in implementing voluntarily, the teachers believed the experiences were worthwhile. As one teacher noted: “We loved it and the kids loved it. The one
thing we bet is that all the kids will remember VDP after they leave.”
Using a scale of 1=Very dissatisfied to 10=Completely satisfied, the Stafford volunteer teachers’ rated their satisfaction with the VDP activities at a mean of 6, with a range of 5-7. One teacher commented that the program would be rated at “9” or even “10” if materials were available as they had been in previous years.
The volunteer satisfaction mean score of “6.0” is lower than the “7.6” rating of Spotsylvania teachers, who implemented VDP activities as part of a system-wide effort including organized professional development activities, support from administrators, and some (minimal) support from Navy mentors. This comparison indicates that teacher satisfaction is related to mentor support as well as a sense of being part of a system-wide effort. The fact that these Stafford teachers accomplished this implementation is laudatory, but it must be noted that conditions were not optimal, teacher end-point satisfaction was not high, and student outcomes were not reported. Too often teachers are expected to persevere with challenging situations without external support, and it would be unreasonable to expect optimal results in terms of the outcomes of the logic model without the coherent support provided through VDP professional development and mentor involvement. Summer Camp
At the beginning of the camp, students generally agreed that they liked mathematics and science, though the rating for mathematics was lower. Using a scale of 1=Strongly Disagree to 4=Strongly Agree, the mean rating for “I really like math” was 2.84 (SD = .970) and for “I really like science” was 3.26 (SD = .754). The number of students responding was 115. When asked to predict the probability of choosing a STEM career, on a scale of 1=Zero to 5=High, the mean response from the same students was 3.33 (SD.995).
In a noteworthy aspect of the summer camp results, at the end of the camp, students again rated their perception of change in their own career plans. There was a significant change observed by the campers in their own intentions related to becoming a professional in a STEM area.
Page 13.572.17

Please rate the probability that you will become a scientist, engineer, or mathematician in the future. Think back to before Camp and then, NOW.
Mean Standard
Deviation
Before this camp 2.78 1.14
t
Sig
Now that camp is over 3.57 1.14 9.13 .000
N=115. The scale was: 1 = Zero, 2 = Very Low, 3 = about half & half, 4 = High, 5 = Very High.
Table 10. Students’ Post-Camp Career Interests—Stafford County Schools
On the last day of the camp, students generally agreed that they had learned about key themes taught in the camp. The table below shows their responses.
As a result of participating in this Camp, students: Mean Standard Deviation
Learned more about robotics. 3.51 .588 Learned more about what scientists & engineers do in their jobs.
3.41 .603
Learned more about working as part of a team. 3.18 .691
Learned more about real world issues. 2.85 .815
Were valuable members of teams. 3.23 .607
N=115. The scale used was: 1 = Strongly Disagree; 2 = Disagree; 3 = Agree; 4 = Strongly Agree.
Table 11. Learning from Robotics Challenges—Stafford County Schools
Students rated the usefulness of camp daily activities. All activities were rated between Useful and Very Useful.
Camp Daily Activity Mean Standard Deviation
Water Balloon Launcher (Practice) 3.35 .665 Water Balloon Launcher (Competition) 3.11 .765 Egg Drop Construction 3.16 .679 Egg Drop Contest 3.14 .765 Electronics (Alarm System) 3.28 .840
N=115. The scale was: 1 = Not at all Useful, 2 = Not Useful, 3 = Useful, 4 = Very Useful.
Table 12. Learning from Breakout Experiments—Stafford County Schools
Campers were asked to rate the characteristics of the camp. The means for the majority of the responses were positive; indicating that campers enjoyed the camp and believed they gained a lot from the camp. Differences in these responses between the King George and Stafford campers proved interesting. The table below shows these comparisons.
Page 13.572.18

Stafford (N=115) King George (N=25) Camp Characteristic
Mean Standard
Deviation
Mean Standard
Deviation
Sufficient time to work on project 2.94 .798 3.12 .766 Team had enough work space 2.51 .851 3.27 .827 Entire team participated in the projects 2.77 .788 3.00 .632 I arrived at answers on my own 2.81 .790 2.92 .688 Team worked together to arrive at answers 2.83 .795 3.15 .464
The scale used was: 1 = Strongly Disagree, 2 = Disagree, 3 = Agree, 4 = Strongly Agree.
Table 13. Selected aspects of camp —Stafford and King George County Schools
There were two differences between the Stafford camp and King George camp that may explain the differences in these items. The King George campers had already worked together cooperatively during the academic year VDP program, as pointed out before, whereas teacher participation in the Stafford academic year program was voluntary and therefore many of the students did not have this experience. Furthermore, the cooperative groups for camp at Stafford had six campers per group, whereas the King George teams were smaller, containing four students. Comments from the King George student focus group, noted earlier in this paper, show a sense of satisfaction at learning to work with other people on a team. Though this aspect of the VDP activities may not seem directly related to the STEM goal of the VDP, it is indirectly critical to (1) increasing satisfaction and self-confidence in the social setting of schools, and (2) practicing workplace skills that are essential in the STEM enterprise. Lastly, Stafford campers were asked to rate their general satisfaction with the camp experience. The mean rating of 7.42 out of 10 for overall satisfaction with the camp indicates that, for the most part, students were satisfied with their experience. Parent Perspectives
An informational meeting was convened for parents and students who would be attending the Stafford Summer Camp. At the end of the meeting, parents were asked to predict the probability that their son or daughter attending camp would choose a STEM career. Generally, parents rated the probability that their sons or daughters attending the camp would choose a science, engineering, or mathematics career between about “half and half” and “high.” At the close of camp parents who visited on the last day were asked to rate their satisfaction with the camp. Fifty-seven parents responded. Parents gave a mean rating of 8.98 out of 10 for overall satisfaction with the camp.
Teacher and Mentor Perspectives
Eight NSWCDD scientists and engineers acted as mentors and helped organize the summer camp. The mentors and teachers agreed that the campers had the opportunity to use and expand upon a wide range of skills related to STEM careers, including exploring challenging math and
Page 13.572.19

science problems, and connecting math and science to real world applications. Selected items and responses relative to their expectations are illustrated below.
Item Mean Standard
Deviation
In this camp, students will have an opportunity to explore challenging math and science problems.
3.28 .669
In this camp, students will demonstrate real world problems and solutions through robotics.
3.33 .594
In this camp, students will connect math & science to real world applications.
3.00 .594
The scale was: 1 = Strongly Disagree, 2 = Disagree, 3 = Agree, 4 = Strongly Agree.
Table 14. Teacher and Mentor Perspectives —Stafford County Schools
Teachers and mentors were also asked to rate the degree to which certain camp daily activities were useful in achieving camp outcomes. Generally, mean ratings indicated that the teachers and mentors thought the daily activities were useful, and the results were similar to the campers’ responses appearing in Table 15, below. Lastly, professionals were asked to rate their level of satisfaction with their camp experience. The mean rating for general satisfaction of the camp was 8.25 out of 10, indicating a high degree of satisfaction. Junior Mentor Perspectives
In addition to teachers, scientists and engineers, 16 ninth-grade Stafford County students who participated in VDP in 2005 were selected to serve as junior mentors for the summer camp. These students worked with the teachers and mentors, and provided technical support and encouragement to the students. At the end of camp, the junior mentors were asked about their career plans. The mean rating for their responses (given below) is much higher than the value (3.33) that the seventh grade campers provided, indicating that the junior mentors were highly motivated to pursue a STEM career.
Item Mean Standard Deviation
If you had to predict, what is the probability that you will choose science, engineering, or mathematics as a career?
4.20 .941
N=15. The scale was: 1 = Zero , 2 = Very Low, 3 = about half and half, 4 = High, 5 = Very High.
Table 15. Mentors’ Post-Camp Career Interests—Stafford County Schools
This is not surprising since these mentors were chosen by their teachers for the quality of their performance in the VDP as seventh graders and thus represented in this sense a select group.
Page 13.572.20

Lastly the junior mentors were asked to rate their satisfaction with their camp experience. Junior mentors were generally satisfied with the camp, rating their satisfaction at 7.93 (SD 1.27) on a scale of 1 - 10. Spotsylvania County Spotsylvania County, consisting of 407 square miles, is located in eastern Virginia, midway between the Nation’s capital in Washington, D.C and the State capital of Richmond, both of which are about 50 miles distant. The district has seven middle schools and a total enrollment of 24,304 students in the year 2007, 66.8% Caucasian, 19.7% African American and 8.1% are Hispanic 23.5% of students are economically disadvantaged, 2.4% are English Language Learners, and 12.4% are students with disabilities. In the spring of 2007, eighth grade teachers in all seven Spotsylvania County middle schools implemented the Landmine! Robotics Challenge with about 50 students per school for a total student population doing VDP of 204. Two teachers from each school participated. Professional development, led by William & Mary faculty and Spotsylvania lead teachers, consisted of one full day of training as a review, since most of the Spotsylvania teachers had received training in VDP activities in 2005-2006. Topics for the training included managing cooperating learning groups, new lessons in the Landmines! curriculum, and hands-on training in use of a motion sensor and a robot to teach physical science concepts. A second full day of training was devoted to building and programming robots, and was led by a mentor from Dahlgren, assisted by lead teachers from Spotsylvania and the curriculum specialist from William & Mary. Each school worked from a curriculum plan created by a team of teachers, with leadership provided by the division’s Mathematics and Science Curriculum Supervisors. VDP lessons occurred during a specifically designated class period each day at midday. Each student spent approximately 33 hours on VDP lessons. Implementation in the spring of 2007 was very different from the implementation of this program the previous year due to the reduction in funding in 2006-2007 mentioned above in connection with the VDP implementation in Stafford County. A particularly heavy impact of the budget shortfall was the limited number of mentor hours available. Teachers and administrators in Spotsylvania chose to go ahead with the radically reduced availability of mentors. There was no summer camp.
Type of Implementation Approximate Student hours Number of Students Involved
In-class 33 204
Table 16. Implementation—Spotsylvania County Schools
A student questionnaire was administered at the conclusion of VDP activities. The initial section of the survey asked students about their interest in doing math and science.
Page 13.572.21

Item Mean (Scale of 1-4) Standard Deviation
1. I really like math. 2.93 .918 3. I really like science 2.77 .860
N= 204, The scale used was: 1 = Strongly Disagree; 2 = Disagree; 3 = Agree; 4 = Strongly Agree.
Table 17. Confidence and Satisfaction Questionnaire —Spotsylvania County Schools
Students were asked to rate their career aspirations prior to and following the VDP lessons. The data below indicate there was no change in aspirations following the VDP lessons in the eighth grade classrooms.
Pre (N=177) Post (N=204)
Statement Mean SD Mean SD t Sig
1. I am interested in becoming a scientist.
1.91 .811 1.90 .752 .064 .949
2. I am interested in becoming an engineer.
2.24 .977 2.18 .936 .587 .557
3. I am interested in becoming a mathematician.
1.78 .775 1.83 .819 .575 .566
Scale was: 1 = Strongly Disagree, 2 = Disagree, 3 = Agree, 4 = Strongly Agree.
Table 18. Student Career Interests—Spotsylvania County Schools
In the next section of this survey, students were asked to provide a rating of their level of confidence regarding various activities associated with VDP implementation. Post assessment ratings of confidence increased and two items showed statistically significant differences pre to post, items 3 (“Write ROBOLAB programs”) and 8 (“Programming abilities overall”). One additional item was near significance. Those items are shown in the table below:
Pre (N=177) Post (N=204)
Item Mean SD Mean SD t Sig
1. How confident are you that you can write programs with ROBOLAB?
3.11 1.04 3.53 1.25 3.35 .001
2. How confident are you of your understanding of basic engineering concepts such as force and motion?
3.17 1.06 3.37 1.15 1.70 .090
3. How confident are you of your computer programming abilities overall including other languages such as C++ or BASIC?
2.86 1.12 3.11 1.17 2.09 .038
A 5-point scale was used, 1 = not confident and 5 = very confident.
Table 19. Ratings of Confidence with STEM Topics —Spotsylvania County Schools
Page 13.572.22

It was expected that students working with the robotics activities would report gains in programming with ROBOLAB, and students also gained in confidence about programming abilities in general. The strong showing in perception of understanding about physics principles such as force and motion might be explained by the additional activities Spotsylvania teachers implemented, using a Vernier motion sensor and a robot to teach about speed, velocity, and acceleration in the physical science classes. Student focus group interviews were held at each Spotsylvania middle school, and students noted the connection of mathematics to the VDP lessons, as well as a wide range of other outcomes from the project. One student noted, “You actually use math—when you’re in math class you
think, “we’re never going to use this”. Students also commented that robotics was “Hard to
learn, but once you got it, you want to run with it!” A consistent theme in both the King George and Spotsylvania comments was the appreciation of the cooperative teamwork. Students commented on gains in appreciation of differences in people: “We learned to work in groups; learned to work with people you don’t know or don’t
like; got to really know people that you didn’t really know before; it made you work as a team
and count on each other”. Another response was “[I learned] social skills—start branching out
and meeting new people. It’s okay to be friends with an N-STAR [VDP] dork or geek…they are
successful.” Several student comments paralleled the insights of the seventh graders at King George. Like those seventh graders, these students gained awareness of their own abilities. In a statement tinged with passion, a student noted, “I am not a nerd; I am very, very intelligent; this project
helped a lot of people realize that they know more than they thought they did…gave self
confidence…and helped them come out of their box more.” According to these students, the VDP lessons helped them gain confidence in their own abilities: “Figuring things out yourself!” and also “[We learned] skills for working with others”, “[You]
learn to be patient; everyone gets to work at their own pace, instead of being overly structured.”
Teacher Professional Development Workshop and Program Perspectives
Staff from W&M, experienced Spotsylvania teachers, and Dahlgren staff conducted professional development workshops before the classroom implementation. There were 21 Spotsylvania teachers in attendance, three from each school. Teachers rated the professional development activities on whether they believed the activities helped them learn skills relevant to teaching VDP lessons. Review of data showed that teachers believed they gained skills in all but problem-based learning and co-teaching.
Page 13.572.23

The rating scale was: 1=Explorer, 2=Novice, 3=Integrator, and 4=Expert .
Table 20. Changes in Teacher Capabilities —Spotsylvania County Schools
When asked at the close of the workshop if they would recommend the VDP to a colleague, most said yes. Teachers’ general satisfaction rating for the workshop was moderate to high – mean of 7.04 on a scale of 1-10 where 10 equals superb. A meeting was held at the end of the VDP lessons in Spotsylvania, and eleven teachers attended. At the meeting teachers completed a survey asking about the project facilitators and also about their own plans for using VDP skills.
Item Mean SD
The project facilitators demonstrated a useful range of expertise. 3.27 .467
I am leaving this project with renewed interest in collaborating with colleagues to share information, plan and try new activities.
3.09 .701
1= strongly disagree and 4 = strongly agree
Table 21. Evaluation of Workshop —Spotsylvania County Schools
On a scale of 1-10, the teachers rated their general satisfaction with their VDP experience as 7.3.
Teacher Self-Confidence
W&M staff members adapted a Teacher Efficacy Belief Instrument using the Science Teaching Efficacy Belief Instrument (STEBI), a valid and reliable instrument developed by Enochs and Riggs (1990)7 and used extensively to measure teachers’ beliefs about teaching science. Teacher efficacy beliefs are a teacher’s judgment of his/her capability to bring about desired outcomes of student engagement and learning, and are referenced in Tschannen-Moran and Hoy (2001)8 and Bandura (1977)9. Given that studies have documented that strong self-efficacy beliefs are linked to high student achievement and increased student motivation (Henson, 2001)10, it seems reasonable to gauge change in these beliefs during teaching/learning experiences that have the potential to enhance teacher self-efficacy. The STEBI has been adapted for use in many studies of science teaching efficacy, as found in Ritter, et al (2002)11 and Moseley and Utley(2006)12.
Measure Pre Post
Items Mean SD Mean SD
1. Using co-teaching strategies in a class setting
2.87 .834 3.00 .707
2. Using problem-based learning 2.93 .799 2.85 .801 3. Robotics programming 2.00 .845 2.31 1.11 4. Using cooperative learning groups in your classes
3.07 .884 3.21 .802
Page 13.572.24

The items used for the VDP instrument were taken from the STEBI and related to a factor in the STEBI, Personal Science Teaching Efficacy (PSTE), which pertains to a teacher’s beliefs about outcomes the teacher can personally affect. Items asked teachers to rate their level of agreement with statements about their own skills and attitudes toward implementing VDP concepts and also toward general confidence as a teacher. Here is a sample of the items:
• I understand concepts in my content area well enough to be effective in teaching these concepts in the VDP project.
• I will typically be able to answer students’ questions about robotics and the problem-based learning lessons.
• I know what to do to turn students on to science, mathematics, and engineering. The instrument was administered before (N=20) and after (N=11) classroom implementation. For PSTE the pre and post means were 3.72 and 3.93. T-test analyses indicated statistical significance for the pre to post change for the PSTE scale.
Pre-Mean Pre Post-Mean Post t Sig
PSTE 3.72 .572 3.93 .349 1.09 .030
Table 22. Personal Teaching Efficacy Beliefs Related to VDP —Spotsylvania County Schools
The results of administration of the VDP version of the PSTE scale are encouraging. The scale that this was derived from, the STEBI, is considered a robust instrument that is predictive of teacher impact on students. The change in Spotsylvania teachers’ pre to post indicates positive gain and improvement in the teaching skills of Spotsylvania teachers who were trained in the VDP project.
Administrator Perspectives
Middle school administrators in Spotsylvania County were interviewed about their perceptions of the Virginia Demonstration Project and the results for students. These principals commented on the importance of financial support for the project, beyond what the school system could provide. All agreed that the VDP is an exciting project that “grabs the kids”, and a very positive result was that kids talked to their parents about what they were doing, which yielded good public relations for the schools. One principal stated: “Regardless of perspective - national security defense perspective, or the
more altruistic love of science and math, the program encourages students, particularly middle
level eighth grade (students) 13 and 14 year olds in science and math not from the abstract
formulas and theories and bookwork, but from real life. How do we apply these in real life to
not only expand science and math learning, but to save lives? The purpose of the program is to
engender the passion for learning out of the abstract into the applied level.”
Page 13.572.25

The group viewed the participation of the Navy engineers as critical, saying, “Navy engineers
are extremely important to the student experience. It would have been very tough to get along
without them last year because they bring so much knowledge.” They added, “It’s difficult for
one person to handle the volume of questions coming from 25 novice robotics students.”
Principals identified beneficial instructional outcomes from the VDP project:
• “Getting traditionally under-represented students excited about math and science
careers and technology learning.”
• “An opportunity to do inquiry based hands-on learning. They have a research
component that’s critical. They have to research the problem before they ever get to
do the mission. They have to understand the problem – the question. That really
helped students with the scientific investigation.”
• “A great benefit to the teachers in collaborating. This sets a structure to it.”
When asked about continuing the project if there were no funding for materials and engineer time, the principals admitted that this would be a difficult situation, especially since additional laptops were needed for the project. One principal stated, “If funds are eliminated, the program
is gone.”
School administrators are a necessary support for any in-classroom project; without the support of these same administrators in a substantive way (e.g., materials, encouragement, and time) innovative projects like the VDP are doomed. These administrators recognized many positive outcomes from their observations of the VDP activities, yet were pragmatic about the persistence of this innovation without external funding. Conclusions
Students completed VDP lessons with positive attitudes toward mathematics and science, and the students who participated in summer camp finished camp with a greater determination to pursue STEM careers. Teachers incorporated engaging and challenging STEM lessons while encouraging students to learn to work together toward a common goal. Students gained valuable lessons about working with others and learned to appreciate diverse classmates. In one school system where data was collected on teacher self-confidence, teachers increased their confidence during VDP lessons. Since research indicates that increases in teacher confidence yield increases in student achievement, this is an encouraging result. One school system, King George, employed VDP for both in-classroom and summer camp activities. Student outcomes from both the school year project and the summer camp were strong, and were stronger than either the school year alone project (Spotsylvania) and the summer camp alone project (Stafford). This indicates that coupling an in-classroom component with a summer camp provides a powerful vehicle for effecting change in knowledge, skills, and attitudes related to STEM careers. Funding issues constrained implementation more in the larger school systems, Stafford and Spotsylvania. In the pilot year, 2004-2005, VDP funds were directed toward implementation in
Page 13.572.26

Stafford only, and there were generous provisions for materials, professional development support including substitute teacher pay, and for Navy mentors. In 2005-2006, and Spotsylvania and King George were added to the school systems implementing the project. In the fall of 2006 school systems were notified that there would be no new funds for the project in that fiscal year. All three school systems chose how they would respond to the news. This was disruptive to the development of the VDP, and efforts are currently being made to include funding for VDP as a part of its annual budget rather than rely on year-by-year special Congressional appropriations. This would mean school systems would know the level of support in advance and could plan accordingly. When asked about future funding cuts. King George administrators expressed determination to continue the VDP project regardless of the funding prospects. In contrast, Spotsylvania administrators stated that the project was dead if funding ended. The fluctuations in funding provided an opportunity for the evaluation to show potential for sustainability and also to probe what value was added to the project through the funding. It is possible that a small school system such as King George has more flexibility in funding innovative programs because the total dollar amount is less and the coordination tasks are not as complex. The Spotsylvania administrators made it very clear, though, that they believed that the presence of mentors was essential for the success of initial implementation of the VDP activities. Eight Stafford school teachers voluntarily implemented VDP lessons and their experiences also support the importance of the Navy mentors. The activities these teachers implemented were simple robotics activities, and, even though many of these teacher-volunteers were experienced with VDP, they were unable to promote the more complex tasks with their students. Mentors provide additional and expert assistance when students are doing robotics, and they enable students to take on more challenging programming and building tasks. Anecdotal evidence from interviews with teachers and students indicates a change in the knowledge, skills, and behaviors of special education students who were involved in the program. Classes in the VDP project were “inclusion” classes, meaning that special education students with an Individualized Education Plan were included in all classroom activities. William & Mary faculty observed a wide range of special needs students who were actively involved, with needs ranging from autism to blindness. Just as special education students were successfully included, so were females. VDP professional development supported changes in perceptions about females. Strategies included emphasizing the need for relevance and real world impact in the problem-based learning scenarios, de-emphasizing competitive activities, as well as the use of heterogeneous cooperative learning teams that changed leadership roles regularly without consideration of gender, ethnicity, or special needs status. A teacher in Stafford noted that several girls learned to program, and to program notably well. The King George summer camp research project involved a real world event, Hurricane Katrina, and gave students the opportunity to develop strategies to help. During some planning meeting there was discussion of eliminating the research project from summer camp so the camp would be more fun, and the planners decided to keep the research project and to emphasize its
Page 13.572.27

relevance. The fact that Katrina project proved to be the most highly ranked activity in the King George camp shows the positive impact such an approach can have on students. Gender differences may also explain why the competitions in summer camp (Egg Drop Contest) were the least favored, though males could also be uncomfortable with a process that eliminates all but one team. In the academic year program, students in King George remarked that they learned that girls could program. In itself, these remarks from students show the endurance of the cultural bias of girls being less capable. Though the VDP activities led to girls taking roles of leadership and showing high levels of competence, the fact that students noticed the shift in their perceptions of females shows that activities such as these must continue. In addition, future evaluation efforts should parse out female and male responses to various tests and items found in the results section of this paper, yielding more information about what aspects of the project work best for females. The same should be done for minorities. Comments from teacher, administrator, and student focus groups in the three school systems about working with students who are “different” could be interpreted as students who are minority/English language learner/poor/special education, but there is not way as the data is currently collected to discriminate exactly what category of student is referred to in such comments. Data collection and evaluation were successful, but not perfect. There were cases where schools were unable, for various logistical and other reasons, to submit complete sets of data. Teachers have many other important things to do in the school day besides accommodate post-test administration. The research team for the VDP learned that additional dedicated personnel are needed to support efficient and reliable data collection. Also, implementation varied across the three sites to the extent that comparisons were difficult. This was true not only in the year of decreased funding (2006-2007) but was also true in previous years’ implementations of the VDP project. Also, a controlled study with a comparison group is needed to increase confidence in the results of the project activities.
Bibliographic Information
1. National Academy of Engineering (2005). Rising above the Gathering Storm: Energizing and Employing
America for a Brighter Economic Future, http://books.nap.edu/catalog/11463.html 2. Adam Segal and Yochelson, John (2006). “The Innovation Burden Must Be Shared,” Financial Times, 11
January 2006, p. 15. 3. Mc Laughlin, John A., Gail B. Hardinge, Eugene F. Brown, Kirk Jenne, Robert L. Stiegler, “Evaluating a
collaborative Middle School Outreach Program—The Strategy, The Results, and the Challenges, Proceedings of the 2007 American Society for Engineering Education Annual Conference & Exposition, Honolulu, HI, June 24-27, 2007, http://asee.org/acPapers/AC%202007Full2304.pdf.
4. Bickman, L., “The Functions of Program Theory,” Using Program Theory in Evaluation, New Directions for Program Evaluation, no. 33. San Francisco: Jossey-Bass, 1987.
5. VanTassel-Baska, J., Bracken, B., Avery, L., Drummond, D., Struck, J., Stambaugh, T., and Feng, A., (2004). The William and Mary classroom observation scales, revised teacher observation. In A Guide to Implementation
of Project Athena, Williamsburg: College of William and Mary. 6. Cejka, E. (2005). Inservice teachers’ approaches to open-ended engineering design problems and the
engineering design process. Unpublished Master’s Thesis, Tufts University.
Page 13.572.28
7. Enochs, L. G. and Riggs, I. M., (1990). “Further development of an elementary science teaching efficacy belief instrument: A preservice elementary scale,” School Science and Mathematics, 90, pp 694-706.
8. Tschannen-Moran, M. and Hoy, A. W. (2001). “Teacher efficacy: Capturing an elusive construct,” Teaching and Teacher Education 17, pp 783-805.
9. Bandura, A. (1977). “Self-efficacy: Toward a unifying theory of behavioral change,” Psychological Review, 84, pp. 191-215.
10. Henson, R. K., (2001). Teacher self-efficacy: Substantive implications and measurement dilemmas. ERIC Document Reproduction Service No:ED452208.
11. Ritter, J. M., Boone, W. J., and Rubba, P. A. (2001). “Development of an instrument to assess prospective elementary teacher self-efficacy beliefs about equitable science teaching and learning (SEBEST),” Journal of
Science Teacher Education, 12, 175-198. 12. Moseley, C. and Utley, J. (2006). “The effect of an integrated science and mathematics content-based course on
science and mathematics teaching efficacy of preservice elementary teachers,” Journal of Elementary Science
Education, 18(2), pp. 1-12.
Page 13.572.29