EvaluateMedTech World Preview 2016, Outlook to 2022
35
EvaluateMedTech ® World Preview 2016, Outlook to 2022 5th Edition – October 2016
Transcript of EvaluateMedTech World Preview 2016, Outlook to 2022

EvaluateMedTech®
World Preview 2016, Outlook to 2022
5th Edition – October 2016
Welcome to the EvaluateMedTech® World Preview 2016, Outlook to 2022
Our fifth annual EvaluateMedTech® World Preview brings together many of our analyses to provide a top level insight into the expected performance of the medtech industry between now and 2022. Based on EvaluateMedTech®’s coverage of the world’s leading medical device and diagnostic companies, the World Preview highlights trends in medtech including: consensus sales forecasts of leading industry analysts by device area to 2022; the top 20 companies in 2022; R&D spend current and future; FDA approvals; M&A; venture financing and IPOs. Complimentary copies of the full report can be downloaded at: www.evaluate.com/MedtechWorldPreview2016
EvaluateMedTech® World Preview 20162 Copyright © 2016 Evaluate Ltd. All rights reserved.

EvaluateMedTech® provides trusted global medtech market intelligence and consensus forecasts delivered through a single integrated and standardised platform, that easily integrates with your own analytical models. It allows medtech companies, financial institutions, consultancies, service providers and others to efficiently track, benchmark and forecast the sector so more time can be spent examining insights and making effective decisions to optimise performance.
To find out more about this report and Evaluate’s range of services for the life science sector please contact us:
North America: Alan Raider Tel: +1 617 573 9455 / Email: [email protected]
Rest of the World: Will Hau Tel: +44 (0)20 7377 0800 / Email: [email protected]
Japan: Hiroshi Yamazaki Tel: + 81 (0)80 1164 4754 / Email: [email protected]
For general questions: Christine Lindgren Tel: +1 617 866 3906 / Email: [email protected]
All intellectual property rights in this report remain that of Evaluate Ltd and/or its respective third party licensors. Whilst all reasonable steps have been taken to ensure that the data presented are accurate, Evaluate Ltd cannot accept responsibility for errors or omissions. Neither does Evaluate Ltd warrant the accuracy, merchantability or fitness for a particular purpose of the data. Nothing in the reports shall constitute investment, financial or legal advice and the contents of the reports are provided for information purposes only. The data is not intended to amount to advice and should not be used as a determining factor in any investment decision. This report may not be lent, resold, hired out or otherwise disposed of by way of trade in any form of binding or cover other than that in which it is published, without the prior written consent of Evaluate Ltd. Copyright © 2016 Evaluate Ltd. All rights reserved.
3 Copyright © 2016 Evaluate Ltd. All rights reserved.
About EvaluateMedTech®
EvaluateMedTech® World Preview 2016
Foreword
4 Copyright © 2016 Evaluate Ltd. All rights reserved.
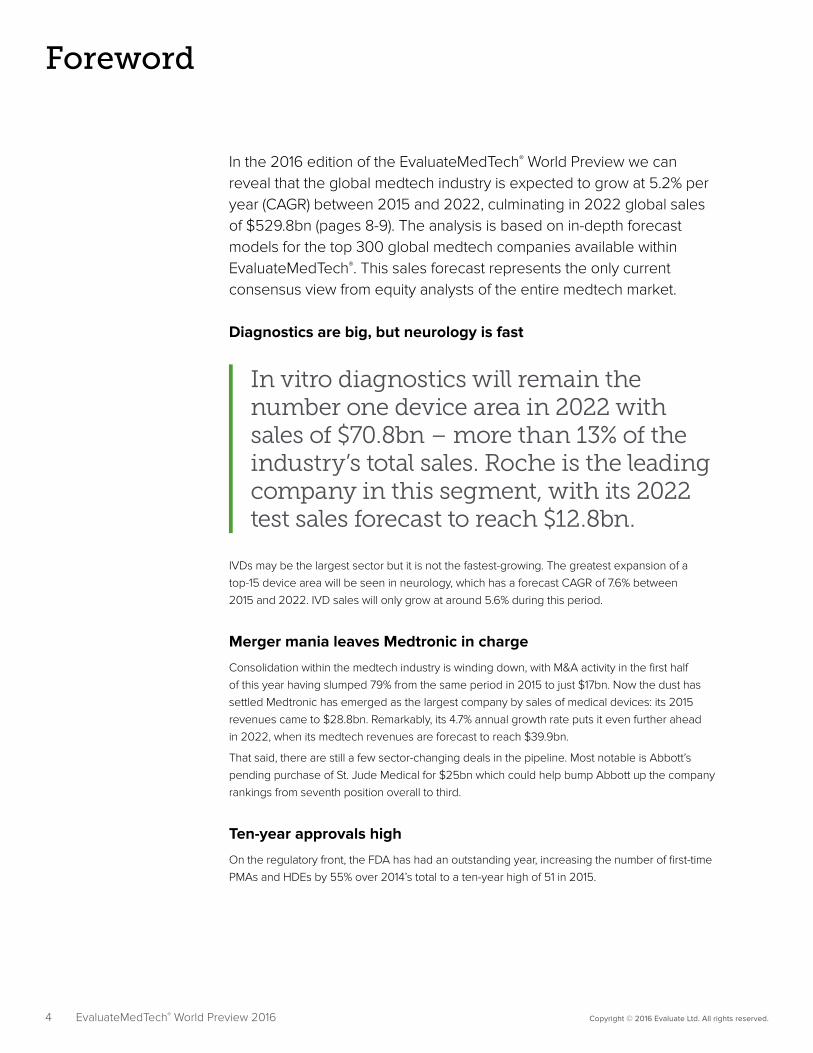
In the 2016 edition of the EvaluateMedTech® World Preview we can reveal that the global medtech industry is expected to grow at 5.2% per year (CAGR) between 2015 and 2022, culminating in 2022 global sales of $529.8bn (pages 8-9). The analysis is based on in-depth forecast models for the top 300 global medtech companies available within EvaluateMedTech®. This sales forecast represents the only current consensus view from equity analysts of the entire medtech market.
Diagnostics are big, but neurology is fast
IVDs may be the largest sector but it is not the fastest-growing. The greatest expansion of a top-15 device area will be seen in neurology, which has a forecast CAGR of 7.6% between 2015 and 2022. IVD sales will only grow at around 5.6% during this period.
Merger mania leaves Medtronic in charge
Consolidation within the medtech industry is winding down, with M&A activity in the first half of this year having slumped 79% from the same period in 2015 to just $17bn. Now the dust has settled Medtronic has emerged as the largest company by sales of medical devices: its 2015 revenues came to $28.8bn. Remarkably, its 4.7% annual growth rate puts it even further ahead in 2022, when its medtech revenues are forecast to reach $39.9bn.
That said, there are still a few sector-changing deals in the pipeline. Most notable is Abbott’s pending purchase of St. Jude Medical for $25bn which could help bump Abbott up the company rankings from seventh position overall to third.
Ten-year approvals high
On the regulatory front, the FDA has had an outstanding year, increasing the number of first-time PMAs and HDEs by 55% over 2014’s total to a ten-year high of 51 in 2015.
In vitro diagnostics will remain the number one device area in 2022 with sales of $70.8bn – more than 13% of the industry’s total sales. Roche is the leading company in this segment, with its 2022 test sales forecast to reach $12.8bn.
EvaluateMedTech® World Preview 2016
Foreword
5 Copyright © 2016 Evaluate Ltd. All rights reserved.
That said, the pace seems to have slowed slightly since. EvaluateMedTech® found that up to the end of August 2016, the FDA had issued 27 first-time PMAs, slightly down on the 2015 figure of 30 at this time point. As if to compensate, over the same period there were 15 de novo 510(k) clearances, a 50% increase over the same point last year.
EvaluateMedTech® World Preview 2016
Overall the device industry is growing reasonably rapidly, and the calming of the M&A scene is no bad thing. Already the sector is seeing a resurgence of smaller tuck-in deals on which start-ups, a significant source of disruptive new technologies, depend.
Ian StricklandProduct Manager, EvaluateMedTech®
Elizabeth CairnsMedtech Reporter
Analysis Highlights
6 Copyright © 2016 Evaluate Ltd. All rights reserved.
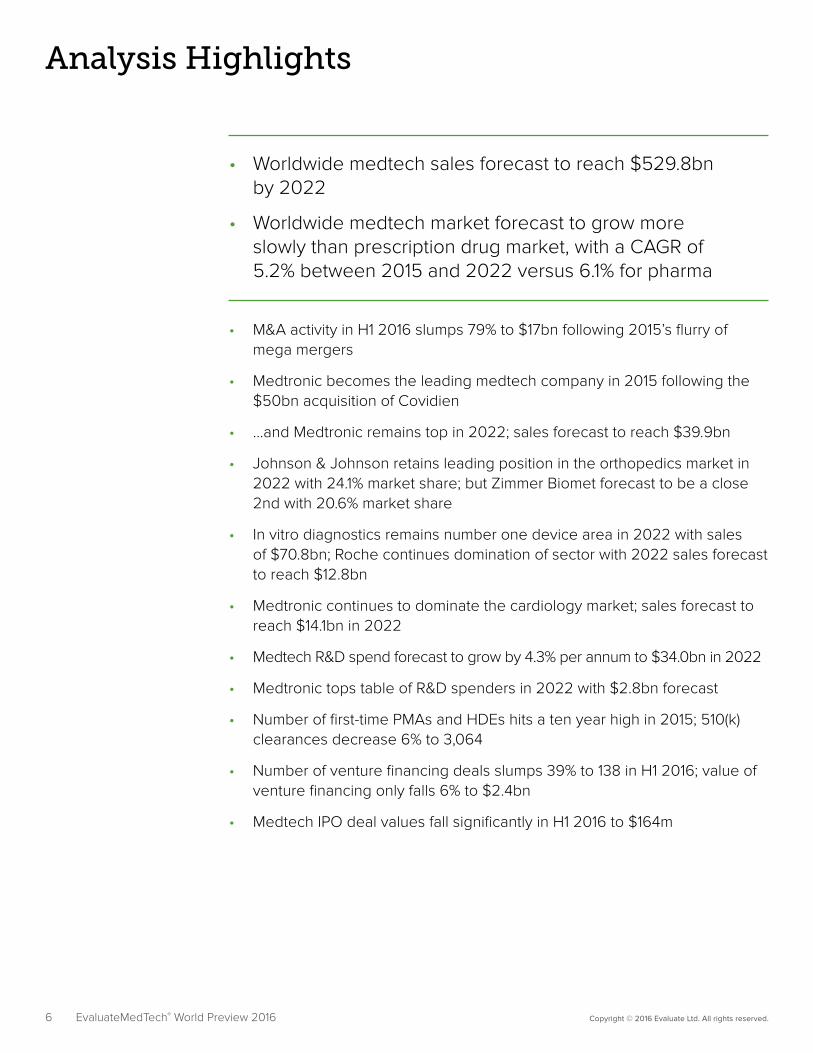
• Worldwide medtech sales forecast to reach $529.8bn by 2022
• Worldwide medtech market forecast to grow more slowly than prescription drug market, with a CAGR of 5.2% between 2015 and 2022 versus 6.1% for pharma
• M&A activity in H1 2016 slumps 79% to $17bn following 2015’s flurry of mega mergers
• Medtronic becomes the leading medtech company in 2015 following the $50bn acquisition of Covidien
• …and Medtronic remains top in 2022; sales forecast to reach $39.9bn
• Johnson & Johnson retains leading position in the orthopedics market in 2022 with 24.1% market share; but Zimmer Biomet forecast to be a close 2nd with 20.6% market share
• In vitro diagnostics remains number one device area in 2022 with sales of $70.8bn; Roche continues domination of sector with 2022 sales forecast to reach $12.8bn
• Medtronic continues to dominate the cardiology market; sales forecast to reach $14.1bn in 2022
• Medtech R&D spend forecast to grow by 4.3% per annum to $34.0bn in 2022
• Medtronic tops table of R&D spenders in 2022 with $2.8bn forecast
• Number of first-time PMAs and HDEs hits a ten year high in 2015; 510(k) clearances decrease 6% to 3,064
• Number of venture financing deals slumps 39% to 138 in H1 2016; value of venture financing only falls 6% to $2.4bn
• Medtech IPO deal values fall significantly in H1 2016 to $164m
EvaluateMedTech® World Preview 2016
Table of Contents
7 Copyright © 2016 Evaluate Ltd. All rights reserved.
Contents
8 Worldwide Medtech Sales by Device Area in 2022
10 Worldwide Medtech Sales in 2015: Top 20 Companies
12 Worldwide Medtech Sales in 2022: Top 20 Companies
14 Worldwide Medtech vs. Prescription Drug Sales (2009-22)
16 Worldwide Medtech R&D Spend (2009-22)
17 Medtech R&D Spend in 2022: Top 20 Companies
19 FDA Regulatory Analysis (2008-15)
21 2016 FDA First-Time PMAs, HDEs and 510(k) De Novo Clearances
24 In Vitro Diagnostics (IVD) Market to 2022
25 Cardiology Market to 2022
26 Diagnostic Imaging Market to 2022
27 Orthopedics Market to 2022
28 Ophthalmics Market to 2022
29 M&A Analysis: 2011 to H1 2016
31 Venture Financing Analysis: 2011 to H1 2016
33 IPO Analysis: 2014 to H1 2016
EvaluateMedTech® World Preview 2016
Worldwide Medtech Sales by Device Area in 2022
part 1 of 2
Source: EvaluateMedTech® September 2016Analysis on Top 10 Device Areas in 2022, Market Share & Sales Growth (2015-22)
WW
Mar
ket S
hare
% in
20
22
0%
8%
10%
2%
4%
6%
12%
14%
16%
18%
+3.0% +3.5% +4.0% +4.5% +5.0% +5.5% +6.0% +6.5% +7.0% +7.5%
Diagnostic Imaging
Orthopedics
Ophthalmics
Cardiology
General & Plastic Surgery
DrugDelivery
Endoscopy
In Vitro Diagnostics (IVD)
Wound Management Dental
% Sales Growth: CAGR 2015-22
Note: Size of Bubble = WW Sales in 2022
8 Copyright © 2016 Evaluate Ltd. All rights reserved.
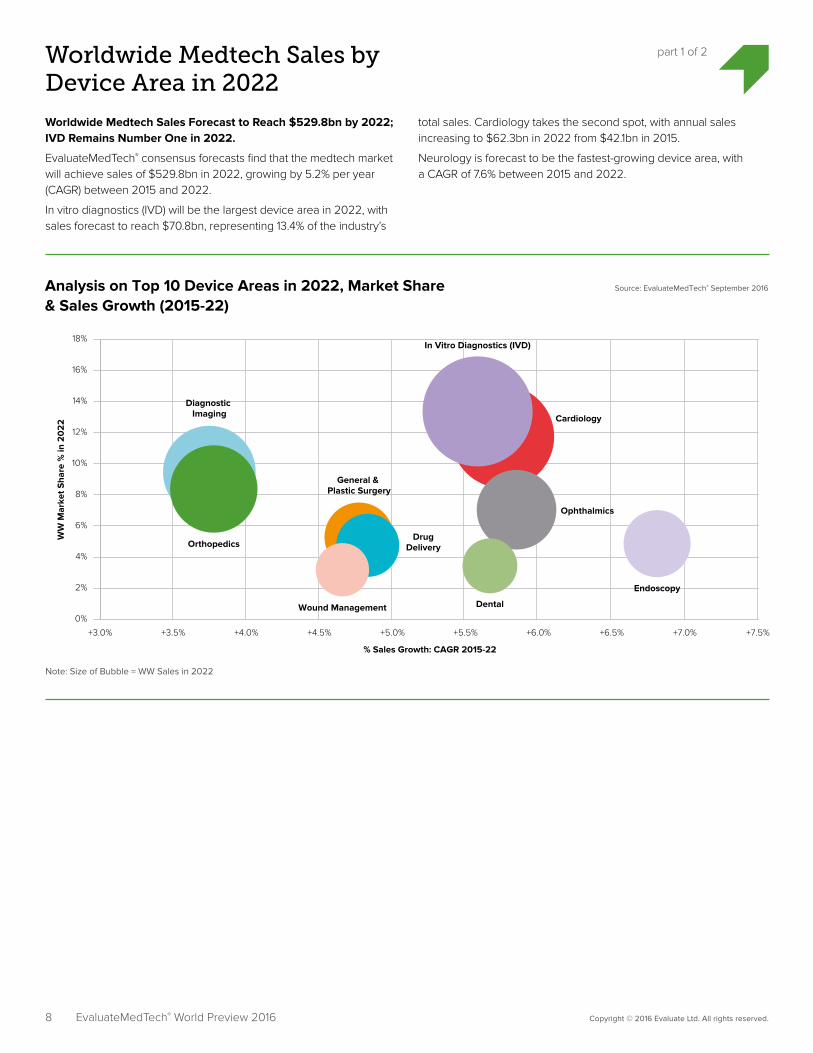
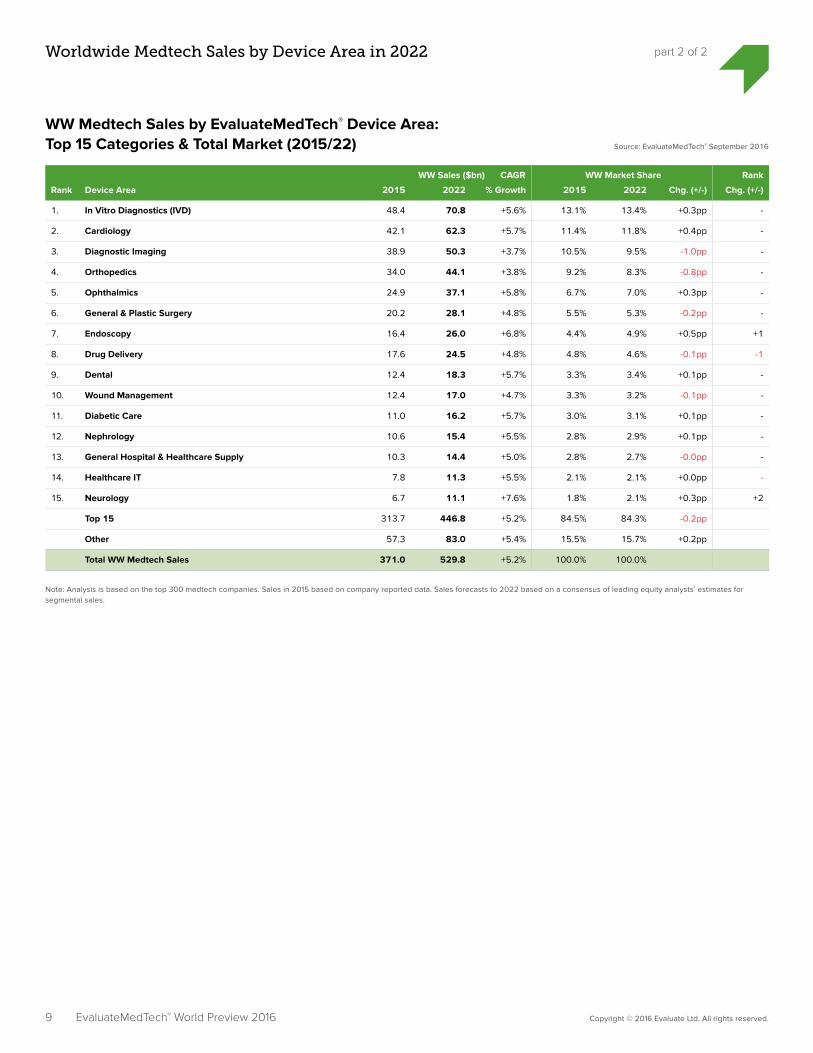
Worldwide Medtech Sales Forecast to Reach $529.8bn by 2022; IVD Remains Number One in 2022.
EvaluateMedTech® consensus forecasts find that the medtech market will achieve sales of $529.8bn in 2022, growing by 5.2% per year (CAGR) between 2015 and 2022.
In vitro diagnostics (IVD) will be the largest device area in 2022, with sales forecast to reach $70.8bn, representing 13.4% of the industry’s
total sales. Cardiology takes the second spot, with annual sales increasing to $62.3bn in 2022 from $42.1bn in 2015.
Neurology is forecast to be the fastest-growing device area, with a CAGR of 7.6% between 2015 and 2022.
EvaluateMedTech® World Preview 2016
9 Copyright © 2016 Evaluate Ltd. All rights reserved.
Worldwide Medtech Sales by Device Area in 2022 part 2 of 2
EvaluateMedTech® World Preview 2016
WW Sales ($bn) CAGR WW Market Share Rank
Rank Device Area 2015 2022 % Growth 2015 2022 Chg. (+/-) Chg. (+/-)
1. In Vitro Diagnostics (IVD) 48.4 70.8 +5.6% 13.1% 13.4% +0.3pp -
2. Cardiology 42.1 62.3 +5.7% 11.4% 11.8% +0.4pp -
3. Diagnostic Imaging 38.9 50.3 +3.7% 10.5% 9.5% -1.0pp -
4. Orthopedics 34.0 44.1 +3.8% 9.2% 8.3% -0.8pp -
5. Ophthalmics 24.9 37.1 +5.8% 6.7% 7.0% +0.3pp -
6. General & Plastic Surgery 20.2 28.1 +4.8% 5.5% 5.3% -0.2pp -
7. Endoscopy 16.4 26.0 +6.8% 4.4% 4.9% +0.5pp +1
8. Drug Delivery 17.6 24.5 +4.8% 4.8% 4.6% -0.1pp -1
9. Dental 12.4 18.3 +5.7% 3.3% 3.4% +0.1pp -
10. Wound Management 12.4 17.0 +4.7% 3.3% 3.2% -0.1pp -
11. Diabetic Care 11.0 16.2 +5.7% 3.0% 3.1% +0.1pp -
12. Nephrology 10.6 15.4 +5.5% 2.8% 2.9% +0.1pp -
13. General Hospital & Healthcare Supply 10.3 14.4 +5.0% 2.8% 2.7% -0.0pp -
14. Healthcare IT 7.8 11.3 +5.5% 2.1% 2.1% +0.0pp -
15. Neurology 6.7 11.1 +7.6% 1.8% 2.1% +0.3pp +2
Top 15 313.7 446.8 +5.2% 84.5% 84.3% -0.2pp
Other 57.3 83.0 +5.4% 15.5% 15.7% +0.2pp
Total WW Medtech Sales 371.0 529.8 +5.2% 100.0% 100.0%
WW Medtech Sales by EvaluateMedTech® Device Area: Top 15 Categories & Total Market (2015/22) Source: EvaluateMedTech® September 2016
Note: Analysis is based on the top 300 medtech companies. Sales in 2015 based on company reported data. Sales forecasts to 2022 based on a consensus of leading equity analysts’ estimates for segmental sales.
10 Copyright © 2016 Evaluate Ltd. All rights reserved.
Worldwide Medtech Sales in 2015: Top 20 Companies
part 1 of 2
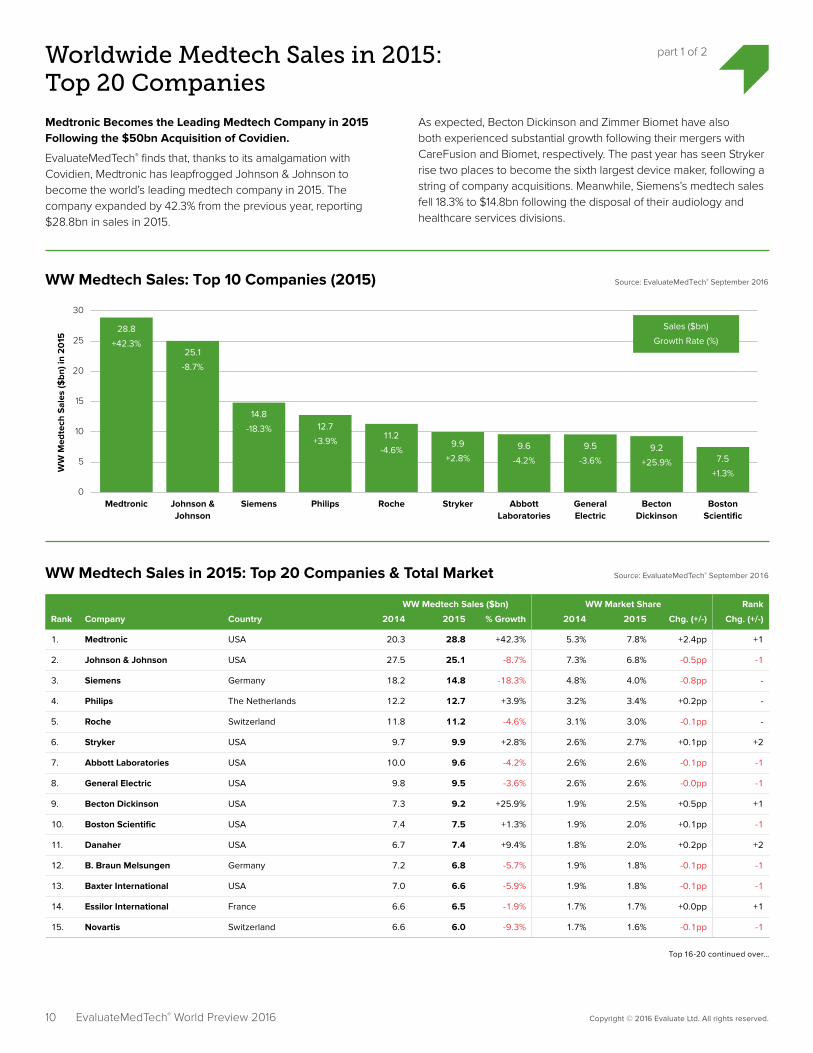
Medtronic Becomes the Leading Medtech Company in 2015 Following the $50bn Acquisition of Covidien.
EvaluateMedTech® finds that, thanks to its amalgamation with Covidien, Medtronic has leapfrogged Johnson & Johnson to become the world’s leading medtech company in 2015. The company expanded by 42.3% from the previous year, reporting $28.8bn in sales in 2015.
As expected, Becton Dickinson and Zimmer Biomet have also both experienced substantial growth following their mergers with CareFusion and Biomet, respectively. The past year has seen Stryker rise two places to become the sixth largest device maker, following a string of company acquisitions. Meanwhile, Siemens’s medtech sales fell 18.3% to $14.8bn following the disposal of their audiology and healthcare services divisions.
WW
Med
tech
Sal
es ($
bn) i
n 2
015
5
10
15
20
25
30
Medtronic
28.8
+42.3%
Johnson &Johnson
25.1
-8.7%
Siemens
14.8
-18.3%
Philips
12.7
+3.9%
Roche
11.2
-4.6%
Stryker
9.9
+2.8%
AbbottLaboratories
9.6
-4.2%
GeneralElectric
9.5
-3.6%
BectonDickinson
9.2
+25.9%
BostonScientific
7.5
+1.3%
Sales ($bn)
Growth Rate (%)
Source: EvaluateMedTech® September 2016WW Medtech Sales: Top 10 Companies (2015)
0
EvaluateMedTech® World Preview 2016
WW Medtech Sales ($bn) WW Market Share Rank
Rank Company Country 2014 2015 % Growth 2014 2015 Chg. (+/-) Chg. (+/-)
1. Medtronic USA 20.3 28.8 +42.3% 5.3% 7.8% +2.4pp +1
2. Johnson & Johnson USA 27.5 25.1 -8.7% 7.3% 6.8% -0.5pp -1
3. Siemens Germany 18.2 14.8 -18.3% 4.8% 4.0% -0.8pp -
4. Philips The Netherlands 12.2 12.7 +3.9% 3.2% 3.4% +0.2pp -
5. Roche Switzerland 11.8 11.2 -4.6% 3.1% 3.0% -0.1pp -
6. Stryker USA 9.7 9.9 +2.8% 2.6% 2.7% +0.1pp +2
7. Abbott Laboratories USA 10.0 9.6 -4.2% 2.6% 2.6% -0.1pp -1
8. General Electric USA 9.8 9.5 -3.6% 2.6% 2.6% -0.0pp -1
9. Becton Dickinson USA 7.3 9.2 +25.9% 1.9% 2.5% +0.5pp +1
10. Boston Scientific USA 7.4 7.5 +1.3% 1.9% 2.0% +0.1pp -1
11. Danaher USA 6.7 7.4 +9.4% 1.8% 2.0% +0.2pp +2
12. B. Braun Melsungen Germany 7.2 6.8 -5.7% 1.9% 1.8% -0.1pp -1
13. Baxter International USA 7.0 6.6 -5.9% 1.9% 1.8% -0.1pp -1
14. Essilor International France 6.6 6.5 -1.9% 1.7% 1.7% +0.0pp +1
15. Novartis Switzerland 6.6 6.0 -9.3% 1.7% 1.6% -0.1pp -1
WW Medtech Sales in 2015: Top 20 Companies & Total Market Source: EvaluateMedTech® September 2016
Top 16-20 continued over…
1 1 Copyright © 2016 Evaluate Ltd. All rights reserved.
Worldwide Medtech Sales in 2015: Top 20 Companies part 2 of 2
EvaluateMedTech® World Preview 2016
WW Medtech Sales ($bn) WW Market Share Rank
Rank Company Country 2014 2015 % Growth 2014 2015 Chg. (+/-) Chg. (+/-)
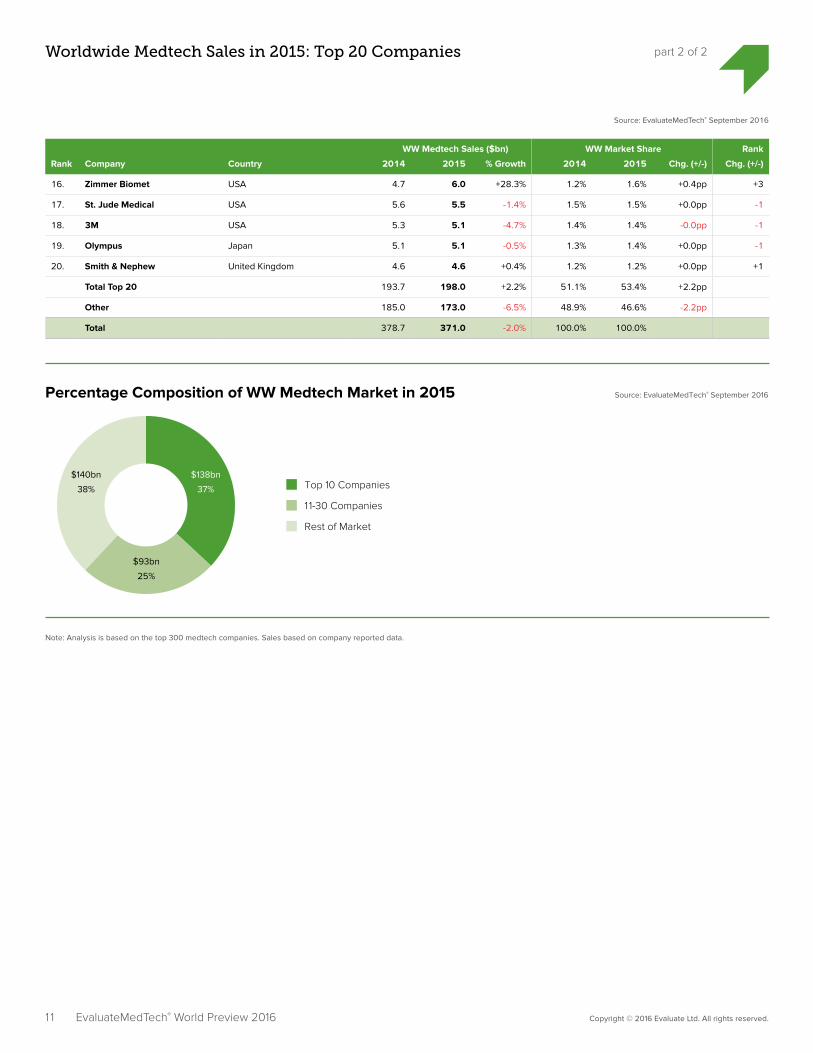
16. Zimmer Biomet USA 4.7 6.0 +28.3% 1.2% 1.6% +0.4pp +3
17. St. Jude Medical USA 5.6 5.5 -1.4% 1.5% 1.5% +0.0pp -1
18. 3M USA 5.3 5.1 -4.7% 1.4% 1.4% -0.0pp -1
19. Olympus Japan 5.1 5.1 -0.5% 1.3% 1.4% +0.0pp -1
20. Smith & Nephew United Kingdom 4.6 4.6 +0.4% 1.2% 1.2% +0.0pp +1
Total Top 20 193.7 198.0 +2.2% 51.1% 53.4% +2.2pp
Other 185.0 173.0 -6.5% 48.9% 46.6% -2.2pp
Total 378.7 371.0 -2.0% 100.0% 100.0%
Source: EvaluateMedTech® September 2016
Source: EvaluateMedTech® September 2016Percentage Composition of WW Medtech Market in 2015
Top 10 Companies
11-30 Companies
Rest of Market
$140bn
38%
$138bn
37%
$93bn
25%
Note: Analysis is based on the top 300 medtech companies. Sales based on company reported data.
12 Copyright © 2016 Evaluate Ltd. All rights reserved.
Worldwide Medtech Sales in 2022: Top 20 Companies
part 1 of 2
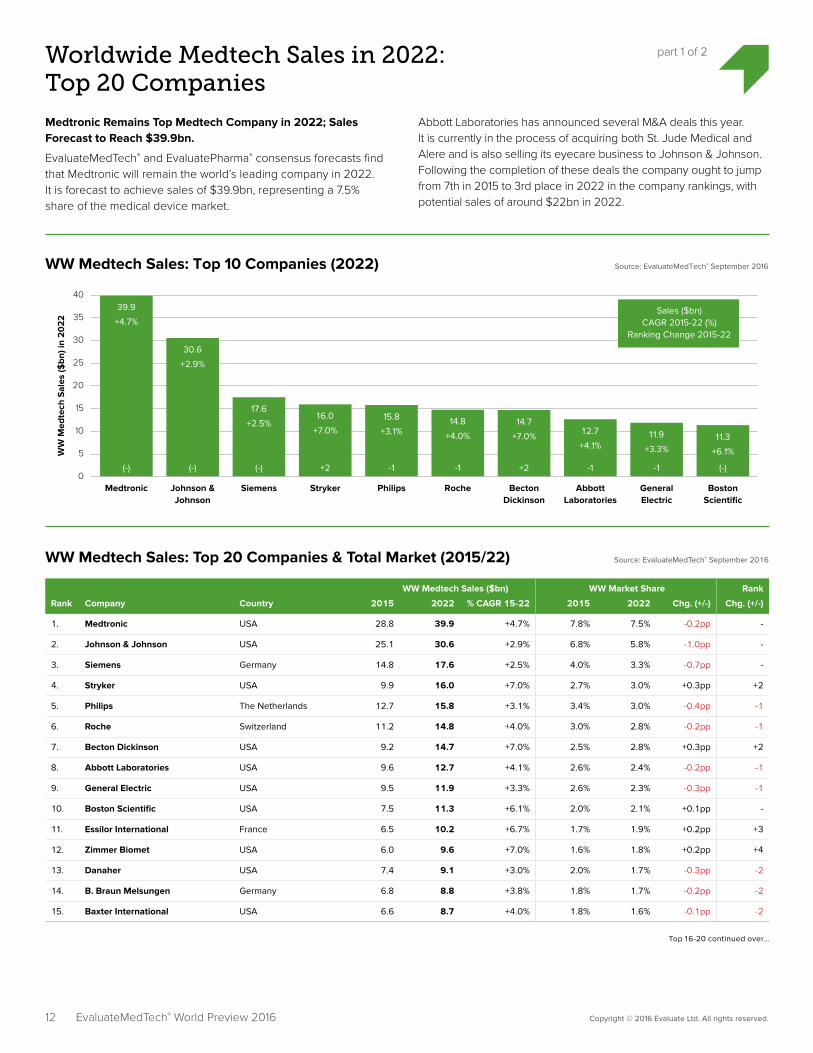
Medtronic Remains Top Medtech Company in 2022; Sales Forecast to Reach $39.9bn.
EvaluateMedTech® and EvaluatePharma® consensus forecasts find that Medtronic will remain the world’s leading company in 2022. It is forecast to achieve sales of $39.9bn, representing a 7.5% share of the medical device market.
Abbott Laboratories has announced several M&A deals this year. It is currently in the process of acquiring both St. Jude Medical and Alere and is also selling its eyecare business to Johnson & Johnson. Following the completion of these deals the company ought to jump from 7th in 2015 to 3rd place in 2022 in the company rankings, with potential sales of around $22bn in 2022.
EvaluateMedTech® World Preview 2016
WW
Med
tech
Sal
es ($
bn) i
n 2
02
2
10
5
15
20
25
30
35
40
Medtronic
39.9
+4.7%
Johnson &Johnson
30.6
+2.9%
Siemens
17.6
+2.5%
Stryker
16.0
+7.0%
Philips
15.8
+3.1%
Roche
14.8
+4.0%
BectonDickinson
14.7
+7.0%
AbbottLaboratories
12.7
+4.1%
GeneralElectric
11.9
+3.3%
BostonScientific
11.3
+6.1%
(-) (-) (-) +2 -1 -1 +2 -1 -1 (-)
Sales ($bn)CAGR 2015-22 (%)
Ranking Change 2015-22
Source: EvaluateMedTech® September 2016WW Medtech Sales: Top 10 Companies (2022)
0
WW Medtech Sales ($bn) WW Market Share Rank
Rank Company Country 2015 2022 % CAGR 15-22 2015 2022 Chg. (+/-) Chg. (+/-)
1. Medtronic USA 28.8 39.9 +4.7% 7.8% 7.5% -0.2pp -
2. Johnson & Johnson USA 25.1 30.6 +2.9% 6.8% 5.8% -1.0pp -
3. Siemens Germany 14.8 17.6 +2.5% 4.0% 3.3% -0.7pp -
4. Stryker USA 9.9 16.0 +7.0% 2.7% 3.0% +0.3pp +2
5. Philips The Netherlands 12.7 15.8 +3.1% 3.4% 3.0% -0.4pp -1
6. Roche Switzerland 11.2 14.8 +4.0% 3.0% 2.8% -0.2pp -1
7. Becton Dickinson USA 9.2 14.7 +7.0% 2.5% 2.8% +0.3pp +2
8. Abbott Laboratories USA 9.6 12.7 +4.1% 2.6% 2.4% -0.2pp -1
9. General Electric USA 9.5 11.9 +3.3% 2.6% 2.3% -0.3pp -1
10. Boston Scientific USA 7.5 11.3 +6.1% 2.0% 2.1% +0.1pp -
11. Essilor International France 6.5 10.2 +6.7% 1.7% 1.9% +0.2pp +3
12. Zimmer Biomet USA 6.0 9.6 +7.0% 1.6% 1.8% +0.2pp +4
13. Danaher USA 7.4 9.1 +3.0% 2.0% 1.7% -0.3pp -2
14. B. Braun Melsungen Germany 6.8 8.8 +3.8% 1.8% 1.7% -0.2pp -2
15. Baxter International USA 6.6 8.7 +4.0% 1.8% 1.6% -0.1pp -2
WW Medtech Sales: Top 20 Companies & Total Market (2015/22) Source: EvaluateMedTech® September 2016
Top 16-20 continued over…

13 Copyright © 2016 Evaluate Ltd. All rights reserved.
Worldwide Medtech Sales in 2022: Top 20 Companies part 2 of 2
EvaluateMedTech® World Preview 2016
Source: EvaluateMedTech® September 2016
Source: EvaluateMedTech® September 2016Percentage Composition of WW Medtech Market in 2022
Top 10 Companies
11-30 Companies
Rest of Market
$211bn
40%
$185bn
35%
$133bn
25%
Note: Analysis is based on the top 300 medtech companies. Sales in 2015 based on company reported data. Sales forecasts to 2022 based on a consensus of leading equity analysts’ estimates for segmental sales.
WW Medtech Sales ($bn) WW Market Share Rank
Rank Company Country 2015 2022 % CAGR 15-22 2015 2022 Chg. (+/-) Chg. (+/-)
16. Olympus Japan 5.1 8.2 +7.1% 1.4% 1.6% +0.2pp +3
17. Novartis Switzerland 6.0 7.9 +4.0% 1.6% 1.5% -0.1pp -2
18. St. Jude Medical USA 5.5 7.7 +4.8% 1.5% 1.5% -0.0pp -1
19. 3M USA 5.1 6.8 +4.2% 1.4% 1.3% -0.1pp -1
20. Smith & Nephew United Kingdom 4.6 6.1 +4.1% 1.2% 1.2% -0.1pp -
Total Top 20 198.0 268.5 +4.4% 53.4% 50.7% -2.7pp
Other 173.0 261.3 +6.1% 46.6% 49.3% +2.7pp
Total 371.0 529.8 +5.2% 100.0% 100.0%
14 Copyright © 2016 Evaluate Ltd. All rights reserved.
Worldwide Medtech vs. Prescription Drug Sales (2009-22)
part 1 of 2
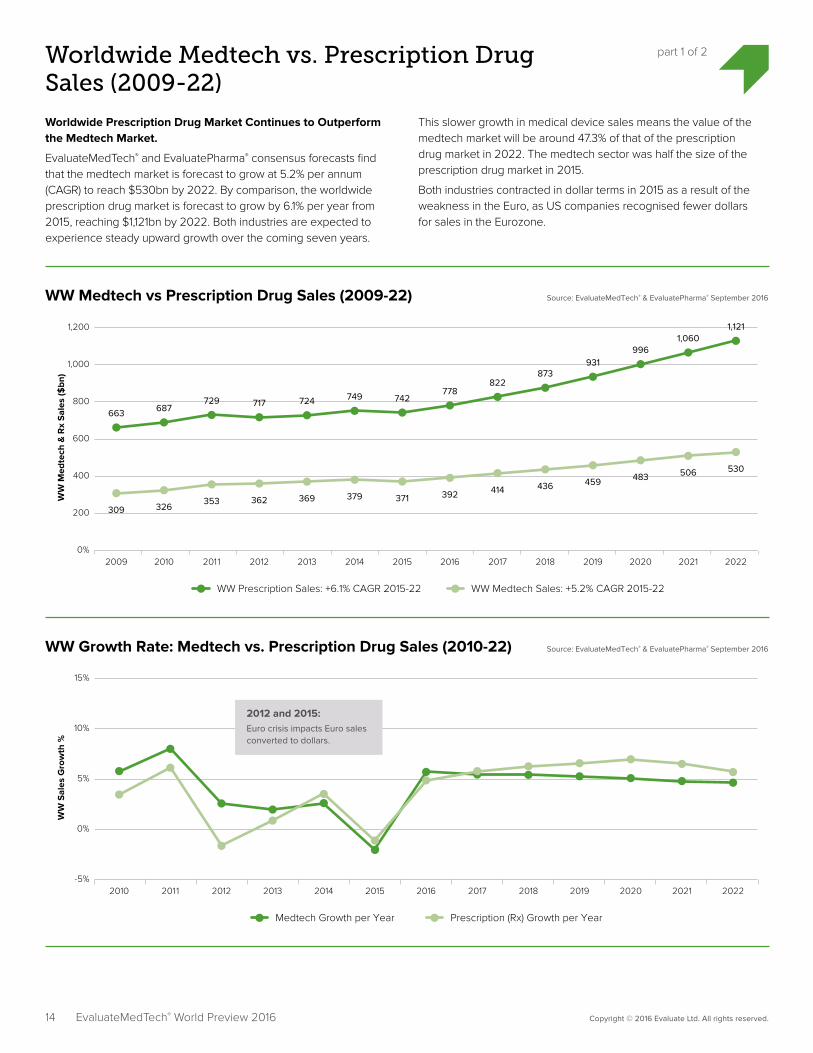
Worldwide Prescription Drug Market Continues to Outperform the Medtech Market.
EvaluateMedTech® and EvaluatePharma® consensus forecasts find that the medtech market is forecast to grow at 5.2% per annum (CAGR) to reach $530bn by 2022. By comparison, the worldwide prescription drug market is forecast to grow by 6.1% per year from 2015, reaching $1,121bn by 2022. Both industries are expected to experience steady upward growth over the coming seven years.
This slower growth in medical device sales means the value of the medtech market will be around 47.3% of that of the prescription drug market in 2022. The medtech sector was half the size of the prescription drug market in 2015.
Both industries contracted in dollar terms in 2015 as a result of the weakness in the Euro, as US companies recognised fewer dollars for sales in the Eurozone.
EvaluateMedTech® World Preview 2016
200
WW
Med
tech
& R
x S
ales
($bn
)
400
600
800
1,000
1,200
Source: EvaluateMedTech® & EvaluatePharma® September 2016WW Medtech vs Prescription Drug Sales (2009-22)
0%2009
309
663
2010
326
687
2011
353
729
2012
362
717
2013
369
724
2014
379
749
2015
371
742
2016
392
778
2017
414
822
2018
436
873
2019
459
931
2020
483
996
2021
506
1,060
2022
530
1,121
WW Prescription Sales: +6.1% CAGR 2015-22 WW Medtech Sales: +5.2% CAGR 2015-22
WW
Sal
es G
row
th %
0%
5%
10%
15%
Source: EvaluateMedTech® & EvaluatePharma® September 2016WW Growth Rate: Medtech vs. Prescription Drug Sales (2010-22)
-5%2010 2011 2012 2013 2014 2017 2018 2019 2020 2021 2022
Medtech Growth per Year Prescription (Rx) Growth per Year
2012 and 2015:Euro crisis impacts Euro sales converted to dollars.
2015 2016

15 Copyright © 2016 Evaluate Ltd. All rights reserved.
Worldwide Medtech vs. Prescription Drug Sales (2009-22) part 2 of 2
EvaluateMedTech® World Preview 2016
WW Medtech vs. Prescription Drug Sales (2009-22)
WW Sales ($bn)
Year 2009 2010 2011 2012 2013 2014 2015 2016 2017 2018 2019 2020 2021 2022
WW Medtech Sales 309 326 353 362 369 379 371 392 414 436 459 483 506 530
Growth per Year +5.7% +8.0% +2.6% +2.0% +2.7% -2.0% +5.7% +5.4% +5.5% +5.3% +5.1% +4.9% +4.7%
Medtech as % of Rx 46.5% 47.5% 48.4% 50.4% 51.0% 50.6% 50.0% 50.4% 50.3% 49.9% 49.3% 48.5% 47.7% 47.3%
WW Prescription (Rx) 663 687 729 717 724 749 742 778 822 873 931 996 1,060 1,121
Growth per Year +3.5% +6.1% -1.6% +0.9% +3.5% -1.0% +4.8% +5.7% +6.2% +6.6% +7.0% +6.5% +5.7%
Source: EvaluateMedTech® & EvaluatePharma® September 2016
CAGR 2015-22WW Medtech Sales +5.2%WW Prescription Drug Sales +6.1%
Note: Prescription drug sales based on top 500 pharmaceutical and biotech companies from EvaluatePharma®. Sales to 2015 based on company reported sales data. Sales forecasts to 2022 based on a consensus of leading equity analysts’ estimates for segmental sales.

16 Copyright © 2016 Evaluate Ltd. All rights reserved.EvaluateMedTech® World Preview 2016
Worldwide Medtech R&D Spend (2009-22)
Medtech R&D Spend Forecast to Grow by 4.3% Per Annum to $34.0bn in 2022.
EvaluateMedTech® consensus forecasts find that worldwide, medtech R&D spending is expected to grow by 4.3% (CAGR) per year between
2015 and 2022, when it will reach $34.0bn. The R&D investment rate as a percentage of sales is forecast to decline slightly from 6.8% in 2015 to 6.4% in 2022.
Source: EvaluateMedTech® September 2016WW Medtech R&D Spend (2009-22)
WW
Med
tech
R&
D S
pend
($bn
)
R&
D S
pend
Gro
wth
%
0
10
5
15
20
25
30
40
3510%
12%
8%
6%
4%
2%
0%
WW Medtech R&D Spend ($bn) R&D Spend Growth %
23.3
2011
+10.2%
21.2
2010
20.0
2009
25.1
2014
+2.0%
24.7
2013
+3.0%
2012
27.7
2017
+3.6%
26.7
2016
+5.5%25.3
2015
+0.7%
31.4
2020
+4.3%
30.1
2019
+4.2%
34.0
2022
+4.1%
32.7
2021
+4.2%
28.8
2018
+4.2%
+4.3% CAGR 2015-22
23.9
+2.7%
+5.6%
WW Medtech R&D Spend (2009-22)
WW Medtech R&D & Medtech Sales ($bn)
Year 2009 2010 2011 2012 2013 2014 2015 2016 2017 2018 2019 2020 2021 2022
Medtech R&D Spend 20.0 21.2 23.3 23.9 24.7 25.1 25.3 26.7 27.7 28.8 30.1 31.4 32.7 34.0
R&D Spend Growth per Year % +5.6% +10.2% +2.7% +3.0% +2.0% +0.7% +5.5% +3.6% +4.2% +4.2% +4.3% +4.2% +4.1%
WW Medtech Sales 308.6 326.3 352.6 361.6 368.8 378.7 371.0 392.2 413.6 436.3 459.4 482.7 506.2 529.8
R&D as % of Medtech Sales +6.5% +6.5% +6.6% +6.6% +6.7% +6.6% +6.8% +6.8% +6.7% +6.6% +6.5% +6.5% +6.5% +6.4%
R&D as % of Medtech Sales (Top 20 in 2022)
8.4% 8.0%
Source: EvaluateMedTech® September 2016
CAGR 2015-22 on Medtech R&D Spend +4.3%Cumulative 5 year R&D Spend (2011-15) $122.3bnCAGR 2009-15 on Medtech R&D Spend +4.0%
Note: Analysis is based on the Top 300 medtech companies. R&D spend in 2015 based on company reported data.
Forecast medtech R&D spend based on a consensus of leading equity analysts’ estimates for company level R&D spend, extrapolated to medtech R&D when a company has non-medtech R&D activity.
Medtech R&D is not disclosed by a number of companies and this analysis is limited to those companies with sufficient disclosure.

17 Copyright © 2016 Evaluate Ltd. All rights reserved.EvaluateMedTech® World Preview 2016
Medtech R&D Spend in 2022: Top 20 Companies
part 1 of 2
Medtronic Tops Table of R&D Spenders in 2022 with $2.8bn Forecast.
Medtronic will allocate $2.8bn to R&D in 2022, making it the sector’s biggest research spender. Its R&D expenditure will increase at a CAGR of 3.6% between 2015 and 2022. It does not, however, spend
the most proportionally to total medtech sales – that title belongs to Edwards Lifesciences with an estimated 15.0% R&D investment rate in 2022. This contrasts with Zimmer Biomet, which will reinvest a mere 4.8% of its total medtech sales in research.
Med
tech
R&
D S
pend
($m
) in
20
22
500
1,000
1,500
2,000
2,500
3,000
Medtronic
2,841
+3.6%
Johnson &Johnson
1,857
+2.2%
Siemens
1,603
+3.1%
Roche
1,454
+2.2%
Philips
1,321
+1.5%
AbbottLaboratories
1,298
+4.1%
BostonScientific
1,210
+5.2%
GeneralElectric
1,061
+2.0%
Stryker
995
+6.9%
St. JudeMedical
956
+5.1%
R&D Spend ($m)
CAGR 2015-22 (%)
Source: EvaluateMedTech® September 2016WW Medtech R&D Spend: Top 10 Companies (2022)
0
Medtech R&D ($m) R&D As a % of Medtech Sales Rank
Rank Company 2015 2022 CAGR 15-22 2015 2022 Chg. (+/-) Chg. (+/-)
1. Medtronic 2,224 2,841 +3.6% 7.7% 7.1% -0.6pp -
2. Johnson & Johnson 1,600 1,857 +2.2% 6.4% 6.1% -0.3pp -
3. Siemens 1,294 1,603 +3.1% 8.7% 9.1% +0.4pp -
4. Roche 1,245 1,454 +2.2% 11.1% 9.9% -1.2pp -
5. Philips 1,190 1,321 +1.5% 9.4% 8.4% -1.0pp -
6. Abbott Laboratories 977 1,298 +4.1% 10.1% 10.1% +0.1pp -
7. Boston Scientific 850 1,210 +5.2% 11.4% 10.7% -0.7pp +1
8. General Electric 926 1,061 +2.0% 9.8% 8.9% -0.9pp -1
9. Stryker 625 995 +6.9% 6.3% 6.2% -0.1pp +3
10. St. Jude Medical 676 956 +5.1% 12.2% 12.4% +0.2pp -
11. Danaher 688 902 +3.9% 9.3% 10.0% +0.6pp -2
12. Becton Dickinson 632 872 +4.7% 6.9% 5.9% -1.0pp -1
13. Baxter International 589 694 +2.4% 8.9% 8.0% -0.9pp -
14. Edwards Lifesciences 383 692 +8.8% 15.4% 15.0% -0.3pp +2
15. 3M 434 580 +4.2% 8.5% 8.5% -0.0pp -
Top 16-20 continued over…
WW Medtech R&D Spend: Top 20 Companies & Total Market (2015/22) Source: EvaluateMedTech® September 2016
18 Copyright © 2016 Evaluate Ltd. All rights reserved.
Medtech R&D Spend in 2022: Top 20 Companies part 2 of 2
EvaluateMedTech® World Preview 2016
Source: EvaluateMedTech® September 2016
Note: Analysis is based on the top 300 medtech companies. R&D spend in 2015 based on company reported data.
Forecast medtech R&D spend based on a consensus of leading equity analysts’ estimates for company level R&D spend, extrapolated to medtech R&D when a company has non-medtech R&D activity.
Medtech R&D is not disclosed by a number of companies and this analysis is limited to those companies with sufficient disclosure.
Medtech R&D ($m) R&D As a % of Medtech Sales Rank
Rank Company 2015 2022 CAGR 15-22 2015 2022 Chg. (+/-) Chg. (+/-)
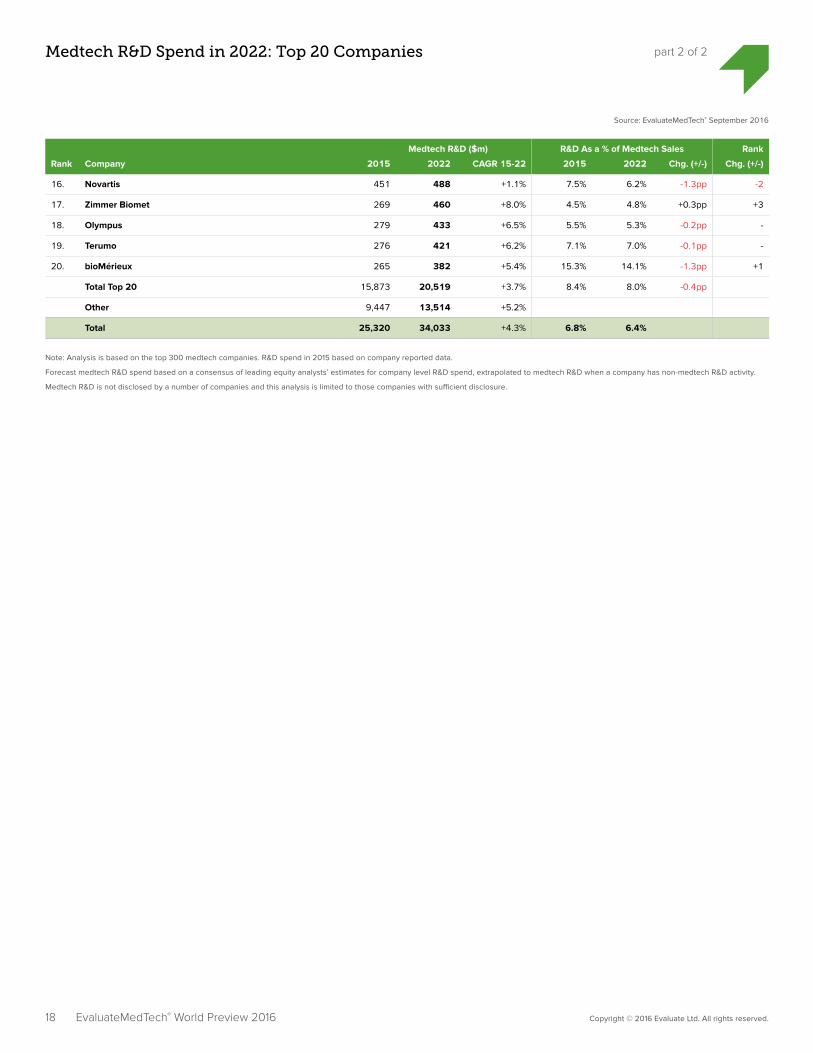
16. Novartis 451 488 +1.1% 7.5% 6.2% -1.3pp -2
17. Zimmer Biomet 269 460 +8.0% 4.5% 4.8% +0.3pp +3
18. Olympus 279 433 +6.5% 5.5% 5.3% -0.2pp -
19. Terumo 276 421 +6.2% 7.1% 7.0% -0.1pp -
20. bioMérieux 265 382 +5.4% 15.3% 14.1% -1.3pp +1
Total Top 20 15,873 20,519 +3.7% 8.4% 8.0% -0.4pp
Other 9,447 13,514 +5.2%
Total 25,320 34,033 +4.3% 6.8% 6.4%

19 Copyright © 2016 Evaluate Ltd. All rights reserved.EvaluateMedTech® World Preview 2016
FDA Regulatory Analysis (2008-15) part 1 of 2
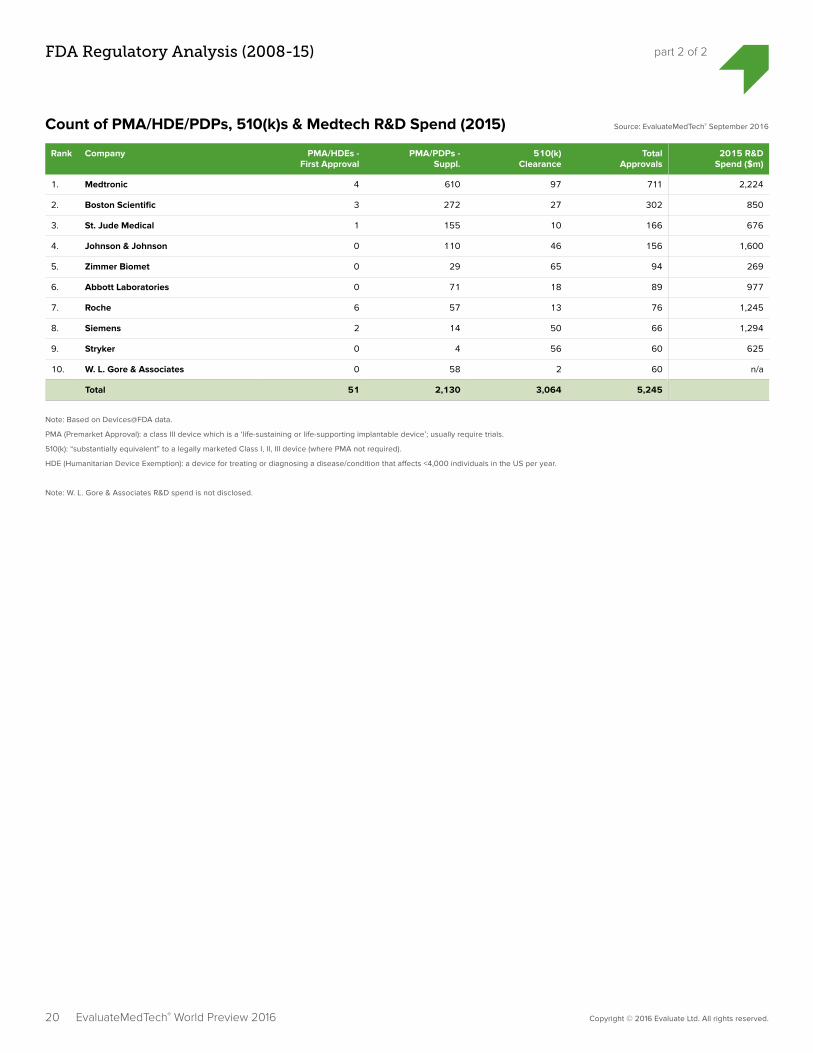
Number of First-Time PMAs and HDEs hits a Ten Year High in 2015; 510(k) Clearances Decrease 6% to 3,064.
EvaluateMedTech® found that the FDA granted 51 new PMAs/HDEs/PDPs (first-time approvals) in 2015, a 55% increase over 2014’s total. Roche was awarded more first-time PMAs than any other company,
with six of its tests receiving the green light. Medtronic received the largest number of overall approvals plus clearances in 2015, with 711.
The total number of regulatory approvals in 2015 decreased 9% from the year before.
Source: EvaluateMedTech® September 2016Count of 1st PMA/HDE/PDPs, 510(k)s & Supplementary PMA/PDPs Per Year (2008-15)
No.
of 1
st P
MA
/HD
E/P
DP
No.
of S
up P
MA
s / 5
10(k
)s
0
10
20
30
40
50
60 3,500
3,000
2,500
2,000
1,500
500
1,000
0
1st Time PMA/HDE/PDP 510(k) Supplementary PMA/PDP
18
2009
3,044
1,500
30
2008
3,104
1,487
22
2010
2,850
1,843
44
2011
3,151
2,194
41
2012
3,185
2,383
23
2013
3,084
2,329
33
2014
3,244
2,456
51
2015
3,064
2,130
Count of 1st PMA/HDE/PDPs, 510(k)s & Supplementary PMA/PDPs (2008-15)
Year 2008 2009 2010 2011 2012 2013 2014 2015
1st Time PMA/ HDE/ PDP 30 18 22 44 41 23 33 51
% Chg. -40% +22% +100% -7% -44% +43% +55%
Supplementary PMA/ PDP 1,487 1,500 1,843 2,194 2,383 2,329 2,456 2,130
% Chg. +1% +23% +19% +9% -2% +5% -13%
510(k) 3,104 3,044 2,850 3,151 3,185 3,084 3,244 3,064
% Chg. -2% -6% +11% +1% -3% +5% -6%
Total 4,621 4,562 4,715 5,389 5,609 5,436 5,733 5,245
% Chg. -1% +3% +14% +4% -3% +5% -9%
Source: EvaluateMedTech® September 2016
20 Copyright © 2016 Evaluate Ltd. All rights reserved.EvaluateMedTech® World Preview 2016
FDA Regulatory Analysis (2008-15) part 2 of 2
Count of PMA/HDE/PDPs, 510(k)s & Medtech R&D Spend (2015) Source: EvaluateMedTech® September 2016
Rank Company PMA/HDEs - First Approval
PMA/PDPs - Suppl.
510(k) Clearance
Total Approvals
2015 R&D Spend ($m)
1. Medtronic 4 610 97 711 2,224
2. Boston Scientific 3 272 27 302 850
3. St. Jude Medical 1 155 10 166 676
4. Johnson & Johnson 0 110 46 156 1,600
5. Zimmer Biomet 0 29 65 94 269
6. Abbott Laboratories 0 71 18 89 977
7. Roche 6 57 13 76 1,245
8. Siemens 2 14 50 66 1,294
9. Stryker 0 4 56 60 625
10. W. L. Gore & Associates 0 58 2 60 n/a
Total 51 2,130 3,064 5,245
Note: Based on Devices@FDA data.
PMA (Premarket Approval): a class III device which is a ‘life-sustaining or life-supporting implantable device’; usually require trials.
510(k): “substantially equivalent” to a legally marketed Class I, II, III device (where PMA not required).
HDE (Humanitarian Device Exemption): a device for treating or diagnosing a disease/condition that affects <4,000 individuals in the US per year.
Note: W. L. Gore & Associates R&D spend is not disclosed.
EvaluateMedTech® Device Classification
Level 1 Level 2 Level 3 Decision Date
FDA Review Time (mths)
Company Product Code Name Device Name (Approval Code)
Cardiology Cardiac Prosthetic Devices
Tissue Heart Valves
12 Aug 16 10.0 Edwards Lifesciences Heart-Valve, Non-Allograft Tissue
EDWARDS INTUITY ELITE VALVE SYSTEM (P150036)
Cardiology Cardiac Prosthetic Devices
Tissue Heart Valves
08 Jan 16 10.3 LivaNova Heart-Valve, Non-Allograft Tissue
PERCEVAL SUTURELESS HEART VALVE (P150011)
Cardiology Cardiac Rhythm Management (CRM)
Pacemakers 25 Apr 16 13.8 Boston Scientific Implantable Pulse Generator, Pacemaker (Non-Crt)
IMAGEREADY MR CONDITIONAL PACING SYSTEM AND INGEVITY PACE/SENSE LEAD (P150012)
Cardiology Cardiac Rhythm Management (CRM)
Pacemakers 06 Apr 16 6.6 Medtronic Leadless Pacemaker MEDTRONIC MICRA TRANSCATHETER PACEMAKER SYSTEM (P150033)
Cardiology Cardiovascular Surgical Devices
Vascular Closure Devices
20 Jul 16 17.5 Vasorum Device, Hemostasis, Vascular CELT ACD VASCULAR CLOSURE DEVICE (P150006)
Cardiology Cardiovascular Surgical Devices
Vascular Closure Devices
12 Feb 16 7.6 Rex Medical Device, Hemostasis, Vascular CLOSER VASCULAR SEALING SYSTEM (P150022)
Cardiology Electrophysiology Cardiac Ablation Catheters
01 Apr 16 8.1 CardioFocus Catheter, Percutaneous, Cardiac Ablation, For Treatment Of Atrial Fibrillation
HEARTLIGHT ENDOSCOPIC ABLATION SYSTEM (P150026)
Cardiology Electrophysiology Cardiac Ablation Catheters
24 Feb 16 12.7 Boston Scientific Catheter, Percutaneous, Cardiac Ablation, For Treatment Of Atrial Flutter
BLAZER OPEN-IRRIGATED ABLATION CATHETER (P150005)
Cardiology Interventional Cardiology
Drug-Eluting Coronary Stents
05 Jul 16 12.2 Abbott Laboratories Absorbable Coronary Drug-Eluting Stent
ABSORB GT1 BIORESORBABLE VASCULAR SCAFFOLD (BVS) SYSTEM (P150023)
Cardiology Interventional Cardiology
Non-Drug- Eluting Coronary Stents
25 Mar 16 7.7 NuMED Aortic Stent CHEATHAM PLATINUM STENT SYSTEM (P150028)
Cardiology Interventional Cardiology
Peripheral Vascular Devices
27 Jul 16 5.8 W. L. Gore & Associates
Stent, Superficial Femoral Artery GORE TIGRIS VASCULAR STENT (P160004)
Diabetic Care
Glucose Monitor-ing Devices
Glucose Test Systems
17 Jun 16 10.3 Medtronic Sensor, Glucose, Invasive IPRO2 CGM SYSTEM WITH ENLITE SENSOR (P150029)
Diabetic Care
Insulin Delivery Devices
Artificial Pancreas
10 Aug 16 19.1 Medtronic Artificial Pancreas Device System, Threshold Suspend
MINIMED 630G SYSTEM WITH SMARTGUARD (P150001)
Gastro- enterology
Gastrointestinal Therapeutic Devices
Other Gastrointestinal Therapeutic Devices
14 Jun 16 11.2 Aspire Bariatrics Aspiration Therapy System ASPIREASSIST (P150024)
General Hospital & Healthcare Supply
Other General Hospital Supplies
Other General Hospital Supplies
17 Feb 16 39.8 Sharps Terminator Device, Needle Destruction SHARPS TERMINATOR (P120018)
2016 FDA First-Time PMAs, HDEs and 510(k) De Novo Clearances
part 1 of 3
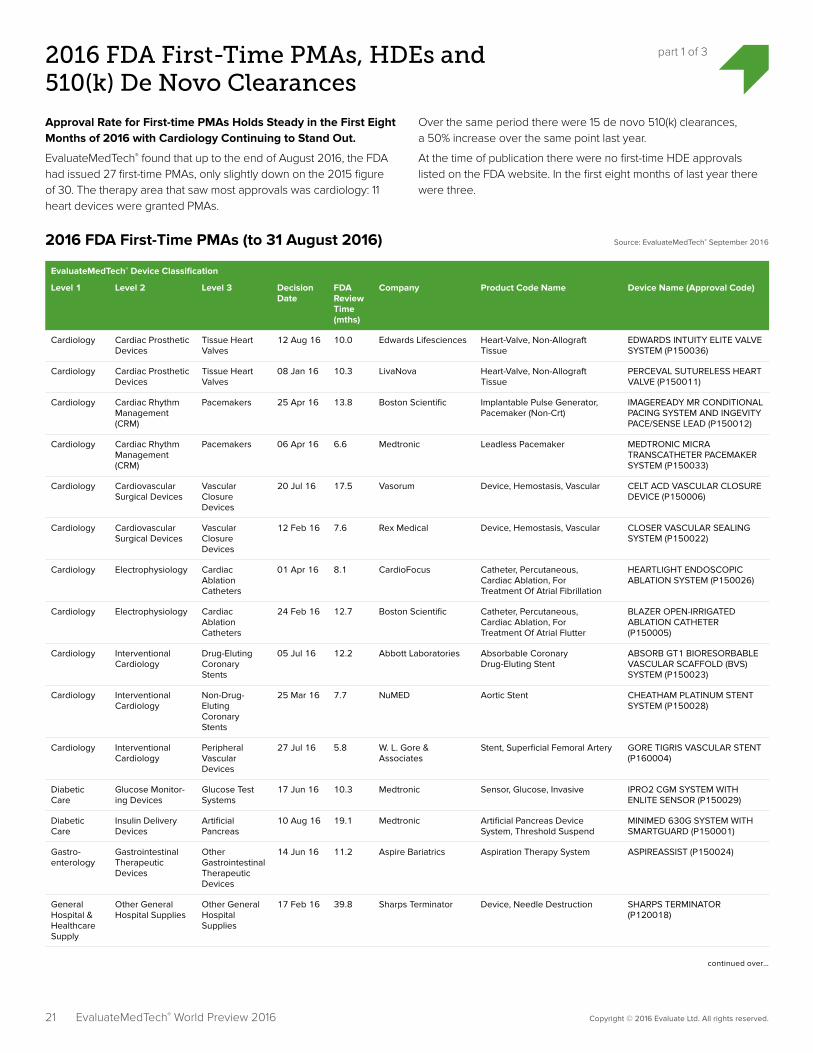
Approval Rate for First-time PMAs Holds Steady in the First Eight Months of 2016 with Cardiology Continuing to Stand Out.
EvaluateMedTech® found that up to the end of August 2016, the FDA had issued 27 first-time PMAs, only slightly down on the 2015 figure of 30. The therapy area that saw most approvals was cardiology: 11 heart devices were granted PMAs.
Over the same period there were 15 de novo 510(k) clearances, a 50% increase over the same point last year.
At the time of publication there were no first-time HDE approvals listed on the FDA website. In the first eight months of last year there were three.
2016 FDA First-Time PMAs (to 31 August 2016) Source: EvaluateMedTech® September 2016
21 Copyright © 2016 Evaluate Ltd. All rights reserved.EvaluateMedTech® World Preview 2016
continued over…
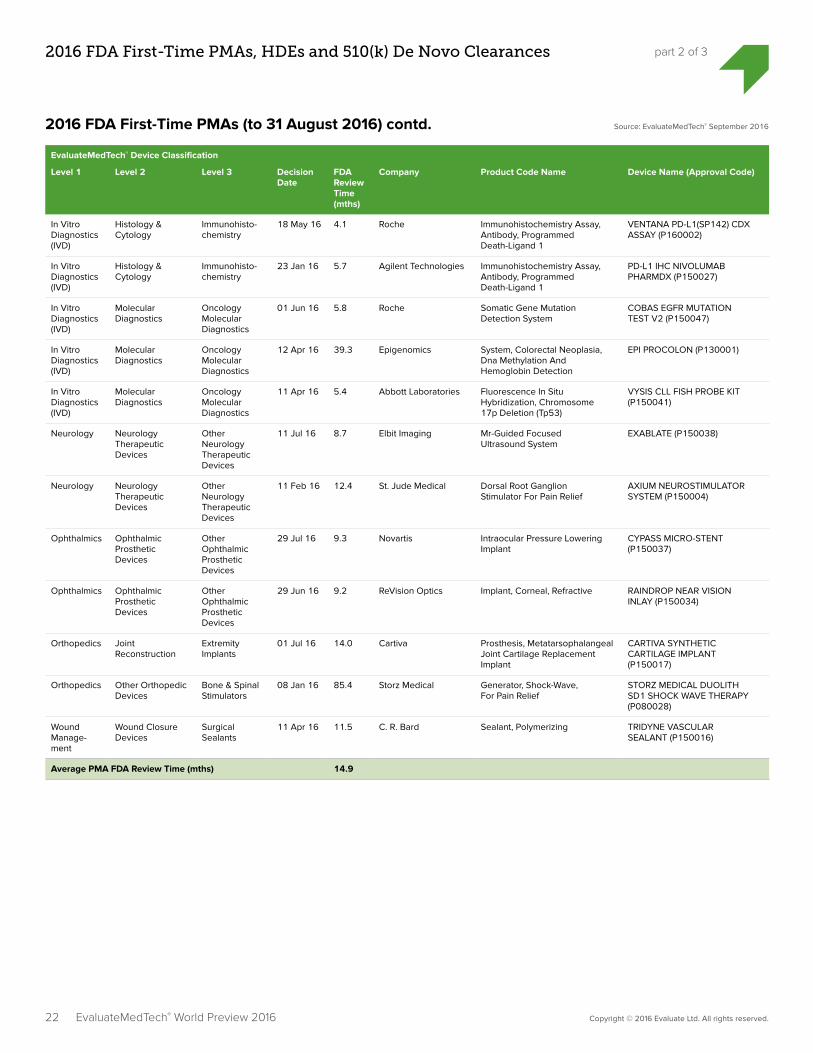
EvaluateMedTech® Device Classification
Level 1 Level 2 Level 3 Decision Date
FDA Review Time (mths)
Company Product Code Name Device Name (Approval Code)
In Vitro Diagnostics (IVD)
Histology & Cytology
Immunohisto-chemistry
18 May 16 4.1 Roche Immunohistochemistry Assay, Antibody, Programmed Death-Ligand 1
VENTANA PD-L1(SP142) CDX ASSAY (P160002)
In Vitro Diagnostics (IVD)
Histology & Cytology
Immunohisto-chemistry
23 Jan 16 5.7 Agilent Technologies Immunohistochemistry Assay, Antibody, Programmed Death-Ligand 1
PD-L1 IHC NIVOLUMAB PHARMDX (P150027)
In Vitro Diagnostics (IVD)
Molecular Diagnostics
Oncology Molecular Diagnostics
01 Jun 16 5.8 Roche Somatic Gene Mutation Detection System
COBAS EGFR MUTATION TEST V2 (P150047)
In Vitro Diagnostics (IVD)
Molecular Diagnostics
Oncology Molecular Diagnostics
12 Apr 16 39.3 Epigenomics System, Colorectal Neoplasia, Dna Methylation And Hemoglobin Detection
EPI PROCOLON (P130001)
In Vitro Diagnostics (IVD)
Molecular Diagnostics
Oncology Molecular Diagnostics
11 Apr 16 5.4 Abbott Laboratories Fluorescence In Situ Hybridization, Chromosome 17p Deletion (Tp53)
VYSIS CLL FISH PROBE KIT (P150041)
Neurology Neurology Therapeutic Devices
Other Neurology Therapeutic Devices
11 Jul 16 8.7 Elbit Imaging Mr-Guided Focused Ultrasound System
EXABLATE (P150038)
Neurology Neurology Therapeutic Devices
Other Neurology Therapeutic Devices
11 Feb 16 12.4 St. Jude Medical Dorsal Root Ganglion Stimulator For Pain Relief
AXIUM NEUROSTIMULATOR SYSTEM (P150004)
Ophthalmics Ophthalmic Prosthetic Devices
Other Ophthalmic Prosthetic Devices
29 Jul 16 9.3 Novartis Intraocular Pressure Lowering Implant
CYPASS MICRO-STENT (P150037)
Ophthalmics Ophthalmic Prosthetic Devices
Other Ophthalmic Prosthetic Devices
29 Jun 16 9.2 ReVision Optics Implant, Corneal, Refractive RAINDROP NEAR VISION INLAY (P150034)
Orthopedics Joint Reconstruction
Extremity Implants
01 Jul 16 14.0 Cartiva Prosthesis, Metatarsophalangeal Joint Cartilage Replacement Implant
CARTIVA SYNTHETIC CARTILAGE IMPLANT (P150017)
Orthopedics Other Orthopedic Devices
Bone & Spinal Stimulators
08 Jan 16 85.4 Storz Medical Generator, Shock-Wave, For Pain Relief
STORZ MEDICAL DUOLITH SD1 SHOCK WAVE THERAPY (P080028)
Wound Manage-ment
Wound Closure Devices
Surgical Sealants
11 Apr 16 11.5 C. R. Bard Sealant, Polymerizing TRIDYNE VASCULAR SEALANT (P150016)
Average PMA FDA Review Time (mths) 14.9
22 Copyright © 2016 Evaluate Ltd. All rights reserved.EvaluateMedTech® World Preview 2016
2016 FDA First-Time PMAs, HDEs and 510(k) De Novo Clearances part 2 of 3
2016 FDA First-Time PMAs (to 31 August 2016) contd. Source: EvaluateMedTech® September 2016

EvaluateMedTech® Device Classification
Level 1 Level 2 Level 3 Decision Date
FDA Review Time (mths)
Company Product Code Name Device Name (Approval Code)
Cardiology Cardiovascular Surgical Devices
Vascular Closure Devices
27 Jul 16 13.2 Micro Interventional Devices
Apical Closure Device PERMASEAL (DEN150029)
Endoscopy Endoscopes Laparoscopes 07 Apr 16 9.6 Advanced Surgical Concepts
Containment System, Laparo-scopic Power Morcellation, With Instrument Port
PNEUMOLINER (DEN150028)
Gastro- enterology
Gastrointestinal Therapeutic Devices
Biliary Devices 03 Jun 16 9.2 Boston Scientific Biliary Stent System For Benign Strictures
WALLFLEX BILIARY RX FULLY COVERED STENT SYSTEM RMV (DEN150040)
General & Plastic Surgery
Surgical Instruments & Accessories
Other Surgical Instruments & Accessories
13 Jun 16 16.1 Levita Magnetics Magnetic Surgical System MAGNETIC SURGICAL SYSTEM (DEN150007)
In Vitro Diagnostics (IVD)
Immunoassays Multiple Autoantibodies Immunoassays
25 Apr 16 9.8 Kronus Aquaporin-4 Autoantibody KRONUS AQUAPORIN-4 AUTOANTIBODY (AQP4AB) ELISA ASSAY (DEN150030)
In Vitro Diagnostics (IVD)
Immunoassays Other Immunoassays
20 Feb 16 11.6 Thermo Fisher Scientific
Device To Detect And Measure Procalcitonin (Pct) In Human Clinical Specimens
B.R.A.H.M.S PCT SENSITIVE KRYPTOR (DEN150009)
In Vitro Diagnostics (IVD)
Molecular Diagnostics Infectious Disease Molecular Diagnostics
28 Mar 16 3.4 Bio-Rad Laboratories
Assayed External Control Material For Microbiology Nucleic Acid Amplification (Nat) Assays
AMPLICHEK II, NEGATIVE AND AMPLICHEK II, NEGATIVE MINIPAK, AMPLICHEK II, LEVEL 1 AND AMPLICHEK II, LEVEL 1 MINIPAK, AMPLICHEK II, LEVEL 2 AND AMPLICHEK II, LEVEL 2 MINIPAK, AMPLICHEK II, LEVEL 3 AND AMPLICHEK II, LEVEL 3 MINIPAK (DEN150058)
In Vitro Diagnostics (IVD)
Molecular Diagnostics
Oncology Molecular Diagnostics
22 Jul 16 6.1 Asuragen Bcr/Abl1 Monitoring Test QUANTIDEX QPCR BCR-ABL IS KIT (DEN160003)
Neurology Neurology Diagnostic Devices
Neurodiagnostic Systems
01 Aug 16 19.3 Jan Medical Cranial Motion Measurement Device
NAUTILUS BRAINPULSE 1000 (DEN140040)
Neurology Neurology Diagnostic Devices
Other Neurology Diagnostic Devices
22 Aug 16 12.4 ImPACT Applications
Computerized Cognitive Assessment Aid For Concussion
IMPACT COMPUTERIZED NEUROCOGNITIVE CON-CUSSION MANAGEMENT AID (DEN150037)
Neurology Neurology Therapeutic Devices
Other Neurology Therapeutic Devices
15 Jul 16 18.0 EPIC Research & Diagnostics
Evoked Photon Image Cap-ture Device
EPIC CLEARVIEW SYSTEM (DEN150004)
Neurology Neurology Therapeutic Devices
Other Neurology Therapeutic Devices
13 May 16 18.8 Cereve Thermal System For Insomnia CEREVE SLEEP SYSTEM (DEN140032)
Ophthalmics Ophthalmic Diagnostic Devices
Other Ophthalmic Diagnostic Devices
08 Jun 16 29.9 REBIScan Strabismus Detection Device PEDIATRIC VISION SCANNER (DEN130051)
Ophthalmics Ophthalmic Diagnostic Devices
Other Ophthalmic Diagnostic Devices
04 Mar 16 22.0 Sensimed Ocular Pattern Recorder SENSIMED TRIGGERFISH (DEN140017)
Ophthalmics Ophthalmic Therapeutic Devices
Other Ophthalmic Therapeutic Devices
20 Apr 16 21.1 Innovatex Tear Duct Occluder GLAUCOMA COMPANION (DEN140022)
Average 510(k) De Novo FDA Review Time (mths) 14.7
2016 FDA 510(k) De Novo Clearances (to 31 August 2016) Source: EvaluateMedTech® September 2016
23 Copyright © 2016 Evaluate Ltd. All rights reserved.EvaluateMedTech® World Preview 2016
2016 FDA First-Time PMAs, HDEs and 510(k) De Novo Clearances part 3 of 3
Note: Based on Devices@FDA data to 31 August 2016.
PMA (Premarket Approval): a class III device which is a ‘life-sustaining or life-supporting implantable device’; usually require trials.
HDE (Humanitarian Device Exemption): a device for treating or diagnosing a disease/condition that affects <4,000 individuals in the US per year.
510(k) De Novo Clearance: a device which poses a low risk and could ordinarily be cleared via the 510(k) route, but which is sufficiently innovative that no existing device may be used as a predicate.

24 Copyright © 2016 Evaluate Ltd. All rights reserved.
In Vitro Diagnostics (IVD) Market to 2022
Roche Continues Domination of IVD field; 2022 Sales Forecast to Reach $12.8bn.
EvaluateMedTech® consensus forecasts find that Roche’s sales of diagnostic tests are expected to reach $12.8bn in 2022, giving the company a market share of 18.1%.
Sysmex is the fastest growing IVD company in the top ten with an
annual growth rate of 10.2% between 2015 and 2022. This will push the company up two places to sixth in the 2022 rankings.
The in vitro diagnostics market is estimated to grow at 5.6% (CAGR) between 2015 and 2022 to a worldwide total of $70.8bn.
Should Abbott complete the acquisition of Alere it will close in on Roche, with potential sales of $9.4bn in 2022.
EvaluateMedTech® World Preview 2016
Source: EvaluateMedTech® September 2016WW In Vitro Diagnostics Sales, Market Share & Sales Growth (2015-22)
WW
Mar
ket S
hare
% in
20
22
+2%
0%
5%
10%
15%
20%
25%
+5%+3% +4% +6%
Siemens
Roche
Thermo Fisher Scientific
Danaher
AbbottLaboratories
% Sales Growth: CAGR 2015-22
Note: Bubble = WW Sales in 2022
WW Sales ($m) CAGR WW Market Share Rank Change
Rank Company 2015 2022 2015-22 2015 2022 2015-22
1. Roche 9,026 12,800 +5.1% 18.6% 18.1% -
2. Abbott Laboratories 4,646 6,590 +5.1% 9.6% 9.3% +1
3. Danaher 4,633 5,823 +3.3% 9.6% 8.2% +1
4. Siemens 4,855 5,762 +2.5% 10.0% 8.1% -2
5. Thermo Fisher Scientific 3,017 3,854 +3.6% 6.2% 5.4% -
6. Sysmex 1,940 3,835 +10.2% 4.0% 5.4% +2
7. Becton Dickinson 2,690 3,392 +3.4% 5.6% 4.8% -1
8. Alere 2,238 2,822 +3.4% 4.6% 4.0% -1
9. bioMérieux 1,722 2,716 +6.7% 3.6% 3.8% -
10. Ortho-Clinical Diagnostics 1,700 1,997 +2.3% 3.5% 2.8% -
Top 10 36,466 49,590 +4.5% 75.3% 70.0%
Other 11,958 21,235 +8.5% 24.7% 30.0%
Total Industry 48,424 70,825 +5.6% 100.0% 100.0%
WW In Vitro Diagnostics Sales: Top 10 Companies & Total Market (2015/22) Source: EvaluateMedTech® September 2016
Note: Excludes Glucose Test Systems which are included in Diabetic Care classification.
25 Copyright © 2016 Evaluate Ltd. All rights reserved.
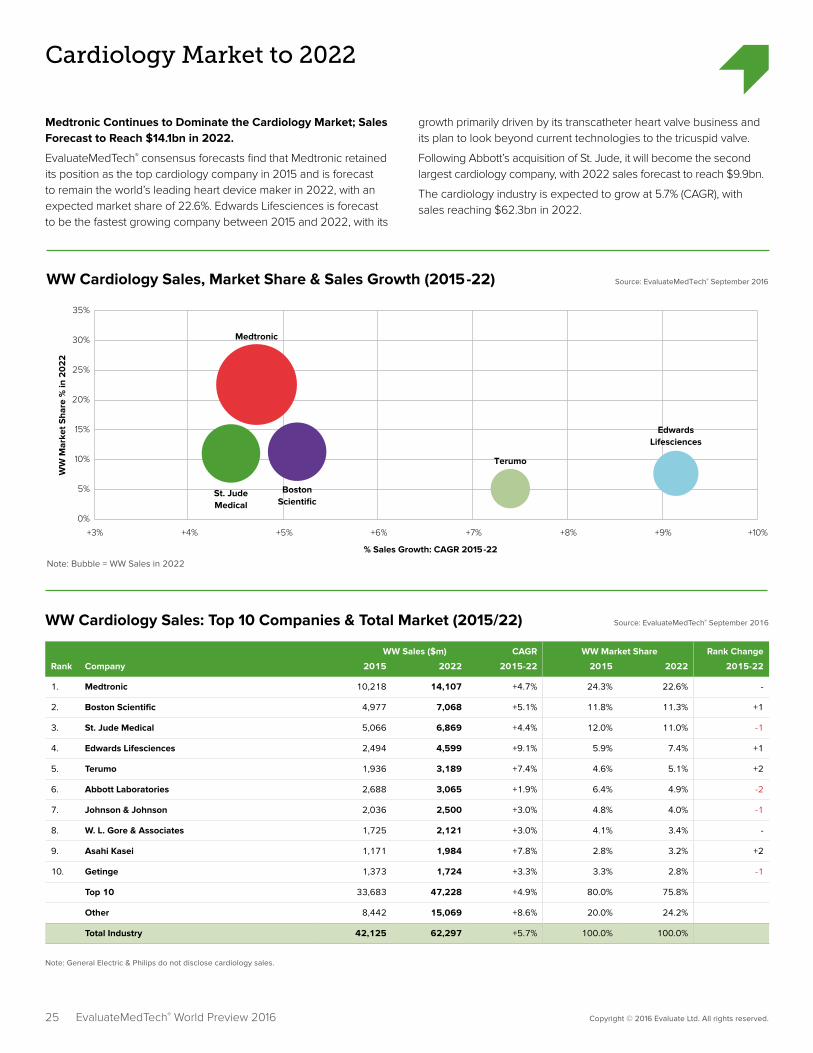
Cardiology Market to 2022
Medtronic Continues to Dominate the Cardiology Market; Sales Forecast to Reach $14.1bn in 2022.
EvaluateMedTech® consensus forecasts find that Medtronic retained its position as the top cardiology company in 2015 and is forecast to remain the world’s leading heart device maker in 2022, with an expected market share of 22.6%. Edwards Lifesciences is forecast to be the fastest growing company between 2015 and 2022, with its
growth primarily driven by its transcatheter heart valve business and its plan to look beyond current technologies to the tricuspid valve.
Following Abbott’s acquisition of St. Jude, it will become the second largest cardiology company, with 2022 sales forecast to reach $9.9bn.
The cardiology industry is expected to grow at 5.7% (CAGR), with sales reaching $62.3bn in 2022.
EvaluateMedTech® World Preview 2016
Source: EvaluateMedTech® September 2016WW Cardiology Sales, Market Share & Sales Growth (2015-22)
WW
Mar
ket S
hare
% in
20
22
+3%
0%
5%
10%
15%
20%
25%
30%
35%
+5% +6%+4% +9%+7% +8% +10%
Medtronic
EdwardsLifesciences
Terumo
BostonScientific
St. JudeMedical
% Sales Growth: CAGR 2015-22
Note: Bubble = WW Sales in 2022
WW Sales ($m) CAGR WW Market Share Rank Change
Rank Company 2015 2022 2015-22 2015 2022 2015-22
1. Medtronic 10,218 14,107 +4.7% 24.3% 22.6% -
2. Boston Scientific 4,977 7,068 +5.1% 11.8% 11.3% +1
3. St. Jude Medical 5,066 6,869 +4.4% 12.0% 11.0% -1
4. Edwards Lifesciences 2,494 4,599 +9.1% 5.9% 7.4% +1
5. Terumo 1,936 3,189 +7.4% 4.6% 5.1% +2
6. Abbott Laboratories 2,688 3,065 +1.9% 6.4% 4.9% -2
7. Johnson & Johnson 2,036 2,500 +3.0% 4.8% 4.0% -1
8. W. L. Gore & Associates 1,725 2,121 +3.0% 4.1% 3.4% -
9. Asahi Kasei 1,171 1,984 +7.8% 2.8% 3.2% +2
10. Getinge 1,373 1,724 +3.3% 3.3% 2.8% -1
Top 10 33,683 47,228 +4.9% 80.0% 75.8%
Other 8,442 15,069 +8.6% 20.0% 24.2%
Total Industry 42,125 62,297 +5.7% 100.0% 100.0%
WW Cardiology Sales: Top 10 Companies & Total Market (2015/22) Source: EvaluateMedTech® September 2016
Note: General Electric & Philips do not disclose cardiology sales.
26 Copyright © 2016 Evaluate Ltd. All rights reserved.
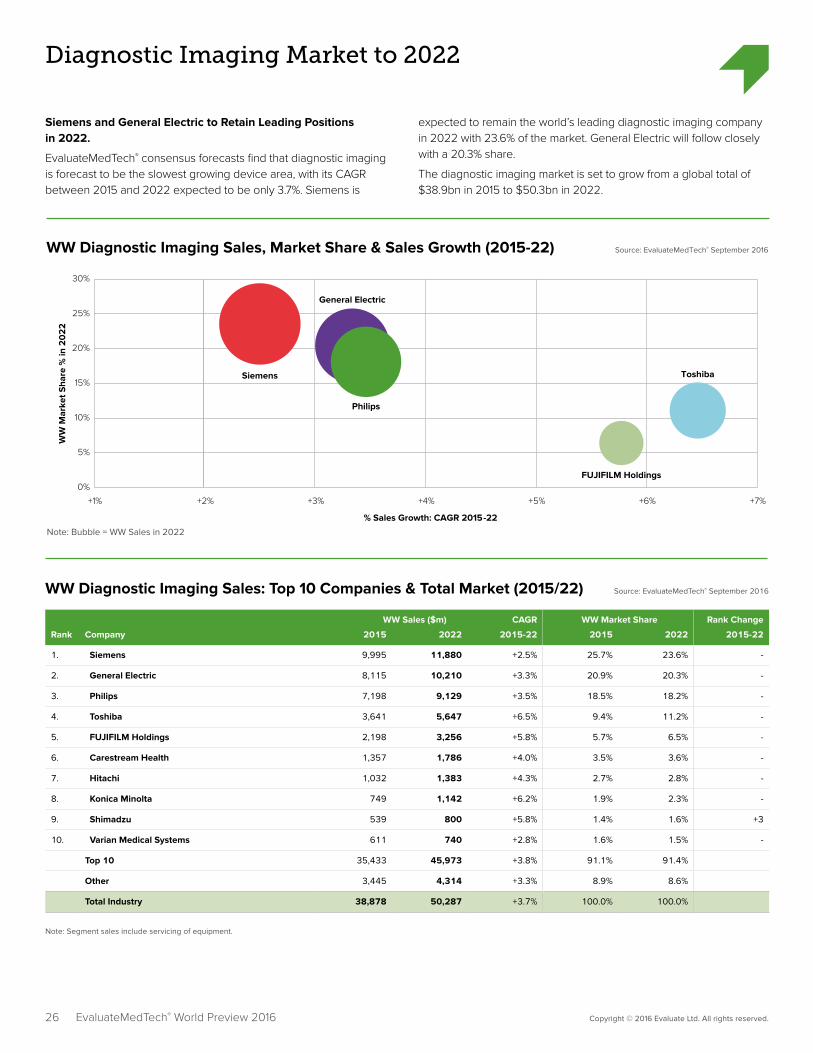
Diagnostic Imaging Market to 2022
Siemens and General Electric to Retain Leading Positions in 2022.
EvaluateMedTech® consensus forecasts find that diagnostic imaging is forecast to be the slowest growing device area, with its CAGR between 2015 and 2022 expected to be only 3.7%. Siemens is
expected to remain the world’s leading diagnostic imaging company in 2022 with 23.6% of the market. General Electric will follow closely with a 20.3% share.
The diagnostic imaging market is set to grow from a global total of $38.9bn in 2015 to $50.3bn in 2022.
EvaluateMedTech® World Preview 2016
Source: EvaluateMedTech® September 2016WW Diagnostic Imaging Sales, Market Share & Sales Growth (2015-22)
WW
Mar
ket S
hare
% in
20
22
+1%
0%
10%
5%
15%
20%
25%
30%
+3% +4%+2% +5% +6% +7%
ToshibaSiemens
FUJIFILM Holdings
General Electric
Philips
% Sales Growth: CAGR 2015-22
Note: Bubble = WW Sales in 2022
WW Diagnostic Imaging Sales: Top 10 Companies & Total Market (2015/22) Source: EvaluateMedTech® September 2016
WW Sales ($m) CAGR WW Market Share Rank Change
Rank Company 2015 2022 2015-22 2015 2022 2015-22
1. Siemens 9,995 11,880 +2.5% 25.7% 23.6% -
2. General Electric 8,115 10,210 +3.3% 20.9% 20.3% -
3. Philips 7,198 9,129 +3.5% 18.5% 18.2% -
4. Toshiba 3,641 5,647 +6.5% 9.4% 11.2% -
5. FUJIFILM Holdings 2,198 3,256 +5.8% 5.7% 6.5% -
6. Carestream Health 1,357 1,786 +4.0% 3.5% 3.6% -
7. Hitachi 1,032 1,383 +4.3% 2.7% 2.8% -
8. Konica Minolta 749 1,142 +6.2% 1.9% 2.3% -
9. Shimadzu 539 800 +5.8% 1.4% 1.6% +3
10. Varian Medical Systems 611 740 +2.8% 1.6% 1.5% -
Top 10 35,433 45,973 +3.8% 91.1% 91.4%
Other 3,445 4,314 +3.3% 8.9% 8.6%
Total Industry 38,878 50,287 +3.7% 100.0% 100.0%
Note: Segment sales include servicing of equipment.
27 Copyright © 2016 Evaluate Ltd. All rights reserved.
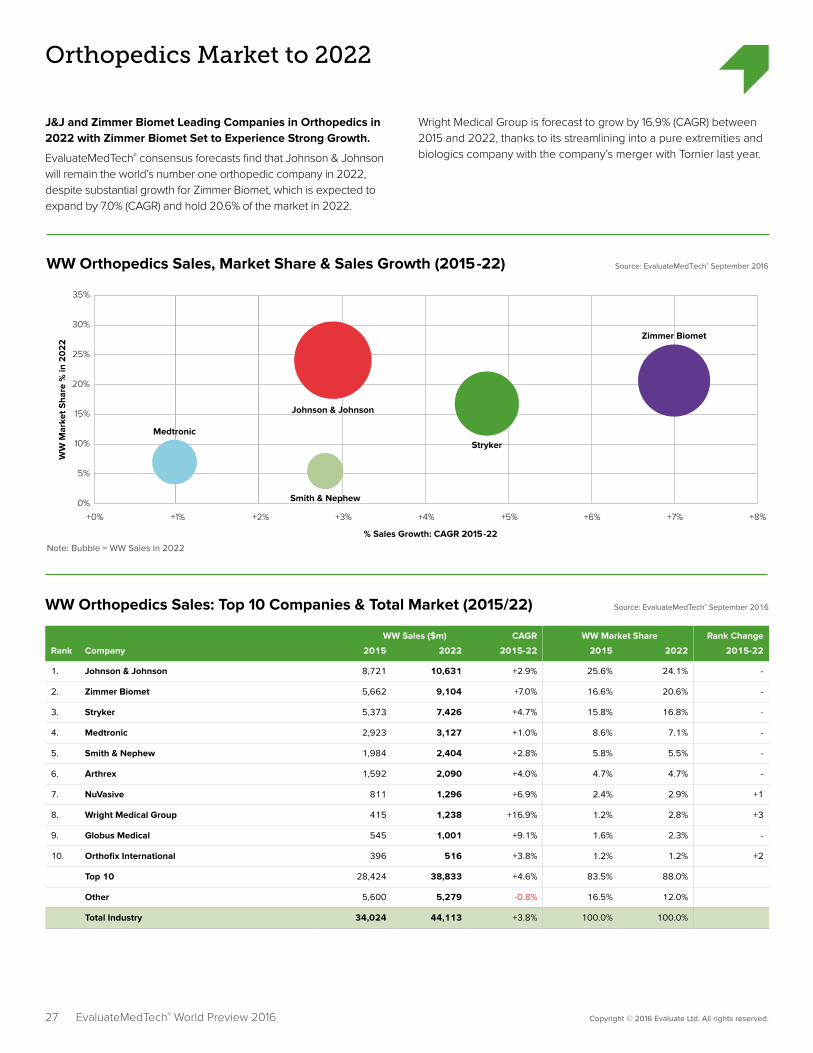
Orthopedics Market to 2022
J&J and Zimmer Biomet Leading Companies in Orthopedics in 2022 with Zimmer Biomet Set to Experience Strong Growth.
EvaluateMedTech® consensus forecasts find that Johnson & Johnson will remain the world’s number one orthopedic company in 2022, despite substantial growth for Zimmer Biomet, which is expected to expand by 7.0% (CAGR) and hold 20.6% of the market in 2022.
Wright Medical Group is forecast to grow by 16.9% (CAGR) between 2015 and 2022, thanks to its streamlining into a pure extremities and biologics company with the company’s merger with Tornier last year.
EvaluateMedTech® World Preview 2016
Source: EvaluateMedTech® September 2016WW Orthopedics Sales, Market Share & Sales Growth (2015-22)
WW
Mar
ket S
hare
% in
20
22
+0%
0%
10%
5%
15%
20%
25%
30%
35%
+3% +4%+2%+1% +5% +6% +7% +8%
Medtronic
Johnson & Johnson
Smith & Nephew
Zimmer Biomet
Stryker
% Sales Growth: CAGR 2015-22
Note: Bubble = WW Sales in 2022
WW Sales ($m) CAGR WW Market Share Rank Change
Rank Company 2015 2022 2015-22 2015 2022 2015-22
1. Johnson & Johnson 8,721 10,631 +2.9% 25.6% 24.1% -
2. Zimmer Biomet 5,662 9,104 +7.0% 16.6% 20.6% -
3. Stryker 5,373 7,426 +4.7% 15.8% 16.8% -
4. Medtronic 2,923 3,127 +1.0% 8.6% 7.1% -
5. Smith & Nephew 1,984 2,404 +2.8% 5.8% 5.5% -
6. Arthrex 1,592 2,090 +4.0% 4.7% 4.7% -
7. NuVasive 811 1,296 +6.9% 2.4% 2.9% +1
8. Wright Medical Group 415 1,238 +16.9% 1.2% 2.8% +3
9. Globus Medical 545 1,001 +9.1% 1.6% 2.3% -
10. Orthofix International 396 516 +3.8% 1.2% 1.2% +2
Top 10 28,424 38,833 +4.6% 83.5% 88.0%
Other 5,600 5,279 -0.8% 16.5% 12.0%
Total Industry 34,024 44,113 +3.8% 100.0% 100.0%
WW Orthopedics Sales: Top 10 Companies & Total Market (2015/22) Source: EvaluateMedTech® September 2016
28 Copyright © 2016 Evaluate Ltd. All rights reserved.
Ophthalmics Market to 2022
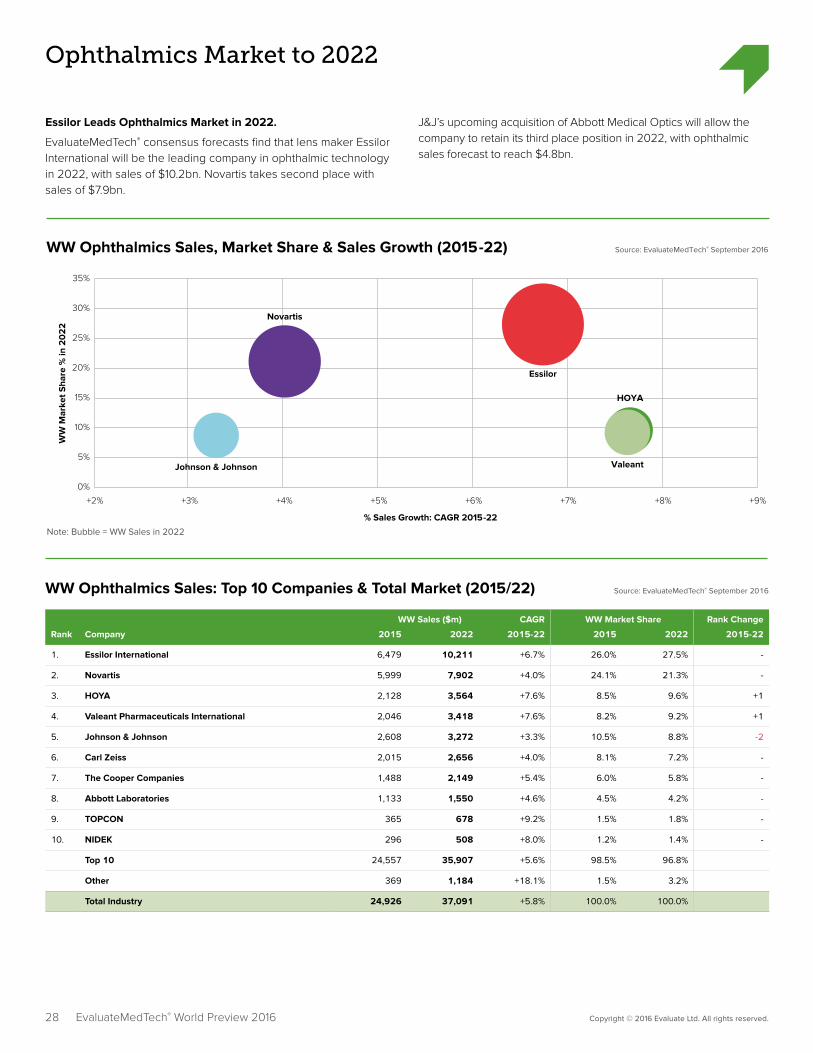
Essilor Leads Ophthalmics Market in 2022.
EvaluateMedTech® consensus forecasts find that lens maker Essilor International will be the leading company in ophthalmic technology in 2022, with sales of $10.2bn. Novartis takes second place with sales of $7.9bn.
J&J’s upcoming acquisition of Abbott Medical Optics will allow the company to retain its third place position in 2022, with ophthalmic sales forecast to reach $4.8bn.
EvaluateMedTech® World Preview 2016
Source: EvaluateMedTech® September 2016WW Ophthalmics Sales, Market Share & Sales Growth (2015-22)
WW
Mar
ket S
hare
% in
20
22
+2%
0%
10%
5%
15%
20%
25%
30%
35%
+5%+4%+3% +6% +7% +8% +9%
Essilor
Novartis
HOYA
Valeant
% Sales Growth: CAGR 2015-22
Note: Bubble = WW Sales in 2022
Johnson & Johnson
WW Sales ($m) CAGR WW Market Share Rank Change
Rank Company 2015 2022 2015-22 2015 2022 2015-22
1. Essilor International 6,479 10,211 +6.7% 26.0% 27.5% -
2. Novartis 5,999 7,902 +4.0% 24.1% 21.3% -
3. HOYA 2,128 3,564 +7.6% 8.5% 9.6% +1
4. Valeant Pharmaceuticals International 2,046 3,418 +7.6% 8.2% 9.2% +1
5. Johnson & Johnson 2,608 3,272 +3.3% 10.5% 8.8% -2
6. Carl Zeiss 2,015 2,656 +4.0% 8.1% 7.2% -
7. The Cooper Companies 1,488 2,149 +5.4% 6.0% 5.8% -
8. Abbott Laboratories 1,133 1,550 +4.6% 4.5% 4.2% -
9. TOPCON 365 678 +9.2% 1.5% 1.8% -
10. NIDEK 296 508 +8.0% 1.2% 1.4% -
Top 10 24,557 35,907 +5.6% 98.5% 96.8%
Other 369 1,184 +18.1% 1.5% 3.2%
Total Industry 24,926 37,091 +5.8% 100.0% 100.0%
WW Ophthalmics Sales: Top 10 Companies & Total Market (2015/22) Source: EvaluateMedTech® September 2016
29 Copyright © 2016 Evaluate Ltd. All rights reserved.EvaluateMedTech® World Preview 2016
M&A Analysis: 2011 to H1 2016 part 1 of 2
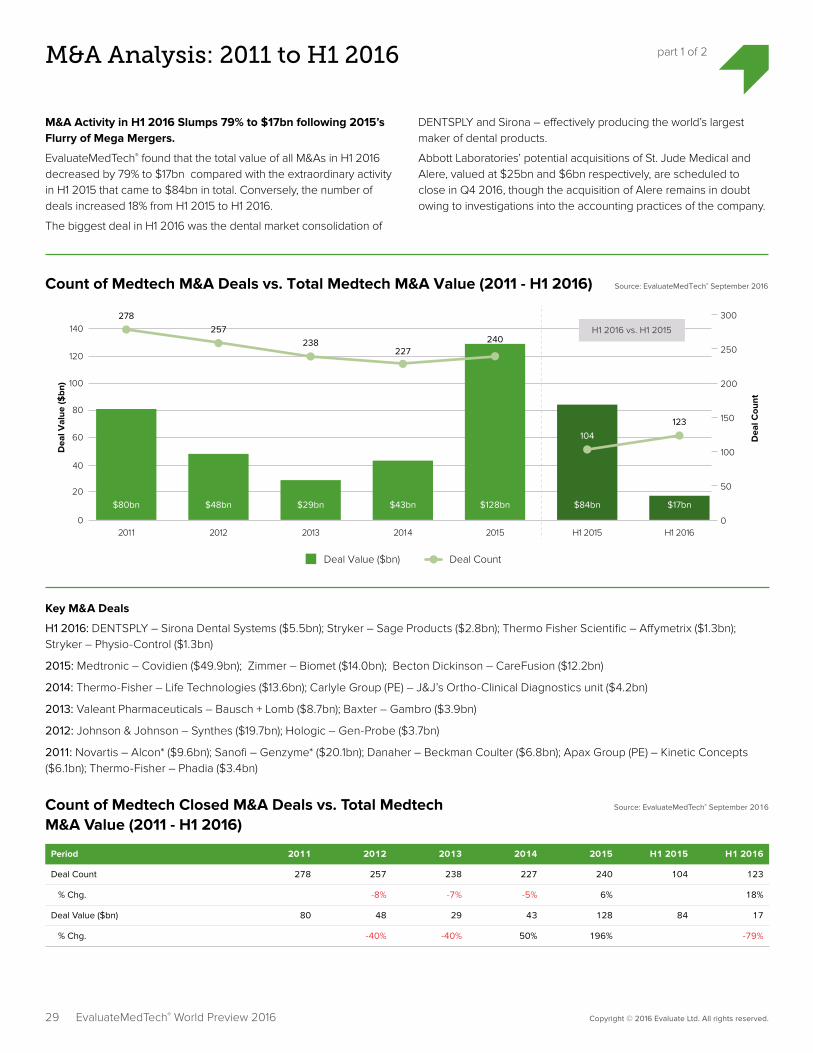
M&A Activity in H1 2016 Slumps 79% to $17bn following 2015’s Flurry of Mega Mergers.
EvaluateMedTech® found that the total value of all M&As in H1 2016 decreased by 79% to $17bn compared with the extraordinary activity in H1 2015 that came to $84bn in total. Conversely, the number of deals increased 18% from H1 2015 to H1 2016.
The biggest deal in H1 2016 was the dental market consolidation of
DENTSPLY and Sirona – effectively producing the world’s largest maker of dental products.
Abbott Laboratories’ potential acquisitions of St. Jude Medical and Alere, valued at $25bn and $6bn respectively, are scheduled to close in Q4 2016, though the acquisition of Alere remains in doubt owing to investigations into the accounting practices of the company.
Source: EvaluateMedTech® September 2016Count of Medtech M&A Deals vs. Total Medtech M&A Value (2011 - H1 2016)
Dea
l Val
ue ($
bn)
Dea
l Cou
nt
0
20
40
80
60
140
120
100
300
250
200
150
50
100
0
Deal Value ($bn) Deal Count
$48bn
2012
257
$80bn
2011
278
$29bn
2013
238
$43bn
2014
227
$128bn
2015
240
$84bn
H1 2015
104
$17bn
H1 2016
123
H1 2016 vs. H1 2015
Count of Medtech Closed M&A Deals vs. Total Medtech M&A Value (2011 - H1 2016)
Period 2011 2012 2013 2014 2015 H1 2015 H1 2016
Deal Count 278 257 238 227 240 104 123
% Chg. -8% -7% -5% 6% 18%
Deal Value ($bn) 80 48 29 43 128 84 17
% Chg. -40% -40% 50% 196% -79%
Source: EvaluateMedTech® September 2016
Key M&A Deals
H1 2016: DENTSPLY – Sirona Dental Systems ($5.5bn); Stryker – Sage Products ($2.8bn); Thermo Fisher Scientific – Affymetrix ($1.3bn); Stryker – Physio-Control ($1.3bn)
2015: Medtronic – Covidien ($49.9bn); Zimmer – Biomet ($14.0bn); Becton Dickinson – CareFusion ($12.2bn)
2014: Thermo-Fisher – Life Technologies ($13.6bn); Carlyle Group (PE) – J&J’s Ortho-Clinical Diagnostics unit ($4.2bn)
2013: Valeant Pharmaceuticals – Bausch + Lomb ($8.7bn); Baxter – Gambro ($3.9bn)
2012: Johnson & Johnson – Synthes ($19.7bn); Hologic – Gen-Probe ($3.7bn)
2011: Novartis – Alcon* ($9.6bn); Sanofi – Genzyme* ($20.1bn); Danaher – Beckman Coulter ($6.8bn); Apax Group (PE) – Kinetic Concepts ($6.1bn); Thermo-Fisher – Phadia ($3.4bn)

Top 10 Medtech M&A Deals Closed: Ranked on Deal Value (H1 2016) Source: EvaluateMedTech® September 2016
30 Copyright © 2016 Evaluate Ltd. All rights reserved.EvaluateMedTech® World Preview 2016
M&A Analysis: 2011 to H1 2016 part 2 of 2
Rank Target Country (Status) Acquiror Completion Date
Deal Value ($m)
1. Sirona Dental Systems Germany (Listed) DENTSPLY Sirona 29 Feb 16 5,507
2. Sage Products USA (Private) Stryker 01 Apr 16 2,775
3. Affymetrix USA (Listed) Thermo Fisher Scientific 31 Mar 16 1,300
4. Physio-Control USA (Private) Stryker 05 Apr 16 1,280
5. Diabetes Care business of Bayer Germany (Business Unit) Panasonic 05 Jan 16 1,110
6. Creganna Medical Ireland (Private) TE Connectivity 04 Apr 16 895
7. Brightree USA (Private) ResMed 04 Apr 16 800
8. Ellipse Technologies USA (Private) NuVasive 11 Feb 16 410
9. Focus Diagnostics USA (Business Unit) DiaSorin 13 May 16 300
10. Aesynt USA (Private) Omnicell 05 Jan 16 275
Other 2,822
Total 17,473
Note: Analysis based on closing date of deal.
*Alcon & Genzyme included in analysis as >25% of company sales are derived from medtech.
31 Copyright © 2016 Evaluate Ltd. All rights reserved.EvaluateMedTech® World Preview 2016
Venture Financing Analysis: 2011 to H1 2016 part 1 of 2
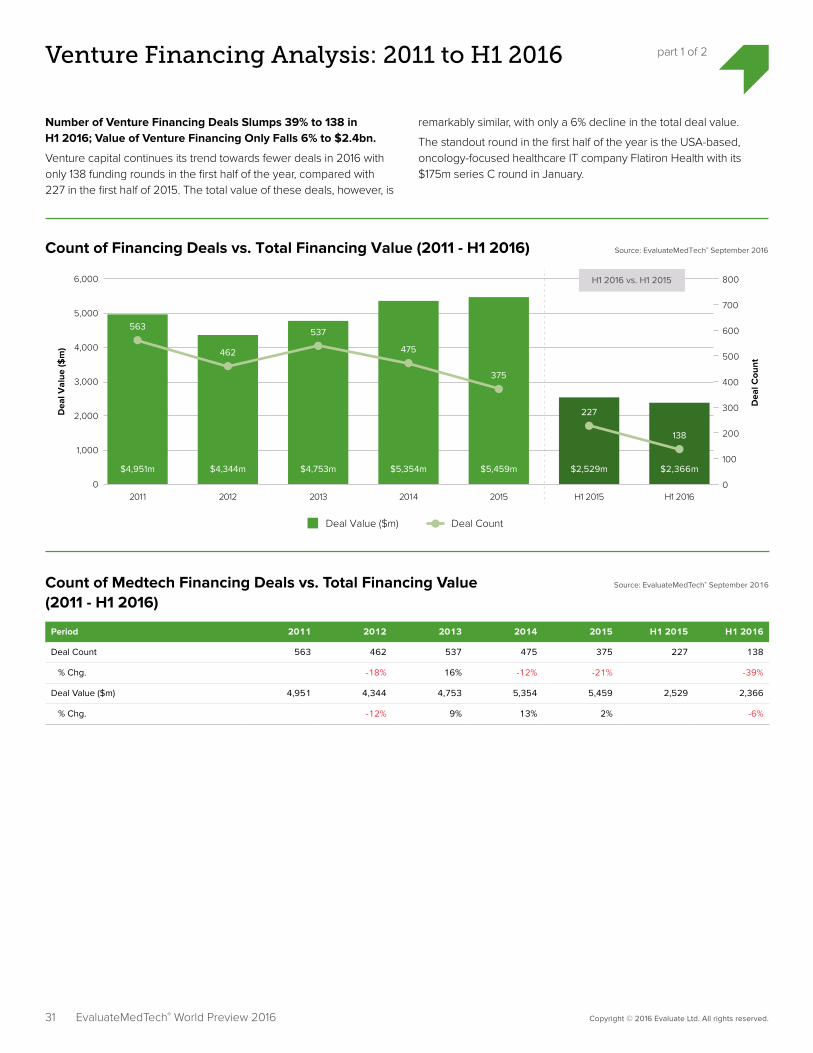
Number of Venture Financing Deals Slumps 39% to 138 in H1 2016; Value of Venture Financing Only Falls 6% to $2.4bn.
Venture capital continues its trend towards fewer deals in 2016 with only 138 funding rounds in the first half of the year, compared with 227 in the first half of 2015. The total value of these deals, however, is
remarkably similar, with only a 6% decline in the total deal value.
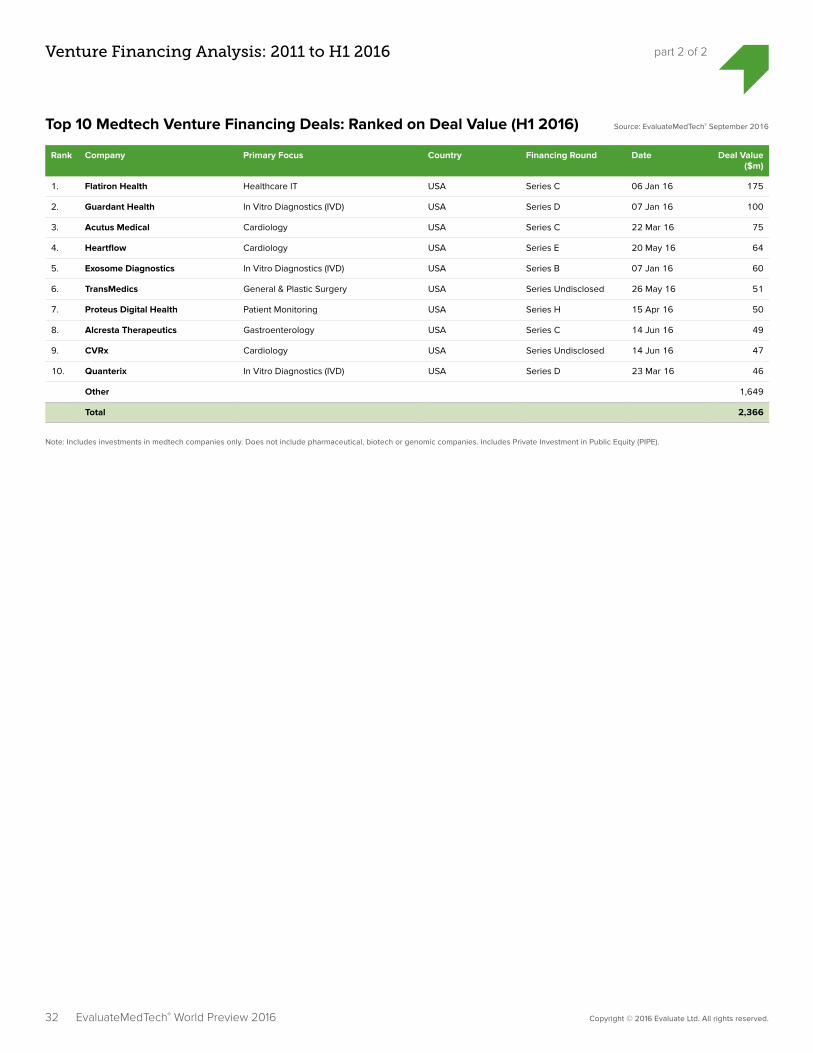
The standout round in the first half of the year is the USA-based, oncology-focused healthcare IT company Flatiron Health with its $175m series C round in January.
Source: EvaluateMedTech® September 2016Count of Financing Deals vs. Total Financing Value (2011 - H1 2016)
Dea
l Val
ue ($
m)
Dea
l Cou
nt
0
1,000
2,000
4,000
3,000
6,000
5,000
800
700
600
500
400
200
100
300
0
Deal Value ($m) Deal Count
$4,344m
2012
462
$4,951m
2011
563
$4,753m
2013
537
$5,354m
2014
475
$5,459m
2015
375
$2,529m
H1 2015
227
$2,366m
H1 2016
138
H1 2016 vs. H1 2015
Count of Medtech Financing Deals vs. Total Financing Value (2011 - H1 2016)
Period 2011 2012 2013 2014 2015 H1 2015 H1 2016
Deal Count 563 462 537 475 375 227 138
% Chg. -18% 16% -12% -21% -39%
Deal Value ($m) 4,951 4,344 4,753 5,354 5,459 2,529 2,366
% Chg. -12% 9% 13% 2% -6%
Source: EvaluateMedTech® September 2016
Top 10 Medtech Venture Financing Deals: Ranked on Deal Value (H1 2016) Source: EvaluateMedTech® September 2016
32 Copyright © 2016 Evaluate Ltd. All rights reserved.EvaluateMedTech® World Preview 2016
Venture Financing Analysis: 2011 to H1 2016 part 2 of 2
Rank Company Primary Focus Country Financing Round Date Deal Value ($m)
1. Flatiron Health Healthcare IT USA Series C 06 Jan 16 175
2. Guardant Health In Vitro Diagnostics (IVD) USA Series D 07 Jan 16 100
3. Acutus Medical Cardiology USA Series C 22 Mar 16 75
4. Heartflow Cardiology USA Series E 20 May 16 64
5. Exosome Diagnostics In Vitro Diagnostics (IVD) USA Series B 07 Jan 16 60
6. TransMedics General & Plastic Surgery USA Series Undisclosed 26 May 16 51
7. Proteus Digital Health Patient Monitoring USA Series H 15 Apr 16 50
8. Alcresta Therapeutics Gastroenterology USA Series C 14 Jun 16 49
9. CVRx Cardiology USA Series Undisclosed 14 Jun 16 47
10. Quanterix In Vitro Diagnostics (IVD) USA Series D 23 Mar 16 46
Other 1,649
Total 2,366
Note: Includes investments in medtech companies only. Does not include pharmaceutical, biotech or genomic companies. Includes Private Investment in Public Equity (PIPE).
33 Copyright © 2016 Evaluate Ltd. All rights reserved.EvaluateMedTech® World Preview 2016
IPO Analysis: 2014 to H1 2016 part 1 of 2
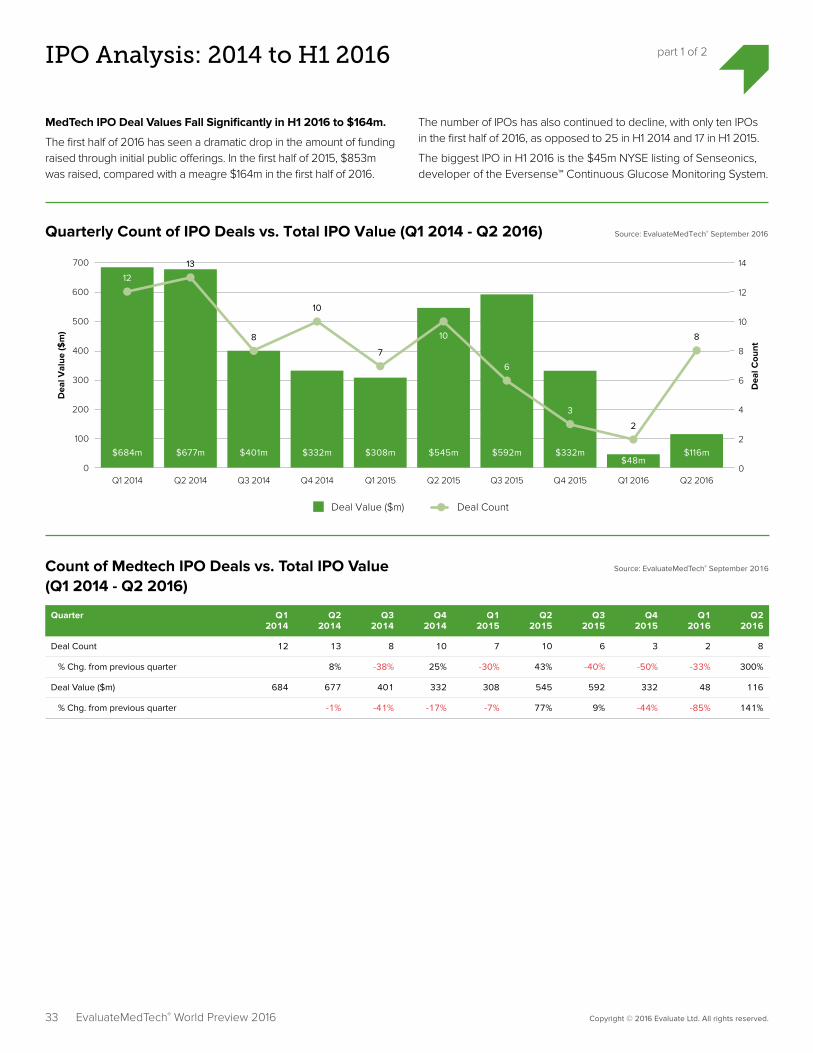
MedTech IPO Deal Values Fall Significantly in H1 2016 to $164m.
The first half of 2016 has seen a dramatic drop in the amount of funding raised through initial public offerings. In the first half of 2015, $853m was raised, compared with a meagre $164m in the first half of 2016.
The number of IPOs has also continued to decline, with only ten IPOs in the first half of 2016, as opposed to 25 in H1 2014 and 17 in H1 2015.
The biggest IPO in H1 2016 is the $45m NYSE listing of Senseonics, developer of the Eversense™ Continuous Glucose Monitoring System.
Source: EvaluateMedTech® September 2016Quarterly Count of IPO Deals vs. Total IPO Value (Q1 2014 - Q2 2016)
Dea
l Val
ue ($
m)
Dea
l Cou
nt
0
100
200
400
500
600
300
700 14
12
10
8
4
2
6
0
Deal Value ($m) Deal Count
$684m
Q1 2014
12
$677m
Q2 2014
13
$401m
Q3 2014
8
$332m
Q4 2014
10
$308m
Q1 2015
7
$545m
Q2 2015
10
$592m
Q3 2015
6
$332m
Q4 2015
3
$48m
Q1 2016
2
$116m
Q2 2016
8
Count of Medtech IPO Deals vs. Total IPO Value (Q1 2014 - Q2 2016)
Quarter Q1 2014
Q2 2014
Q3 2014
Q4 2014
Q1 2015
Q2 2015
Q3 2015
Q4 2015
Q1 2016
Q2 2016
Deal Count 12 13 8 10 7 10 6 3 2 8
% Chg. from previous quarter 8% -38% 25% -30% 43% -40% -50% -33% 300%
Deal Value ($m) 684 677 401 332 308 545 592 332 48 116
% Chg. from previous quarter -1% -41% -17% -7% 77% 9% -44% -85% 141%
Source: EvaluateMedTech® September 2016

Top 10 Medtech IPO Deals: Ranked on Deal Value (H1 2016) Source: EvaluateMedTech® September 2016
34 Copyright © 2016 Evaluate Ltd. All rights reserved.EvaluateMedTech® World Preview 2016
IPO Analysis: 2014 to H1 2016 part 2 of 2
Rank Company Primary Focus Country Stock Exchange Date Deal Value ($m)
1. Senseonics Diabetic Care USA NYSE 18 Mar 16 45
2. ASIT biotech In Vitro Diagnostics (IVD) Belgium Euronext 10 May 16 27
3. Valeritas Drug Delivery USA OTC Markets 03 May 16 25
4. Pulse Biosciences Radiology USA Nasdaq 18 May 16 20
5. Oncimmune In Vitro Diagnostics (IVD) United Kingdom London Stock Exchange (LSE) 18 May 16 16
6. Sensus Healthcare Oncology USA Nasdaq 03 Jun 16 11
7. Volpara Solutions Diagnostic Imaging New Zealand Australian Securities Exchange (ASX) 27 Apr 16 10
8. PAVMED Various USA Nasdaq 28 Apr 16 5
9. SunBio Various South Korea KOSDAQ 22 Jan 16 3
10. Osteonic Orthopedics South Korea KOSDAQ 04 May 16 2
Total 164
Note: Does not include pharmaceutical or biotech companies.
Excludes the following IPOs: NantHealth Q2 2016, Fitbit Q2 2015; Circassia Q1 2014, for which medtech is not a primary focus.
www.evaluate.com
Evaluate is the trusted provider of commercial intelligence including product sales and consensus forecasts to 2022 for commercial teams and their advisors within the global life science industry. We help our clients make high value decisions through superior quality, timely, must-have data and insights, combined with personalised, expert client support.
EvaluatePharma® delivers exclusive consensus sales forecasts and trusted commercial insight into biotech and pharmaceutical performance.
@EvaluatePharma
EvaluateMedTech® sets a new standard in commercial analysis and consensus forecasts of the global medical device and diagnostic industry.
@EvaluateMedTech
EvaluateClinical Trials® delivers unique clinical trial intelligence expertly curated to efficiently analyse the global clinical trial landscape.
@EPClinicalTrial
EP Vantage an award winning editorial team, provides daily commentary and analysis with fresh perspectives and insight into current and future industry trends.
@EPVantage
Evaluate Custom Services provides customised solutions to help you access, analyse and manage the information you need to support effective decision-making.
The Evaluate services enable the life science community to make sound business decisions about value and opportunity.
Evaluate Headquarters Evaluate Ltd. 1 1 -29 Fashion Street London E1 6PX United Kingdom T +44 (0)20 7377 0800 F +44 (0)20 7539 1801
Evaluate North America EvaluatePharma USA Inc. 15 Broad Street, Suite 401 Boston, MA 02109, USA T +1 617 573 9450 F +1 617 573 9542
Evaluate Japan Evaluate Japan KK Akasaka Garden City 4F 4-15-1 Akasaka, Minato-ku Tokyo 107-0052, Japan T +81 (0)80 1164 4754
Additional complimentary copies of this report can be downloaded at: www.evaluate.com/MedtechWorldPreview2016