Evaluate IEEE 802.11e EDCA Performance Tyler Ngo CMPE 257.
15
Evaluate IEEE 802.11e EDCA Performance Tyler Ngo CMPE 257
-
date post
19-Dec-2015 -
Category
Documents
-
view
229 -
download
3
Transcript of Evaluate IEEE 802.11e EDCA Performance Tyler Ngo CMPE 257.
Evaluate IEEE 802.11e EDCA Performance
Tyler Ngo
CMPE 257

EDCA vs. DCF
EDCA classifies traffic flows in different access categories (AC). Modifiable MAC parameters include:
– Arbitration Interframe Space (AIFS) replaces the DIFS in IEEE 802.11.– Minimum Contention Window (CWmin).– Maximum Contention Window (CWmax).– Transmission Opportunity (TXOP).
Shorter CW and AIFS for higher-priority traffic.
AC CWmin CWmax AIFSN Max TXOP Background (AC_BK) 31 1023 7 0 Best Effort (AC_BE) 31 1023 3 0
Video (AC_VI) 15 31 2 3.008ms Voice (AC_VO) 7 15 2 1.504ms
Legacy DCF 15 1023 2 0

Analytical Modeling Transmission Probability
Let W = CWmin, then CWmax = W * 2m, where m is the maximum backoff stage.
Let ρc be the probability that a packet of class c encounters a collision on the channel. Let τc be the probability that a station of class c transmit in a random
chosen slot. Then:

Analytical Modeling Throughput
Let ρtr be the probability that there is at least one transmission in the considered slot time. Then:
Let ρs,i be the probability that a transmission of a packet of node i occurring on the channel is successful. Let τj be the probability that a node j transmit data (j ≠ i, j = [1, n]). Then:
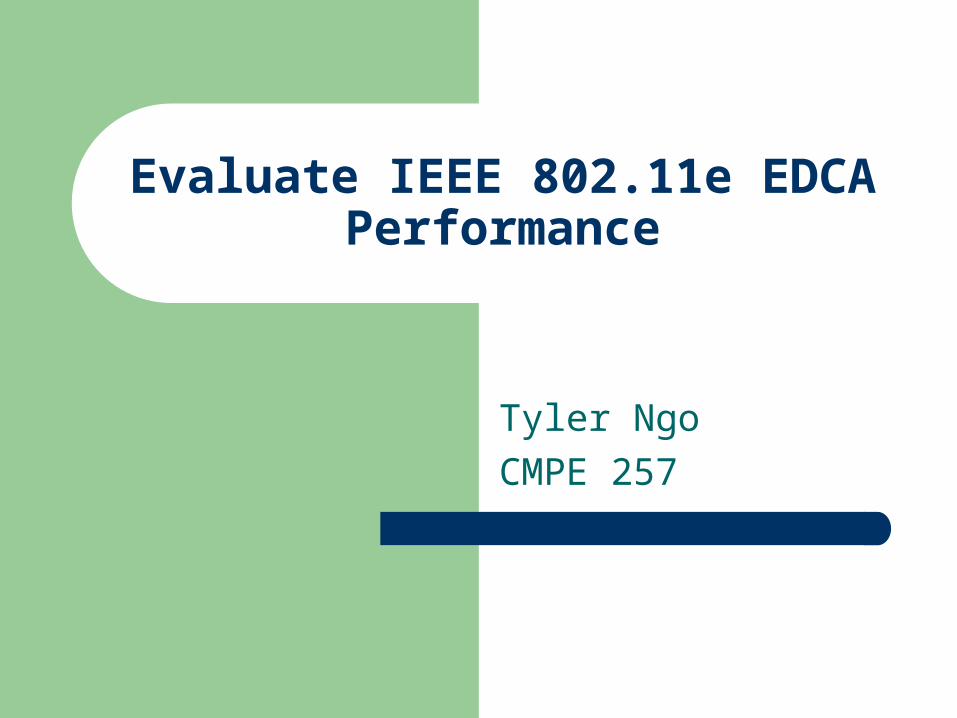
Analytical Modeling Throughput, Cont.
Let Ts,c be the average time that a node of class c senses the channel busy because of a successful transmission, TC,c be the average time that a node of class c senses the channel busy during a collision. Let E[P] be the expected packet length, H = PHYhdr + MAChdr be the packet header, δ be the propagation delay, and α be the length of a slot time. Then:
The throughput of node i, Si is then:

Simulation Modeling
Controlled Parameters:– Loss Model: Log Distance
Exponent = 3 Reference Distance = 1 Reference Loss: 46.67
– Delay Model: Random, Uniform variable; Constant speed.– Nist Error Rate Model– Transmission Range
Energy Detection Threshold: -96.0 CCA Mode1 Threshold: -99.0 Tx Power End/Start: 16.0206
– Routing Protocol: OLSR– TCP Protocol: New Reno– Data Rate: 5MB/s– Run time = ~100s– TCP Packet Size = 1024– UDP Packet Size = 120

Topology 1
Traffic: 6 7; 9 1; 3 8; 5 2 Total run duration: 100s
Topology 1
-150
-100
-50
0
50
100
150
-150 -100 -50 0 50 100 150
X
Y
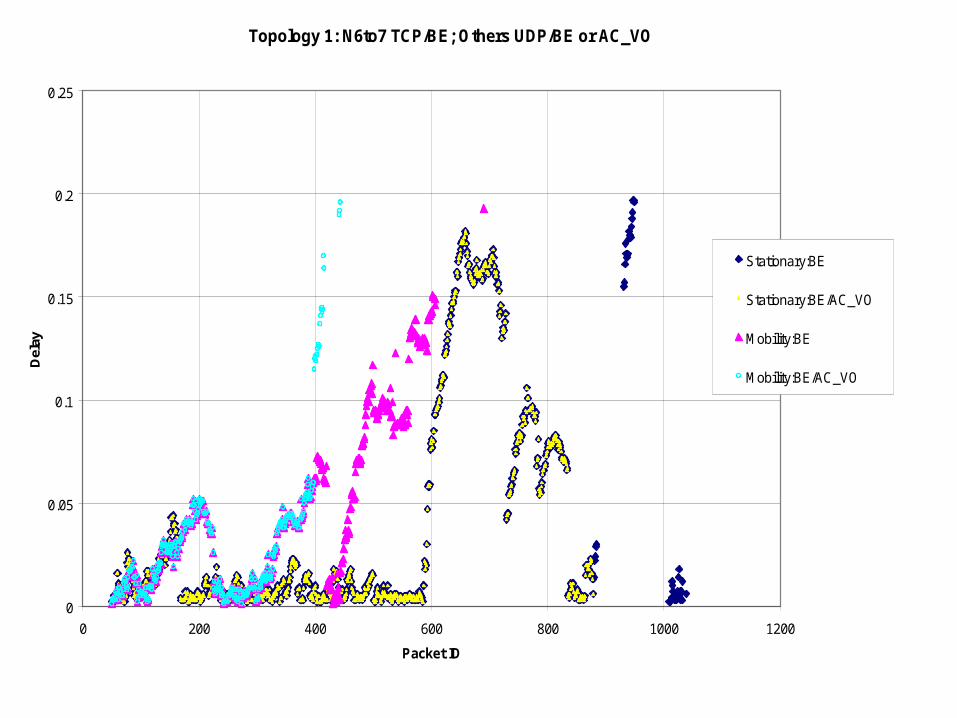
Topology 1: N6to7 TCP/BE; Others UDP/BE or AC_VO
0
0.05
0.1
0.15
0.2
0.25
0 200 400 600 800 1000 1200
Packet ID
Del
ay
Stationary:BE
Stationary:BE/AC_VO
Mobility:BE
Mobility:BE/AC_VO

Topology 1: N6to7 TCP/AC_VO; Others UDP/BE
0
0.005
0.01
0.015
0.02
0.025
0.03
0 200 400 600 800 1000 1200 1400 1600
Packet ID
Del
ay (
s)
Mobility
Stationary
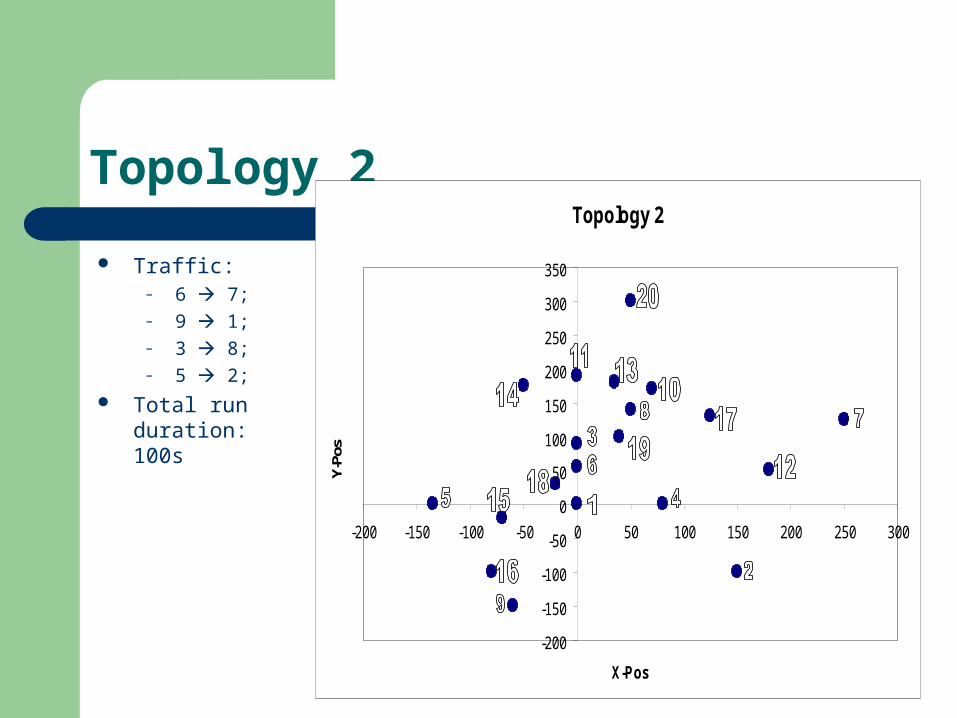
Topology 2
Traffic:– 6 7; – 9 1; – 3 8; – 5 2;
Total run duration: 100s
Topology 2
-200
-150
-100
-50
0
50
100
150
200
250
300
350
-200 -150 -100 -50 0 50 100 150 200 250 300
X-Pos
Y-Po
s

Topology 2: N6to7 TCP/BE; Others UDP/BE or AC_VO
0
0.02
0.04
0.06
0.08
0.1
0.12
0.14
0.16
0.18
0.2
0 50 100 150 200 250 300 350 400
Packet ID
Del
ay (
s)
Stationary: BE
Mobile: BE
Stationary: BE/AC_VO
Mobility: BE/AC_VO

Topology 2: N6to7 TCP/AC_VO; Others UDP/BE
0
0.02
0.04
0.06
0.08
0.1
0.12
0.14
0 200 400 600 800 1000 1200
Packet ID
Del
ay (
s)
Stationary
Mobility

Topology 3
Traffic: – 6 7; – 9 1; – 3 8; – 5 2;
Total run duration: 100s Mobile environment only
– Gaussian Markov Mobility Model

Topology 3: N6to7 TCP/BE or AC_VO; Others UDP/BE or AC_VO
0
0.02
0.04
0.06
0.08
0.1
0.12
0.14
0 100 200 300 400 500 600 700 800
Packet ID
Delay
(s)
BE
TCP: BE; UDP: AC_VO
TCP: AC_VO; UDP: BE
Conclusion
Higher-priority tagging improves throughputs. But…
What are the rules for tagging? TCP starvation is the main issue.


![Performance Analysis of IEEE 802.11e EDCA with QoS ......The enhanced distributed channel access (EDCA) protocol of the emerging IEEE 802.11e standard [5] supports access category](https://static.fdocuments.in/doc/165x107/60b0104527d5601cea74f490/performance-analysis-of-ieee-80211e-edca-with-qos-the-enhanced-distributed.jpg)

![Analytical Study of TCP Performance over IEEE 802.11e WLANsdaji/papers/monet2008.pdf2.1 IEEE 802.11e EDCA and TXOP The 802.11 DCF [8] does not support service differ-entiation. Basically,](https://static.fdocuments.in/doc/165x107/60b0104627d5601cea74f494/analytical-study-of-tcp-performance-over-ieee-80211e-dajipapersmonet2008pdf.jpg)