EVA: V A to I Fraudulent Eents - TU Wien · EVA: V A to I Fraudulent Eents R A. L, T Gandtner, S M,...
10
330 IEEE TRANSACTIONS ON VISUALIZATION AND COMPUTER GRAPHICS, VOL. 24, NO. 1, JANUARY 2018 1077-2626 2017 IEEE. Personal use is permitted, but republication/redistribution requires IEEE permission. See http://www.ieee.org/publications_standards/publications/rights/index.html for more information. Manuscript received 31 Mar. 2017; accepted 1 Aug. 2017. Date of publication 28 Aug. 2017; date of current version 1 Oct. 2017. For information on obtaining reprints of this article, please send e-mail to: [email protected], and reference the Digital Object Identifier below. Digital Object Identifier no. 10.1109/TVCG.2017.2744758 EVA: Visual Analytics to Identify Fraudulent Events Roger A. Leite, Theresia Gschwandtner, Silvia Miksch, Simone Kriglstein, Margit Pohl, Erich Gstrein, and Johannes Kuntner Fig. 1. Screenshot of EVA (Event detection with Visual Analytics). (A.1, A.2) Temporal Views: a filter was applied in (A.2) to the period from January 2014 until April 2014. (B) Score Construction View: each line represents a transaction and its scores. (C) Amount vs Overall Score Scatterplot. (D.1, D.2) Ranks of accounts that received the highest amounts of money from the selected account and accounts that received the highest number of transactions from the selected account. (E) Accounts Selector: bars shows amount of transactions from each account. (F) Dynamic Table of raw transaction data. In all views, elements that represents suspicious data are highlighted in red. Abstract— Financial institutions are interested in ensuring security and quality for their customers. Banks, for instance, need to identify and stop harmful transactions in a timely manner. In order to detect fraudulent operations, data mining techniques and customer profile analysis are commonly used. However, these approaches are not supported by Visual Analytics techniques yet. Visual Analytics techniques have potential to considerably enhance the knowledge discovery process and increase the detection and prediction accuracy of financial fraud detection systems. Thus, we propose EVA, a Visual Analytics approach for supporting fraud investigation, fine-tuning fraud detection algorithms, and thus, reducing false positive alarms. Index Terms—Visual Knowledge Discovery, Time Series Data, Business and Finance Visualization, Financial Fraud Detection 1 I NTRODUCTION Event detection is an important task in many domains such as find- ing interesting changes in stock markets, spotting problems in health parameters, or detecting financial fraud. Analyzing these events in a • Roger A. Leite, Theresia Gschwandtner, Silvia Miksch, and Margit Pohl are with Vienna University of Technology. E-mail: {firstname.lastname}@tuwien.ac.at • Simone Kriglstein is with University of Vienna Faculty of Computer Science, Austria. E-mail: [email protected] • Erich Gstrein and Johannes Kuntner are with Erste Group IT International, Austria. E-mail:{firstname.lastname}@erstegroup.com temporal context allows the identification of insights such as frequency, trends, and changes. Moreover, the investigation of outliers allows the analyst to identify risks, drastic changes, or rare occurrences. In this work we focus on the identification of anomalous events in the financial sector. Financial institutions handle millions of transactions from clients per year. Although the majority part of these transactions being legitimate, a small number of them are criminal attempts, which may cause serious harm to customers or to the financial institutions themselves. Thus, the trustability of each transaction has to be assessed by the institu- tion. However, due to the complex and multidimensional data at hand, financial fraud detection (FFD) is a difficult task. The well renowned Oxford Dictionary defines fraud as “wrongful or criminal deception intended to result in financial or personal gain” 1 . 1 http://www.oxforddictionaries.com/definition/english/fraud (accessed De- cember 10, 2016)
Transcript of EVA: V A to I Fraudulent Eents - TU Wien · EVA: V A to I Fraudulent Eents R A. L, T Gandtner, S M,...
330 IEEE TRANSACTIONS ON VISUALIZATION AND COMPUTER GRAPHICS, VOL. 24, NO. 1, JANUARY 2018
1077-2626 2017 IEEE. Personal use is permitted, but republication/redistribution requires IEEE permission.See http://www.ieee.org/publications_standards/publications/rights/index.html for more information.
Manuscript received 31 Mar. 2017; accepted 1 Aug. 2017.Date of publication 28 Aug. 2017; date of current version 1 Oct. 2017.For information on obtaining reprints of this article, please send e-mail to:[email protected], and reference the Digital Object Identifier below.Digital Object Identifier no. 10.1109/TVCG.2017.2744758
EVA: Visual Analytics to Identify Fraudulent Events
Roger A. Leite, Theresia Gschwandtner, Silvia Miksch, Simone Kriglstein,Margit Pohl, Erich Gstrein, and Johannes Kuntner
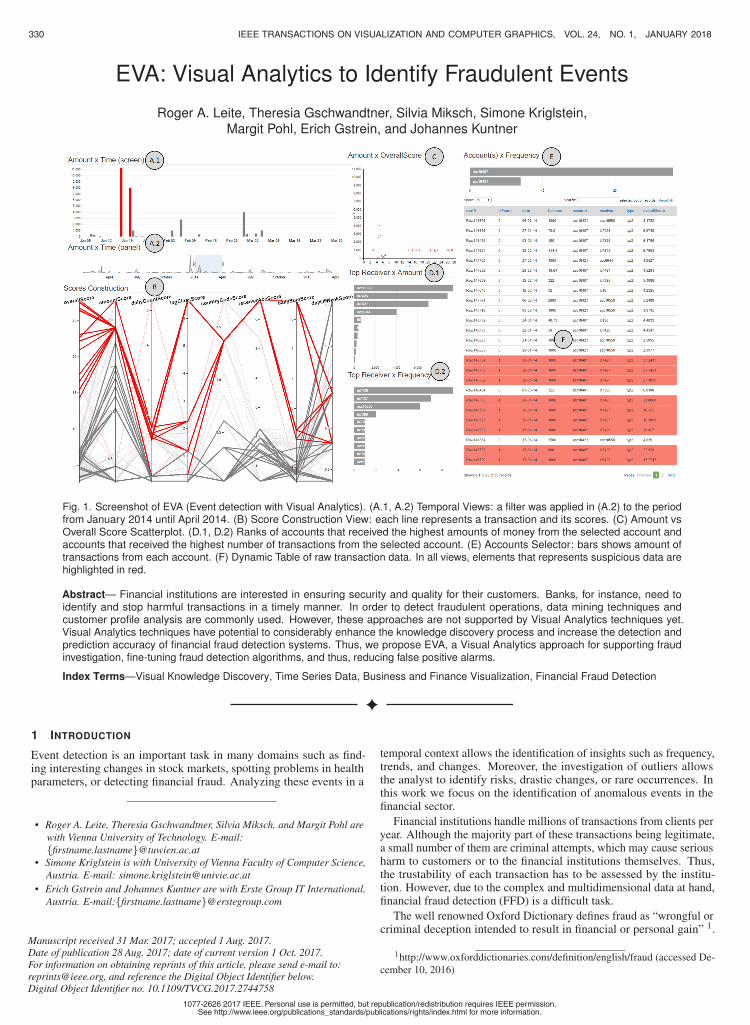
Fig. 1. Screenshot of EVA (Event detection with Visual Analytics). (A.1, A.2) Temporal Views: a filter was applied in (A.2) to the periodfrom January 2014 until April 2014. (B) Score Construction View: each line represents a transaction and its scores. (C) Amount vsOverall Score Scatterplot. (D.1, D.2) Ranks of accounts that received the highest amounts of money from the selected account andaccounts that received the highest number of transactions from the selected account. (E) Accounts Selector: bars shows amount oftransactions from each account. (F) Dynamic Table of raw transaction data. In all views, elements that represents suspicious data arehighlighted in red.
Abstract— Financial institutions are interested in ensuring security and quality for their customers. Banks, for instance, need toidentify and stop harmful transactions in a timely manner. In order to detect fraudulent operations, data mining techniques andcustomer profile analysis are commonly used. However, these approaches are not supported by Visual Analytics techniques yet.Visual Analytics techniques have potential to considerably enhance the knowledge discovery process and increase the detection andprediction accuracy of financial fraud detection systems. Thus, we propose EVA, a Visual Analytics approach for supporting fraudinvestigation, fine-tuning fraud detection algorithms, and thus, reducing false positive alarms.
Index Terms—Visual Knowledge Discovery, Time Series Data, Business and Finance Visualization, Financial Fraud Detection
1 INTRODUCTION
Event detection is an important task in many domains such as find-ing interesting changes in stock markets, spotting problems in healthparameters, or detecting financial fraud. Analyzing these events in a
• Roger A. Leite, Theresia Gschwandtner, Silvia Miksch, and Margit Pohl arewith Vienna University of Technology. E-mail:{firstname.lastname}@tuwien.ac.at
• Simone Kriglstein is with University of Vienna Faculty of Computer Science,Austria. E-mail: [email protected]
• Erich Gstrein and Johannes Kuntner are with Erste Group IT International,Austria. E-mail:{firstname.lastname}@erstegroup.com
temporal context allows the identification of insights such as frequency,trends, and changes. Moreover, the investigation of outliers allowsthe analyst to identify risks, drastic changes, or rare occurrences. Inthis work we focus on the identification of anomalous events in thefinancial sector.
Financial institutions handle millions of transactions from clients peryear. Although the majority part of these transactions being legitimate,a small number of them are criminal attempts, which may cause seriousharm to customers or to the financial institutions themselves. Thus,the trustability of each transaction has to be assessed by the institu-tion. However, due to the complex and multidimensional data at hand,financial fraud detection (FFD) is a difficult task.
The well renowned Oxford Dictionary defines fraud as “wrongful orcriminal deception intended to result in financial or personal gain” 1.
1http://www.oxforddictionaries.com/definition/english/fraud (accessed De-cember 10, 2016)
Software environments handling sensitive data such as financial op-eration management systems, systems for insurance evaluation, orcompanies‘ internal control systems, need to be in constant evaluationto prevent fraud, to provide risk management, and, thus, to avoid seriousconsequences. All these scenarios deal with similar data with the aimto detect suspicious events and, thus, to identify frauds. For instance,the two tasks of monitoring bank transactions and credit control usuallyinvolve data with time-oriented and multivariate aspects. Due to itscomplex nature [1], time-oriented and multivariate data require sophis-ticated means for detailed analysis and exploration. By consequence,both are subjects of interest to the Visual Analytics (VA) community.
Besides its challenging nature, FFD has also a strong social andfinancial importance. For instance, fraudulent schemes such as ‘moneylaundering’, ‘unauthorized transaction’, or ‘straw person’ should bedetected and fought as fast as possible by financial systems, sincethe negative economical and social impact increases with time. Thus,governments, banks, and other financial institutions that provide creditand money transaction services have a strong interest in improvingoperation monitoring and fraud detection.
Kielman et al. [14] describe fraud detection as an open VA problemthat requires visual exploration, discovery, and analysis. However,many of the current solutions involve mainly data mining techniques,while neglecting the potential of VA techniques to integrate humananalysis into the process [13]. In this paper, we aim at closing thisgap by presenting a VA approach for the investigation of suspiciousfinancial transactions and fine-tuning of an existing automatic alertsystem. VA approaches may be utilized to identify different types offrauds. In this work, we focus on detecting “unauthorized transactions”within a financial institution. We designed our VA approach for FFDaccording to the nested model [29] paying attention that our solution isflexible and extensible enough to be applied in similar domains withsimilar multivariate and time-oriented aspects. The main contributionsare:
• In tight collaboration with domain experts we analyzed the realworld problem of FFD and iteratively designed EVA, a VA ap-proach to improve their current work flow;
• EVA interweaves well-known visualization techniques, which ourdomain experts are mostly familiar with, and automatic methods;
• To the best of our knowledge, we present the first VA approachbased on a scoring system for FFD;
• We present our findings from an evaluation with three target users(not involved in the design process) and categorize the types ofinsights that could be gained with our prototype;
• We derived open challenges and possible future research direc-tions in the field.
2 RELATED WORK
There is a number of surveys that focus on fraud detection. In 2002,Bolton and Hand [32] published a review about fraud detection ap-proaches. They described the available tools for statistical fraud detec-tion and identified the most used technologies in four areas: credit cardfraud, money laundering, telecommunication fraud, and computer intru-sion. Kou et al. [20] presented a survey of techniques for identifying thesame types of fraud as described in [32]. The different approaches arebroadly classified into two categories: misuse and anomaly detection.Both categories present techniques such as: outlier detection, neuralnetworks, expert systems, model-based reasoning, data mining, statetransition analysis, and information visualization. These works helpedus to understand diverse fraud domains and how they are normallytackled. When looking on surveys of visual approaches for financialdata, we identified FinanceVis [7] which is a browser tool includingover 85 papers related to financial data visualization. FinanceVis wasinstrumental in analyzing how data that is similar to our data is usuallyvisualized. Motivated by a lack of information, Ko et al. [19] presented
a survey of approaches for exploring financial data. In this work, finan-cial data experts were interviewed concerning their preferences of datasources, automated techniques, visualizations, and interaction methods.
When it comes to visual solutions to support FFD, Kirk-land et al. [15] published one of the first works in fraud detectionusing visual techniques. In their work they combined Artificial In-telligence (AI), visualization, pattern recognition, and data mining tosupport regulatory analysis, alerts (fraud detection), and knowledgediscovery. In our approach, we use a similar combination of tech-niques, but we also provide means for an interactive exploration of thevisualized data.
WireVis’s [4] main idea is to explore big amounts of transaction datausing multiple coordinated views. In order to aid fraud detection, theyhighlight similarities between accounts based on keywords over time.Yet, WireVis does not support the detailed analysis of single accountswithout clustering a set of accounts by their similar keywords usage.This is the most similar approach to EVA. However, instead of focusingon hierarchical analysis of keywords patterns within the transactions,EVA enables a broader and more flexible analysis. A deeper comparisonwith our approach is provided in Section 5.1.1. A first financial dataflow is presented by [34]. In this approach, data are aggregated in orderto allow users to draw analytical conclusions and make transactiondecisions. EventFlow [28] was designed to facilitate analysis, query,and data transformation of temporal event datasets. The goal of thiswork is to create aggregated data representations to track entities andthe events related to them. When looking at approaches for eventmonitoring in general, Huang et al. [10] presented a VA framework forstock market security. In order to reduce the number of false alarmsproduced by traditional AI techniques, this work presents a visualizationapproach combining a 3D tree map for market performance analysis anda node-link diagram for network analysis. Dilla et al. [6], presented thecurrent needs in FFD. The authors presented a theoretical frameworkto predict when and how the investigators should apply VA techniques.They evaluated various visualization techniques and derived whichvisualizations support different cognitive processes. In addition, theauthors also suggest future challenges in this research area and discussthe efficacy of interactive data visualization for fraud detection, whichwe used as a starting point for our approach.
Carminati et al. [3] presented a semi-supervised online banking fraudanalysis and decision support based on profile generation and analysis.While this approach provides no visual support for fraud analysis, it isdirectly related to our approach since we are also focusing on profileanalysis. However, we believe that VA methods have great potentialto foster the investigation of the data and enable the analyst to betterfine-tune the scoring system.
In the health domain, Rind et al. [33] conducted a survey study fo-cusing on information visualization systems for exploring and queryingelectronic health records. Moreover, Wagner et al. [36] presented a sys-tematic overview and categorization of malware visualization systemsfrom a VA perspective. Both domains of these studies are similar toFFD, since they both involve multivariate and temporal aspects. How-ever, the FFD domain demands for special consideration due to thecomplexity of the involved tasks (see Section 3.2).
3 FINANCIAL FRAUD DETECTION
We developed our prototype called EVA (Event detection with VisualAnalytics) in tight collaboration with a national bank institution [8]with the aim to improve and support their current FFD techniques.
In this section, we (1) describe the characteristics of transactiondata, (2) discuss the complexity of the problem at hand, (3) present thecurrently used methodology for FFD at the bank, and (4) sketch EVA’sscoring approach.
3.1 Transaction DataWe use an anonymized data set of real money transactions from our col-laborating bank. This data set contains all transactions (e.g., payments,money transfers) executed or received by one of its customers withina given time period. Each transaction event is composed by severalcategorical, numerical, geospatial, and temporal dimensions. Some
LEITE ET AL.: EVA: VISUAL ANALYTICS TO IDENTIFY FRAUDULENT EVENTS 331
EVA: Visual Analytics to Identify Fraudulent Events
Roger A. Leite, Theresia Gschwandtner, Silvia Miksch, Simone Kriglstein,Margit Pohl, Erich Gstrein, and Johannes Kuntner
Fig. 1. Screenshot of EVA (Event detection with Visual Analytics). (A.1, A.2) Temporal Views: a filter was applied in (A.2) to the periodfrom January 2014 until April 2014. (B) Score Construction View: each line represents a transaction and its scores. (C) Amount vsOverall Score Scatterplot. (D.1, D.2) Ranks of accounts that received the highest amounts of money from the selected account andaccounts that received the highest number of transactions from the selected account. (E) Accounts Selector: bars shows amount oftransactions from each account. (F) Dynamic Table of raw transaction data. In all views, elements that represents suspicious data arehighlighted in red.
Abstract— Financial institutions are interested in ensuring security and quality for their customers. Banks, for instance, need toidentify and stop harmful transactions in a timely manner. In order to detect fraudulent operations, data mining techniques andcustomer profile analysis are commonly used. However, these approaches are not supported by Visual Analytics techniques yet.Visual Analytics techniques have potential to considerably enhance the knowledge discovery process and increase the detection andprediction accuracy of financial fraud detection systems. Thus, we propose EVA, a Visual Analytics approach for supporting fraudinvestigation, fine-tuning fraud detection algorithms, and thus, reducing false positive alarms.
Index Terms—Visual Knowledge Discovery, Time Series Data, Business and Finance Visualization, Financial Fraud Detection
1 INTRODUCTION
Event detection is an important task in many domains such as find-ing interesting changes in stock markets, spotting problems in healthparameters, or detecting financial fraud. Analyzing these events in a
• Roger A. Leite, Theresia Gschwandtner, Silvia Miksch, and Margit Pohl arewith Vienna University of Technology. E-mail:{firstname.lastname}@tuwien.ac.at
• Simone Kriglstein is with University of Vienna Faculty of Computer Science,Austria. E-mail: [email protected]
• Erich Gstrein and Johannes Kuntner are with Erste Group IT International,Austria. E-mail:{firstname.lastname}@erstegroup.com
temporal context allows the identification of insights such as frequency,trends, and changes. Moreover, the investigation of outliers allowsthe analyst to identify risks, drastic changes, or rare occurrences. Inthis work we focus on the identification of anomalous events in thefinancial sector.
Financial institutions handle millions of transactions from clients peryear. Although the majority part of these transactions being legitimate,a small number of them are criminal attempts, which may cause seriousharm to customers or to the financial institutions themselves. Thus,the trustability of each transaction has to be assessed by the institu-tion. However, due to the complex and multidimensional data at hand,financial fraud detection (FFD) is a difficult task.
The well renowned Oxford Dictionary defines fraud as “wrongful orcriminal deception intended to result in financial or personal gain” 1.
1http://www.oxforddictionaries.com/definition/english/fraud (accessed De-cember 10, 2016)
Software environments handling sensitive data such as financial op-eration management systems, systems for insurance evaluation, orcompanies‘ internal control systems, need to be in constant evaluationto prevent fraud, to provide risk management, and, thus, to avoid seriousconsequences. All these scenarios deal with similar data with the aimto detect suspicious events and, thus, to identify frauds. For instance,the two tasks of monitoring bank transactions and credit control usuallyinvolve data with time-oriented and multivariate aspects. Due to itscomplex nature [1], time-oriented and multivariate data require sophis-ticated means for detailed analysis and exploration. By consequence,both are subjects of interest to the Visual Analytics (VA) community.
Besides its challenging nature, FFD has also a strong social andfinancial importance. For instance, fraudulent schemes such as ‘moneylaundering’, ‘unauthorized transaction’, or ‘straw person’ should bedetected and fought as fast as possible by financial systems, sincethe negative economical and social impact increases with time. Thus,governments, banks, and other financial institutions that provide creditand money transaction services have a strong interest in improvingoperation monitoring and fraud detection.
Kielman et al. [14] describe fraud detection as an open VA problemthat requires visual exploration, discovery, and analysis. However,many of the current solutions involve mainly data mining techniques,while neglecting the potential of VA techniques to integrate humananalysis into the process [13]. In this paper, we aim at closing thisgap by presenting a VA approach for the investigation of suspiciousfinancial transactions and fine-tuning of an existing automatic alertsystem. VA approaches may be utilized to identify different types offrauds. In this work, we focus on detecting “unauthorized transactions”within a financial institution. We designed our VA approach for FFDaccording to the nested model [29] paying attention that our solution isflexible and extensible enough to be applied in similar domains withsimilar multivariate and time-oriented aspects. The main contributionsare:
• In tight collaboration with domain experts we analyzed the realworld problem of FFD and iteratively designed EVA, a VA ap-proach to improve their current work flow;
• EVA interweaves well-known visualization techniques, which ourdomain experts are mostly familiar with, and automatic methods;
• To the best of our knowledge, we present the first VA approachbased on a scoring system for FFD;
• We present our findings from an evaluation with three target users(not involved in the design process) and categorize the types ofinsights that could be gained with our prototype;
• We derived open challenges and possible future research direc-tions in the field.
2 RELATED WORK
There is a number of surveys that focus on fraud detection. In 2002,Bolton and Hand [32] published a review about fraud detection ap-proaches. They described the available tools for statistical fraud detec-tion and identified the most used technologies in four areas: credit cardfraud, money laundering, telecommunication fraud, and computer intru-sion. Kou et al. [20] presented a survey of techniques for identifying thesame types of fraud as described in [32]. The different approaches arebroadly classified into two categories: misuse and anomaly detection.Both categories present techniques such as: outlier detection, neuralnetworks, expert systems, model-based reasoning, data mining, statetransition analysis, and information visualization. These works helpedus to understand diverse fraud domains and how they are normallytackled. When looking on surveys of visual approaches for financialdata, we identified FinanceVis [7] which is a browser tool includingover 85 papers related to financial data visualization. FinanceVis wasinstrumental in analyzing how data that is similar to our data is usuallyvisualized. Motivated by a lack of information, Ko et al. [19] presented
a survey of approaches for exploring financial data. In this work, finan-cial data experts were interviewed concerning their preferences of datasources, automated techniques, visualizations, and interaction methods.
When it comes to visual solutions to support FFD, Kirk-land et al. [15] published one of the first works in fraud detectionusing visual techniques. In their work they combined Artificial In-telligence (AI), visualization, pattern recognition, and data mining tosupport regulatory analysis, alerts (fraud detection), and knowledgediscovery. In our approach, we use a similar combination of tech-niques, but we also provide means for an interactive exploration of thevisualized data.
WireVis’s [4] main idea is to explore big amounts of transaction datausing multiple coordinated views. In order to aid fraud detection, theyhighlight similarities between accounts based on keywords over time.Yet, WireVis does not support the detailed analysis of single accountswithout clustering a set of accounts by their similar keywords usage.This is the most similar approach to EVA. However, instead of focusingon hierarchical analysis of keywords patterns within the transactions,EVA enables a broader and more flexible analysis. A deeper comparisonwith our approach is provided in Section 5.1.1. A first financial dataflow is presented by [34]. In this approach, data are aggregated in orderto allow users to draw analytical conclusions and make transactiondecisions. EventFlow [28] was designed to facilitate analysis, query,and data transformation of temporal event datasets. The goal of thiswork is to create aggregated data representations to track entities andthe events related to them. When looking at approaches for eventmonitoring in general, Huang et al. [10] presented a VA framework forstock market security. In order to reduce the number of false alarmsproduced by traditional AI techniques, this work presents a visualizationapproach combining a 3D tree map for market performance analysis anda node-link diagram for network analysis. Dilla et al. [6], presented thecurrent needs in FFD. The authors presented a theoretical frameworkto predict when and how the investigators should apply VA techniques.They evaluated various visualization techniques and derived whichvisualizations support different cognitive processes. In addition, theauthors also suggest future challenges in this research area and discussthe efficacy of interactive data visualization for fraud detection, whichwe used as a starting point for our approach.
Carminati et al. [3] presented a semi-supervised online banking fraudanalysis and decision support based on profile generation and analysis.While this approach provides no visual support for fraud analysis, it isdirectly related to our approach since we are also focusing on profileanalysis. However, we believe that VA methods have great potentialto foster the investigation of the data and enable the analyst to betterfine-tune the scoring system.
In the health domain, Rind et al. [33] conducted a survey study fo-cusing on information visualization systems for exploring and queryingelectronic health records. Moreover, Wagner et al. [36] presented a sys-tematic overview and categorization of malware visualization systemsfrom a VA perspective. Both domains of these studies are similar toFFD, since they both involve multivariate and temporal aspects. How-ever, the FFD domain demands for special consideration due to thecomplexity of the involved tasks (see Section 3.2).
3 FINANCIAL FRAUD DETECTION
We developed our prototype called EVA (Event detection with VisualAnalytics) in tight collaboration with a national bank institution [8]with the aim to improve and support their current FFD techniques.
In this section, we (1) describe the characteristics of transactiondata, (2) discuss the complexity of the problem at hand, (3) present thecurrently used methodology for FFD at the bank, and (4) sketch EVA’sscoring approach.
3.1 Transaction DataWe use an anonymized data set of real money transactions from our col-laborating bank. This data set contains all transactions (e.g., payments,money transfers) executed or received by one of its customers withina given time period. Each transaction event is composed by severalcategorical, numerical, geospatial, and temporal dimensions. Some
332 IEEE TRANSACTIONS ON VISUALIZATION AND COMPUTER GRAPHICS, VOL. 24, NO. 1, JANUARY 2018
examples are: sender/receiver, amount of money, location, and time ofexecution. The combination of these different aspects of data resultsin complex analysis scenarios that require the combination of differenttechniques in order to be tackled. More details concerning the data setused during development and evaluation are given in Section 5.
3.2 Problem ComplexityAutomated FFD techniques are suited for well-defined problems andscenarios where the investigator knows exactly which patterns he/sheis examining. However, the majority of fraudulent cases are not easilypredictable by common rules and require some human investigation.Consequently, new methods such as VA are needed for these ill-definedproblems. Besides the complexity that comes with the multivariate dataset, there are several additional aspects that add up to the complexity ofFFD.
Scalability. Financial institutions execute hundreds of thousands oftransactions per day. To validate the veracity of all these transactionsrequires visually and analytically scalable solutions [22].
Context complexity. To better understand frauds, we need to con-sider the motivations that guide this criminal act. It is known thatgeopolitical, social, and economical contexts influence this criminal be-havior [12]. Considering the ever changing local and global scenarios,FFD techniques need to be adapted frequently.
Frequent Changes. Not only there are many different types offrauds, but new ones are constantly being created and old ones areconstantly being adapted in order to hide from current detection mecha-nisms.
False Positives. For each transaction that is flagged as suspiciousby the automatic system, an investigator has to decide if the accusationof fraudulent behavior is correct, or not. Depending on the fraudu-lent classification (i.g., in case of money laundering suspicion), theowner account is then sued. To bring the accusation to court, involvesprofessionals and costs a lot of money. This means that as the levelsof positive alarms increase, the bank wastes money and, also, loosescustomers. Besides, even if identified during the process, false positivealarms overloads the investigators and waste their time of analysis.
False Negatives. Frauds that are neither detected by the automaticscoring system nor by investigators produce a financial damage to thebank and impact its clients‘ safety. They also impact the trustworthinessof the institution. Moreover, false negatives overlook actual recurrentfrauds and, by consequence, result in fraudulent harm [23]. In otherwords, in order to be more helpful than harmful, the solutions need tobe precise in estimating possible threats.
Fraud Classification. Fraudulent techniques are constantly beingupdated and reinvented. The definition of a set of features that classifyfraud techniques is a difficult task which increases with the amount andcomplexity of data dimensions.
Time-Oriented Analysis. FFD not only requires the identificationof temporal outliers, but also of periodic behavior (e.g., disguisingfraudulent transactions as monthly bill payments). If well planned,frauds can avoid automatic algorithms detection. Thus, synchronousand asynchronous temporal aspects should be observed during analysis.However, due to its complexity [1], there are many aspects of temporaldata that need to be analyzed efficiently.
3.3 Methodology for FFDIn this subsection we give an overview of the methodology that isused for FFD by our collaborating bank. Since we are using realdata that is quite sensitive, we need to respect privacy and securityregulations. Thus, we are not allowed to get into details about theactual algorithms. However, we roughly sketch the four phases of theFFD methodology applied: Profile Generation System, Scoring System,Results Interpretation, and Fraud Validation.
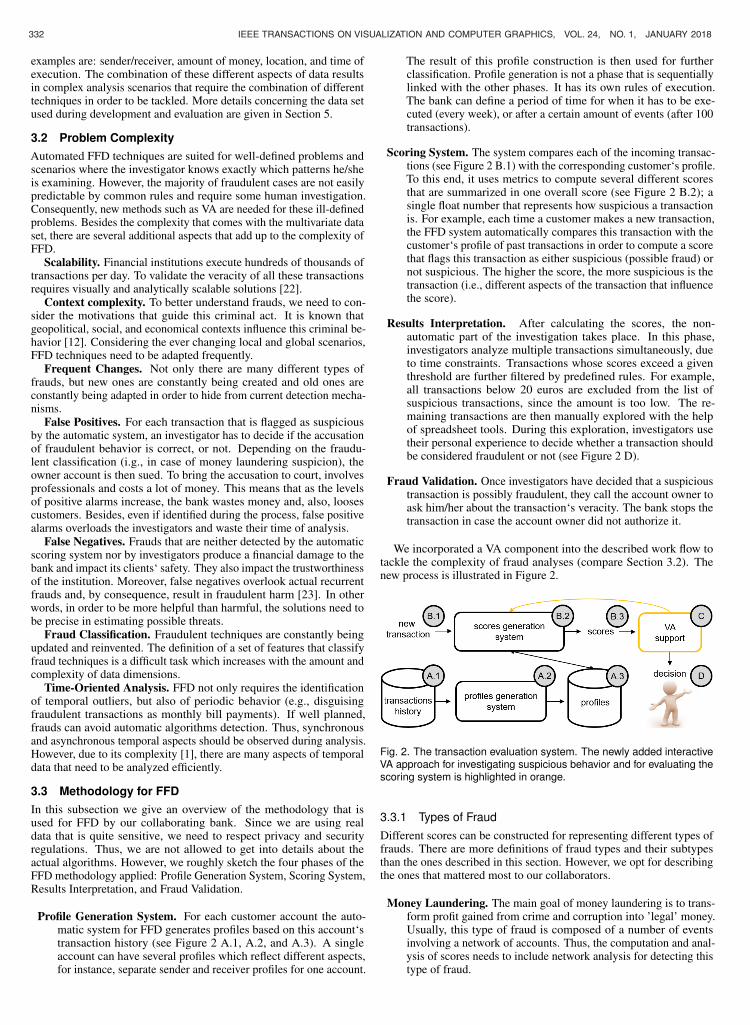
Profile Generation System. For each customer account the auto-matic system for FFD generates profiles based on this account‘stransaction history (see Figure 2 A.1, A.2, and A.3). A singleaccount can have several profiles which reflect different aspects,for instance, separate sender and receiver profiles for one account.
The result of this profile construction is then used for furtherclassification. Profile generation is not a phase that is sequentiallylinked with the other phases. It has its own rules of execution.The bank can define a period of time for when it has to be exe-cuted (every week), or after a certain amount of events (after 100transactions).
Scoring System. The system compares each of the incoming transac-tions (see Figure 2 B.1) with the corresponding customer‘s profile.To this end, it uses metrics to compute several different scoresthat are summarized in one overall score (see Figure 2 B.2); asingle float number that represents how suspicious a transactionis. For example, each time a customer makes a new transaction,the FFD system automatically compares this transaction with thecustomer‘s profile of past transactions in order to compute a scorethat flags this transaction as either suspicious (possible fraud) ornot suspicious. The higher the score, the more suspicious is thetransaction (i.e., different aspects of the transaction that influencethe score).
Results Interpretation. After calculating the scores, the non-automatic part of the investigation takes place. In this phase,investigators analyze multiple transactions simultaneously, dueto time constraints. Transactions whose scores exceed a giventhreshold are further filtered by predefined rules. For example,all transactions below 20 euros are excluded from the list ofsuspicious transactions, since the amount is too low. The re-maining transactions are then manually explored with the helpof spreadsheet tools. During this exploration, investigators usetheir personal experience to decide whether a transaction shouldbe considered fraudulent or not (see Figure 2 D).
Fraud Validation. Once investigators have decided that a suspicioustransaction is possibly fraudulent, they call the account owner toask him/her about the transaction‘s veracity. The bank stops thetransaction in case the account owner did not authorize it.
We incorporated a VA component into the described work flow totackle the complexity of fraud analyses (compare Section 3.2). Thenew process is illustrated in Figure 2.
Fig. 2. The transaction evaluation system. The newly added interactiveVA approach for investigating suspicious behavior and for evaluating thescoring system is highlighted in orange.
3.3.1 Types of FraudDifferent scores can be constructed for representing different types offrauds. There are more definitions of fraud types and their subtypesthan the ones described in this section. However, we opt for describingthe ones that mattered most to our collaborators.
Money Laundering. The main goal of money laundering is to trans-form profit gained from crime and corruption into ’legal’ money.Usually, this type of fraud is composed of a number of eventsinvolving a network of accounts. Thus, the computation and anal-ysis of scores needs to include network analysis for detecting thistype of fraud.
Unauthorized Transaction. This type of fraud involves transactionsfrom the account of a customer of a financial institution madeby a non-authorized user with the aim of financial profit. Thisfraud is usually detected by profile analysis, i.e., comparing thistransactions to other transactions usually done by this customer.Uncommon transactions receive high scores and need to be furtherinvestigated.
Embezzlement. In this type of fraud a criminal person misappropri-ates the money entrusted to him/her. This fraud may happen inthe public or private sector and it is usually considered an internalfraud. To detect this fraudulent behaviour, scores need to considertransaction flows. This is usually done based on records frommanagement software (e.g., log-files).
Straw Person. This type of fraud is sometimes related to moneylaundering. It describes a person A who receives money insteadof person B, because B is not legally allowed to receive thismoney. In order to detect this type of fraud, scores need toconsider customer profiles and detect outliers.
During the design and development of EVA, we focused on detect-ing “unauthorized transactions”. Since EVA uses scores for decisionsupport, an extension of these scores to detect other types of fraudswould be an appropriate way to perform other types of fraud analyses.
3.4 EVA’s Scoring ApproachOur profile-based algorithm is a self-adaptive, histogram-based ap-proach according to the (mandatory) guidelines from the EuropeanBanking Authority (EBA) and monitors the behavior of internet origi-nated payments. The proposed algorithm computes individual customerprofiles, which are created on basis of historical transactions. Theseprofiles are used to score new transactions in real-time. Thus, depend-ing on the relative deviation of the score from the profile’s standardrange, the payment might be classified as suspicious.
Due to privacy and security regulations of our collaboration part-ners of the bank, we are not allowed to describe our profile-basedalgorithm in detail. However, our approach is comparable with Carmi-nati et al. [3], who generate customer profiles in a semi-supervised wayand provide different kinds of statistical analysis. As a result, theirapproach correctly ranks complex transactions as suspicious.
We evaluated EVA’s profile-based algorithm on a representative sam-ple of internet-based transactions consisting of 13 million paymentsranging over a period of 15 months (1.1.2015 - 31.3.2016). To cre-ate the customer profiles the transactions of the first 12 months weretaken (year 2015, 11.9 mill). For scoring - and consequently for eval-uating - the remaining transactions of 2016 (about 1.1 million singletransactions) were used. 24 transactions - out of this 1.1 mill - wereflagged as confirmed frauds. Furthermore, as a reference system, anamount-threshold-based strategy was implemented, thus simulating thedetection rules previously used.
Our profile-based approach documented a good performance andoutperformed the threshold-based previously used strategy by far. Forexample: Taking the current number of confirmed fraudulent transac-tions identified by the threshold-based strategy as the constraint to bemet, our approach found 500% more confirmed fraudulent transactions,and thus, preventing 86% of all potential amount losses. In a statisticalanalysis, applying Receiver Operating Characteristic (ROC) curve andcalculating the Area Under the Curve (AUC) on both approaches, theprofile-based approach produced an AUC of 0.944 while the threshold-based approach demonstrated less efficiency with an AUC of 0.78.
4 EVA’S DESIGN AND IMPLEMENTATION
In the design phase of EVA we collaborated with two domain expertsfrom the bank institution (referred as “collaborators”). Following thedesign triangle [27], to generate interactive VA methods we designedEVA with respect to the data, users, and tasks at hand.
Data. Financial transaction events constitute multivariate and time-oriented data which include details about the transactions such asamount, time, receiver, etc.
Users. Investigators from financial institutions that investigate andvalidate transactions alerts.
Tasks. The overall tasks are fraud detection by means of profileanalysis. This task includes the reduction of false negative and falsepositive alarms, history comparison, as well as the manual investigationof suspicious transactions.
4.1 RequirementsWhen looking at currently used FFD solutions, there are still manyopportunities for improvements. Instead of running queries in spread-sheets and judging alarms by a single overall score value, we proposeEVA to support investigators during their decision-making process.From the study of related work and in collaboration with our projectpartners, we derived the follow requirements:
R1: Visual Support for Scoring System. Considering the constantlychanging fraudulent behaviour, the scoring system and the pro-filing systems should be in constant evaluation. They shouldbe frequently updated in order to stay effective. In the currentsystem, investigators are not able to explore which transactionfeatures and which sub-scores influenced the overall score to whatextent. This information would be beneficial for understandingthe construction of scores and deciding if the algorithm needs tobe adapted. Moreover, investigators should be able to comparesingle transactions and their scores with the client‘s history oftransactions.
R2: Account Comparison. Another important task in order tobetter understand suspicious events is to analyze the relationshipbetween two accounts (i.e., their money exchanging behaviour).However, currently, this task is not supported besides the manualanalysis of the two separate accounts by means of spreadsheets.Our solution needs to support the analysis of money exchangerelationships of different accounts to enable the user to analyzeand detect fraudulent collaborators.
R3: Reasoning About Potential Frauds. During the fraud valida-tion phase (see Section 3.3), the investigator has to decide if atransaction flagged as suspicious is going to be confirmed as beingfraud or not. To aid this task, our system needs to provide visualmeans to support the investigation of the automatically computedresults. The system needs to allow for visually analyzing flaggedtransactions in contrast with non-flagged transactions, and thus,support the identification of false-positively flagged transactions.
R4: Identification of Hidden Frauds. Due to the data complex-ity (see Section 3.2), automatic methods such as the one used inour approach are not fully accurate. This can lead investigatorsto overlook fraudulent transactions that were not detected by theautomatic system. In order to better support this task, our solu-tion needs to make similarities between flagged and non-flaggedtransactions visible during the validation phase (see Section 3.3).Thus, the system needs to facilitate the identification of false-negative frauds.
4.2 Event Detection with Visual Analytics (EVA)Following a user-centric iterative design process [29] we had regularmeetings with our collaborators (about two hours each other monthfor one and a half years). We discussed the data, users, and tasksat hand in order to gain a thorough understanding of the problemand we designed a number of prototypes, ranging from low-fidelitymock-ups to interactive prototypes. Some design ideas we had todiscard while others were iteractively refined and integrated into thefinal prototype. EVA is composed of six views displaying differentaspects of the data (see Figure 1). All views are connected via brushingand linking (i.e., multiple coordinated views). EVA was developed as aweb application by using Angular and D3.js technologies.
After some discussions with our collaborators, we opted for simpleand well-known visualizations they are mostly familiar with, suchas bar charts, line charts, and scatterplots [5, 6]. The goal was to
LEITE ET AL.: EVA: VISUAL ANALYTICS TO IDENTIFY FRAUDULENT EVENTS 333
examples are: sender/receiver, amount of money, location, and time ofexecution. The combination of these different aspects of data resultsin complex analysis scenarios that require the combination of differenttechniques in order to be tackled. More details concerning the data setused during development and evaluation are given in Section 5.
3.2 Problem ComplexityAutomated FFD techniques are suited for well-defined problems andscenarios where the investigator knows exactly which patterns he/sheis examining. However, the majority of fraudulent cases are not easilypredictable by common rules and require some human investigation.Consequently, new methods such as VA are needed for these ill-definedproblems. Besides the complexity that comes with the multivariate dataset, there are several additional aspects that add up to the complexity ofFFD.
Scalability. Financial institutions execute hundreds of thousands oftransactions per day. To validate the veracity of all these transactionsrequires visually and analytically scalable solutions [22].
Context complexity. To better understand frauds, we need to con-sider the motivations that guide this criminal act. It is known thatgeopolitical, social, and economical contexts influence this criminal be-havior [12]. Considering the ever changing local and global scenarios,FFD techniques need to be adapted frequently.
Frequent Changes. Not only there are many different types offrauds, but new ones are constantly being created and old ones areconstantly being adapted in order to hide from current detection mecha-nisms.
False Positives. For each transaction that is flagged as suspiciousby the automatic system, an investigator has to decide if the accusationof fraudulent behavior is correct, or not. Depending on the fraudu-lent classification (i.g., in case of money laundering suspicion), theowner account is then sued. To bring the accusation to court, involvesprofessionals and costs a lot of money. This means that as the levelsof positive alarms increase, the bank wastes money and, also, loosescustomers. Besides, even if identified during the process, false positivealarms overloads the investigators and waste their time of analysis.
False Negatives. Frauds that are neither detected by the automaticscoring system nor by investigators produce a financial damage to thebank and impact its clients‘ safety. They also impact the trustworthinessof the institution. Moreover, false negatives overlook actual recurrentfrauds and, by consequence, result in fraudulent harm [23]. In otherwords, in order to be more helpful than harmful, the solutions need tobe precise in estimating possible threats.
Fraud Classification. Fraudulent techniques are constantly beingupdated and reinvented. The definition of a set of features that classifyfraud techniques is a difficult task which increases with the amount andcomplexity of data dimensions.
Time-Oriented Analysis. FFD not only requires the identificationof temporal outliers, but also of periodic behavior (e.g., disguisingfraudulent transactions as monthly bill payments). If well planned,frauds can avoid automatic algorithms detection. Thus, synchronousand asynchronous temporal aspects should be observed during analysis.However, due to its complexity [1], there are many aspects of temporaldata that need to be analyzed efficiently.
3.3 Methodology for FFDIn this subsection we give an overview of the methodology that isused for FFD by our collaborating bank. Since we are using realdata that is quite sensitive, we need to respect privacy and securityregulations. Thus, we are not allowed to get into details about theactual algorithms. However, we roughly sketch the four phases of theFFD methodology applied: Profile Generation System, Scoring System,Results Interpretation, and Fraud Validation.
Profile Generation System. For each customer account the auto-matic system for FFD generates profiles based on this account‘stransaction history (see Figure 2 A.1, A.2, and A.3). A singleaccount can have several profiles which reflect different aspects,for instance, separate sender and receiver profiles for one account.
The result of this profile construction is then used for furtherclassification. Profile generation is not a phase that is sequentiallylinked with the other phases. It has its own rules of execution.The bank can define a period of time for when it has to be exe-cuted (every week), or after a certain amount of events (after 100transactions).
Scoring System. The system compares each of the incoming transac-tions (see Figure 2 B.1) with the corresponding customer‘s profile.To this end, it uses metrics to compute several different scoresthat are summarized in one overall score (see Figure 2 B.2); asingle float number that represents how suspicious a transactionis. For example, each time a customer makes a new transaction,the FFD system automatically compares this transaction with thecustomer‘s profile of past transactions in order to compute a scorethat flags this transaction as either suspicious (possible fraud) ornot suspicious. The higher the score, the more suspicious is thetransaction (i.e., different aspects of the transaction that influencethe score).
Results Interpretation. After calculating the scores, the non-automatic part of the investigation takes place. In this phase,investigators analyze multiple transactions simultaneously, dueto time constraints. Transactions whose scores exceed a giventhreshold are further filtered by predefined rules. For example,all transactions below 20 euros are excluded from the list ofsuspicious transactions, since the amount is too low. The re-maining transactions are then manually explored with the helpof spreadsheet tools. During this exploration, investigators usetheir personal experience to decide whether a transaction shouldbe considered fraudulent or not (see Figure 2 D).
Fraud Validation. Once investigators have decided that a suspicioustransaction is possibly fraudulent, they call the account owner toask him/her about the transaction‘s veracity. The bank stops thetransaction in case the account owner did not authorize it.
We incorporated a VA component into the described work flow totackle the complexity of fraud analyses (compare Section 3.2). Thenew process is illustrated in Figure 2.
Fig. 2. The transaction evaluation system. The newly added interactiveVA approach for investigating suspicious behavior and for evaluating thescoring system is highlighted in orange.
3.3.1 Types of FraudDifferent scores can be constructed for representing different types offrauds. There are more definitions of fraud types and their subtypesthan the ones described in this section. However, we opt for describingthe ones that mattered most to our collaborators.
Money Laundering. The main goal of money laundering is to trans-form profit gained from crime and corruption into ’legal’ money.Usually, this type of fraud is composed of a number of eventsinvolving a network of accounts. Thus, the computation and anal-ysis of scores needs to include network analysis for detecting thistype of fraud.
Unauthorized Transaction. This type of fraud involves transactionsfrom the account of a customer of a financial institution madeby a non-authorized user with the aim of financial profit. Thisfraud is usually detected by profile analysis, i.e., comparing thistransactions to other transactions usually done by this customer.Uncommon transactions receive high scores and need to be furtherinvestigated.
Embezzlement. In this type of fraud a criminal person misappropri-ates the money entrusted to him/her. This fraud may happen inthe public or private sector and it is usually considered an internalfraud. To detect this fraudulent behaviour, scores need to considertransaction flows. This is usually done based on records frommanagement software (e.g., log-files).
Straw Person. This type of fraud is sometimes related to moneylaundering. It describes a person A who receives money insteadof person B, because B is not legally allowed to receive thismoney. In order to detect this type of fraud, scores need toconsider customer profiles and detect outliers.
During the design and development of EVA, we focused on detect-ing “unauthorized transactions”. Since EVA uses scores for decisionsupport, an extension of these scores to detect other types of fraudswould be an appropriate way to perform other types of fraud analyses.
3.4 EVA’s Scoring ApproachOur profile-based algorithm is a self-adaptive, histogram-based ap-proach according to the (mandatory) guidelines from the EuropeanBanking Authority (EBA) and monitors the behavior of internet origi-nated payments. The proposed algorithm computes individual customerprofiles, which are created on basis of historical transactions. Theseprofiles are used to score new transactions in real-time. Thus, depend-ing on the relative deviation of the score from the profile’s standardrange, the payment might be classified as suspicious.
Due to privacy and security regulations of our collaboration part-ners of the bank, we are not allowed to describe our profile-basedalgorithm in detail. However, our approach is comparable with Carmi-nati et al. [3], who generate customer profiles in a semi-supervised wayand provide different kinds of statistical analysis. As a result, theirapproach correctly ranks complex transactions as suspicious.
We evaluated EVA’s profile-based algorithm on a representative sam-ple of internet-based transactions consisting of 13 million paymentsranging over a period of 15 months (1.1.2015 - 31.3.2016). To cre-ate the customer profiles the transactions of the first 12 months weretaken (year 2015, 11.9 mill). For scoring - and consequently for eval-uating - the remaining transactions of 2016 (about 1.1 million singletransactions) were used. 24 transactions - out of this 1.1 mill - wereflagged as confirmed frauds. Furthermore, as a reference system, anamount-threshold-based strategy was implemented, thus simulating thedetection rules previously used.
Our profile-based approach documented a good performance andoutperformed the threshold-based previously used strategy by far. Forexample: Taking the current number of confirmed fraudulent transac-tions identified by the threshold-based strategy as the constraint to bemet, our approach found 500% more confirmed fraudulent transactions,and thus, preventing 86% of all potential amount losses. In a statisticalanalysis, applying Receiver Operating Characteristic (ROC) curve andcalculating the Area Under the Curve (AUC) on both approaches, theprofile-based approach produced an AUC of 0.944 while the threshold-based approach demonstrated less efficiency with an AUC of 0.78.
4 EVA’S DESIGN AND IMPLEMENTATION
In the design phase of EVA we collaborated with two domain expertsfrom the bank institution (referred as “collaborators”). Following thedesign triangle [27], to generate interactive VA methods we designedEVA with respect to the data, users, and tasks at hand.
Data. Financial transaction events constitute multivariate and time-oriented data which include details about the transactions such asamount, time, receiver, etc.
Users. Investigators from financial institutions that investigate andvalidate transactions alerts.
Tasks. The overall tasks are fraud detection by means of profileanalysis. This task includes the reduction of false negative and falsepositive alarms, history comparison, as well as the manual investigationof suspicious transactions.
4.1 RequirementsWhen looking at currently used FFD solutions, there are still manyopportunities for improvements. Instead of running queries in spread-sheets and judging alarms by a single overall score value, we proposeEVA to support investigators during their decision-making process.From the study of related work and in collaboration with our projectpartners, we derived the follow requirements:
R1: Visual Support for Scoring System. Considering the constantlychanging fraudulent behaviour, the scoring system and the pro-filing systems should be in constant evaluation. They shouldbe frequently updated in order to stay effective. In the currentsystem, investigators are not able to explore which transactionfeatures and which sub-scores influenced the overall score to whatextent. This information would be beneficial for understandingthe construction of scores and deciding if the algorithm needs tobe adapted. Moreover, investigators should be able to comparesingle transactions and their scores with the client‘s history oftransactions.
R2: Account Comparison. Another important task in order tobetter understand suspicious events is to analyze the relationshipbetween two accounts (i.e., their money exchanging behaviour).However, currently, this task is not supported besides the manualanalysis of the two separate accounts by means of spreadsheets.Our solution needs to support the analysis of money exchangerelationships of different accounts to enable the user to analyzeand detect fraudulent collaborators.
R3: Reasoning About Potential Frauds. During the fraud valida-tion phase (see Section 3.3), the investigator has to decide if atransaction flagged as suspicious is going to be confirmed as beingfraud or not. To aid this task, our system needs to provide visualmeans to support the investigation of the automatically computedresults. The system needs to allow for visually analyzing flaggedtransactions in contrast with non-flagged transactions, and thus,support the identification of false-positively flagged transactions.
R4: Identification of Hidden Frauds. Due to the data complex-ity (see Section 3.2), automatic methods such as the one used inour approach are not fully accurate. This can lead investigatorsto overlook fraudulent transactions that were not detected by theautomatic system. In order to better support this task, our solu-tion needs to make similarities between flagged and non-flaggedtransactions visible during the validation phase (see Section 3.3).Thus, the system needs to facilitate the identification of false-negative frauds.
4.2 Event Detection with Visual Analytics (EVA)Following a user-centric iterative design process [29] we had regularmeetings with our collaborators (about two hours each other monthfor one and a half years). We discussed the data, users, and tasksat hand in order to gain a thorough understanding of the problemand we designed a number of prototypes, ranging from low-fidelitymock-ups to interactive prototypes. Some design ideas we had todiscard while others were iteractively refined and integrated into thefinal prototype. EVA is composed of six views displaying differentaspects of the data (see Figure 1). All views are connected via brushingand linking (i.e., multiple coordinated views). EVA was developed as aweb application by using Angular and D3.js technologies.
After some discussions with our collaborators, we opted for simpleand well-known visualizations they are mostly familiar with, suchas bar charts, line charts, and scatterplots [5, 6]. The goal was to
334 IEEE TRANSACTIONS ON VISUALIZATION AND COMPUTER GRAPHICS, VOL. 24, NO. 1, JANUARY 2018
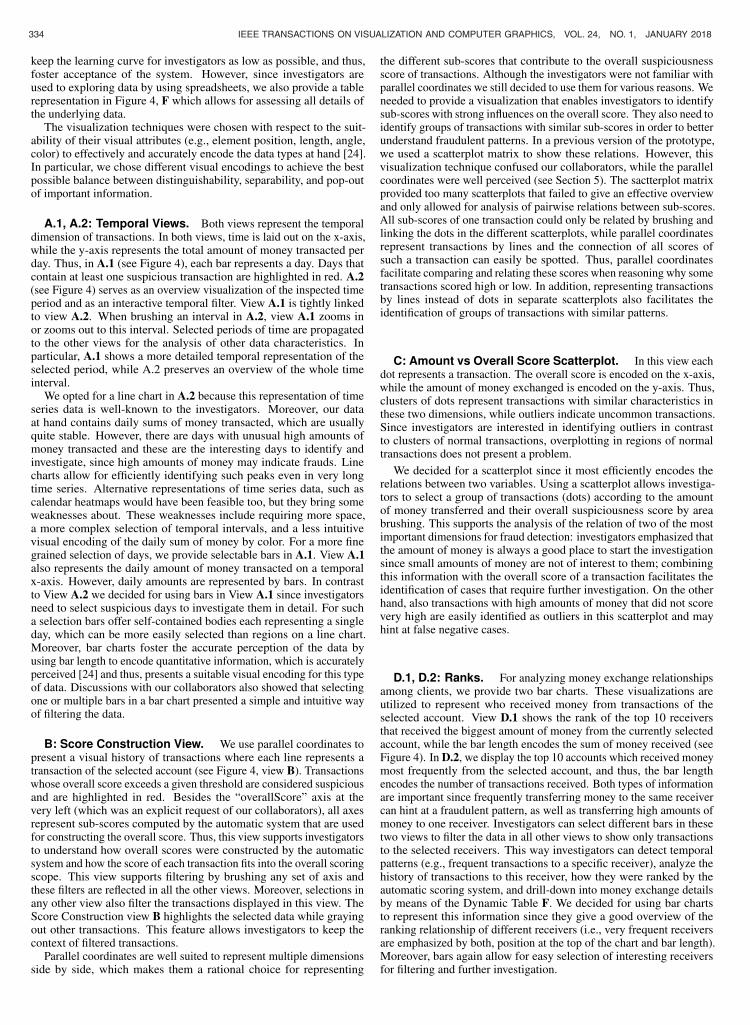
keep the learning curve for investigators as low as possible, and thus,foster acceptance of the system. However, since investigators areused to exploring data by using spreadsheets, we also provide a tablerepresentation in Figure 4, F which allows for assessing all details ofthe underlying data.
The visualization techniques were chosen with respect to the suit-ability of their visual attributes (e.g., element position, length, angle,color) to effectively and accurately encode the data types at hand [24].In particular, we chose different visual encodings to achieve the bestpossible balance between distinguishability, separability, and pop-outof important information.
A.1, A.2: Temporal Views. Both views represent the temporaldimension of transactions. In both views, time is laid out on the x-axis,while the y-axis represents the total amount of money transacted perday. Thus, in A.1 (see Figure 4), each bar represents a day. Days thatcontain at least one suspicious transaction are highlighted in red. A.2(see Figure 4) serves as an overview visualization of the inspected timeperiod and as an interactive temporal filter. View A.1 is tightly linkedto view A.2. When brushing an interval in A.2, view A.1 zooms inor zooms out to this interval. Selected periods of time are propagatedto the other views for the analysis of other data characteristics. Inparticular, A.1 shows a more detailed temporal representation of theselected period, while A.2 preserves an overview of the whole timeinterval.
We opted for a line chart in A.2 because this representation of timeseries data is well-known to the investigators. Moreover, our dataat hand contains daily sums of money transacted, which are usuallyquite stable. However, there are days with unusual high amounts ofmoney transacted and these are the interesting days to identify andinvestigate, since high amounts of money may indicate frauds. Linecharts allow for efficiently identifying such peaks even in very longtime series. Alternative representations of time series data, such ascalendar heatmaps would have been feasible too, but they bring someweaknesses about. These weaknesses include requiring more space,a more complex selection of temporal intervals, and a less intuitivevisual encoding of the daily sum of money by color. For a more finegrained selection of days, we provide selectable bars in A.1. View A.1also represents the daily amount of money transacted on a temporalx-axis. However, daily amounts are represented by bars. In contrastto View A.2 we decided for using bars in View A.1 since investigatorsneed to select suspicious days to investigate them in detail. For sucha selection bars offer self-contained bodies each representing a singleday, which can be more easily selected than regions on a line chart.Moreover, bar charts foster the accurate perception of the data byusing bar length to encode quantitative information, which is accuratelyperceived [24] and thus, presents a suitable visual encoding for this typeof data. Discussions with our collaborators also showed that selectingone or multiple bars in a bar chart presented a simple and intuitive wayof filtering the data.
B: Score Construction View. We use parallel coordinates topresent a visual history of transactions where each line represents atransaction of the selected account (see Figure 4, view B). Transactionswhose overall score exceeds a given threshold are considered suspiciousand are highlighted in red. Besides the “overallScore” axis at thevery left (which was an explicit request of our collaborators), all axesrepresent sub-scores computed by the automatic system that are usedfor constructing the overall score. Thus, this view supports investigatorsto understand how overall scores were constructed by the automaticsystem and how the score of each transaction fits into the overall scoringscope. This view supports filtering by brushing any set of axis andthese filters are reflected in all the other views. Moreover, selections inany other view also filter the transactions displayed in this view. TheScore Construction view B highlights the selected data while grayingout other transactions. This feature allows investigators to keep thecontext of filtered transactions.
Parallel coordinates are well suited to represent multiple dimensionsside by side, which makes them a rational choice for representing
the different sub-scores that contribute to the overall suspiciousnessscore of transactions. Although the investigators were not familiar withparallel coordinates we still decided to use them for various reasons. Weneeded to provide a visualization that enables investigators to identifysub-scores with strong influences on the overall score. They also need toidentify groups of transactions with similar sub-scores in order to betterunderstand fraudulent patterns. In a previous version of the prototype,we used a scatterplot matrix to show these relations. However, thisvisualization technique confused our collaborators, while the parallelcoordinates were well perceived (see Section 5). The sactterplot matrixprovided too many scatterplots that failed to give an effective overviewand only allowed for analysis of pairwise relations between sub-scores.All sub-scores of one transaction could only be related by brushing andlinking the dots in the different scatterplots, while parallel coordinatesrepresent transactions by lines and the connection of all scores ofsuch a transaction can easily be spotted. Thus, parallel coordinatesfacilitate comparing and relating these scores when reasoning why sometransactions scored high or low. In addition, representing transactionsby lines instead of dots in separate scatterplots also facilitates theidentification of groups of transactions with similar patterns.
C: Amount vs Overall Score Scatterplot. In this view eachdot represents a transaction. The overall score is encoded on the x-axis,while the amount of money exchanged is encoded on the y-axis. Thus,clusters of dots represent transactions with similar characteristics inthese two dimensions, while outliers indicate uncommon transactions.Since investigators are interested in identifying outliers in contrastto clusters of normal transactions, overplotting in regions of normaltransactions does not present a problem.
We decided for a scatterplot since it most efficiently encodes therelations between two variables. Using a scatterplot allows investiga-tors to select a group of transactions (dots) according to the amountof money transferred and their overall suspiciousness score by areabrushing. This supports the analysis of the relation of two of the mostimportant dimensions for fraud detection: investigators emphasized thatthe amount of money is always a good place to start the investigationsince small amounts of money are not of interest to them; combiningthis information with the overall score of a transaction facilitates theidentification of cases that require further investigation. On the otherhand, also transactions with high amounts of money that did not scorevery high are easily identified as outliers in this scatterplot and mayhint at false negative cases.
D.1, D.2: Ranks. For analyzing money exchange relationshipsamong clients, we provide two bar charts. These visualizations areutilized to represent who received money from transactions of theselected account. View D.1 shows the rank of the top 10 receiversthat received the biggest amount of money from the currently selectedaccount, while the bar length encodes the sum of money received (seeFigure 4). In D.2, we display the top 10 accounts which received moneymost frequently from the selected account, and thus, the bar lengthencodes the number of transactions received. Both types of informationare important since frequently transferring money to the same receivercan hint at a fraudulent pattern, as well as transferring high amounts ofmoney to one receiver. Investigators can select different bars in thesetwo views to filter the data in all other views to show only transactionsto the selected receivers. This way investigators can detect temporalpatterns (e.g., frequent transactions to a specific receiver), analyze thehistory of transactions to this receiver, how they were ranked by theautomatic scoring system, and drill-down into money exchange detailsby means of the Dynamic Table F. We decided for using bar chartsto represent this information since they give a good overview of theranking relationship of different receivers (i.e., very frequent receiversare emphasized by both, position at the top of the chart and bar length).Moreover, bars again allow for easy selection of interesting receiversfor filtering and further investigation.
E: Accounts Selector. When investigating more than one ac-count, this view facilitates comparison and switching between accounts.The bar length represents the amount of transactions that each accountexecuted, which already facilitates the selection of accounts of interest.By selecting a bar, investigators filter the other views to show only dataof the selected account. This functionality can be used for comparing asmall group of accounts in more detail.
F: Dynamic Table. Currently, investigators are used to applyqueries within spreadsheets in order to find insights. Besides providinga good amount of details, tables hinder pattern recognition and scalebadly. However, tables are known and appreciated by investigatorsand thus, we provide an interactive table view in addition to the otherviews. Each row represents one transaction and each column one ofits dimensions. Filters and selections in other views are automaticallyreflected by the table view and the other way around. Moreover, it ispossible to sort rows by column values and to execute manual searchqueries.
Multiple Connected Data Perspectives. Since transactionlogs are composed of multiple heterogeneous dimensions that need to beanalyzed in relation to each other, EVA provides multiple perspectiveson the data in multiple connected views. This set of views presentsa variety of abstraction levels of the same subset of the data. In allviews that represent transactions, we chose a colorblind-safe colorencoding [9] to indicate transactions flagged as suspicious. Using thecolor red makes these suspicious transactions stand out immediately.
5 EVALUATION
To assess the usefulness of EVA, we conducted a qualitative evaluationwhich aimed to address the following research questions (RQ):
RQ1: Comparison. What are the advantages and disadvantages ofEVA compared to the tools which users usually use?
RQ2: Insights. What kind of insights can be generated with EVA?
RQ3: Improvements. Do users miss any features or have sugges-tions for improvement?
We decided for a qualitative study because it allowed us to get users’feedback and to understand insights they gained while using EVA.
Sample. We recruited three target users of EVA, i.e. FFD investiga-tors, from our collaborating bank, who were not involved in the designprocess and have never seen our prototype before. Although the numberof participants was low, qualitative evaluation studies are still useful tounderstand if the approach is useful for domain experts and if it fits theirworkflow [11, 21]. All three male participants had basic knowledgeof working with visualizations. They usually use visualizations forpresentation purposes to show the key message and the structure of thedata. However, one participant also noted that he uses visualizationsfor exploration tasks (e.g., to analyze algorithms via heatmaps). Forfraud detection tasks, they primarily use rule-based management sys-tems which provide mainly spreadsheet representations including theautomatic generated scores for each transaction.
Dataset and Tasks. We used an anonymized real world datasetfrom our collaborators covering an interval from January 2013 to April2015. The dataset consists of 413 different accounts with a total of1,128,147 transactions of different types (e.g., netbanking transactions).These tasks are structured according to the analytical task taxonomyby Andrienko and Andrienko [2], distinguishing elementary and syn-optic tasks. In order to evaluate our solutions with respect to ourrequirements, we have defined a list of typical tasks together with twocollaborating domain experts. Each task was designed with a specificfocus on one or more requirements (see Figure 3). Requirements suchas interactivity (R2), data conservancy (R3), and visual scalability (R5)were considered in all tasks.
Task 1: Explore the top three frequent receivers from the accountacc10407 during the period of January 2014 to April 2014.
Task 2: Explore the transactions of account acc10421 and find thereason about the scoring of all transactions that happened onday(s) where fraud(s) were detected.
Task 3: Analyze two fraudulent accounts (acc10407 and acc10421)with respect to their similarities and differences in their fraudu-lent behavior.
Fig. 3. This table shows the relation between tasks and requirements inour evaluation.
Procedure. The study took place in a quiet meeting room at thebank‘s head office. In addition to the respective participant, one testmoderator, one observer for taking notes, and one developer as contactperson for technical questions were present in the room. Furthermore,audio recording and screen capturing software was used. The testsession began with a short introduction of the goal and the schedule ofthe study. Next, EVA was presented and participants had the possibilityto ask questions to clarify any issues. We then conducted a semi-structured interview with the participants in order to learn about theirexperience regarding visualizations and which tools they usually use tosolve their fraud detection tasks. After the interview, the participantswere asked to interact with EVA in order to fulfill the three tasksoutlined above. While the participants interacted with the prototype,they were encouraged to think aloud. After they finished the tasks,again a semi-structured interview was conducted. They were askedabout their impressions of EVA, if they missed anything in particular,to compare the prototype with the tools they would typically use forfraud detection, and if there were any further tasks which they wouldlike to solve with this kind of VA tool.
Data Analysis. The collected qualitative data (observation and inter-view notes as well as the audio and video recordings) were analyzedin order to find out what works well, what needs further improvement,and what are possible missing features (cf. research questions RQ1 andRQ3). However, we were also interested in which kinds of insights theygained with EVA while they solved the tasks (cf. RQ2). EVA supportsprocesses of exploration and sensemaking. There are two well-knownapproaches explaining sensemaking with visualization - the model byPirolli and Card [30] and Klein‘s sensemaking model (see also [17,18]).The model by Pirolli and Card has been criticized because it appliesonly to a very narrow range of activities of intelligence analysis [31],while Klein‘s model is much broader. Therefore, Klein‘s categorieswere chosen for this analysis. Thus, we adapted the five categoriesfrom Klein [16] for gaining insights:
Connection. These insights result from a connection between twoor more events which provides new information. For example, twovisualizations present the same data set from different viewpoints. Thecombination of these visualizations allows the viewer to get additionaldetail information about the data.
Coincidence. Coincidence insights result from events which seemrelated but do not have an obvious connection. In contrast to theconnection insights a coincidence insight results from repetition andnot from detail information. For example, if data points have the samevalue in the visualization then this can be a result from a specific event.
Curiosity. These insights differ in one way from the coincidenceinsights: it results from a single event. For example, a data point with aspecific value in a visualization arouses the interest of the viewer.
Contradiction. Such insights often occur if there is discrepancybetween events which causes doubts. For example, a data point in thevisualization has an unrealistic value.
Creative Desperation. These insights result from events which tendto be a dead-end and require finding new ways. For example, if it is not

LEITE ET AL.: EVA: VISUAL ANALYTICS TO IDENTIFY FRAUDULENT EVENTS 335
keep the learning curve for investigators as low as possible, and thus,foster acceptance of the system. However, since investigators areused to exploring data by using spreadsheets, we also provide a tablerepresentation in Figure 4, F which allows for assessing all details ofthe underlying data.
The visualization techniques were chosen with respect to the suit-ability of their visual attributes (e.g., element position, length, angle,color) to effectively and accurately encode the data types at hand [24].In particular, we chose different visual encodings to achieve the bestpossible balance between distinguishability, separability, and pop-outof important information.
A.1, A.2: Temporal Views. Both views represent the temporaldimension of transactions. In both views, time is laid out on the x-axis,while the y-axis represents the total amount of money transacted perday. Thus, in A.1 (see Figure 4), each bar represents a day. Days thatcontain at least one suspicious transaction are highlighted in red. A.2(see Figure 4) serves as an overview visualization of the inspected timeperiod and as an interactive temporal filter. View A.1 is tightly linkedto view A.2. When brushing an interval in A.2, view A.1 zooms inor zooms out to this interval. Selected periods of time are propagatedto the other views for the analysis of other data characteristics. Inparticular, A.1 shows a more detailed temporal representation of theselected period, while A.2 preserves an overview of the whole timeinterval.
We opted for a line chart in A.2 because this representation of timeseries data is well-known to the investigators. Moreover, our dataat hand contains daily sums of money transacted, which are usuallyquite stable. However, there are days with unusual high amounts ofmoney transacted and these are the interesting days to identify andinvestigate, since high amounts of money may indicate frauds. Linecharts allow for efficiently identifying such peaks even in very longtime series. Alternative representations of time series data, such ascalendar heatmaps would have been feasible too, but they bring someweaknesses about. These weaknesses include requiring more space,a more complex selection of temporal intervals, and a less intuitivevisual encoding of the daily sum of money by color. For a more finegrained selection of days, we provide selectable bars in A.1. View A.1also represents the daily amount of money transacted on a temporalx-axis. However, daily amounts are represented by bars. In contrastto View A.2 we decided for using bars in View A.1 since investigatorsneed to select suspicious days to investigate them in detail. For sucha selection bars offer self-contained bodies each representing a singleday, which can be more easily selected than regions on a line chart.Moreover, bar charts foster the accurate perception of the data byusing bar length to encode quantitative information, which is accuratelyperceived [24] and thus, presents a suitable visual encoding for this typeof data. Discussions with our collaborators also showed that selectingone or multiple bars in a bar chart presented a simple and intuitive wayof filtering the data.
B: Score Construction View. We use parallel coordinates topresent a visual history of transactions where each line represents atransaction of the selected account (see Figure 4, view B). Transactionswhose overall score exceeds a given threshold are considered suspiciousand are highlighted in red. Besides the “overallScore” axis at thevery left (which was an explicit request of our collaborators), all axesrepresent sub-scores computed by the automatic system that are usedfor constructing the overall score. Thus, this view supports investigatorsto understand how overall scores were constructed by the automaticsystem and how the score of each transaction fits into the overall scoringscope. This view supports filtering by brushing any set of axis andthese filters are reflected in all the other views. Moreover, selections inany other view also filter the transactions displayed in this view. TheScore Construction view B highlights the selected data while grayingout other transactions. This feature allows investigators to keep thecontext of filtered transactions.
Parallel coordinates are well suited to represent multiple dimensionsside by side, which makes them a rational choice for representing
the different sub-scores that contribute to the overall suspiciousnessscore of transactions. Although the investigators were not familiar withparallel coordinates we still decided to use them for various reasons. Weneeded to provide a visualization that enables investigators to identifysub-scores with strong influences on the overall score. They also need toidentify groups of transactions with similar sub-scores in order to betterunderstand fraudulent patterns. In a previous version of the prototype,we used a scatterplot matrix to show these relations. However, thisvisualization technique confused our collaborators, while the parallelcoordinates were well perceived (see Section 5). The sactterplot matrixprovided too many scatterplots that failed to give an effective overviewand only allowed for analysis of pairwise relations between sub-scores.All sub-scores of one transaction could only be related by brushing andlinking the dots in the different scatterplots, while parallel coordinatesrepresent transactions by lines and the connection of all scores ofsuch a transaction can easily be spotted. Thus, parallel coordinatesfacilitate comparing and relating these scores when reasoning why sometransactions scored high or low. In addition, representing transactionsby lines instead of dots in separate scatterplots also facilitates theidentification of groups of transactions with similar patterns.
C: Amount vs Overall Score Scatterplot. In this view eachdot represents a transaction. The overall score is encoded on the x-axis,while the amount of money exchanged is encoded on the y-axis. Thus,clusters of dots represent transactions with similar characteristics inthese two dimensions, while outliers indicate uncommon transactions.Since investigators are interested in identifying outliers in contrastto clusters of normal transactions, overplotting in regions of normaltransactions does not present a problem.
We decided for a scatterplot since it most efficiently encodes therelations between two variables. Using a scatterplot allows investiga-tors to select a group of transactions (dots) according to the amountof money transferred and their overall suspiciousness score by areabrushing. This supports the analysis of the relation of two of the mostimportant dimensions for fraud detection: investigators emphasized thatthe amount of money is always a good place to start the investigationsince small amounts of money are not of interest to them; combiningthis information with the overall score of a transaction facilitates theidentification of cases that require further investigation. On the otherhand, also transactions with high amounts of money that did not scorevery high are easily identified as outliers in this scatterplot and mayhint at false negative cases.
D.1, D.2: Ranks. For analyzing money exchange relationshipsamong clients, we provide two bar charts. These visualizations areutilized to represent who received money from transactions of theselected account. View D.1 shows the rank of the top 10 receiversthat received the biggest amount of money from the currently selectedaccount, while the bar length encodes the sum of money received (seeFigure 4). In D.2, we display the top 10 accounts which received moneymost frequently from the selected account, and thus, the bar lengthencodes the number of transactions received. Both types of informationare important since frequently transferring money to the same receivercan hint at a fraudulent pattern, as well as transferring high amounts ofmoney to one receiver. Investigators can select different bars in thesetwo views to filter the data in all other views to show only transactionsto the selected receivers. This way investigators can detect temporalpatterns (e.g., frequent transactions to a specific receiver), analyze thehistory of transactions to this receiver, how they were ranked by theautomatic scoring system, and drill-down into money exchange detailsby means of the Dynamic Table F. We decided for using bar chartsto represent this information since they give a good overview of theranking relationship of different receivers (i.e., very frequent receiversare emphasized by both, position at the top of the chart and bar length).Moreover, bars again allow for easy selection of interesting receiversfor filtering and further investigation.
E: Accounts Selector. When investigating more than one ac-count, this view facilitates comparison and switching between accounts.The bar length represents the amount of transactions that each accountexecuted, which already facilitates the selection of accounts of interest.By selecting a bar, investigators filter the other views to show only dataof the selected account. This functionality can be used for comparing asmall group of accounts in more detail.
F: Dynamic Table. Currently, investigators are used to applyqueries within spreadsheets in order to find insights. Besides providinga good amount of details, tables hinder pattern recognition and scalebadly. However, tables are known and appreciated by investigatorsand thus, we provide an interactive table view in addition to the otherviews. Each row represents one transaction and each column one ofits dimensions. Filters and selections in other views are automaticallyreflected by the table view and the other way around. Moreover, it ispossible to sort rows by column values and to execute manual searchqueries.
Multiple Connected Data Perspectives. Since transactionlogs are composed of multiple heterogeneous dimensions that need to beanalyzed in relation to each other, EVA provides multiple perspectiveson the data in multiple connected views. This set of views presentsa variety of abstraction levels of the same subset of the data. In allviews that represent transactions, we chose a colorblind-safe colorencoding [9] to indicate transactions flagged as suspicious. Using thecolor red makes these suspicious transactions stand out immediately.
5 EVALUATION
To assess the usefulness of EVA, we conducted a qualitative evaluationwhich aimed to address the following research questions (RQ):
RQ1: Comparison. What are the advantages and disadvantages ofEVA compared to the tools which users usually use?
RQ2: Insights. What kind of insights can be generated with EVA?
RQ3: Improvements. Do users miss any features or have sugges-tions for improvement?
We decided for a qualitative study because it allowed us to get users’feedback and to understand insights they gained while using EVA.
Sample. We recruited three target users of EVA, i.e. FFD investiga-tors, from our collaborating bank, who were not involved in the designprocess and have never seen our prototype before. Although the numberof participants was low, qualitative evaluation studies are still useful tounderstand if the approach is useful for domain experts and if it fits theirworkflow [11, 21]. All three male participants had basic knowledgeof working with visualizations. They usually use visualizations forpresentation purposes to show the key message and the structure of thedata. However, one participant also noted that he uses visualizationsfor exploration tasks (e.g., to analyze algorithms via heatmaps). Forfraud detection tasks, they primarily use rule-based management sys-tems which provide mainly spreadsheet representations including theautomatic generated scores for each transaction.
Dataset and Tasks. We used an anonymized real world datasetfrom our collaborators covering an interval from January 2013 to April2015. The dataset consists of 413 different accounts with a total of1,128,147 transactions of different types (e.g., netbanking transactions).These tasks are structured according to the analytical task taxonomyby Andrienko and Andrienko [2], distinguishing elementary and syn-optic tasks. In order to evaluate our solutions with respect to ourrequirements, we have defined a list of typical tasks together with twocollaborating domain experts. Each task was designed with a specificfocus on one or more requirements (see Figure 3). Requirements suchas interactivity (R2), data conservancy (R3), and visual scalability (R5)were considered in all tasks.
Task 1: Explore the top three frequent receivers from the accountacc10407 during the period of January 2014 to April 2014.
Task 2: Explore the transactions of account acc10421 and find thereason about the scoring of all transactions that happened onday(s) where fraud(s) were detected.
Task 3: Analyze two fraudulent accounts (acc10407 and acc10421)with respect to their similarities and differences in their fraudu-lent behavior.
Fig. 3. This table shows the relation between tasks and requirements inour evaluation.
Procedure. The study took place in a quiet meeting room at thebank‘s head office. In addition to the respective participant, one testmoderator, one observer for taking notes, and one developer as contactperson for technical questions were present in the room. Furthermore,audio recording and screen capturing software was used. The testsession began with a short introduction of the goal and the schedule ofthe study. Next, EVA was presented and participants had the possibilityto ask questions to clarify any issues. We then conducted a semi-structured interview with the participants in order to learn about theirexperience regarding visualizations and which tools they usually use tosolve their fraud detection tasks. After the interview, the participantswere asked to interact with EVA in order to fulfill the three tasksoutlined above. While the participants interacted with the prototype,they were encouraged to think aloud. After they finished the tasks,again a semi-structured interview was conducted. They were askedabout their impressions of EVA, if they missed anything in particular,to compare the prototype with the tools they would typically use forfraud detection, and if there were any further tasks which they wouldlike to solve with this kind of VA tool.
Data Analysis. The collected qualitative data (observation and inter-view notes as well as the audio and video recordings) were analyzedin order to find out what works well, what needs further improvement,and what are possible missing features (cf. research questions RQ1 andRQ3). However, we were also interested in which kinds of insights theygained with EVA while they solved the tasks (cf. RQ2). EVA supportsprocesses of exploration and sensemaking. There are two well-knownapproaches explaining sensemaking with visualization - the model byPirolli and Card [30] and Klein‘s sensemaking model (see also [17,18]).The model by Pirolli and Card has been criticized because it appliesonly to a very narrow range of activities of intelligence analysis [31],while Klein‘s model is much broader. Therefore, Klein‘s categorieswere chosen for this analysis. Thus, we adapted the five categoriesfrom Klein [16] for gaining insights:
Connection. These insights result from a connection between twoor more events which provides new information. For example, twovisualizations present the same data set from different viewpoints. Thecombination of these visualizations allows the viewer to get additionaldetail information about the data.
Coincidence. Coincidence insights result from events which seemrelated but do not have an obvious connection. In contrast to theconnection insights a coincidence insight results from repetition andnot from detail information. For example, if data points have the samevalue in the visualization then this can be a result from a specific event.
Curiosity. These insights differ in one way from the coincidenceinsights: it results from a single event. For example, a data point with aspecific value in a visualization arouses the interest of the viewer.
Contradiction. Such insights often occur if there is discrepancybetween events which causes doubts. For example, a data point in thevisualization has an unrealistic value.
Creative Desperation. These insights result from events which tendto be a dead-end and require finding new ways. For example, if it is not
336 IEEE TRANSACTIONS ON VISUALIZATION AND COMPUTER GRAPHICS, VOL. 24, NO. 1, JANUARY 2018
possible to get relevant information with a specific type of visualizationthen another visualization type might be helpful.
Based on these categories, the observation notes as well as audioand video recordings were coded and categorized.
5.1 ResultsAll participants solved all tasks. The average duration needed for thetasks was about 18 minutes. The interview sessions (before and after theparticipants solved the tasks) took about 40 minutes in total. Next, wewill present and discuss the results according to our research questions.
5.1.1 RQ1: ComparisonThe investigators stated that they typically use visualizations for presen-tation tasks which they typically generate with Microsoft Office tools(e.g., Excel and PowerPoint) [25, 26]. Therefore, they argued that it isdifficult to compare EVA with these tools. The challenge in using thesetools is to find the interesting hot spots. All three investigators agreedthat a powerful visual tool for exploration tasks would be helpful forbrowsing the data, and for gaining insights which they were not evenlooking for, or for giving them hints to look at specific parts in thedata set more closely. They highlighted that EVA was very intuitive(e.g., color-coding), easy to use, more dynamic than the tools whichthey usually use and that it provides a good overview and quick accessto detail information. For example, one expert mentioned: “I likedit because it is very interactive and you can browse the data, evenif you don’t know what you are looking for, and find new insights”.Furthermore, the usage of EVA led to a positive attitude towards usingVA approaches in the future. For example, one expert noted: “Here wecould see what is possible [...] So we can rethink what we can offer tothe bank.”.
Since, the investigators did not know any visual approaches to sup-port FFD, they could not compare EVA to actual VA approaches. How-ever, if we compare EVA, for instance, to WireVis [4], a state of theart VA approach focusing on FFD, EVA takes more aspects into ac-count in order to identify fraudulent behaviour. While WireVis is usedto analyze keywords used in transaction descriptions with a focus ondetecting money laundering, EVA is aimed at detecting unauthorizedtransactions by analyzing a variety of objective aspects about transac-tions (e.g., amount, date and time, frequency, etc.). Thus, EVA presentsa broader approach that is in line with existing FFD mining techniques.Moreover, EVA allows for a deeper exploration of multiple aspects oftransactions as well as reasoning about how they influenced the auto-matically generated scores for fraud detection. Instead of analyzingkeywords, our FFD approach constructs individual profiles for eachaccount and computes suspiciousness scores that indicate how unusualthe transaction is, given the history of this account. This supports thedetection of different types of fraudulent transactions which would notbe possible from keyword analysis alone.
5.1.2 RQ2: InsightsIn total we found 77 insights. Most of these insights were connectioninsights (53.2%). Coincidence insights contributed 26%. Curiosityinsights (6.5%) and contradiction insights (9.1%) played a marginalrole. Creative desperation insights also only showed up in 5.2% of thecases. Most insights (35 insights) were found for the Task 3, followedby Task 2 with 24 insights and Task 1 with 18 insights. The number offound insights correlated with increasing task complexity. For example,Task 1 focused on the identification of specific values in order to offerthe investigators an easy start with EVA whereas Task 3 allowed formore data exploration since it required to analyze and compare twoaccounts in order to find their similarities and differences. Next, wewill discuss each insight category in more detail.
Connection. In total, 41 connection insights were found and twotypes of connection insights were identified. Connection insights fromthe first type resulted from a connection between the different viewsof EVA. For example, one expert compared the Dynamic Table view(see Figure 1, F) with the Score Construction view (see Figure 1, B) todetect connections between the amount and the scores of the suspicioustransactions. Connection insights from the second type, resulted from a
connection between the different variables. For example, one expertnoted: “country code and daily count are suspicious since unusualmany transactions were made from this foreign country”. In total,they derived slightly more connection insights from the views (53.7%)than from the variables (46.3%). These results show that the differentviews helped investigators to analyze the data from different viewpoints.However, also the comparison of the different variables played a rolein finding insights.
Coincidence. From the 77 found insights 20 were coincidence in-sights. These insights resulted from comparing values of the samevariables. For example, one expert noted: “the chance is high thatthese both transactions are also fraudulent since the receiver has al-ready a confirmed fraudulent transaction”. Or another investigatormentioned: “when you detect one fraud in this case, you can detect allfrauds because they were all made by only one person”. Although wefound more connection insights than coincidence insights during Task 1(15 versus 2 insights) and during Task 2 (13 versus 4 insights), slightlymore coincidence insights than connection insights were gained duringTask 3 (13 versus 14 insights). It seems that the differences betweenTask 3 and the other two tasks arose from the comparison of the twoaccounts in Task 3. For example, we observed that the investigatorscompared the values of the variables separately for each account andnext compared these between the accounts to detect similar behaviour.
Curiosity. We found 5 curiosity insights. These insights resultedfrom investigators’ observations which stimulated their interest to ex-plore the data further. For example, although one expert had alreadydetected fraud cases with the bar chart visualization in the Time Panel(see Figure 1, A.1), he interacted further with the time slider from thearea visualization (see Figure 1, A.2) in order to detect further possiblecases. Curiosity insights only occurred during the last two tasks whichwere more exploratory in nature than the first one (Task 2: 3 insightsand Task 3: 2 insights).
Contradiction. In total, 7 insights were contradiction insights. Thecontradiction insights arose from conflicts and doubts in their ownobservations but also in EVA. For example, one expert explained hisdecision not only to select the suspicious cases automatically markedfrom EVA: “I would also select the surrounding in the scatterplot -because maybe the system did not detect all fraudulent cases”. Mostcontradiction insights were found during Task 3 (5 insights). It seemsthat comparing two accounts added to the complexity of Task 3. Thisshowed that the participants had less confidence in their own obser-vations. Thus, we plan to find solutions to minimize users’ doubtsin the future, for example, by directly highlighting the differencesbetween accounts.
Creative Desperation. Only 4 creative desperation insights werefound. These insights resulted from revising their own, previouslyphrased interpretations or from finding alternative ways when the de-sired interaction or view was not available. For example, one expertassumed that the interaction technique linking and brushing is not pos-sible between the Dynamic Table view (see Figure 1, F) and the ScoreConstruction view (see Figure 1, B) since he saw no changes betweenthe two entries in the parallel coordinates after he selected them inthe table. After he tried a third entry, he realized that the first twoentries had the same values and hence there were no visual differencesin view B.
5.1.3 RQ3: Improvements
The investigators made useful suggestions for possible new features andimprovements. One suggestion was to expand the filter and selectionfunctionality. For example, all investigators noted that filter optionsespecially for the table representation (e.g., only to show transactionswith a certain amount) would be helpful. One expert highlighted thathe would also like to directly select suspicious cases in the Time Panelby selecting bars instead of using the temporal filter (see Figure 1, A.1).Another suggestion was to provide the possibility to put suspiciousreceivers on a black list to stop and investigate all transactions to thesereceivers. Furthermore, one expert suggested to have a simulationfeature to being able to play around with the composition, weights, andthresholds of sub-scores and see how it affects the overall score in order
to optimize the scoring algorithm.However, all three investigators propose to include: support of net-
work analysis. Network visualization is highly interesting in the areaof fraud detection in order to analyze the relations between accounts,receivers, and dimensions. Such a network visualization could helpthem to see the connection between suspicious transactions and othertransactions as well as involved accounts.
In addition to the mentioned opportunities for improvement we ob-served several minor usability issues (e.g., labels were sometimes toosmall or they overlapped) which will be resolved in the next itera-tion of EVA.
6 DISCUSSION
In this section, first, we discuss which features presented in EVA fulfilleach of the defined requirements. Next, we illustrate the challenges andopportunities that we identified during the work process.
6.1 Requirements
The set of views presented in EVA supports a better understanding ofthe data by presenting it in different abstraction levels to the investigator.Identifying time-oriented aspects, analysing the score construction, aswell as drill-down inspection are tasks that can be executed simultane-ously in different views. EVA also presents fully responsive interactiontechniques that allow a natural understanding of the relationships be-tween the multiple coordinated views. Aiming to perform a moreconcise decision about an alarmed transaction, the investigator canexplore data features, identify patterns, and evaluate scores by selectingand filtering the views. All interaction that excludes or include data intoa view ensures the consistency of the data by also excluding, including,or rearranging data representations on the other views as well.
The time-oriented analysis is presented through the views A.1 andA.2 and through their link with the other views. Investigators can ob-serve sending, receiving, scores, amount and others feature patternsover the time. Different periods of time can be specified during theanalysis. The multivariate feature of transactions makes a completevisual encoding of all important characteristics within a single viewimpossible. By presenting multiple-coordinated views we present anoverview of different features that our collaborators declared essentialfor their tasks. However, by presenting a dynamic table in additionto these multiple views, EVA allows detailed analysis of raw data fea-tures. Although EVA provides features to compare multiple customeraccounts, it was primarily developed for the analysis of individual ac-counts. The simultaneous investigation of multiple accounts usuallyincludes transactions of a time span from one to three years. However,due to national law restrictions, the maximum period of time that abank is allowed to keep this transaction data is seven years. Thus, evenfor the most extreme outlier case present in our real world data (2,000transactions per year), EVA scales fine.
In view B we can analyse how each overall score is constructedby others specific scores (R1). By observing how each line passesthrough the axis it is possible to identify which sub-scores influencemost. In addition, once all transactions are visible at once in thisview, EVA allows an analysis of the usual construction pattern for anaccount. Thus, when analyzing a single transaction, the investigator cancompare the construction of it with the normal construction behaviour.Another feature is the range filters for any of the axis. By doing that,the investigator can judge if high/low sub-scores are being ignored,overestimated, or present correlation and, thus, help on evaluating thescoring system.
In order to aid multiple account comparison and analysis, view Epresent an interactive row chart that allows the investigators to fil-ter each account‘s transactions (R2). By doing that, it is possible tocompare patterns among the different views presented by the prototype.
Similarities and differences between suspicious and non-suspicioustransactions become more evident during visual analysis. This canbe done for single or multiple accounts. Thus, transactions that arewrongly flagged as suspicious (false positive cases) can be more easilyidentified when comparing them with other transactions from the same
account (R3). On the other hand, false-negative cases are also more eas-ily detected by the exploration of the suspicious patterns through visualmeans (R4). A false-negative case is illustrated and described in Fig-ure 4. An efficiency way to perform both tasks is by using the DynamicTable (F) in combination with the Score Construction View (B).
6.2 Solving Real-World Tasks with EVAWe chose the tasks for our evaluation session in order to reflect theinvestigators’ real world tasks (we elaborated them together with twocollaborating domain experts). In this section, we outline how an in-vestigator solved his real-world tasks with EVA and the insights hederived during the evaluation session. While one investigator used EVAto solve Task 2, he examined account acc10421 (see Figure 4). Inter-actively investigating the different views of EVA, he used the ScoresConstruction View to filter out transactions with a low suspiciousnessof the country the money was transferred to (see arrow in Figure 4,view B). For this filter selection only one transaction was not automati-cally flagged as suspicious (i.e., the gray element in Figure 4) and EVAshows several clues that indicate that the only non-flagged transactionmight be fraudulent too and should at least be considered as suspicious.All transactions (including the non-flagged transaction) are going outto the same receiver (see arrow in Figure 4, view D.1), on the samedate (see arrow in Figure 4, view A.2). In addition, the non-flaggedtransaction involves a high amount of money (see arrow in Figure 4,view C) and scored quite high in several sub-domains (see Figure 4,view B). However, the overall score was not high enough to flag thistransaction as suspicious. After some more exploration the investigatorconfirmed this transaction as a false-negative case. Without the VAsupport of EVA, it would have been (nearly) impossible to spot thismistake of the automatic scoring system, which illustrates the benefitsof a VA approach compared to a pure FFD approach. This insight ledthe investigators to actually fine-tune the automatic alert system (seeSection 3.4).
6.3 Limitations & Further WorkDemands to detect, analyze, and monitor suspicious behavior are con-stantly increasing not only in FFD. Based on some of EVA’s limitations,we present possible further work and open research challenges.
Network Analysis. Although our prototype shows promisingresults for investigating long time intervals of transactions and relatinga small number of accounts, we do not support the investigation ofnetworks of accounts yet. An interactive network visualization wouldallow investigators to better reason about suspicious money transferrelationships and patterns within their contexts [4].
New Customer Classification. When a new customer is added toa profile system, he/she does not have enough transactions to derive areliable profile by EVA’s profile generation algorithm (see Section 3.4).This makes it impossible for the scoring algorithm to detect fraudulentattempts from new accounts. There is a need for an exploratory VAenvironment which allows for the analysis of suspicious behavior ofnew customer accounts.
Knowledge Base Construction. One aspect that adds up to thecomplexity of fraud detection is that finding suitable solutions for de-tecting and deciding about suspicious cases is not enough [6]. Currently,investigators are using their experience to judge if a transaction is fraud-ulent or not. This can be tricky and results vary with investigators. Wesuggest the construction of a knowledge base based on former fraud de-tection that supports investigators to choose suitable scoring thresholdsduring analysis. For instance, by logging investigators’ interaction data,we could collect filter set ups or filter combinations that obtained mostsuccess on detecting fraudulent behavior. This would not only supportfine-tuning of the automatic scoring system but also ease the knowledgetransfer to inexperienced investigators. Furthermore, it could also keepall investigators updated on new fraudulent discoveries.
Multiple Customers Monitoring. In our work, we can handlea small group of customers. Usually, these are accounts that wereflagged as suspicious by the automatic scoring system. However, itshould be possible to monitor all customers (or at least a big partsof them), which could lead to new insights. During evaluation (see

LEITE ET AL.: EVA: VISUAL ANALYTICS TO IDENTIFY FRAUDULENT EVENTS 337
possible to get relevant information with a specific type of visualizationthen another visualization type might be helpful.
Based on these categories, the observation notes as well as audioand video recordings were coded and categorized.
5.1 ResultsAll participants solved all tasks. The average duration needed for thetasks was about 18 minutes. The interview sessions (before and after theparticipants solved the tasks) took about 40 minutes in total. Next, wewill present and discuss the results according to our research questions.
5.1.1 RQ1: ComparisonThe investigators stated that they typically use visualizations for presen-tation tasks which they typically generate with Microsoft Office tools(e.g., Excel and PowerPoint) [25, 26]. Therefore, they argued that it isdifficult to compare EVA with these tools. The challenge in using thesetools is to find the interesting hot spots. All three investigators agreedthat a powerful visual tool for exploration tasks would be helpful forbrowsing the data, and for gaining insights which they were not evenlooking for, or for giving them hints to look at specific parts in thedata set more closely. They highlighted that EVA was very intuitive(e.g., color-coding), easy to use, more dynamic than the tools whichthey usually use and that it provides a good overview and quick accessto detail information. For example, one expert mentioned: “I likedit because it is very interactive and you can browse the data, evenif you don’t know what you are looking for, and find new insights”.Furthermore, the usage of EVA led to a positive attitude towards usingVA approaches in the future. For example, one expert noted: “Here wecould see what is possible [...] So we can rethink what we can offer tothe bank.”.
Since, the investigators did not know any visual approaches to sup-port FFD, they could not compare EVA to actual VA approaches. How-ever, if we compare EVA, for instance, to WireVis [4], a state of theart VA approach focusing on FFD, EVA takes more aspects into ac-count in order to identify fraudulent behaviour. While WireVis is usedto analyze keywords used in transaction descriptions with a focus ondetecting money laundering, EVA is aimed at detecting unauthorizedtransactions by analyzing a variety of objective aspects about transac-tions (e.g., amount, date and time, frequency, etc.). Thus, EVA presentsa broader approach that is in line with existing FFD mining techniques.Moreover, EVA allows for a deeper exploration of multiple aspects oftransactions as well as reasoning about how they influenced the auto-matically generated scores for fraud detection. Instead of analyzingkeywords, our FFD approach constructs individual profiles for eachaccount and computes suspiciousness scores that indicate how unusualthe transaction is, given the history of this account. This supports thedetection of different types of fraudulent transactions which would notbe possible from keyword analysis alone.
5.1.2 RQ2: InsightsIn total we found 77 insights. Most of these insights were connectioninsights (53.2%). Coincidence insights contributed 26%. Curiosityinsights (6.5%) and contradiction insights (9.1%) played a marginalrole. Creative desperation insights also only showed up in 5.2% of thecases. Most insights (35 insights) were found for the Task 3, followedby Task 2 with 24 insights and Task 1 with 18 insights. The number offound insights correlated with increasing task complexity. For example,Task 1 focused on the identification of specific values in order to offerthe investigators an easy start with EVA whereas Task 3 allowed formore data exploration since it required to analyze and compare twoaccounts in order to find their similarities and differences. Next, wewill discuss each insight category in more detail.
Connection. In total, 41 connection insights were found and twotypes of connection insights were identified. Connection insights fromthe first type resulted from a connection between the different viewsof EVA. For example, one expert compared the Dynamic Table view(see Figure 1, F) with the Score Construction view (see Figure 1, B) todetect connections between the amount and the scores of the suspicioustransactions. Connection insights from the second type, resulted from a
connection between the different variables. For example, one expertnoted: “country code and daily count are suspicious since unusualmany transactions were made from this foreign country”. In total,they derived slightly more connection insights from the views (53.7%)than from the variables (46.3%). These results show that the differentviews helped investigators to analyze the data from different viewpoints.However, also the comparison of the different variables played a rolein finding insights.
Coincidence. From the 77 found insights 20 were coincidence in-sights. These insights resulted from comparing values of the samevariables. For example, one expert noted: “the chance is high thatthese both transactions are also fraudulent since the receiver has al-ready a confirmed fraudulent transaction”. Or another investigatormentioned: “when you detect one fraud in this case, you can detect allfrauds because they were all made by only one person”. Although wefound more connection insights than coincidence insights during Task 1(15 versus 2 insights) and during Task 2 (13 versus 4 insights), slightlymore coincidence insights than connection insights were gained duringTask 3 (13 versus 14 insights). It seems that the differences betweenTask 3 and the other two tasks arose from the comparison of the twoaccounts in Task 3. For example, we observed that the investigatorscompared the values of the variables separately for each account andnext compared these between the accounts to detect similar behaviour.
Curiosity. We found 5 curiosity insights. These insights resultedfrom investigators’ observations which stimulated their interest to ex-plore the data further. For example, although one expert had alreadydetected fraud cases with the bar chart visualization in the Time Panel(see Figure 1, A.1), he interacted further with the time slider from thearea visualization (see Figure 1, A.2) in order to detect further possiblecases. Curiosity insights only occurred during the last two tasks whichwere more exploratory in nature than the first one (Task 2: 3 insightsand Task 3: 2 insights).
Contradiction. In total, 7 insights were contradiction insights. Thecontradiction insights arose from conflicts and doubts in their ownobservations but also in EVA. For example, one expert explained hisdecision not only to select the suspicious cases automatically markedfrom EVA: “I would also select the surrounding in the scatterplot -because maybe the system did not detect all fraudulent cases”. Mostcontradiction insights were found during Task 3 (5 insights). It seemsthat comparing two accounts added to the complexity of Task 3. Thisshowed that the participants had less confidence in their own obser-vations. Thus, we plan to find solutions to minimize users’ doubtsin the future, for example, by directly highlighting the differencesbetween accounts.
Creative Desperation. Only 4 creative desperation insights werefound. These insights resulted from revising their own, previouslyphrased interpretations or from finding alternative ways when the de-sired interaction or view was not available. For example, one expertassumed that the interaction technique linking and brushing is not pos-sible between the Dynamic Table view (see Figure 1, F) and the ScoreConstruction view (see Figure 1, B) since he saw no changes betweenthe two entries in the parallel coordinates after he selected them inthe table. After he tried a third entry, he realized that the first twoentries had the same values and hence there were no visual differencesin view B.
5.1.3 RQ3: Improvements
The investigators made useful suggestions for possible new features andimprovements. One suggestion was to expand the filter and selectionfunctionality. For example, all investigators noted that filter optionsespecially for the table representation (e.g., only to show transactionswith a certain amount) would be helpful. One expert highlighted thathe would also like to directly select suspicious cases in the Time Panelby selecting bars instead of using the temporal filter (see Figure 1, A.1).Another suggestion was to provide the possibility to put suspiciousreceivers on a black list to stop and investigate all transactions to thesereceivers. Furthermore, one expert suggested to have a simulationfeature to being able to play around with the composition, weights, andthresholds of sub-scores and see how it affects the overall score in order
to optimize the scoring algorithm.However, all three investigators propose to include: support of net-
work analysis. Network visualization is highly interesting in the areaof fraud detection in order to analyze the relations between accounts,receivers, and dimensions. Such a network visualization could helpthem to see the connection between suspicious transactions and othertransactions as well as involved accounts.
In addition to the mentioned opportunities for improvement we ob-served several minor usability issues (e.g., labels were sometimes toosmall or they overlapped) which will be resolved in the next itera-tion of EVA.
6 DISCUSSION
In this section, first, we discuss which features presented in EVA fulfilleach of the defined requirements. Next, we illustrate the challenges andopportunities that we identified during the work process.
6.1 Requirements
The set of views presented in EVA supports a better understanding ofthe data by presenting it in different abstraction levels to the investigator.Identifying time-oriented aspects, analysing the score construction, aswell as drill-down inspection are tasks that can be executed simultane-ously in different views. EVA also presents fully responsive interactiontechniques that allow a natural understanding of the relationships be-tween the multiple coordinated views. Aiming to perform a moreconcise decision about an alarmed transaction, the investigator canexplore data features, identify patterns, and evaluate scores by selectingand filtering the views. All interaction that excludes or include data intoa view ensures the consistency of the data by also excluding, including,or rearranging data representations on the other views as well.
The time-oriented analysis is presented through the views A.1 andA.2 and through their link with the other views. Investigators can ob-serve sending, receiving, scores, amount and others feature patternsover the time. Different periods of time can be specified during theanalysis. The multivariate feature of transactions makes a completevisual encoding of all important characteristics within a single viewimpossible. By presenting multiple-coordinated views we present anoverview of different features that our collaborators declared essentialfor their tasks. However, by presenting a dynamic table in additionto these multiple views, EVA allows detailed analysis of raw data fea-tures. Although EVA provides features to compare multiple customeraccounts, it was primarily developed for the analysis of individual ac-counts. The simultaneous investigation of multiple accounts usuallyincludes transactions of a time span from one to three years. However,due to national law restrictions, the maximum period of time that abank is allowed to keep this transaction data is seven years. Thus, evenfor the most extreme outlier case present in our real world data (2,000transactions per year), EVA scales fine.
In view B we can analyse how each overall score is constructedby others specific scores (R1). By observing how each line passesthrough the axis it is possible to identify which sub-scores influencemost. In addition, once all transactions are visible at once in thisview, EVA allows an analysis of the usual construction pattern for anaccount. Thus, when analyzing a single transaction, the investigator cancompare the construction of it with the normal construction behaviour.Another feature is the range filters for any of the axis. By doing that,the investigator can judge if high/low sub-scores are being ignored,overestimated, or present correlation and, thus, help on evaluating thescoring system.
In order to aid multiple account comparison and analysis, view Epresent an interactive row chart that allows the investigators to fil-ter each account‘s transactions (R2). By doing that, it is possible tocompare patterns among the different views presented by the prototype.
Similarities and differences between suspicious and non-suspicioustransactions become more evident during visual analysis. This canbe done for single or multiple accounts. Thus, transactions that arewrongly flagged as suspicious (false positive cases) can be more easilyidentified when comparing them with other transactions from the same
account (R3). On the other hand, false-negative cases are also more eas-ily detected by the exploration of the suspicious patterns through visualmeans (R4). A false-negative case is illustrated and described in Fig-ure 4. An efficiency way to perform both tasks is by using the DynamicTable (F) in combination with the Score Construction View (B).
6.2 Solving Real-World Tasks with EVAWe chose the tasks for our evaluation session in order to reflect theinvestigators’ real world tasks (we elaborated them together with twocollaborating domain experts). In this section, we outline how an in-vestigator solved his real-world tasks with EVA and the insights hederived during the evaluation session. While one investigator used EVAto solve Task 2, he examined account acc10421 (see Figure 4). Inter-actively investigating the different views of EVA, he used the ScoresConstruction View to filter out transactions with a low suspiciousnessof the country the money was transferred to (see arrow in Figure 4,view B). For this filter selection only one transaction was not automati-cally flagged as suspicious (i.e., the gray element in Figure 4) and EVAshows several clues that indicate that the only non-flagged transactionmight be fraudulent too and should at least be considered as suspicious.All transactions (including the non-flagged transaction) are going outto the same receiver (see arrow in Figure 4, view D.1), on the samedate (see arrow in Figure 4, view A.2). In addition, the non-flaggedtransaction involves a high amount of money (see arrow in Figure 4,view C) and scored quite high in several sub-domains (see Figure 4,view B). However, the overall score was not high enough to flag thistransaction as suspicious. After some more exploration the investigatorconfirmed this transaction as a false-negative case. Without the VAsupport of EVA, it would have been (nearly) impossible to spot thismistake of the automatic scoring system, which illustrates the benefitsof a VA approach compared to a pure FFD approach. This insight ledthe investigators to actually fine-tune the automatic alert system (seeSection 3.4).
6.3 Limitations & Further WorkDemands to detect, analyze, and monitor suspicious behavior are con-stantly increasing not only in FFD. Based on some of EVA’s limitations,we present possible further work and open research challenges.
Network Analysis. Although our prototype shows promisingresults for investigating long time intervals of transactions and relatinga small number of accounts, we do not support the investigation ofnetworks of accounts yet. An interactive network visualization wouldallow investigators to better reason about suspicious money transferrelationships and patterns within their contexts [4].
New Customer Classification. When a new customer is added toa profile system, he/she does not have enough transactions to derive areliable profile by EVA’s profile generation algorithm (see Section 3.4).This makes it impossible for the scoring algorithm to detect fraudulentattempts from new accounts. There is a need for an exploratory VAenvironment which allows for the analysis of suspicious behavior ofnew customer accounts.
Knowledge Base Construction. One aspect that adds up to thecomplexity of fraud detection is that finding suitable solutions for de-tecting and deciding about suspicious cases is not enough [6]. Currently,investigators are using their experience to judge if a transaction is fraud-ulent or not. This can be tricky and results vary with investigators. Wesuggest the construction of a knowledge base based on former fraud de-tection that supports investigators to choose suitable scoring thresholdsduring analysis. For instance, by logging investigators’ interaction data,we could collect filter set ups or filter combinations that obtained mostsuccess on detecting fraudulent behavior. This would not only supportfine-tuning of the automatic scoring system but also ease the knowledgetransfer to inexperienced investigators. Furthermore, it could also keepall investigators updated on new fraudulent discoveries.
Multiple Customers Monitoring. In our work, we can handlea small group of customers. Usually, these are accounts that wereflagged as suspicious by the automatic scoring system. However, itshould be possible to monitor all customers (or at least a big partsof them), which could lead to new insights. During evaluation (see
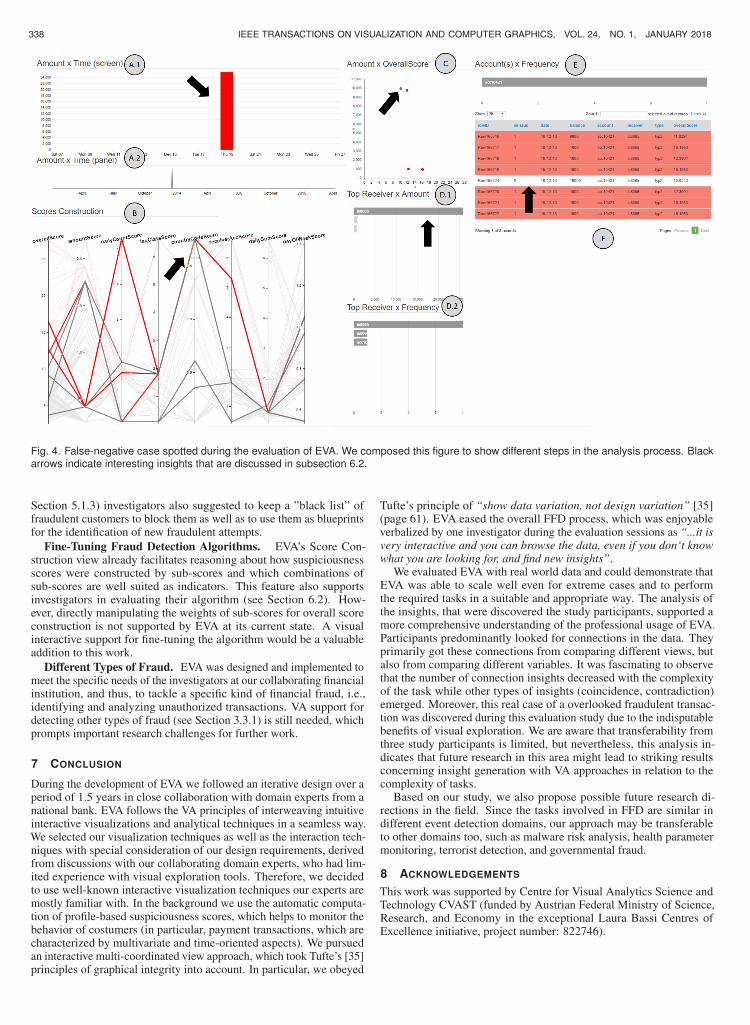
338 IEEE TRANSACTIONS ON VISUALIZATION AND COMPUTER GRAPHICS, VOL. 24, NO. 1, JANUARY 2018
Fig. 4. False-negative case spotted during the evaluation of EVA. We composed this figure to show different steps in the analysis process. Blackarrows indicate interesting insights that are discussed in subsection 6.2.
Section 5.1.3) investigators also suggested to keep a ”black list” offraudulent customers to block them as well as to use them as blueprintsfor the identification of new fraudulent attempts.
Fine-Tuning Fraud Detection Algorithms. EVA’s Score Con-struction view already facilitates reasoning about how suspiciousnessscores were constructed by sub-scores and which combinations ofsub-scores are well suited as indicators. This feature also supportsinvestigators in evaluating their algorithm (see Section 6.2). How-ever, directly manipulating the weights of sub-scores for overall scoreconstruction is not supported by EVA at its current state. A visualinteractive support for fine-tuning the algorithm would be a valuableaddition to this work.
Different Types of Fraud. EVA was designed and implemented tomeet the specific needs of the investigators at our collaborating financialinstitution, and thus, to tackle a specific kind of financial fraud, i.e.,identifying and analyzing unauthorized transactions. VA support fordetecting other types of fraud (see Section 3.3.1) is still needed, whichprompts important research challenges for further work.
7 CONCLUSION
During the development of EVA we followed an iterative design over aperiod of 1.5 years in close collaboration with domain experts from anational bank. EVA follows the VA principles of interweaving intuitiveinteractive visualizations and analytical techniques in a seamless way.We selected our visualization techniques as well as the interaction tech-niques with special consideration of our design requirements, derivedfrom discussions with our collaborating domain experts, who had lim-ited experience with visual exploration tools. Therefore, we decidedto use well-known interactive visualization techniques our experts aremostly familiar with. In the background we use the automatic computa-tion of profile-based suspiciousness scores, which helps to monitor thebehavior of costumers (in particular, payment transactions, which arecharacterized by multivariate and time-oriented aspects). We pursuedan interactive multi-coordinated view approach, which took Tufte’s [35]principles of graphical integrity into account. In particular, we obeyed
Tufte’s principle of “show data variation, not design variation” [35](page 61). EVA eased the overall FFD process, which was enjoyableverbalized by one investigator during the evaluation sessions as “...it isvery interactive and you can browse the data, even if you don‘t knowwhat you are looking for, and find new insights”.
We evaluated EVA with real world data and could demonstrate thatEVA was able to scale well even for extreme cases and to performthe required tasks in a suitable and appropriate way. The analysis ofthe insights, that were discovered the study participants, supported amore comprehensive understanding of the professional usage of EVA.Participants predominantly looked for connections in the data. Theyprimarily got these connections from comparing different views, butalso from comparing different variables. It was fascinating to observethat the number of connection insights decreased with the complexityof the task while other types of insights (coincidence, contradiction)emerged. Moreover, this real case of a overlooked fraudulent transac-tion was discovered during this evaluation study due to the indisputablebenefits of visual exploration. We are aware that transferability fromthree study participants is limited, but nevertheless, this analysis in-dicates that future research in this area might lead to striking resultsconcerning insight generation with VA approaches in relation to thecomplexity of tasks.
Based on our study, we also propose possible future research di-rections in the field. Since the tasks involved in FFD are similar indifferent event detection domains, our approach may be transferableto other domains too, such as malware risk analysis, health parametermonitoring, terrorist detection, and governmental fraud.
8 ACKNOWLEDGEMENTS
This work was supported by Centre for Visual Analytics Science andTechnology CVAST (funded by Austrian Federal Ministry of Science,Research, and Economy in the exceptional Laura Bassi Centres ofExcellence initiative, project number: 822746).
REFERENCES
[1] W. Aigner, S. Miksch, H. Schumann, and C. Tominski. Visualization oftime-oriented data. Springer Science & Business Media, 2011.
[2] N. Andrienko and G. Andrienko. Exploratory Analysis of Spatial andTemporal Data: A Systematic Approach. Springer Berlin Heidelberg,Berlin, Heidelberg, 2006. doi: 10.1007/3-540-31190-4 3
[3] M. Carminati, R. Caron, F. Maggi, I. Epifani, and S. Zanero. Banksealer:an online banking fraud analysis and decision support system. In IFIPInternational Information Security Conference, pp. 380–394. Springer,2014.
[4] R. Chang, M. Ghoniem, R. Kosara, W. Ribarsky, J. Yang, E. Suma,C. Ziemkiewicz, D. Kern, and A. Sudjianto. Wirevis: Visualization of cat-egorical, time-varying data from financial transactions. In Visual AnalyticsScience and Technology. VAST. IEEE Symposium on, pp. 155–162. IEEE,2007.
[5] W. S. Cleveland. Graphical methods for data presentation: Full scalebreaks, dot charts, and multibased logging. The American Statistician,38(4):270–280, 1984.
[6] W. N. Dilla and R. L. Raschke. Data visualization for fraud detection:Practice implications and a call for future research. International Journalof Accounting Information Systems, 16:1–22, 2015.
[7] M. Dumas, M. J. McGuffin, and V. L. Lemieux. Financevis.net - a visualsurvey of financial data visualizations. In Poster Abstracts of IEEE VIS2014, November 2014. Poster and Extended Abstract.
[8] Erste Bank, Austria. Erste Group IT International.https://www.erstegroupit.com/en/home.
[9] M. Harrower and C. A. Brewer. Colorbrewer. org: an online tool forselecting colour schemes for maps. The Cartographic Journal, 40(1):27–37, 2003.
[10] M. L. Huang, J. Liang, and Q. V. Nguyen. A visualization approach forfrauds detection in financial market. In Information Visualisation, 13thInternational Conference, pp. 197–202. IEEE, 2009.
[11] T. Isenberg, P. Isenberg, J. Chen, M. Sedlmair, and T. Moller. A systematicreview on the practice of evaluating visualization. IEEE Transactions onVisualization and Computer Graphics, 19(12):2818–2827, 2013.
[12] K. Jaishankar. Cyber criminology: exploring internet crimes and criminalbehavior. CRC Press, 2011.
[13] D. A. Keim, F. Mansmann, J. Schneidewind, J. Thomas, and H. Ziegler.Visual analytics: Scope and challenges. Springer, 2008.
[14] J. Kielman, J. Thomas, and R. May. Foundations and frontiers in visualanalytics. Information Visualization, 8(4):239, 2009.
[15] J. D. Kirkland, T. E. Senator, J. J. Hayden, T. Dybala, H. G. Goldberg,and P. Shyr. The nasd regulation advanced-detection system (ads). AIMagazine, 20(1):55, 1999.
[16] G. Klein. Seeing what others don’t: The remarkable ways we gain insights.PublicAffairs, 2013.
[17] G. Klein, B. Moon, and R. R. Hoffman. Making sense of sensemaking1: Alternative perspectives. IEEE Intelligent Systems, 21(4):70–73, July2006.
[18] G. Klein, B. Moon, and R. R. Hoffman. Making sense of sensemaking2: A macrocognitive model. IEEE Intelligent Systems, 21(5):88–92, Sept.2006.
[19] S. Ko, I. Cho, S. Afzal, C. Yau, J. Chae, A. Malik, K. Beck, Y. Jang,W. Ribarsky, and D. S. Ebert. A survey on visual analysis approaches forfinancial data. In Computer Graphics Forum, vol. 35, pp. 599–617. WileyOnline Library, 2016.
[20] Y. Kou, C.-T. Lu, S. Sirwongwattana, and Y.-P. Huang. Survey of frauddetection techniques. In Networking, sensing and control, 2004 IEEEinternational conference on, vol. 2, pp. 749–754, 2004.
[21] S. Kriglstein and M. Pohl. Choosing the Right Sample? Experiences ofSelecting Participants for Visualization Evaluation. In W. Aigner, P. Rosen-thal, and C. Scheidegger, eds., EuroVis Workshop on Reproducibility, Ver-ification, and Validation in Visualization (EuroRV3). The EurographicsAssociation, 2015. doi: 10.2312/eurorv3.20151146
[22] R. A. Leite, T. Gschwandtner, S. Miksch, E. Gstrein, and J. Kuntner.Visual analytics for fraud detection and monitoring. In Visual AnalyticsScience and Technology (VAST), 2015 IEEE Conference on, pp. 201–202.IEEE, 2015.
[23] J. Luell. Employee fraud detection under real world conditions. PhDthesis, UNIVERSITY OF ZURICH, 2010.
[24] J. Mackinlay. Automating the design of graphical presentations of rela-tional information. ACM Transactions On Graphics (Tog), 5(2):110–141,
1986.[25] Microsoft. Excel. office.microsoft.com/en-us/excel/ (accessed: 2016-12-
09).[26] Microsoft. Powerpoint. office.microsoft.com/en-us/powerpoint/ (accessed:
2016-12-09).[27] S. Miksch and W. Aigner. A matter of time: Applying a data–users–tasks
design triangle to visual analytics of time-oriented data. Computers &Graphics, 38:286–290, 2014.
[28] M. Monroe, R. Lan, H. Lee, C. Plaisant, and B. Shneiderman. Temporalevent sequence simplification. IEEE transactions on visualization andcomputer graphics, 19(12):2227–2236, 2013.
[29] T. Munzner. A nested model for visualization design and validation.IEEE transactions on visualization and computer graphics, 15(6):921–928, 2009.
[30] P. Pirolli and S. Card. The sensemaking process and leverage pointsfor analyst technology as identified through cognitive task analysis. InProceedings of International Conference on Intelligence Analysis, pp. 2–4,2005.
[31] M. Pohl, M. Smuc, and E. Mayr. The user puzzle—explaining the inter-action with visual analytics systems. IEEE Transactions on Visualizationand Computer Graphics, 18(12):2908–2916, Dec 2012.
[32] D. J. H. Richard J. Bolton. Statistical fraud detection: A review. StatisticalScience, 17(3):235–249, 2002.
[33] A. Rind, T. D. Wang, W. Aigner, S. Miksch, K. Wongsuphasawat,C. Plaisant, B. Shneiderman, et al. Interactive information visualiza-tion to explore and query electronic health records. Foundations andTrends® in Human–Computer Interaction, 5(3):207–298, 2013.
[34] J. P. Steidlmayer and G. Kummel. Financial data event flow analysissystem with study conductor display, Sept. 26 1995. US Patent 5,454,104.
[35] E. R. Tufte. The Visual Display of Quantitative Information. GraphicsPress, Cheshire, CT, 2011.
[36] M. Wagner, F. Fischer, R. Luh, A. Haberson, A. Rind, D. A. Keim, andW. Aigner. A Survey of Visualization Systems for Malware Analysis. InR. Borgo, F. Ganovelli, and I. Viola, eds., EG Conference on Visualization(EuroVis) - STARs, pp. 105–125. The Eurographics Association, 2015. doi:10.2312/eurovisstar.20151114

LEITE ET AL.: EVA: VISUAL ANALYTICS TO IDENTIFY FRAUDULENT EVENTS 339
Fig. 4. False-negative case spotted during the evaluation of EVA. We composed this figure to show different steps in the analysis process. Blackarrows indicate interesting insights that are discussed in subsection 6.2.
Section 5.1.3) investigators also suggested to keep a ”black list” offraudulent customers to block them as well as to use them as blueprintsfor the identification of new fraudulent attempts.
Fine-Tuning Fraud Detection Algorithms. EVA’s Score Con-struction view already facilitates reasoning about how suspiciousnessscores were constructed by sub-scores and which combinations ofsub-scores are well suited as indicators. This feature also supportsinvestigators in evaluating their algorithm (see Section 6.2). How-ever, directly manipulating the weights of sub-scores for overall scoreconstruction is not supported by EVA at its current state. A visualinteractive support for fine-tuning the algorithm would be a valuableaddition to this work.
Different Types of Fraud. EVA was designed and implemented tomeet the specific needs of the investigators at our collaborating financialinstitution, and thus, to tackle a specific kind of financial fraud, i.e.,identifying and analyzing unauthorized transactions. VA support fordetecting other types of fraud (see Section 3.3.1) is still needed, whichprompts important research challenges for further work.
7 CONCLUSION
During the development of EVA we followed an iterative design over aperiod of 1.5 years in close collaboration with domain experts from anational bank. EVA follows the VA principles of interweaving intuitiveinteractive visualizations and analytical techniques in a seamless way.We selected our visualization techniques as well as the interaction tech-niques with special consideration of our design requirements, derivedfrom discussions with our collaborating domain experts, who had lim-ited experience with visual exploration tools. Therefore, we decidedto use well-known interactive visualization techniques our experts aremostly familiar with. In the background we use the automatic computa-tion of profile-based suspiciousness scores, which helps to monitor thebehavior of costumers (in particular, payment transactions, which arecharacterized by multivariate and time-oriented aspects). We pursuedan interactive multi-coordinated view approach, which took Tufte’s [35]principles of graphical integrity into account. In particular, we obeyed
Tufte’s principle of “show data variation, not design variation” [35](page 61). EVA eased the overall FFD process, which was enjoyableverbalized by one investigator during the evaluation sessions as “...it isvery interactive and you can browse the data, even if you don‘t knowwhat you are looking for, and find new insights”.
We evaluated EVA with real world data and could demonstrate thatEVA was able to scale well even for extreme cases and to performthe required tasks in a suitable and appropriate way. The analysis ofthe insights, that were discovered the study participants, supported amore comprehensive understanding of the professional usage of EVA.Participants predominantly looked for connections in the data. Theyprimarily got these connections from comparing different views, butalso from comparing different variables. It was fascinating to observethat the number of connection insights decreased with the complexityof the task while other types of insights (coincidence, contradiction)emerged. Moreover, this real case of a overlooked fraudulent transac-tion was discovered during this evaluation study due to the indisputablebenefits of visual exploration. We are aware that transferability fromthree study participants is limited, but nevertheless, this analysis in-dicates that future research in this area might lead to striking resultsconcerning insight generation with VA approaches in relation to thecomplexity of tasks.
Based on our study, we also propose possible future research di-rections in the field. Since the tasks involved in FFD are similar indifferent event detection domains, our approach may be transferableto other domains too, such as malware risk analysis, health parametermonitoring, terrorist detection, and governmental fraud.
8 ACKNOWLEDGEMENTS
This work was supported by Centre for Visual Analytics Science andTechnology CVAST (funded by Austrian Federal Ministry of Science,Research, and Economy in the exceptional Laura Bassi Centres ofExcellence initiative, project number: 822746).
REFERENCES
[1] W. Aigner, S. Miksch, H. Schumann, and C. Tominski. Visualization oftime-oriented data. Springer Science & Business Media, 2011.
[2] N. Andrienko and G. Andrienko. Exploratory Analysis of Spatial andTemporal Data: A Systematic Approach. Springer Berlin Heidelberg,Berlin, Heidelberg, 2006. doi: 10.1007/3-540-31190-4 3
[3] M. Carminati, R. Caron, F. Maggi, I. Epifani, and S. Zanero. Banksealer:an online banking fraud analysis and decision support system. In IFIPInternational Information Security Conference, pp. 380–394. Springer,2014.
[4] R. Chang, M. Ghoniem, R. Kosara, W. Ribarsky, J. Yang, E. Suma,C. Ziemkiewicz, D. Kern, and A. Sudjianto. Wirevis: Visualization of cat-egorical, time-varying data from financial transactions. In Visual AnalyticsScience and Technology. VAST. IEEE Symposium on, pp. 155–162. IEEE,2007.
[5] W. S. Cleveland. Graphical methods for data presentation: Full scalebreaks, dot charts, and multibased logging. The American Statistician,38(4):270–280, 1984.
[6] W. N. Dilla and R. L. Raschke. Data visualization for fraud detection:Practice implications and a call for future research. International Journalof Accounting Information Systems, 16:1–22, 2015.
[7] M. Dumas, M. J. McGuffin, and V. L. Lemieux. Financevis.net - a visualsurvey of financial data visualizations. In Poster Abstracts of IEEE VIS2014, November 2014. Poster and Extended Abstract.
[8] Erste Bank, Austria. Erste Group IT International.https://www.erstegroupit.com/en/home.
[9] M. Harrower and C. A. Brewer. Colorbrewer. org: an online tool forselecting colour schemes for maps. The Cartographic Journal, 40(1):27–37, 2003.
[10] M. L. Huang, J. Liang, and Q. V. Nguyen. A visualization approach forfrauds detection in financial market. In Information Visualisation, 13thInternational Conference, pp. 197–202. IEEE, 2009.
[11] T. Isenberg, P. Isenberg, J. Chen, M. Sedlmair, and T. Moller. A systematicreview on the practice of evaluating visualization. IEEE Transactions onVisualization and Computer Graphics, 19(12):2818–2827, 2013.
[12] K. Jaishankar. Cyber criminology: exploring internet crimes and criminalbehavior. CRC Press, 2011.
[13] D. A. Keim, F. Mansmann, J. Schneidewind, J. Thomas, and H. Ziegler.Visual analytics: Scope and challenges. Springer, 2008.
[14] J. Kielman, J. Thomas, and R. May. Foundations and frontiers in visualanalytics. Information Visualization, 8(4):239, 2009.
[15] J. D. Kirkland, T. E. Senator, J. J. Hayden, T. Dybala, H. G. Goldberg,and P. Shyr. The nasd regulation advanced-detection system (ads). AIMagazine, 20(1):55, 1999.
[16] G. Klein. Seeing what others don’t: The remarkable ways we gain insights.PublicAffairs, 2013.
[17] G. Klein, B. Moon, and R. R. Hoffman. Making sense of sensemaking1: Alternative perspectives. IEEE Intelligent Systems, 21(4):70–73, July2006.
[18] G. Klein, B. Moon, and R. R. Hoffman. Making sense of sensemaking2: A macrocognitive model. IEEE Intelligent Systems, 21(5):88–92, Sept.2006.
[19] S. Ko, I. Cho, S. Afzal, C. Yau, J. Chae, A. Malik, K. Beck, Y. Jang,W. Ribarsky, and D. S. Ebert. A survey on visual analysis approaches forfinancial data. In Computer Graphics Forum, vol. 35, pp. 599–617. WileyOnline Library, 2016.
[20] Y. Kou, C.-T. Lu, S. Sirwongwattana, and Y.-P. Huang. Survey of frauddetection techniques. In Networking, sensing and control, 2004 IEEEinternational conference on, vol. 2, pp. 749–754, 2004.
[21] S. Kriglstein and M. Pohl. Choosing the Right Sample? Experiences ofSelecting Participants for Visualization Evaluation. In W. Aigner, P. Rosen-thal, and C. Scheidegger, eds., EuroVis Workshop on Reproducibility, Ver-ification, and Validation in Visualization (EuroRV3). The EurographicsAssociation, 2015. doi: 10.2312/eurorv3.20151146
[22] R. A. Leite, T. Gschwandtner, S. Miksch, E. Gstrein, and J. Kuntner.Visual analytics for fraud detection and monitoring. In Visual AnalyticsScience and Technology (VAST), 2015 IEEE Conference on, pp. 201–202.IEEE, 2015.
[23] J. Luell. Employee fraud detection under real world conditions. PhDthesis, UNIVERSITY OF ZURICH, 2010.
[24] J. Mackinlay. Automating the design of graphical presentations of rela-tional information. ACM Transactions On Graphics (Tog), 5(2):110–141,
1986.[25] Microsoft. Excel. office.microsoft.com/en-us/excel/ (accessed: 2016-12-
09).[26] Microsoft. Powerpoint. office.microsoft.com/en-us/powerpoint/ (accessed:
2016-12-09).[27] S. Miksch and W. Aigner. A matter of time: Applying a data–users–tasks
design triangle to visual analytics of time-oriented data. Computers &Graphics, 38:286–290, 2014.
[28] M. Monroe, R. Lan, H. Lee, C. Plaisant, and B. Shneiderman. Temporalevent sequence simplification. IEEE transactions on visualization andcomputer graphics, 19(12):2227–2236, 2013.
[29] T. Munzner. A nested model for visualization design and validation.IEEE transactions on visualization and computer graphics, 15(6):921–928, 2009.
[30] P. Pirolli and S. Card. The sensemaking process and leverage pointsfor analyst technology as identified through cognitive task analysis. InProceedings of International Conference on Intelligence Analysis, pp. 2–4,2005.
[31] M. Pohl, M. Smuc, and E. Mayr. The user puzzle—explaining the inter-action with visual analytics systems. IEEE Transactions on Visualizationand Computer Graphics, 18(12):2908–2916, Dec 2012.
[32] D. J. H. Richard J. Bolton. Statistical fraud detection: A review. StatisticalScience, 17(3):235–249, 2002.
[33] A. Rind, T. D. Wang, W. Aigner, S. Miksch, K. Wongsuphasawat,C. Plaisant, B. Shneiderman, et al. Interactive information visualiza-tion to explore and query electronic health records. Foundations andTrends® in Human–Computer Interaction, 5(3):207–298, 2013.
[34] J. P. Steidlmayer and G. Kummel. Financial data event flow analysissystem with study conductor display, Sept. 26 1995. US Patent 5,454,104.
[35] E. R. Tufte. The Visual Display of Quantitative Information. GraphicsPress, Cheshire, CT, 2011.
[36] M. Wagner, F. Fischer, R. Luh, A. Haberson, A. Rind, D. A. Keim, andW. Aigner. A Survey of Visualization Systems for Malware Analysis. InR. Borgo, F. Ganovelli, and I. Viola, eds., EG Conference on Visualization(EuroVis) - STARs, pp. 105–125. The Eurographics Association, 2015. doi:10.2312/eurovisstar.20151114