Atomistic Visualization: On-the-fly Data Extraction and Rendering
1
EVA: Extraction, Visualization and Analysis of the Telecommunications
and Media Ownership Network
Kim Norlen
School of Information Management and Systems
University of California, Berkeley
Gabriel Lucas
School of Information Management and Systems
University of California, Berkeley
Mike Gebbie
School of Information Management and Systems
University of California, Berkeley
John Chuang
School of Information Management and Systems
University of California, Berkeley
Abstract
We present EVA, a prototype system for extracting, visualizing, and analyzing corporate
ownership information as a social network. Using probabilistic information retrieval and
extraction techniques, we automatically extract ownership relationships from
heterogeneous sources of online text, including corporate annual reports (10-Ks) filed with
the U.S. Securities and Exchange Commission (SEC). A browser-based visualization
interface allows users to query the relationship database and explore large networks of
companies. Applying the system and methodology to the telecommunications and media
industries, we construct an ownership network with 6,726 relationships among 8,343

2
companies. Analysis reveals a highly clustered network, with over 50% of all companies
connected to one another in a single component. Furthermore, ownership activity is highly
skewed: 90% of companies are involved in no more than one relationship, but the top ten
companies are parents for over 24% of all relationships. We are also able to identify the
most influential companies in the network using social network analysis metrics such as
degree, betweenness, cutpoints, and cliques. We believe this methodology and tool can aid
government regulators, policy researchers, and the general public to interpret complex
corporate ownership structures, thereby bringing greater transparency to the public
disclosure of corporate inter-relationships.
1 Introduction
Ownership is a fundamental element of analysis in economics and public policy. An
ownership relationship may indicate the flow of capital, information, and influence
between two firms. It may also have broader implications for industrial organization,
competition, and antitrust. In an era of industry convergence, ownership relationships
among companies have become so complex that they resemble directed social networks
rather than simple hierarchies. Yet, tracking and analyzing ownership networks are
prerequisites to informed public debate on proposed mergers or government regulation.
While federal regulations dictate full ownership disclosure for public firms, such
information are often decentralized and unstructured, if not unreported, 1 making
systematic documentation and analysis of ownership very difficult. Researchers must often
sift through large volumes of free-text, a process that is time-consuming, tedious, and non-
scalable.
The EVA project has three objectives. The first is to efficiently gather from heterogeneous
sources large amounts of ownership information describing the telecommunications and
media industries. We format this data as a social network of companies connected by
ownership relationships, where ownership is defined as one company’s possession of
equity in another company. The second objective is to provide access to this information
through a simple, intuitive interface.2 The third is to analyze the ownership network using
1 For example, Tyco spent about $8 billion in its past three fiscal years on more than 700 acquisitions that were never announced to the public [17]. 2 The EVA visualization tool is located at <http://denali.berkeley.edu/eva/>.

3
social network analytic techniques in order to gain insight of the industry at both the firm
level and the industry level.
We concentrate on the telecommunications and media industries for two reasons. First,
these industries constitute a significant component of the global economy, as companies in
these industries control information content and delivery, publishing, broadcasting, and
global networking, all essential components of public speech. Second, these industries
have been in a state of flux since the Telecommunications Act of 1996 opened up
possibilities for new constellations of ownership by lifting regulatory barriers between
media and telecommunications companies [8]. The ability to track and analyze these
changes would be an important tool for the creation of telecommunications policy.
Using probabilistic information retrieval and extraction techniques, we construct an
ownership network of 6,726 ownership relationships among 8,343 companies. Analysis
reveals power law distributions for two important network metrics, namely component size
(number of companies connected together) and company degree (number of ownership
relationships in which a company is involved). Two results stand out from these metrics.
First, one large component connects over half of the companies in the database. Second,
ten companies are owners in over 24% of relationships. These findings reveal a sparse but
broad network where a few companies claim the majority of ownership.
This paper is structured as follows. Section 2 gives an overview of the EVA system.
Section 3 explains the process for extracting and storing ownership relationships. Section
4 describes the visualization interface. Section 5 contains our network analysis and
discusses its significance. Section 6 discusses implications of and improvements to the
system, and Section 7 concludes.
2 System Overview
The EVA system comprises an extraction engine, a database, and a visualization interface.
Figure 1 shows how these components interact. The extraction engine is both a primary
and secondary research tool for gathering ownership data. As a primary research tool, the
extraction engine identifies ownership information buried within lengthy free-text
documents; as a secondary research tool, it gathers ownership data summarized in

4
documents published by organizations that have conducted prior research. The extraction
engine can search any number of heterogeneous data sources. If the data from a source are
consistently formatted, EVA can gather such data automatically. Otherwise, EVA either
probabilistically ranks likely ownership relationships for human review, or else offers an
interface for humans to manually enter the data. The database stores the information as a
directed network, enabling calculation of overall connectedness and identification of
prominent companies. The browser-based visualization interface lets users display subsets
of the network and explore different paths among companies. We use the standard
network analysis software package UCINET [4] and additional custom scripts for data
analysis.
Figure 1. EVA data flow diagram.
Our current sources include three online document collections:
Public company 10-K annual reports filed with the U.S. Securities and Exchange
Commission [26]
Columbia Journalism Review’s Who Owns What [18]
The Industry Standard’s online Deal Tracker Database [15]
Corporate annual reports (10-Ks) are primary sources because EVA extracts ownership
data from paragraphs in these free-text documents. Columbia Journalism Review (CJR)
and the Industry Standard are both secondary sources as the ownership data contained in
these documents were gathered, compiled, and verified by other researchers. All
relationships were valid at some point between January 1, 1998, and December 31, 2001.
Figure 2a shows the number of companies for which each source found at least one
relationship, and Figure 2b shows the number of relationships found by each source. Few
relationships were found by more than one source. This lack of overlap suggests that the

5
coverage of the data set can be further improved with additional data sources. For
example, Mergerstat and Thomson Financial are two leading sources of mergers and
acquisitions data, commercially compiled by teams of full-time research staff. Discussions
with one vendor reveal a data set for the telecommunications and media industries that
contains slightly fewer relationships than our data set.
CJR
IndustryStandard SEC 10-Ks
Figure 2a. Number of companies for whicheach source found at least one relationship
(Total = 7,253)
168
9262
2,259 427
4,200
45
CJR
IndustryStandard SEC 10-Ks
Figure 2b. Number of relationships found byeach source (Total = 6,726)
32
476
1,711 571
4,357
2
3 Probabilistic Extraction of Relationships from Free-text
EVA uses probabilistic extraction techniques to extract ownership relationships from
primary sources such as corporate annual reports submitted to the SEC (10-K documents).
The main goal of the extraction heuristic is to minimize the human effort required to
conduct primary research. The list below breaks down the time it took to design and run
the free-text extraction engine in EVA:
160 hours to code and test
20 hours to download and process documents (3,374 documents, 1.5GB of text)
30 hours to manually train the system and evaluate the top 3,249 relationship
paragraphs
Since the extraction code can be reused, EVA would require significantly less time to
process additional sources of data.3
3 We conducted a rough experiment to approximate how much time EVA can save researchers looking for acquisition data in 10-K documents. We timed ourselves reading sampled 10-K documents and manually recorded each acquisition that we found. We calculated that we would have needed about 293 hours to process the entire 1.5GB of text. This is about six times more than the 50 hours needed by the EVA extraction engine to process an additional 1.5GB of data.
6
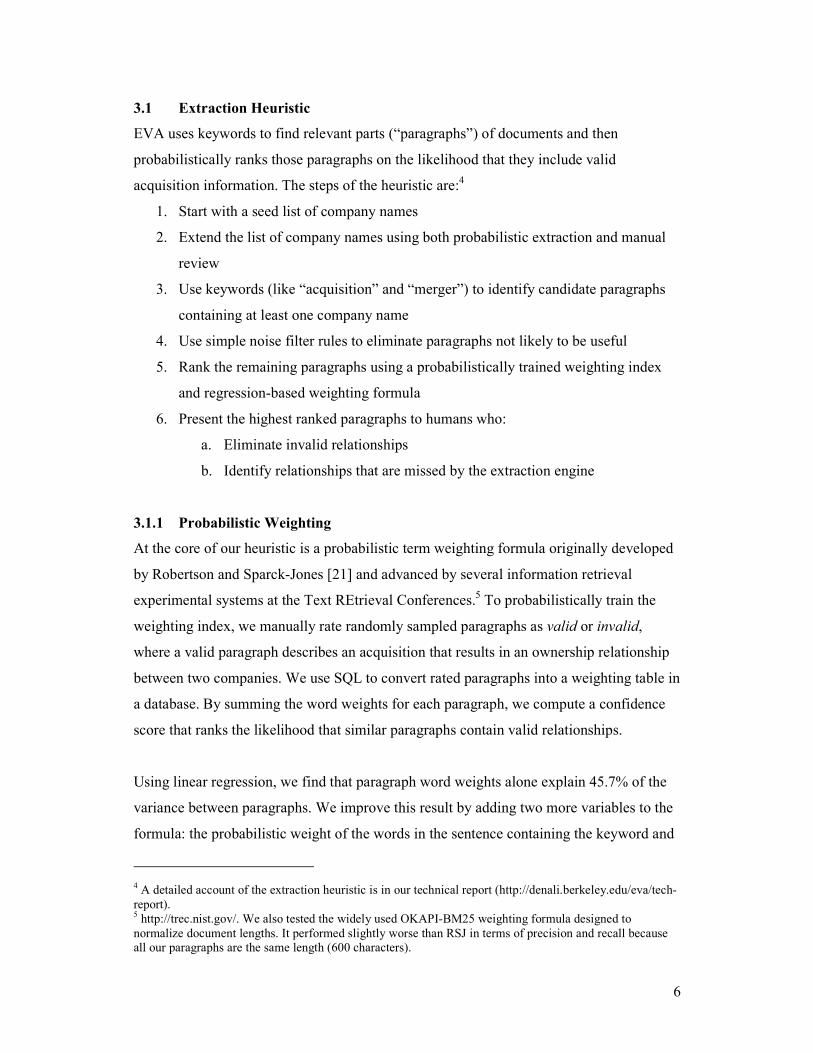
3.1 Extraction Heuristic
EVA uses keywords to find relevant parts (“paragraphs”) of documents and then
probabilistically ranks those paragraphs on the likelihood that they include valid
acquisition information. The steps of the heuristic are:4
1. Start with a seed list of company names
2. Extend the list of company names using both probabilistic extraction and manual
review
3. Use keywords (like “acquisition” and “merger”) to identify candidate paragraphs
containing at least one company name
4. Use simple noise filter rules to eliminate paragraphs not likely to be useful
5. Rank the remaining paragraphs using a probabilistically trained weighting index
and regression-based weighting formula
6. Present the highest ranked paragraphs to humans who:
a. Eliminate invalid relationships
b. Identify relationships that are missed by the extraction engine
3.1.1 Probabilistic Weighting
At the core of our heuristic is a probabilistic term weighting formula originally developed
by Robertson and Sparck-Jones [21] and advanced by several information retrieval
experimental systems at the Text REtrieval Conferences.5 To probabilistically train the
weighting index, we manually rate randomly sampled paragraphs as valid or invalid,
where a valid paragraph describes an acquisition that results in an ownership relationship
between two companies. We use SQL to convert rated paragraphs into a weighting table in
a database. By summing the word weights for each paragraph, we compute a confidence
score that ranks the likelihood that similar paragraphs contain valid relationships.
Using linear regression, we find that paragraph word weights alone explain 45.7% of the
variance between paragraphs. We improve this result by adding two more variables to the
formula: the probabilistic weight of the words in the sentence containing the keyword and
4 A detailed account of the extraction heuristic is in our technical report (http://denali.berkeley.edu/eva/tech-report). 5 http://trec.nist.gov/. We also tested the widely used OKAPI-BM25 weighting formula designed to normalize document lengths. It performed slightly worse than RSJ in terms of precision and recall because all our paragraphs are the same length (600 characters).

7
the proximity of the keyword to the acquired company’s name. Using linear regression a
second time, we add together the paragraph weights, sentence weights, and proximity
measures after multiplying them by their regression coefficients.6 The combined weighting
formula explains 52.4% of the variance and produces a ranking confidence value for each
paragraph.
3.1.2 Probabilistic Weighting Performance: Precision and Recall
Although the EVA extraction engine is primarily designed to save time, we do measure
precision and recall.7 We keep the 35% of paragraphs with the highest probabilistic
rankings for possible inclusion in our data set. Examining these paragraphs, we find that
the extraction module has a precision of 55.4% and a recall of 50.0%. This performance
compares favorably with the performance of DARPA-sponsored Message Understanding
Conferences (MUC) systems,8 where good performance in simpler event extraction
domains translated to precision and recall measurements between 50% and 70% [14].
We present two examples of false positives that underscore the difficulty in automatic
extraction of acquisition events that result in changes in equity holdings.9 In many cases,
the language in 10-K documents is so ambiguous that even humans are confused. The first
example comes from a 10-K filed by Aether Systems and contains an acquisition that does
not meet our definition of equity ownership. At one point, text in the document appears to
describe Aether’s acquisition of the company Motient:
6 We use a linear regression method similar to the logistic regression technique by Cooper, Gey and Dabney [9] to estimate weighting formula coefficients. 7 Precision is the number of records returned from a search satisfying a query, divided by the total number of records returned from a search. Thus, if four of ten records returned by a search engine were valid, then precision would be 40% (4 / 10). Recall is the number of good records returned from a search, divided by the total number of good records in all documents searched. Thus, if there are eight total good records, but the search engine only returned four, then recall would be 50% (4 / 8). For these calculations, we need to know the number of good relationships that EVA finds for a given set of documents, as well as the total number of good relationships in those documents. The first metric simply requires that we track the number of good acquisitions found during our reviews. The second metric is more difficult; without reading all documents thoroughly, we do not know how many acquisitions are contained in all the documents. However, while reviewing paragraphs we search for additional acquisition data to manually enter, so as an approximation we use the total number of acquisitions found during the review phase. 8 MUC evaluations helped researchers set standards to evaluate the performance of tasks such as named entity recognition (NER), entity attribute recognition, entity relationship fact-finding, and entity event finding. Soderland compares several successful information extraction systems that MUC participants have created [23]. 9 Freitag points out additional difficulties when extracting information within the “acquisition” domain [12].

8
… In connection with the acquisitions of Cerulean, Sinope, RTS and Motient, the
Company [Aether Systems] has accrued $29,800 as of December 31, 2000 for the
remaining portion of the purchase price. Such amount has been allocated to the fair value
of the assets purchased and the liabilities assumed… [27]
Subsequent text, however, clarifies that Aether has simply acquired one of Motient’s
business units, rather than any equity in Motient itself:
… On November 30, 2000, we [Aether Systems] acquired Motient's retail transportation
business unit for $49.2 million in cash… [27]
Companies routinely report acquisitions of assets in their 10-K filings, but by definition
these events do not give rise to equity ownerships. Furthermore, these acquisitions are
sometimes financed by the equity of the acquirer, so a transfer of equity ownership can
actually occur in the reverse direction. In this second example, the excerpt from the 10-K
filing of Nextel Communications is tagged as containing an acquisition event that results
in Nextel’s becoming an equity owner of Motorola:
… we [Nextel] acquired all of Motorola’s 800 MHz SMR licenses in the continental
United States in exchange for 41.7 million shares of class A common stock and 17.8
million shares of nonvoting class B common stock … [28]
However, human review reveals that Nextel acquired some licenses from Motorola using
its own stock, and therefore Motorola emerges as an equity owner of Nextel as a result of
this transaction.
Precision and recall can be improved using category filters. As the examples indicate, we
want the extraction engine to exclude acquisition events such as asset acquisitions,
proposed, pending and future acquisitions, and acquisitions of warrants. We create
category filters that probabilistically identify the type of acquisition contained in each
paragraph. Paragraphs with a high likelihood of being in a category other than equity
ownership are eliminated and excluded from manual review. Experiments on our data set
show that, given a fixed number of paragraphs, category filters can increase precision up
to 6% (Figure 3). Although category filters do not eliminate the need for human review,
they do allow reviewers to examine fewer paragraphs yet still receive a higher yield.

9
Figure 3. Category filter improves extraction precision.
More fundamentally, the ambiguity of free text can be avoided altogether by forming
documents according to a semantic structure such as the XML schema in Appendix 1.
How such a schema might be implemented (required or optional inclusion in corporate
filings) would be a matter of public policy. If used, XML could encourage a more
transparent understanding of major ownership events.
3.1.3 Manual Evaluation
The final step in the free-text extraction process is to manually review the top 35% ranked
paragraphs. Ranking the paragraphs allows human reviewers to focus first on paragraphs
that are most likely to be useful. A web interface allows reviewers to quickly accept,
reject, reverse, and add relationships. Altogether, the manual evaluation process takes
approximately 22 seconds per paragraph. Since multiple paragraphs often describe the
same acquisition, it takes reviewers an average of 1.6 minutes to confirm or reject each
possible acquisition. We add the approved relationships to the EVA data set, which has a
precision level of 100%.
4 Information Visualization
Understanding networks can be difficult without a visual explanation. Graphs have long
been the primary method of representing social networks [5]. Because EVA treats
corporate ownership as a social network, it is logical to expect a graphical component to
this work. Graphical representation reveals a macroscopic view of an industry, plus sub-
structures that would otherwise remain hidden. Following the principles of information
10
visualization [25], our goal is to present this information without overwhelming the user or
cluttering the display.
The browser-based visualization prototype displays the ownership network stored in the
EVA database. Users can search for companies, generate ownership graphs, and read
source documents. Given the appropriate data, the interface can also visualize changes to
ownership networks over time.
4.1 Related Visualization Work
Visualizing ownership networks is an interdisciplinary endeavor drawing from the fields
of social network analysis, business intelligence, media criticism, and information design.
Specific works related to the EVA visualization tool therefore include graphics and
software from several sources. [22] contains an example of a static graphic image
explaining media mergers described in a news article. Orgnet10 and TheyRule11 are two
applets that display information similar to the EVA data set. A few visualizations deal
directly with corporate ownership relationships. Strategic Landscapes from Goldridge12
generates textual reports and graphical maps of companies related by many factors,
including ownership. The Centre for Global Corporate Positioning13 offers a similar
service.
4.2 Graphical Interface
Figure 4 shows an overview of the interface prototype. Major elements include the search
feature, the graph display panel, and the metadata panel. Users generate graphs by first
searching for specific companies and then adding the ownership networks of those
companies to the display panel. The display panel is a Java applet implementing a version
of the spring embedder graphing algorithm described in [10]. The metadata panel on the
left lists details about the selected company, including links to the source documents
substantiating that company’s ownership relationships. Figure 5 shows the graph’s legend
with definitions for colors, arrows, node sizes, and borders.
10 http://www.orgnet.com/inetindustry.html 11 http://theyrule.orgo.org/ 12 http://www.goldridge.net/ 13 http://www.cgcpmaps.com/demo.php

11
Figure 4. EVA display.
Figure 5. Legend for EVA display.
For every company displayed on the screen, all parents (owners) of that company are also
visible. This approach helps users to quickly identify top-level companies, see how local
clusters fit into the overall network, and identify previously hidden relationships. As an
example, a recent user of the interface selected Sunset Magazine, and to his surprise found
that AOL-Time Warner was an indirect owner (Figure 6). This discovery provided an
explanation for the AOL trial disk enclosed between the pages of his latest issue of Sunset

12
Magazine. Figure 6 shows the indirect relationship between Sunset Magazine and AOL-
Time Warner.
Figure 6. All parents are automatically added to the display along with the selected
company. Here, Sunset Magazine is shown with its parents, Time Warner and AOL-Time Warner.
Ownership paths are browsable [13] to allow visual exploration of subsidiaries in limited
screen space. Users navigate networks by double clicking on nodes with thick borders.
This action “opens” the node, displaying all its holdings (children). To “close” a node,
users double click on it to hide its holdings. Figure 7 shows how a user can discover a path
between Bertelsmann and AT&T simply by displaying the children of AOL-Time Warner.
a) b)
Figure 7. a) Parent companies appear automatically when a company displays in the EVA interface. Here, AOL-Time Warner has been added to the screen. b) Double clicking the node AOL-Time Warner reveals its direct subsidiaries and their other
owners.
5 Network Analysis
In this section, we analyze our data set as a social network. Our results describe the
landscape of the network, identify prominent companies in our data set, and illustrate the
insights revealed by applying social network analysis to corporate ownership structures.

13
To summarize our findings:
Two metrics follow power law distributions: company degree (the number of
relationships each company has) and component size (number of companies
connected together);
The largest component contains 53.6% of the companies in the network;
Ten companies are the parents for over 24% of all relationships;
87% of companies are involved in at least one ownership relationship;
Only 10% of companies are involved in more than one ownership relationship;
The greatest outdegree (number of holdings) for a company is 552; the greatest
indegree (number of owners) for a company is six;
The removal of small a proportion of companies (8.9%) and relationships (2%)
would produce non-trivial changes to the network topology (in terms of increasing
component count) if removed.
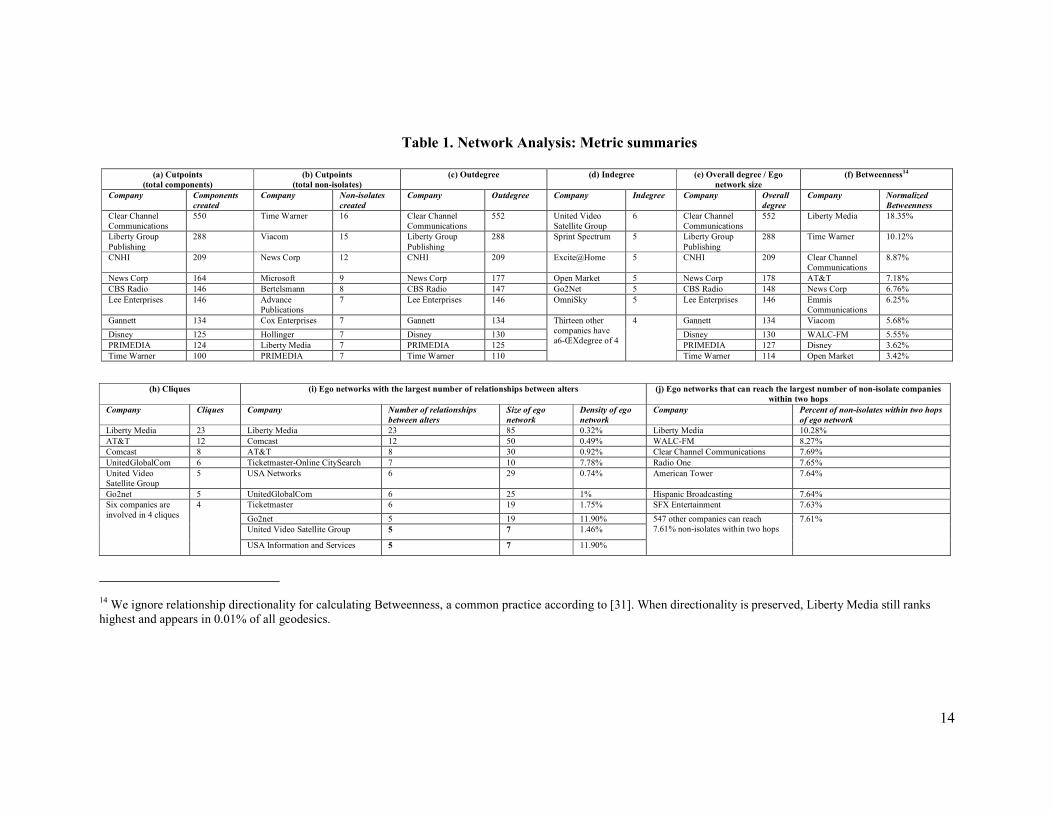
Table 1 is a summary of the companies with the largest values for various network
metrics. We refer to this table throughout this section.
5.1 Related Network Analysis Work
Network analysis has been applied to many different fields, including: 1) engineered
systems, such as the Internet [11], the world wide web [6,16], and electric power grids
[32]; 2) biological systems, such as the neural network of the Caenorhabditis elegans [32];
and 3) social networks, such as movie actor collaboration [1] and terrorist networks [20].
Social network analysis has also been applied to corporate ownership networks [3,7]. For
example, [24] and [30] investigate changes to the ownership networks of Hungarian
companies during the 1990’s and show how these networks dissolved after a period of
industrial privatization.
We base our network analysis methods on the principles outlined in [31], particularly on
those used to determine network prominence. We use UCINET 5 [4] to calculate the
prominence measurements including degree, Freeman Betweenness, cliques, cutpoints,
bridges, and network size.
14
Table 1. Network Analysis: Metric summaries
(h) Cliques (i) Ego networks with the largest number of relationships between alters (j) Ego networks that can reach the largest number of non-isolate companies
within two hops Company Cliques Company
Number of relationships between alters
Size of ego network
Density of ego network
Company Percent of non-isolates within two hops of ego network
Liberty Media 23 Liberty Media 23 85 0.32% Liberty Media 10.28% AT&T 12 Comcast 12 50 0.49% WALC-FM 8.27% Comcast 8 AT&T 8 30 0.92% Clear Channel Communications 7.69% UnitedGlobalCom 6 Ticketmaster-Online CitySearch 7 10 7.78% Radio One 7.65% United Video Satellite Group
5 USA Networks 6 29 0.74% American Tower 7.64%
Go2net 5 UnitedGlobalCom 6 25 1% Hispanic Broadcasting 7.64% Ticketmaster 6 19 1.75% SFX Entertainment 7.63% Go2net 5 19 11.90% United Video Satellite Group 5 7 1.46%
Six companies are involved in 4 cliques
4
USA Information and Services 5 7 11.90%
547 other companies can reach 7.61% non-isolates within two hops
7.61%
14 We ignore relationship directionality for calculating Betweenness, a common practice according to [31]. When directionality is preserved, Liberty Media still ranks highest and appears in 0.01% of all geodesics.
(a) Cutpoints (total components)
(b) Cutpoints (total non-isolates)
(c) Outdegree (d) Indegree (e) Overall degree / Ego network size
(f) Betweenness14
Company Components created
Company Non-isolates created
Company Outdegree Company Indegree Company Overall degree
Company Normalized Betweenness
Clear Channel Communications
550 Time Warner 16 Clear Channel Communications
552 United Video Satellite Group
6 Clear Channel Communications
552 Liberty Media 18.35%
Liberty Group Publishing
288 Viacom 15 Liberty Group Publishing
288 Sprint Spectrum 5 Liberty Group Publishing
288 Time Warner 10.12%
CNHI 209 News Corp 12 CNHI 209 Excite@Home 5 CNHI 209 Clear Channel Communications
8.87%
News Corp 164 Microsoft 9 News Corp 177 Open Market 5 News Corp 178 AT&T 7.18% CBS Radio 146 Bertelsmann 8 CBS Radio 147 Go2Net 5 CBS Radio 148 News Corp 6.76% Lee Enterprises 146 Advance
Publications 7 Lee Enterprises 146 OmniSky 5 Lee Enterprises 146 Emmis
Communications 6.25%
Gannett 134 Cox Enterprises 7 Gannett 134 Gannett 134 Viacom 5.68% Disney 125 Hollinger 7 Disney 130 Disney 130 WALC-FM 5.55% PRIMEDIA 124 Liberty Media 7 PRIMEDIA 125 PRIMEDIA 127 Disney 3.62% Time Warner 100 PRIMEDIA 7 Time Warner 110
Thirteen other companies have a6-ŒXdegree of 4
4
Time Warner 114 Open Market 3.42%

15
5.2 Network Topology
5.2.1 Component Distribution
A component is a group of nodes connected only to each other, also called a maximal
connected sub-graph. The largest component in our data set contains 4,475 companies, or
53.6% of the entire network, while the next largest component contains only 3.5% of the
network. We plot component sizes in descending rank order (Figure 8) and observe that
component size follows a power law distribution with a slope α = -0.56 (r2 = 0.87). In
other words, the i-th largest component has a size of c * iα, where c is a constant. The fit
improves further if we consider separately the top ten components (α = -2.23, r2 = 0.96)
and the remaining components (α = -0.48, r2 = 0.89).
Figure 8. Population distribution of all components, rank-ordered by size.
5.2.2 Density
Density refers to the number of relationships in the network, divided by the maximum
possible number of relationships among all nodes in the network. Given a network of size
N, the maximum number of relationships is (N)(N-1)/2. A dense network would indicate
overall strong connectivity while a sparse network would indicate weak connectivity. The
maximum possible number of relationships among the 8,343 companies in our database is
34,798,653. However, we have identified only 6,726 relationships, or fewer than 0.02% of
the maximum possible. Thus, we conclude that the network is sparsely connected.
However, a large network with a low density measurement can still have prominent actors
[31]. Indeed, we find several companies whose prominence measurements are
significantly higher than those for most other companies in the network (see Section 5.4).

16
Table 2 groups companies by role (parent, child, both, or neither). Parents that are roots
and children that are leaves only participate in one relationship. Isolates participate in no
relationships. The population distribution of these node types explains why network
density is so low; only 10% of companies participate in more than one relationship.
Table 2. Population distribution by ownership role Ownership role Role Subtype
Number of
children
Number of
parents
Population
distribution
Root 1 0 8% Parent only Transmitter
Star > 1 0 3%
Leaf 0 1 69% Child only Receiver
Magnet 0 > 1 2%
Link 1 1 1%
>1 >=1
Parent and child Carrier
Hub
>=1 >1
4%
None Isolate 0 0 13%
5.2.3 Depth and Diameter
Depth is defined as the longest shortest path (longest geodesic) between two nodes,
considering the direction of each relationship. Conversely, diameter is the longest geodesic
regardless of relationship directionality. The depth of the EVA network is 12 relationships,
and its diameter is 23, both occurring in the largest component. If the largest component
were excluded, the depth would only be three and the diameter four. Thus, the largest
component is four times “deeper” and over five times “wider” than the next deepest and
widest components. Among all companies in the largest component, Comcast has the
shortest radius and the greatest depth. That is, ignoring relationship directionality, other
companies have longer shortest paths to the edge of the component. Yet, preserving
relationship directionality, no other company has a longer shortest path to the edge of the
component. Comcast is therefore in the center of the component when directionality is
ignored, and at the top when relationship directionality is preserved.
5.3 Sensitivity Analysis: Cutpoints and Bridges
We examine the robustness of the overall network topology by quantifying the number of
cutpoints and bridges in the network. Cutpoints and bridges are defined as nodes and links
that, if removed, would change the network topology by increasing the number of

17
components. In this context, cutpoints and bridges are important companies and ownership
relationships that tie different parts of the industries together.
We find that 742 companies (8.9% of total) are cutpoints, and 273 of these (3.3% of total)
would leave behind two or more non-isolate components, i.e., components of size greater
than one. Table 1(a) lists the cutpoints whose removal would create the most additional
components. With its numerous holdings, radio conglomerate Clear Channel tops the list,
creating 550 components when removed from the network. Table 1(b) lists the cutpoints
whose removal would create the most additional non-isolate components. Time Warner, if
removed from the network, would create 18 non-isolate components.
We find that 89% of the relationships in our data set are bridges. This number is high
because so many companies participate in only one relationship (see Table 2). A
relationship attached to either a leaf or a root company is always a bridge since its removal
isolates the leaf or root from the rest of the network. Only 2% of relationships, however,
are bridges that do not join leaves or roots; removing these relationships creates
disconnected components that contain two or more companies.
5.4 Prominence
Identifying which nodes are the most important, or prominent, in a network is a common
task in social network analysis. A company ownership network presents an interesting
twist since certain well-known companies are often assumed to be prominent merely
because of their reputation or name recognition. However, the most prominent companies
may turn out to be lesser-known but well-positioned companies in the network. We
examine two measurements of prominence: degree and Freeman Betweenness.
5.4.1 Degree
Degree measures the number of ownership relationships in which a company is engaged,
either as a parent (outdegree), as a child (indegree), or both (overall degree). In social
network analysis, outdegree indicates expansiveness, indegree indicates popularity, and
overall degree indicates activity [31]. These characterizations are likewise valid for our
network; companies with high outdegrees have expanded operations, companies with high
indegrees have attracted investment from other companies, and companies with high

18
overall degrees are very involved in corporate ownership. Table 1(c-e) indicates the
companies with the highest outdegrees, indegrees, and overall degrees. Clear Channel has
the highest out- and total degree, and United Video Satellite Group, with many corporate
investors, has the highest indegree.
Figure 9 plots the degree distributions in descending rank order. Like the plot for
component size (Figure 8), these plots reveal power law distributions. We use linear
regression to compute α = -0.96 (r2 = 0.94) for outdegree, α = -0.13 (r2 = 0.51) for
indegree, and α = -0.89 (r2 = 0.97) for overall degree. From these calculations, we
conclude that outdegree and overall degree follow power law distributions. A power law
distribution for degree means that D = c * iα. That is, the i-th largest company degree = c *
iα, where c is a constant. A power law distribution for company degree not only is
consistent with findings showing power law degree distributions in other naturally
occurring, social, and engineered networks as reported in [2,11], but also suggests that
commonly hypothesized growth models involving incremental growth and preferential
attachment may be at work here.
Figure 9. Distribution of node degrees
Only 16% of companies have an outdegree of one or more, while 76% have an indegree of
one or more. In other words, most companies are not owners themselves but rather owned
by another company. The ten companies with the greatest outdegrees are the parents for
24% of all relationships, and six of them are not owned by any other company. Ownership
is therefore concentrated among a few companies, most of which are located at the top of
the network. The converse does not hold true for indegree, however; most companies with
high indegrees are not at the bottom of the network. Rather, 17 of the top 20 companies

19
are also owners themselves. Finally, overall degree is nearly identical to outdegree
because over 90% of companies have an indegree of zero or one. Thus, if a company is
active in the network, it is likely doing so as a parent rather than as a child. This finding is
consistent not only with the similar values for α as computed above in the linear
regressions, but also with the similarity between the first and third graphs in Figure 9.
Table 3 provides summary statistics for the degree measurements. We observe that
outdegree and overall degree have nearly identical variances, which are much greater than
indegree variance. For most companies, overall degree is equal to outdegree plus one.
Table 3. Degree summary statistics OUTDEGREE INDEGREE OVERALL DEGREE
Mean Median Std Dev Mean Median Std Dev Mean Median Std Dev
All companies 0.93 0 9.67 0.93 1 0.46 1.85 1 9.65
Companies with
outdegree > 0
4.97 1 21.94 0.43 1 0.79 5.41 2 21.99
Companies with
indegree > 0
0.42 0 4.53 1.06 1 0.32 1.48 1 4.58
5.4.2 Freeman Betweenness
Freeman Betweenness measures how often a node appears in the shortest path between all
other node pairs, regardless of relationship directionality. Nodes with high Betweenness
values are like well-placed hubs in an airport system, linking together more distant
outliers. In our network, only 841 companies (10% of the network) have a Betweenness
value greater than zero. Of those 841 companies, several are between many pairs of
companies. Table 1(f) lists companies with the top Freeman Betweenness measurements.
In particular, Liberty Media lies on over 18% of all shortest paths. In other words, when
two companies are indirectly connected through one or more intermediate companies,
18% of the time Liberty Media is one of those intermediaries.
5.5 Analysis of Important Subsets of the Network
5.5.1 Bi-Components
A bi-component is a group of nodes that could not become disconnected by the removal of
just one node. In a bi-component there is at the very least a circular path that loops through
all companies; often, though, there are additional relationships within the bi-component. In
our network, bi-components are significant because they indicate strong connections

20
among groups of companies. We found 28 bi-components containing three or more
companies. The largest bi-component contains 234 companies and includes AOL-Time
Warner, AT&T, Bertelsmann, British Telecom, CBS, Cisco, Comcast, Deutsche Telecom,
Disney, Intel, MCI WorldCom, Microsoft, NBC, Sony, and Yahoo!. Its density is 1.4%,
which is 72 times greater than the density of the overall network.
5.5.2 Cliques
A clique is a group of nodes that all have a direct relationship to each other. In our case,
cliques are significant because they indicate the thickest webs of ownership within a
network that is otherwise quite sparse. We found 136 companies participating in 75
ownership cliques. Only one of these cliques has four members; all others have three. The
ten companies involved in the most cliques are listed in Table 1(h). Liberty Media
outranks all other companies, participating in 23 different cliques.
5.5.3 Ego Networks
Every node has an ego network, consisting of itself (the ego) and all nodes to which it is
immediately connected (its alters). Because the number of alters equals the sum of a
node’s indegree and outdegree, the overall degree values in Table 1(e) equal the sizes of
the largest ego networks. An ego network indicates the size and composition of a
company’s close circle. In the EVA network, most ego networks are small, a result which
is not surprising given that most companies are only involved in one relationship. Most
ego networks are also sparse; only 130 ego networks contain additional relationships
between two alters. Thus, if two companies have relationships with a common third
company, there is a low probability that those two companies will have a relationship with
each other. This observation supports the finding that ownership is concentrated among a
few companies, rather than spread out among many companies.
Table 1(i) lists the companies whose ego networks contain the largest number of
relationships between alters. Liberty Media has the largest ego network, with 85 alters and
23 relationships among those alters. Table 1(j) lists the companies whose ego networks
can reach within two hops the greatest percentage of non-isolate companies (reachability).
Over ten percent of non-isolate companies can be reached within two hops of Liberty
Media’s ego network.
21
6 Discussion
Viewing ownership as a social network allows us to analyze the shape and scope of an
industry and to identify the companies that play important investment roles. Our analysis
of the telecommunications and media industry reveals a sparse but well connected network
where ownership is concentrated among a handful of influential companies. However, the
network topology we extract and analyze is only a snapshot of a continually changing
industry landscape. Each new merger, acquisition, or divestiture can potentially alter the
topology and the industry in a fundamental way. Comparative analyses can and should be
performed for other industries and across time periods to help shed light on the
significance of our findings.
In this analysis, we characterize paths in an ownership network as influence within an
industry in a social sense. Here, companies with small investments in many companies
surface as prominent while those with a few major holdings may actually hold more
market power. We conceive of ownership as a flow of funds, but it may also indicate
control over what kinds of content are published over which channels, or how resources
such as customer records or technical know-how are shared between companies. Precisely
how ownership translates into flows of information or editorial influence is a question for
future research.
Ultimately, the validity of the network analysis rests upon the correctness and
completeness of the data produced by the information extraction process. State-of-the-art
free-text information extraction systems can only achieve 50-70% precision and recall for
this problem domain, necessitating manual review to achieve the 100% precision
requirement of EVA. We believe the use of extensible markup language (XML) in the
authoring of corporate filings will remove the ambiguity of free-text and dramatically
improve extraction performance and therefore data quality. The SEC EDGAR (Electronic
Data Gathering, Analysis and Retrieval) system is already capable of processing corporate
filings with markups for company names, attributes, and simple accounting data. As the
SEC proposes rule changes to require more accurate, comprehensive, and timely
disclosure by companies [29], we urge the Commission to adopt a standardized XML
schema (such as the one described in Section 3 and Appendix 1) for the reporting of
ownership and other corporate relationships and transactions.
22
7 Conclusion
EVA is a prototype research tool for extracting, visualizing, and analyzing corporate
ownership relationships as a directed social network. Applying EVA to the
telecommunications and media industries, we find that over half the companies are
connected to one another in a single, large component, and the top ten companies account
for 24% of ownership relationships. Liberty Media, Clear Channel Communications,
AT&T, Comcast, and Time Warner appear repeatedly in lists of companies with high
network analysis measurements, suggesting that these companies are among the most
prominent companies in the network. More generally, we show that information retrieval,
extraction, storage, and visualization techniques can be used to build a cost-effective
system that gathers corporate ownership information from multiple data sources and
presents it in a meaningful, analyzable format. As corporate relationships become
increasingly complex, tools such as EVA can reveal the shape of ownership networks and
enhance the benefits of corporate disclosure by bringing greater transparency to public
discourse.
References
[1] Albert, R. and A. Barabasi, 2002. Statistical mechanics of complex networks. Reviews
of Modern Physics 74(47).
[2] Barabasi, A. and Albert, R. 1999. Emergence of scaling in random networks. Science
286:509-512.
[3] Berkowitz, S.D., P.J. Carrington, Y. Kotowitz, and L. Waverman. 1979. The
determination of enterprise groupings through combined ownership and directorship ties.
Social Networks 1: 391-413.
[4] Borgatti, S.P., M.G. Everett, and L.C. Freeman. 1999. UCINET 5.0 Version 1.00.
Natick: Analytic Technologies.
[5] Brandes , U., T. Raab, and D. Wagner. 2001. Exploratory Network Visualization:
Simultaneous Display of Actor Status and Connections. Journal of Social Structure 2(4).
[6] Broder, A., R. Kumar, F. Maghoul, P. Raghavan, S. Rajagopalan, R. Stata, A.
Tomkins, and J. Wiener. 2000. Graph Structure in the Web: experiments and models. In
Proceedings of the 9th International World Wide Web Conference, Amsterdam, The
Netherlands, May 15-19.

23
[7] Burt, R.S. 1983. Corporate Profits and Cooptation: networks of market constraints
and directorate ties in the American economy. New York: Academic Press.
[8] Compaine, B.M. and D. Gomery. 2000. Who Owns the Media?: competition and
concentration in the mass media industry, 3rd ed., Lawrence Erlbaum Associates: New
Jersey.
[9] Cooper, W. S., F.C. Gey, and D.P. Dabney. 1992. Probabilistic Retrieval Based on
Staged Logistic Regression. In Proceedings of the Fifteenth Annual International ACM
SIGIR Conference on Research and Development in Information Retrieval, Copenhagen,
Denmark, June 21-24, N.J. Belkin, P. Ingwersen, A.M. Pejtersen, eds.
[10] Eades, P. 1984. A heuristic for graph drawing. Congressus Numerantium, 42:149-
160.
[11] Faloutsos, M., P. Faloutsos, and C. Faloutsos. 1999. On Power Law Relationships
of the Internet Topology. Proceedings of ACM SIGCOMM'99.
[12] Freitag, D. 1998. Machine Learning for Information Extraction in Informal
Domains. Ph.D. dissertation, Carnegie Mellon University. Available from <http://reports-
archive.adm.cs.cmu.edu/anon/1999/CMU-CS-99-104.pdf>. [March 20, 2002].
[13] Gram, C. and G. Cockton. 1996. Design Principles for Interactive Software. New
York: Chapman & Hall.
[14] Grishman, R. 1997. Information Extraction: Techniques and Challenges.
Information Extraction (International Summer School SCIE-97), M.T. Pazienza, ed. New
York: Springer-Verlag.
[15] Industry Standard. Deal Tracker. 2001. Available from
<http://www.thestandard.com/search/ deals>. [June 30, 2001].
[16] Kleinberg, J. and S. Lawrence. 2001. The Structure of the Web. Science, 294,
1849-1850.
[17] Maremont, M., J. Hechinger and G. Zuckerman. 2002. Tyco to Tap Backup Credit
Lines, Shares Drop 19% Following News. The Wall Street Journal, Feb 5.
[18] Moore, A., ed. Who Owns What. Columbia Journalism Review web site. Available
from <http://www.cjr.org/owners/>. [October 1, 2001].
[19] Mueller, E.T. Making news understandable to computers. Available from
<http://www.signiform.com/newsextract/newsund.htm>. [March 31, 2000].
24
[20] Picarelli, J.T. 1998. Transnational threat indications and warning: The utility of
network analysis. In AAAI Fall Symposium on Artificial Intelligence and Link Analysis
Technical Report, October 23-25, Orlando, Florida.
[21] Robertson, S. E. and K. Sparck-Jones. 1976. Relevance weighting of search terms.
Journal of the American Society for Information Science. 27:129-146.
[22] Rosenwein, R. 2000. Why Media Mergers Matter. Brill's Content, January, 93-111.
[23] Soderland, S. 1999. Learning Information Extraction Rules for Semi-structured
and Free Text. Machine Learning. 34(1/3):233-272.
[24] Stark, D. and B. Vedres. 2001. Pathways of property transformation: Enterprise
network careers in Hungary, 1989-2000. Unpublished manuscript. Available from
<http://www.santafe.edu/sfi/publications/01wplist.html>. [March 20, 2002].
[25] Tufte, E.R. 1990. Envisioning Information. Cheshire: Graphics Press.
[26] U.S. Securities and Exchange Commission. 2002. EDGAR Form Pick Search.
Available from <http://www.sec.gov/edgar/searchedgar/formpick.htm>. [March 20, 2002].
[27] U.S. Securities and Exchange Commission. 2002. Aether Systems, Inc. Annual
report on form 10-K for the year ended December 31, 2000. Available at
<http://www.sec.gov/Archives/edgar/data/1093434/000095013301500380/w47071e10-
k.txt>. [March 4, 2002].
[28] U.S. Securities and Exchange Commission. 2002. Nextel Communications, Inc.
Annual report on form 10-K for the year ended December 31, 1998. Available from
<http://www.sec.gov/Archives/edgar/data/824169/0000950133-99-001031.txt>. [March 4,
2002]
[29] U.S. Securities and Exchange Commission. 2002. SEC Proposes Requiring
Certification of Quarterly and Annual Reports; Proposes New Form 8-K Disclosures and
Filing Deadlines. Press Release, June 12.
[30] Vedres, B. 2000. A Tulajdonosi Hálózatok Felbomlása (The Dissolution of
Ownership Networks). Közgazdasági Szemle (Hungarian Review of Economics) 47 (in
Hungarian) English version available at
<http://www.columbia.edu/~bv2002/pages/papers/pdf/discons.pdf>. [March 4, 2002].
[31] Wasserman, S. and K. Faust. 1994. Social Network Analysis. New York:
Cambridge University Press.
[32] Watts, D. and S. Strogatz. 1998. Collective dynamics of 'small world' networks.
Nature. 393:202-204.
25
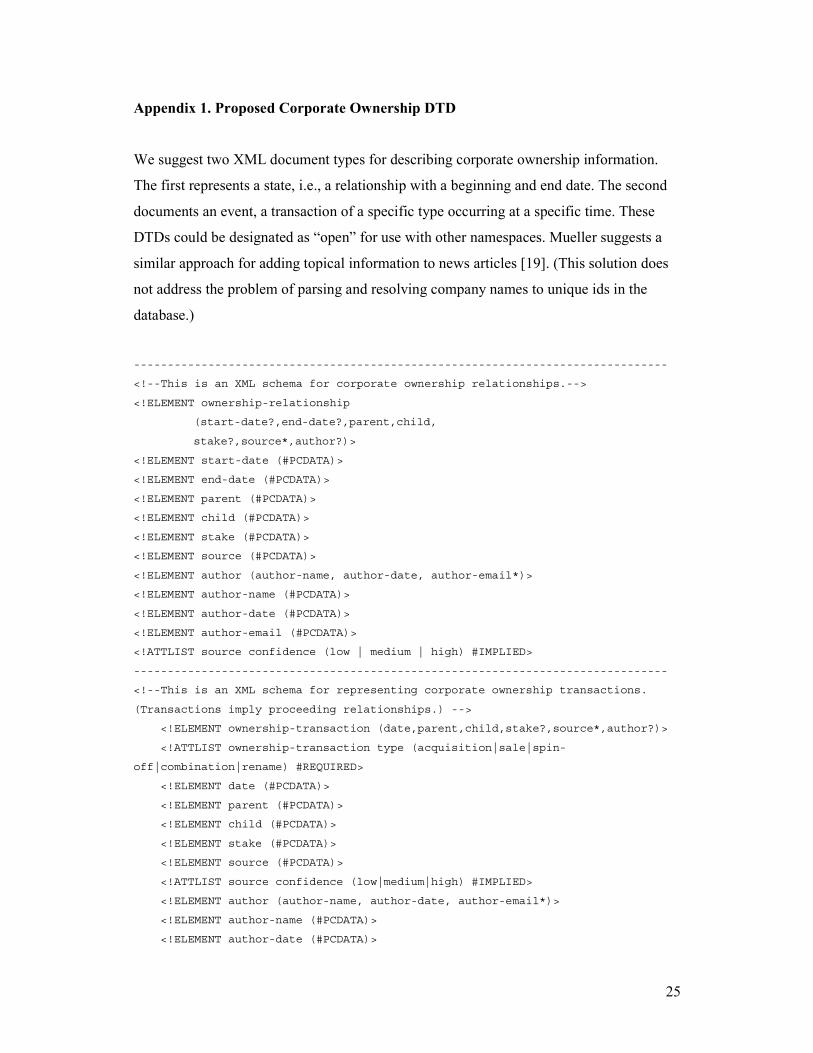
Appendix 1. Proposed Corporate Ownership DTD
We suggest two XML document types for describing corporate ownership information.
The first represents a state, i.e., a relationship with a beginning and end date. The second
documents an event, a transaction of a specific type occurring at a specific time. These
DTDs could be designated as “open” for use with other namespaces. Mueller suggests a
similar approach for adding topical information to news articles [19]. (This solution does
not address the problem of parsing and resolving company names to unique ids in the
database.)
-------------------------------------------------------------------------------
<!--This is an XML schema for corporate ownership relationships.-->
<!ELEMENT ownership-relationship
(start-date?,end-date?,parent,child,
stake?,source*,author?)>
<!ELEMENT start-date (#PCDATA)>
<!ELEMENT end-date (#PCDATA)>
<!ELEMENT parent (#PCDATA)>
<!ELEMENT child (#PCDATA)>
<!ELEMENT stake (#PCDATA)>
<!ELEMENT source (#PCDATA)>
<!ELEMENT author (author-name, author-date, author-email*)>
<!ELEMENT author-name (#PCDATA)>
<!ELEMENT author-date (#PCDATA)>
<!ELEMENT author-email (#PCDATA)>
<!ATTLIST source confidence (low | medium | high) #IMPLIED>
-------------------------------------------------------------------------------
<!--This is an XML schema for representing corporate ownership transactions.
(Transactions imply proceeding relationships.) -->
<!ELEMENT ownership-transaction (date,parent,child,stake?,source*,author?)>
<!ATTLIST ownership-transaction type (acquisition|sale|spin-
off|combination|rename) #REQUIRED>
<!ELEMENT date (#PCDATA)>
<!ELEMENT parent (#PCDATA)>
<!ELEMENT child (#PCDATA)>
<!ELEMENT stake (#PCDATA)>
<!ELEMENT source (#PCDATA)>
<!ATTLIST source confidence (low|medium|high) #IMPLIED>
<!ELEMENT author (author-name, author-date, author-email*)>
<!ELEMENT author-name (#PCDATA)>
<!ELEMENT author-date (#PCDATA)>

26
<!ELEMENT author-email (#PCDATA)>
-------------------------------------------------------------------------------
<!--This is an example ownership-relationship record. -->
<?xml version="1.0"?>
<!DOCTYPE ownership-relationship
SYSTEM "http://denali.berkeley.edu/eva/ownership_relationship.dtd">
<ownership-relationship>
<start-date>1999-02-18</start-date>
<parent>ATT</parent>
<child>TCI</child>
<stake>100</stake>
<source cont]‡°nce =
"high">http://www.fcc.gov/ccb/Mergers/ATT_TCI/</source>
<author>
<author-name> EVA Group (KN) </author-name>
<author-date>2001-12--30</author-date>
<author-email> [email protected] </author-email>
</author>
</ownership-relationship>
-------------------------------------------------------------------------------
<!-- This is an example ownership-transaction record. -->
<?xml version="1.0" ?>
<!DOCTYPE ownership-transaction SYSTEM
"http://denali.berkeley.edu/eva/ownership_transaction.dtd">
<ownership-transaction type = "acquisition">
<date>1999-02-18</date>
<parent> ATT </parent>
<child> TCI </child>
<stake> 100 </stake>
<source confidence = "high"> http://www.fcc.gov/ccb/Mergers/ATT_TCI/
</source>
<author>
<author-name> EVA Group (KN) </author-name>
<author-date> 2001-12-30 </author-date>
<author-email> [email protected] </author-email>
</author>
</ownership-transaction>