EUSO 2013 TEST 2 TASK 2.docx. 2013... · All paper used, including rough work ... You have 4 hours...
21
11 th EUROPEAN UNION SCIENCE OLYMPIAD Test 2 Task sheet Luxembourg, March 21 th , 2013 Renewable Energy Country: Language:
Transcript of EUSO 2013 TEST 2 TASK 2.docx. 2013... · All paper used, including rough work ... You have 4 hours...

11th EUROPEAN UNION SCIENCE OLYMPIAD
Test 2
Task sheet Luxembourg, March 21th, 2013
Renewable Energy
Country: Language:

$ COUNTRY – Test 2 – Task Sheet 2 ____________________________________________________________
General instructions
Wear a laboratory coat and safety glasses at all times within the laboratory.
Eating and drinking is prohibited in the laboratory.
Disposable gloves are provided and must be worn when handling chemicals.
All paper used, including rough work paper, must be handed in at the end of the experiment.
All results must be entered onto the answer sheet.
Your calculations must be handed in along with the answer sheet.
There is only one the answer sheet.
The tasks may be carried out in whatever order you wish.
The experiment consists of 5 Tasks and can be completed either individually or as a team.
You have 4 hours of time to complete Test 2
Task 1: 20 credit points
Task 2: 21 credit points
Task 3: 17 credit points
Task 4: 31 credit points
Task 5: 6 credit points
When you finish your tasks, leave everything on the desk. You are not allowed to take anything from the laboratory.

$ COUNTRY – Test 2 – Task Sheet 3 ____________________________________________________________
Biomethanation – Biogas from organic waste
Biomethanation, or the production of biogas, naturally occurs in fermentation processes in swamps, river beds of lakes as well as during digestive processes in the stomach of ruminants such as sheep, cows, and goats. These animals therefore contribute to the natural methane (CH4) emmisons; the same gas we find in fossil natural gas. Cellulose found in grass, hay and grain is broken down by microorganisms in the chambered stomach of ruminants in order to gain energy. During this digestive process methane is produced and belched out by the ruminants (50kg grass ingested/day/cow releases 350L of CH4 and 1500L of CO2/day/cow). However, methane is a powerful greenhouse gas because it traps about 20 times as much heat in our atmosphere as the same volume of carbon dioxide. Around 20% of global methane production is from farm animals.
Biomethanation (anaerobic digestion) is a biological process that decomposes organic matter into methane (CH4, almost insoluble in water), carbon dioxide (CO2, well soluble in water where it produces a weak acid), hydrogen sulphur (H2S, partly soluble in water and also acidic), and ammonia (NH3, highly soluble in water and moderate alkali). It is achieved in the absence of oxygen (anaerobia) by a complex consortium of microbes.
The following equation (Buswell & Müller, 1952 ; Boyle 1976) summarizes the process:
CcHhOoNnSs (Organic matter) + y H2O à (c-x) CO2 + x CH4 + n NH3 + s H2S
CARBOHYDRATES: C6H12O6 à 3CO2 + 3 CH4
Complex organic material (proteins, polysaccharides, lipids)
Mono- and Oligomers (amino acids, soluble sugars, peptides, long chain fatty acids, CO2, H2)
Intermediary products (alcohols, fatty acids, lactic acid, CO2, H2.)
H2 + CO2 Acetic Acid
CH4 + CO2
Acetogenesis
Acidogenesis
Hydrolysis
Acetotrophic Methanogenesis
Hydrogenotrophic Methanogenesis
Stepwise decomposition of organic matter into biogas, (Schnürer A. & A. Jarvis, 2010, Microbial Handbook for biogas plants, Swedish Gas Center Report 207)
Anaerobic oxidation

$ COUNTRY – Test 2 – Task Sheet 4 ____________________________________________________________ LIPIDS: C12H24O2 + 5 H2O à 3.5 CO2 + 8.5 CH4
PROTEINS: C13H25O7N3S + 6H2O à 6.5 CO2 + 6.5 CH4 + 3 NH3 + H2S
The complex and insoluble organic material is hydrolysed into soluble compounds that are then available for fermentation. The products are mainly volatile fatty acids (VFA, like acetic acid, propionic acid, butyric acid, etc.), hydrogen, and CO2. Microbes convert the large VFA into acetate. Finally, the methanogenic microbes convert acetate, CO2 and H2, into methane (CH4).
Biogas on-farm: alternative energy production
Mankind has harnessed the biogas process by constructing large anaerobic digesters, of some thousands of cubic meter capacity, that collect the produced biogas in a reservoir, and use the gas as fuel to produce heat and electricity. In recent years, the biogas has been upgraded to bio-methane and is injected into the natural gas grid.
Indeed large quantities of organic substrates from farms (animal effluents like manure or slurry, crop residues and energy crops) or supermarkets and households (perished food or greencuts from gardens) are readily available for feeding biogas digesters.
In Luxembourg 30 biogas plants with a total capacity of 34 million of m3 biogas /year are in production. About 23 million m3 of biogas are burned in Combined Heat and Power plants and 11 million m3 are converted to 6.6 millions m3 of CH4, to be injected into the gas grid.
The non-digested material, the digestate, is an excellent organic fertilizer for agriculture. It contains most of the minerals (N, P, K, Ca, Mg, etc.) required for the vegetal growth. Approximately 1 ton oil equivalent (toe) or 1000 m3 of natural gas is required for the chemical synthesis of 1 ton of reactive nitrogen. The biomethanation process contributes to the saving of fossil energy by recovering nitrogen from organic wastes.
Renewable energy for Alfred Bioman Mr Alfred Bioman has known about the benefits of renewable energies for many years. As a farmer he thought that he could make a contribution to the environment and implement a more sustainable energy practice. He was told that the government of Luxembourg supports the production of “green energy” by individuals. Mr Bioman’s farm in Luxembourg has about 100 milk cows and also produces large quantities of corn on his fields.
Four years ago, he decided to install a biogas plant next to his farm. This plant produces biogas that is converted to bio-methane and is injected directly into the natural gas grid. Mr Bioman is very satisfied
1 m3 of animal effluents à 30 m3 biogas 1 ton of greencut from households à 150 m3 biogas 1 m3 biogas à 2kWh electric energy & 4 kWh heat 1 m3 biogas has equivalent energy of 0.6 L petrol

$ COUNTRY – Test 2 – Task Sheet 5 ____________________________________________________________
with the energy production of his plant. But very negative for his energy balance is the outdoor swimming pool. However, he is dissatisfied with the energy consumption that his pool uses to heat the water. Mr Bioman would like to produce the energy for the swimming pool by solar energy and he is therefore contemplating the installation of solar collectors on the roof of his house.
In the following test teams, of the 2013 EUSO, will solve different problems concerning the biogas plant of Alfred Bioman and the
function of solar collectors:
• Task 1: Microbiology of biogas production • Task 2: Identifications of two gases in a biogas mixture • Task 3: Monitoring the biogas production process • Task 4: Determination of the specific heat capacity of a heat carrier liquid used
in a solar collector • Task 5: General questions about Biomethanation
TASK 1: Microbiology of biogas production
Alfred Bioman would like to know which organisms are involved in the methane production in his biogas plant. Therfore, you should analyse the digestate under a microscope with a magnification of 1000x. Your task will be to take a sample from the digestate, prepare a microscopic slide and identify the organisms involved.
Background information
Different kinds of microbes are involved in fermentation processes. In common beer and wine production yeast (Fungi) play an important role. About thirty years ago the discovery of microorganisms living in extreme conditions (high temperatures, salinity, pressure etc) was very important for the development of new techniques in Biology (i.e. PCR). These called Archaebacteria are quite different from the known Bacteria and are rather closely related to the Eukaryota.
The actual classification of living beings proposed by Woese et al. in 1990, assumes that a universal ancestor gave rise to different cell types, each representing a domain subdivided into six kingdoms as shown in the phylogenetic tree of life.

$ COUNTRY – Test 2 – Task Sheet 6 ____________________________________________________________ Materials used for this task
On the main desk of the laboratory: Digestate from a biogas plant (sample A); microbial culture (sample B); centrifuge. Per team: microscope and immersion oil; heating plate; stop watch; pasteur pipettes; Eppendorf tubes; test tubes; pair of tweezers; microscopic slides; gloves; Gram-colour staining set (R1, R2, R3, R4); access to tap water, marker pen; pencil; gum eraser; paper towels.
Experimental procedure
Step 1: Sampling. Sample (A): Take 1 mL of digestate (sample A) from the flask on the main desk in the laboratory and dilute it 10 times using tap water. Pour 1.5 mL from the diluted digestate into an Eppendorf tube and centrifuge it for one minute (centrifuge on main desk). Use the supernatant for the further experiments. Sample (B): Take 1 mL of the culture from sample (B) from the flask on the main desk in the laboratory into an Eppendorf tube. Step 2: Heat fixation. Turn on the heating plate and regulate the temperature to 100-120°C. You should prepare two microscope slides, one from your digestate (sample A) and one from sample B. Using a pencil, label the slides A and B, accordingly. Lay down the microscope slides on the heating plate. Take 0.5 mL of each sample and distribute evenly on the surface of the corresponding microscope slide. Leave the slides on the heating plate for heat fixation until all the water has evaporated. Using the tweezers, take the slides off the hotplate and leave them on the bench for a while to cool down. Step 3: Colouring. In order to be able to make an observation of the microorganisms present, you have to stain the fixed sample. A common technique in microbiology is the Gram colour staining. Use gloves and tweezers to handle the samples. For colouring we will use the immersion technique in staining cuvettes with three different dyes. Follow the instructions shown below: Gram staining (general information about Gram staining can be found in the Appendix at the end of this paper!)
1. Immerse the sample slides in crystal violet dye (R1) for 1min 30 seconds
2. Clean the slides under gently running tap water for 30 seconds 3. Immerse the slides in Lugol’s iodine solution (R2) for 3 minutes 4. Clean the slides under gently running tap water for 30 seconds 5. Dip the slides for 5-10 seconds in the decolourizing solution (R3)
containing alcohol and acetone 6. Clean the slides under running tap water for 30 seconds 7. Immerse the slides in Safranin solution (R4) for 1 minute 8. Clean the slides under gently running tap water for 30 seconds 9. To dry, leave the slides on the hotplate for 10 seconds

$ COUNTRY – Test 2 – Task Sheet 7 ____________________________________________________________ Step 4: Observation. You may now analyse the samples with a microscope. You do not need to cover your preparation with a cover slip. Start your observation with a 10x and then 40x lens. For final magnification of 1000x, you will have to use the oil immersion technique. You will need to place a drop of immersion oil between the sample and the lens of the microscope.
Joker: If you do not know how to perform the oil immersion technique, ask the laboratory assistant for a Joker. This will cost you 3 marks!
If you are not satisfied with your slide preparation you may consider preparing new slides. Evaluation of the observations
1. At the beginning, have a look at the general colouring of your samples and give a preliminary assessment of the Gram staining by marking with an (X) on the Answer sheet (Answer 1.1).
2. Observe the sample slide under the microscope with a magnification of 1000x and choose the best field of view of sample A under the microscope. Call a member of the jury to look at your microscope slide to evaluate your prepared slide. (Answer 1.2)
3. Looking at sample (A) and referring to the identification sheet (Appendix at the end of this paper), you can now indicate which organisms among the six kingdoms are not involved in biogas production in the biogas plant of Alfred Bioman (sample A). (Answer 1.3).
4. Looking at sample (B) and referring to the identification sheet, identify the microorganism(s) present. (Answer 1.4).
5. Make a drawing of the microorganisms present in sample (A) and name the specimens using the corresponding numbers from the identification sheet (Answer 1.5).
6. General questions about microorganisms and biogas production: Mark with an (X) if the statements in the Answer sheet are true or false.
TASK 2: Identification of two gases in a biogas mixture Alfred Bioman would like to know the two gases that are contained in the produced biogas. It is now your job to identify these gases (gas X and gas Y).
General Remarks
• Use powder free gloves. • Be sure to flush the system with the gas mixture at each step. • Take care when handling the NaOH solution. • R = 8.314 J•K-1mol-1
Materials used for this task
• precision balance, manometer, thermometer (one per room) • bag containing the biogas mixture
$ COUNTRY – Test 2 – Task Sheet 8 ____________________________________________________________
• 50 mL syringe with 3-way valve • 50 mL syringe containing 10 mL 1M NaOH • flexible hose • hose connector • washing flask containing 1M NaOH fixed on a retort stand
Experimental procedure
2.1 Step One Fill the syringe carrying the 3-way valve with 50mL of air. Weigh and record the mass m1 of the syringe equipped with the 3-way valve on the sheet of paper next to the balances and on the Answer sheet.
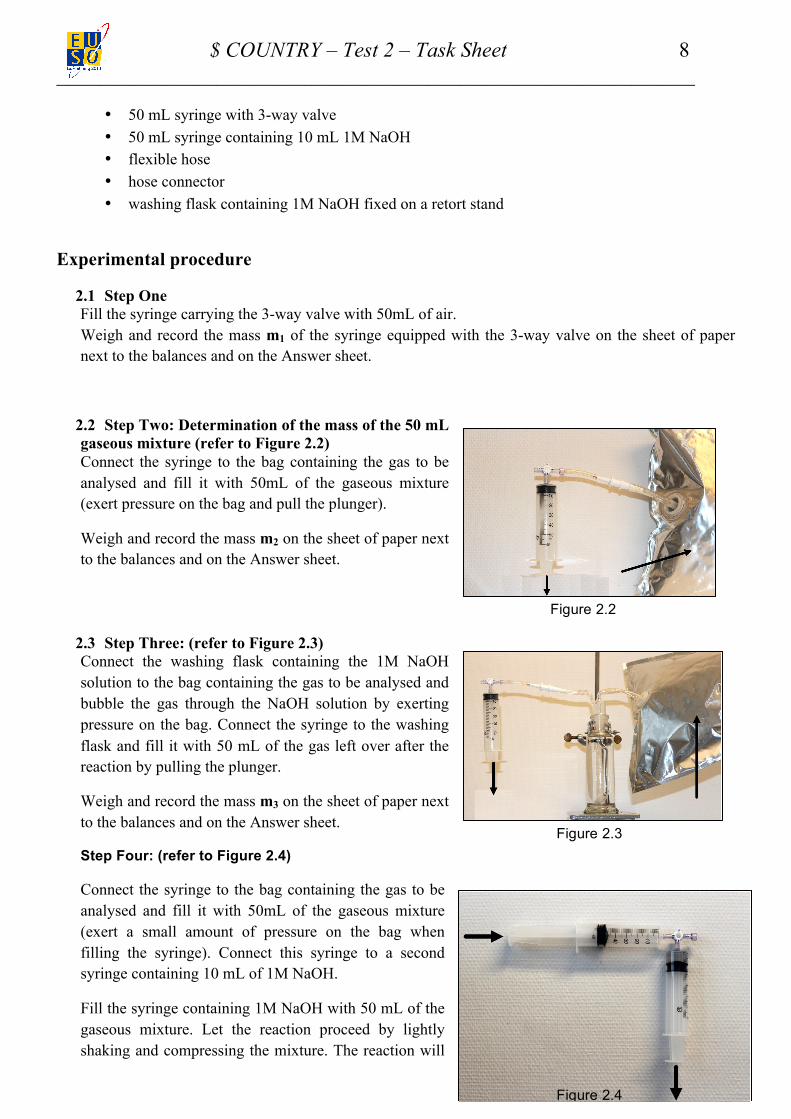
2.2 Step Two: Determination of the mass of the 50 mL gaseous mixture (refer to Figure 2.2) Connect the syringe to the bag containing the gas to be analysed and fill it with 50mL of the gaseous mixture (exert pressure on the bag and pull the plunger).
Weigh and record the mass m2 on the sheet of paper next to the balances and on the Answer sheet.
2.3 Step Three: (refer to Figure 2.3) Connect the washing flask containing the 1M NaOH solution to the bag containing the gas to be analysed and bubble the gas through the NaOH solution by exerting pressure on the bag. Connect the syringe to the washing flask and fill it with 50 mL of the gas left over after the reaction by pulling the plunger.
Weigh and record the mass m3 on the sheet of paper next to the balances and on the Answer sheet.
Step Four: (refer to Figure 2.4)
Connect the syringe to the bag containing the gas to be analysed and fill it with 50mL of the gaseous mixture (exert a small amount of pressure on the bag when filling the syringe). Connect this syringe to a second syringe containing 10 mL of 1M NaOH.
Fill the syringe containing 1M NaOH with 50 mL of the gaseous mixture. Let the reaction proceed by lightly shaking and compressing the mixture. The reaction will
Figure 2.2
Figure 2.3
Figure 2.4

$ COUNTRY – Test 2 – Task Sheet 9 ____________________________________________________________
go to completion. Note down the volume of the gas after the reaction and record it on the Answer sheet.
Calculations
Show your calculations on the Answer sheet.
2.5 Calculation of the mass of the empty syringe:
Using the value of mass m1 and the table below, calculate the mass of the empty syringe mA
Temperature (°C) Density of air (kg · m-3) 30 1.1644 25 1.1839 20 1.2041 15 1.2250 5 1.2690 0 1.2922 -5 1.3163
Table of air density as a function of temperature (at p=1 atm)
2.6 Calculation of the mass of the gaseous mixture in the 50 mL volume: Using the value of mass m2, calculate the mass of the 50 mL gaseous mixture mB 2.7 Calculation of the molar masses of the 2 gases:
2.7.1. Using the value of mass m3 calculate the mass of 50 mL of gas X, mx
2.7.2 Calculate the molar mass of gas X (Mx), using n for the given conditions and the Ideal Gas law.
JOKER: If you want to receive the Ideal Gas formula, you will incur a 3 point deduction.
2.7.3. Calculate the proportional value nX/nY , and calculate the molar mass of gas Y, (My).
Conclusion
2.8 Provide the formulas for both gas X and gas Y. ? Answer sheet
Additional questions
2A Indicate for each of the following statements if they are true or false ? Answer sheet
In the Ideal Gas law: True False the volume of the molecules is negligible. the gas itself does not exert any pressure. the atomic radius is larger than 10 nm. there are no intermolecular interactions.

$ COUNTRY – Test 2 – Task Sheet 10 ____________________________________________________________
the gas is not soluble in water.
2B Indicate for each of the following statements if they are true or false ? Answer sheet
Methane: True False gives rise to a stronger greenhouse effect than carbon dioxide. can combine with water at the bottom of the ocean. is very soluble in water. forms a cubic molecular structure. has a characteristic smell

$ COUNTRY – Test 2 – Task Sheet 11 ____________________________________________________________
TASK 3: Monitoring the biogas production process
Mr Alfred Bioman regularly measures several parameters to keep control of the biogas process. However, Mr Bioman fears that his biogas digester may suffer from a dysfunctional process known as “acidosis”. Acidosis is one of the major process failures encountered in biogas plants caused by improper reactor feeding. He suspects that the waste he introduced yesterday in his reactor may contain highly fermentescible compounds that could potentially produce large amount of organic acids and lower the pH of the reactor below 6.5. In this case, he knows that methanogenic microbes will be strongly inhibited and consequently the biogas production would be reduced. Indeed this substrate is originating from a jam factory and contains a large proportion of soluble sugars. To prevent the pH drop, a recommendable method is to measure the buffer capacity of the digestate. The buffer capacity is chiefly provided by the presence of solubilised CO2 leading to the formation of hydrogen carbonate (HCO3
-) and carbonate (CO3
2-) in the digestate. An adequate buffer capacity is achieved by at least 1 to 3 volume of CO2 dissolved in 1 volume of digestate.
Mr Bioman proposes that in the following tasks, you measure the two important parameters (buffer capacity and pH) that assess the quality of the digestate which will reflect the functioning status of the biological process of his biogas reactor. The first parameter (buffer capacity) can be measured by investigating the gas that is released by the digestate when exposed to a specific reactant. The pH can easily be measured using commercially available test colour strips.
In Task 3.1, the volume of the released gas is measured using a simple apparatus called “eudiometer” which has been slightly modified for the purpose of this analysis. An eudiometer is a laboratory device that measures the change in volume of a gas mixture following a physical, chemical or biochemical change. The simplest form of eudiometer is illustrated below in Figure 3.1, and the system that you will be using for the current experiment is illustrated in Figure 3.2.
Figure 3.1 : The simplest form of an eudiometer. The gas produced by the reaction flows towards a water column. The water is displaced and the volume of gas can be accurately measured.
Since Mr Alfred Bioman is not inclined to lose major revenue generated by the biogas and electricity production, he is eager to know the status of his digester and asks you to proceed as follows:
$ COUNTRY – Test 2 – Task Sheet 12 ____________________________________________________________ TASK 3.1: Digestate buffer capacity
Material and Methods To carry out Task 3.1, you will need the following:
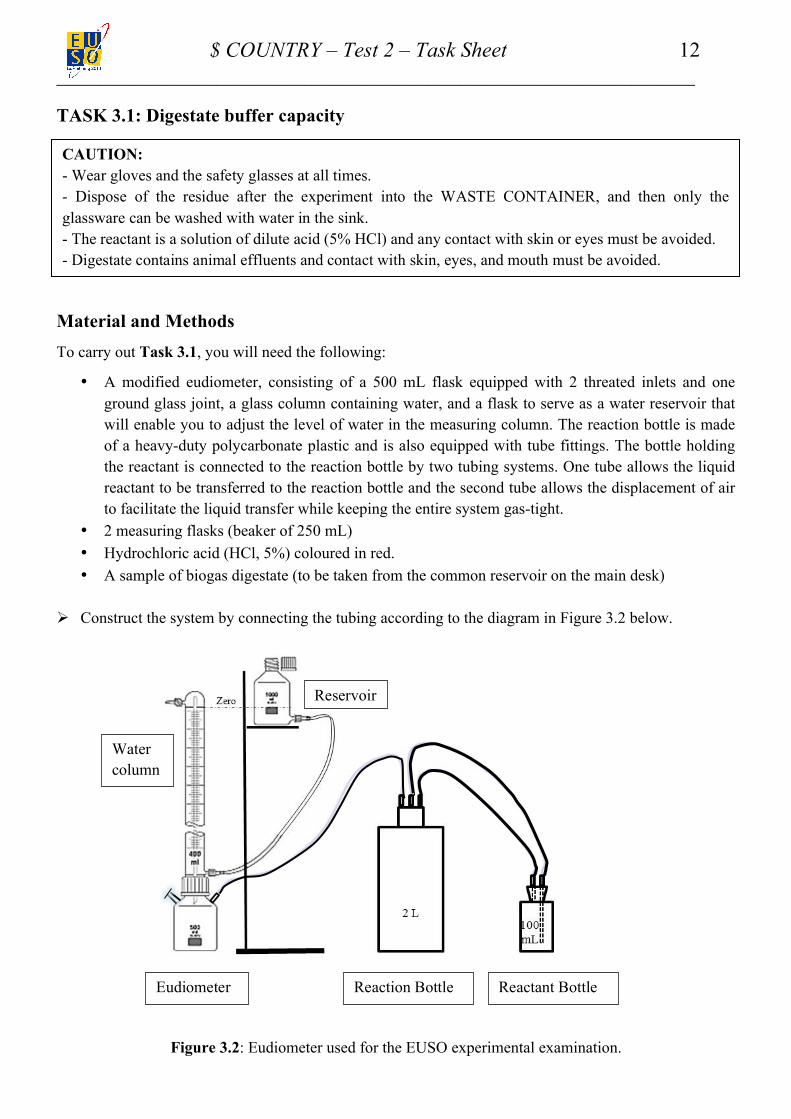
• A modified eudiometer, consisting of a 500 mL flask equipped with 2 threated inlets and one ground glass joint, a glass column containing water, and a flask to serve as a water reservoir that will enable you to adjust the level of water in the measuring column. The reaction bottle is made of a heavy-duty polycarbonate plastic and is also equipped with tube fittings. The bottle holding the reactant is connected to the reaction bottle by two tubing systems. One tube allows the liquid reactant to be transferred to the reaction bottle and the second tube allows the displacement of air to facilitate the liquid transfer while keeping the entire system gas-tight.
• 2 measuring flasks (beaker of 250 mL) • Hydrochloric acid (HCl, 5%) coloured in red. • A sample of biogas digestate (to be taken from the common reservoir on the main desk)
Ø Construct the system by connecting the tubing according to the diagram in Figure 3.2 below.
Figure 3.2: Eudiometer used for the EUSO experimental examination.
CAUTION: - Wear gloves and the safety glasses at all times. - Dispose of the residue after the experiment into the WASTE CONTAINER, and then only the glassware can be washed with water in the sink. - The reactant is a solution of dilute acid (5% HCl) and any contact with skin or eyes must be avoided. - Digestate contains animal effluents and contact with skin, eyes, and mouth must be avoided.
Water column
Reservoir
Eudiometer Reaction Bottle Reactant Bottle
Water column
$ COUNTRY – Test 2 – Task Sheet 13 ____________________________________________________________ • Adjust the volume of water in the reservoir flask of the eudiometer. The level of water in the bottle
and the height of the reservoir has been adjusted so that the water meniscus in the measuring water column coincides with the zero. While doing so the glass tap at the top of the water column should remain open! Do not forget to close this tap after zeroing the water level and before adding the reactant to the reaction bottle. Also be careful not to push the rubber lid into the reactant bottle as this will indeed affect the water reading!
• Wear gloves and safety glasses, measure 100 mL of digestate into a 250 mL beaker. Pour the 100 mL of digestate into the reaction bottle, rinse the beaker twice with a small volume of tap water and pour it into the reaction bottle. Carefully close the reaction bottle.
• Now, with the help of the second 250 mL beaker, you can pour 50 mL (which is in excess) of the acid reactant into the reactant bottle and carefully close the lid. Check once more that (1) the level of water in the measuring column is at zero, and (2) the tap and all the lids are closed and the system is consequently gas tight. Then you should lift the reactant bottle to a level well above the reaction bottle; tilt the bottle so that the reactant liquid drains into the reaction bottle. Immediately note a fast and rapid formation of foam above the digestate and the displacement of the water column. Carefully shake the reaction bottle in order to mix the digestate and the acid well until the water column is stable.
• Record the volume of water displaced (see Answer sheet 3.1.1). For accuracy, Mr Bioman asks you to repeat the experiment three times and calculate the average volume of gas produced (see Answer sheet). Which gas is produced during this experiment? (see answer sheet 3.1.2)
ð Question 3.1.3 – 3.1.8: see Answer sheet
TASK 3.2 : Digestate pH To better understand what type of reaction has occurred in the eudiometer while measuring the buffer capacity of the digestate, Mr Alfred Bioman asks you to measure the pH of the original digestate as well as that of the digestate exposed to the reaction in the reaction bottle. Mr Bioman is not a chemist, neither a laboratory technician, but a friend has provided the pH test strips. Based on a colour scale, it is quite possible to estimate with relatively good accuracy the pH of a solution.
For this task, wear gloves and protective glasses.
• Collect in one beaker approximately 50 mL of the original digestate and dilute it with an equivalent volume of tap water (rinse the beaker carefully under tap water before filling it with the digestate).
• Place approximately 50 mL of the exposed digestate into the second beaker (rinse the beaker carefully under tap water before filling it with the digestate).
• Plunge the pH test strips in the digestates (original and after the reaction, respectively), shake it to remove the excessive sludge (black stain) and record the two pH values that correspond to the colour code provided with the kit (see Answer sheet 3.2.1).
ð Question 3.2.2: see Answer sheet

$ COUNTRY – Test 2 – Task Sheet 14 ____________________________________________________________ TASK 4: Determination of the specific heat capacity of a heat carrier liquid used in a solar collector Imagine a hosepipe filled with water and exposed to solar light: after a short time the temperature of the water inside the hose has considerably increased. The mode of operation of a solar collector is as simple as that. If direct or diffuse solar radiation hits a flat plate solar collector, part of the light energy is transformed into thermal energy in an absorber and finally transmitted to a special heat carrier liquid flowing through the absorber tube (see Figure 4.1 below). In the tank the heat carrier liquid transfers its thermal energy to the water.
Figure 4.1: (1) absorber plate, (2) heat carrier liquid flowing through the absorber tube, (3) heat exchanger, (4) tank, (5) domestic hot water.
In this task you have to determine the specific heat capacity of the heat carrier liquid.
Definitions and Theory
Any material is able to store thermal energy. Let Q be the heat exchanged between a heat source and a sample of mass m. If θΔ represents the temperature change (in °C) of the sample, its specific heat capacity can be defined as
1= ⋅
ΔθQc
m (1)
c is a characteristic property of the material the sample consists of.
The SI unit is J· K−1 kg−
1. As a temperature change 1KΔ =T corresponds to a temperature difference 1°CΔ =θ , you can also use J·°C−
1·kg−1 as a unit for the specific heat capacity. At 20°C water for example
has a specific heat capacity of 4183 J·°C−1·kg−
1. This means that you need 4183 J of energy to raise the temperature of 1 kg of water by 1°C.
Compared to other liquids water has a very high specific heat capacity. This property makes it an ideal candidate as a heat carrier liquid in solar collectors. To guarantee frost and corrosion protection of the

$ COUNTRY – Test 2 – Task Sheet 15 ____________________________________________________________ installation, a commercially available anti-freezer liquid (generally based on propylene glycol) is mixed with water to yield an appropriate heat carrier liquid. One of the advantages of the mixture is that its freezing temperature is reduced with respect to water. A major drawback of the water-anti-freezer mixture is its increased resistance to flow.
From the explanations given above it follows that if you want to predict the specific heat capacity of a heat carrier liquid used in real life, you first have to know the specific heat capacity of the anti-freezer liquid and then, use a mixing rule, calculate the specific heat capacity of the heat carrier itself.
To determine the specific heat capacity of the commercially available anti-freezer liquid (Tyfocor®L in your case; abbreviated Tyfo in the following) you will record the cooling curves of a Tyfo sample and of water as a reference liquid. In both cases you will investigate how the temperature of the respective hot liquid sample decreases as a function of time.
For the current experiment consider the calorimeter shown in Figure 4.2. It is formed by a copper cylinder, closed at the bottom, provided with a copper lid and equipped with a copper stirrer. Let calm be the total mass of the assembly and θamb its temperature (corresponding to ambient temperature). As shown in Figure 4.2, the calorimeter is resting on cork supports inside a large plastic box. The purpose of the latter is to fix a defined environment for the calorimeter (by preventing, for example, the circulation of random air currents around the copper cylinder).
Figure 4.2: (1) cork supports, (2) calorimeter, (3) liquid sample, (4) plastic box, (5) lid, (6) thermometer probe, (7) stirrer, (8) digital thermometer.
If you fill part of the calorimeter’s volume with a mass liqm of hot liquid then, in a little while, the calorimeter will heat up and the liquid will cool down to reach an equilibrium temperature. From now on this equilibrium temperature will decrease.
Several transport mechanisms are responsible for the cooling down of the calorimeter and its contents: (i) heat conduction occurring at the interface calorimeter-air, (ii) convection resulting from density differences between hot and colder air and finally (iii) heat radiation which can be neglected as in your experiment the maximum temperature of the calorimeter will be rather low.

$ COUNTRY – Test 2 – Task Sheet 16 ____________________________________________________________ It is important to stress by now that whatever might be the weight of each of the different mechanisms (i), (ii) or (iii) in the cooling down process of the samples, the evaluation of the cooling curves will yield a reliable result for the specific heat capacity of the anti-freezer liquid, if both samples, water and Tyfo, can cool down under exactly the same conditions.
If Q represents the heat dissipated by the calorimeter and its content when their common temperature decreases by θΔ , then, according to (1):
= + = ⋅ ⋅Δ + ⋅ ⋅Δθ θliq cal liq liq cal CalQ Q Q m c m c (2)
liqc : specific heat capacity of the liquid (water and Tyfo, respectively);
calc : specific heat capacity of the material the calorimeter consists of.
Considering that the heat exchange takes a time Δt , then with equation (2), the heat evacuated per unit time is given by:
( ) Δ= ⋅ + ⋅ ⋅Δ Δ
θliq liq cal cal
Q m c m ct t
(3)
If both liquids can cool down under exactly the same conditions, Δ
Qt
depends only on the temperature
difference between the calorimeter (and its content) and the environment (air, box, cork supports). Thus the heat evacuated per unit time, at a given calorimeter temperature, is independent of the nature of the liquid inside the calorimeter. With this remarkable conclusion you can determine the unknown specific heat capacity of one liquid (Tyfo), if you know the specific heat capacity of the reference liquid (water). After investigating the cooling down of a water sample (reference liquid) and subsequently, under exactly the same conditions, the cooling down of anti-freezer liquid (Tyfo) sample, you get, at a given temperature θslope :
or ( ) ( ) (4)
⎛ ⎞ ⎛ ⎞=⎜ ⎟ ⎜ ⎟Δ Δ⎝ ⎠ ⎝ ⎠
Δ Δ⎛ ⎞ ⎛ ⎞⋅ + ⋅ ⋅ = ⋅ + ⋅ ⋅⎜ ⎟ ⎜ ⎟Δ Δ⎝ ⎠ ⎝ ⎠
θ θTyfo water
Tyfo Tyfo cal cal water water cal calTyfo water
Q Qt t
m c m c m c m ct t
, Tyfo waterm m are the masses of the same volume V of anti-freezer liquid and water, respectively;
, Tyfo waterc c represent the specific heat capacities of both species of liquids (Tyfo and water);
, Δ Δ⎛ ⎞ ⎛ ⎞⎜ ⎟ ⎜ ⎟Δ Δ⎝ ⎠ ⎝ ⎠
θ θ
Tyfo watert tcorrespond to the slopes of the cooling curves ( )θTyfo t and ( )θwater t at the
temperature θslope , respectively.
As already mentioned, in a real solar collector, the heat carrier is a mixture of water with Tyfo.

$ COUNTRY – Test 2 – Task Sheet 17 ____________________________________________________________ Equipment and Material
-‐ 1 copper calorimeter with copper lid and copper stirrer -‐ 1 digital thermometer -‐ 1 large plastic box -‐ 3 cork supports -‐ 1 stop-watch -‐ 1 digital scale -‐ 1 heating plate -‐ 1 graduated beaker filled with 0.5 L anti-freezer liquid (Tyfocor®L) -‐ 1 graduated empty beaker to be filled with water -‐ 1 pair of protecting gloves -‐ 1 spoon -‐ 1 cleaning cloth -‐ 2 sheets of millimetre paper
Description of the tasks
Task 4.1: Mass of calorimeter
Measure the mass of the empty calorimeter with the lid and the stirrer and record the result on the Answer sheet. Also, indicate the number of the calorimeter used (see backside of lid).
Task 4.2: Data table
• Leave the calorimeter without the lid and stirrer on the digital scales and fill it with 300g of water (reference liquid). Then place the calorimeter (without the stirrer and lid) on the heating plate and heat it up to about 80°C. Adjust the heating power to its maximum and keep the magnetic stirrer switched off. Warning! The calorimeter and its content get very hot! Protect your hands with the gloves. You can check the temperature of the reference liquid inside the calorimeter with the digital thermometer. To ensure a uniform temperature distribution inside the reference liquid, continuously stir it with the thermometer probe.
Very important! Take care to avoid contact of the connecting cable of the thermometer probe and the very hot heating plate!
• Once the liquid has reached a temperature of about 80°C, switch off the heating plate, transfer the calorimeter to the plastic box, using the protecting gloves, and carefully place it onto the three cork supports. Insert the thermometer probe through the little hole in the centre of the lid and fix the probe with the screw nut. Finally place the copper stirrer inside the liquid and close the calorimeter with the lid.

$ COUNTRY – Test 2 – Task Sheet 18 ____________________________________________________________ • While steadily and slowly stirring, measure the temperature θ every 30 seconds as the liquid cools.
Start your measurement at about 75= °θ C . Write your measurement data in the table of Task 4.2 the Answer sheet.
t (min) θwater (°C) Reference liquid
θTyfo (°C) Anti-freezer liquid
0 0.5 1.0 1.5 …. 10.0
Stop the measurement after 10 minutes.
• Pour the water into its original container and clean the calorimeter using the cleaning cloth. • Repeat the experiment with the calorimeter now filled with 300 g of anti-freezer liquid (Tyfo).
As in the temperature range where your take your measurements the density of the reference liquid (water) is in good approximation equal to the density of the anti-freezer liquid (Tyfo), both samples occupy the same volume inside the calorimeter (which is very important in order to guarantee that the cooling curves are measured for both liquids under exactly the same conditions.)
Task 4.3: Cooling curves
With the data in the table draw the cooling curves ( )θref t and ( )θTyfo t on the same sheet of millimetre paper.
Task 4.4: Slopes of the cooling curves at 70°C
• Determine the slopes of the cooling curves at 70°C and provide the values on the Answer sheet.
Task 4.5: Specific heat capacity of Tyfo
• Use equation 4 to derive the formula for the specific heat capacity of Tyfo. Provide your result on the Answer sheet.
• Determine the specific heat capacity Tyfoc of the anti-freezer liquid knowing that
ccal = 380 J ⋅°C−1 ⋅ kg−1 and cwater = 4189 J ⋅°C−1 ⋅ kg−1 at a temperature of 70°C. Provide your result on the Answer sheet.
• Considering that the specific heat capacity of Tyfo linearly increases by 5.75 J ⋅°C−1 ⋅ kg−1 if the temperature is risen by 1°C, determine the specific heat capacity of the anti-freezer liquid sample at +30°C and at −20°C. Provide your results on the Answer sheet.

$ COUNTRY – Test 2 – Task Sheet 19 ____________________________________________________________ Task 4.6: Concentration of the heat carrier mixture
As already mentioned, in practice a heat carrier liquid is a mixture of water and anti-freezer liquid (in your case Tyfocor®L). Consider a solar collector properly working down to a temperature of −20°C. To save energy the heat carrier mixture should have the lowest possible viscosity (i.e. resistance to flow). Use the appendix to determine the Tyfo concentration of that mixture and write this value on the Answer sheet.
Question 4A: Specific heat capacity of a mixture
A solar collector is working at a temperature of 30°C with a heat carrier containing 40% of Tyfocor®L. Knowing that cwater = 4179 J ⋅°C−1 ⋅ kg−1 at a temperature of 30°C determine the specific heat capacity of the mixture at 30°C. Provide your result on the Answer sheet.
Question 4B: Calorimeter’s thermal equilibrium
A liquid sample with a given volume is heated up to a temperature of about 80°C and poured into a calorimeter originally at ambient temperature. The liquid is continuously stirred. After a certain time both calorimeter and liquid reach an equal temperature. Which of the following factor(s) or action(s) would affect that time?
• Choosing a calorimeter of the same material with a different mass
• Changing the contact area between calorimeter and liquid • Placing the calorimeter in a small plastic box • Not stirring the liquid
• Increasing the ambient temperature and the temperature of the heated liquid by 5°C (specific heat capacities and heat conductivities of the calorimeter and the liquid remaining invariant)
Provide your answers on the Answer sheet.

$ COUNTRY – Test 2 – Task Sheet 20 ____________________________________________________________ Appendix:

$ COUNTRY – Test 2 – Task Sheet 21 ____________________________________________________________
TASK 5: GENERAL QUESTIONS
ABOUT BIOMETHANATION 5A Methane synthesis:
Write down the equation of methane production by acetototrophic methane producers using acetic acid (CH3COOH)
Write down the equation of methane production by hydrogenotrophic methane producers using hydrogen and carbon dioxyde.
5B Calculate the total amount of petrol which could be displaced annually by the use of biomethanation for energy production in Luxembourg.
5C The government of Luxembourg, in an effort to lower the greenhouse gas emissions and to meet emissions reduction target as set by the Kyoto Protocol, may propose a levy on the ruminant farmers (flatulence tax: 0.01 € /L of CH4 and 0.005€ /L of CO2 emitted annually) because their livestock was the biggest emitters of methane (196470 cows in total). How much money the government of Luxembourg could earn per year (365 days) by raising such a tax?
5D Since Mr Alfred Bioman has turned his farm into a biogas unit he makes good use of the digestate as an organic fertilizer. His farm has an arable land area of 100 ha and he uses the equivalent of 170 kg of nitrogen/ha per annum (the digestate on Mr Bioman's farm contains on average 4 kg of nitrogen/m3). Calculate how many m3 of natural gas is saved annually thanks to the action of Mr Bioman.


![Free-flying JEM-EUSO precursor utilizing the InnoSat platform · Free-flying JEM-EUSO precursor utilizing the InnoSat platform The goal of the JEM-EUSO collaboration [1] has, for](https://static.fdocuments.in/doc/165x107/5edbb317ad6a402d66660c7e/free-flying-jem-euso-precursor-utilizing-the-innosat-platform-free-flying-jem-euso.jpg)