European Sourcebook of Crime and Criminal Justice ...
410
European Institute for Crime Prevention and Control, affiliated with the United Nations (HEUNI) P.O. Box 444 FIN-00531 Helsinki Finland Publication Series No. 80 European Sourcebook of Crime and Criminal Justice Statistics 2014 Fifth edition 2 nd revised printing Marcelo F. Aebi, Galma Akdeniz, Gordon Barclay, Claudia Campistol, Stefano Caneppele, Beata Gruszczyńska, Stefan Harrendorf, Markku Heiskanen, Vasilika Hysi, Jörg-Martin Jehle, Anniina Jokinen, Annie Kensey, Martin Killias, Chris G. Lewis, Ernesto Savona, Paul Smit, Rannveig Þórisdóttir Helsinki 2014/2017
Transcript of European Sourcebook of Crime and Criminal Justice ...

European Institute for Crime Prevention and Control, affiliated with the United Nations (HEUNI) P.O. Box 444 FIN-00531 Helsinki Finland Publication Series No. 80
European Sourcebook of Crime and Criminal Justice Statistics
2014
Fifth edition
2nd revised printing
Marcelo F. Aebi, Galma Akdeniz, Gordon Barclay, Claudia Campistol, Stefano Caneppele, Beata Gruszczyńska, Stefan Harrendorf, Markku Heiskanen, Vasilika Hysi, Jörg-Martin Jehle, Anniina Jokinen, Annie Kensey, Martin Killias,
Chris G. Lewis, Ernesto Savona, Paul Smit, Rannveig Þórisdóttir
Helsinki 2014/2017

Copies can be purchased from: Academic Bookstore P.O. Box 128 FIN-00101 Helsinki Finland Website: http://www.akateeminen.com ISBN 978-952-5333-94-7 ISSN 1799-5590 ISSN-L 1237-4741 Printed by Hakapaino Oy, Helsinki, Finland 2014

Authors in alphabetical order:
Marcelo F. Aebi Galma Akdeniz Gordon Barclay Claudia Campistol Stefano Caneppele Beata Gruszczyńska Stefan Harrendorf Markku Heiskanen Vasilika Hysi Jörg-Martin Jehle Anniina Jokinen Annie Kensey Martin Killias Chris G. Lewis Ernesto Savona Paul Smit Rannveig Þórisdóttir
Dedication The 5th Edition of the European Sourcebook is dedicated to the memory of Professor Hanns von Hofer of Stockholm University (1944-2014). Hanns was a member of the Council of Europe Group who developed the draft Sourcebook and he continued to be involved with the production of the early editions. His knowledge of criminology and statistics played a major part in developing the methodology used in the Sourcebook and later adopted by the United Nations and Eurostat. We have lost a good friend.


Acknowledgements
This report has been built upon the knowledge, commitment and active contribution of many experts from all European countries. The editors would like to express their deep gratitude to everybody who contributed to this work and its successful completion. The questionnaire devised by the European Sourcebook group together with the Confederation of European Probation (CEP) has been discussed with and answered by the following national correspondents: Albania: Vasilika Hysi, University of Tirana (also ESB group member) Armenia: Anna Margaryan, Yerevan State University Austria: Ireen Christine Winter and Bernhard Klob, University of Vienna Belgium: Charlotte Vanneste, Institut national de criminalistique et de criminologie,
Brussels Bulgaria: Maria Yordanova and Dimitar Markov, Center for the Study of Democracy,
Sofia Croatia: Maja Munivrana Vajda, University of Zagreb Cyprus: Georgia Ioannou, Statistical Service of Cyprus, Nicosia; Markianos Kokkinos,
Analysis and Statistics Office, Nicosia Czech Republic: Simona Diblikova, Institute of Criminology and Social Prevention,
Prague Denmark: Britta Kyvsgaard, Ministry of Justice, Copenhagen Estonia: Andri Ahven, Ministry of Justice, Tallinn Finland: Markku Heiskanen, HEUNI, Helsinki (also ESB group member) and Anniina
Jokinen, HEUNI, Helsinki France: Annie Kensey, CESDIP, Guyancourt (also ESB group member) Georgia: Georgi Glonti, Grigol Robakidze University, Tbilisi Germany: Stefan Harrendorf and Jörg-Martin Jehle, University of Göttingen (also ESB
group members) Greece: Calliope Spinellis, Maria Galanou, and Georgios Papanicolaou, University of
Athens Hungary: Tibor Nagy, Office of the Prosecutor General of Hungary, Budapest Iceland: Rannveig Þórisdóttir, Metropolitan Police, Reykjavik (also ESB group
member) Ireland: Timothy Linehan, Crime and Criminal Justice, Central Statistics Office, Cork Italy: Uberto Gatti and Gabriele Rocca, University of Genoa Kosovo1: Sanije Ismajli, Statistical Office of Kosovo, Priština Latvia: Jurijs Ņikišins, State Probation Service, Riga Lithuania: Margarita Dobrynina, Simonas Nikartas, Salomėja Zaksaitė, and Renata
Giedrytė, Law Institute of Lithuania, Vilnius Malta: Nicola Vella Haber, National Statistics Office, Valletta Netherlands: Heike Goudriaan and Harm Aten, Statistics Netherlands, The Hague Norway: Gerhard Ploeg, Ministry of Justice and Public Security, Oslo Poland: Beata Gruszczyńska, University of Warsaw (also ESB group member) Portugal: Maria João Morgado Costa, Direcção-Geral da Política de Justiça, Lisbon Romania: Catalin Bejan, National Administration of Penitentiaries, Bucharest Russia: Alexander Salagaev, Kazan State Technological University Serbia: Vesna Nikolić-Ristanović and Danica Vasiljevic-Prodanovic, University of
Belgrade; Sanja Copic, Institute for Criminological and Sociological Research, Belgrade
Slovakia: Juraj Rychtárik, Statistical Office of the Slovak Republic, Bratislava 1 UN/R 1244/99.

Slovenia: Miran Mitar, University of Maribor Spain: Antonia Linde, Universitat Oberta de Catalunya, Barcelona Sweden: Levent Kemetli, National Council for Crime Prevention, Stockholm Switzerland: Anne-Corinne Vollenweider Wyss, Office Féderal de la Statistique,
Neuchâtel Turkey: Galma Akdeniz, Istanbul Bilgi University (also ESB group member) Ukraine: Olena Shostko, National Law Academy of Ukraine, Kharkiv UK: England and Wales: Ben Coleman, Ministry of Justice, London (also ESB group
member) UK: Northern Ireland: Richard Erskine, Department of Justice, Belfast UK: Scotland: Howard Hooper, Scottish Government, Justice Statistics Analytical
Services, Edinburgh A second round of data collection has been conducted via the following correspondents of the Confederation of European Probation (CEP). Austria: Bernd Glaeser, NEUSTART, Wien Croatia: Jana Spero, Ministry of Justice, Zagreb Czech Republic: Michal Karban, Probation and Mediation Service, Prague Estonia: Andri Ahven, Ministry of Justice, Tallinn Italy: Roberta Palmisano, Office for Studies Research Legislation and International
Relations, Rome Malta: Mariella Camilleri, Department of Probation and Parole, Valetta Moldova: Valeriu Melinte and Alisa Simicevscaia, Oficul Central de Probaţiune,
Chişinău Netherlands: Martine Wiekeraad, Reclassering Nederland, Utrecht Romania: Evelina Obersterescu, Ministry of Justice, Bucharest Slovakia: Ján Evin, Ministry of Justice, Bratislava Sweden: Mats Johansson, Swedish Prison and Probation Service, Norrköping UK: England and Wales: Francesca Emmett, National Offenders Management Service,
Warrington The following experts from the European Sourcebook group participated in the project: Marcelo F. Aebi, University of Lausanne, Switzerland/Autonomous University of
Barcelona, Spain Galma Akdeniz, Istanbul Bilgi University, Turkey Kauko Aromaa, HEUNI, Helsinki, Finland Stefano Caneppele, TRANSCRIME, Milan, Italy Ben Coleman (since 2012), Ministry of Justice, London, UK Beata Gruszczyńska, University of Warsaw, Poland Stefan Harrendorf, University of Göttingen, Germany Markku Heiskanen, HEUNI, Helsinki, Finland Vasilika Hysi, University of Tirana, Albania Jörg-Martin Jehle, University of Göttingen, Germany (chair) Annie Kensey, CESDIP, Guyancourt, France Ernesto Savona, TRANSCRIME, Milan, Italy Paul Smit, Ministry of Justice – WODC, The Hague, Netherlands Rannveig Þorisdottir, Metropolitan Police, Reykjavik, Iceland Alison Walker (until 2012), formerly Ministry of Justice, London, UK (retired)

The following experts from the Confederation of European Probation (CEP) participated in the project: Willem van der Brugge, General Secretary of CEP (since April 2013), Utrecht,
Netherlands Ioan Durnescu, University of Bucharest, Romania Koen Goei, CEP, Utrecht, Netherlands Anton van Kalmthout, University of Tilburg, Netherlands John Stafford, Interim Assistant General Secretary of CEP (from May 2012 until March
2013), Utrecht, Netherlands Leo Tigges, General Secretary of CEP (until April 2012), Utrecht, Netherlands A Steering Board of the DECODEUR project, which developed the methodology regarding community sanctions and measures, took part in the project. Its members were: Gordon Barclay, formerly Home Office, London, UK (retired) Enrico Bisogno, United Nations Office on Drugs and Crime, Vienna, Austria Steve Clarke, Eurostat, Luxembourg (since 2012) Michael Jandl, United Nations Office on Drugs and Crime, Vienna, Austria Hans Jürgen Kerner, University of Tübingen, Germany Martin Killias, University of Zürich, Switzerland Chris Lewis, University of Portsmouth, UK Cynthia Tavares, Eurostat, Luxembourg (sadly died in 2013) Geoffrey Thomas, Eurostat, Luxembourg (until 2012) The following observers/invited experts were involved in the discussions related to the project and gave helpful advice:
Anna Alvazzi del Frate, The Small Arms Survey, Geneva, Switzerland Natalia Delgrande, University of Lausanne, Switzerland Debora Moolenaar, Ministry of Justice – WODC, The Hague, Netherlands Giulia Mugellini, University of Zürich, Switzerland Irene Pavesi, The Small Arms Survey, Geneva, Switzerland The following researchers were part of the project staff. They assisted the group and made a major contribution to the success of this project:
Claudia Campistol, Autonomous University of Barcelona, Spain/University of Lausanne, Switzerland
Anniina Jokinen, HEUNI, Helsinki, Finland Anni Lietonen, HEUNI, Helsinki, Finland Nina Palmowski, University of Göttingen, Germany


Preface
This is the fifth edition of a data collection initiative that started in 1993 under the umbrella of the Council of Europe. As was the case with the earlier editions, it was prepared by an international group of experts, who have recently formed a legal entity called European Sourcebook of Criminal Justice e.V.2 The format developed during the earlier editions was maintained, especially the network of national correspondents and regional coordinators whose contribution has, once more, been decisive in collecting and validating data on a variety of subjects from 41 countries.3 New categories for the collection of data on community sanctions and measures and probation agencies were introduced with the support of the Confederation of European Probation (CEP). In addition, the chapter on victimization surveys for the first time refers to national studies, as no recent international survey was available. The present document covers the years 2007 to 2011 for police, prosecution, conviction and prison statistics, with detailed analyses for 2010.
The basic structure of five chapters – offences and offenders known to the police, prosecution, convictions and sentences, prison and survey data – has been extended by introducing a separate chapter on the work of probation agencies and the implementation of community sanctions and measures. All data in that new chapter refer to 2010. Furthermore, more detailed data on community sanctions and measures connected with prosecutorial decisions or orders by the court were introduced in chapter 2 and 3 respectively. Moreover, all chapters were revised and partly enlarged in various respects. For example, offence definitions were further developed and improved, while keeping as far as possible comparability with previous editions of the Sourcebook: i.e, major traffic offences and sexual assault, while a breakdown for offences involving a firearm was included in the case of homicide and robbery. The chapters on prosecution and convictions include more detailed information on minors. Finally, chapter 6 presents survey data from national crime victimisation surveys conducted between 1990 and 2010.
Basically, all data included were originally collected by the national correspondents. With regard to chapter 5, additional data collection was carried out via the network of the CEP member organizations to improve data availability. The present document also includes, in chapter 4, some data provided by the SPACE project of the Council of Europe.
The data presented is also available on the web site www.unil.ch/europeansourcebook. The raw data of the Sourcebook can be found there as well. This includes the absolute crime figures as provided by the national correspondents and more detailed technical information.
The Sourcebook group wishes to thank all those who, in whatever capacity, have worked on the present edition. First of all, our thanks go to the national correspondents, the cooperating representatives of CEP - Willem van der Brugge, Koen Goei, John Stafford, Leo Tigges, Anton van Kalmthout and Ioan Durnescu and the respondents from CEP member organizations. We also wish to thank three research institutes for their substantial support in preparing papers and conferences: HEUNI and its staff, particularly Anniina Jokinen and Anni Lietonen; the Department for Criminology of Göttingen University and its staff, especially Nina Palmowski and Patrick Fresow, and last but not least Marcelo Aebi, Natalia Delgrande and, especially, Claudia Campistol from the University of Lausanne, for preparing the online survey, managing the database and creating a new Sourcebook website. While preparing the 5th edition, the Sourcebook group had the privilege to receive support also from Cynthia Tavares (Eurostat), who sadly died during the final course of the project. She is greatly missed.
We also thank Steve Clarke and Geoffrey Thomas (Eurostat), Enrico Bisogno and, Michael Jandl (UNODC), Giulia Muggellini (University of Zurich), Anna Alvazzi del Frate and Irene
2 Registered association according to German law (eingetragener Verein). 3 Including the constituent countries of the United Kingdom that have separate criminal justice systems, namely England and Wales, Northern Ireland, and Scotland.

Pavesi (The Small Arms Survey) and Kauko Aromaa (former head of HEUNI) and Deborah Moolenaar (WODC) for their important contributions.
Special thanks are due to the Directorate-General Home Affairs of the European Commission who funded the ISEC project,4 which was focussed on community sanctions and measures as well as attrition. This built the base for preparing the new edition.
We hope that this new edition will continue to promote comparative research throughout Europe and make European experiences and data available across the world.
Göttingen, June 2014
Jörg-Martin Jehle, Chair
4 HOME/2010/ISEC/FP/C1/4000001420. Detailed results of this project are publicized parallel to this book in: Heiskanen/Aebi/van der Brugge/Jehle (eds.): Recording Community Sanctions and Measures and Assessing Attrition. A Methodological Study on Comparative Data in Europe. Helsinki: HEUNI 2014.

Contents General Introduction: The European Sourcebook Project ..................................................................................... 15
1. Police Statistics .................................................................................................. 23
1.1 General comments ............................................................................................... 23 1.1.1 Police statistics as a measure of crime .................................................................. 23 1.1.2 Police in the criminal justice system ...................................................................... 23 1.1.3 Counting offences and offenders........................................................................... 24 1.1.4 Counting police officers ......................................................................................... 24 1.1.5 Results ................................................................................................................. 24 1.1.6 Comments by offences ......................................................................................... 25 1.1.7 Police staff ............................................................................................................ 31
1.2 Tables .................................................................................................................. 32 1.2.1 Offences ............................................................................................................... 32 1.2.2 Offenders ............................................................................................................. 56 1.2.3 Percentage of females, minors, and aliens among offenders in 2010..................... 78 1.2.4 Police staff ............................................................................................................ 99
1.3 Technical Information.......................................................................................... 102
1.4 Sources .............................................................................................................. 108
2. Prosecution Statistics ...................................................................................... 111
2.1 General comments ............................................................................................. 111 2.1.1 Background ........................................................................................................ 111 2.1.2 Results ............................................................................................................... 114
2.2 Tables ................................................................................................................ 117 2.2.1 Criminal cases handled by the prosecuting authorities 2007–2011 ...................... 117 2.2.2 Criminal cases handled by the prosecuting authorities in 2010 ............................ 121 2.2.3 Criminal cases handled by the prosecuting authorities in 2010 by offence groups 126 2.2.4 Police custody and pre-trial detention .................................................................. 132 2.2.5 Staff.................................................................................................................... 134
2.3 Technical information .......................................................................................... 136 2.3.1 General remarks ................................................................................................. 136 2.3.2 Offences / cases handled by the prosecuting authorities ..................................... 137 2.3.3 Disposal categories ............................................................................................ 137 2.3.4 Other technical information on the tables ............................................................ 140
2.4 Sources .............................................................................................................. 145
3. Conviction Statistics ........................................................................................ 147
3.1 General comments ............................................................................................. 147 3.1.1 Introduction......................................................................................................... 147 3.1.2 Offence definitions .............................................................................................. 147 3.1.3 Definition of a conviction ..................................................................................... 148 3.1.4 Minimum age of conviction .................................................................................. 148 3.1.5 Validation checks ................................................................................................ 148 3.1.6 Methodology ....................................................................................................... 148 3.1.7 Results ............................................................................................................... 149 3.1.8 Total crimes ........................................................................................................ 149 3.1.9 Major traffic offences .......................................................................................... 150

3.1.10 Homicide ............................................................................................................. 150 3.1.11 Assaults .............................................................................................................. 151 3.1.12 Rape ................................................................................................................... 151 3.1.13 Sexual assaults ................................................................................................... 152 3.1.14 Robbery .............................................................................................................. 152 3.1.15 Theft ................................................................................................................... 152 3.1.16 Fraud .................................................................................................................. 153 3.1.17 Money laundering................................................................................................ 153 3.1.18 Corruption ........................................................................................................... 153 3.1.19 Drug trafficking .................................................................................................... 154 3.1.20 Attrition ............................................................................................................... 154
3.2 Tables ................................................................................................................. 156 3.2.1 Total number of convictions per 100 000 population ............................................ 156 3.2.2 Percentage of females, minors, and aliens among convicted persons
in 2010 ................................................................................................................ 176
3.3 Technical information .......................................................................................... 262 3.3.1 Technical comments ........................................................................................... 262 3.3.2 Minors in conviction statistics .............................................................................. 262
3.4 Sources .............................................................................................................. 264
4. Prison Statistics ................................................................................................ 267
4.1. General Comments ............................................................................................. 267 4.1.1 Introduction ......................................................................................................... 267 4.1.2 Quality of the data ............................................................................................... 268 4.1.3 Results................................................................................................................ 268 4.1.4 Recidivism .......................................................................................................... 269
4.2 Tables ................................................................................................................. 270 4.2.1 Prison population (including pre-trial detainees): Stock ........................................ 270 4.2.2 Prison population (including pre-trial detainees): Flow ......................................... 276 4.2.3 Convicted prison population by type of offence on 1st September 2010 ................ 282
4.3 Technical information .......................................................................................... 293 4.3.1 Stock .................................................................................................................. 293 4.3.2 Flow .................................................................................................................... 293 4.3.3 Description of data recording methods for Tables on Stock and Flow................... 293 4.3.4 Description of data recording methods for Tables on the convicted
population ........................................................................................................... 295
4.4 Sources .............................................................................................................. 296
5. Probation Statistics........................................................................................... 299
5.1 General comments .............................................................................................. 299 5.1.1 Introduction ......................................................................................................... 299 5.1.2 Quality of the data ............................................................................................... 299 5.1.3 Results................................................................................................................ 300
5.2 Tables ................................................................................................................. 301 5.2.1 Persons under the control, supervision and / or care of the Probation Agencies
in 2010 ................................................................................................................ 301 5.2.2 Reasons for ending supervision by the Probation Agencies in 2010 ..................... 307 5.2.3 Persons under community service in 2010 .......................................................... 309 5.2.4 Reasons for ending community service in 2010 ................................................... 313 5.2.5 Persons under electronic monitoring in 2010 ....................................................... 315 5.2.6 Reasons for ending electronic monitoring in 2010 ................................................ 317 5.2.7 Probation Agencies staff in 2010 ......................................................................... 319

5.2.8 Number of written reports provided by the Probation Agencies in 2010 ............... 321
5.3 Technical information .......................................................................................... 323 5.3.1 The structure and organization of Probation Agencies ......................................... 323 5.3.2 Description of data recording methods for Tables on Supervision ........................ 331 5.3.3 Description of data recording methods for Tables on Community Service ............ 333 5.3.4 Description of data recording methods for Tables on Electronic
monitoring........................................................................................................... 335 5.3.5 Additional information on the staff and reports of Probation Agencies .................. 337
5.4 Sources .............................................................................................................. 338
6. National Victimization Surveys ........................................................................ 341
6.1 General comments ............................................................................................. 341 6.1.1 Introduction......................................................................................................... 341 6.1.2 Standard wording of the questions on victimization ............................................. 344 6.1.3 Quality of the data............................................................................................... 347 6.1.4 Main results ........................................................................................................ 347
6.2 Tables ................................................................................................................ 348 6.2.1 Bodily Injury ........................................................................................................ 348 6.2.2 Sexual assault .................................................................................................... 349 6.2.3 Robbery .............................................................................................................. 352 6.2.4 Theft of personal property ................................................................................... 354 6.2.5 Theft of a motor vehicle ...................................................................................... 356 6.2.6 Domestic burglary ............................................................................................... 357 6.2.7 Corruption .......................................................................................................... 359 6.2.8 Trust in the police ............................................................................................... 359 6.2.9 Feelings of safety ............................................................................................... 361
6.3. Technical information .......................................................................................... 363
6.4 Sources .............................................................................................................. 368
Appendix I: General definitions ......................................................................................... 369
Appendix II: Population ..................................................................................................... 409


15
General Introduction: The European Sourcebook Project
Background
The assessment of trends in crime and criminal justice has been a permanent concern of international organizations and a major source of interest and debate for researchers and policy makers. Following the political changes that have taken place in the European continent, the necessity of a reliable source of data for Europe became evident. Against this background, the European Committee on Crime Problems (CDPC) created in 1993 a Group of Specialists on ‘’Trends in crime and criminal justice: statistics and other quantitative data on crime and criminal justice systems’ (PC-S-ST). The Group was composed of experts from France, Germany, Hungary, the Netherlands, Sweden, Switzerland and the United Kingdom.5
In 1995, the Group presented the European Sourcebook of Crime and Criminal Justice Statistics. Draft model (Strasbourg: Council of Europe, 1995, 194 pp) to the CDPC. The draft model presented crime and criminal justice data for the year 1990 for ten European countries.6 At its 45th plenary session in June 1996, the CDPC entrusted the Group of Specialists with the preparation of a compendium of crime and criminal justice data for the whole of Europe. The addition of specialists in the collection of statistical data resulted in the enlargement of the Group and members were given responsibilities as ‘regional co-ordinators’.7
In its work, the Group took account of the periodic surveys carried out by INTERPOL and the UNODC. These surveys relied on the provision of data by official authorities of each country, which usually would transmit the figures as published in their national statistics. The Group decided to follow a different approach by creating a co-ordinated network of national correspondents that would access the main statistical sources within each country, collect information on statistical and legal definitions (metadata), and adapt as much as possible the available figures to a standard definition of each offence developed by the Group.
The system of national correspondents required the identification in each country of an expert in crime and criminal justice statistics who was responsible for the collection and initial checking of the data. The list of the current national correspondents is given in the beginning of this publication. Some of them have served during all sweeps of this project, whereas others have joined later. They are responsible for the accuracy of the data provided for their respective countries as well as for identifying legal and statistical changes, or factual incidents that can explain variations in the trends observed. The members of the European Sourcebook Group act as ‘regional co-ordinators’ for groups of 3 to 4 countries.
The methodology developed by the European Sourcebook Group proved successful, and the first edition of the Sourcebook was published in 1999. Later, that methodology inspired the collection of data started at the beginning of the 2000s by Eurostat. In the same perspective, the United Nations Survey on Crime Trends and the Operations of Criminal Justice Systems (CTS) conducted by the UNODC has also incorporated, since the mid-2000s, the questions on
5 The members of the Group were: Martin Killias (Switzerland; chair), Gordon Barclay (United Kingdom),
Hanns von Hofer (Sweden), Imre Kertesz (Hungary), Max Kommer (Netherlands), Jörg-Martin Jehle (Germany), Chris Lewis (United Kingdom) and Pierre Tournier (France). HEUNI was represented by an observer (Kristiina Kangaspunta). The secretary to the Group was Wolfgang Rau, Directorate of Legal Affairs, Council of Europe.
6 France, Germany, Hungary, Ireland, Italy, the Netherlands, Norway, Sweden, Switzerland, United Kingdom.
7 The new members of the enlarged Group of Specialists were: Marcelo Aebi (Switzerland), Andri Ahven (Estonia), Uberto Gatti (Italy), Zdenek Karabec (Czech Republic), Vlado Kambovski (The Former Yugoslav Republic of Macedonia), Alberto Laguia Arrazola (Spain) and Calliope Spinellis (Greece). Paul Smit (Netherlands) and Bruno Aubusson de Cavarlay (France) joined the Group in December 1997 and April 1998 replacing Max Kommer and Pierre Tournier, respectively.

16
metadata developed by the Group. Currently, the members of the European Sourcebook Group are constantly in contact with Eurostat and the UNODC.8
After the publication of the first edition in 1999,9 the Council of Europe was, unfortunately, no longer able to support the project financially. To maintain continuity in the data collection effort and especially to avoid dismantling the network of national correspondents from the whole of Europe, the second (2003)10 and the third edition (2006)11 were funded and supported by different institutions: the British Home Office, the Swiss Foreign Ministry (through the Federal Office of Statistics and the School of Criminal Sciences of the University of Lausanne), the Dutch Ministry of Justice, the Centre d’Etudes Sociologiques sur le Droit et les Institutions Pénales (CESDIP), the European Commission and the German Federal Ministry of Justice. A small group of experts was responsible for updating data and improving data quality of the European Sourcebook of Crime and Criminal Justice Statistics.12
The fourth edition of the European Sourcebook13 was made possible with support from the European Commission under the AGIS programme.14 The results of the project funded by the Commission were published independently15 and, although the Sourcebook itself was not a result of that project the data collection instrument developed for it was used for collecting the data included in the 4th edition of the Sourcebook. In that context, efforts were made to extend the Sourcebook’s coverage beyond ordinary (“street level”) crimes and to include offences such as fraud, offences against computer data and systems, money laundering and corruption. Other offence definitions were completed or differentiated, such as assault, drug trafficking, sexual assault and sexual abuse of minors.
The current fifth edition took advantage of a project funded by the European Commission under the ISEC 2010 programme16 and aiming at improving data collection on the tasks and work of probation agencies and on community sanctions and measures, as well as developing indicators for the attrition process within the criminal justice system.17 Experts from the CEP 8 See Lewis, C. (2012). Crime and Justice Statistics Collected by International Agencies. European Journal on Criminal Policy and Research, 18, 5-21. 9 Council of Europe (Ed.) (1999). European sourcebook of crime and criminal justice statistics. Strasbourg: Council of Europe. Analysis of the results of the first edition is presented in a special issue of the European Journal of Criminal Policy and Research (8/1, 2000). 10 Aebi, M., Aromaa, K., Aubusson de Cavarlay, B., Barclay, G., Gruszczyńska, B., Hofer, H. v., Hysi, V., Jehle, J.-M., Killias, M., Smit, P. & Tavares, C. (2003). European Sourcebook of Crime and Criminal Justice Statistics – 2003. 2nd edition. Den Haag: Boom. Analysis of the results of the second edition is presented in a special issue of the European Journal of Criminal Policy and Research (10/2-3, 2004). 11 Aebi, M., Aromaa, K., Aubusson de Cavarlay, B., Barclay, G., Gruszczyńska, B., Hofer, H. v., Hysi, V., Jehle, J.-M., Killias, M., Smit, P. & Tavares, C. (2006). European Sourcebook of Crime and Criminal Justice Statistics – 2006. 3rd edition. Den Haag: Boom. 12 The members of the new group of experts were: Martin Killias (Switzerland, chair), Marcelo F. Aebi (Switzerland/Spain, database administrator), Kauko Aromaa (Finland), Bruno Aubusson de Cavarlay (France), Gordon Barclay (United Kingdom), Hanns von Hofer (Sweden), Beata Gruszczynska (Poland), Vasilika Hysi (Albania), Jörg-Martin Jehle (Germany), Paul Smit (Netherlands, website administrator), and Cynthia Tavares (United Kingdom, Secretariat). Chris Lewis (United Kingdom) also assisted with the editing of the final publication. 13 Aebi, M., Aubusson de Cavarlay, B., Barclay, G., Gruszczyńska, B., Harrendorf, S., Heiskanen, M., Hysi, V., Jaquier, V., Jehle, J-M., Killias, M., Shostko, O., Smit, P. & Þorisdottir, R. (2010). European Sourcebook of Crime and Criminal Justice Statistics – 2010. 4th edition. Den Haag: Boom. Analysis of the results of the first edition is presented in a special issue of the European Journal of Criminal Policy and Research (18/1, 2012). 14 JLS/2006/AGIS/134. The members of the expert group for the 4th edition were Martin Killias (Switzerland, chair); Marcelo Aebi (Switzerland, database administrator), Bruno Aubusson de Cavarlay (France), Gordon Barclay (United Kingdom), Beata Gruszczyńska (Poland), Stefan Harrendorf (Germany), Markku Heiskanen (Finland), Vasilika Hysi (Albania), Véronique Jaquier (Switzerland), Jörg-Martin Jehle (Germany), Olena Shostko (Ukraine), Paul Smit (The Netherlands), Rannveig Þorisdottir (Iceland). 15 Detailed results of the project can be found in: Jehle/Harrendorf (eds.): Defining and Registering Criminal Offences and Measures. Standards for a European Comparison. Göttingen: Universitätsverlag Göttingen 2010. 16 DECODEUR (HOME/2010/ISEC/FP/C1/4000001420). The project was managed by the European Institute for Crime Prevention and Control, affiliated with the United Nations (HEUNI). 17 Detailed results of this project are publicized parallel to this book in: Heiskanen/Aebi/van der Brugge/Jehle (eds.): Recording Community Sanctions and Measures and Assessing Attrition. A Methodological Study on Comparative Data in Europe. Helsinki: HEUNI 2014.

17
(Confederation of European Probation) were involved in order to improve the questionnaire and the data validation procedure in respect of probation statistics. Based on these efforts a broader range of data and information on community sanctions and measures connected with prosecutorial decisions and orders by the court and implemented by probation agencies –both for adults and for minors- can be presented in this edition.
From 2001 to 2012, the Dutch Ministry of Justice provided the necessary resources to set up and maintain a website containing all the data of the 1999, 2003, 2006 and 2010 editions of the European Sourcebook under the supervision of Paul Smit (WODC, Ministry of Justice of the Netherlands). Since 2012, the University of Lausanne supervised by Marcelo Aebi has taken over this function for the European Sourcebook. Results for all ESB editions, including the respective raw data, are available on this new ESB website (www.unil.ch/europeansourcebook).
Definitions of offences and sanctions
Comparative criminology has to face the problem of national offence definitions that are often incompatible. The Group adopted the following procedure: For all offences included in the European Sourcebook, a standard definition was developed and countries were invited to follow it whenever possible. Offence definitions and related commentaries are given in Appendix I to this book, providing for each of the selected offences detailed information on which countries (among those providing numerical data) were able to fully conform to the definition and which countries deviated from it. For the latter, there is also an indication of the elements of the definition that they were unable to meet. Data on definitions are presented separately for police and convictions levels.
The structure of the European Sourcebook
This edition of the European Sourcebook is divided into six chapters, each of which is, in general, subdivided into four sections:
1. General comments 2. Tables 3. Technical information 4. Sources
The six chapters are:
A. Police data. (offences and suspected offenders recorded by the police and police staff). Chapter 1 provides information on offences and suspected offenders known to the police in each country. Most of the data are available as time-series data for 2007-2011. Detailed information on the sex, age group, and nationality of suspects is provided for 2010. Most offences newly introduced in the last edition were also kept for the 5th edition. The definition of sexual assault was, however, completely revised, resulting in a break in the time series in all chapters. Results on offences committed with a firearm were introduced for homicide and robbery.
B. Prosecution statistics. The data in this chapter 2 cover all steps of decision-making at the prosecution level, such as initiating and abandoning prosecutions, bringing cases to court and sanctioning offenders by summary decisions. Data on the output of the prosecution level both for the total and for minors refer to 2007 – 2011. Separate data for females and aliens are given for 2010. For the first time, the chapter also features a breakdown by offence groups and by conditions imposed for ending proceedings, such as community service and victim-offender mediation. Data on compulsory measures during criminal proceedings, such as police custody and pre-trial detention, are also presented.
C. Conviction statistics. The tables in this chapter 3 deal with persons who have been convicted, i.e, found guilty according to law, of having committed a criminal offence. Information on convictions is presented by offence for the years 2007 to 2011. Detailed

18
information on the type of sanction imposed (including community sanctions and measures), on sentence lengths of custodial sanctions and on sex, age group, and nationality of the sentenced persons is provided for the year 2010.
D. Correctional statistics. Chapter 4 includes data on ‘stock’ and ‘flow’ of prison populations for the years 2007-2011, including percentages of pre-trial detainees, females, minors and aliens. It also includes data on the convicted population by offence group in 2010.
E. Probation statistics. Chapter 5 is based on data and information which were part of chapter 4 in the 1st and 2nd editions. Now the scope is widened and provides information on the number of persons placed under the supervision of probation agencies during 2010 (flow of entries), persons leaving such supervision during the same year (flow of exits), as well as on the stock of persons under such supervision on 31st December 2010. It also includes the same three types of information for the specific subcategories of persons under community service and under electronic monitoring. In all cases, detailed information on the reasons for ending supervision is also provided. Finally, the chapter includes information on the staff of probation agencies in 2010, and on the number of written reports provided by these agencies during the same year.
F. Survey data. As there was no recent International Crime Victimisation Survey to refer to for this edition, Chapter 6 now presents data on national victimization surveys carried out by the responding countries between 1990 and 2010. The chapter provides information about the methodology used in these surveys and presents some selected results.
Methodological issues Data recording methods
Since the timing and method of recording can have a considerable impact on a statistical measure, the Group paid much attention to the way in which national data were collected and recorded, and what operational definitions were applied at the several stages of the criminal justice process. Detailed information provided on this has been summarised in the form of tables, short comments and the definitions appendix.
Validation
Validation is often the most important and in many cases the most forgotten stage of the data collection process. As a first step, the Group identified and discussed obvious problems relating to this process. Data validation involved:
a. Trend checks: Consistency of trends was checked for the years covered by the new survey and also in comparison with the data provided for the 4th editions. This was mainly a check for ‘outliers’, i.e., extreme values which are difficult, if not impossible, to explain.
b. Internal validity checks: The coherence of results provided for different, logically connected variables was checked (for example, subcategories being smaller than and adding up to the total or the acceptable range of certain ratios, e.g., suspects by offences or convictions by suspects).
c. Other sources checks: If possible, results were compared to the results published in the surveys of Eurostat, UNODC and the Council of Europe (SPACE).
This procedure resulted in the need to go back to many national correspondents for clarification and additional cross-checking. Although some errors had been made when completing the questionnaire, which were then corrected, it is also apparent that the survey also identifies

19
many differences in national systems of criminal justice statistics, which are extensively documented in the metadata.
Concerning the new information and data on community sanctions and measures and on the work of probation agencies, experts of CEP (Confederation of European Probation) participated in the validation, checked the incoming data from the national ESB correspondents and involved their correspondents where necessary in order to improve data availability and quality (see chapter 5, technical information).
The year 2007 is covered by both the fourth and the fifth edition of the Sourcebook. In some cases, there are differences in these data. In principle, data included in the present edition should be considered as more accurate. Usually, the reason for these differences was that the data for the year 2007 of the fourth edition were provisional as the questionnaire had been sent a few months after the end of that year. Similarly, data for 2011 in the present edition – which were collected in 2012/2013 – could sometimes also be provisional.
Presentational details
In order to increase the clarity of the present report, the Group took the following practical decisions:
A. To make all raw data and all comments available in a separate document through the
website www.europeansourcebook.org. Thus, the present document contains only a selection of all the data and comments submitted.
B. To shorten, in general, tables where the number of reporting countries was very
small.18 C. To use decimals sparingly so as to avoid the impression of false precision. However,
increases and decreases have been computed taking all decimals into account. D. To use the English notation for figures. The decimal marker is represented by a dot
(i.e, 1.5 means one and a half). The thousand marker is represented by a space (i.e, 1 500 means one thousand five hundred).
E. To translate comments, where necessary (although left in the original language in the
database that can be accessed through the European Sourcebook website). F. To use the following symbols throughout the tables:
a) ‘0’ to indicate a number between 0 and 0.4; b) ‘...’ to indicate that data is not (yet) available or that the question / concept as
used in the European Sourcebook questionnaire does not apply; c) ‘> 1 000’ to indicate that the percentage change between 2007 and 2011 is
above one thousand per cent. G. To condense the vast amount of technical information on definitions, data collection
methods, processing rules, et cetera into clearly arranged summary tables, listings and footnotes.
H. Whenever possible and reasonable, figures were transformed into rates per 100 000
population or indicated as percentages. For minors rates are given per 100 000 total population as information is not available on the size of the minor population. The total population figures used are contained in appendix II at the end of the publication.
18 Only very few tables have been totally eliminated from the publication. In such a case, data are available on the website.

20
I. To use the following measures throughout the tables to provide information on the
data dispersion:
Mean: The (unweighted) arithmetic average; the sum of scores divided by the number of countries that provided data. The value of the mean is sensitive to the presence of very high or very low scores. For this reason the median was also included as an indicator of the central tendency of the data. Median: The (unweighted) median is the score that divides the distribution of scores into two exact halves. Minimum: The lowest score in the table. Maximum: The highest score in the table.
Percentage change 2007 – 2011 (based upon unrounded scores).
Comparability
The basic aim of the European Sourcebook data collection is to present comparable information on crime and criminal justice statistics in Europe.19 However, the issue of whether or not it is feasible to use official criminal justice statistics for decision-making in crime policy or for conducting scientific studies is one of the classic debates of criminology. The problems involved are even more serious when it comes to international comparisons, because nations differ widely in the way they organise their police and court systems, the way they define their legal concepts, and the way they collect and present their statistics. In fact, the lack of uniform definitions of offences and sanctions, of common measuring instruments and of common methodology makes comparisons between countries extremely hazardous. This is the reason why criminologists over the last decades have developed alternatives to complement the existing official statistics: international comparative victimization studies on the one hand and international comparative self-report studies on the other. Due to a lack of very recent international victimization studies, however, Chapter 6 covers data from national victimization surveys instead, which can be compared only with extreme caution.
Comparative analyses generally fall into one of three categories: (A) distributive comparisons, (B) level comparisons and, (C) trend comparisons.
A. Distributive comparisons are aimed at answering questions such as: Do theft offences dominate the crime picture in most countries? What is the age profile of sentenced offenders in the various countries?
B. Relevant questions for level comparisons are of the following type: Which country
reports the highest robbery rate? Which countries show low rates of incarcerated offenders? Which criminal justice systems have a high level of attrition, e.g., measured by the relation of convicted to suspected persons?
C. In contrast, interpretations of trends deal with such questions as: Did the decrease in
robbery offences differ over time in various countries?
Before these and other questions can be answered, it should be noted that official crime and criminal justice statistics are fundamentally dependent upon three sets of circumstances: (a) substantive factors such as the propensity of individuals to commit crimes, the opportunity structure, the risk of detection, the willingness of the public to report crimes, the efficiency of criminal justice authorities; (b) legal factors such as the design of the Criminal Code, the Code 19 See further Jehle, J.-M. (2013). Crime and Criminal Justice in Europe. The Approach of the European Sourcebook. In Kuhn, A., Schwarzenegger, C., Margot, P., Donatsch, A., Aebi, M.F. & Jositsch, D. (eds.), Criminology, Criminal Policy and Criminal Law in an International Perspective, Essays in Honour of Martin Killias on the Occasion of his 65th Birthday (pp. 191-205). Zürich: Stämpfli 2013.

21
of Criminal Procedure and other relevant legislation; the formal organisation of criminal justice agencies and the informal application of the law in everyday life; and (c) statistical factors such as the formal data collection and processing rules and their practical implementation.20
To ensure comparability when making distribution and level comparisons, one must carefully control the legal and statistical circumstances before concluding that similarities or dissimilarities can be taken as real. The demands are somewhat different when it comes to ascertaining crime trends. For such analyses, the ‘real’ crime level does not need to be known; it is sufficient to control for possible changes to the legal and statistical systems. This is of course a difficult task and identifying informal changes in criminal justice procedures and in statistical routines is especially difficult. In order to assist the reader in making informed decisions on the validity of trend data, possible changes in the data recording methods are indicated in the technical information contained in each chapter.21
To facilitate the use of the data contained in this European Sourcebook, comprehensive additional information concerning the definition of offences and sanctions, the data collection and processing rules were collected. This information is contained in section 3 of each chapter. However, it is not possible to easily quantify the extent to which over- or under-reporting occurs.
Basic rules on how to use the statistical information contained in the Sourcebook
1. Do not use any figures from the Sourcebook without referring to the footnotes and the
technical information provided in each chapter. 2. Do not over-interpret relatively ‘small’ differences in the tables, especially between countries. 3. Do not over-interpret relatively ‘large’ differences in the tables, especially between countries. 4. Do not stress differences between individual countries too much. It is better to compare an
individual country with a larger group of countries or with the average for all countries. 5. Whenever possible, avoid using the tables on police-recorded offences for ‘level’ comparisons
between countries. Rather, they should be used for ‘trend’ comparisons. Survey data are a more valid source for cross-national comparisons.
6. Avoid interpreting ‘large’ variations from one year to another as evidence for changes in the
measured phenomenon. Sudden increases or decreases are often merely indicative of modifications in the law or in the underlying statistical routines/counting rules.
20 For details, see von Hofer, H. (2000). Crime statistics as constructs: The case of Swedish rape statistics. European Journal on Criminal Policy and Research, 8(1), 77-89; Harrendorf (2012). Offence Definitions in the European Sourcebook of Crime and Criminal Justice Statistics and Their Influence on Data Quality and Comparability, European Journal on Criminal Policy and Research 18(1), 23-53. 21 Examples of how European Sourcebook data can be analyzed can especially be found in the following special issues of the European Journal of Criminal Policy and Research: 8/1 (2000), 10/2-3 (2004), 18/1 (2012). For a more detailed list of publications referring to European Sourcebook data, see http://www3.unil.ch/wpmu/europeansourcebook/publications/.

22

23
1. Police Statistics
1.1 General comments 1.1.1 Police statistics as a measure of crime
This chapter provides information on offences recorded by the police, the number and characteristics of suspected offenders, and the number of police staff.
Police statistics are collected in every country but for several reasons they do not offer a comprehensive measure of crime. Victims may choose not to report the crime to the police (e.g., depending on their previous experiences or trust in the police) or they may not be aware that they have been a victim of crime. In addition, reporting may be self-incriminating (e.g., when a victim is also an offender) or humiliating or the victim may think that nothing will be gained by reporting (e.g., the victim thinks that the police will not be able to solve the crime).
If the victim does not report a crime, and the police do not learn about the offence from another source, the offence will not be recorded and therefore not counted in police statistics. Research suggests that victims of assault or rape, for example, tend to be less likely to report the offence than victims of property crimes.22
Not all crimes are reported by a victim or a witness. The police themselves may report violent crimes, for example homicide and ‘victimless’ offences (such as illegal possession of arms, drink-driving and drug offences). Even when a crime is reported to the police, it may not be recorded in the official statistics. This may occur if the police believe that the event reported did not actually constitute a crime.
Petty offences are not always recorded in police statistics. Also, countries differ in the way they consider certain offences as petty (e.g., theft of low value items).
In assessing national differences, comparisons with other data sources, such as victimization surveys (e.g., the International Crime Victims Survey, ICVS), are helpful. The last sweep of the ICVS was carried out in 2005.
1.1.2 Police in the criminal justice system
In most countries the police are the first stage of the criminal justice process. However, this does not mean that the figures on recorded crime, such as those in this chapter, give an accurate account of the total input to the criminal justice system. In a number of countries, the prosecuting authorities may initiate criminal proceedings without receiving a police report. Also, other agencies (military police, customs, border police, and fiscal fraud squads) and individuals (foresters, judges, or even citizens) may have the power to initiate criminal proceedings by filing a complaint with the prosecution authorities or the court. Nevertheless, most of the offences covered by the Sourcebook will be reported to or detected by the police.
The position of the police in the criminal justice system may also directly influence the number of offences recorded and how they are classified. In some countries the police is quite independent in their activities whilst in others they may work under the close supervision of the prosecutor or the court.
Substantial differences exist between countries in the tasks that the police carry out. For example, in most countries the police deal with traffic offences such as drink-driving, causing bodily harm or petty traffic offences (such as speeding and illegal parking). Also, in most countries, the police have the additional task of maintaining public order and of assisting the
22 van Dijk, J., van Kesteren, J. & P. Smit (2007). Criminal Victimisation in International Perspective. Key Findings from the 2004-2005 ICVS and EU ICS. 257 Onderzoek en beleid. Den Haag: WODC.

24
public in various situations (from providing information to rendering first aid). This may not apply, however, to all types of police or related agencies that have been included in the tables on police staff. Therefore, care should be taken when relating police resources to the volume of recorded crime or the number of suspected offenders.
1.1.3 Counting offences and offenders
Certain classification issues need to be considered when examining police statistics:23
– The point in time when the offence is recorded in the statistics: did the recording follow the initial report (‘input’ statistic) or the initial investigation (‘output’ statistic)?
– Multiple offences: one offence can consist of several offences (e.g., rape, followed by a homicide and the use of an illegal weapon). Therefore, awareness of whether the offences committed are counted separately or whether a principal offence rule is applied (i.e., only counting the most serious offence) is essential.
– In addition, in relation to serial or continuous offending, issues such as whether a report of domestic violence experienced over a period of time is counted as one or several incidents are important.
Similar issues arise in connection with the counting of offenders. Differences between countries exist and practices range from recording a person as a ‘suspected offender’ as soon as the police are reasonably convinced that this is the case, to recording a person as a ‘suspect’ only after the prosecutor has started criminal proceedings.
1.1.4 Counting police officers
European countries organise their police systems in different ways. Most of them have more than one police force, e.g., state police, communal police, municipal police, gendarmerie or judicial police. They perform tasks in connection with the offences under consideration in this Sourcebook although some also undertake military duties (e.g., gendarmerie).
A standard definition for police officer was used. This included criminal police, traffic police, border police, gendarmerie and uniformed police but excluded customs police, tax police, military police, secret service police, part-time officers, police reservists, cadet police officers and court police (see Tables 1.3.1 - 1.3.2).
Many European countries have seen considerable increases in the private security industry over recent years and such increases can influence the counting of crime. For example, the increase of private security guards and doormen can lead to a fall in the counts of crime in retail shops and clubs as some guards may deal with crime themselves by banning offenders from their premises.
1.1.5 Results
Definitions and counting rules
Participating countries were able to give data on police statistics, with only small deviations from the standard definition, for sexual assault, robbery, total theft, domestic burglary and money laundering.24 However, for some offences there were more deviations from the standard
23 Aebi, M. F. (2008). Measuring the Influence of Statistical Counting Rules on Cross-National Differences in Recorded Crime. In K. Aromaa & M. Heiskanen (Eds.), Crime and Criminal Justice Systems in Europe and North America 1995-2004, 196-214. HEUNI Publication Series No. 55. Helsinki: European Institute for Crime Prevention and Control. 24 Azerbaijan, Bosnia-Herzegovina, Latvia, Luxemburg, Moldova, Montenegro, Romania, and TFYR of Macedonia did not provide data for the Police section, except for table 1.2.1.7.

25
definition, e.g., drug offences, bodily injury (assault), corruption in the public sector, and fraud. Variations from the standard definition are important when comparing levels of recorded crime among European countries. These variations are listed in detail at the end of this Sourcebook (Appendix I).
The point at which the data is recorded varies between countries; 18 countries reported that offences were recorded as soon as the offence is first reported to the police. 10 countries reported that recording is done subsequently, eight that recording occurs only after investigation. It is difficult to interpret the impact of these findings to the statistics but it seems that ‘as soon as’ and ‘subsequently’ imply that the legal labelling of the offence is the task of the police, whilst ‘after investigation’ seems to indicate that the labelling is done by the prosecuting authorities (output statistics) once the police inquiry has been completed. This might explain some of the differences in levels between countries, in particular for offences such as homicide and assault.
The rules for recording both multiple and serial offences vary between countries. For example, 16 countries stated that they apply a principal offence rule and 18 that they do not. In addition, multiple offences are counted as two or more offences in 19 countries but as one offence in 13 countries. Most countries (31 of 35) count an offence committed by more than one person as one offence.
Whilst many countries answered the question on the number of police officers and civilians working in the police, few were able to meet the standard definition.
Trends in both recorded crime and suspected offenders over the years 2007–2011 vary from one type of offence to another. For particular offences, in several Central and Eastern European countries trends are quite different from those observed in other countries. These variations may not necessarily reflect actual increases or decreases in the rates under consideration, but could also be the result of different perception of crime and of improvements in data collection or important changes in the legal definition of offences.
1.1.6 Comments by offences
Police statistics contain tables on offences and perpetrators in 22 crime categories. Also information on police staff is included. Compared to the previous Sourcebook tables on minor property and minor violent offences handled outside the criminal justice system, on minor bodily injury, bodily injury of a public servant, domestic violence and offences against computer data systems are omitted. The structure of questions on sexual violence has been improved.25 A question on whether a firearm was used is added to questions on homicide and robbery.
Total criminal offences
The rate of total criminal offences has decreased from 2007 to 2011 in 20 countries and increased in 13 countries. The overall trend was slightly decreasing.26
For the total criminal offences, differences between countries were large – even when traffic offences are removed. This reflects differences in the offences included or excluded and the point at which the statistics were recorded. Moreover, trends for total criminal offences described quite different situations as regards the type of offences covered, since many
25 In Sourcebook 5 the definitions of both rape and sexual abuse of a child have remained unchanged, but sexual assault has been changed to a general headline category covering all physical sexual contacts with persons against their will or with those who cannot validly consent, especially children. Rape and sexual abuse of a child are subcategories of this new definition of sexual assault. 26 Previous results (Sourcebook 4) analysed in Gruszczyńska B.& Heiskanen M. (2012). Trends in Police-recorded Offences. European Journal on Criminal Policy and Research 18(1), 83-100. For a longitudinal analysis of police statistics from the four first editions of the Sourcebook, covering the years 1990 to 2007, and a comparison with data from victimization surveys, see Aebi M.F. & Linde A. (2010). Is There a Crime Drop in Western Europe? European Journal on Criminal Policy and Research, 16(4): 251-277.

26
countries restrict their crime count to a smaller group of offences. Therefore, the figures on total criminal offences, but also on different crime types, should not be used for detailed country by country level comparisons without detailed knowledge of practices of the criminal justice systems in the respective countries. For Tables 1.2.3.1 – 1.2.3.22 (percentage of suspected female, minor and alien offenders) there was a large variation between countries. For instance, for total criminal offences the proportion of female offenders varied between four and 25%, and for juveniles between three and 19%.
Major traffic offences
Wide variations were found in recorded traffic offences; several Eastern European countries showed very low levels (less than 100 offences per 100 000 population) compared with some Western European countries where the highest rates exceed 900 offences per 100 000 population. Traffic offences cover severe road traffic offences.
Total homicide and completed homicide
Homicide rates vary significantly between countries, even when attempted homicide is excluded. Differences in definitions may influence homicide rates but do not explain these differences. For instance, seven countries excluded assault leading to death, six countries excluded attempts from the total homicide and five included negligent killing even though it was excluded from the standard definition.
A table on completed homicide based on Health Statistics is also included (Table 1.2.1.7). It supplements the results of the police data.
Total homicide rates have decreased in 24 countries and increased in 10 countries. Due to the small number of cases the annual homicide rates may vary considerably in small countries. The average proportion of female offenders for total homicide was 13%, and of minor perpetrators 6%.
Firearms and homicide
The involvement of firearms was asked in connection with homicide and robbery. The figures included homicide with a firearm regardless of whether shots had been fired. Firearms could also be used as a blunt weapon or threat, or in any other way.
18 countries had statistics on firearms regarding total homicide or completed homicide, and 10 countries on both. On average, in 2011 the rate of total homicides with firearms involved was 0.5 cases per 100 000 population (mean of 15 countries). In completed homicides the rate was 0.1 per 100 000 population (mean of 14 countries).
Bodily injury (assault)
Assault was defined as inflicting bodily injury on another person with intent. The definition is difficult to follow for those countries where the penal code does not require injury as a result of the assault. In these cases the act is assessed according to the circumstances of the incident.
It is evident that some European countries counted cases at the police level as public order offences rather than as assaults. A low rate of assault in a country may also be explained by the fact that a complaint from the victim may be a necessary condition for the police to record the case.
The rate of bodily injury recorded by the police was higher in Middle-European and Nordic countries than in Eastern European countries. The trend (2007-2011) in bodily injury was decreasing in 20 countries and increasing in 15 countries. On average, the share of both female and of minor offenders was 11%.

27
Sexual assault
Sexual assault was defined as sexual contact with a person against her or his will, or with a person who cannot validly consent to sexual acts. Almost all countries were able to adopt the standard definition.
The trend was stable with a mean of 33 sexual assaults in 2011. The highest rate (more than 50 per 100 000 population) was recorded in Scandinavian countries and in Belgium, France, Switzerland and United Kingdom (E & W, N. Ireland, Scotland), and the lowest (under 5) in Albania, Armenia and Turkey.
The proportion of female offenders was low with a mean of 5%, whereas the proportion of minors as offenders was 15%.
Rape
All countries that provided data for rape have similar features in their definition. Yet, there are variations in the inclusion and exclusion criteria provided in the questionnaire. Additionally, the reporting of rape to the police most likely differed between countries because of different social traditions.
The mean rate of rape was rather constant (11-12 per 100 000 population in 2007-2011). The rate varied between one and 69. Twelve countries showed a decrease in rape (20% or more), while in 11 countries the recorded rapes increased (10% or more). 1.5% of the offenders were females, and the average proportion of minor offenders was 12%.
Sexual abuse of a child
Sexual abuse of a child was defined as sexual intercourse or any other form of physical sexual contact with a person below the age of consent. Age of consent varied from 14 to 17.27
The trend was consistent between the years 2007-2011 with a mean of 12 incidents per 100 000 population. Out of the total number of offenders 4% were female offenders, whereas 22% were minor offenders.
Robbery
There were large differences in rates between countries, which can partly be explained by variations in the definition of robbery (mean rate 73, ranging between 10 and 411). Between 2007 and 2011, there was a decrease in recorded robbery in 17 countries, and an increase in 19 countries.
The proportion of female offenders was 6% but the proportion of minor offenders was 22 %, which is the highest proportion of minor offenders except for theft of a motor vehicle.
Nineteen countries provided data about robbery with firearms involved. Thirteen followed the standard definition. On average there were seven robberies conducted with the help of a firearm per 100 000 population in 2011.
Theft
All the different theft offences (except robbery) should have been included in this category. However, differences between countries cannot be explained completely by a variation in offence definition (e.g., exclusion of low value items does not result in significantly lower levels of recorded theft).
27 See Appendix I, Table 3, for age of consent for sexual abuse of a child by country
28
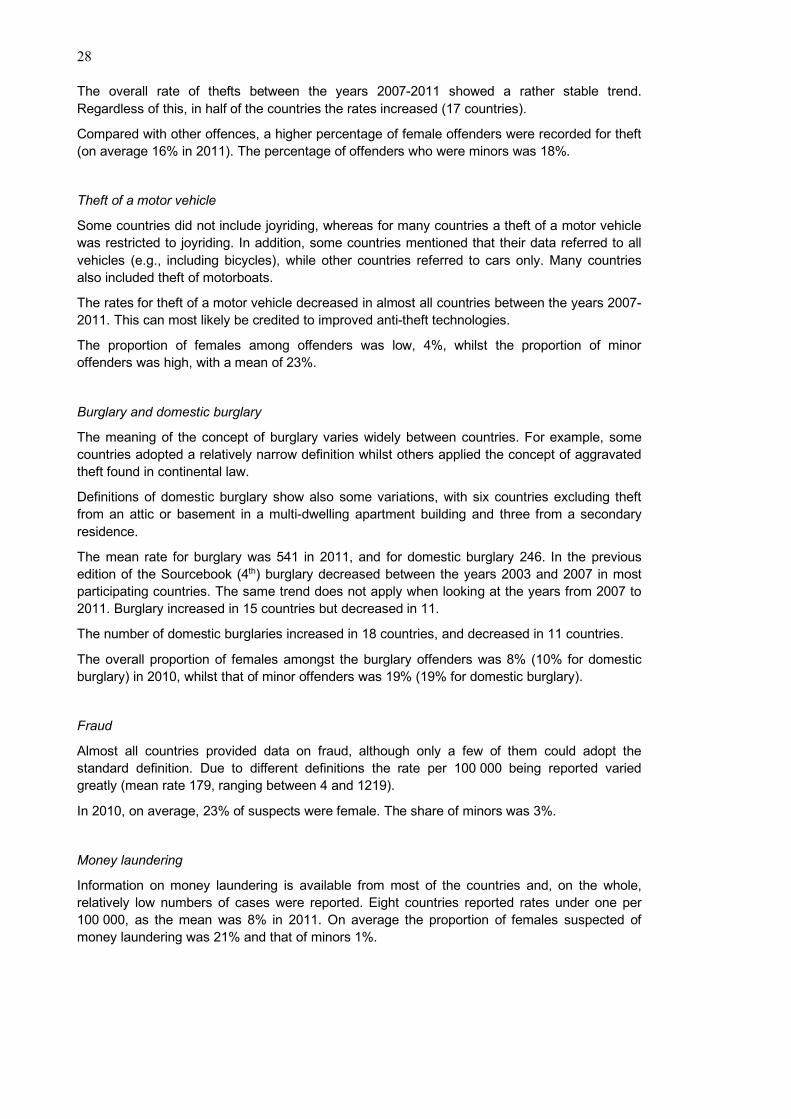
The overall rate of thefts between the years 2007-2011 showed a rather stable trend. Regardless of this, in half of the countries the rates increased (17 countries).
Compared with other offences, a higher percentage of female offenders were recorded for theft (on average 16% in 2011). The percentage of offenders who were minors was 18%.
Theft of a motor vehicle
Some countries did not include joyriding, whereas for many countries a theft of a motor vehicle was restricted to joyriding. In addition, some countries mentioned that their data referred to all vehicles (e.g., including bicycles), while other countries referred to cars only. Many countries also included theft of motorboats.
The rates for theft of a motor vehicle decreased in almost all countries between the years 2007-2011. This can most likely be credited to improved anti-theft technologies.
The proportion of females among offenders was low, 4%, whilst the proportion of minor offenders was high, with a mean of 23%.
Burglary and domestic burglary
The meaning of the concept of burglary varies widely between countries. For example, some countries adopted a relatively narrow definition whilst others applied the concept of aggravated theft found in continental law.
Definitions of domestic burglary show also some variations, with six countries excluding theft from an attic or basement in a multi-dwelling apartment building and three from a secondary residence.
The mean rate for burglary was 541 in 2011, and for domestic burglary 246. In the previous edition of the Sourcebook (4th) burglary decreased between the years 2003 and 2007 in most participating countries. The same trend does not apply when looking at the years from 2007 to 2011. Burglary increased in 15 countries but decreased in 11.
The number of domestic burglaries increased in 18 countries, and decreased in 11 countries.
The overall proportion of females amongst the burglary offenders was 8% (10% for domestic burglary) in 2010, whilst that of minor offenders was 19% (19% for domestic burglary).
Fraud
Almost all countries provided data on fraud, although only a few of them could adopt the standard definition. Due to different definitions the rate per 100 000 being reported varied greatly (mean rate 179, ranging between 4 and 1219).
In 2010, on average, 23% of suspects were female. The share of minors was 3%.
Money laundering
Information on money laundering is available from most of the countries and, on the whole, relatively low numbers of cases were reported. Eight countries reported rates under one per 100 000, as the mean was 8% in 2011. On average the proportion of females suspected of money laundering was 21% and that of minors 1%.

29
Corruption
According to the standard definition provided by the questionnaire, corruption refers to “the offering or accepting of a financial or any other advantage in exchange for favourable treatment by public officials”. Almost all countries provided data on corruption, but a few of them could adopt the standard definition. Most countries reported low numbers of cases, but some countries showed a rate considerably higher than the average rate, e.g., Poland and Lithuania.
Drug offences
There were wide variations in the number of reported drug offences between countries. For example 18 countries reported an increase in the number of total drug offences between 2007 and 2011 but 14 countries reported a decrease for that same period.
Proportionally more countries reported an increase in the number of drug trafficking offences between the years 2007 and 2011 when compared with the overall drug offences.
The mean rate for drug offences was 260, and for drug trafficking 50 per 100 000 population. On average 10% of those suspected of overall drug offences were female. The same applies to the overall percentage of those suspected of drug trafficking. Minors were on average 7% of those suspected of overall drug offences but 5% of those suspected of drug trafficking.
Trends
Table 1a summarises trends (i.e., percentage changes between 2007 and 2011) in police data by type of offences. The purpose is to give a general view of differences in trends for each offence in a given country; the table should not be used to examine changes in specific offences between the countries.

30
Table 1.a Trends in police data (percentage change of the rates between 2007-2011)28 Homicide Assault Rape Robbery Theft Drug Offences
Total Comp-leted Total Motor
vehicle Burglary Total Drug trafficking
Total Domestic burglary
Albania ↔ ↗ ↑ ↘ ↑ ↗ ↗ ↗ ↗ ↗ ↗ Armenia ↘ ↘ ↑ ↔ ↗ ↗ ↓ ↗ ↑ Austria ↗ ↗ ↔ ↗ ↘ ↘ ↘ ↘ ↔ ↔ Belgium ↗ ↔ ↔ ↔ ↗ ↔ ↘ ↗ ↗ ↔ Bulgaria ↘ ↘ ↓ ↘ ↔ ↔ ↘ ↗ Croatia ↘ ↘ ↘ ↘ ↔ ↔ ↘ ↔ ↗ ↔ ↗ Cyprus ↔ ↘ ↗ ↗ ↗ ↗ ↗ ↗ ↔ ↘ Czech Republic ↘ ↘ ↔ ↘ ↘ ↘ ↔ ↔ ↗ ↗ Denmark ↘ ↔ ↘ ↘ ↔ ↗ ↘ ↗ ↗ ↗ ↗ Estonia ↔ ↘ ↔ ↘ ↘ ↔ ↘ ↘ ↘ ↘ Finland ↘ ↘ ↗ ↗ ↔ ↔ ↘ ↗ ↔ ↗ ↗ France ↔ ↘ ↗ ↔ ↔ ↔ ↘ ↔ ↗ ↗ ↔ Georgia ↘ ↓ ↘ ↘ ↓ ↘ ↓ ↘ ↓ Germany ↔ ↘ ↔ ↔ ↔ ↔ ↘ ↔ ↗ ↔ ↘ Greece ↔ ↔ ↘ ↘ ↗ ↗ ↔ ↗ ↔ Hungary ↔ ↔ ↗ ↔ ↔ ↔ ↘ ↗ ↗ ↗ ↘ Iceland ↗ ↗ ↘ ↗ ↔ ↗ ↔ ↘ ↘ ↔ ↘ Ireland ↘ ↔ ↗ ↗ ↔ ↘ ↗ ↔ ↗ Kosovo (UNR) ↗ ↘ ↗ ↓ ↗ ↗ ↗ ↘ ↗ ↗ ↗ Lithuania ↘ ↘ ↔ ↗ ↘ ↔ ↘ ↘ ↗ ↗ Malta ↘ ↘ ↓ ↗ ↗ ↔ ↔ ↗ ↗ ↗ Netherlands ↑ ↘ ↘ ↗ ↔ ↔ ↗ ↘ Norway ↗ ↑ ↔ ↗ ↗ ↔ ↘ ↘ ↔ Poland ↘ ↘ ↔ ↘ ↘ ↔ ↘ ↔ ↔ ↗ ↗ Portugal ↘ ↔ ↗ ↗ ↔ ↘ ↗ ↗ ↗ ↗ Russia ↘ ↘ ↘ ↓ ↘ ↘ ↘ ↔ Serbia ↘ ↘ ↘ ↘ ↗ ↔ ↗ ↗ ↔ ↔ ↔ Slovakia ↔ ↗ ↘ ↘ ↘ ↘ ↘ ↘ ↘ ↗ ↗ Slovenia ↔ ↘ ↘ ↘ ↘ ↔ ↘ ↘ ↔ ↔ ↔ Spain ↗ ↔ ↗ ↔ ↗ ↗ ↘ ↗ ↗ Sweden ↘ ↔ ↗ ↗ ↔ ↘ ↔ ↗ ↗ ↗ Turkey ↔ ↘ ↘ ↓ ↓ ↓ Ukraine ↘ ↘ ↘ ↘ ↑ ↘ ↘ ↘ ↔ UK: E & W ↘ ↘ ↘ ↗ ↘ ↘ ↘ ↘ ↘ ↔ ↗ UK: N. Ireland ↘ ↘ ↑ ↗ ↔ ↔ ↘ ↔ ↔ ↗ ↗ UK: Scotland ↘ ↘ ↔ ↗ ↘ ↔ ↘ ↔ ↔ ↘ ↘
Note: ↓ = decrease of more than 50% ↘ = decrease of 10% to 50% ↔ = decrease or increase of less than 10% ↗ = increase of 10% to 100% ↑ = increase of more than 100%
28 Only those countries are included which have been able to provide data for at least one crime trend.

31
1.1.7 Police staff
The ratio of police officers (excluding civilians) per 100 000 (hereafter referred to as police density) in 2011 varied between 150 (in Finland) and 940 (in Georgia). Table 1.b gives the distribution over five density categories.
Eight countries had a police density below 300 and five over 500. In most of the countries that were able to provide information regarding civilian employees the number was under 100 per 100 000. Seven countries reported figures higher than 100, Serbia (167), United Kingdom: Scotland (142), United Kingdom: Northern Ireland (139), United Kingdom: England & Wales (132), Estonia (129) and Croatia (123).
Overall, there does not seem to be a clear relationship between policy density and the level of recorded crime. However, in Sweden and Finland, where the police density is low, the rate of total offences per 100 000 population is high. Furthermore, in Cyprus, Georgia and Ukraine the police density was high and the level of total crime was low.
Table 1.b Number of police officers excluding civilians per 100 000 population (police density) in 2011
Under 200 200-299 300-399 400-499 500 and over
Denmark Bulgaria Albania Croatia Cyprus Finland Iceland Austria Greece Georgia Netherlands Belgium Malta Italy Poland Czech Republic Portugal Spain Sweden Estonia Serbia Ukraine UK: E & W Germany Slovakia Hungary UK: Northern Ireland Ireland Lithuania Slovenia Turkey UK: Scotland
Overall, 23 countries were able to give data for civilian employees in the police force in 2011. The share of civilians was the highest in Denmark, the Netherlands, United Kingdom: England and Wales, and United Kingdom: Scotland. Table 1.c Percentage of civilian police staff (officers and civilians) in 2011
Under 10% 10-19% 20-29% 30-39% 40% or more
Bulgaria Albania Belgium Estonia Denmark
Cyprus Austria Croatia Finland Netherlands
Portugal Germany Czech Republic Hungary UK: E & W
Spain Slovenia Lithuania Serbia UK: Scotland
Turkey Poland Sweden
UK: Northern Ireland

32
1.2 Tables 1.2.1 Offences
Table 1.2.1.1 Offences per 100 000 population – Criminal offences: Total
2007 2008 2009 2010 2011 % change 2007-2011
Albania 318 431 411 507 623 96 Armenia 261 287 443 476 508 94 Austria 7174 6885 7081 6397 6425 -10 Belgium 9351 9291 9377 9319 9469 1 Bulgaria 1754 1658 1816 1944 1745 -1 Croatia 1708 1681 1657 1657 1714 0 Cyprus 970 928 890 1024 1003 3 Czech Republic 3474 3312 3180 2983 3025 -13 Denmark 8174 8710 8923 8511 8394 3 Estonia 3753 3802 3608 3607 3176 -15 Finland 8259 8315 8287 8066 8525 3 France 5808 5725 5646 5506 5462 -6 Georgia 1377 1019 820 783 722 -48 Germany 7635 7436 7383 7253 7328 -4 Greece 3790 3746 3436 2954 1716 -55 Hungary 4241 4066 3928 4465 4520 7 Iceland 4238 4621 4999 4694 3969 -6 Ireland ... ... ... ... ... ... Italy 4960 4545 4380 4344 ... ... Kosovo (UNR) 3163 3157 3008 2826 3612 14 Lithuania 2179 2319 2484 2333 2605 20 Malta 3679 3364 2890 3209 3425 -7 Netherlands 7971 7789 7609 7204 7169 -10 Norway 6693 6421 6553 6278 5999 -10 Poland 3024 2839 2962 3016 3009 -1 Portugal 3776 4068 4024 3987 3927 4 Russia 2519 2260 2110 1852 1683 -33 Serbia 1397 1428 1397 1384 1368 -2 Slovakia 2054 1940 1938 1756 1722 -16 Slovenia 4387 4075 4304 4372 4328 -1 Spain 2028 2078 1956 1894 2421 19 Sweden 14334 15005 15186 14671 15042 5 Switzerland ... ... 8781 8437 8805 ... Turkey ... ... ... ... ... ... Ukraine 864 832 946 1094 1131 31 UK: England & Wales 9159 8638 7915 7514 7079 -23 UK: Northern Ireland 6166 6202 6101 5838 5722 -7 UK: Scotland 12742 12499 11676 10845 10592 -17 Mean 4668 4611 4670 4528 4513 Median 3776 3802 3768 3797 3612 Minimum 261 287 411 476 508 Maximum 14334 15005 15186 14671 15042

33
Table 1.2.1.2 Offences per 100 000 population – Offences – Criminal offences: Major
traffic offences
2007 2008 2009 2010 2011
% change 2007-2011
Albania ... 15 16 32 68 ... Armenia 13 12 24 27 29 131 Austria 420 413 403 410 423 1 Belgium ... ... ... ... ... ... Bulgaria 245 254 263 227 205 -16 Croatia 57 53 49 41 40 -31 Cyprus 23162 29082 23088 26531 29305 27 Czech Republic 98 103 84 64 64 -35 Denmark ... ... ... ... ... ... Estonia 382 325 242 258 285 -25 Finland 1231 1145 1055 989 997 -19 France ... ... ... ... ... ... Georgia 63 70 56 59 62 -1 Germany ... ... ... ... ... ... Greece 1617 1400 1189 822 39 -98 Hungary 229 194 176 164 140 -39 Iceland ... ... ... ... ... ... Ireland 1473 1447 1173 1060 ... ... Italy 3 3 2 2 ... ... Kosovo (UNR) 800 740 881 817 1053 32 Lithuania 102 73 51 46 46 -55 Malta ... ... ... ... ... ... Netherlands 1033 998 947 930 913 -12 Norway 1002 952 869 836 759 -24 Poland 442 441 441 411 427 -3 Portugal 432 407 388 407 402 -7 Romania ... ... ... ... ... ... Russia 164 154 143 141 140 -15 Serbia 41 40 35 29 29 -31 Slovakia 54 54 42 37 34 -37 Slovenia ... ... ... ... ... ... Spain 46 98 114 105 146 219 Sweden 881 897 838 826 822 -7 Switzerland ... ... ... ... ... ... Turkey ... ... ... ... ... ... Ukraine 46 40 32 28 30 -34 UK: England & Wales 10 9 8 7 6 -32 UK: Northern Ireland 32 46 54 45 44 38 UK: Scotland 889 808 719 634 609 -32 Mean 1249 1389 1151 1241 1375 Median 237 194 176 164 140 Minimum 3 3 2 2 6 Maximum 23162 29082 23088 26531 29305

34
Table 1.2.1.3 Offences per 100 000 population – Offences – Intentional homicide: Total
2007 2008 2009 2010 2011
% change 2007-2011
Albania 11.5 10.3 9.8 11.1 11.9 4 Armenia 3.1 3.3 3.0 2.1 2.7 -11 Austria 1.5 1.4 1.8 2.1 2.2 47 Belgium 8.6 8.3 8.7 8.7 9.6 12 Bulgaria 3.3 3.0 2.9 2.8 2.6 -22 Croatia 5.1 4.9 4.6 4.2 4.1 -20 Cyprus 2.8 2.8 4.8 2.2 2.5 -11 Czech Republic 1.9 1.9 1.7 1.6 1.6 -14 Denmark 4.4 4.6 4.9 3.7 3.7 -18 Estonia 8.2 7.8 7.1 6.3 7.5 -9 Finland 10.1 9.9 9.5 8.3 8.2 -19 France 3.6 3.6 3.1 3.2 3.5 -1 Georgia 16.9 14.9 11.3 9.4 8.9 -47 Germany 3.0 2.9 2.9 2.8 2.8 -8 Greece 2.1 2.2 2.2 2.2 1.9 -8 Hungary 2.9 2.9 2.7 2.8 2.8 -6 Iceland 1.6 1.0 1.6 1.9 1.9 16 Ireland 1.8 1.1 1.3 1.2 0.9 -49 Italy 3.9 3.9 3.3 3.1 ... ... Kosovo (UNR) 10.5 12.8 11.8 11.8 14.5 38 Lithuania 8.3 8.9 7.7 6.5 6.9 -16 Malta 2.5 2.7 2.4 1.9 2.2 -12 Netherlands 9.8 10.1 19.4 24.0 24.6 152 Norway 2.3 2.7 2.3 2.2 3.6 61 Poland 2.8 2.6 2.5 2.3 2.2 -22 Portugal ... ... ... ... ... ... Russia 1.6 1.4 1.2 1.1 1.0 -36 Serbia 5.2 4.5 4.8 4.4 4.1 -20 Slovakia 1.7 1.7 1.6 1.6 1.8 8 Slovenia 2.3 1.5 2.6 2.0 2.5 6 Spain 2.3 2.3 2.1 2.0 2.6 15 Sweden ... ... ... ... ... ... Switzerland ... ... 3.1 3.1 2.9 ... Turkey 2.2 2.0 ... 2.2 2.0 -9 Ukraine 6.3 5.9 5.4 5.1 5.5 -12 UK: England & Wales 2.5 2.2 2.2 2.1 1.8 -27 UK: Northern Ireland 9.3 8.5 7.6 7.7 7.6 -19 UK: Scotland 16.6 15.4 13.5 11.9 12.1 -27 Mean 5.2 5.0 5.1 4.8 5.1 Median 3.1 3.0 3.1 2.8 2.8 Minimum 1.5 1.0 1.2 1.1 0.9 Maximum 16.9 15.4 19.4 24.0 24.6

35
Table 1.2.1.4 Offences per 100 000 population – Offences – Intentional homicide:
Firearm involved
2007 2008 2009 2010 2011
% change 2007-2011
Albania ... ... ... ... ... ... Armenia ... ... ... ... ... ... Austria 0.2 0.1 0.2 0.2 0.2 29 Belgium 0.8 0.5 0.6 1.0 0.9 13 Bulgaria ... ... ... ... ... ... Croatia 1.4 1.2 1.1 1.1 1.0 -29 Cyprus ... ... ... 0.5 0.7 ... Czech Republic ... ... ... ... ... ... Denmark ... ... ... ... ... ... Estonia ... ... ... ... ... ... Finland ... ... ... ... ... ... France ... ... ... ... ... ... Georgia ... ... ... ... ... ... Germany 0.2 0.2 0.2 0.2 0.2 -19 Greece ... ... ... ... ... ... Hungary 0.2 0.2 0.1 0.3 0.2 -9 Iceland ... ... ... ... ... ... Ireland 0.4 0.5 0.5 0.5 0.3 -27 Italy ... ... ... ... ... ... Kosovo (UNR) ... ... ... ... ... ... Lithuania 0.2 0.2 0.2 0.3 0.0 -86 Malta 1.5 1.5 1.0 0.5 0.2 -84 Netherlands ... ... ... ... ... ... Norway ... ... ... ... ... ... Poland 0.1 0.1 0.1 0.1 0.1 -63 Portugal ... ... ... ... ... ... Russia ... ... ... ... ... ... Serbia 1.8 1.8 1.6 1.2 0.9 -50 Slovakia 0.3 0.3 0.3 0.3 0.3 -22 Slovenia ... ... ... ... ... ... Spain 0.4 0.4 0.4 0.3 0.4 0 Sweden ... ... ... ... ... ... Switzerland ... ... ... ... ... ... Turkey ... ... ... ... ... ... Ukraine ... ... ... ... ... ... UK: England & Wales 0.4 0.4 0.3 0.3 0.3 -43 UK: Northern Ireland 1.4 1.6 1.5 1.1 1.3 -7 UK: Scotland ... ... ... ... ... ... Mean 0.7 0.6 0.6 0.5 0.5 Median 0.4 0.4 0.4 0.3 0.3 Minimum 0.1 0.1 0.1 0.1 0.0 Maximum 1.8 1.8 1.6 1.2 1.3

36
Table 1.2.1.5 Offences per 100 000 population – Offences – Intentional homicide:
Completed
2007 2008 2009 2010 2011
% change 2007-2011
Albania 3.3 2.9 2.6 4.1 4.4 34 Armenia 2.2 2.4 2.1 1.3 1.8 -17 Austria 0.6 0.7 0.6 0.7 1.0 61 Belgium 2.0 1.9 1.7 1.7 1.9 -6 Bulgaria 2.2 2.3 2.0 2.0 1.7 -21 Croatia 1.6 1.8 1.1 1.4 1.3 -19 Cyprus 1.4 1.1 2.4 0.9 1.0 -33 Czech Republic ... ... ... ... ... ... Denmark 1.0 1.0 1.1 1.0 1.0 -2 Estonia 6.9 6.3 5.2 5.2 6.2 -11 Finland 2.9 3.0 2.6 2.5 2.5 -14 France 1.8 1.8 1.4 1.4 1.5 -15 Georgia 7.5 6.0 4.7 4.1 2.3 -70 Germany 1.0 0.9 0.9 0.9 0.8 -15 Greece 1.0 1.1 1.1 1.0 0.9 -10 Hungary 1.5 1.5 1.4 1.3 1.4 -6 Iceland 0.7 0.0 0.3 0.6 0.9 45 Ireland ... ... ... ... ... ... Italy 1.2 1.1 1.1 1.0 ... ... Kosovo (UNR) 3.3 3.7 2.7 2.9 2.7 -17 Lithuania 7.9 8.5 7.2 6.0 6.2 -21 Malta 1.0 1.5 1.0 1.0 0.7 -26 Netherlands ... ... ... ... ... ... Norway 0.6 0.7 0.6 0.6 2.3 252 Poland 1.9 2.1 1.8 1.7 1.6 -16 Portugal 1.2 1.4 1.4 1.3 1.1 -11 Russia ... ... ... ... ... ... Serbia 2.0 1.7 1.9 1.6 1.6 -19 Slovakia 1.1 1.1 0.9 1.0 1.3 19 Slovenia 1.2 0.5 0.6 0.5 0.8 -35 Spain 0.8 0.8 0.8 0.7 0.8 2 Sweden 1.2 0.8 1.0 1.0 0.9 -27 Switzerland ... ... 0.7 0.7 0.6 ... Turkey 2.2 2.0 ... 1.7 1.5 -30 Ukraine 6.0 5.6 5.2 ... ... ... UK: England & Wales 1.4 1.2 1.1 1.1 1.0 -29 UK: Northern Ireland 1.7 1.5 1.2 1.6 1.3 -25 UK: Scotland 2.2 1.9 1.6 1.9 1.8 -19 Mean 2.3 2.1 1.9 1.7 1.8 Median 1.6 1.5 1.4 1.3 1.4 Minimum 0.6 0.0 0.3 0.5 0.6 Maximum 7.9 8.5 7.2 6.0 6.2

37
Table 1.2.1.6 Offences per 100 000 population – Offences – Intentional homicide:
Completed: Firearm involved
2007 2008 2009 2010 2011
% change 2007-2011
Albania ... ... ... ... ... ... Armenia ... ... ... ... ... ... Austria 0.1 0.1 0.1 0.2 0.1 81 Belgium 0.2 0.1 0.1 0.2 0.2 -9 Bulgaria ... ... ... ... ... ... Croatia 0.7 0.6 0.4 0.6 0.2 -65 Cyprus 0.4 0.4 0.6 0.1 0.2 -38 Czech Republic ... ... ... ... ... ... Denmark ... ... ... ... ... ... Estonia ... ... ... ... ... ... Finland ... ... ... ... ... ... France ... ... ... ... ... ... Georgia ... ... ... ... ... ... Germany ... ... ... ... ... ... Greece ... ... ... ... ... ... Hungary 0.1 0.1 0.1 0.1 0.1 1 Iceland 0.3 0.0 0.0 0.0 0.0 -100 Ireland ... ... ... ... ... ... Italy ... ... ... ... ... ... Kosovo (UNR) ... ... ... ... ... ... Lithuania 0.2 0.1 0.2 0.1 0.0 -84 Malta 0.5 1.2 0.0 0.5 0.0 -100 Netherlands ... ... ... ... ... ... Norway ... ... ... ... ... ... Poland ... ... ... ... ... ... Portugal 0.5 0.5 0.4 0.4 0.2 -56 Russia ... ... ... ... ... ... Serbia 0.7 0.7 0.7 0.5 0.4 -46 Slovakia 0.2 0.2 0.1 0.1 0.2 -17 Slovenia ... ... ... ... ... ... Spain 0.1 0.1 0.2 0.1 0.1 -12 Sweden ... ... ... ... ... ... Switzerland ... ... ... ... ... ... Turkey ... ... ... ... ... ... Ukraine ... ... ... ... ... ... UK: England & Wales 0.1 0.1 0.1 0.1 0.1 -20 UK: Northern Ireland ... 0.3 ... 0.3 0.2 ... UK: Scotland ... ... ... ... ... ... Mean 0.3 0.3 0.2 0.2 0.1 Median 0.2 0.2 0.1 0.2 0.2 Minimum 0.1 0.0 0.0 0.0 0.0 Maximum 0.7 1.2 0.7 0.6 0.4

38
Table 1.2.1.7 Offences per 100 000 population – Offences – Intentional homicide
according to Health Statistics29
2007 2008 2009 2010 2011
% change 2007-2011
Albania ... ... ... ... ... ... Armenia ... 1.9 1.7 ... ... ... Austria 0.6 0.6 0.7 0.5 0.5 -15 Azerbaijan 0.3 ... ... ... ... ... Belgium 1.5 1.2 1.2 ... ... ... Bulgaria 1.7 1.5 1.8 1.3 1.2 -31 Croatia 1.4 1.7 1.2 1.3 1.0 -26 Cyprus 1.4 1.2 2.0 0.5 1.2 -16 Czech Republic 1.0 0.7 0.8 0.8 0.8 -21 Denmark ... ... ... ... 0.8 ... Estonia 6.8 6.4 5.6 4.4 4.6 -32 Finland 2.2 2.2 1.9 1.9 1.9 -13 France 0.6 0.7 0.7 ... ... ... Georgia 1.1 ... 0.6 0.3 ... ... Germany 0.6 0.5 0.5 0.6 0.5 -12 Greece 1.1 1.2 1.3 1.4 1.5 41 Hungary 1.7 1.9 1.3 1.4 1.4 -13 Iceland 0.6 0.3 0.3 ... ... ... Ireland 1.0 0.9 1.0 0.8 ... ... Italy 0.9 0.8 0.8 0.7 ... ... Kosovo (UNR) ... ... ... ... ... ... Latvia 8.0 7.1 5.9 5.6 ... ... Lithuania 6.9 7.0 5.6 5.0 ... ... Luxembourg 1.2 1.1 0.9 2.1 0.5 -63 Malta 0.7 1.2 0.7 1.0 0.5 -32 Moldova 6.8 7.1 6.4 6.9 5.3 -22 Montenegro 0.7 2.2 2.0 ... ... ... Netherlands 0.9 0.9 0.9 0.9 0.9 -4 Norway 0.7 0.6 0.6 0.7 2.4 255 Poland 1.3 1.2 1.0 0.9 1.0 -24 Portugal 1.0 1.3 0.9 1.2 0.9 -9 Romania 2.0 2.3 2.2 2.2 ... ... Russia 16.8 15.6 14.0 12.3 ... ... Serbia 2.5 1.8 1.8 1.7 1.6 -36 Slovakia ... 1.2 1.1 1.1 ... ... Slovenia 0.9 0.6 0.5 0.4 ... ... Spain 0.7 0.8 0.7 0.7 0.7 -1 Sweden 1.2 0.8 0.9 1.0 ... ... Switzerland 0.6 0.5 0.7 0.5 ... ... TFYR of Macedonia 2.3 1.9 1.4 2.1 ... ... Turkey ... ... ... ... ... ... Ukraine 8.5 7.6 6.3 5.6 5.2 -39 United Kingdom 0.4 0.3 0.3 0.3 ... ... Mean 2.4 2.3 2.1 2.0 1.6 Median 1.1 1.2 1.1 1.1 1.0 Minimum 0.3 0.3 0.3 0.3 0.5 Maximum 16.8 15.6 14.0 12.3 5.3
29 Source: World Health Organization. “European health for all database”. Homicide and intentional injury, all ages per 100 000 population. Available online: http://data.euro.who.int/hfadb/ Retrieved on 22 April 2014.

39
Table 1.2.1.8 Offences per 100 000 population – Offences – Bodily injury (Assault): Total
2007 2008 2009 2010 2011
% change 2007-2011
Albania 6 28 33 45 51 796 Armenia 16 16 44 42 42 158 Austria 474 487 494 457 481 1 Belgium 702 715 722 716 713 2 Bulgaria 39 23 22 22 20 -49 Croatia 43 46 44 41 37 -14 Cyprus 18 21 27 21 20 7 Czech Republic 60 52 45 46 50 -16 Denmark 253 241 228 229 224 -11 Estonia 358 402 350 335 370 3 Finland 656 657 618 618 747 14 France 354 375 385 385 384 8 Georgia 4 5 3 3 2 -41 Germany 641 636 639 637 634 -1 Greece 184 181 178 176 139 -24 Hungary 114 130 128 146 143 25 Iceland 112 105 105 81 85 -24 Ireland 352 369 349 332 317 -10 Italy 108 110 109 108 ... ... Kosovo (UNR) 129 154 159 166 203 58 Lithuania 122 116 105 105 135 10 Malta 307 48 42 43 44 -86 Netherlands 438 421 398 364 357 -19 Norway 339 328 306 295 296 -13 Poland 147 141 140 134 136 -7 Portugal 534 566 584 586 563 6 Russia 33 32 30 28 27 -19 Serbia 52 51 51 48 42 -19 Slovakia 55 50 48 45 41 -25 Slovenia 123 106 107 107 96 -22 Spain 36 35 34 33 40 10 Sweden 903 921 932 941 950 5 Switzerland ... ... 134 126 121 ... Turkey ... 17 ... 37 27 ... Ukraine 37 34 32 29 29 -22 UK: England & Wales 836 772 732 666 602 -28 UK: Northern Ireland 31 45 71 61 55 78 UK: Scotland 1546 1546 1488 1450 1396 -10 Mean 282 270 268 255 260 Median 126 116 128 117 135 Minimum 4 5 3 3 2 Maximum 1546 1546 1488 1450 1396

40
Table 1.2.1.9 Offences per 100 000 population – Offences – Bodily injury (Assault):
Aggravated bodily injury
2007 2008 2009 2010 2011 % change
2007-2011 Albania 6 8 9 6 6 5 Armenia 6 7 6 5 5 -9 Austria 47 47 48 43 46 -1 Belgium 28 30 33 37 45 59 Bulgaria 1 1 1 1 1 -40 Croatia 22 23 22 21 19 -17 Cyprus 14 16 22 15 15 6 Czech Republic ... ... ... ... ... ... Denmark 31 30 29 32 31 -3 Estonia 11 10 8 8 8 -28 Finland 45 43 40 37 38 -15 France ... ... ... ... ... ... Georgia 0 1 0 0 1 22 Germany 188 184 182 175 170 -10 Greece ... ... ... ... ... ... Hungary 68 76 70 78 68 1 Iceland 16 24 25 18 19 16 Ireland 91 87 83 82 78 -14 Italy ... ... ... ... ... ... Kosovo (UNR) 20 21 20 21 26 33 Lithuania 7 7 6 6 6 -20 Malta ... ... ... ... ... ... Netherlands ... ... ... ... ... ... Norway 0 0 0 0 0 -24 Poland 3 3 3 3 2 -24 Portugal 6 7 7 8 8 22 Russia ... ... ... ... ... ... Serbia 23 22 20 19 18 -20 Slovakia ... ... ... ... ... ... Slovenia 14 10 10 11 9 -34 Spain ... ... ... ... ... ... Sweden ... ... ... ... ... ... Switzerland ... ... 9 8 7 ... Turkey ... ... ... ... ... ... Ukraine 12 11 9 8 8 -36 UK: England & Wales ... 74 72 63 58 ... UK: Northern Ireland 30 39 41 40 33 12 UK: Scotland 117 111 97 94 79 -33 Mean 32 34 32 31 30 Median 16 21 20 18 18 Minimum 0 0 0 0 0 Maximum 188 184 182 175 170

41
Table 1.2.1.10 Offences per 100 000 population – Offences – Sexual assault
2007 2008 2009 2010 2011
% change 2007-2011
Albania 3 2 3 3 2 -51 Armenia 1 2 2 3 2 113 Austria 24 22 22 26 28 18 Belgium 62 61 62 63 62 1 Bulgaria 8 8 8 8 8 -11 Croatia 10 10 10 9 8 -16 Cyprus 8 7 7 8 8 10 Czech Republic ... ... ... 13 14 ... Denmark 27 25 23 27 25 -7 Estonia 15 20 19 13 13 -11 Finland 42 51 39 45 59 41 France 63 65 62 60 63 0 Georgia ... ... ... ... ... ... Germany 32 33 31 32 31 -6 Greece 7 8 10 7 5 -28 Hungary 10 12 11 12 10 3 Iceland 87 86 87 68 89 3 Ireland 29 30 33 48 44 53 Italy 9 9 9 9 ... ... Kosovo (UNR) 7 8 7 6 8 10 Lithuania 11 11 11 16 18 55 Malta 17 19 20 22 17 -3 Netherlands 52 47 46 43 40 -23 Norway 73 75 81 81 84 15 Poland 10 9 9 9 8 -20 Portugal 17 20 22 20 20 16 Russia ... ... ... ... ... ... Serbia 6 6 6 7 7 19 Slovakia 12 12 12 10 14 19 Slovenia 20 16 19 20 17 -17 Spain 20 22 20 18 21 7 Sweden 65 74 79 77 84 29 Switzerland ... ... 65 63 62 ... Turkey ... 1 ... 3 3 ... Ukraine ... ... ... ... ... ... UK: England & Wales 77 75 79 82 79 3 UK: Northern Ireland 80 86 80 89 87 9 UK: Scotland 89 82 85 83 80 -10 Mean 31 31 33 31 33 Median 19 20 20 20 19 Minimum 1 1 2 3 2 Maximum 89 86 87 89 89

42
Table 1.2.1.11 Offences per 100 000 population – Offences – Rape
2007 2008 2009 2010 2011
% change 2007-2011
Albania 1.3 1.2 1.1 0.8 0.8 -40 Armenia 0.5 0.7 1.0 0.7 0.5 -1 Austria 14.3 13.5 14.0 15.7 17.7 24 Belgium 31.0 29.8 28.5 29.2 28.8 -7 Bulgaria 2.9 3.4 3.2 2.8 2.1 -27 Croatia 3.3 4.1 2.7 3.1 2.7 -19 Cyprus 2.4 4.3 3.4 4.4 4.5 85 Czech Republic 6.2 5.1 4.6 5.6 6.4 4 Denmark 13.4 11.4 10.2 10.9 10.1 -24 Estonia 9.1 11.9 9.3 6.0 6.8 -25 Finland 14.0 17.3 12.4 15.3 19.3 38 France 16.0 16.9 17.8 16.6 16.9 6 Georgia 3.5 2.3 1.9 1.8 1.7 -51 Germany 8.5 8.2 8.3 8.7 8.6 1 Greece 2.0 2.2 2.2 2.1 1.6 -18 Hungary 2.1 2.1 2.3 2.5 2.0 -8 Iceland 37.1 30.4 31.0 30.9 40.2 8 Ireland 9.9 9.4 10.9 14.1 13.3 34 Italy ... ... ... ... ... ... Kosovo (UNR) 2.6 2.3 2.0 1.5 1.3 -49 Lithuania 9.8 9.1 8.6 11.3 12.4 27 Malta 2.5 4.6 2.9 2.7 4.3 77 Netherlands 13.1 11.9 11.6 10.0 9.5 -27 Norway 22.7 22.4 23.2 21.6 24.7 9 Poland 5.3 4.9 4.6 4.6 4.2 -20 Portugal 2.9 3.0 3.5 4.0 3.5 23 Russia 4.9 4.4 3.8 3.5 3.4 -32 Serbia 1.5 1.7 1.6 1.0 1.1 -23 Slovakia 3.4 2.8 2.6 2.2 2.8 -18 Slovenia 4.8 2.8 3.9 3.1 2.7 -44 Spain 3.5 3.1 2.8 2.6 3.3 -7 Sweden 52.1 59.3 64.1 63.8 69.4 33 Switzerland ... ... 8.6 7.0 7.0 ... Turkey ... ... ... ... ... ... Ukraine 1.9 1.9 1.6 1.4 1.4 -27 UK: England & Wales 23.4 24.1 27.5 28.8 28.6 22 UK: Northern Ireland 23.6 22.8 25.8 30.6 30.6 30 UK: Scotland 20.5 18.6 19.2 21.7 24.2 18 Mean 10.7 10.7 10.6 10.9 11.6 Median 5.3 4.9 4.6 5.1 5.5 Minimum 0.5 0.7 1.0 0.7 0.5 Maximum 52.1 59.3 64.1 63.8 69.4

43
Table 1.2.1.12 Offences per 100 000 population – Offences – Sexual abuse of a child
2007 2008 2009 2010 2011
% change 2007-2011
Albania 1.6 1.1 1.5 1.3 0.6 -59 Armenia ... ... ... ... ... ... Austria 7.4 6.7 6.1 7.9 8.3 12 Belgium 37.7 36.3 35.0 35.7 35.2 -7 Bulgaria ... ... ... ... ... ... Croatia 4.9 4.1 5.0 3.9 3.7 -23 Cyprus 1.2 0.6 0.9 0.7 0.8 -28 Czech Republic 7.4 7.7 7.9 7.0 7.2 -3 Denmark 7.5 7.6 6.7 7.8 6.7 -11 Estonia 4.8 6.7 7.0 5.9 5.2 8 Finland 19.4 24.9 20.1 20.6 31.6 63 France 13.3 14.0 13.3 13.1 12.8 -4 Georgia ... ... ... ... ... ... Germany 11.5 11.1 10.5 11.0 10.5 -9 Greece ... ... ... ... ... ... Hungary 1.0 0.9 1.0 1.3 0.9 -15 Iceland 39.0 46.9 43.5 30.5 35.8 -8 Ireland 1.6 1.7 2.5 3.5 3.2 97 Italy 0.8 0.8 0.8 1.0 ... ... Kosovo (UNR) 1.9 2.8 1.9 2.0 2.9 50 Lithuania 1.5 1.6 1.9 3.4 4.3 183 Malta ... 7.1 6.5 8.9 6.7 ... Netherlands ... ... ... ... ... ... Norway 24.8 26.2 26.2 27.8 28.8 16 Poland 4.9 4.4 4.3 4.0 4.0 -19 Portugal 6.1 5.6 6.3 7.3 7.4 22 Russia ... ... ... ... ... ... Serbia 0.9 0.9 1.1 1.1 0.8 -14 Slovakia 6.7 7.2 7.3 6.8 10.1 50 Slovenia 10.1 7.9 9.8 11.9 10.6 5 Spain ... ... ... ... ... ... Sweden 9.8 10.5 9.2 8.9 10.7 10 Switzerland ... ... 19.8 14.6 17.8 ... Turkey ... ... ... ... ... ... Ukraine 0.1 0.2 0.2 0.1 0.1 0 UK: England & Wales 28.1 27.6 31.4 32.1 30.6 9 UK: Northern Ireland 30.4 37.2 34.3 36.6 32.7 8 UK: Scotland 35.7 32.1 33.2 31.1 28.1 -21 Mean 11.4 11.8 11.8 11.6 12.4 Median 7.0 7.1 6.9 7.6 7.4 Minimum 0.1 0.2 0.2 0.1 0.1 Maximum 39.0 46.9 43.5 36.6 35.8

44
Table 1.2.1.13 Offences per 100 000 population – Offences – Robbery
2007 2008 2009 2010 2011
% change 2007-2011
Albania 4 5 5 8 10 140 Armenia 6 11 13 11 11 72 Austria 61 58 55 51 48 -20 Belgium 200 214 219 220 248 24 Bulgaria 39 38 47 49 42 8 Croatia 29 28 32 28 31 9 Cyprus 10 9 18 19 16 72 Czech Republic 47 45 45 38 37 -22 Denmark 41 44 49 40 40 -3 Estonia 66 68 54 45 39 -41 Finland 34 32 31 28 30 -11 France 183 173 182 194 193 5 Georgia 64 50 38 23 17 -74 Germany 64 61 60 59 59 -9 Greece 25 28 37 39 40 58 Hungary 31 31 31 34 32 3 Iceland 14 14 19 13 13 -6 Ireland 49 49 53 68 61 26 Italy 87 77 60 56 ... ... Kosovo (UNR) 22 21 26 24 35 59 Lithuania 112 103 100 82 82 -27 Malta 49 36 49 47 53 7 Netherlands 84 80 99 97 92 11 Norway 31 34 37 35 33 5 Poland 57 51 50 45 40 -30 Portugal 174 196 193 192 193 11 Russia 207 172 145 116 89 -57 Serbia 367 378 378 384 411 12 Slovakia 26 25 25 22 16 -40 Slovenia 27 24 29 27 24 -12 Spain 161 158 142 129 190 18 Sweden 95 97 103 99 103 8 Switzerland ... ... 65 57 67 ... Turkey 17 11 ... 11 12 -28 Ukraine 69 58 60 51 50 -27 UK: England & Wales 157 147 137 138 133 -15 UK: Northern Ireland 65 72 71 73 68 4 UK: Scotland 60 57 48 49 43 -28 Mean 77 74 76 71 73 Median 57 50 50 48 42 Minimum 4 5 5 8 10 Maximum 367 378 378 384 411

45
Table 1.2.1.14 Offences per 100 000 population – Offences – Robbery: Firearm involved
2007 2008 2009 2010 2011
% change 2007-2011
Albania 1.1 1.3 1.6 2.2 3.2 193 Armenia ... ... ... ... ... ... Austria 3.7 4.0 3.4 3.4 2.5 -31 Belgium 10.1 15.6 18.9 16.0 15.3 51 Bulgaria ... ... ... ... … ... Croatia 8.8 9.8 11.7 10.2 12.4 42 Cyprus ... ... ... 9.6 10.0 ... Czech Republic ... ... ... ... ... ... Denmark ... ... ... ... ... ... Estonia ... ... ... ... ... ... Finland ... ... ... ... ... ... France 9.3 10.8 12.2 10.9 10.0 7 Georgia ... ... ... ... ... ... Germany 4.7 4.3 4.7 4.6 4.3 -9 Greece ... ... ... ... ... ... Hungary 1.2 0.8 1.1 1.4 1.5 23 Iceland ... ... ... ... ... ... Ireland 1.3 1.3 1.1 1.3 1.6 22 Italy ... ... ... ... ... ... Kosovo (UNR) ... ... ... ... ... ... Lithuania 0.3 0.2 0.3 0.2 0.0 -88 Malta ... ... ... ... ... ... Netherlands ... ... ... ... ... ... Norway ... ... ... ... ... ... Poland 0.6 0.5 0.6 0.7 0.6 -8 Portugal 19.2 29.5 28.0 19.1 16.4 -14 Russia ... ... ... ... ... ... Serbia 15.4 17.7 19.2 13.5 13.5 -12 Slovakia 2.2 1.8 2.5 3.0 1.8 -21 Slovenia ... ... ... ... ... ... Spain 6.6 7.3 6.9 5.1 4.3 -35 Sweden 10.0 12.4 14.0 11.4 10.8 8 Switzerland ... ... ... ... ... ... Turkey ... ... ... ... ... ... Ukraine ... ... ... ... ... ... UK: England & Wales 7.3 6.6 6.6 5.3 4.5 -38 UK: Northern Ireland 6.4 8.2 8.9 6.9 6.0 -5 UK: Scotland ... ... ... ... ... ... Mean 6.4 7.8 8.3 6.9 6.6 Median 6.4 6.6 6.6 5.2 4.5 Minimum 0.3 0.2 0.3 0.2 0 Maximum 19.2 29.5 28.0 19.1 16.4

46
Table 1.2.1.15 Offences per 100 000 population – Offences – Theft: Total
2007 2008 2009 2010 2011
% change 2007-2011
Albania 90 78 96 132 163 80 Armenia 88 102 124 115 131 48 Austria 3382 3268 3239 2841 2723 -19 Belgium 3792 3769 3696 3699 3849 1 Bulgaria 897 818 893 1037 961 7 Croatia 774 727 698 751 822 6 Cyprus 553 506 475 598 603 9 Czech Republic 2033 1933 1846 1761 1754 -14 Denmark 5021 5548 5695 5512 5396 7 Estonia 1615 1676 1783 1884 1505 -7 Finland 2748 2764 2848 2770 2814 2 France 2879 2721 2714 2669 2657 -8 Georgia 423 338 262 256 255 -40 Germany 3112 2972 2859 2814 2940 -6 Greece 690 756 811 853 871 26 Hungary 1749 1715 1643 1868 1839 5 Iceland 1745 2239 2705 2451 1916 10 Ireland 2292 2309 2332 2280 2288 0 Italy 2768 2336 2195 2196 ... ... Kosovo (UNR) 655 676 599 685 950 45 Lithuania 1003 1141 1181 1113 1211 21 Malta 2202 1981 1654 1875 2049 -7 Netherlands 4187 4160 4134 3994 4020 -4 Norway 3120 2986 3100 2900 2807 -10 Poland 1019 902 924 957 961 -6 Portugal 1483 1702 1605 1561 1608 8 Russia 1102 934 838 781 727 -34 Serbia 231 221 207 223 240 4 Slovakia 1006 905 867 785 706 -30 Slovenia 2424 2193 2169 2095 2190 -10 Spain 834 843 780 762 899 8 Sweden 6231 5996 5877 5558 5701 -9 Switzerland ... ... 3196 2980 3346 ... Turkey 226 191 ... 228 102 -55 Ukraine 247 240 383 556 609 147 UK: England & Wales 4367 4139 3782 3713 3603 -18 UK: Northern Ireland 2035 2142 2156 2050 1992 -2 UK: Scotland 3028 3035 2741 2770 2727 -10 Mean 1947 1918 1976 1897 1890 Median 1745 1715 1783 1872 1754 Minimum 88 78 96 115 102 Maximum 6231 5996 5877 5558 5701

47
Table 1.2.1.16 Offences per 100 000 population – Offences – Theft: Theft of a motor
vehicle
2007 2008 2009 2010 2011
% change 2007-2011
Albania 14 12 16 21 22 56 Armenia 4 2 2 2 2 -62 Austria 94 109 111 61 61 -35 Belgium 168 159 145 130 128 -24 Bulgaria 59 60 59 52 44 -26 Croatia 47 43 41 35 35 -24 Cyprus 57 47 61 62 82 44 Czech Republic 198 181 141 125 118 -40 Denmark 343 383 378 324 271 -21 Estonia 75 77 70 65 56 -25 Finland 281 260 229 208 223 -21 France 362 338 330 309 294 -19 Georgia 7 6 4 3 2 -72 Germany 113 108 107 102 96 -15 Greece 153 149 163 150 148 -4 Hungary 106 100 97 86 87 -18 Iceland 152 136 171 142 139 -9 Ireland 314 325 296 255 227 -28 Italy 469 386 355 327 ... ... Kosovo (UNR) 18 22 18 15 25 35 Lithuania 88 82 64 67 64 -27 Malta 95 97 97 90 88 -8 Netherlands 131 132 133 131 126 -4 Norway 269 251 250 223 189 -29 Poland 71 61 60 56 54 -23 Portugal 226 238 212 191 184 -18 Russia 41 37 35 34 35 -14 Serbia 2 2 1 1 2 13 Slovakia 87 77 70 62 50 -43 Slovenia 42 29 29 26 26 -38 Spain 193 159 122 99 112 -42 Sweden 540 487 436 376 366 -32 Switzerland ... ... 118 101 100 ... Turkey 33 24 ... 17 15 -54 Ukraine 15 13 11 9 10 -30 UK: England & Wales 314 270 215 192 164 -48 UK: Northern Ireland 190 167 166 151 127 -33 UK: Scotland 235 223 179 167 134 -43 Mean 152 142 135 118 106 Median 106 108 111 94 88 Minimum 2 2 1 1 2 Maximum 540 487 436 376 366

48
Table 1.2.1.17 Offences per 100 000 population – Offences – (Theft) Burglary: Total
2007 2008 2009 2010 2011
% change 2007-2011
Albania 45 47 55 72 72 58 Armenia ... ... ... ... ... ... Austria 1266 1254 1286 1057 1003 -21 Belgium 798 800 829 819 863 8 Bulgaria ... ... ... ... ... ... Croatia 224 197 203 212 227 1 Cyprus 339 328 314 395 402 19 Czech Republic 534 514 524 559 569 7 Denmark 1446 1709 1941 1747 1650 14 Estonia ... ... ... ... ... ... Finland 471 465 604 588 605 28 France 523 497 516 519 544 4 Georgia ... ... ... ... ... ... Germany 489 475 472 486 515 5 Greece 339 394 419 460 492 45 Hungary 406 428 376 442 453 12 Iceland 740 866 1103 902 597 -19 Ireland 548 563 606 568 604 10 Italy 282 253 251 280 ... ... Kosovo (UNR) 267 295 281 143 199 -25 Lithuania ... ... ... ... ... ... Malta 289 353 327 401 405 40 Netherlands ... ... ... ... ... ... Norway ... ... ... ... ... ... Poland 371 325 355 367 352 -5 Portugal 422 506 464 476 493 17 Russia ... ... ... ... ... ... Serbia 8 7 7 8 9 15 Slovakia 318 281 284 273 239 -25 Slovenia 890 742 743 639 652 -27 Spain ... ... ... ... ... ... Sweden 1064 1027 1035 993 1002 -6 Switzerland ... ... 672 645 670 ... Turkey 161 143 ... 175 56 -65 Ukraine ... ... ... ... ... ... UK: England & Wales 1080 1068 986 946 892 -17 UK: Northern Ireland 659 695 697 658 586 -11 UK: Scotland 495 493 458 479 461 -7 Mean 536 545 585 547 541 Median 471 475 472 482 515 Minimum 8 7 7 8 9 Maximum 1446 1709 1941 1747 1650

49
Table 1.2.1.18 Offences per 100 000 population – Offences – (Theft) Burglary: Domestic
burglary
2007 2008 2009 2010 2011
% change 2007-2011
Albania 24 22 24 32 35 44 Armenia ... ... ... ... ... ... Austria 242 224 254 188 252 4 Belgium 533 540 589 575 624 17 Bulgaria ... ... ... ... ... ... Croatia 87 78 79 91 103 18 Cyprus ... ... ... 253 234 ... Czech Republic 89 88 92 96 91 2 Denmark 829 999 1121 1036 1048 26 Estonia 231 248 226 238 208 -10 Finland 124 113 122 121 124 0 France 280 270 290 301 346 23 Georgia 61 54 42 35 31 -49 Germany 219 217 226 242 264 20 Greece ... ... ... ... ... ... Hungary 148 164 162 198 211 43 Iceland 179 179 241 216 146 -19 Ireland ... ... ... ... ... ... Italy ... ... ... ... ... ... Kosovo (UNR) 209 201 182 228 315 51 Lithuania 163 180 173 147 134 -18 Malta 180 192 196 215 229 27 Netherlands 547 556 574 620 653 19 Norway 69 71 70 69 58 -16 Poland 127 107 110 127 135 6 Portugal 211 279 245 251 268 27 Russia 374 291 269 251 220 -41 Serbia 1 1 1 1 1 11 Slovakia 45 39 43 35 32 -30 Slovenia 114 101 109 124 120 6 Spain 166 181 176 196 218 32 Sweden 186 198 221 212 236 27 Switzerland ... ... 330 310 349 ... Turkey 100 93 ... 118 ... ... Ukraine 64 55 74 72 55 -15 UK: England & Wales 519 522 490 467 437 -16 UK: Northern Ireland 382 414 406 394 368 -4 UK: Scotland 340 333 322 338 331 -3 Mean 221 226 241 236 246 Median 179 181 196 212 219 Minimum 1 1 1 1 1 Maximum 829 999 1121 1036 1048

50
Table 1.2.1.19 Offences per 100 000 population – Offences – Fraud
2007 2008 2009 2010 2011
% change 2007-2011
Albania 7 14 9 12 12 59 Armenia 13 13 24 25 23 69 Austria 371 296 423 319 343 -8 Belgium 266 218 213 205 190 -28 Bulgaria 63 54 60 51 34 -46 Croatia 53 42 53 45 53 -1 Cyprus 22 22 23 31 23 8 Czech Republic 97 92 94 89 86 -11 Denmark 85 82 87 117 168 98 Estonia 185 166 156 151 86 -53 Finland 258 303 327 296 331 28 France 283 341 342 321 314 11 Georgia 51 42 41 30 40 -21 Germany 795 778 833 830 775 -3 Greece 9 12 11 14 17 85 Hungary 410 301 295 321 279 -32 Iceland 112 165 128 116 133 19 Ireland 137 123 111 111 117 -14 Italy 204 175 165 160 ... ... Kosovo (UNR) 26 35 34 29 37 43 Lithuania 93 91 135 132 179 93 Malta ... ... ... ... ... ... Netherlands 134 134 150 151 130 -3 Norway 260 254 311 259 240 -7 Poland 215 219 229 257 259 20 Portugal 57 60 60 63 62 9 Russia 149 136 133 113 103 -30 Serbia 43 48 49 48 40 -7 Slovakia 140 128 131 109 111 -21 Slovenia 224 181 196 214 162 -28 Spain 66 76 90 91 104 57 Sweden 852 1069 1169 1224 1219 43 Switzerland ... ... 170 190 144 ... Turkey ... 1 ... 5 4 ... Ukraine 46 44 51 54 53 14 UK: England & Wales 287 300 278 264 251 -13 UK: Northern Ireland 155 201 186 168 152 -2 UK: Scotland 163 161 159 172 169 4 Mean 181 177 192 183 179 Median 137 131 134 117 124 Minimum 7 1 9 5 4 Maximum 852 1069 1169 1224 1219

51
Table 1.2.1.20 Offences per 100 000 population – Offences – Money laundering
2007 2008 2009 2010 2011
% change 2007-2011
Albania 0.0 5.8 5.0 1.9 3.0 ... Armenia 0.0 0.0 0.0 ... ... ... Austria 2.8 3.3 3.0 6.9 6.4 131 Belgium 6.8 7.0 6.6 6.6 6.5 -4 Bulgaria ... ... ... ... ... ... Croatia 0.4 0.3 0.2 0.3 0.7 54 Cyprus 68.8 73.9 106.9 120.7 127.3 85 Czech Republic 0.3 0.4 0.6 1.7 2.4 679 Denmark ... ... ... ... ... ... Estonia 3.7 9.5 10.0 4.8 6.0 64 Finland 1.2 1.5 1.1 2.0 2.0 63 France ... ... ... ... ... ... Georgia ... ... ... ... ... ... Germany 4.8 3.1 5.6 8.3 10.5 120 Greece ... ... ... ... ... ... Hungary 0.0 0.0 0.2 0.1 0.1 908 Iceland 1.3 1.6 0.9 2.8 1.6 21 Ireland 0.2 0.1 0.4 0.4 0.4 60 Italy 2.0 2.1 2.1 2.2 ... ... Kosovo (UNR) ... ... 0.0 0.2 0.6 ... Lithuania 0.2 0.3 0.4 1.1 1.1 528 Malta ... ... ... ... ... ... Netherlands 0.1 0.0 1.2 1.8 2.6 4172 Norway ... ... ... ... ... ... Poland 0.7 0.7 0.7 0.8 0.7 7 Portugal 0.2 0.4 0.3 0.1 0.1 -65 Russia ... ... ... ... ... ... Serbia 0.5 0.6 0.5 1.3 2.5 406 Slovakia 1.1 1.1 1.7 2.2 2.6 140 Slovenia 0.1 0.8 1.9 3.1 2.3 1469 Spain 0.3 0.2 0.3 0.4 0.4 47 Sweden ... 1.9 3.4 3.9 5.4 ... Switzerland ... ... 3.5 4.6 3.7 ... Turkey ... ... ... ... ... ... Ukraine 0.8 0.8 0.7 0.7 0.8 -3 UK: England & Wales 4.4 4.6 4.8 4.2 3.2 -28 UK: Northern Ireland ... ... ... ... ... ... UK: Scotland 1.0 1.1 1.3 1.1 1.1 9 Mean 4.1 4.7 5.8 6.8 7.5 Median 0.7 1.0 1.2 1.9 2.4 Minimum 0.0 0.0 0.0 0.1 0.1 Maximum 68.8 73.9 106.9 120.7 127.3

52
Table 1.2.1.21 Offences per 100 000 population – Offences – Corruption
2007 2008 2009 2010 2011
% change 2007-2011
Albania 3.8 2.2 1.6 2.6 2.3 -40 Armenia 1.0 4.1 4.2 3.8 3.9 277 Austria 1.4 2.4 7.6 5.8 8.1 461 Belgium 0.8 0.9 0.9 0.7 0.7 -5 Bulgaria 1.6 1.5 2.0 2.0 2.1 33 Croatia 1.8 3.9 4.0 4.3 6.8 279 Cyprus 0.9 0.9 2.0 1.1 1.1 19 Czech Republic 1.0 1.4 1.2 1.7 2.5 154 Denmark 0.2 0.0 0.2 0.1 0.1 -24 Estonia 8.1 16.7 7.9 9.6 8.1 -1 Finland 0.2 0.0 0.1 0.4 0.1 -39 France ... ... ... ... ... ... Georgia ... ... ... ... ... ... Germany 2.8 2.1 1.8 1.6 1.4 -52 Greece 0.7 1.4 1.6 1.2 1.0 50 Hungary 3.5 5.4 9.6 4.8 7.4 113 Iceland 0.3 0.0 0.3 0.0 0.0 -100 Ireland 0.1 0.1 0.1 0.0 0.1 89 Italy ... ... ... ... ... ... Kosovo (UNR) 0.7 0.6 0.6 14.2 9.6 1365 Lithuania 13.4 11.2 15.1 16.6 17.5 31 Malta ... ... ... ... ... ... Netherlands ... ... ... ... ... ... Norway ... ... ... ... ... ... Poland 16.7 16.2 16.0 22.2 23.1 39 Portugal 1.2 1.0 0.6 0.5 0.6 -47 Russia 0.8 7.0 6.0 4.6 4.1 410 Serbia 5.6 3.1 5.1 3.6 3.2 -42 Slovakia 3.9 4.8 4.3 2.7 3.7 -6 Slovenia 0.8 0.5 11.2 2.9 3.4 298 Spain 2.0 1.4 1.2 1.2 1.0 -49 Sweden ... ... 3.5 1.9 1.3 ... Switzerland ... ... 0.3 0.3 0.3 ... Turkey ... ... ... 0.2 0.2 ... Ukraine 9.5 5.0 4.6 6.4 6.3 -34 UK: England & Wales ... ... ... ... ... ... UK: Northern Ireland ... ... ... ... ... ... UK: Scotland 0.1 0.0 0.1 0.1 0.0 -100 Mean 3.1 3.5 3.9 3.9 4.0 Median 1.2 1.5 2.0 2.0 2.2 Minimum 0.1 0.0 0.1 0.0 0.0 Maximum 16.7 16.7 16.0 22.2 23.1

53
Table 1.2.1.22 Offences per 100 000 population – Offences – Drug offences: Total
2007 2008 2009 2010 2011
% change 2007-2011
Albania 16 21 20 17 26 63 Armenia 34 24 38 47 47 39 Austria 292 229 272 285 308 6 Belgium 421 433 445 389 381 -9 Bulgaria 27 37 48 50 39 46 Croatia 164 166 147 162 163 0 Cyprus 113 99 89 104 112 -1 Czech Republic 28 29 29 30 37 31 Denmark 324 347 322 328 385 19 Estonia 554 572 316 227 285 -49 Finland 293 292 348 369 379 30 France 254 288 280 275 293 15 Georgia 193 199 144 123 84 -56 Germany 302 292 288 282 289 -4 Greece 71 88 92 77 66 -7 Hungary 46 54 48 58 60 29 Iceland 600 504 416 484 571 -5 Ireland 430 531 493 446 387 -10 Italy 58 57 57 54 ... ... Kosovo (UNR) 4 5 4 5 8 104 Lithuania 51 54 65 66 73 43 Malta ... ... ... ... ... ... Netherlands 120 115 113 105 101 -16 Norway 857 776 803 921 856 0 Poland 165 151 179 190 193 17 Portugal 39 42 51 56 53 38 Russia 163 164 168 157 151 -7 Serbia 74 83 76 77 68 -8 Slovakia 40 42 45 32 45 12 Slovenia 80 84 115 96 82 3 Spain 28 28 28 28 33 17 Sweden 799 869 886 964 977 22 Switzerland ... ... 1113 1145 1159 ... Turkey ... ... ... ... ... ... Ukraine 137 138 125 124 117 -15 UK: England & Wales 425 447 430 422 408 -4 UK: Northern Ireland 155 168 176 194 209 35 UK: Scotland 792 822 759 658 669 -16 Mean 233 236 251 251 260 Median 155 151 146 141 151 Minimum 4 5 4 5 8 Maximum 857 869 1113 1145 1159

54
Table 1.2.1.23 Offences per 100 000 population – Offences – Drug offences: Drug
trafficking
2007 2008 2009 2010 2011
% change 2007-2011
Albania 16 21 20 17 26 63 Armenia 7 9 17 24 23 217 Austria ... ... ... ... ... ... Belgium 119 122 125 116 ... ... Bulgaria ... ... ... ... ... ... Croatia 36 51 40 43 41 15 Cyprus 23 24 19 20 15 -32 Czech Republic 22 23 23 24 30 37 Denmark 60 59 52 59 64 8 Estonia 108 116 78 67 68 -37 Finland 97 107 136 141 154 59 France 10 10 10 10 10 1 Georgia ... ... ... ... ... ... Germany 89 81 76 75 76 -15 Greece ... ... ... ... ... ... Hungary 9 8 7 8 7 -16 Iceland 34 33 32 30 26 -23 Ireland 105 121 116 122 110 4 Italy ... ... ... ... ... ... Kosovo (UNR) 4 5 4 5 8 104 Lithuania 22 23 25 25 30 40 Malta 37 44 45 44 43 17 Netherlands ... ... ... ... ... ... Norway ... ... ... ... ... ... Poland 10 9 10 12 11 10 Portugal 31 35 40 43 40 29 Romania ... ... ... ... ... ... Russia ... ... ... ... ... ... Serbia 24 30 30 28 23 -6 Slovakia 9 10 11 11 16 68 Slovenia 71 71 103 86 73 3 Spain ... ... ... ... ... ... Sweden 80 92 94 117 118 48 Switzerland ... ... 100 99 80 ... Turkey ... ... ... ... ... ... Ukraine 37 37 36 37 36 -3 UK: England & Wales 52 55 61 59 56 6 UK: Northern Ireland 30 34 37 42 47 55 UK: Scotland 191 200 191 137 127 -33 Mean 49 53 55 54 50 Median 34 35 38 43 40 Minimum 4 5 4 5 7 Maximum 191 200 191 141 154

55
Notes on Tables 1.2.1.1-1.2.1.23
Albania: Negligent homicides were excluded in 2010 and 2011. Less serious assault is missing for 2007. Armenia: Rape for 2011 included only forceful per vagina intercourse. It did not cover buggery, while for 2007-2010 both concepts were covered. Bulgaria: Major traffic offences covered all traffic offences. The rise in the number of recorded drug offences from 2007-2010 could partly be explained by a legislative change adopted in 2006. Croatia: Minor thefts and some minor frauds are excluded from the tables. Czech Republic: Police statistics included traffic accidents as well. Prosecution and conviction statistics show major traffic offences only. Estonia: In 2008 the definition of minor property offences was changed. 'Total drug offences' include misdemeanours but these were not included in total criminal offences. Finland: From 2009 onwards minor traffic offences were excluded from Total criminal offences. From 2010 onwards the crimes recorded by the Customs and the Border Guard Service have been included in the total criminal offences. France: Overseas territories are included (this was not the case in the former editions) Georgia: Only aggravated bodily injuries were included in bodily injury. Since 2007 bodily injury included hooliganism. Since 2007 any illegal possession of a car (including joy riding) was considered a theft. Greece: The definition of traffic offences was changed in 2010. Kosovo (UNR): Major traffic offences included road traffic accidents. Netherlands: Because the definition used is much broader, the figures of domestic burglary are high and not comparable with other countries. Norway: The high value for homicide 2011 is due to the massacre of 77 people on Utoya Island. Poland: For all years the total number of thefts has been revised from the previous editions to include joyriding. The same applies to the number of frauds where economic frauds are now included. Russia: Traffic offences present the total number of the traffic offences, not merely the major ones. Under corruption only extortion by public officials was included. Sweden: Corruption included only bribery. Switzerland: Police statistics were revised since 2009. Turkey: In 2011 burglary included only those made into business premises. UK: England & Wales: All data is on a financial year basis, i.e., 2011 relates to April 2011 until March 2012. UK: Northern Ireland: Data provided relates to reported crime by financial year (as England & Wales). In 2008 the definition of bodily injury was changed. UK: Scotland: All data provided are by financial year (as England & Wales) with the exception of intentional homicide, which are provided on a calendar year basis.

56
1.2.2 Offenders
Table 1.2.2.1 Offenders per 100 000 population – Offenders – Criminal offences: Total
2007 2008 2009 2010 2011
% change 2007-2011
Albania 315 413 376 502 628 99 Armenia 169 176 336 374 364 116 Austria 3085 2986 3061 3000 3203 4 Belgium 3128 3210 3294 3219 3178 2 Bulgaria 746 726 728 783 696 -7 Croatia 1417 1424 1357 1371 1358 -4 Cyprus 763 782 712 ... ... ... Czech Republic 1242 1176 1177 1071 1096 -12 Denmark ... ... ... ... ... ... Estonia 1220 1361 1165 1127 1138 -7 Finland 5840 5814 5605 5644 5632 -4 France 1849 1912 1909 1860 1888 2 Georgia 498 478 456 461 391 -21 Germany 2788 2744 2667 2632 2584 -7 Greece 3336 3340 2927 2313 1194 -64 Hungary 1154 1161 1125 1224 1131 -2 Iceland 1381 ... 1445 ... ... ... Ireland ... ... ... ... ... ... Italy 1453 1492 1447 1438 ... ... Kosovo (UNR) 1852 1732 1659 1621 2006 8 Lithuania 671 690 720 736 797 19 Malta 787 864 887 1086 1220 55 Netherlands 3036 2871 2568 2310 2258 -26 Norway ... ... ... ... ... ... Poland 1418 1355 1368 1352 1354 -4 Portugal 2387 2242 2348 2078 2030 -15 Romania ... ... ... ... ... ... Russia ... ... ... ... ... ... Serbia 733 773 756 752 719 -2 Slovakia 987 973 1040 983 1007 2 Slovenia 2350 2192 2466 2722 2626 12 Spain 578 651 662 635 844 46 Sweden 1232 1299 1349 1354 1296 5 Switzerland ... ... 1541 1515 1468 ... Turkey ... ... ... ... ... ... Ukraine 461 450 461 494 495 7 UK: England & Wales ... ... ... ... ... ... UK: Northern Ireland ... ... ... ... ... ... UK: Scotland ... ... ... ... ... ... Mean 1616 1617 1587 1595 1578 Median 1242 1327 1353 1353 1220 Minimum 169 176 336 374 364 Maximum 5840 5814 5605 5644 5632

57
Table 1.2.2.2 Offenders per 100 000 population – Offenders – Major traffic offences
2007 2008 2009 2010 2011
% change 2007-2011
Albania ... 14 17 32 68 ... Armenia ... ... ... ... ... ... Austria 451 436 429 444 459 2 Belgium ... ... ... ... ... ... Bulgaria 186 198 197 168 168 -10 Croatia 57 53 49 40 39 -31 Cyprus ... ... ... ... ... ... Czech Republic 88 88 81 60 59 -33 Denmark ... ... ... ... ... ... Estonia 294 ... ... ... ... ... Finland 1227 1194 1042 1004 985 -20 France ... ... ... ... ... ... Georgia ... ... ... ... ... ... Germany ... ... ... ... ... ... Greece 1617 1412 1181 797 37 -98 Hungary 192 160 151 135 111 -42 Iceland ... ... ... ... ... ... Ireland ... ... ... ... ... ... Italy 3 2 2 2 ... ... Kosovo (UNR) 568 513 583 541 652 15 Lithuania 55 55 45 36 32 -42 Malta ... ... ... ... ... ... Netherlands 506 473 420 370 358 -29 Norway ... ... ... ... ... ... Poland 425 423 423 394 411 -3 Portugal 430 403 385 405 401 -7 Romania ... ... ... ... ... ... Russia ... ... ... ... ... ... Serbia 41 39 35 29 28 -31 Slovakia 47 47 40 32 30 -36 Slovenia ... ... ... ... ... ... Spain 33 75 89 78 114 240 Sweden 344 350 340 327 317 -8 Switzerland ... ... ... ... ... ... Turkey ... ... ... ... ... ... Ukraine 32 32 27 23 21 -33 UK: England & Wales ... ... ... ... ... ... UK: Northern Ireland ... ... ... ... ... ... UK: Scotland ... ... ... ... ... ... Mean 347 314 291 259 238 Median 192 160 151 135 113 Minimum 3 2 2 2 21 Maximum 1617 1412 1181 1004 985

58
Table 1.2.2.3 Offenders per 100 000 population – Offenders – Intentional homicide:
Total
2007 2008 2009 2010 2011
% change 2007-2011
Albania 14.3 12.1 13.0 14.1 15.7 9 Armenia 2.1 2.2 2.8 ... ... ... Austria 1.6 2.8 1.9 2.2 2.2 39 Belgium 7.8 7.0 7.6 7.0 8.1 4 Bulgaria 2.4 2.2 1.8 1.9 1.6 -36 Croatia 5.3 5.0 4.7 4.5 4.2 -21 Cyprus 3.0 3.7 3.6 ... ... ... Czech Republic 2.0 1.9 1.7 1.8 1.6 -22 Denmark ... ... ... ... ... ... Estonia 7.0 ... ... ... ... ... Finland 10.0 11.9 10.4 8.9 8.6 -14 France 3.3 3.5 3.1 3.4 3.6 9 Georgia ... ... 8.2 7.2 7.1 ... Germany 3.7 3.6 3.6 3.5 3.4 -8 Greece 2.1 2.3 2.4 2.5 2.2 4 Hungary 3.0 3.0 3.1 2.7 2.9 -3 Iceland ... ... ... ... ... ... Ireland ... ... ... ... ... ... Italy 5.7 5.9 5.5 5.2 ... ... Kosovo (UNR) 5.3 5.1 5.7 6.0 5.5 4 Lithuania 8.7 9.1 9.0 8.9 8.6 -1 Malta ... ... ... ... ... ... Netherlands 13.7 12.6 17.5 19.5 20.8 52 Norway ... ... ... ... ... ... Poland 2.8 2.6 2.7 2.5 2.3 -19 Portugal ... ... ... ... ... ... Russia ... ... ... ... ... ... Serbia 5.1 5.0 5.3 4.9 4.8 -6 Slovakia 1.6 1.6 1.5 1.4 2.0 23 Slovenia 2.3 1.6 2.8 2.5 2.6 15 Spain 2.7 3.0 2.5 2.3 3.0 11 Sweden ... ... ... ... ... ... Switzerland ... ... 3.1 3.3 3.2 ... Turkey ... ... ... ... ... ... Ukraine 6.3 6.0 5.5 5.5 5.7 -11 UK: England & Wales ... ... ... ... ... ... UK: Northern Ireland ... ... ... ... ... ... UK: Scotland ... ... ... ... ... ... Mean 5.1 4.9 5.2 5.3 5.4 Median 3.5 3.6 3.6 3.5 3.5 Minimum 1.6 1.6 1.5 1.4 1.6 Maximum 14.3 12.6 17.5 19.5 20.8

59
Table 1.2.2.4 Offenders per 100 000 population – Offenders – Intentional homicide:
Completed
2007 2008 2009 2010 2011
% change 2007-2011
Albania 4.0 2.8 3.2 4.4 5.8 43 Armenia ... ... ... ... ... ... Austria ... ... ... ... ... ... Belgium 2.0 1.6 1.8 1.5 1.7 -14 Bulgaria ... ... ... ... ... ... Croatia 2.0 1.9 1.1 1.4 1.5 -26 Cyprus 1.2 1.3 1.9 ... ... ... Czech Republic ... ... ... ... ... ... Denmark ... ... ... ... ... ... Estonia ... ... ... ... ... ... Finland 2.9 3.4 2.8 2.8 2.4 -17 France 1.7 1.8 1.6 1.7 1.7 -4 Georgia ... ... 5.6 5.2 5.2 ... Germany ... ... ... ... ... ... Greece ... ... ... ... ... ... Hungary 1.7 1.6 1.6 1.3 1.6 -6 Iceland 0.7 0.0 0.3 0.6 0.9 45 Ireland ... ... ... ... ... ... Italy 2.2 2.0 1.9 1.9 ... ... Kosovo (UNR) 5.2 4.9 5.5 5.8 5.5 7 Lithuania 8.5 8.5 8.6 8.1 7.9 -8 Malta ... ... ... ... ... ... Netherlands ... ... ... ... ... ... Norway ... ... ... ... ... ... Poland ... ... ... ... ... ... Portugal 0.9 0.9 0.9 0.7 0.6 -34 Russia ... ... ... ... ... ... Serbia 2.1 2.2 2.5 2.0 1.9 -12 Slovakia 1.1 1.1 0.9 1.0 1.6 49 Slovenia 1.2 0.7 0.8 0.6 0.9 -22 Spain 1.0 1.2 1.0 0.9 1.0 -5 Sweden ... ... ... ... ... ... Switzerland ... ... ... ... ... ... Turkey ... ... ... ... ... ... Ukraine ... ... ... ... ... ... UK: England & Wales ... ... ... ... ... ... UK: Northern Ireland ... ... ... ... ... ... UK: Scotland ... ... ... ... ... ... Mean 2.4 2.2 2.5 2.5 2.7 Median 1.8 1.7 1.8 1.6 1.7 Minimum 0.7 0.0 0.3 0.6 0.6 Maximum 8.5 8.5 8.6 8.1 7.9

60
Table 1.2.2.5 Offenders per 100 000 population – Offenders – Intentional homicide:
Firearm involved
2007 2008 2009 2010 2011
% change 2007-2011
Germany 0.3 0.2 0.2 0.2 0.2 -36 Hungary 0.2 0.1 0.1 0.2 0.2 -8 Lithuania 0.1 0.1 0.1 0.1 0.0 -45 Serbia 1.6 2.0 1.6 1.3 1.0 -33 Slovakia 0.3 0.4 0.2 0.2 0.6 127 Spain 0.5 0.6 0.6 0.5 0.4 -9 Mean 0.5 0.6 0.5 0.4 0.4 Median 0.3 0.3 0.2 0.2 0.3 Minimum 0.1 0.1 0.1 0.1 0.0 Maximum 1.6 2.0 1.6 1.3 1.0
Table 1.2.2.6 Offenders per 100 000 population – Offenders – Intentional homicide:
Completed: Firearm involved
2007 2008 2009 2010 2011
% change 2007-2011
Hungary 0.1 0.1 0.0 0.1 0.1 18 Lithuania 0.1 0.1 0.1 0.1 0.0 -45 Serbia 0.6 0.8 0.6 0.5 0.4 -33 Slovakia 0.2 0.2 0.1 0.1 0.5 222 Spain 0.2 0.2 0.3 0.2 0.2 -23 Mean 0.2 0.3 0.2 0.2 0.3 Median 0.2 0.2 0.1 0.1 0.2 Minimum 0.1 0.1 0.0 0.1 0.0 Maximum 0.6 0.8 0.6 0.5 0.5

61
Table 1.2.2.7 Offenders per 100 000 population – Offenders – Bodily injury (Assault):
Total
2007 2008 2009 2010 2011
% change 2007-2011
Albania 7 34 40 54 62 728 Armenia ... ... ... ... ... ... Austria 440 442 453 425 450 2 Belgium 402 416 419 415 402 0 Bulgaria 29 15 14 13 9 -68 Croatia 49 52 49 46 41 -16 Cyprus 24 24 33 ... ... ... Czech Republic 48 42 39 39 41 -14 Denmark ... ... ... ... ... ... Estonia 221 ... ... ... ... ... Finland 567 617 553 542 617 9 France 277 291 302 294 293 6 Georgia ... ... ... ... ... ... Germany 555 556 555 547 543 -2 Greece 194 193 189 183 148 -24 Hungary 55 60 59 67 57 3 Iceland ... ... ... ... ... ... Ireland ... ... ... ... ... ... Italy 79 84 79 79 ... ... Kosovo (UNR) 210 241 243 253 310 48 Lithuania 71 70 69 73 80 12 Malta ... ... ... ... ... ... Netherlands 446 424 355 300 297 -33 Norway ... ... ... ... ... ... Poland 151 145 140 131 130 -14 Portugal 614 608 657 626 604 -2 Russia ... ... ... ... ... ... Serbia 57 56 55 53 47 -18 Slovakia 47 43 44 40 41 -12 Slovenia 126 109 108 103 95 -25 Spain 29 31 32 32 35 22 Sweden 166 175 182 193 188 13 Switzerland ... ... 120 114 110 ... Turkey ... ... ... ... ... ... Ukraine 26 25 22 20 20 -23 UK: England & Wales ... ... ... ... ... ... UK: Northern Ireland ... ... ... ... ... ... UK: Scotland ... ... ... ... ... ... Mean 196 198 192 193 201 Median 126 96 108 109 110 Minimum 7 15 14 13 9 Maximum 614 617 657 626 617

62
Table 1.2.2.8 Offenders per 100 000 population – Offenders – Bodily injury (Assault):
Aggravated bodily injury
2007 2008 2009 2010 2011
% change 2007-2011
Albania 7 10 11 7 8 4 Armenia 4 5 5 ... ... ... Austria 43 42 45 41 44 2 Belgium 11 12 13 14 17 58 Bulgaria 1 1 0 0 0 -43 Croatia 26 24 24 22 20 -22 Cyprus 18 20 28 ... ... ... Czech Republic ... ... ... ... ... ... Denmark ... ... ... ... ... ... Estonia ... ... ... ... ... ... Finland 45 49 43 40 41 -9 France ... ... ... ... ... ... Georgia ... ... 7 8 10 ... Germany 210 208 205 195 188 -11 Greece ... ... ... ... ... ... Hungary 46 50 47 55 46 0 Iceland ... ... ... ... ... ... Ireland ... ... ... ... ... ... Italy ... ... ... ... ... ... Kosovo (UNR) 39 41 37 39 50 29 Lithuania 10 10 8 10 8 -15 Malta ... ... ... ... ... ... Netherlands ... ... ... ... ... ... Norway ... ... ... ... ... ... Poland 4 3 4 3 3 -25 Portugal 7 8 8 8 7 -3 Russia ... ... ... ... ... ... Serbia 25 25 23 22 21 -15 Slovakia ... ... ... ... ... ... Slovenia 15 10 11 10 10 -31 Spain ... ... ... ... ... ... Sweden ... ... ... ... ... ... Switzerland ... ... 14 14 12 ... Turkey ... ... ... ... ... ... Ukraine 11 11 9 8 8 -31 UK: England & Wales ... ... ... ... ... ... UK: Northern Ireland ... ... ... ... ... ... UK: Scotland ... ... ... ... ... ... Mean 31 31 28 29 29 Median 15 12 13 14 12 Minimum 1 1 0 0 0 Maximum 210 208 205 195 188

63
Table 1.2.2.9 Offenders per 100 000 population – Offenders – Sexual assault: Total
2007 2008 2009 2010 2011
% change 2007-2011
Albania 3.5 2.6 3.0 3.0 1.7 -51 Armenia ... ... ... ... ... ... Austria 22.4 20.7 19.9 23.4 24.8 11 Belgium 22.7 21.7 22.1 21.3 18.5 -19 Bulgaria 7.1 7.1 5.9 5.7 4.8 -32 Croatia 9.6 10.1 9.4 5.8 8.2 -15 Cyprus 6.3 6.5 8.0 ... ... ... Czech Republic ... ... ... 8.9 8.7 ... Denmark ... ... ... ... ... ... Estonia ... ... ... ... ... ... Finland 38.0 43.0 39.1 33.6 39.3 3 France 43.0 44.3 42.1 40.4 42.8 -1 Georgia ... ... 2.2 2.1 2.2 ... Germany 26.1 25.9 25.0 26.3 25.2 -4 Greece 8.2 11.0 13.3 9.3 5.9 -28 Hungary 5.0 5.6 5.8 5.9 5.2 3 Iceland ... ... ... ... ... ... Ireland ... ... ... ... ... ... Italy 8.7 8.7 8.4 8.5 ... ... Kosovo (UNR) 9.5 14.4 11.8 9.2 13.2 39 Lithuania 6.9 6.7 9.1 9.6 12.3 80 Malta ... ... ... ... ... ... Netherlands 36.8 31.9 28.1 24.0 21.4 -42 Norway ... ... ... ... ... ... Poland 6.3 5.8 5.4 4.9 4.7 -26 Portugal 14.2 14.7 17.1 10.3 10.4 -27 Russia ... ... ... ... ... ... Serbia 5.5 5.2 5.4 5.9 5.4 -2 Slovakia 8.9 8.7 9.1 8.2 10.6 20 Slovenia 19.6 15.5 18.1 19.8 15.6 -21 Spain 12.0 13.7 12.2 11.8 14.5 21 Sweden 13.4 14.0 14.9 15.6 15.0 12 Switzerland ... ... 63.4 44.5 42.8 ... Turkey ... ... ... ... ... ... Ukraine ... ... ... ... ... ... UK: England & Wales ... ... ... ... ... ... UK: Northern Ireland ... ... ... ... ... ... UK: Scotland ... ... ... ... ... ... Mean 15.2 15.4 16.6 14.9 15.4 Median 9.5 12.3 12.0 9.5 12.3 Minimum 3.5 2.6 2.2 2.1 1.7 Maximum 43.0 44.3 63.4 44.5 42.8

64
Table 1.2.2.10 Offenders per 100 000 population – Offenders – Sexual assault: Rape
2007 2008 2009 2010 2011
% change 2007-2011
Albania 2.0 ... ... ... ... ... Armenia 0.5 0.6 0.9 ... ... ... Austria 12.1 11.7 11.8 13.2 14.3 18 Belgium 11.3 10.7 10.2 9.7 8.7 -23 Bulgaria 2.9 3.0 2.4 1.9 1.3 -55 Croatia 3.2 4.3 2.7 3.3 2.7 -15 Cyprus 1.4 3.5 4.1 ... ... ... Czech Republic 4.1 3.3 3.0 3.6 3.9 -7 Denmark ... ... ... ... ... ... Estonia 4.3 ... ... ... ... ... Finland 9.0 12.1 9.6 10.7 12.0 33 France 11.3 11.6 11.4 11.4 11.8 4 Georgia ... ... 1.1 0.9 0.7 ... Germany 7.1 6.8 6.9 7.2 7.2 1 Greece 1.8 2.2 2.1 1.8 1.5 -15 Hungary 1.0 1.1 1.2 1.2 1.0 6 Iceland ... ... ... ... ... ... Ireland ... ... ... ... ... ... Italy ... ... ... ... ... ... Kosovo (UNR) 2.6 2.9 2.6 1.3 1.4 -45 Lithuania 6.4 6.0 8.2 8.4 10.1 59 Luxembourg ... ... ... ... ... ... Malta ... ... ... ... ... ... Netherlands 10.3 8.3 7.8 6.1 5.5 -47 Norway ... ... ... ... ... ... Poland 3.3 3.0 2.8 2.5 2.4 -25 Portugal 2.5 2.4 2.3 1.9 1.4 -45 Russia ... ... ... ... ... ... Serbia 1.6 1.7 1.7 1.2 1.2 -21 Slovakia 2.2 1.7 1.9 1.6 1.5 -29 Slovenia 4.4 2.5 3.8 2.9 2.5 -44 Spain 2.5 2.2 2.2 1.8 2.4 -3 Sweden 9.6 10.2 11.1 12.0 11.2 17 Switzerland ... ... 6.1 5.8 5.8 ... Turkey ... ... ... ... ... ... Ukraine 1.4 1.4 1.3 1.1 1.2 -16 UK: England & Wales ... ... ... ... ... ... UK: Northern Ireland ... ... ... ... ... ... UK: Scotland ... ... ... ... ... ... Mean 4.8 4.9 4.8 4.9 4.9 Median 3.2 3.0 2.8 2.9 2.5 Minimum 0.5 0.6 0.9 0.9 0.7 Maximum 12.1 12.1 11.8 13.2 14.3

65
Table 1.2.2.11 Offenders per 100 000 population – Offenders – Sexual assault: Sexual
abuse of a child
2007 2008 2009 2010 2011
% change 2007-2011
Albania 1.4 ... ... ... ... ... Armenia ... ... ... ... ... ... Austria 7.6 6.7 6.2 7.8 8.1 7 Belgium 14.8 14.0 13.4 13.0 11.1 -25 Bulgaria ... ... ... ... ... ... Croatia 5.1 4.1 5.1 3.9 3.7 -27 Cyprus 3.5 1.1 2.1 ... ... ... Czech Republic 5.6 5.7 5.6 5.2 4.7 -15 Denmark ... ... ... ... ... ... Estonia 0.8 ... ... ... ... ... Finland 19.0 22.4 20.4 14.7 20.1 6 France 8.7 9.0 8.9 8.5 8.2 -6 Georgia ... ... ... ... ... ... Germany 9.5 9.6 9.2 9.8 9.2 -3 Greece ... ... ... ... ... ... Hungary 0.6 0.5 0.7 0.9 0.6 4 Iceland ... ... ... ... ... ... Ireland ... ... ... ... ... ... Italy 1.0 0.9 0.9 1.0 ... ... Kosovo (UNR) 2.9 4.2 3.2 2.9 3.2 11 Lithuania 0.5 0.7 0.8 0.9 1.9 272 Malta ... ... ... ... ... ... Netherlands ... ... ... ... ... ... Norway ... ... ... ... ... ... Poland 3.0 2.8 2.6 2.4 2.2 -26 Portugal 4.0 3.3 3.5 3.0 3.1 -22 Romania ... ... ... ... ... ... Russia ... ... ... ... ... ... Serbia 1.0 0.9 1.0 1.1 0.7 -30 Slovakia 5.2 5.7 6.1 5.7 8.0 53 Slovenia 10.3 8.2 9.4 11.9 10.4 0 Spain ... ... ... ... ... ... Sweden 2.7 3.0 2.0 2.6 2.8 6 Switzerland ... ... 10.6 8.8 9.3 ... Turkey ... ... ... ... ... ... Ukraine ... ... ... ... ... ... UK: England & Wales ... ... ... ... ... ... UK: Northern Ireland ... ... ... ... ... ... UK: Scotland ... ... ... ... ... ... Mean 5.4 5.7 5.9 5.8 6.3 Median 3.7 4.2 5.1 4.5 4.7 Minimum 0.5 0.5 0.7 0.9 0.6 Maximum 19.0 22.4 20.4 14.7 20.1

66
Table 1.2.2.12 Offenders per 100 000 population – Offenders – Robbery: Total
2007 2008 2009 2010 2011
% change 2007-2011
Albania 4.7 4.5 5.0 6.2 8.6 84 Armenia ... ... ... ... ... ... Austria 29.0 28.1 31.5 28.8 25.0 -14 Belgium 70.1 76.9 82.9 80.5 77.0 10 Bulgaria 18.7 18.4 19.4 20.0 17.2 -8 Croatia 23.9 21.3 23.4 20.5 19.1 -20 Cyprus 6.3 5.7 12.8 ... ... ... Czech Republic 22.5 23.9 24.6 21.2 20.5 -9 Denmark ... ... ... ... ... ... Estonia 42.4 ... ... ... ... ... Finland 25.9 28.0 29.0 24.9 26.1 1 France 35.7 33.5 35.7 36.6 34.8 -2 Georgia ... ... 23.1 15.5 11.8 ... Germany 44.0 42.8 42.0 40.1 39.4 -11 Greece 7.6 7.7 10.5 12.3 11.7 53 Hungary 18.3 18.9 16.9 18.4 16.1 -12 Iceland ... ... ... ... ... ... Ireland ... ... ... ... ... ... Italy 32.9 33.0 29.4 29.5 ... ... Kosovo (UNR) 9.1 10.8 12.5 11.3 16.7 84 Lithuania 61.8 58.4 56.5 48.3 49.0 -21 Malta ... ... ... ... ... ... Netherlands 51.4 46.1 50.6 49.8 52.2 2 Norway ... ... ... ... ... ... Poland 35.2 32.8 32.1 29.5 27.4 -22 Portugal 300.5 245.3 308.3 123.0 120.1 -60 Russia ... ... ... ... ... ... Serbia 109.5 113.4 111.9 116.0 116.7 7 Slovakia 19.4 18.0 18.7 16.5 12.0 -38 Slovenia 22.0 16.4 19.6 16.8 17.5 -20 Spain 37.2 38.9 38.2 36.1 50.0 34 Sweden 17.6 17.5 19.4 18.9 18.3 4 Switzerland ... ... 33.2 32.4 39.5 ... Turkey ... ... ... ... ... ... Ukraine 35.7 32.1 33.9 29.4 27.7 -22 UK: England & Wales ... ... ... ... ... ... UK: Northern Ireland ... ... ... ... ... ... UK: Scotland ... ... ... ... ... ... Mean 43.3 40.5 43.1 35.3 35.6 Median 29.0 28.1 29.2 28.8 25.6 Minimum 4.7 4.5 5.0 6.2 8.6 Maximum 300.5 245.3 308.3 123.0 120.1

67
Table 1.2.2.13 Offenders per 100 000 population – Offenders – Robbery: Firearm
involved
2007 2008 2009 2010 2011
% change 2007-2011
Albania 1.3 0.9 1.7 2.1 3.3 153 France 4.5 4.9 5.9 5.3 5.1 14 Georgia ... ... 10.9 6.8 4.9 ... Germany 2.2 2.0 2.5 2.5 2.4 8 Hungary 0.6 0.3 0.1 0.3 0.4 -26 Lithuania 0.1 0.1 0.2 0.2 0.3 196 Serbia 8.6 8.6 10.2 7.6 7.7 -10 Slovakia 1.3 0.8 0.9 1.3 0.9 -33 Spain 2.0 2.1 2.3 1.9 2.3 16 Sweden 4.3 4.3 4.9 4.8 5.2 20 Mean 2.8 2.7 4.0 3.3 3.2 Median 2.0 2.0 2.4 2.3 2.8 Minimum 0.1 0.1 0.1 0.2 0.3 Maximum 8.6 8.6 10.9 7.6 7.7

68
Table 1.2.2.14 Offenders per 100 000 population – Offenders – Theft: Total
2007 2008 2009 2010 2011
% change 2007-2011
Albania 60 60 64 94 114 89 Armenia ... ... ... ... ... ... Austria 624 618 619 602 612 -2 Belgium 573 585 589 608 582 2 Bulgaria 281 254 243 334 316 13 Croatia 384 323 331 385 381 -1 Cyprus 310 287 229 ... ... ... Czech Republic 281 268 266 263 284 1 Denmark ... ... ... ... ... ... Estonia 313 ... ... ... ... ... Finland 1189 1269 1268 1283 1254 5 France 338 337 345 349 345 2 Georgia ... ... 85 97 94 ... Germany 705 682 652 632 621 -12 Greece 83 93 100 99 115 39 Hungary 287 293 267 303 283 -1 Iceland ... ... 440 ... ... ... Ireland ... ... ... ... ... ... Italy 145 135 126 138 ... ... Kosovo (UNR) 235 209 148 158 233 -1 Lithuania 228 240 256 246 272 20 Luxembourg ... ... ... ... ... ... Malta ... ... ... ... ... ... Netherlands 785 761 692 653 662 -16 Norway ... ... ... ... ... ... Poland 194 179 177 197 211 9 Portugal 253 269 253 214 229 -9 Russia ... ... ... ... ... ... Serbia 83 81 68 83 90 8 Slovakia 257 250 275 274 269 5 Slovenia 688 549 479 484 481 -30 Spain ... ... ... ... ... ... Sweden 320 336 369 349 322 1 Switzerland ... ... 313 301 287 ... Turkey ... ... ... ... ... ... Ukraine 90 82 110 177 191 113 UK: England & Wales ... ... ... ... ... ... UK: Northern Ireland ... ... ... ... ... ... UK: Scotland ... ... ... ... ... ... Mean 363 355 337 347 359 Median 284 269 266 288 284 Minimum 60 60 64 83 90 Maximum 1189 1269 1268 1283 1254

69
Table 1.2.2.15 Offenders per 100 000 population – Offenders – Theft: Theft of a motor
vehicle
2007 2008 2009 2010 2011 % change
2007-2011 Albania 4 4 4 5 6 65 Armenia ... ... ... ... ... ... Austria 15 16 15 10 13 -14 Belgium 38 36 34 30 26 -31 Bulgaria 8 8 7 8 5 -37 Croatia 26 27 24 21 19 -27 Cyprus ... ... ... ... ... ... Czech Republic 23 21 19 17 17 -27 Denmark ... ... ... ... ... ... Estonia ... ... ... ... ... ... Finland 127 134 108 95 93 -27 France 34 34 32 29 27 -22 Georgia ... ... 3 4 4 ... Germany 30 28 26 25 24 -19 Greece 10 10 11 8 10 7 Hungary 18 17 16 14 13 -30 Iceland ... ... ... ... ... ... Ireland ... ... ... ... ... ... Italy 11 13 9 8 ... ... Kosovo (UNR) 8 7 5 3 2 -69 Lithuania 26 27 26 24 25 -7 Malta ... ... ... ... ... ... Netherlands 27 26 21 18 17 -37 Norway ... ... ... ... ... ... Poland 10 9 9 8 8 -19 Portugal 17 20 15 18 17 -5 Russia ... ... ... ... ... ... Serbia 1 1 1 1 1 -1 Slovakia 17 18 19 16 10 -38 Slovenia 6 10 5 6 5 -16 Spain 24 21 17 13 16 -35 Sweden 34 31 28 26 22 -35 Switzerland ... ... 25 23 19 ... Turkey ... ... ... ... ... ... Ukraine 15 8 7 6 6 -56 UK: England & Wales ... ... ... ... ... ... UK: Northern Ireland ... ... ... ... ... ... UK: Scotland ... ... ... ... ... ... Mean 23 23 19 17 17 Median 17 18 16 14 14 Minimum 1 1 1 1 1 Maximum 127 134 108 95 93
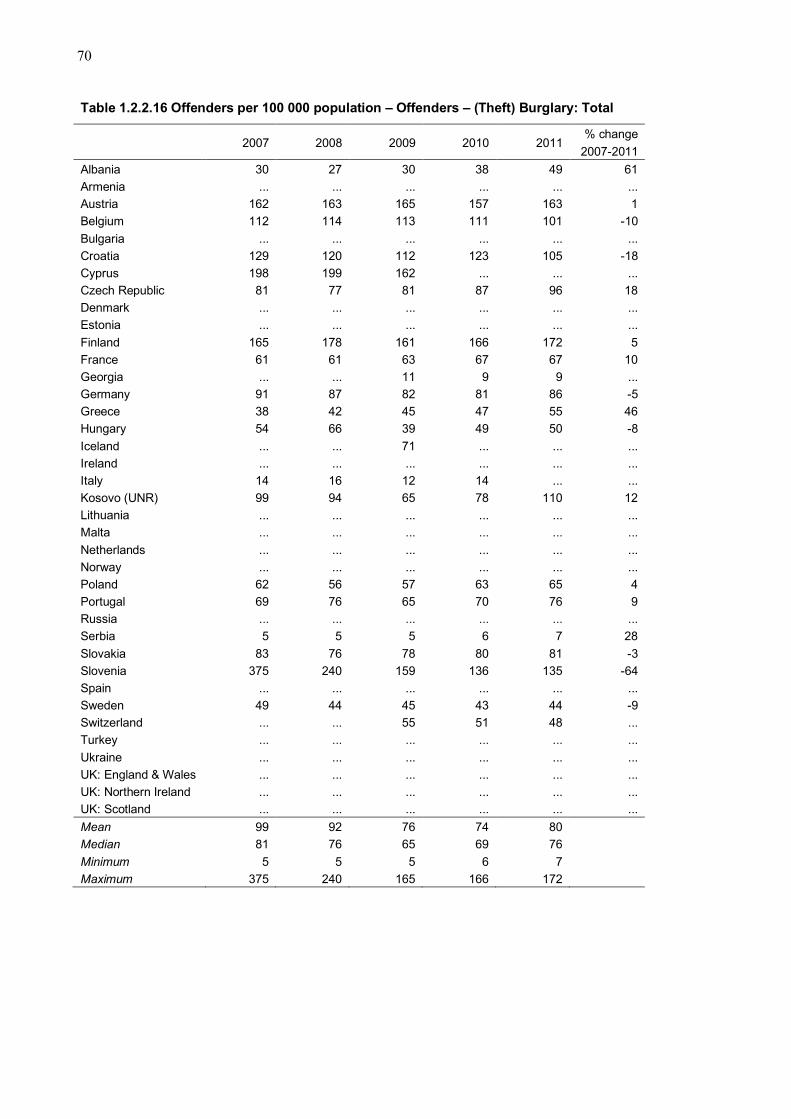
70
Table 1.2.2.16 Offenders per 100 000 population – Offenders – (Theft) Burglary: Total
2007 2008 2009 2010 2011
% change 2007-2011
Albania 30 27 30 38 49 61 Armenia ... ... ... ... ... ... Austria 162 163 165 157 163 1 Belgium 112 114 113 111 101 -10 Bulgaria ... ... ... ... ... ... Croatia 129 120 112 123 105 -18 Cyprus 198 199 162 ... ... ... Czech Republic 81 77 81 87 96 18 Denmark ... ... ... ... ... ... Estonia ... ... ... ... ... ... Finland 165 178 161 166 172 5 France 61 61 63 67 67 10 Georgia ... ... 11 9 9 ... Germany 91 87 82 81 86 -5 Greece 38 42 45 47 55 46 Hungary 54 66 39 49 50 -8 Iceland ... ... 71 ... ... ... Ireland ... ... ... ... ... ... Italy 14 16 12 14 ... ... Kosovo (UNR) 99 94 65 78 110 12 Lithuania ... ... ... ... ... ... Malta ... ... ... ... ... ... Netherlands ... ... ... ... ... ... Norway ... ... ... ... ... ... Poland 62 56 57 63 65 4 Portugal 69 76 65 70 76 9 Russia ... ... ... ... ... ... Serbia 5 5 5 6 7 28 Slovakia 83 76 78 80 81 -3 Slovenia 375 240 159 136 135 -64 Spain ... ... ... ... ... ... Sweden 49 44 45 43 44 -9 Switzerland ... ... 55 51 48 ... Turkey ... ... ... ... ... ... Ukraine ... ... ... ... ... ... UK: England & Wales ... ... ... ... ... ... UK: Northern Ireland ... ... ... ... ... ... UK: Scotland ... ... ... ... ... ... Mean 99 92 76 74 80 Median 81 76 65 69 76 Minimum 5 5 5 6 7 Maximum 375 240 165 166 172

71
Table 1.2.2.17 Offenders per 100 000 population – Offenders – (Theft) Burglary:
Domestic burglary
2007 2008 2009 2010 2011 % change
2007-2011 Albania 15 13 13 18 25 68 Armenia ... ... ... ... ... ... Austria 32 30 30 29 28 -13 Belgium 57 58 58 57 56 -2 Bulgaria ... ... ... ... ... ... Croatia 39 36 32 44 35 -11 Cyprus ... ... ... ... ... ... Czech Republic 16 15 16 16 17 6 Denmark ... ... ... ... ... ... Estonia ... ... ... ... ... ... Finland 48 56 54 57 48 0 France 26 27 31 32 34 31 Georgia ... ... ... ... ... ... Germany 29 27 27 26 28 -4 Greece ... ... ... ... ... ... Hungary 20 25 17 22 24 21 Iceland ... ... ... ... ... ... Ireland ... ... ... ... ... ... Italy ... ... ... ... ... ... Kosovo (UNR) ... ... ... ... ... ... Lithuania 53 52 56 55 58 9 Malta ... ... ... ... ... ... Netherlands 91 85 73 75 80 -12 Norway ... ... ... ... ... ... Poland ... ... ... ... ... ... Portugal 34 38 31 36 39 14 Russia ... ... ... ... ... ... Serbia 0 1 0 1 1 32 Slovakia 15 15 15 15 13 -15 Slovenia 21 24 18 21 20 -3 Spain 14 16 18 21 24 72 Sweden 7 9 11 11 13 75 Switzerland ... ... 55 51 48 ... Turkey ... ... ... ... ... ... Ukraine 14 11 15 19 12 -18 UK: England & Wales ... ... ... ... ... ... UK: Northern Ireland ... ... ... ... ... ... UK: Scotland ... ... ... ... ... ... Mean 30 30 30 32 32 Median 24 26 27 26 28 Minimum 0 1 0 1 1 Maximum 91 85 73 75 80

72
Table 1.2.2.18 Offenders per 100 000 population – Offenders – Fraud
2007 2008 2009 2010 2011
% change 2007-2011
Albania 6 15 11 13 13 112 Armenia ... ... ... ... ... ... Austria 221 203 222 220 239 8 Belgium 66 66 68 68 62 -6 Bulgaria 21 19 19 16 7 -65 Croatia 65 69 69 59 71 9 Cyprus 21 24 35 ... ... ... Czech Republic 50 45 47 48 45 -11 Denmark ... ... ... ... ... ... Estonia 42 ... ... ... ... ... Finland 265 275 303 340 313 18 France 73 81 84 81 82 13 Georgia ... ... 23 31 27 ... Germany 345 350 348 349 322 -7 Greece 5 6 5 5 7 38 Hungary 84 80 71 72 61 -28 Iceland ... ... ... ... ... ... Ireland ... ... ... ... ... ... Italy 78 79 81 82 ... ... Kosovo (UNR) 21 22 22 19 30 40 Lithuania 33 38 42 53 58 75 Malta ... ... ... ... ... ... Netherlands 72 71 65 60 47 -35 Norway ... ... ... ... ... ... Poland 94 88 91 97 88 -6 Portugal 39 35 37 31 30 -22 Russia ... ... ... ... ... ... Serbia 22 25 25 23 21 -5 Slovakia 105 93 102 84 78 -26 Slovenia 232 189 213 218 156 -33 Spain 14 19 20 21 21 51 Sweden 84 76 83 85 78 -7 Switzerland ... ... 102 104 98 ... Turkey ... ... ... ... ... ... Ukraine 14 10 15 18 18 22 UK: England & Wales ... ... ... ... ... ... UK: Northern Ireland ... ... ... ... ... ... UK: Scotland ... ... ... ... ... ... Mean 83 82 85 88 82 Median 65 67 67 60 59 Minimum 5 6 5 5 7 Maximum 345 350 348 349 322

73
Table 1.2.2.19 Offenders per 100 000 population – Offenders – Money laundering
2007 2008 2009 2010 2011
% change 2007-2011
Albania 0.0 5.8 5.9 3.1 4.7 ... Armenia 0.0 0.0 0.0 ... ... ... Austria 3.5 4.3 3.5 7.7 7.2 102 Belgium 8.0 7.9 8.1 8.8 7.5 -6 Bulgaria ... ... ... ... ... ... Croatia 0.8 0.3 0.4 0.6 0.9 9 Cyprus 68.8 ... ... ... ... ... Czech Republic 0.1 0.2 0.2 0.5 1.0 662 Denmark ... ... ... ... ... ... Estonia 0.7 ... ... ... ... ... Finland ... ... ... ... ... ... France ... ... ... ... ... ... Georgia ... ... 0.1 0.7 2.8 ... Germany 4.3 3.1 5.1 7.5 8.7 100 Greece ... ... ... ... ... ... Hungary 0.0 0.0 0.0 0.0 0.0 102 Iceland ... ... ... ... ... ... Ireland ... ... ... ... ... ... Italy 5.1 5.5 4.6 5.5 ... ... Kosovo (UNR) ... ... 0.0 0.3 0.3 ... Lithuania 0.1 0.3 0.0 0.6 0.9 521 Luxembourg ... ... ... ... ... ... Malta ... ... ... ... ... ... Netherlands 0.2 0.0 2.0 2.7 3.8 2395 Norway ... ... ... ... ... ... Poland 0.6 0.4 0.4 0.6 0.3 -43 Portugal ... 0.1 0.1 ... ... ... Russia ... ... ... ... ... ... Serbia 0.6 0.7 0.6 1.7 3.2 473 Slovakia 0.3 0.3 0.5 0.7 1.0 238 Slovenia 0.2 1.2 2.8 5.6 4.5 1724 Spain 0.4 0.5 0.6 0.6 0.9 106 Sweden ... 1.2 1.1 1.3 1.7 ... Switzerland ... ... 7.5 4.8 4.2 ... Turkey ... ... ... ... ... ... Ukraine 0.1 0.1 0.2 0.4 0.6 382 UK: England & Wales ... ... ... ... ... ... UK: Northern Ireland ... ... ... ... ... ... UK: Scotland ... ... ... ... ... ... Mean 4.9 1.7 2.0 2.7 2.8 Median 0.4 0.4 0.5 1.0 1.7 Minimum 0.0 0.0 0.0 0.0 0.0 Maximum 68.8 7.9 8.1 8.8 8.7

74
Table 1.2.2.20 Offenders per 100 000 population – Offenders – Corruption
2007 2008 2009 2010 2011
% change 2007-2011
Albania 7.0 5.0 3.5 5.2 4.8 -31 Armenia ... ... ... ... ... ... Austria 1.7 2.9 2.2 4.5 7.9 369 Belgium 1.1 0.7 1.3 0.7 0.6 -45 Bulgaria 1.0 1.1 1.6 1.5 1.5 41 Croatia 2.0 6.0 4.1 6.1 7.2 261 Cyprus 2.3 0.5 6.1 ... ... ... Czech Republic 0.8 0.8 0.6 1.1 1.9 139 Denmark ... ... ... ... ... ... Estonia 6.1 ... ... ... ... ... Finland ... ... ... ... ... ... France ... ... ... ... ... ... Georgia ... ... 3.0 5.4 3.4 ... Germany 2.7 2.0 1.9 1.7 1.4 -49 Greece 0.9 1.6 1.9 1.4 1.3 49 Hungary 2.1 2.6 3.4 2.6 2.5 18 Iceland ... ... ... ... ... ... Ireland ... ... ... ... ... ... Italy ... ... ... ... ... ... Kosovo (UNR) 4.5 4.1 9.4 4.2 4.0 -10 Lithuania 10.7 9.6 11.2 13.4 14.5 36 Luxembourg ... ... ... ... ... ... Malta ... ... ... ... ... ... Netherlands ... ... ... ... ... ... Norway ... ... ... ... ... ... Poland 8.6 7.8 7.3 7.8 7.3 -15 Portugal 0.6 0.3 0.1 0.1 0.1 -79 Russia ... ... ... ... ... ... Serbia 3.4 3.0 3.7 3.0 2.7 -20 Slovakia 2.4 4.0 4.6 2.3 3.1 28 Slovenia 0.8 0.5 12.0 3.4 4.2 402 Spain 0.6 0.7 0.7 0.6 1.4 135 Sweden ... ... 0.4 0.9 0.7 ... Switzerland ... ... 0.8 0.3 0.2 ... Turkey ... ... ... ... ... ... Ukraine 3.0 3.1 3.1 3.7 4.1 35 UK: England & Wales ... ... ... ... ... ... UK: Northern Ireland ... ... ... ... ... ... UK: Scotland ... ... ... ... ... ... Mean 3.1 3.0 3.8 3.3 3.6 Median 2.2 2.6 3.1 2.6 2.7 Minimum 0.6 0.3 0.1 0.1 0.1 Maximum 10.7 9.6 12.0 13.4 14.5
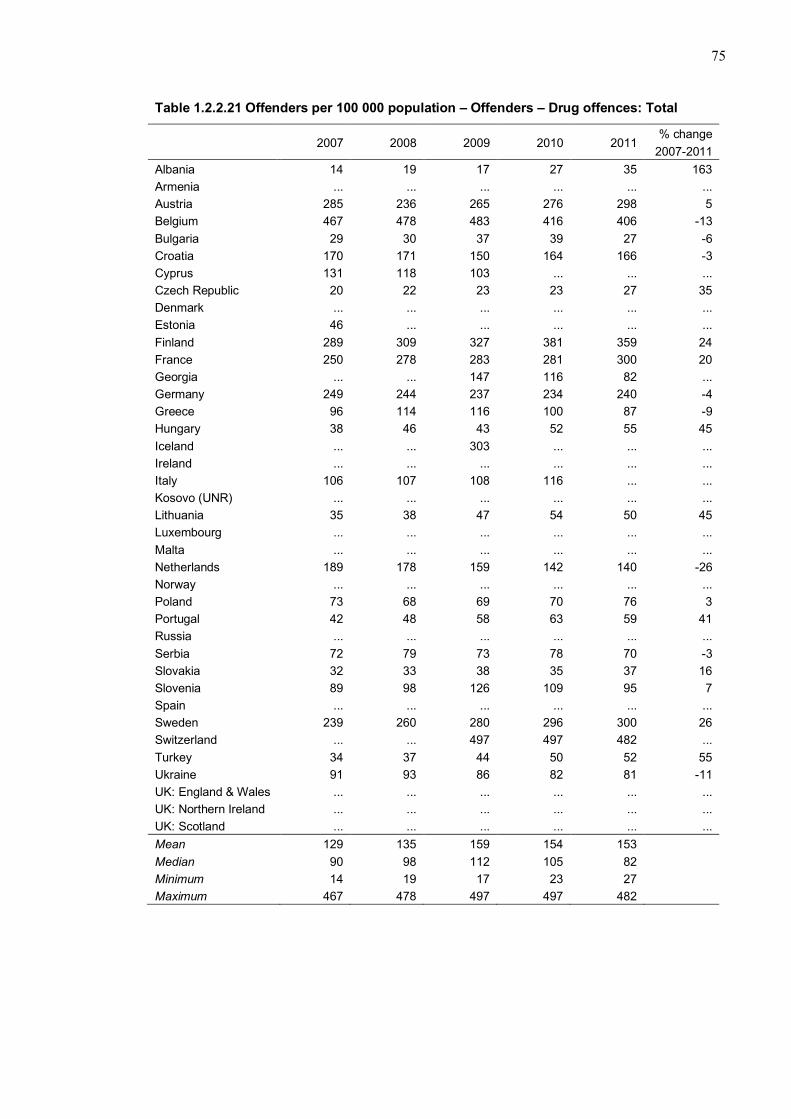
75
Table 1.2.2.21 Offenders per 100 000 population – Offenders – Drug offences: Total
2007 2008 2009 2010 2011
% change 2007-2011
Albania 14 19 17 27 35 163 Armenia ... ... ... ... ... ... Austria 285 236 265 276 298 5 Belgium 467 478 483 416 406 -13 Bulgaria 29 30 37 39 27 -6 Croatia 170 171 150 164 166 -3 Cyprus 131 118 103 ... ... ... Czech Republic 20 22 23 23 27 35 Denmark ... ... ... ... ... ... Estonia 46 ... ... ... ... ... Finland 289 309 327 381 359 24 France 250 278 283 281 300 20 Georgia ... ... 147 116 82 ... Germany 249 244 237 234 240 -4 Greece 96 114 116 100 87 -9 Hungary 38 46 43 52 55 45 Iceland ... ... 303 ... ... ... Ireland ... ... ... ... ... ... Italy 106 107 108 116 ... ... Kosovo (UNR) ... ... ... ... ... ... Lithuania 35 38 47 54 50 45 Luxembourg ... ... ... ... ... ... Malta ... ... ... ... ... ... Netherlands 189 178 159 142 140 -26 Norway ... ... ... ... ... ... Poland 73 68 69 70 76 3 Portugal 42 48 58 63 59 41 Russia ... ... ... ... ... ... Serbia 72 79 73 78 70 -3 Slovakia 32 33 38 35 37 16 Slovenia 89 98 126 109 95 7 Spain ... ... ... ... ... ... Sweden 239 260 280 296 300 26 Switzerland ... ... 497 497 482 ... Turkey 34 37 44 50 52 55 Ukraine 91 93 86 82 81 -11 UK: England & Wales ... ... ... ... ... ... UK: Northern Ireland ... ... ... ... ... ... UK: Scotland ... ... ... ... ... ... Mean 129 135 159 154 153 Median 90 98 112 105 82 Minimum 14 19 17 23 27 Maximum 467 478 497 497 482

76
Table 1.2.2.22 Offenders per 100 000 population – Offenders – Drug offences: Drug
trafficking
2007 2008 2009 2010 2011
% change 2007-2011
Albania 14 19 17 27 35 163 Armenia ... ... ... ... ... ... Austria ... ... ... ... ... ... Belgium 135 141 139 128 117 -13 Bulgaria ... ... ... ... ... ... Croatia 42 55 42 46 44 3 Cyprus ... ... ... ... ... ... Czech Republic 16 18 19 19 21 36 Denmark ... ... ... ... ... ... Estonia 37 ... ... ... ... ... Finland 97 109 125 144 139 44 France 17 23 19 20 19 9 Georgia ... ... 2 3 1 ... Germany 83 77 73 73 74 -10 Greece ... ... ... ... ... ... Hungary 6 6 5 6 5 -19 Iceland ... ... ... ... ... ... Ireland ... ... ... ... ... ... Italy ... ... ... ... ... ... Kosovo (UNR) 25 16 20 22 32 31 Lithuania 10 12 13 16 15 50 Luxembourg ... ... ... ... ... ... Malta ... ... ... ... ... ... Netherlands ... ... ... ... ... ... Norway ... ... ... ... ... ... Poland 4 5 4 5 5 18 Portugal 35 40 44 46 44 26 Russia ... ... ... ... ... ... Serbia 24 29 30 31 25 7 Slovakia 11 11 13 12 14 35 Slovenia 80 85 115 99 86 8 Spain 44 44 44 43 51 16 Sweden 30 36 40 44 44 45 Switzerland ... ... 85 84 69 ... Turkey ... ... ... ... ... ... Ukraine 17 17 17 17 16 -6 UK: England & Wales ... ... ... ... ... ... UK: Northern Ireland ... ... ... ... ... ... UK: Scotland ... ... ... ... ... ... Mean 38 41 43 44 43 Median 25 26 25 29 34 Minimum 4 5 2 3 1 Maximum 135 141 139 144 139

77
Notes on Tables 1.2.2.1-1.2.2.22
Albania: The number of suspected offenders for drug offences has increased because cultivation of cannabis rose. Estonia: For 2008-2011 data according to crime types are not available due to changes in the database. Mentally ill persons who have been sent to court in order to apply compulsory psychiatric treatment were not included. Georgia: Theft of motor vehicle: Number of offenders significantly increased due to changes in the criminal code. Money laundering: New legislation was adopted in 2010. Turkey: These statistics are not published, in general.

78
1.2.3 Percentage of females, minors, and aliens among offenders in 2010
Table 1.2.3.1 Percentage of females, minors, and aliens from EU countries among offenders in 2010 – Criminal offences: Total
Total offenders per 100 000
pop.
of which % of Females
of which % of Minors
of which % of Aliens
% of EU citizens
amongst aliens
Albania 502 4.3 11.0 2.3 ... Armenia 374 12.1 3.7 2.4 ... Austria 3000 20.5 14.9 23.5 42.2 Belgium 3219 17.7 11.4 30.6 43.8 Bulgaria 783 11.9 7.8 2.9 ... Croatia 1371 10.1 10.8 6.5 45.4 Cyprus 693 ... ... 43.8 ... Czech Republic 1071 13.2 5.0 6.6 ... Denmark ... ... ... ... ... Estonia 1127 ... 9.9 ... ... Finland 5644 23.5 12.6 11.1 54.0 France 1860 16.0 18.5 20.4 ... Georgia ... ... ... ... ... Germany 2632 25.4 15.0 21.9 ... Greece 1689 20.2 6.5 37.0 ... Hungary 1224 17.3 9.2 3.4 55.3 Iceland ... ... ... ... ... Ireland ... ... ... ... ... Italy 1552 17.5 3.4 31.9 ... Kosovo (UNR) 1621 5.9 3.4 ... ... Lithuania 736 12.6 14.7 1.2 33.2 Malta 1086 23.1 8.5 11.3 ... Netherlands 2310 15.9 15.9 ... ... Norway ... ... ... ... ... Poland 1352 10.0 9.9 0.4 39.6 Portugal 2078 17.0 ... ... ... Russia 1852 6.6 2.8 1.9 ... Serbia 752 9.9 8.4 2.4 ... Slovakia 983 14.7 7.8 2.0 60.3 Slovenia 2722 14.6 4.9 14.1 35.5 Spain 635 10.2 5.5 34.0 32.6 Sweden 1354 20.3 13.2 ... ... Switzerland ... ... ... ... ... Turkey ... ... ... ... ... Ukraine 494 13.9 6.2 0.9 ... UK: England & Wales ... ... ... ... ... UK: Northern Ireland ... ... ... ... ... UK: Scotland ... ... ... ... ... Mean 1597 14.8 9.3 13.6 44.2 Median 1353 14.7 8.9 6.6 43.0 Minimum 374 4.3 2.8 0.4 32.6 Maximum 5644 25.4 18.5 43.8 60.3

79
Table 1.2.3.2 Percentage of females, minors, and aliens from EU countries among
offenders in 2010 - Major traffic offences
Total offenders per 100 000 pop.
of which % of Females
of which % of Minors
of which % of Aliens
% of EU citizens
amongst aliens
Albania 32 4.3 6.1 3.0 ... Armenia ... ... ... ... ... Austria 444 28.9 4.7 16.1 52.5 Belgium ... ... ... ... ... Bulgaria 168 3.8 1.1 1.8 ... Croatia 40 14.8 1.5 6.0 58.9 Cyprus ... ... ... ... ... Czech Republic 60 15.7 0.7 ... ... Denmark ... ... ... ... ... Estonia ... ... ... ... ... Finland 2449 18.1 6.2 10.4 53.3 France ... ... ... ... ... Georgia ... ... ... ... ... Germany ... ... ... ... ... Greece 797 11.5 8.4 19.2 ... Hungary 135 8.9 1.4 4.4 80.2 Iceland ... ... ... ... ... Ireland ... ... ... ... ... Italy 4 7.5 0.4 56.3 ... Kosovo (UNR) 541 5.0 0.8 ... ... Lithuania 36 18.8 2.4 1.7 65.0 Malta ... ... ... ... ... Netherlands 370 13.5 2.5 ... ... Norway ... ... ... ... ... Poland 394 4.2 0.6 0.4 47.6 Portugal 405 7.3 ... ... ... Russia ... ... ... ... ... Serbia 29 9.9 1.9 1.5 ... Slovakia 32 14.2 1.0 4.8 71.4 Slovenia ... ... ... ... ... Spain 78 6.4 2.3 24.8 38.4 Sweden 327 10.9 8.1 ... ... Switzerland ... ... ... ... ... Turkey ... ... ... ... ... Ukraine 23 3.9 4.8 1.6 ... UK: England & Wales ... ... ... ... ... UK: Northern Ireland ... ... ... ... ... UK: Scotland ... ... ... ... ... Mean 335 10.9 3.0 10.9 58.4 Median 135 9.9 2.1 4.6 56.1 Minimum 4 3.8 0.4 0.4 38.4 Maximum 2449 28.9 8.4 56.3 80.2

80
Table 1.2.3.3 Percentage of females, minors, and aliens from EU countries among
offenders in 2010 – Intentional homicide: Total
Total offenders
per 100 000 pop.
of which % of Females
of which % of Minors
of which % of Aliens
% of EU citizens
amongst aliens
Albania 14.1 1.9 5.4 0.2 ... Armenia ... ... ... ... ... Austria 2.2 15.8 7.1 27.2 36.0 Belgium 7.0 11.3 4.8 29.8 47.6 Bulgaria 1.9 9.0 5.6 0.0 ... Croatia 4.5 9.6 3.5 2.0 25.0 Cyprus 3.5 ... ... 48.3 ... Czech Republic 1.8 17.7 2.7 12.4 ... Denmark ... ... ... ... ... Estonia ... ... ... ... ... Finland 8.9 16.9 3.2 3.2 6.7 France 3.4 11.2 8.1 16.3 ... Georgia ... ... ... ... ... Germany 3.5 14.2 7.3 27.7 ... Greece 2.5 6.6 ... 33.0 ... Hungary 2.7 16.5 5.6 4.9 100.0 Iceland ... ... ... ... ... Ireland ... ... ... ... ... Italy 0.5 54.1 30.5 382.8 ... Kosovo (UNR) 6.0 5.3 3.0 ... ... Lithuania 8.9 10.5 10.2 0.3 0.0 Luxembourg ... ... ... ... ... Malta ... ... ... ... ... Netherlands 19.5 10.8 6.5 ... ... Norway ... ... ... ... ... Poland 2.5 12.4 2.6 0.3 0.0 Portugal ... ... ... ... ... Russia ... ... ... ... ... Serbia 4.9 8.6 8.6 2.2 ... Slovakia 1.4 11.7 0.0 2.6 0.0 Slovenia 2.5 7.7 0.0 9.6 20.0 Spain 2.3 10.7 4.2 28.7 27.5 Sweden ... ... ... ... ... Switzerland ... ... ... ... ... Turkey ... ... ... ... ... Ukraine 5.3 12.1 2.7 2.1 ... UK: England & Wales ... ... ... ... ... UK: Northern Ireland ... ... ... ... ... UK: Scotland ... ... ... ... ... Mean 5.0 13.1 6.1 31.7 26.3 Median 3.4 11.2 5.1 7.3 22.5 Minimum 0.5 1.9 0.0 0.0 0.0 Maximum 19.5 54.1 30.5 382.8 100.0

81
Table 1.2.3.4 Percentage of females, minors, and aliens from EU countries among
offenders in 2010 – Intentional homicide: Completed
Total offenders
per 100 000 pop.
of which % of Females
of which % of Minors
of which % of Aliens
% of EU citizens
amongst aliens
Albania 4.4 5.3 15.2 0.0 ... Armenia ... ... ... ... ... Austria ... ... ... ... ... Belgium 1.5 14.0 5.5 36.0 50.8 Bulgaria ... ... ... ... ... Croatia 1.4 15.6 0.0 1.6 0.0 Cyprus 1.8 ... ... 33.3 ... Czech Republic ... ... ... ... ... Denmark ... ... ... ... ... Estonia ... ... ... ... ... Finland 2.8 13.2 0.7 2.0 0.0 France 1.7 12.2 6.6 14.8 ... Georgia ... ... ... ... ... Germany ... ... ... ... ... Greece ... ... ... ... ... Hungary 1.3 9.1 0.0 3.0 100.0 Iceland ... ... ... ... ... Ireland ... ... ... ... ... Italy 1.8 6.8 2.8 22.6 ... Kosovo (UNR) 5.8 ... ... ... ... Lithuania 8.1 10.7 10.4 0.4 0.0 Malta ... ... ... ... ... Netherlands ... ... ... ... ... Norway ... ... ... ... ... Poland ... ... ... ... ... Portugal 0.7 12.7 ... ... ... Russia ... ... ... ... ... Serbia 2.0 11.7 6.9 2.1 ... Slovakia 1.0 12.7 0.0 0.0 ... Slovenia 0.6 ... ... 16.7 ... Spain 0.9 13.1 3.3 31.2 33.9 Sweden ... ... ... ... ... Switzerland ... ... ... ... ... Turkey ... ... ... ... ... Ukraine ... ... ... ... ... UK: England & Wales ... ... ... ... ... UK: Northern Ireland ... ... ... ... ... UK: Scotland ... ... ... ... ... Mean 2.4 11.4 4.7 12.6 30.8 Median 1.7 12.4 3.3 3.0 16.9 Minimum 0.6 5.3 0.0 0.0 0.0 Maximum 8.1 15.6 15.2 36.0 100.0

82
Table 1.2.3.5 Percentage of females, minors, and aliens from EU countries among
offenders in 2010 – Intentional homicide: Completed: Firearm involved
Total offenders per 100 000
pop.
of which % of Females
of which % of Minors
of which % of Aliens
% of EU citizens
amongst aliens
Hungary 0.1 11.1 0.0 11.1 100.0 Lithuania 0.1 ... ... 0.0 ... Serbia 0.5 5.4 2.7 0.0 ... Slovakia 0.1 0.0 0.0 0.0 ... Spain 0.2 13.2 1.9 15.1 37.5 Mean 0.2 7.4 1.1 5.2 68.8 Median 0.1 8.3 0.9 0.0 68.8 Minimum 0.1 0.0 0.0 0.0 37.5 Maximum 0.5 13.2 2.7 15.1 100.0 Table 1.2.3.6 Percentage of females, minors, and aliens from EU countries among
offenders in 2010 – Robbery: Firearm involved
Total offenders per 100 000
pop.
of which % of Females
of which % of Minors
of which % of Aliens
% of EU citizens
amongst aliens
Albania 2.1 0.0 0.0 0.0 ... France 5.3 2.9 17.9 9.7 ... Germany 2.5 1.7 ... ... ... Hungary 0.3 0.0 0.0 0.0 ... Lithuania 0.2 12.5 0.0 0.0 ... Serbia 7.6 2.2 6.0 2.3 ... Slovakia 1.3 1.4 2.8 5.6 100.0 Spain 1.9 7.1 5.1 34.9 13.4 Sweden 4.8 5.1 23.8 ... ... Mean 2.9 3.6 7.0 7.5 56.7 Median 2.1 2.2 4.0 2.3 56.7 Minimum 0.2 0.0 0.0 0.0 13.4 Maximum 7.6 12.5 23.8 34.9 100.0 Table 1.2.3.7 Percentage of females, minors, and aliens from EU countries among
offenders in 2010 – Intentional homicide: Firearm involved
Total offenders per 100 000
pop.
of which % of Females
of which % of Minors
of which % of Aliens
% of EU citizens
amongst aliens
Germany 0.2 1.0 ... ... ... Hungary 0.2 14.3 4.8 4.8 100.0 Lithuania 0.1 ... ... 0.0 ... Serbia 1.3 2.0 3.1 1.0 ... Slovakia 0.2 0.0 0.0 0.0 ... Spain 0.5 11.2 2.3 15.0 46.9 Mean 0.4 5.7 2.5 4.1 73.4 Median 0.2 2.0 2.7 1.0 73.4 Minimum 0.1 0.0 0.0 0.0 46.9 Maximum 1.3 14.3 4.8 15.0 100.0

83
Table 1.2.3.8 Percentage of females, minors, and aliens from EU countries among
offenders in 2010 – Bodily injury (Assault): Total
Total offenders per 100 000
pop.
of which % of Females
of which % of Minors
of which % of Aliens
% of EU citizens
amongst aliens
Albania 54 1.4 16.4 0.2 ... Armenia ... ... ... ... ... Austria 425 14.9 17.1 25.4 29.4 Belgium 415 15.7 12.1 16.9 43.3 Bulgaria 13 3.9 10.0 0.9 ... Croatia 46 5.6 32.2 2.0 46.3 Cyprus 32 ... ... 43.2 ... Czech Republic 39 6.8 9.2 8.2 ... Denmark ... ... ... ... ... Estonia ... ... ... ... ... Finland 542 15.4 11.9 9.8 30.0 France 294 15.1 19.7 12.5 ... Georgia ... ... ... ... ... Germany 547 17.3 16.5 21.0 ... Greece 183 16.6 1.5 11.0 ... Hungary 67 11.9 12.2 1.9 65.4 Iceland ... ... ... ... ... Ireland ... ... ... ... ... Italy 79 16.5 5.0 29.0 ... Kosovo (UNR) 253 3.8 5.0 ... ... Lithuania 73 9.4 9.9 0.2 25.0 Malta ... ... ... ... ... Netherlands 300 14.4 14.4 ... ... Norway ... ... ... ... ... Poland 131 7.8 21.3 0.2 26.9 Portugal 626 20.6 ... ... ... Russia ... ... ... ... ... Serbia 53 5.6 11.7 1.1 ... Slovakia 40 5.3 6.9 1.1 72.0 Slovenia 103 11.5 7.9 5.9 10.5 Spain 32 6.2 6.4 33.4 30.0 Sweden 193 15.4 18.0 ... ... Switzerland ... ... ... ... ... Turkey ... ... ... ... ... Ukraine 20 8.4 4.1 0.9 ... UK: England & Wales ... ... ... ... ... UK: Northern Ireland ... ... ... ... ... UK: Scotland ... ... ... ... ... Mean 190 10.9 12.2 11.2 37.9 Median 91 11.5 11.8 7.0 30.0 Minimum 13 1.4 1.5 0.2 10.5 Maximum 626 20.6 32.2 43.2 72.0

84
Table 1.2.3.9 Percentage of females, minors, and aliens from EU countries among
offenders in 2010 – Bodily injury (Assault): Aggravated bodily injury
Total offenders per 100 000
pop.
of which % of Females
of which % of Minors
of which % of Aliens
% of EU citizens
amongst aliens
Albania 7 2.7 16.8 0.5 ... Armenia ... ... ... ... ... Austria 41 8.9 16.8 28.3 32.1 Belgium 14 25.4 20.9 15.6 33.9 Bulgaria 0 3.4 3.4 3.4 ... Croatia 22 3.1 11.3 2.9 64.3 Cyprus 27 ... ... 41.4 ... Czech Republic ... ... ... ... ... Denmark ... ... ... ... ... Estonia ... ... ... ... ... Finland 40 17.7 6.2 9.1 37.1 France ... ... ... ... ... Georgia ... ... ... ... ... Germany 195 15.2 23.3 23.2 ... Greece ... ... ... ... ... Hungary 55 8.7 9.5 2.0 66.4 Iceland ... ... ... ... ... Ireland ... ... ... ... ... Italy ... ... ... ... ... Kosovo (UNR) 39 1.1 4.7 ... ... Lithuania 10 10.4 6.0 0.0 ... Malta ... ... ... ... ... Netherlands ... ... ... ... ... Norway ... ... ... ... ... Poland 3 6.7 9.2 ... ... Portugal 8 12.4 ... ... ... Russia ... ... ... ... ... Serbia 22 2.4 12.6 1.0 ... Slovakia ... ... ... ... ... Slovenia 103 11.5 1.0 0.5 9.1 Spain ... ... ... ... ... Sweden ... ... ... ... ... Switzerland ... ... ... ... ... Turkey ... ... ... ... ... Ukraine 8 12.9 3.2 1.4 ... UK: England & Wales ... ... ... ... ... UK: Northern Ireland ... ... ... ... ... UK: Scotland ... ... ... ... ... Mean 37 9.5 10.4 9.9 40.5 Median 22 8.9 9.3 2.9 35.5 Minimum 0 1.1 1.0 0.0 9.1 Maximum 195 25.4 23.3 41.4 66.4

85
Table 1.2.3.10 Percentage of females, minors, and aliens from EU countries among
offenders in 2010 – Sexual assault: Total
Total offenders per 100 000
pop.
of which % of Females
of which % of Minors
of which % of Aliens
% of EU citizens
amongst aliens
Albania 3.0 0.0 14.4 1.1 ... Armenia ... ... ... ... ... Austria 23.4 3.7 15.1 23.4 24.8 Belgium 21.3 2.4 17.9 18.5 39.0 Bulgaria 5.7 1.2 17.1 0.9 ... Croatia 5.8 3.1 26.2 5.5 21.4 Cyprus 7.8 ... ... 32.8 ... Czech Republic 8.9 3.4 23.4 ... ... Denmark ... ... ... ... ... Estonia ... ... ... ... ... Finland 33.6 2.8 8.2 22.1 12.8 France 40.4 11.2 19.3 18.0 ... Georgia ... ... ... ... ... Germany 26.3 2.6 18.4 19.9 ... Greece 9.3 29.8 2.3 45.2 ... Hungary 5.9 6.1 17.6 2.4 78.6 Iceland ... ... ... ... ... Ireland ... ... ... ... ... Italy 15.2 2.1 6.4 39.5 ... Kosovo (UNR) 9.2 1.5 6.9 ... ... Lithuania 9.6 1.6 17.4 0.3 0.0 Malta ... ... ... ... ... Netherlands 24.0 2.3 20.4 ... ... Norway ... ... ... ... ... Poland 4.9 1.2 15.5 0.2 66.7 Portugal 10.3 3.8 ... ... ... Russia ... ... ... ... ... Serbia 5.9 5.8 15.2 2.5 ... Slovakia 8.2 5.2 28.9 0.9 100.0 Slovenia 19.8 2.0 12.1 5.2 14.3 Spain 11.8 8.4 5.6 39.5 31.5 Sweden 15.6 1.4 14.7 ... ... Switzerland ... ... ... ... ... Turkey ... ... ... ... ... Ukraine ... ... ... ... ... UK: England & Wales ... ... ... ... ... UK: Northern Ireland ... ... ... ... ... UK: Scotland ... ... ... ... ... Mean 14.2 4.6 15.4 15.4 38.9 Median 9.6 2.7 15.5 11.7 28.1 Minimum 3.0 0.0 2.3 0.2 0.0 Maximum 40.4 29.8 28.9 45.2 100.0

86
Table 1.2.3.11 Percentage of females, minors, and aliens from EU countries among
offenders in 2010 – Sexual assault: Rape
Total offenders
per 100 000 pop.
of which % of Females
of which % of Minors
of which % of Aliens
% of EU citizens
amongst aliens
Albania ... ... ... ... ... Armenia ... ... ... ... ... Austria 13.2 2.3 12.7 30.7 23.2 Belgium 9.7 2.4 18.3 21.1 37.8 Bulgaria 1.9 1.4 9.9 1.4 ... Croatia 3.3 3.4 19.9 4.1 50.0 Cyprus 4.0 ... ... 15.2 ... Czech Republic 3.6 0.5 8.8 15.4 ... Denmark ... ... ... ... ... Estonia ... ... ... ... ... Finland 10.7 0.3 6.4 45.3 9.2 France 11.4 1.6 24.1 12.4 ... Georgia ... ... ... ... ... Germany 7.2 0.8 9.6 27.3 ... Greece 1.8 1.5 7.5 44.2 ... Hungary 1.2 5.0 13.2 3.3 75.0 Iceland ... ... ... ... ... Ireland ... ... ... ... ... Italy ... ... ... ... ... Kosovo (UNR) 1.3 3.6 ... ... ... Lithuania 8.4 1.4 18.3 0.4 0.0 Malta ... ... ... ... ... Netherlands 6.1 1.5 17.2 ... ... Norway ... ... ... ... ... Poland 2.5 1.4 9.6 0.3 66.7 Portugal 1.9 2.5 ... ... ... Russia ... ... ... ... ... Serbia 1.2 0.0 17.0 2.3 ... Slovakia 1.6 0.0 4.7 1.2 100.0 Slovenia 2.9 0.0 5.0 5.0 33.3 Spain 1.8 1.3 6.1 51.5 26.4 Sweden 12.0 0.5 13.0 ... ... Switzerland ... ... ... ... ... Turkey ... ... ... ... ... Ukraine 1.1 1.0 8.7 3.5 ... UK: England & Wales ... ... ... ... ... UK: Northern Ireland ... ... ... ... ... UK: Scotland ... ... ... ... ... Mean 4.9 1.5 12.1 15.8 42.2 Median 3.1 1.4 9.9 8.7 35.6 Minimum 1.1 0.0 4.7 0.3 0.0 Maximum 13.2 5.0 24.1 51.5 100.0

87
Table 1.2.3.12 Percentage of females, minors, and aliens from EU countries among
offenders in 2010 – Sexual abuse of a child
Total offenders per 100 000 pop.
of which % of Females
of which % of Minors
of which % of Aliens
% of EU citizens
amongst aliens
Albania ... ... ... ... ... Armenia ... ... ... ... ... Austria 7.8 5.1 22.2 13.3 27.6 Belgium 13.0 3.1 24.4 13.5 43.5 Bulgaria ... ... ... ... ... Croatia 3.9 1.2 19.2 4.1 0.0 Cyprus 2.1 ... ... 47.1 ... Czech Republic 5.2 5.5 33.9 2.9 ... Denmark ... ... ... ... ... Estonia ... ... ... ... ... Finland 14.7 3.8 11.3 9.4 21.6 France 8.5 3.3 34.6 7.7 ... Georgia ... ... ... ... ... Germany 9.8 4.3 25.8 11.7 ... Greece ... ... ... ... ... Hungary 0.9 5.8 14.0 3.5 100.0 Iceland ... ... ... ... ... Ireland ... ... ... ... ... Italy 1.0 5.2 5.4 23.3 ... Kosovo (UNR) 2.9 ... ... ... ... Lithuania 0.9 0.0 12.9 0.0 ... Malta ... ... ... ... ... Netherlands ... ... ... ... ... Norway ... ... ... ... ... Poland 2.4 1.0 21.6 ... ... Portugal 3.0 2.2 ... ... ... Russia ... ... ... ... ... Serbia 1.1 2.6 25.6 1.3 ... Slovakia 5.7 7.1 34.8 1.0 100.0 Slovenia 11.9 3.3 16.9 4.5 9.1 Spain ... ... ... ... ... Sweden 2.6 4.6 26.7 ... ... Switzerland ... ... ... ... ... Turkey ... ... ... ... ... Ukraine ... ... ... ... ... UK: England & Wales ... ... ... ... ... UK: Northern Ireland ... ... ... ... ... UK: Scotland ... ... ... ... ... Mean 5.4 3.6 21.9 10.2 43.1 Median 3.5 3.5 22.2 6.1 27.6 Minimum 0.9 0.0 5.4 0.0 0.0 Maximum 14.7 7.1 34.8 47.1 100.0

88
Table 1.2.3.13 Percentage of females, minors, and aliens from EU countries among
offenders in 2010 – Robbery
Total offenders per 100 000
pop.
of which % of Females
of which % of Minors
of which % of Aliens
% of EU citizens
amongst aliens
Albania 6 0.0 0.0 0.0 ... Armenia ... ... ... ... ... Austria 29 10.6 38.1 44.1 35.1 Belgium 81 8.3 30.9 33.9 35.0 Bulgaria 20 4.6 19.6 0.8 ... Croatia 20 5.0 13.1 4.9 2.3 Cyprus 12 ... ... 57.8 ... Czech Republic 21 7.5 20.4 8.4 ... Denmark ... ... ... ... ... Estonia ... ... ... ... ... Finland 25 12.3 18.8 13.4 38.8 France 37 8.6 44.9 14.7 ... Georgia ... ... ... ... ... Germany 40 9.1 31.3 29.3 ... Greece 12 4.3 7.0 47.6 ... Hungary 18 10.2 30.6 2.6 89.6 Iceland ... ... ... ... ... Ireland ... ... ... ... ... Italy 30 7.1 9.2 35.3 ... Kosovo (UNR) 11 1.6 5.2 ... ... Lithuania 48 3.1 28.8 0.2 0.0 Malta ... ... ... ... ... Netherlands 50 8.5 29.7 ... ... Norway ... ... ... ... ... Poland 29 5.4 21.0 0.4 46.5 Portugal 123 5.4 ... ... ... Russia ... ... ... ... ... Serbia 116 5.8 23.3 2.3 ... Slovakia 17 5.6 23.0 1.5 69.2 Slovenia 17 3.2 23.0 10.8 37.8 Spain 36 10.6 20.0 37.8 22.1 Sweden 19 7.0 31.2 ... ... Switzerland ... ... ... ... ... Turkey ... ... ... ... ... Ukraine 29 5.3 11.2 1.4 ... UK: England & Wales ... ... ... ... ... UK: Northern Ireland ... ... ... ... ... UK: Scotland ... ... ... ... ... Mean 35 6.5 21.8 17.4 37.6 Median 27 5.8 22.0 9.6 36.4 Minimum 6 0.0 0.0 0.0 0.0 Maximum 123 12.3 44.9 57.8 89.6

89
Table 1.2.3.14 Percentage of females, minors, and aliens from EU countries among
offenders in 2010 – Theft: Total
Total offenders per 100 000
pop.
of which % of Females
of which % of Minors
of which % of Aliens
% of EU citizens
amongst aliens
Albania 94 1.1 18.3 0.2 ... Armenia ... ... ... ... ... Austria 602 26.2 23.5 45.2 53.7 Belgium 608 20.2 23.5 34.7 45.0 Bulgaria 334 11.5 15.2 0.4 ... Croatia 385 5.7 24.0 5.1 11.9 Cyprus 223 ... ... 44.4 ... Czech Republic 263 12.0 9.5 5.0 ... Denmark ... ... ... ... ... Estonia ... ... ... ... ... Finland 1283 26.2 17.3 14.3 60.6 France 349 21.0 31.1 17.3 ... Georgia ... ... ... ... ... Germany 632 31.1 28.1 22.7 ... Greece 99 14.6 9.2 43.9 ... Hungary 303 18.1 15.9 1.8 77.8 Iceland ... ... ... ... ... Ireland ... ... ... ... ... Italy 138 21.6 10.3 44.8 ... Kosovo (UNR) 158 5.3 13.5 ... ... Lithuania 246 10.1 18.4 0.5 55.0 Malta ... ... ... ... ... Netherlands 653 23.4 23.5 ... ... Norway ... ... ... ... ... Poland 197 10.1 19.8 0.3 35.7 Portugal 214 20.2 ... ... ... Russia ... ... ... ... ... Serbia 83 11.1 16.2 2.0 ... Slovakia 274 14.9 16.6 1.3 86.9 Slovenia 484 16.6 13.9 9.5 48.6 Spain 89 6.6 11.4 29.0 52.0 Sweden 349 32.3 18.5 ... ... Switzerland ... ... ... ... ... Turkey ... ... ... ... ... Ukraine 177 11.6 11.4 0.9 ... UK: England & Wales ... ... ... ... ... UK: Northern Ireland ... ... ... ... ... UK: Scotland ... ... ... ... ... Mean 343 16.2 17.7 16.2 52.7 Median 268 14.9 17.0 7.3 52.9 Minimum 83 1.1 9.2 0.2 11.9 Maximum 1283 32.3 31.1 45.2 86.9

90
Table 1.2.3.15 Percentage of females, minors, and aliens from EU countries among
offenders in 2010 – Theft: Theft of a motor vehicle
Total offenders per 100 000
pop.
of which % of Females
of which % of Minors
of which % of Aliens
% of EU citizens
amongst aliens
Albania 5 0.6 21.2 0.6 ... Armenia ... ... ... ... ... Austria 10 3.9 33.1 53.6 72.9 Belgium 30 5.2 21.5 31.8 57.3 Bulgaria 8 2.6 22.5 0.5 ... Croatia 21 0.8 46.4 7.0 ... Cyprus ... ... ... ... ... Czech Republic 17 5.1 16.3 3.8 ... Denmark ... ... ... ... ... Estonia ... ... ... ... ... Finland 95 8.6 15.5 3.2 66.3 France 29 3.5 42.0 5.9 ... Georgia ... ... ... ... ... Germany 25 5.2 35.2 21.7 ... Greece 8 2.6 21.6 28.8 ... Hungary 14 3.3 19.0 2.4 65.7 Iceland ... ... ... ... ... Ireland ... ... ... ... ... Italy 8 3.1 16.5 32.2 ... Kosovo (UNR) 3 ... ... ... ... Lithuania 24 2.2 37.3 0.0 ... Malta ... ... ... ... ... Netherlands 18 5.4 12.9 ... ... Norway ... ... ... ... ... Poland 8 1.9 15.8 0.2 85.7 Portugal 18 7.9 ... ... ... Russia ... ... ... ... ... Serbia 1 0.0 17.5 3.2 ... Slovakia 16 6.3 17.1 0.7 100.0 Slovenia 6 1.7 15.7 14.9 38.9 Spain 13 5.3 16.2 28.6 44.9 Sweden 26 7.6 25.4 ... ... Switzerland ... ... ... ... ... Turkey ... ... ... ... ... Ukraine 6 1.4 13.4 1.0 ... UK: England & Wales ... ... ... ... ... UK: Northern Ireland ... ... ... ... ... UK: Scotland ... ... ... ... ... Mean 18 3.8 23.0 12.6 66.5 Median 14 3.4 19.0 3.8 66.0 Minimum 1 0.0 12.9 0.0 38.9 Maximum 95 8.6 46.4 53.6 100.0

91
Table 1.2.3.16 Percentage of females, minors, and aliens from EU countries among
offenders in 2010 – (Theft) Burglary: Total
Total offenders
per 100 000 pop.
of which % of Females
of which % of Minors
of which % of Aliens
% of EU citizens
amongst aliens
Albania ... ... ... ... ... Armenia ... ... ... ... ... Austria 157 6.5 28.9 50.9 48.3 Belgium 111 8.7 22.5 34.4 44.0 Bulgaria ... ... ... ... ... Croatia 123 3.2 24.3 6.4 ... Cyprus 158 ... ... 42.2 ... Czech Republic 87 4.9 13.5 4.6 ... Denmark ... ... ... ... ... Estonia ... ... ... ... ... Finland 166 10.1 16.1 ... ... France 67 6.5 31.8 14.1 ... Georgia ... ... ... ... ... Germany 81 11.0 22.2 26.4 ... Greece 47 10.2 8.0 43.4 ... Hungary 49 5.3 19.1 1.0 87.2 Iceland ... ... ... ... ... Ireland ... ... ... ... ... Italy 14 23.3 10.0 44.0 ... Kosovo (UNR) 78 2.3 13.8 ... ... Lithuania ... ... ... ... ... Malta ... ... ... ... ... Netherlands ... ... ... ... ... Norway ... ... ... ... ... Poland 63 3.0 22.8 0.2 42.9 Portugal 70 13.3 ... ... ... Russia ... ... ... ... ... Serbia 6 7.8 13.1 2.9 ... Slovakia 80 4.6 24.6 1.0 90.9 Slovenia 136 5.2 14.6 10.8 47.7 Spain ... ... ... ... ... Sweden 43 8.1 18.5 ... ... Switzerland ... ... ... ... ... Turkey ... ... ... ... ... Ukraine ... ... ... ... ... UK: England & Wales ... ... ... ... ... UK: Northern Ireland ... ... ... ... ... UK: Scotland ... ... ... ... ... Mean 85 7.9 19.0 20.2 60.2 Median 79 6.5 18.8 12.5 48.0 Minimum 6 2.3 8.0 0.2 42.9 Maximum 166 23.3 31.8 50.9 90.9

92
Table 1.2.3.17 Percentage of females, minors, and aliens from EU countries among
offenders in 2010 – (Theft) Burglary: Domestic burglary
Total offenders per 100 000
pop.
of which % of Females
of which % of Minors
of which % of Aliens
% of EU citizens
amongst aliens
Albania 18 2.4 38.8 0.2 ... Armenia ... ... ... ... ... Austria 29 10.3 18.0 64.5 38.1 Belgium 57 11.6 22.3 39.5 39.2 Bulgaria ... ... ... ... ... Croatia 44 2.4 13.1 11.2 ... Cyprus ... ... ... ... ... Czech Republic 16 8.5 12.3 4.8 ... Denmark ... ... ... ... ... Estonia ... ... ... ... ... Finland 114 13.3 ... ... ... France 32 8.2 33.8 15.6 ... Georgia ... ... ... ... ... Germany 26 13.8 20.5 21.4 ... Greece ... ... ... ... ... Hungary 22 6.5 20.8 0.9 100.0 Iceland ... ... ... ... ... Ireland ... ... ... ... ... Italy ... ... ... ... ... Kosovo (UNR) ... ... ... ... ... Lithuania 55 11.8 18.3 0.9 62.5 Malta ... ... ... ... ... Netherlands 75 11.9 18.2 ... ... Norway ... ... ... ... ... Poland ... ... ... ... ... Portugal 36 17.5 ... ... ... Russia ... ... ... ... ... Serbia 1 17.4 10.9 4.3 ... Slovakia 15 8.4 23.3 1.1 100.0 Slovenia 21 4.2 15.5 13.4 33.3 Spain 21 9.4 14.1 28.6 42.0 Sweden 11 9.2 15.0 ... ... Switzerland ... ... ... ... ... Turkey ... ... ... ... ... Ukraine 19 15.9 11.1 0.8 ... UK: England & Wales ... ... ... ... ... UK: Northern Ireland ... ... ... ... ... UK: Scotland ... ... ... ... ... Mean 34 10.1 19.1 14.8 59.3 Median 24 9.8 18.1 8.0 42.0 Minimum 1 2.4 10.9 0.2 33.3 Maximum 114 17.5 38.8 64.5 100.0

93
Table 1.2.3.18 Percentage of females, minors, and aliens from EU countries among
offenders in 2010 – Fraud
Total offenders
per 100 000 pop.
of which % of Females
of which % of Minors
of which % of Aliens
% of EU citizens
amongst aliens
Albania 13 14.8 0.0 3.0 ... Armenia ... ... ... ... ... Austria 220 24.0 3.4 34.1 58.2 Belgium 68 23.3 6.6 34.2 69.9 Bulgaria 16 25.1 1.7 1.3 ... Croatia 59 17.3 0.2 3.4 53.4 Cyprus 34 ... ... 31.3 ... Czech Republic 48 23.6 0.8 7.4 ... Denmark ... ... ... ... ... Estonia ... ... ... ... ... Finland 340 24.0 3.3 6.9 45.8 France 81 29.6 5.3 13.4 ... Georgia ... ... ... ... ... Germany 349 32.9 3.8 19.7 ... Greece 5 20.5 1.7 4.2 ... Hungary 72 27.5 1.1 2.0 74.1 Iceland ... ... ... ... ... Ireland ... ... ... ... ... Italy 82 26.2 0.4 15.3 ... Kosovo (UNR) 19 8.3 0.5 ... ... Lithuania 53 22.3 4.2 0.0 ... Malta ... ... ... ... ... Netherlands 60 23.7 8.1 ... ... Norway ... ... ... ... ... Poland 97 26.8 1.1 0.2 60.3 Portugal 31 23.3 ... ... ... Russia ... ... ... ... ... Serbia 23 18.3 0.6 1.8 ... Slovakia 84 31.6 0.3 1.3 70.5 Slovenia 218 21.8 0.8 8.7 21.0 Spain 21 18.6 0.5 26.6 30.0 Sweden 85 20.5 9.0 ... ... Switzerland ... ... ... ... ... Turkey ... ... ... ... ... Ukraine 18 23.4 3.8 1.3 ... UK: England & Wales ... ... ... ... ... UK: Northern Ireland ... ... ... ... ... UK: Scotland ... ... ... ... ... Mean 87 22.9 2.6 10.8 53.7 Median 60 23.4 1.4 5.5 58.2 Minimum 5 8.3 0.0 0.0 21.0 Maximum 349 32.9 9.0 34.2 74.1

94
Table 1.2.3.19 Percentage of females, minors, and aliens from EU countries among
offenders in 2010 – Money laundering
Total offenders per 100 000
pop.
of which % of Females
of which % of Minors
of which % of Aliens
% of EU citizens
amongst aliens
Albania 1.9 21.4 0.0 0.0 ... Armenia ... ... ... ... ... Austria 7.7 26.1 0.3 60.7 27.7 Belgium 8.8 20.9 0.7 43.8 60.7 Bulgaria ... ... ... ... ... Croatia 0.6 28.0 0.0 4.0 100.0 Cyprus ... ... ... ... ... Czech Republic 0.5 22.6 0.0 ... ... Denmark ... ... ... ... ... Estonia ... ... ... ... ... Finland ... ... ... ... ... France ... ... ... ... ... Georgia ... ... ... ... ... Germany 7.5 25.3 2.7 32.8 ... Greece ... ... ... ... ... Hungary 0.0 66.7 0.0 0.0 ... Iceland ... ... ... ... ... Ireland ... ... ... ... ... Italy 5.5 14.3 1.3 28.8 ... Kosovo (UNR) ... ... ... ... ... Lithuania 0.6 5.3 0.0 0.0 ... Malta ... ... ... ... ... Netherlands 2.7 18.9 4.4 ... ... Norway ... ... ... ... ... Poland 0.6 13.5 0.0 ... ... Portugal ... ... ... ... ... Russia ... ... ... ... ... Serbia 1.7 10.7 0.8 0.8 ... Slovakia 0.7 5.0 0.0 12.5 80.0 Slovenia 5.6 14.8 0.0 15.7 11.1 Spain 0.6 23.9 0.3 33.9 38.8 Sweden 1.3 22.0 2.4 ... ... Switzerland ... ... ... ... ... Turkey ... ... ... ... ... Ukraine 0.4 21.3 0.0 0.6 ... UK: England & Wales ... ... ... ... ... UK: Northern Ireland ... ... ... ... ... UK: Scotland ... ... ... ... ... Mean 2.7 21.2 0.8 18.0 53.0 Median 1.3 21.3 0.0 12.5 49.7 Minimum 0.0 5.0 0.0 0.0 11.1 Maximum 8.8 66.7 4.4 60.7 100.0

95
Table 1.2.3.20 Percentage of females, minors, and aliens from EU countries among
offenders in 2010 – Corruption
Total offenders per 100 000
pop.
of which % of Females
of which % of Minors
of which % of Aliens
% of EU citizens
amongst aliens
Albania 5.2 7.6 ... 0.6 ... Armenia ... ... ... ... ... Austria 4.5 17.5 0.0 2.4 33.3 Belgium 0.7 14.1 0.0 11.5 33.3 Bulgaria 1.5 7.0 0.0 5.2 ... Croatia 6.1 1.8 0.0 11.8 84.4 Cyprus 6.0 ... ... 44.9 ... Czech Republic 1.1 7.0 0.0 ... ... Denmark ... ... ... ... ... Estonia ... ... ... ... ... Finland ... ... ... ... ... France ... ... ... ... ... Georgia ... ... ... ... ... Germany 1.7 15.2 0.1 14.4 ... Greece 1.4 17.4 0.0 16.1 ... Hungary 2.6 16.6 0.0 4.2 45.5 Iceland ... ... ... ... ... Ireland ... ... ... ... ... Italy ... ... ... ... ... Kosovo (UNR) 4.2 10.9 ... ... ... Lithuania 13.4 14.1 0.0 3.1 28.6 Malta ... ... ... ... ... Netherlands ... ... ... ... ... Norway ... ... ... ... ... Poland 7.8 16.0 0.1 2.6 33.3 Portugal 0.1 ... ... ... ... Russia ... ... ... ... ... Serbia 3.0 19.8 0.0 5.9 ... Slovakia 2.3 17.1 0.8 7.3 44.4 Slovenia 3.4 11.6 0.0 5.8 50.0 Spain 0.6 12.2 ... 7.1 23.8 Sweden 0.9 15.5 0.0 ... ... Switzerland ... ... ... ... ... Turkey ... ... ... ... ... Ukraine 3.7 21.3 0.0 0.0 ... UK: England & Wales ... ... ... ... ... UK: Northern Ireland ... ... ... ... ... UK: Scotland ... ... ... ... ... Mean 3.5 13.5 0.1 8.9 41.9 Median 2.8 14.6 0.0 5.8 33.3 Minimum 0.1 1.8 0.0 0.0 23.8 Maximum 13.4 21.3 0.8 44.9 84.4

96
Table 1.2.3.21 Percentage of females, minors, and aliens from EU countries among
offenders in 2010 – Drug offences: Total
Total offenders per 100 000
pop.
of which % of Females
of which % of Minors
of which % of Aliens
% of EU citizens
amongst aliens
Albania 27 0.0 6.6 1.1 ... Armenia ... ... ... ... ... Austria 276 15.1 4.5 24.7 ... Belgium 416 9.9 11.0 22.1 59.4 Bulgaria 39 8.1 8.3 2.2 ... Croatia 164 8.8 4.6 20.4 71.2 Cyprus 100 ... ... 27.3 ... Czech Republic 23 15.1 6.4 12.8 ... Denmark ... ... ... ... ... Estonia ... ... ... ... ... Finland 381 15.1 5.2 7.0 40.5 France 281 7.9 13.1 7.6 ... Georgia ... ... ... ... ... Germany 234 11.7 9.2 20.3 ... Greece 100 7.2 3.1 21.3 ... Hungary 52 9.3 11.7 2.8 50.3 Iceland ... ... ... ... ... Ireland ... ... ... ... ... Italy 202 8.7 3.8 35.1 ... Kosovo (UNR) ... ... ... ... ... Lithuania 54 12.4 5.0 1.0 38.9 Malta ... ... ... ... ... Netherlands 142 13.5 4.5 ... ... Norway ... ... ... ... ... Poland 70 5.8 15.3 0.4 45.9 Portugal 63 9.0 ... ... ... Russia ... ... ... ... ... Serbia 78 6.7 5.7 4.8 ... Slovakia 35 7.8 4.0 3.4 49.2 Slovenia 109 9.5 5.0 3.3 26.0 Spain ... ... ... ... ... Sweden 296 13.5 9.7 ... ... Switzerland ... ... ... ... ... Turkey ... ... ... ... ... Ukraine 82 14.3 1.8 0.9 ... UK: England & Wales ... ... ... ... ... UK: Northern Ireland ... ... ... ... ... UK: Scotland ... ... ... ... ... Mean 147 10.0 6.9 11.5 47.7 Median 100 9.3 5.4 7.0 47.6 Minimum 23 0.0 1.8 0.4 26.0 Maximum 416 15.1 15.3 35.1 71.2

97
Table 1.2.3.22 Percentage of females, minors, and aliens from EU countries among
offenders in 2010 – Drug offences: Drug trafficking
Total
offenders per 100 000 pop.
of which % of Females
of which % of Minors
of which % of Aliens
% of EU citizens
amongst aliens
Albania 27 0.0 6.6 1.1 ... Armenia ... ... ... ... ... Austria ... ... ... ... ... Belgium 128 10.1 7.0 29.9 60.3 Bulgaria ... ... ... ... ... Croatia 46 5.3 2.7 2.7 7.4 Cyprus ... ... ... ... ... Czech Republic 19 16.1 7.0 ... ... Denmark ... ... ... ... ... Estonia ... ... ... ... ... Finland 22 11.6 1.2 32.0 44.1 France 20 11.0 8.0 18.0 ... Georgia ... ... ... ... ... Germany 73 11.0 0.7 27.3 ... Greece ... ... ... ... ... Hungary 6 9.8 7.7 5.4 48.4 Iceland ... ... ... ... ... Ireland ... ... ... ... ... Italy ... ... ... ... ... Kosovo (UNR) 22 ... ... ... ... Lithuania 16 17.6 5.3 0.9 20.0 Malta ... ... ... ... ... Netherlands ... ... ... ... ... Norway ... ... ... ... ... Poland 5 8.3 16.1 ... ... Portugal 46 9.8 ... ... ... Russia ... ... ... ... ... Serbia 31 5.5 4.2 2.8 ... Slovakia 12 9.3 2.7 6.8 35.6 Slovenia 99 9.7 4.1 3.5 26.4 Spain 43 15.5 1.8 39.4 18.2 Sweden 44 11.2 6.6 ... ... Switzerland ... ... ... ... ... Turkey ... ... ... ... ... Ukraine 17 13.0 2.0 1.0 ... UK: England & Wales ... ... ... ... ... UK: Northern Ireland ... ... ... ... ... UK: Scotland ... ... ... ... ... Mean 38 10.3 5.2 13.1 32.5 Median 24 10.1 4.7 5.4 31.0 Minimum 5 0.0 0.7 0.9 7.4 Maximum 128 17.6 16.1 39.4 60.3

98
Notes on Tables 1.2.3.1-1.3.2.22
Croatia: Police has no data on foreign nationals reported for criminal offences if they are citizens of the following EU Member States: Luxembourg, Ireland, Portugal, Spain, Cyprus, Estonia, Latvia, Lithuania, and Malta. Cyprus: Year of reference is 2009. Denmark: Aliens include those without permanent residence in Denmark. Iceland: Year of reference is 2007. Sweden: Year of reference is 2011. Turkey: Statistics for minors are collected differently from statistics for adults. Hence they are not comparable and should not be combined.

99
1.2.4 Police staff
Table 1.2.4.1 Police staff: Number of police officers per 100 000 population
2007 2008 2009 2010 2011 % change
2007-2011 Albania 299 293 280 295 318 6 Armenia ... ... ... ... ... ... Austria 317 318 313 316 318 0 Belgium 348 347 344 345 340 -2 Bulgaria 315 313 300 290 291 -7 Croatia 461 447 456 471 479 4 Cyprus 660 669 672 650 632 -4 Czech Republic 429 412 416 397 372 -13 Denmark 199 196 195 197 196 -1 Estonia 242 351 343 340 335 38 Finland 154 151 152 151 150 -3 France ... ... ... ... ... ... Georgia ... ... 981 969 940 ... Germany 317 316 318 319 321 1 Greece 484 483 500 473 488 1 Hungary 270 325 326 327 323 19 Iceland 222 205 215 207 203 -8 Ireland 319 327 327 322 304 -5 Italy 564 555 548 537 535 -5 Kosovo (UNR) ... ... ... ... ... ... Lithuania 334 332 329 329 352 5 Luxembourg ... ... ... ... ... ... Malta 474 459 447 463 462 -2 Netherlands 216 216 221 225 230 6 Norway ... ... ... ... ... ... Poland 258 264 259 256 253 -2 Portugal 450 451 456 443 443 -2 Russia 675 ... ... ... ... ... Serbia 431 436 444 458 467 8 Slovakia 417 416 449 443 438 5 Slovenia 395 387 386 380 376 -5 Spain 483 495 506 525 536 11 Sweden 196 200 207 217 217 11 Switzerland ... ... ... ... ... ... Turkey 267 281 293 301 316 18 Ukraine 697 701 705 708 711 2 UK: England & Wales 262 261 262 260 248 -6 UK: Northern Ireland 509 494 471 454 435 -14 UK: Scotland 316 314 328 333 329 4 Mean 374 368 389 388 386 Median 326 332 336 337 337 Minimum 154 151 152 151 150 Maximum 697 701 981 969 940

100
Table 1.2.4.2 Police staff: Number of civilians per 100 000 population
2007 2008 2009 2010 2011 % change
2007-2011 Albania 9 9 21 27 32 255 Armenia ... ... ... ... ... ... Austria 43 43 42 40 38 -11 Azerbaijan ... ... ... ... ... ... Belgium 86 88 89 89 89 4 Bulgaria 17 17 16 16 14 -17 Croatia 122 129 130 125 123 0 Cyprus ... ... ... ... 3 ... Czech Republic 111 106 101 98 88 -21 Denmark 79 77 82 81 83 5 Estonia 89 145 131 124 129 45 Finland 51 50 49 49 47 -7 France ... ... ... ... ... ... Georgia ... ... ... ... ... ... Germany 60 58 58 58 57 -5 Greece ... ... ... ... ... ... Hungary 81 90 93 96 105 30 Iceland ... ... ... ... ... ... Ireland ... ... ... ... ... ... Italy ... ... ... ... ... ... Kosovo (UNR) ... ... ... ... ... ... Lithuania 87 85 87 84 88 1 Malta ... ... ... ... ... ... Netherlands 102 103 102 99 96 -6 Norway ... ... ... ... ... ... Poland 61 66 65 67 65 6 Portugal 33 35 35 34 32 -2 Russia 113 ... ... ... ... ... Serbia 156 156 156 159 167 7 Slovakia ... ... ... ... ... ... Slovenia 76 76 74 59 57 -24 Spain 13 14 13 13 13 0 Sweden 87 85 84 83 85 -3 Switzerland ... ... ... ... ... ... Turkey 24 16 16 16 18 -27 Ukraine ... ... ... ... ... ... UK: England & Wales 139 141 145 144 132 -5 UK: Northern Ireland 158 149 144 139 138 -12 UK: Scotland 143 146 149 151 142 -1 Mean 81 82 82 80 77 Median 83 85 84 83 84 Minimum 9 9 13 13 3 Maximum 158 156 156 159 167

101
Notes on Tables 1.2.4.1-1.2.4.2
Albania: There were recent changes in the structure of the Police which transformed some positions from police to civilians. Bulgaria: The number of police officers includes civil servants with police status. Denmark: The figures differ from those in the fourth edition, probably because they now include part-time employed. Estonia: Due to changes in the structure, 2009 is not comparable with later years. France: In France the Gendarmerie is a military force acting as a police force for less serious offences mainly in rural areas. The Gendarmerie is also involved in some specific matters. Hungary: From 2008 the Border Guard organization and tasks were integrated into the National Police structure. The statistics also contain the staff of the newly established policing branch, the Counter Terrorism Centre (TEK – founded in 2010) and the National Protective Service (NVSZ – founded in 2011). Netherlands: Only full-time equivalents included. Russia: Statistics on the number of police officers ares not available from open sources. Figures provided above are estimates. Ukraine: Internal troops of the Ministry of Internal Affairs are included as well. UK: England & Wales: Traffic wardens were counted separately from civilian staff. Domestic staff (including cleaners and caterers), if they are contracted out, would be counted separately as contract staff.

102
1.3 Technical Information Table 1.3.1 Data recording methods relating to Tables 1.2.1.1 - 1.2.1.6 and
1.2.1.8 – 1.2.1.23 (Offences)
Are there written rules regulating the way in which data is recorded?
When is the data collected for the statistics?
What is the counting unit used in this table?
Is a principal offence rule applied?
How are multiple offences counted?
How is an offence committed by more than one person counted?
Have the data recording methods described above been substantially modified between 2007 and 2011?
1: Yes 2: No
1: When offence is reported to the police 2: Subseq. 3: After In-vestigation
1: Offence 2: Case 3: Decision 4: Other
1: Yes 2: No
1: As one offence 2: As two or more offences 3: Uncertain
1: As one offence 2: As two or more offences
1: Yes 2: No
Albania 1 2 1 ... 1 1 1 Armenia 1 1 1 2 1 1 1 Austria 1 3 1 2 2 1 1 Belgium 1 2 1 2 2 1 2 Bosnia-Herzegovina ... ... ... ... ... ... ... Bulgaria 2 2 1 2 2 1 1 Croatia 1 3 1 2 1 1 2 Cyprus 1 1 2 1 2 1 2 Czech Republic 1 1 1 1 1 2 2 Denmark 2 1 1 2 2 1 2 Estonia 1 1 1 2 ... 1 2 Finland 1 1 1 2 2 1 2 France 1 3 3 1 2 1 2 Georgia ... 2 1 ... 2 1 2 Germany 1 3 1 1 ... 1 2 Greece 1 1 1 1 2 2 2 Hungary 1 3 1 2 1 1 2 Iceland 1 1 1 2 2 1 2 Ireland 1 1 1 1 1 2 2 Italy 2 3 1 2 2 1 2 Kosovo (UNR) 1 1 1 1 2 1 2 Lithuania 1 2 1 1 2 1 2 Malta ... ... ... ... ... ... ... Netherlands 1 2 1 1 1 1 ... Norway ... 1 1 ... ... ... 1 Poland 1 3 1 1 1 1 ... Portugal 1 2 3 1 1 1 2 Russia 1 2 1 2 2 1 ... Serbia 1 1 1 2 2 1 2 Slovakia 1 2 1 2 1 1 2 Slovenia 1 3 1 1 1 1 2 Spain 1 1 1 2 1 1 2 Sweden 1 1 1 2 2 ... 2 Switzerland 1 1 1 2 2 2 2 Turkey ... ... 1 2 2 1 ... Ukraine 1 2 1 1 1 1 ... UK: England & Wales 1 1 1 1 ... 1 2 UK: Northern Ireland 1 1 1 1 ... 1 2 UK: Scotland 1 1 1 1 2 1 2

103
Are there written rules regulating the way in which data is recorded?
Altogether 31 countries replied that they have written rules regulating the way in which offences are recorded and three countries did not have such rules. However, it is most likely that those countries have instructions to guide the reporting of offences.
When are the data collected for the statistics?
Altogether 18 countries recorded the statistics when the offence was reported to the police, 10 countries recorded it later but before a completed investigation. Eight countries record the offences after an investigation is completed.
Estonia: Statistics are based on started criminal investigations, not on completed investigations.
Lithuania: In the final number of criminal acts, cases which during the further investigations appear not to be criminal acts (due to obvious reasons or due to procedural interferences) are deleted from all previously registered criminal acts.
What is the counting unit used in this table?
35 countries applied the offence as a counting unit. Only one country used the case and two countries used the decision as a counting unit.
France: Counting rules for crimes recorded depend on the offence.
Is a principal offence rule applied?
16 countries applied a principal offence rule and 18 did not.
Lithuania: The rules depend on the type and characteristic of the offence. For example, simultaneously committed offences are counted as one but there are exceptions for instance in cases where the offences are aggravated. Additionally, continuance of the offence and legal precedents provide guidelines for applying the principal rule.
Poland: Depends on if the offence is committed relating to the same case or not. Continuous offences are counted as one offence.
UK: Scotland: Counting rules for crimes recorded by the police vary with the type of offence.
How are multiple offences counted?
13 countries counted multiple offences as one offence, whereas 19 countries recorded them as two or more.
Germany: Multiple offences against the same victim or without a victim are counted as one offence, multiple offences against different victims are counted as two or more offences.
How is an offence that is committed by more than one person counted?
31 countries replied that they record it as one offence and three countries reported that they count such an offence as two or more offences.
Sweden: There are different rules depending on the type of offence. For example, homicides are counted as one offence even if there are several offenders.
Have the data recording methods described above been substantially modified between 2007 and 2011?
Seven countries reported changes in data recording methods. 28 countries reported that methods of data recording were not substantially modified between the years of 2007 and 2011.
Albania: During the years 2010-2011 there were changes in categories (e.g., property and theft) under which offences were recorded.

104
Armenia: Changes in the recording of drug offences due to the decriminalisation of drug consumption.
Netherlands: Statistics Netherlands improved the collection of data from the Police which resulted in new series of police figures from 2005. The figures in this edition are consisted with the new figures. In 2008-2010 a new registration system was introduced by the Dutch Police which caused some changes in the series between the years 2008-2010.
Portugal: From 2010 the method for collecting data on crimes recorded by the National Uniformed Police in urban areas was changed. The new system follows the rules of registration used before as well. However, there are possible data fluctuations in some cases such as the recorded number of suspected offenders.
Switzerland: The police statistics were revised from 2009.
Turkey: The way police statistics have been collected changed in 2009.
Age brackets used in Tables 1.2.3.1 to 1.2.3.22
Almost all countries count minors as persons who are not yet 18 years old. In Austria, Poland and Switzerland the maximum age for a minor was reported to be 17 years and in Cyprus 16 years.
The lower age limit for treating a person as a minor varies among different countries, at least in recording police statistics. Persons below the age of criminal responsibility will not be convicted and therefore are not counted in conviction statistics (for details refer to Chapter 3). However, persons below the age of criminal responsibility are possibly included in police statistics (minimum age = 0 in the following table), suggesting that all persons below 18 would be counted in the police statistics. All countries in the following table include offences committed by minors in the police statistics.
Notes on Table 1.3.3
Cyprus: As of 1999, the age limit for minors was from 10 to 15 years (inclusive). Czech Republic: minimum age 0, in practice about 6 years and above. France: No legal minimum age. In practice, about 7 years is considered as a minimum for proceedings but for the police statistics there is no minimum age. Germany: No legal minimum age. Theoretically all suspects under the age of 18 are counted. However, offences committed by small children are not likely to be recorded in practice. The age of criminal responsibility is 14. Lithuania: The general age of criminal responsibility is 16 years. Serbia: Criminal reports cannot be submitted against minors below 16 years of age. Spain: Young people over 14 years and less than 18 are seen as criminally responsible. Youth under 14 years are not criminally responsible

105
Table 1.3.3 Minimum age for inclusion in Tables 1.2.3.1 to 1.2.3.22
Albania ... Armenia
14
Austria
1
Azerbaijan
...
Belgium
...
Bosnia-Herzegovina
...
Bulgaria
14
Croatia
14
Cyprus
10
Czech Republic
0
Denmark
...
Estonia
14
Finland
0
France
...
Georgia
...
Germany
0
Greece
8
Hungary
14
Iceland
...
Ireland
...
Italy
0
Kosovo (UNR)
...
Latvia
...
Lithuania
14
Luxembourg
...
Malta
...
Moldova
...
Montenegro
...
Netherlands
0
Norway
...
Poland
13
Portugal
...
Romania
...
Russia
14
Serbia
16
Slovakia
0
Slovenia
14
Spain
14
Sweden
15
Switzerland
10
TFYR of Macedonia
...
Turkey
5
Ukraine
14
UK: England & Wales
...
UK: Northern Ireland
...
UK: Scotland ...
Definition of an alien Generally speaking, aliens are persons who do not have the nationality of the country in which they commit an offence.

106
Table 1.3.4 Technical information on Table 1.2.4.1 Police staff: Police officers
1=Included 2=Excluded
Crim
inal
pol
ice
Traf
fic p
olic
e
Bord
er p
olic
e
Gen
darm
erie
Uni
form
ed p
olic
e
City
gua
rd o
r m
unic
ipal
pol
ice
Cus
tom
s of
ficer
s
Tax
polic
e
Milit
ary
polic
e
Secr
et s
ervi
ce
polic
e
Part-
time
offic
ers
Polic
e re
serv
es
Cad
et p
olic
e of
ficer
s
Cou
rt po
lice
Albania 1 1 1 2 1 2 2 2 2 2 2 2 … 2 Armenia … … … … … … … … … … … … … … Austria 1 1 1 1 1 1 2 2 2 2 2 2 2 2 Belgium 1 1 2 1 1 1 2 1 2 2 2 2 2 2 Bulgaria 1 1 1 1 1 2 2 2 2 2 2 2 2 2 Croatia 1 1 1 2 1 2 2 2 2 2 2 2 2 2 Cyprus 1 1 2 2 1 2 2 2 2 1 2 2 1 1 Czech Republic 1 1 2 2 1 2 2 2 2 2 2 2 1 2 Denmark 1 1 1 2 1 2 … 2 2 1 1 … … … Estonia 1 1 1 … 1 2 2 … 2 2 2 2 1 … Finland 1 1 2 2 1 2 2 2 2 1 2 2 1 2 France 1 1 1 1 1 2 2 2 1 2 1 2 2 2 Georgia 1 1 1 … 1 1 2 2 1 1 2 2 1 2 Germany 1 1 1 … 1 1 2 2 2 2 1 2 1 2 Greece 1 1 1 1 1 2 2 2 2 2 2 2 2 2 Hungary 1 1 1 2 1 2 2 2 2 2 2 2 2 2 Iceland 1 1 1 1 1 1 2 2 … … 2 … … 1 Ireland … … … … … … … … … … … … … … Italy 1 1 1 1 1 2 2 2 2 2 2 2 2 1 Kosovo (UNR) 1 1 1 2 1 2 1 1 1 1 1 1 1 1 Lithuania 1 1 2 2 1 2 2 2 2 2 2 2 2 2 Malta … … … … … … … … … … … … … … Netherlands 1 1 1 … 1 1 2 2 2 2 1 2 2 2 Norway … … … … … … … … … … … … … … Poland 1 1 2 2 1 2 2 2 2 2 2 2 2 2 Portugal 1 1 1 1 1 1 2 2 2 2 2 2 1 2 Russia 1 1 2 2 1 1 2 2 2 2 2 2 2 2 Serbia 1 1 1 1 1 2 2 2 2 2 2 2 2 2 Slovakia 1 1 1 1 1 1 2 2 2 2 2 2 2 2 Slovenia 1 1 1 2 1 2 2 2 2 2 2 2 2 2 Spain 1 1 1 1 1 2 2 2 2 2 2 2 1 2 Sweden 1 1 1 1 1 2 2 1 2 2 1 2 2 2 Switzerland 1 1 2 1 1 1 2 2 2 2 … … 2 … Turkey 1 1 1 2 1 1 2 2 2 2 2 2 2 2 Ukraine 1 1 … … … 1 2 2 2 1 … … 1 1 UK: England & Wales 1 1 2 1 1 2 2 1 2 2 1 1 2 1 UK: Northern Ireland 1 1 2 2 1 2 2 2 2 2 1 1 2 … UK: Scotland 1 1 2 2 1 1 2 2 2 2 1 2 2 1

107
Table 1.3.5 Technical information on Table 1.2.4.2 Police staff: Civilians
1=Included 2=Excluded
Cadet police officers Clerical staff
Technical staff
Maintenance staff (cars)
Traffic wardens
Domestic staff
Albania … 1 1 1 2 1 Armenia … … … … … … Austria 1 1 1 1 2 2 Belgium 2 2 1 1 1 1 Bulgaria 2 1 1 1 2 1 Croatia 2 1 1 1 2 1 Cyprus 1 1 1 1 2 2 Czech Republic 2 1 1 1 1 1 Denmark 2 1 1 1 … … Estonia 2 1 1 1 … … Finland 2 1 1 1 2 2 France 1 1 1 1 2 1 Georgia 2 1 1 1 2 2 Germany 2 1 1 1 2 2 Greece … … … … … … Hungary 2 1 1 2 2 2 Iceland … … … … … … Ireland … … … … … … Italy … … … … … … Kosovo (UNR) 2 1 1 1 1 2 Lithuania 2 1 1 1 2 1 Malta … … … … … … Netherlands 2 1 1 1 2 2 Norway … … … … … … Poland 2 1 2 1 2 2 Portugal … … … … … … Russia 1 1 1 1 2 2 Serbia 2 1 1 1 2 1 Slovakia … … … … … … Slovenia 2 2 2 2 2 2 Spain 2 1 1 2 2 2 Sweden 2 1 1 1 2 1 Switzerland … … … … … … Turkey 1 1 1 1 2 2 Ukraine 2 2 2 1 1 2 UK: England & Wales 2 1 1 2 2 1 UK: Northern Ireland 2 1 1 1 2 2 UK: Scotland 2 1 1 1 2 2

108
1.4 Sources General sources used in Chapter 1 are:
- CTS = United Nations Survey of Crime Trends and Operations of Criminal Justice Systems database
- Eurostat = Statistics in Focus
Albania General Directory of State Police, Statistics sector [Unpublished data]. Armenia Information Centre of the Police of Armenia, Armenian Statistical Service. Austria Ministry of the Interior, Statistics of Crime Reports in Austria 2007-2011 by Criminal
Intelligence Service. Belgium National Police data base : Fedpol (PRP2) and Local Police (Morphology). Bulgaria Ministry of Interior, Coordination, Information and Analysis Directorate: Police Statistics
2007-2011. [unpublished]. Ministry of Interior, Letter to the Center for the Study of Democracy of 11 December 2012.
Croatia Ministry of the Interior - Directorate of Legal Affairs and Human Resources. Cyprus Cyprus Police, Analysis and Statistics Office: Criminal Statistics, Report for the years 2007-
2009 and unpublished data of the Statistical Service of Cyprus (CYSTAT). The figures for Money Laundering were provided by the Unit for Combatting Money Laundering of the Law Office of the Republic.
Czech Republic The Ministry of Interior, Department of Human Resources [unpublished]. The Police of the Czech Republic, Statistics of Crime, available from: www.policie.cz
Denmark Ministry of Justice - special data files bought from Statistics Denmark, Personal communication.
Estonia Kuritegevus Eestis 2011. Tallinn, 2012. www.just.ee “Theft of a motor vehicle” and “Domestic burglary” – Police and Border Guard Board [unpublished data]. Ministry of Justice [unpublished data].
Finland Statistics Finland, Internet database (StatFin). Unpublished table from Statistics Finland. Police - Annual Report 2011, available from: www.poliisi.fi
France Ministère de l’intérieur, Annual report on crime and delinquency reported to the police forces ONDRP (National Observatory of criminality and judicial answers). Ministère de l’Intérieur (Police Nationale), Ministère de la Défense (Gendarmerie).
Georgia Ministry of Internal Affairs of Georgia – www.police.ge Ministry of Justice - Main Prosecutor Office.
Germany Bundeskriminalamt (Ed.): Polizeiliche Kriminalstatistik Bundesrepublik Deutschland, 2007 - 2011, Wiesbaden 2008 - 2012. Statistisches Bundesamt (Ed.): Personal des Öffentlichen Dienstes 2007 - 2011, Fachserie 14, Reihe 6, Wiebaden 2008 - 2012.
Greece Statistical Journal of the Hellenic Police (2007-2011). Ministry of Public Order. Hungary Office of the Prosecutor General – Department for IT Unified Criminal Statistics of the
Investigation Authorities and the Public Prosecution. Based on data taken from annual Police Staff Statistics.
Iceland Statistical report of the National Commissioner of the Icelandic Police, 2012. www.logreglan.is / Annual reports of the National Commissioner of the Icelandic Police from 2007 to 2012. www.logreglan.is
Ireland Garda PULSE (Police Using Leading Systems Effectively). Garda Siochana. Italy Italian Institute of Statistics - www.dati.istat.it. / Italian Ministry of Economy and Finance
www.contoannuale.tesoro.it Kosovo (UNR) Kosovo Police Information System (KPIS). Lithuania Ministry of Internal Affairs - Department of Informatics and Communication - Section of
Statistics: Departmental Register of Crimes. Published: Department of Informatics and Communication, website: https://www.ird.lt/infusions/report_manager/report_manager.php?lang=lt&rt=1 / Ministry of Internal Affairs – Police Department – Staff Service [unpublished].
Netherlands Statistics Netherlands. Ministry of the Interior and Kingdom Relations. Norway Statistics Norway Offences reported to the police, by type of offence:
http://www.ssb.no/english/subjects/03/05/a_krim_tab_en/tab/tab-2012-06-29-04-en.html

109
Poland Police Headquarter Statistical Information Bureau – not published (by type of offences defined in European Sourcebook). Police Headquarter – HR Department.
Portugal Ministry of Justice - Directorate-General for Justice Policy. Russia Main Directorate for Road Traffic Safety of the Ministry of Internal Affairs of Russia. The
Ministry of the Interior of Russian Federation: http://archive.svoboda.org/ll/soc/1105/ll.110305-12.asp / The Ministry of the Interior of Russian Federation.
Serbia Ministry of Interior. Slovakia Ministry of Interior, Police Force of the Slovak Republic – Department of Police Information
Systems: Statistical System of Criminality, partially published at: www.minv.sk / Ministry of Interior of the Slovak Republic, partially published at: www.minv.sk
Slovenia Ministry of Interior - Police. Web page of Ministry of Interior (in Slovene language: Reports 2007-2011).
Spain El Sistema Estadístico de Criminalidad (SEC) Ministerio de Interior. Crime Statistical System. Ministry of Interior. Gabinete de Coordinación y Estudios. Secretaría de Estado de Seguridad. Ministerio del Interior. Cabinet of Coordination and Studies. Secretariat of State for Security.
Sweden National Council for Crime Prevention, Sweden, www.bra.se / The Swedish Police www.polisen.se
Turkey General Directorate for Security, Activity Report for 2008-2011 published by Directorate for Strategy Development of the General Directorate for Security. Web based database of the Turkish Statistical Institute: http://tuikapp.tuik.gov.tr/cocuksucdagitimapp/cocuksuc.zul
Ukraine Crime-rate Information of the Ministry of Interior of Ukraine on 2007-2011. Data from the OSCE Policing OnLine Information System http://polis.osce.org/countries/details.php?item_id=4#mia-staff / Law of Ukraine "On structure and the number of the Ministry of Internal Affairs of Ukraine" (2002)
UK: England & Wales
Based on Reference table A4 which accompanied 'Crime in England and Wales, year ending June 2012', with the exception of firearm offences which is taken from a separate collection of police recorded crime and excludes air weapons: http://www.homeoffice.gov.uk/publications/science-research-statistics/research-statistics/police-research/hosb0912/
UK: Northern Ireland
Statistics Branch, Police Service of Northern Ireland * Disclosive. Human Resources Department, Police Service of Northern Ireland.
UK: Scotland Based on data taken from ‘Recorded Crime in Scotland, 2011-12’ and ‘Homicide in Scotland, 2011-12’ http://www.scotland.gov.uk/Topics/Statistics/Browse/Crime- Justice/PubRecordedCrime http://www.scotland.gov.uk/Topics/Statistics/Browse/Crime-Justice/PubHomicide.

110

111
2. Prosecution Statistics
2.1 General comments 2.1.1 Background
Object of data collection
This chapter describes the outcome of procedures at the prosecutorial stage (prosecutors and examining judges) for the years 2007–2011. Taking into account the discretion at the prosecutor’s level, various forms of disposal are differentiated with a special focus on bringing a case to the court, not only for the total of cases, but – for the first time – for minors as well. For the first time, too, but restricted to 2010, data on the breakdown by offences are represented. Only 16 countries could provide such specific data.
Starting with this edition, data on community sanctions and measures at the prosecution stage have been collected but only for the year 2010. Within the present category of a conditional disposal, differentiations were made in terms of specific conditions imposed on the offender: this includes variations of community-based measures as well as fines. Only 14 countries have both this concept of and data on conditional disposals by the prosecution authority and even fewer (10) could provide data on the various forms of conditions. Community sanctions and measures may result from a court sentence (see chapter 3) or be connected with the execution of a prison sentence (see chapter 5).
The chapter also provides data on the staff of prosecuting authorities in the same years.
In addition data on the most important compulsory measures at this stage, police custody, pre-trial detention, bail and electronic monitoring are presented. Pre-trial detention is also covered in chapters 3 and 4.
15 out of 45 countries were not able to provide any data for this chapter (and will not be presented in the tables). 20 countries did not provide data on the number of cases dealt with, and provided data only on the number of prosecutors / employees of the prosecuting authority (see tables 2.2.3.1 and 2.2.3.2).
Definitions of the prosecution stage
Once an offence has been reported to the police and a suspect identified, the decision has to be taken whether or not to prosecute, i.e., to bring the case before a court.
In a narrow sense, the term prosecution refers only to proceeding with a case in a criminal court. Here, the term is used in the broader sense of processing/disposing of cases (decision-making) by the prosecuting authorities, thus including the decision to drop proceedings or to impose a sanction or measure, where this possibility is available to the prosecuting authorities.
The term prosecuting authority refers to the legal body which has as its main task to institute criminal proceedings, i.e., to decide, depending on national legislation and practice, whether or not to prosecute. The actual functions and denominators vary widely between countries. In most European countries, the prosecution of suspected offenders is dealt with by a special prosecuting authority, either a public prosecutor and/or an investigating judge.
There are many differences and many variations in the form this prosecutorial level takes within the different European countries. For the purpose of this Sourcebook, the prosecution stage is considered as an intermediate stage between the police and court levels. Accordingly, this chapter deals with the decisions taken at this intermediate stage.

112
The role of the police in relation to the prosecution stage (case input)
In some countries, the input into the prosecutorial level is identical to the output of the police level (including specialised authorities of public order, such as customs or tax authorities). This should be the case in countries (such as Germany) in which the police are regarded purely as a supporting institution to the public prosecutor, with no own powers to dispose of a criminal case. Consequently they are obliged to transfer all cases to the prosecuting authority. This applies also to cases in which no suspect has been found. Thus the prosecution input will appear disproportionally high in such systems, especially when cases without suspects are counted (e.g., in France).
However, in some European countries actual practice deviates from this model, i.e., the input at prosecutorial level is not identical to police level output because the police can exercise some discretion and decide on whether to prosecute or not. Thus certain cases are not transferred to the prosecuting authority and are ended by a police decision. The following countries said that according to their criminal justice system the police can impose sanctions by themselves: Cyprus, Czech Republic, Greece, Iceland, Netherlands, Russia, Slovakia and Scotland (see technical table 2.3.10). However, the powers of the police are always limited to minor cases, in some countries concerning only petty traffic offences.
These different structures influence the scale of the input and thus the prosecution system statistics. Furthermore, according to changes in definitions and counting rules from one level to another, these statistics at the prosecution level may show some difference with the police output.
What is recorded?
Unlike in most other chapters in the Sourcebook, this chapter only partly differentiates between the types of offences because most of the countries concerned are unable to provide separate offence data. The breakdown for the year 2010 covers all kinds of offences disposed of by prosecuting authorities.
According to the standard definition, in principle, all offences defined as criminal by the law should be included. However, there are some countries which follow a minor offence concept, either excluding them from the criminal code (for example the wykroczenia in Poland in cases of minor thefts etc.) or making them subject to special proceedings (for example most contraventions in France which are handled by the police only) outside the criminal justice system. Included are major traffic offences (e.g., drunk driving) and all other criminal offences subject to criminal proceedings. Excluded are minor traffic offences (e.g., parking offences), breaches of public order regulations and all other minor offences subject to proceedings outside the criminal justice system, even if defined as criminal by the law (i.e., misdemeanours, contraventions, wykroczenia, faltas). Less than half of the countries were able to follow this definition in all respects, but deviations usually only refer to one or two items of the above-mentioned include/exclude-categories. For details see Appendix I: Definitions.
A special problem refers to recording unknown offender cases. In some countries these are handled by the police only, which means that they are not recorded at the prosecution level. If they are part of the input into prosecution statistics there are different modes of recording. In some countries they are not counted at all, in some countries they are included in the output, i.e., the total of cases disposed of. Dependent on these different modes of recording the amount of prosecutorial disposals varies strongly (see technical table 2.3.2).
The counting unit used here should be the case in the sense of proceedings against one defendant, not the offence. Thus, one case may combine several offences. In general, these cases are counted as single cases, but there are some exceptions (see as well paragraph 23 below and technical table 2.3.7).

113
Discretion at the prosecutor’s level (output)
The data provided for the cases disposed of by the prosecuting authority (table 2.2.1.1) refer to the output at the public prosecutor’s level (tables 2.2.1.1 to 2.2.3.5), i.e., the type of decision taken. This means that pending cases are not included in the total of disposals.
The structure of prosecuting authorities varies from country to country depending on the discretionary powers available to them. We developed some simple categories for disposals in order to make figures comparable: number of cases brought before a court, number of cases ended by a sanction imposed by the prosecutor that lead to a formal verdict and that count as a conviction, number of conditional disposals, number of proceedings dropped in combination with a cautioning of the suspect, number of proceedings dropped unconditionally due to lack of public interest or for efficiency reasons, number of proceedings dropped for legal or factual reasons, number of proceedings dropped because offender remained unknown, number of other disposals. Some of these categories may not apply to every country considered.
Three basic structures are possible: - There are countries in which the prosecuting authority has neither the power to drop a
case nor to impose conditions / sanctions upon an offender; in accordance with a strict principle of legality the prosecuting authority merely has the function of preparing a case for court.
- In most of the countries dealt within this chapter the prosecuting authority has the power to decide whether or not to prosecute (i.e., to drop a case completely). In some countries the prosecuting authority has not only the power to decide whether to prosecute or not, but also the possibility of dropping the case under conditions, i.e., to bind or sanction the suspected offender (only possible if he or she agrees to the measure - otherwise the case will go to court), usually to pay an amount of money.
- There are a few countries where the prosecutor can impose penal sanctions that lead to a formal verdict and count as convictions.
The differentiation between “cases brought before a court“, “sanctions imposed by the prosecutor that lead to a formal verdict and that count as a conviction” and “conditional disposals” is not always as simple as it may appear. It is a matter of how far the court is involved in the public prosecutor’s decision-making. In some countries, the court has to approve all decisions made by the prosecutor to end a prosecution without formally taking it to court, whereas in others the public prosecutor has more powers in this regard.
Sanctions imposed by the prosecutor that lead to a formal verdict include the penal order (Strafbefehl) known in some countries, where the defendant is considered as convicted (and should be counted as such in chapter 3). Conditional disposals are usually administered in a rather informal way. The defendant agrees to pay a fine or accepts any restrictions or conditions in exchange for ending prosecution, implying that he or she will not be considered as formally convicted. Here, a breakdown by various forms of conditions is made.
According to the questionnaire, “other disposals“ (e.g., cases that were transferred to another competent domestic jurisdiction) should be included in the total of cases handled by the prosecuting authorities. This may lead to some double counting and/or to a significant difference between the total and the sum of the output disposals. Some countries provided specific information in order to solve this difficulty or to explain the difference. For more explanations on other disposals see technical table 2.3.3.
Exclusion of tables; statistical rules
No separate input statistics are published in this chapter. Only in the case of countries where output data were not available, data on the input total of proceedings or persons were used instead. See notes on table 2.2.1.1 to identify which countries are concerned. Data on the input total and on pending cases can, however, be found on the internet (http://www.europeansourcebook.org).
Most of the countries reporting data on prosecution level apply written rules on recording. The majority of countries count proceedings if more than one person is involved as one case. Most

114
countries do the same if multiple offences occurred. However, most countries record two (or more) cases if a person is subject to more than one proceedings in one year. Usually, data collected by authorities other than public prosecution are not included as well as cases disposed of by the police; see technical table 2.3.7 for more detailed information.
2.1.2 Results
Trends
Wide variations can be seen in the total of cases disposed of by the prosecution authorities, from 661 disposals per 100 000 population in Albania to 7 669 in Turkey for 2010 (see table 2.2.1.1). Similar differences can be found on the police level. According to the different workload of the national prosecution authorities, different modes of handling the cases can be seen (see table 2.1.1).
Whereas in most Western European countries the rates of all cases disposed of by prosecution authorities appear to be stable between 2007 and 2011, i.e., to show an increase or decrease in case numbers of less than 10 %, there are some European countries that show a sharp increase (between 10 and 50 %): Albania, Denmark, Estonia, Hungary, Portugal, Romania and Sweden; and one country that showed a high increase (more than 50 %): Turkey. On the contrary Bulgaria, Georgia, Netherlands, Poland and England & Wales showed a decrease of up to nearly 25 % (see table 2.2.1.1). These trends on the prosecution level are similar to those on the police level.
Total of disposals by public prosecution and cases brought before a court
Table 2.1.1 shows the rate of all cases disposed of and the percentage of cases brought before a court in 2010. Due to the unavailability of data, several countries had to be excluded. The idea behind table 2.1.1 is that there is a relationship between the two factors, namely that where a prosecution authority has to deal with a relatively low number of cases, the percentage of cases brought before a court will be high, e.g., in the Czech Republic, and that where the total of cases was high, the percentage tends to be low, e.g., in Germany. Turkey is the only country which clearly deviated from this trend where the percentage of cases brought before a court remained relatively high although the number of cases disposed of was also high.
Table 2.1.1 Percentage of cases brought before a court by rate of all cases disposed of Cases brought before a court
per 100 000 population in 2010
low: up to 25 % of total cases disposed of
middle: from 26 % to under 50 % of total cases disposed of
high: more than 50% and above of total cases disposed of
Cases disposed of per 100 000 population in 2010
low: up to 1300
Albania Georgia
Croatia Czech Republic Hungary Lithuania Netherlands Slovakia
middle: from 1300 to under 5000
Finland Romania* Slovenia*
Poland
England & Wales Iceland
high: 5000 and more
Austria Belgium* France Germany Portugal*
Turkey*
* Cases disposed of include proceedings against unknown offenders.
One indicator for attrition between the police and court level can be seen in the percentage of cases brought before a court by the public prosecutor. One might assume that this percentage depends not only on the workload of the public prosecution but differs in terms of the offences

115
concerned. The public prosecutor has broader possibilities to drop cases for minor offences because of a lack of public interest or to discontinue criminal proceedings after the defendant has voluntarily fulfilled a condition, such as community service. On the other hand, these possibilities shrink for serious offences. Table 2.1.2 demonstrates the percentage of cases brought before a court broken down by some offences: intentional homicide, as an example of the most serious offences; robbery, as an example of middle range seriousness; and theft, as an example of lower level seriousness. Since only a minority of countries could provide data on this, the results cannot be generalized, but show some evidence for the assumption made: The percentage of homicide cases brought before a court was much higher than theft cases.
Table 2.1.2 Percentage of cases brought before a court by offence groups in 2010*
Homicide Robbery Drug traff. Bodily Injury Theft 74% 68% 61% 53% 45%
* mean of 16 countries (homicide, bodily injury, theft), 15 (robbery) and 12 (drug trafficking) regarding the percentage of offences that were brought before a court; see tables 2.2.3.2, 2.2.3.4 and 2.2.3.5 Conditional disposals and community measures
A conditional disposal at the prosecution stage means that the defendant agrees to pay a fine or accepts conditions in exchange for ending prosecution. 15 countries could provide some data on conditional disposals, but only 11 could provide a breakdown by various forms of conditions. There is less data on minors, not because such concepts do not exist but because the statistics often do not count minors separately.
Table 2.1.3 Conditional disposals and community measures
Fine Restitution Victim Offender Mediation
Community Service
Supervision Therapy Other/Mixed
Austria Belgium Germany Netherlands Turkey Scotland
Belgium France Germany Netherlands Slovenia Scotland
Austria Belgium Estonia France Germany Hungary Lithuania Slovenia Turkey
Austria France Germany Netherlands Slovenia
Austria Austria France
Belgium Germany Hungary Lithuania Netherlands Slovenia Scotland
Staff of the prosecuting authorities; workload
The rates of public prosecutors per 100 000 population in European countries for the year 2010 show a wide variation from 26 in Lithuania to 3 in France (see tables 2.2.3.1 and 2.2.3.2).
In table 2.1.4 three categories of low, middle and high rates of prosecutors are established and correlated to the rate of all cases disposed of. Under the category of a relatively low rate of prosecutors per 100 000 population were mostly Western European countries, and under the opposing category of a relatively high rate of prosecutors only Central and Eastern European countries can be found. These rates did not correlate with the crime situation or with the number of police officers under the supervision of the prosecuting authorities and especially not in with the number of disposals made by public prosecution. On the contrary, in the group with a relatively low rate of total disposals one can find only Central and East European countries with relatively high rates of prosecutors; and in the group with a high rate of disposals only Western European countries (with low rates of prosecutors) can be found. Evidently the number of prosecutors depends on different factors, particularly on their competence and tasks in the different national systems of criminal justice and state administration.

116
Table 2.1.4 Rate of prosecutors by rate of all cases disposed of Prosecutors per 100 000 population in 2010
low: below 10.0
middle: from 10.0 to under 14.0
high: 14.0 and above
Cases disposed of per 100 000 population in 2010
low: below 1300
Albania Czech Republic Croatia
Hungary Lithuania Slovakia*
middle: from 1300 to under 5000
England & Wales Slovenia* Sweden
Estonia Romania*
Poland
high: 5000 and more
France Germany
* Cases disposed of include proceedings against unknown offenders.
Persons whose freedom of movement was restricted
Data on “persons whose freedom of movement was restricted” refer to decisions made before the final conviction of a suspect and while they were under criminal investigation. There are four categories: persons in police custody, persons in pre-trial detention, persons under bail and persons under electronic monitoring.
Ten countries could provide data on persons in police custody. Here the order was mostly made by the police but also by the prosecution or court. In twenty countries data were available on pre-trial detention (see tables 2.2.4.1 and 2.2.4.2).

117
2.2 Tables 2.2.1 Criminal cases handled by the prosecuting authorities 2007–2011
Table 2.2.1.1 Criminal cases handled by the prosecuting authorities per 100 000 population – Output cases: Total
2007 2008 2009 2010 2011 % change
2007-2011
Albania 521 536 571 661 718 38 Austria 7338 7200 7164 6650 6333 -14
Belgium 6712 6624 6693 6677 6533 -3 Bulgaria 2616 2328 2277 2228 2183 -17 Croatia 1175 1144 1172 1163 1185 1 Cyprus ... ... ... ... ... ... Czech Republic 1102 1325 1345 1210 ... ... Denmark 10362 10231 10834 11361 12100 17
Estonia 2672 2814 2230 2284 3239 21 Finland 4567 4539 4513 4479 4563 0 France 7714 7384 7254 6963 7311 -5 Georgia 413 344 339 336 307 -26 Germany 6041 5968 5749 5632 5644 -7 Greece ... ... ... ... ... ...
Hungary 1095 1121 1179 1272 1226 12 Iceland ... 2871 2480 1864 1951 ... Italy ... ... 5136 6115 ... ... Lithuania 970 1014 1098 1084 1166 20 Netherlands 1721 1659 1581 1273 1293 -25 Poland 2918 2477 2528 2466 2427 -17
Portugal 4686 5090 5285 5283 5371 15 Romania 2545 2671 2790 2916 3221 27 Slovakia 956 945 987 987 964 1 Slovenia 4530 4144 4357 4394 4487 -1 Sweden 2043 2332 2420 2349 2356 15 Turkey 3911 4041 7522 7669 7598 94
Ukraine ... ... ... ... ... ... UK: England & Wales 1983 1913 1818 1751 1617 -18 UK: Scotland ... ... ... ... ... ...
Mean 3417 3363 3573 3563 3643 Median 2616 2574 2480 2349 2427 Minimum 413 344 339 336 307
Maximum 10362 10231 10834 11361 12100

118
Table 2.2.1.2 Percentage brought before a court of the total output of criminal cases handled by the prosecuting authorities
2007 2008 2009 2010 2011 % change
2007-11
Albania 40 41 36 37 37 -8 Austria 13 12 12 13 13 1 Belgium 6 5 5 5 5 -7 Bulgaria 22 24 26 27 29 29
Croatia 60 57 55 54 51 -15 Cyprus ... ... ... ... ... ... Czech Republic 89 72 73 73 ... ... Denmark ... ... ... ... ... ... Estonia 27 30 32 29 22 -21 Finland 24 25 24 25 23 -2
France 9 9 9 9 ... ... Georgia 72 70 68 44 47 -35 Germany 12 12 12 12 12 -5 Greece ... ... ... ... ... ... Hungary 62 60 57 57 53 -15 Iceland ... 74 80 71 76 ...
Italy ... ... ... ... ... ... Lithuania 70 72 60 76 76 8 Netherlands 57 55 55 60 61 7 Poland 32 39 40 40 41 27 Portugal 17 14 12 13 13 -19 Romania 7 6 6 7 6 -5
Slovakia 68 71 74 72 74 8 Slovenia 17 18 16 16 15 -8 Sweden ... ... ... ... ... ... Turkey 34 38 51 52 52 55 Ukraine ... ... ... ... ... ... UK: England & Wales 10 100 100 100 100 900
UK: Scotland ... ... ... ... ... ...
Mean 36 41 41 41 40 Median 27 38 38 38 39 Minimum 6 5 5 5 5 Maximum 89 100 100 100 100

119
Table 2.2.1.3 Criminal cases handled by the prosecuting authorities per 100 000 population – Output cases: Minors
2007 2008 2009 2010 2011 % change
2007-11
Albania ... ... ... ... ... ... Austria ... ... ... ... ... ... Belgium ... ... ... ... ... ... Bulgaria ... ... ... ... ... ...
Croatia 87 88 84 83 85 -3 Cyprus ... ... ... ... ... ... Czech Republic ... 71 59 43 42 ... Denmark 848 1166 1469 1740 2215 161 Estonia ... ... ... ... ... ... Finland ... ... ... ... ... ...
France 281 283 284 268 278 -1 Georgia 13 11 11 12 10 -18 Germany ... ... ... ... ... ... Greece ... ... ... ... ... ... Hungary 123 130 136 148 139 13 Iceland ... 147 ... ... 65 ...
Italy ... ... 67 72 ... ... Lithuania 120 128 120 108 108 -10 Netherlands 254 245 213 184 168 -34 Poland ... ... ... ... ... ... Portugal ... ... ... ... ... ... Romania ... ... ... ... ... ...
Slovakia 84 87 79 75 73 -13 Slovenia 136 130 124 126 119 -12 Sweden ... ... ... ... ... ... Turkey ... ... ... ... ... ... Ukraine ... ... ... ... ... ... UK: England & Wales 249 219 186 166 139 -44
UK: Scotland ... ... ... ... ... ...
Mean 219 225 236 252 287 Median 129 130 122 117 114 Minimum 13 11 11 12 10 Maximum 848 1166 1469 1740 2215

120
Table 2.2.1.4 Percentage brought before a court of the total output of criminal cases related to minors handled by the prosecuting authorities
2007 2008 2009 2010 2011 % change
2007-11 Albania ... ... ... ... ... ... Austria ... ... ... ... ... ... Belgium ... ... ... ... ... ... Bulgaria ... ... ... ... ... ... Croatia 30 30 29 29 29 -6 Cyprus ... ... ... ... ... ... Czech Republic ... 59 67 70 71 ... Denmark ... ... ... ... ... ... Estonia ... ... ... ... ... ... Finland ... ... ... ... ... ... France 33 32 32 33 ... ... Georgia 69 54 53 29 32 -54 Germany ... ... ... ... ... ... Greece ... ... ... ... ... ... Hungary 48 45 40 39 37 -23 Iceland ... ... ... ... ... ... Italy ... ... ... ... ... ... Lithuania 44 41 43 44 44 0 Netherlands 41 39 40 42 41 2 Poland ... ... ... ... ... ... Portugal ... ... ... ... ... ... Romania ... ... ... ... ... ... Slovakia 67 68 69 68 71 7 Slovenia 31 31 25 24 22 -28 Sweden ... ... ... ... ... ... Turkey ... ... ... ... ... ... Ukraine ... ... ... ... ... ... UK: England & Wales 100 100 100 100 100 0 UK: Scotland ... ... ... ... ... ... Mean 51 50 50 48 50 Median 44 43 41 40 41 Minimum 30 30 25 24 22 Maximum 100 100 100 100 100 Notes on Tables 2.2.1.1 to 2.2.1.4:
Albania: The counting unit for table 2.2.1.3 is the person, rather than the proceeding. Bulgaria: The total number of output cases is significantly higher in 2007 due to the high number of proceedings terminated on the grounds of expired statute of limitations. Cyprus: Data refers to serious offences only. Czech Republic: The counting unit is the person. Starting in 2008 a new statistical system was introduced. Finland: Only some data on minors are available. Germany: Data on minors are separately available only for cases brought before a court. Poland: The number of input cases does not contain the number of refusals. Slovakia: The counting unit is the person. Turkey: In some tables the counting unit is the person.

121
2.2.2 Criminal cases handled by the prosecuting authorities in 2010
Table 2.2.2.1 Percentage of females and aliens of the criminal cases handled by the prosecuting authorities in 2010 – Output cases total
Total per 100 000
population of which % of Females
of which % of Aliens
% of EU citizens amongst aliens
Belgium 5170 20.0 20.9 43.0 Czech Republic 1210 ... 4.8 57.9 Iceland 1956 4.4 3.1 60.6
Netherlands 1273 12.3 ... ... Slovakia 987 17.1 2.0 ... Turkey 6050 11.4 0.8 ... UK: England & Wales 1645 13.0 ... ...
Mean 2613 13.0 6.2 53.8 Median 1645 12.3 3.1 57.9
Minimum 987 4.4 0.8 43.0 Maximum 6115 20.0 20.9 60.6
Table 2.2.2.2 Percentage of females and aliens of the criminal cases handled by the prosecuting authorities in 2010 – Cases brought before a court
Total per 100 000
population of which % of Females
of which % of Aliens
% of EU citizens amongst aliens
Albania 308 4.9 1.5 ...
Belgium 562 13.2 25.5 42.1 Bulgaria 599 9.0 ... ... Czech Republic 883 ... 6.1 58.2 Netherlands 769 11.3 ... ... Slovakia 710 10.9 1.6 ... UK: England & Wales 1645 1.3 ... ...
Mean 782 8.4 8.2 50.1 Median 710 9.0 6.1 50.1 Minimum 308 1.3 1.5 42.1 Maximum 1645 13.2 25.5 58.2
Notes on tables 2.2.2.1 and 2.2.2.2
Albania, Bulgaria, Czech Republic, Slovakia, Turkey: The counting unit is the person. Cyprus: Refers to serious offences only. Finland: No data on females available. UK: England & Wales: Data refers to 2011.

122
Table 2.2.2.3 Percentage of different types of disposals of the cases disposed by the prosecuting authorities in 2010: Total
To
tal p
er 1
00 0
00 p
opul
atio
n of which (%):
Cases brought before a court
Sanctions and
measures imposed
by the prosecutor that lead to
a formal verdict and count as a conviction
Condi-tional
disposals
Drops due to lack of public
interest or for
efficiency reasons
Drops for legal or factual
reasons
Drops because
the offender
remained unknown
Other disposals
Albania 661 37 ... ... ... 25 34.3 3.8 Austria 6650 13 ... 6.6 12.8 8 ... 2.0 Belgium 6677 5 ... 4.5 23.7 22 22.5 21.9
Bulgaria 2228 27 ... ... ... 74 53.1 ... Croatia 1163 54 10.1 0.5 5.0 ... ... ... Cyprus ... ... ... ... ... ... ... ... Czech Republic 1210 73 ... 4.5 ... 5 ... 7.9 Denmark ... ... ... ... ... ... ... ... Estonia 2284 29 ... 7.7 0.9 19 42.0 1.0
Finland 4479 25 61.0 ... 1.0 7 ... 1.2 France 6963 9 7.0 3.2 4.5 12 58.1 ... Georgia 1087 31 ... ... ... ... ... ... Germany 5632 12 11.6 4.3 21.4 29 ... 22.2 Greece 4947 52 ... ... ... 22 ... ... Hungary 2341 77 3.9 5.2 ... 13 0.1 0.5
Iceland 1864 71 1.3 ... 21.8 6 ... ... Italy 6115 ... ... ... ... ... ... ... Lithuania 1084 76 11.8 8.8 1.5 59 ... ... Netherlands 1273 60 3.2 20.0 7.0 5 ... 4.5 Poland 2466 40 ... 1.2 0.6 23 19.3 16.2 Portugal 5283 13 ... ... ... 78 ... ...
Romania 2916 7 16.3 ... ... ... ... ... Slovakia 2120 31 7.6 3.7 ... 16 51.9 ... Slovenia 4394 16 2.6 2.6 2.3 13 ... 5.7 Sweden ... ... ... ... ... ... ... ... Turkey 7669 52 ... 0.2 ... 36 ... 11.5 Ukraine ... ... ... ... ... ... ... ...
UK: England & Wales 1645 100 ... ... 2.3 8 ... ... UK: Scotland 4829 44 ... 30.9 25.1 ... ... ...
Mean 3519 40 12.4 6.9 9.3 24 35.2 8.2 Median 2466 34 7.6 4.5 4.8 17 38.2 5.1 Minimum 661 5 1.3 0.2 0.6 5 0.1 0.5 Maximum 7669 100 61.0 30.9 25.1 78 58.1 22.2

123
Table 2.2.2.4 Percentage of different types of disposals of the cases disposed by the prosecuting authorities in 2010: Minors
Tota
l per
100
000
pop
ulat
ion of which (%):
Cases brought before a court
Sanctions and
measures imposed
by the prosecutor that lead to
a formal verdict and count as a conviction
Condi-tional
disposals
Drops due to lack of public
interest or for
efficiency reasons
Drops for legal or factual
reasons
Drops because
the offender
remained unknown
Other disposals
Albania ... ... ... ... ... ... ... ... Austria ... ... ... ... ... ... ... ...
Belgium ... ... ... ... ... ... ... ... Bulgaria ... ... ... ... ... ... ... ... Croatia 83 29 0.0 48.2 6.8 ... ... ... Cyprus ... ... ... ... ... ... ... ... Czech Republic 43 70 ... ... ... ... ... ... Denmark ... ... ... ... ... ... ... ...
Estonia ... ... ... ... ... ... ... ... Finland ... ... ... ... ... ... ... ... France 268 33 0.7 8.4 16.3 15 2.9 ... Georgia ... ... ... ... ... ... ... ... Germany ... ... ... ... ... ... ... ... Greece ... ... ... ... ... ... ... ...
Hungary 193 62 10.9 10.7 ... 15 0.0 0.7 Iceland ... ... ... ... ... ... ... ... Italy 72 ... ... ... ... ... ... ... Lithuania 108 44 0.6 5.3 9.3 10 ... ... Netherlands 184 42 0.0 32.3 9.2 6 ... 11.2 Poland ... ... ... ... ... ... ... ...
Portugal ... ... ... ... ... ... ... ... Romania ... ... ... ... ... ... ... ... Slovakia ... ... ... ... ... ... ... ... Slovenia 126 24 ... 11.7 17.5 16 ... 15.0 Sweden ... ... ... ... ... ... ... ... Turkey ... ... ... ... ... ... ... ...
Ukraine ... ... ... ... ... ... ... ... UK: England & Wales 141 100 ... ... 4.9 8 ... ... UK: Scotland ... ... ... ... ... ... ... ...
Mean 135 50 2.4 19.4 10.7 12 1.5 9.0 Median 126 43 0.6 11.2 9.3 12 1.5 11.2
Minimum 43 24 0.0 5.3 4.9 6 0.0 0.7 Maximum 268 100 10.9 48.2 17.5 16 2.9 15.0

124
Table 2.2.2.5 Percentage of different types of conditional disposals of the cases conditionally disposed by the prosecuting authorities in 2010: Total
Total per 100 000
population
of which (%): Fine Restitution V-O-
Med (1)
Com. Service
(2)
Super- vision
Therapy (3)
Other (4)
Mixed (5)
Albania ... ... ... ... ... ... ... ... ... Austria 441 31 ... 13 5 2 21.5 ... ...
Belgium 298 64 13 7 ... ... ... 15 ... Bulgaria ... ... ... ... ... ... ... ... ...
Croatia 6 ... ... ... ... ... ... ... ... Cyprus ... ... ... ... ... ... ... ... ... Czech Republic 54 ... ... ... ... ... ... ... ... Denmark ... ... ... ... ... ... ... ... ... Estonia 176 ... ... 13 ... ... ... ... ...
Finland ... ... ... ... ... ... ... ... ... France 226 ... 6 15 11 ... 2.8 ... ... Georgia ... ... ... ... ... ... ... ... ...
Germany 243 81 6 5 3 ... ... 5 ... Greece ... ... ... ... ... ... ... ... ... Hungary 122 ... ... 25 ... ... ... 75 ... Iceland ... ... ... ... ... ... ... ... ... Italy ... ... ... ... ... ... ... ... ... Lithuania 96 ... ... 93 ... ... ... 7 ...
Netherlands 255 60 3 ... 20 ... ... 16 ... Poland 31 ... ... ... ... ... ... ... ... Portugal ... ... ... ... ... ... ... ... ... Romania ... ... ... ... ... ... ... ... ... Slovakia 79 ... ... ... ... ... ... ... ... Slovenia 115 ... 27 38 12 ... ... 44 21
Sweden ... ... ... ... ... ... ... ... ... Turkey 13 59 ... 41 ... ... ... ... ... Ukraine ... ... ... ... ... ... ... ... ... UK: England & Wales ... ... ... ... ... ... ... ... ... UK: Scotland 1492 69 2 ... ... ... ... 26 3
Mean 243 61 10 28 10 2 12.2 27 12
Median 122 62 6 15 11 2 12.2 16 12 Minimum 6 31 2 5 3 2 2.8 5 3 Maximum 1492 81 27 93 20 2 21.5 75 21
(1) Victim-Offender mediation, (2) Community service, (3) Order to undergo a specific therapeutic treatment, (4) Other measures, (5) Mixed measures

125
Table 2.2.2.6 Percentage of different types of conditional disposals of the cases conditionally disposed by the prosecuting authorities in 2010: Minors
Total per 100 000
population
of which (%): Fine Restitution
V-O-Med.
(1)
Com. Service
(2)
Super- vision
Therapy (3)
Other (4)
Mixed (5)
Albania ... ... ... ... ... ... ... ... ... Austria ... ... ... ... ... ... ... ... ... Belgium ... ... ... ... ... ... ... ... ... Bulgaria ... ... ... ... ... ... ... ... ... Croatia 40 ... ... ... ... ... ... ... ... Cyprus ... ... ... ... ... ... ... ... ... Czech Republic ... ... ... ... ... ... ... ... ... Denmark ... ... ... ... ... ... ... ... ... Estonia ... ... ... ... ... ... ... ... ... Finland ... ... ... ... ... ... ... ... ... France 22 ... 40 5 12 ... 3.1 ... ... Georgia ... ... ... ... ... ... ... ... ... Germany 8 ... ... ... ... ... ... ... ... Greece ... ... ... ... ... ... ... ... ... Hungary 21 ... ... 0 ... ... ... 100 ... Iceland ... ... ... ... ... ... ... ... ... Italy ... ... ... ... ... ... ... ... ... Lithuania 6 ... ... 98 ... ... ... 2 ... Netherlands 59 11 9 ... 67 ... ... 13 ... Poland ... ... ... ... ... ... ... ... ... Portugal ... ... ... ... ... ... ... ... ... Romania ... ... ... ... ... ... ... ... ... Slovakia ... ... ... ... ... ... ... ... ... Slovenia 15 ... 22 39 45 ... ... 13 61 Sweden ... ... ... ... ... ... ... ... ... Turkey ... ... ... ... ... ... ... ... ... Ukraine ... ... ... ... ... ... ... ... ... UK: England & Wales ... ... ... ... ... ... ... ... ...
UK: Scotland ... ... ... ... ... ... ... ... ... Mean 25 11 24 36 42 ... 3.1 32 61 Median 21 11 22 22 45 ... 3.1 13 61 Minimum 6 11 9 0 12 0 3.1 2 61 Maximum 59 11 40 98 67 0 3.1 100 61
(1) Victim-Offender mediation, (2) Community service, (3) Order to undergo a specific therapeutic treatment, (4) Other measures, (5) Mixed measures Notes on tables 2.2.2.3 to 2.2.2.6:
Belgium: Other measures include probation. Croatia: Data partially available. Greece: Only recently the prosecutor has had the power to impose sanctions. This explains the limited number of cases. Hungary: The counting unit is not the case, but the offence. Poland: Conditional disposals means disposal ordered by court but initiated by prosecutors. Turkey: Figures for minors are not included. UK: England & Wales: Data refer to 2011. UK: Scotland: Information on minors not available.

126
2.2.3 Criminal cases handled by the prosecuting authorities in 2010 by offence groups
Table 2.2.3.1 Criminal cases handled by the prosecuting authorities in 2010 – Output cases by offence group
Criminal offences total Major traffic offences
Total per 100 000 population
Of which: % brought before court
Total per 100 000 population
Of which: % brought before court
Albania 661 37 40 63 Austria ... ... ... ... Belgium 6677 5 ... ... Bulgaria 2228 27 ... ...
Croatia 1163 54 45 87 Cyprus ... ... ... ... Czech Republic 1210 73 ... ... Denmark ... ... ... ... Estonia 2284 29 249 90 Finland 1395 79 473 92
France ... ... ... ... Georgia ... ... ... ... Germany 5632 12 994 8 Greece ... ... ... ... Hungary 4465 40 164 78 Iceland 1864 71 ... ...
Italy 6115 ... ... ... Lithuania 1084 76 37 54 Netherlands 1273 60 202 59 Poland 2466 40 ... ... Portugal 5283 13 ... ... Romania 2916 7 219 32
Slovakia 999 72 84 74 Slovenia 4394 16 38 52 Sweden ... ... ... ... Turkey 7669 52 132 73 Ukraine ... ... ... ... UK: England & Wales 1645 100 ... ...
UK: Scotland ... ... ... ...
Mean 3071 46 223 63 Median 2256 40 148 68 Minimum 661 5 37 8 Maximum 7669 100 994 92

127
Table 2.2.3.2 Criminal cases handled by the prosecuting authorities in 2010 – Output cases by offence group: Homicide and Bodily Injury
Intentional homicide
Homicide completed
Bodily injury Bodily injury aggravated
Tota
l per
100
000
po
pula
tion
Of w
hich
: % b
roug
ht
befo
re c
ourt
Tota
l per
100
000
po
pula
tion
Of w
hich
: % b
roug
ht
befo
re c
ourt
Tota
l per
100
000
po
pula
tion
Of w
hich
: % b
roug
ht
befo
re c
ourt
Tota
l per
100
000
po
pula
tion
Of w
hich
: % b
roug
ht
befo
re c
ourt
Albania 10.1 55.9 ... ... 40 51 5 76
Austria ... ... ... ... ... ... ... ... Belgium 10.8 57.4 3.0 57.3 722 9 ... ... Bulgaria ... ... ... ... ... ... ... ... Croatia 4.5 62.6 1.6 48.6 40 53 23 67 Cyprus ... ... ... ... ... ... ... ... Czech Republic 1.8 88.6 ... ... 42 83 6 97
Denmark ... ... ... ... ... ... ... ... Estonia 7.5 58.4 ... ... 305 30 9 61 Finland 5.8 97.4 1.7 100.0 232 73 26 87 France ... ... ... ... ... ... ... ... Georgia ... ... ... ... ... ... ... ... Germany 5.1 ... ... ... 531 17 ... ...
Greece ... ... ... ... ... ... ... ... Hungary 2.8 84.1 1.3 78.2 146 70 78 72 Iceland 0.9 100.0 0.6 100.0 ... ... 22 80 Italy ... ... 2.2 ... 103 ... ... ... Lithuania 7.7 95.7 7.0 95.3 70 72 8 95 Netherlands 13.7 86.6 ... ... 136 55 25 86
Poland ... ... ... ... ... ... ... ... Portugal ... ... ... ... ... ... ... ... Romania 12.2 32.6 4.7 26.7 454 6 5 47 Slovakia 1.6 75.3 ... ... 56 73 ... ... Slovenia 2.4 65.3 1.0 47.6 113 52 10 80 Sweden ... ... ... ... ... ... ... ...
Turkey 27.7 49.9 ... ... 1285 56 6 88 Ukraine ... ... ... ... ... ... ... ... UK: England & Wales 1.7 100.0 ... ... 265 100 ... ... UK: Scotland ... ... ... ... ... ... ... ...
Mean 7.3 74.0 2.6 69.2 284 53 19 78 Median 5.5 75.3 1.7 67.7 141 55 10 80
Minimum 0.9 32.6 0.6 26.7 40 6 5 47 Maximum 27.7 100.0 7.0 100.0 1285 100 78 97

128
Table 2.2.3.3 Criminal cases handled by the prosecuting authorities in 2010 – Output cases by offence group: Sexual offences
Sexual assault Rape Sexual abuse of a
child
Tota
l per
100
000
po
pula
tion
Of w
hich
: % b
roug
ht
befo
re c
ourt
Tota
l per
100
000
po
pula
tion
Of w
hich
: % b
roug
ht
befo
re c
ourt
Tota
l per
100
000
po
pula
tion
Of w
hich
: % b
roug
ht
befo
re c
ourt
Albania 2 40 1.1 50.0 0.8 66.7 Austria ... ... ... ... ... ... Belgium 73 18 35.2 22.0 ... ... Bulgaria ... ... ... ... ... ... Croatia 9 35 3.1 70.3 ... ...
Cyprus ... ... ... ... ... ... Czech Republic 8 92 3.3 90.5 4.7 92.5 Denmark ... ... ... ... ... ... Estonia 12 55 6.3 41.7 2.4 75.0 Finland 14 66 4.9 61.5 9.3 67.8 France ... ... ... ... ... ...
Georgia ... ... ... ... ... ... Germany ... ... ... ... ... ... Greece ... ... ... ... ... ... Hungary 12 66 2.5 66.3 1.3 78.3 Iceland 33 46 15.4 46.9 17.3 45.5 Italy 8 ... ... ... ... ...
Lithuania 13 94 9.3 94.5 2.5 90.5 Netherlands 14 55 3.7 54.9 2.8 66.6 Poland ... ... ... ... ... ... Portugal ... ... ... ... ... ... Romania 21 13 13.3 14.1 6.1 10.6 Slovakia 9 77 2.3 71.2 5.4 81.1
Slovenia 15 41 3.1 42.2 7.4 41.7 Sweden ... ... ... ... ... ... Turkey 66 46 ... ... 43.7 50.2 Ukraine ... ... ... ... ... ... UK: England & Wales 22 100 7.2 100.0 ... ... UK: Scotland ... ... ... ... ... ...
Mean 21 56 7.9 59.0 8.6 63.9 Median 13 55 4.3 58.2 5.0 67.2 Minimum 2 13 1.1 14.1 0.8 10.6 Maximum 73 100 35.2 100.0 43.7 92.5
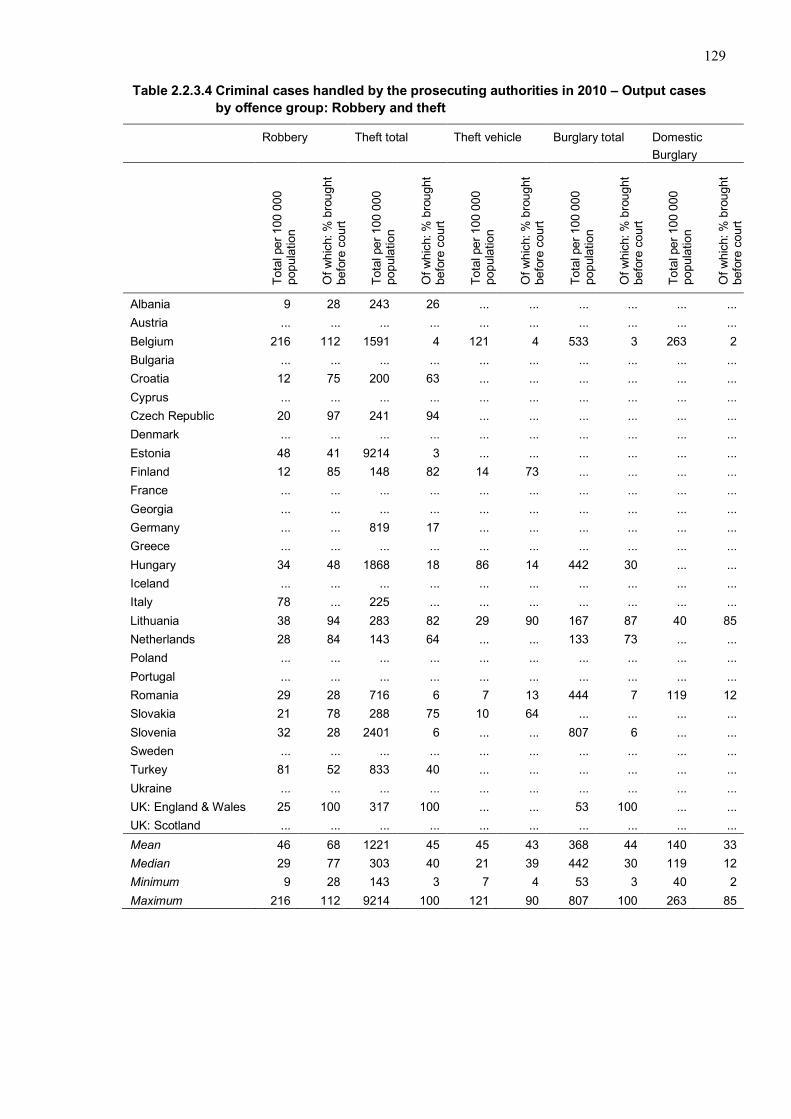
129
Table 2.2.3.4 Criminal cases handled by the prosecuting authorities in 2010 – Output cases by offence group: Robbery and theft
Robbery Theft total Theft vehicle Burglary total Domestic
Burglary
Tota
l per
100
000
po
pula
tion
Of w
hich
: % b
roug
ht
befo
re c
ourt
Tota
l per
100
000
po
pula
tion
Of w
hich
: % b
roug
ht
befo
re c
our t
Tota
l per
100
000
po
pula
tion
Of w
hich
: % b
roug
ht
befo
re c
ourt
Tota
l per
100
000
po
pula
tion
Of w
hich
: % b
roug
ht
befo
re c
ourt
Tota
l per
100
000
po
pula
tion
Of w
hich
: % b
roug
ht
befo
re c
ourt
Albania 9 28 243 26 ... ... ... ... ... ... Austria ... ... ... ... ... ... ... ... ... ... Belgium 216 112 1591 4 121 4 533 3 263 2 Bulgaria ... ... ... ... ... ... ... ... ... ... Croatia 12 75 200 63 ... ... ... ... ... ... Cyprus ... ... ... ... ... ... ... ... ... ... Czech Republic 20 97 241 94 ... ... ... ... ... ... Denmark ... ... ... ... ... ... ... ... ... ... Estonia 48 41 9214 3 ... ... ... ... ... ... Finland 12 85 148 82 14 73 ... ... ... ... France ... ... ... ... ... ... ... ... ... ... Georgia ... ... ... ... ... ... ... ... ... ... Germany ... ... 819 17 ... ... ... ... ... ... Greece ... ... ... ... ... ... ... ... ... ... Hungary 34 48 1868 18 86 14 442 30 ... ... Iceland ... ... ... ... ... ... ... ... ... ... Italy 78 ... 225 ... ... ... ... ... ... ... Lithuania 38 94 283 82 29 90 167 87 40 85 Netherlands 28 84 143 64 ... ... 133 73 ... ... Poland ... ... ... ... ... ... ... ... ... ... Portugal ... ... ... ... ... ... ... ... ... ... Romania 29 28 716 6 7 13 444 7 119 12 Slovakia 21 78 288 75 10 64 ... ... ... ... Slovenia 32 28 2401 6 ... ... 807 6 ... ... Sweden ... ... ... ... ... ... ... ... ... ... Turkey 81 52 833 40 ... ... ... ... ... ... Ukraine ... ... ... ... ... ... ... ... ... ... UK: England & Wales 25 100 317 100 ... ... 53 100 ... ... UK: Scotland ... ... ... ... ... ... ... ... ... ... Mean 46 68 1221 45 45 43 368 44 140 33 Median 29 77 303 40 21 39 442 30 119 12 Minimum 9 28 143 3 7 4 53 3 40 2 Maximum 216 112 9214 100 121 90 807 100 263 85
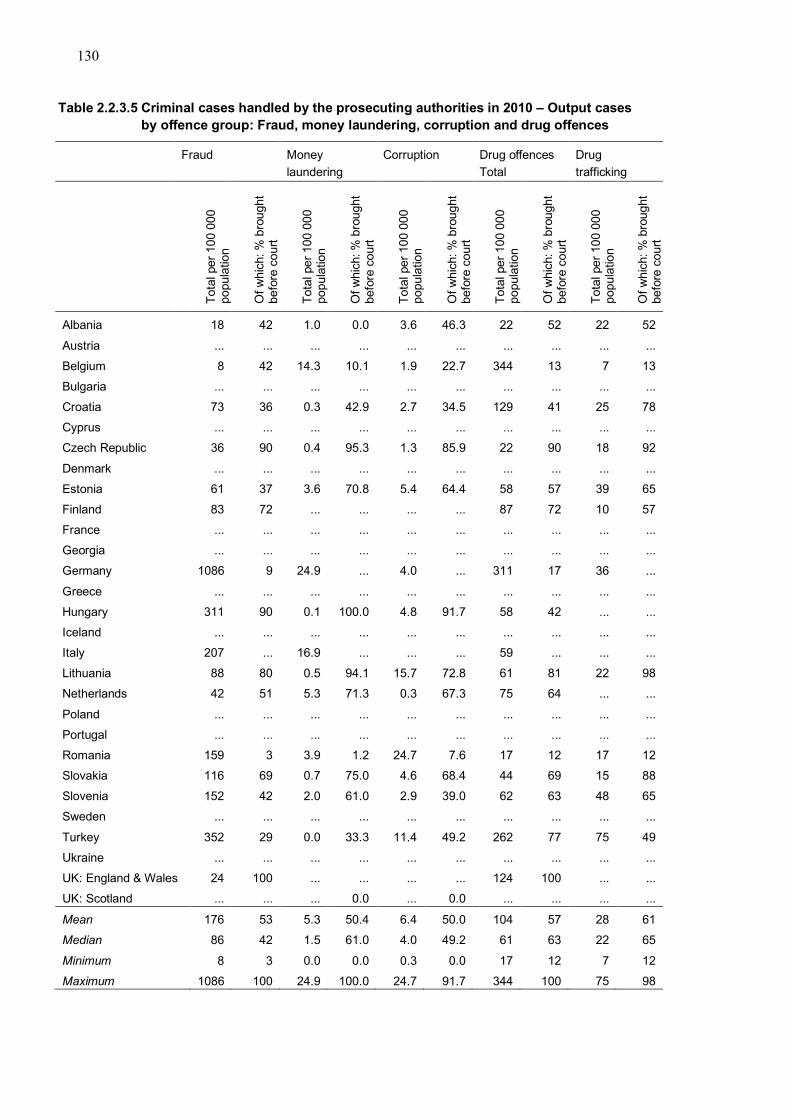
130
Table 2.2.3.5 Criminal cases handled by the prosecuting authorities in 2010 – Output cases
by offence group: Fraud, money laundering, corruption and drug offences
Fraud Money
laundering Corruption Drug offences
Total Drug trafficking
Tota
l per
100
000
po
pula
tion
Of w
hich
: % b
roug
ht
befo
re c
ourt
Tota
l per
100
00 0
po
pula
tion
Of w
hich
: % b
roug
ht
befo
re c
ourt
Tota
l per
100
000
po
pula
tion
Of w
hich
: % b
roug
ht
befo
re c
ourt
Tota
l per
100
000
po
pula
tion
Of w
hich
: % b
roug
ht
befo
re c
ourt
Tota
l per
100
000
po
pula
tion
Of w
hich
: % b
roug
ht
befo
re c
ourt
Albania 18 42 1.0 0.0 3.6 46.3 22 52 22 52
Austria ... ... ... ... ... ... ... ... ... ... Belgium 8 42 14.3 10.1 1.9 22.7 344 13 7 13 Bulgaria ... ... ... ... ... ... ... ... ... ... Croatia 73 36 0.3 42.9 2.7 34.5 129 41 25 78 Cyprus ... ... ... ... ... ... ... ... ... ... Czech Republic 36 90 0.4 95.3 1.3 85.9 22 90 18 92
Denmark ... ... ... ... ... ... ... ... ... ... Estonia 61 37 3.6 70.8 5.4 64.4 58 57 39 65 Finland 83 72 ... ... ... ... 87 72 10 57 France ... ... ... ... ... ... ... ... ... ... Georgia ... ... ... ... ... ... ... ... ... ... Germany 1086 9 24.9 ... 4.0 ... 311 17 36 ...
Greece ... ... ... ... ... ... ... ... ... ... Hungary 311 90 0.1 100.0 4.8 91.7 58 42 ... ... Iceland ... ... ... ... ... ... ... ... ... ... Italy 207 ... 16.9 ... ... ... 59 ... ... ... Lithuania 88 80 0.5 94.1 15.7 72.8 61 81 22 98 Netherlands 42 51 5.3 71.3 0.3 67.3 75 64 ... ...
Poland ... ... ... ... ... ... ... ... ... ... Portugal ... ... ... ... ... ... ... ... ... ... Romania 159 3 3.9 1.2 24.7 7.6 17 12 17 12 Slovakia 116 69 0.7 75.0 4.6 68.4 44 69 15 88 Slovenia 152 42 2.0 61.0 2.9 39.0 62 63 48 65 Sweden ... ... ... ... ... ... ... ... ... ...
Turkey 352 29 0.0 33.3 11.4 49.2 262 77 75 49 Ukraine ... ... ... ... ... ... ... ... ... ... UK: England & Wales 24 100 ... ... ... ... 124 100 ... ... UK: Scotland ... ... ... 0.0 ... 0.0 ... ... ... ...
Mean 176 53 5.3 50.4 6.4 50.0 104 57 28 61 Median 86 42 1.5 61.0 4.0 49.2 61 63 22 65
Minimum 8 3 0.0 0.0 0.3 0.0 17 12 7 12 Maximum 1086 100 24.9 100.0 24.7 91.7 344 100 75 98

131
Notes on Tables 2.2.3.1 to 2.2.3.5
Belgium: For major traffic offences decisions by the "police courts" are not included. Bulgaria: The public prosecution service keeps only input statistics by offence group . Cyprus: The data refers to serious crime as classified by the police. Czech Republic, Slovakia: The counting unit is the person. Finland: Attempts are not included except for homicide. Sexual assault consists only of rape and sexual abuse of a child. These figures are not comparable with the figures in Chapter 3. Germany: German prosecution statistics do not provide a detailed breakdown by offence and definitions differ from other chapters. In particular the high rate for fraud refers to a broader group of offences. Turkey: The counting unit is the decision. UK: England & Wales: Data refer to 2011. UK: Scotland: Domestic burglary cannot be separated from other types of burglary.

132
2.2.4 Police custody and pre-trial detention
Table 2.2.4.1 Persons per 100 000 population whose freedom of movement was restricted in 2010: Persons in police custody
Ordered by the
police Ordered by a
prosecutor Ordered by court Ordered by
another authority
Albania ... ... ... ... Austria ... ... ... ... Belgium ... ... ... ... Bulgaria 639 ... ... ...
Croatia 1018 ... ... ... Cyprus ... ... ... ... Czech Republic 6 244 1 ... Denmark 782 ... ... ... Estonia ... ... ... ... Finland 242 ... ... ...
France 852 ... ... ... Georgia ... ... ... ... Germany ... ... ... ... Greece ... ... ... ... Hungary 53 2 ... ... Iceland ... ... ... ...
Italy ... ... ... ... Lithuania ... ... ... ... Netherlands ... ... ... ... Poland 648 ... 138 ... Portugal 488 ... ... ... Romania ... 42 ... ...
Slovakia ... ... ... ... Slovenia ... ... ... ... Sweden ... ... ... ... Turkey ... ... ... ... Ukraine ... ... ... ... UK: England & Wales ... ... ... ...
UK: Scotland ... ... ... ...
Mean 525 96 69 ... Median 639 42 69 ... Minimum 6 2 1 0 Maximum 1018 244 138 0

133
Table 2.2.4.2 Persons per 100 000 population whose freedom of movement was restricted in 2010: Persons in pre-trial detention
Ordered by the
police Ordered by a
prosecutor Ordered by court Ordered by
another authority Albania ... ... 111.7 ... Austria ... ... ... ... Belgium ... ... 103.1 ... Bulgaria ... ... 57.6 ... Croatia 3.5 ... ... ... Cyprus ... ... ... ... Czech Republic ... ... 38.3 ... Denmark ... ... 138.7 ... Estonia ... ... 70.5 ... Finland ... ... 43.6 ... France ... ... 47.0 ... Georgia ... ... ... ... Germany ... ... ... ... Greece ... 31.5 ... ... Hungary ... ... 58.8 ... Iceland ... ... ... ... Italy ... 12.4 ... ... Lithuania ... ... 35.9 ... Netherlands ... ... ... ... Poland ... ... 60.4 ... Portugal ... ... 23.3 ... Romania ... ... 40.3 ... Slovakia ... ... ... ... Slovenia ... ... 41.9 ... Sweden ... ... ... ... Turkey ... ... 45.4 ... Ukraine ... ... 81.3 ... UK: England & Wales ... ... ... ... UK: Scotland ... ... ... ... Mean 3.5 21.9 65.2 ... Median 3.5 21.9 57.6 ... Minimum 3.5 12.4 23.3 0.0 Maximum 3.5 31.5 138.7 0.0 Notes on Tables 2.2.4.1 to 2.2.4.2
Bulgaria: According to Bulgarian law only the court can order pre-trial detention. Croatia: Only data on restriction of freedom by the police is available. Denmark: Most often arrests are ordered by the police but they can be ordered by others. Estonia: Persons in pre-trial detention (due to criminal offences only) includes both prisons and police detention houses. France: Ordered by court = decisions from the “Juge des libertés et de la detention” and from the courts (tribunal correctionnel and tribunaux et juges pour enfants). Italy: The prosecutor can only propose pre-trial detention. A validation by the Court is always needed. Poland: Persons in pre-trial detention represent the number of persons for whom detention was ordered by the court on the application of the prosecutor. Romania: The offender can be taken into custody either by the police or the prosecutor, but the statistics do not make this distinction.

134
2.2.5 Staff
Table 2.2.5.1 Staff per 100 000 population of the prosecuting authority: Number of employees: Total
2007 2008 2009 2010 2011 % change
2007-11
Albania 27 27 27 27 27 1 Austria ... ... ... ... ... ...
Belgium ... ... ... ... ... ... Bulgaria ... ... ... ... ... ... Croatia 32 33 33 33 37 16 Cyprus ... ... ... ... 27 ... Czech Republic 29 28 28 27 26 -9 Denmark ... ... 20 20 22 ...
Estonia 20 20 19 19 19 -4 Finland ... ... ... ... ... ... France ... ... ... 12 ... ... Georgia ... ... ... ... ... ... Germany 18 18 18 18 18 -3 Greece ... ... ... ... ... ...
Hungary 39 39 39 41 41 6 Iceland ... ... ... ... ... ... Italy ... ... ... ... ... ... Lithuania 50 50 52 50 50 0 Netherlands ... ... ... ... ... ... Poland 34 34 35 35 35 3
Portugal ... ... ... ... ... ... Romania 24 25 25 25 25 7 Slovakia 28 29 30 31 33 17 Slovenia 22 21 22 22 22 0 Sweden 13 13 14 15 14 7 Turkey ... ... ... ... ... ...
Ukraine ... ... ... ... 33 ... UK: England & Wales 15 15 15 14 13 -14 UK: Scotland 30 30 33 33 31 5
Mean 27 27 27 25 27 2 Median 28 27 27 25 27 2 Minimum 13 13 14 10 10 -14
Maximum 50 50 52 50 50 17

135
Table 2.2.5.2 Staff per 100 000 population of the prosecuting authority: Number of employees: Prosecutors
2007 2008 2009 2010 2011 % change
2007-11
Albania 9.5 9.7 9.9 10.4 11.2 18 Austria 4.0 4.1 4.1 4.4 4.5 12 Belgium ... ... ... ... ... ...
Bulgaria ... ... ... ... 21.4 ... Croatia 12.8 12.8 13.0 13.0 14.0 9 Cyprus ... ... ... ... 7.0 ... Czech Republic 12.4 11.4 11.8 12.1 11.7 -5 Denmark ... ... ... ... ... ... Estonia 13.9 13.9 13.1 13.1 13.0 -6
Finland 6.1 6.8 6.4 6.6 6.7 10 France ... ... ... 3.0 ... ... Georgia ... ... ... ... ... ... Germany 7.2 7.2 7.3 7.4 7.4 3 Greece 5.0 5.0 5.0 5.0 5.0 0 Hungary 15.7 16.0 16.5 17.4 18.5 18
Iceland ... ... ... ... ... ... Italy ... ... ... ... ... ... Lithuania 26.4 26.3 26.4 26.6 29.8 13 Netherlands ... ... ... ... ... ... Poland 15.8 16.2 16.6 14.8 15.1 -4 Portugal 12.7 12.7 13.4 13.8 14.7 15
Romania 10.6 10.8 10.7 11.0 11.4 8 Slovakia 14.1 14.5 14.9 15.3 16.7 18 Slovenia 9.9 9.7 9.3 9.3 9.2 -7 Sweden 9.4 9.0 9.6 9.8 9.5 1 Turkey 5.5 5.7 6.0 6.1 ... ... Ukraine ... ... ... ... 2.7 ...
UK: England & Wales 5.5 6.2 6.2 5.9 5.5 0 UK: Scotland 8.7 9.0 9.7 10.3 9.8 13
Mean 10.5 10.6 10.7 10.5 11.3 Median 9.7 9.7 9.8 10.3 10.5 Minimum 4.0 4.1 4.1 3.0 2.7 Maximum 26.4 26.3 26.4 26.6 29.8 Notes on Tables 2.2.5.1 to 2.2.5.2
Albania: The number of the prosecutors has increased because of the creation of some anti-corruption task forces at the prosecutor's offices. Bulgaria: The number of prosecutors refers to the situation on 20 January 2011. Denmark, UK: England & Wales: The numbers reflect full-time equivalents. Netherlands: 2007: end of year figures. 2008-2011: average figures. For all years: full-time equivalents.

136
2.3 Technical information 2.3.1 General remarks
13 countries were not able to provide any technical information on prosecution statistics. For most countries, the counting unit was the proceeding. This can imply more than one defendant, or more than one offence. For details see technical tables 2.3.1 and 2.3.7.
This chapter contains data only on an output basis, i.e., based on the total number of cases disposed of. Input data and information on pending cases are published online (http://www.europeansourcebook.org).
The sum of the figures reported for the different disposal categories is not always equal to the total number of cases disposed, e.g., because of double counting and counting rule variations between categories. The data presented in this chapter give an overview of the prosecution statistics of the different countries. More information is published online: http://www.europeansourcebook.org
Table 2.3.1 What is the counting unit used?
Case30 Proceedings Person
Other
Albania X Austria X Belgium X Bulgaria X Croatia X Cyprus X Czech Republic X Denmark X Estonia X Finland X France X Georgia X Germany X Greece X Hungary X Iceland Italy X Lithuania X Netherlands X Poland X Portugal X Romania X Slovakia X Slovenia X Sweden X Turkey X Ukraine X UK: England & Wales X UK: Scotland X
30 proceedings relating to one person only

137
2.3.2 Offences / cases handled by the prosecuting authorities
For most countries, figures on cases handled by the prosecuting authority include cases reported to the prosecutor by other institutions (e.g., customs, other non-police authorities). Cases where the offender remained unknown are also usually included. In most countries cases only handled by the police – i.e., dropped, conditionally disposed of or sanctioned by the police - are excluded from the total.
Table 2.3.2 Criminal cases handled by the prosecuting authorities (input, output and pending cases) (1 = Included; 2 = Excluded)
Cases reported by other institutions
Cases where the offender remained unknown
Cases dropped, conditionally disposed of or sanctioned by the police
Albania 1 1 2 Austria 1 1 2 Belgium 1 1 2 Bulgaria 1 1 2 Croatia 1 2 2 Cyprus 1 1 2 Czech Republic 1 2 1 Denmark 1 2 2 Estonia 1 1 ... Finland 1 2 2 France 1 1 ... Georgia 1 1 ... Germany 1 2 2 Greece 1 1 2 Hungary 1 1 2 Iceland 1 1 2 Italy 1 1 2 Lithuania 1 1 2 Netherlands 1 ... 2 Poland 1 1 2 Portugal 1 1 ... Romania 1 1 2 Slovakia 1 1 2 Slovenia 1 1 2 Sweden ... ... ... Turkey 1 1 2 Ukraine 1 1 1 UK: England & Wales 1 2 ... UK: Scotland 1 2 2
2.3.3 Disposal categories
General disposal categories
The countries were asked to include – if possible – the following disposal categories in their figures: Cases brought before a court (indictment, acte d’accusation, Anklageschrift); sanctions imposed by the prosecutor (or by the court, but on application of the prosecutor and without a formal court hearing) that lead to a formal verdict and count as a conviction (e.g., penal order, Strafbefehl); conditional disposals by the prosecutor without a formal verdict (i.e., the case is dropped when the condition is met by suspect); proceedings dropped unconditionally due to lack of public interest or for efficiency reasons. Almost all countries that have data at the prosecution stage included information on cases brought before a court and most countries could also include some of the other four categories. In the majority of countries, the concept of sanctions imposed by the prosecutor or conditional disposals by the prosecutor without formal verdict do not exist, and thus no data are available. In 10 out of 24 countries the concept “proceedings dropped unconditionally due to lack of public interest or for efficiency reasons” does not exist or respective data are not available

138
Table 2.3.3 General disposal categories (1 = Included; 2 = Excluded; 3 = Concept does not exist)
Cas
es b
roug
ht b
efor
e a
cour
t
Sanc
tions
impo
sed
by th
e pr
osec
utor
(or b
y th
e co
urt,
but o
n ap
plic
atio
n of
the
pros
ecut
or a
nd w
ithou
t a fo
rmal
cou
rt he
arin
g)
that
lead
to a
form
al v
erdi
ct a
nd c
ount
as
a co
nvic
tion
( e.g
., pe
nal
orde
r, St
rafb
efeh
l)
Con
ditio
nal d
ispo
sals
by
the
pros
ecut
or
with
out f
orm
al v
erdi
ct (i
.e.,
the
case
is
drop
ped
whe
n co
nditi
on is
met
by
the
susp
ect)
Proc
eedi
ngs
drop
ped
unco
nditi
onal
ly d
ue to
lack
of p
ublic
inte
rest
or
for e
ffici
ency
reas
ons C
ondi
tiona
l dis
posa
ls b
y th
e pr
osec
utor
w
ithou
t for
mal
ver
dict
Fine
Res
titut
ion
Vict
im-O
ffend
er-
Med
iatio
n
Com
mun
ity s
ervi
ce
Supe
rvis
ion
Ord
er to
und
ergo
a
spec
ific
ther
apeu
tic
treat
men
t
Oth
er
Albania 1 3 3 3 1 3 3 3 1 1 Austria 1 1 1 1 1 1 1 1 1 ... Belgium 1 3 1 1 1 1 1 1 1 1 Bulgaria 1 3 3 3 3 3 3 3 3 3 Croatia 1 1 1 1 1 1 2 2 1 1 Cyprus 1 1 2 2 2 1 2 2 2 2 Czech Republic 1 1 3 1 3 1 3 3 1 1 Denmark 2 2 2 2 2 2 2 2 2 2 Estonia 1 ... 3 ... 1 1 1 3 1 ... Finland 1 1 1 3 3 1 3 3 3 1 France 1 1 1 1 1 1 1 1 1 ... Georgia ... ... 1 1 1 2 1 2 1 ... Germany 1 1 1 1 1 1 1 3 1 1 Greece 1 1 3 1 1 3 1 1 1 1 Hungary 1 1 3 3 1 3 3 2 3 1 Iceland 1 1 2 3 3 1 3 3 3 ... Italy 1 2 ... ... ... … ... ... ... ... Lithuania 1 1 3 2 1 1 3 3 3 1 Netherlands 1 1 1 1 3 1 1 3 3 ... Poland 1 3 3 3 3 1 3 3 3 3 Portugal 1 3 3 1 3 3 1 3 1 1 Romania 1 1 2 2 2 3 2 2 2 3 Slovakia 1 1 3 1 1 3 1 1 1 1 Slovenia 1 1 3 1 1 1 1 1 3 1 Sweden ... ... ... ... ... … ... ... ... ... Turkey 1 3 1 3 1 3 3 3 3 3 Ukraine 1 1 2 2 2 1 2 2 2 2 UK: England & Wales 1 2 2 2 2 1 2 2 2 2 UK: Scotland 1 ... 1 1 ... … ... ... ... ...

139
Table 2.3.3 (cont.) General disposal categories (1 = Included; 2 = Excluded; 3 = Concept does not exist)
Lack
of e
vide
nce
Act n
ot a
n of
fenc
e
No
crim
inal
resp
onsi
bilit
y
No
com
plai
nt fr
om v
ictim
or
com
plai
nt w
ithdr
awn
Ne
bis
in id
em
Stat
ute
of li
mita
tion
Offe
nder
not
ava
ilabl
e
Offe
nder
unk
now
n
Proc
eedi
ngs
drop
ped
beca
use
offe
nder
rem
aine
d un
know
n
Oth
er d
ispo
sals
: No
com
pete
nce
Oth
er d
ispo
sals
: Tra
nsfe
r to
anot
her d
omes
tic a
utho
rity
Oth
er d
ispo
sals
: Tra
nsfe
r to
a fo
reig
n au
thor
ity
Oth
er d
ispo
sals
: Priv
ate
crim
inal
pr
osec
utio
n re
com
men
ded
Albania 1 1 1 1 1 1 1 2 1 1 1 1 3 Austria 1 1 1 1 1 1 1 2 1 ... ... ... 2 Belgium 1 1 1 1 1 1 1 2 1 2 1 1 1 Bulgaria 1 1 1 1 1 1 1 1 1 1 1 1 1 Croatia 1 1 1 1 1 1 2 2 2 1 1 1 1 Cyprus 1 1 1 1 1 1 1 2 1 1 1 1 1 Czech Republic 1 1 1 1 1 1 1 2 2 1 1 1 3 Denmark 2 2 2 2 2 2 2 2 2 2 2 2 2 Estonia 1 1 1 1 1 1 1 2 1 ... 1 ... ... Finland 1 1 1 1 1 1 1 2 2 1 1 1 3 France 1 1 1 3 1 1 1 2 2 3 3 3 3 Georgia 1 1 1 1 ... ... ... ... ... ... ... ... ... Germany 1 1 1 1 1 1 1 2 2 1 1 1 1 Greece 1 1 1 1 1 1 1 2 1 1 1 2 3 Hungary 1 1 1 1 1 1 1 2 1 1 1 1 1 Iceland 1 1 1 1 1 1 1 2 ... ... ... ... ... Italy ... ... ... ... ... ... ... 3 1 ... ... ... ... Lithuania 1 1 1 1 1 1 1 3 3 2 2 2 2 Netherlands 1 1 1 1 1 1 1 3 3 1 1 1 ... Poland 1 1 1 1 1 2 1 2 1 2 2 2 2 Portugal 1 1 1 1 1 1 3 1 ... 1 1 1 3 Romania 3 1 1 1 1 1 1 1 2 2 2 1 2 Slovakia 3 1 1 1 1 1 3 2 1 ... ... 1 ... Slovenia 1 1 1 1 1 1 2 2 2 1 1 1 1 Sweden ... ... ... ... ... ... ... ... ... ... ... ... ... Turkey 1 1 1 1 1 1 1 2 ... 1 1 ... ... Ukraine 1 1 1 1 1 1 1 2 1 1 1 1 2 UK: England & Wales 1 1 1 1 ... 1 1 2 1 1 2 2 2 UK: Scotland ... ... ... ... ... ... ... ... ... ... ... ... ...
Unknown offenders
Regarding proceedings against unknown offenders, the European Sourcebook questionnaire asked correspondents to include them in their data on input total, pending cases (both are only published online) and output total, if possible (see table 2.3.1). Data on unknown offenders should, if possible, be excluded from the number of proceedings dropped due to legal or factual reasons (see table 2.3.3). Data was to be reported separately if possible (see table 2.2.1.8). However, not every country was able to follow these rules.
Reasons for fully excluding data on unknown offenders might vary. In some countries (e.g., the Netherlands) cases do not enter the prosecution stage at all if no suspect can be found. For other countries the reason may simply be that data on unknown offenders are not available.

140
When comparing prosecution data between countries, it is always crucial to know whether a certain country includes proceedings against unknown offenders in their statistics. In table 2.2.1.1 the countries that stated that they exclude proceedings against unknown offenders from their output totals are Croatia, Czech Republic, Denmark, Finland, France, Germany, Romania and Slovenia. It can be expected that the total output would be significantly higher for these countries if they were able to include that data.
Of those countries able to provide data on the number of proceedings dropped for legal or factual reasons, only Bulgaria, Portugal and Romania included cases against unknown offenders under this heading.
Other disposals
Regarding other disposals, the following sub-categories were asked to be included: No competence; transfer to another domestic authority; transfer to a foreign authority; private criminal prosecution recommended (see table 2.2.1.9).
Conditional disposals without a formal verdict
Only four jurisdictions do not know such a concept or any form of condition imposed at this stage. However, many countries could not provide data on this. Only 14 countries could do that.
2.3.4 Other technical information on the tables
Table 2.3.4 Are decisions made outside a criminal procedure (such as, e.g., measures of constraints against illegal immigrants) excluded from tables 2.2.2.1 to 2.2.2.4?
Yes No Albania Denmark Poland France¹ Austria Estonia Portugal UK: Scotland² Belgium Greece Romania Bulgaria Hungary Slovenia Croatia Italy Turkey Czech Republic Lithuania Ukraine
¹ Constraints against illegal immigrants are considered as administrative measures (“detention administrative”). Illegal immigrants can be detained in administrative centres (different from ordinary prisons, and subject to the Ministry of Interior) before expulsion from the national territory. During 2006, the number of such decisions was 32 817 (annual flow) for an average length of ten days. ² Information on persons held as suspects is not available.
Table 2.3.5 Are cases referring to minors included in the total cases presented in tables 2.2.1.1, 2.2.2.1, and 2.2.3.1?
Yes No Partially Albania France Romania Belgium Cyprus³ Austria¹ Germany Slovakia Bulgaria Iceland4
Croatia Hungary Slovenia Georgia Poland5
Czech Republic Italy Turkey² Portugal6
Denmark Lithuania UK: England & Wales Finland Netherlands UK: Scotland
¹ However, there is no differentiation. ² This is not clearly stated in the source. ³ Data refers to serious offences only 4 If they are over 14 years of age. 5 Cases of minors are related only to the most serious offences (eg. homicide, rape). 6 Only minors 16-17 years old.

141
Definition of aliens used in tables 2.2.2.1 and 2.2.2.2:
Aliens are persons who do not have the nationality of the country in which they commit an offence.
Table 2.3.6 Is the age bracket used for minors in tables 2.2.1.3 and 2.2.1.4 the same as in tables 1.2.3.1-1.2.3.22?
1=Yes
2=No
If no, what are the minimum and maximum age?
Minimum age
Maximum age
Albania 2 14 18 Austria 1 ... ... Belgium ... ... ... Bulgaria 1 ... ... Croatia 1 ... ... Cyprus 1 ... ... Czech Republic 2 15 18 Denmark ... ... ... Estonia ... ... ... Finland ... ... ... France ... ... ... Georgia ... ... ... Germany 2 14 21 Greece ... ... ... Hungary 2 14 18 Iceland 2 15 19 Italy 1 ... ... Lithuania 1 ... ... Netherlands 2 12 18 Poland 2 15 17 Portugal ... ... ... Romania 1 ... ... Slovakia 1 ... ... Slovenia 1 ... ... Sweden ... ... ... Turkey ... ... ... Ukraine ... ... ... UK: England & Wales ... ... ... UK: Scotland 1 ... ...
Do the offence definitions used in tables 2.2.3.1 to 2.2.3.5 differ from those in the ‘Definitions’ section? Two countries declared this was indeed the case:
Bulgaria: Intentional homicide: prosecution statistics exclude preparation for homicide. Bodily injury (assault): prosecution statistics include the inflicting of bodily injury because of severe injury caused by the victim’s unlawful behaviour and exclude assault only causing pain. Sexual assault (total): prosecution statistics exclude sexual assaults against victims of the same sex. Fraud: prosecution statistics exclude insurance fraud (the intentional damaging of one’s own insured property). Germany: Major traffic offences: Differently from the rules laid down in the definitions section, data also include traffic offences outside road traffic, driving without motor liability insurance, driving without paying the motor vehicle tax and driving without or using wrong number plates. This will, however, only make a small difference. Intentional homicide total: In addition to intentional killings and assault leading to death, other forms of killings such as robbery leading to death and rape leading to death are included. There are very few such cases, and therefore the difference is statistically irrelevant. Theft total: Embezzlement / theft by employees is included here. Fraud: Fraudulent breach of trust / embezzlement is included here. Drug trafficking: only aggravated drug offences are included here.

142
Table 2.3.7 Description of data recording methods for prosecution statistics
Questions Are there written rules regulating the way in which the data shown in Table 2.1.1 are recorded?
How are individual proceedings counted if more than one person is involved?
How are multiple offences counted?
How is a person counted who is subject to two or more proceedings in one year?
Are data collected by other authorities (apart from the prosecutor or examining judge) included?
Possible answers 1=Yes 2=No
1=As one case 2=As two or more cases
1=As one case 2=As two or more cases
1=As one case 2=As two or more cases
1=Included 2=Excluded
Albania 1 1 1 2 2 Austria 1 1 1 2 2 Belgium 1 1 2 2 2 Bulgaria 1 1 1 2 2 Croatia 1 2 1 1 2 Cyprus 1 2 2 2 2 Czech Republic 1 1 1 2 2 Denmark ... 2 2 2 1 Estonia 1 1 ... 2 ... Finland 1 1 1 2 2 France 1 1 1 ... 2 Georgia ... ... 1 2 ... Germany 1 1 1 2 2 Greece 2 ... ... ... 2 Hungary 1 1 1 2 1 Iceland ... 2 1 1 2 Italy 2 1 2 2 2 Lithuania 1 1 1 1 2 Netherlands 1 2 2 2 ... Poland 1 1 1 2 2 Portugal ... 1 1 2 2 Romania 1 1 1 2 2 Slovakia 1 2 1 1 2 Slovenia 1 2 1 2 2 Sweden ... ... ... ... ... Turkey 1 ... 2 2 ... Ukraine ... ... 1 2 1 UK: England & Wales 1 2 1 2 2 UK: Scotland 1 2 1 2 2

143
Table 2.3.8 Do the police have separate powers to drop proceedings, conditionally dispose of them or issue a penal order that counts as a conviction?
No, none of these
Yes, they have the following powers Drop because offender remains unknown
Drop for other factual or for legal reasons
Drop for public interest reasons
Conditional disposals
Penal order
Albania X Austria X Belgium X Bulgaria X Croatia X Cyprus X Czech Republic X X X Denmark … Estonia X Finland X France X Georgia X Germany X Greece X1 Hungary X Iceland X X X X Italy X Lithuania X Netherlands X2 X2 Poland X Portugal X Romania X Slovakia X Slovenia X Sweden … Turkey X Ukraine … UK: England & Wales X UK: Scotland X3 1 Only in cases of petty offences. 2 The police has no powers to drop at all. However, in practice drops and disposals are used under the responsibility of the prosecutor (but they do not appear in the prosecution statistics). 3 The police can issue anti-social behaviour notices and police warnings. Have the data recording methods described above been substantially modified between 2007 and 2011?
This applied to four countries: Albania: There are some changes in the format used in the statistics since 2008. Greece: Additional categories have been added. Under these provisions the prosecutor has the power, under certain conditions, to act as a mediator in victim-offender mediation. Italy: From 2008 data about criminal cases handled by the prosecuting authorities include unknown offenders. Turkey: In 2009 data reporting methods have changed, resulting in different counting units.

144
Table 2.3.9 Are the figures in tables 2.2.2.1 to 2.2.2.4 flow data or stock data?
Flow Stock Albania X
Austria X Belgium X
Bulgaria X
Croatia X
Cyprus
Czech Republic X
Denmark X
Estonia 31.12.2010 Finland X
France X
Georgia
Germany
Greece X Hungary X
Iceland
Italy X
Lithuania X
Netherlands
Poland X
Portugal X
Romania 31.12.2010 Slovakia Slovenia X Sweden Turkey 31.12.2010 Ukraine X UK: England & Wales UK: Scotland

145
2.4 Sources Albania The Annual Reports 2011, 2012 General Prosecutor Office Tirana, www.pp.gov.al Austria Sicherheitsbericht 2007-2011, Bericht der Bundesregierung über die Innere
Sicherheit Österreich Bundesministerien für Inneres und Justiz www.parlament.gv.at
Belgium College of General Prosecutors - Statistical analysts. http://www.om-mp.be/sa/start/n/home.html http://www.om-mp.be/sa/SA_JEUGD_INSTROOM_2006-2010_NL.pdf
Bulgaria Source: Supreme Prosecutor’s Office of Cassation – Department of Information, Analysis and Methodological Guidance: Prosecutorial Statistics 2007-2011, not published. Ministry of Interior: Letter to the Center for the Study of Democracy of 11 December 2012 (for persons in police custody).
Croatia State Attorney's Office of the Republic of Croatia – internal data, partially published in Annual Report, available at http://www.dorh.hr/Default.aspx?sec=645 (2004, 2005, 2006, 2007, 2008, 2009, 2010, 2011).
Cyprus The annual reports "Criminal Statistics" and unpublished data of the Statistical Service of Cyprus (CYSTAT).
Czech Republic Central Information System for Statistical Lists and Reporting, The Ministry of Justice, www. justice.cz Annual Report on the Activities of Public Prosecutors, published, The Supreme Public Prosecutor's Office.
Estonia Ministry of Justice – state register of criminal matters – not published. Finland Statistics Finland / StatFIn France Ministère de la Justice, Annuaire statistique de la Justice. Georgia Main Prosecutor Office Germany Statistisches Bundesamt (Hrsg.), Staatsanwaltschaften 2006-2011, Wiesbaden
2007-2012. Greece Personal information. Statistics collected via a special order of the Chief Prosecutor
of the Supreme Court (Areios Pagos). Hungary Office of the Prosecutor General – Department for IT Case Management System,
Department for IT Unified Criminal Statistics of the Investigation Authorities and the Public Prosecution.
Iceland Annual report and information from the Prosecution Office Italy Italian Institute of Statistics - www.istat.it, Ministry of Justice – www.giustizia.it Lithuania Source: Ministry of Internal Affairs - Department of Informatics and Communication -
Section of Statistics: Departmental Register of Crimes, not published. Netherlands Statistics Netherlands http://statline.cbs.nl; Poland To 2009 data aggregated by Ministry of Justice, Department of Statistics. From
2010, data collected by General Prosecution, Department of Statistics. Portugal Directorate-General for Justice Policy – Ministry of Justice. Romania The Public Ministry, the Prosecutor’s Office attached to the High Court of Cassation
and Justice, the Human Resources and Documentation Section, the Judicial Statistics Office.
Slovakia General Prosecution of the Slovak Republic - Internal Administration Division: IS PATRICIA, partially published at: http://www.genpro.gov.sk/
Slovenia Office of Public Prosecutor: Annual reports for years 2007, 2008, 2009, 2010 and 2011. Documentary reference recording of the Office of the Public Prosecutor.
Sweden The Swedish Prosecution Authority www.aklagare.se, National Council for Crime Prevention, Sweden, www.bra.se.
Turkey Ministry of Justice, General Directorate for Criminal Records and Statistics, Judicial Statistics Online: http://www.adlisicil.adalet.gov.tr/en/default.htm, http://www.adlisicil.adalet.gov.tr/istatistik_2010/judicial_statistics_2010.pdf
Ukraine Statistical Records of the General Prosecution Office of Ukraine http://www.gp.gov.ua/ua/stst2011.html?dir_id=104404
UK: England & Wales The above figures are collected through a single national computer system (Compass), and are derived from a related Management Information System capable of inter-relational analyses of the database.
UK: Scotland Input cases: Crown Office and Procurator Fiscal Service Cases brought to court: Scottish Government Criminal Proceedings database, http://www.copfs.gov.uk/About/corporate-info/Caseproclast5.

146

147
3. Conviction Statistics
3.1 General comments 3.1.1 Introduction
The tables in this chapter refer to persons who have been convicted and the sanctions and measures imposed on them. Information is presented on the type of offence for which they were convicted (2007-2011) and the sex, age and nationality of the offender (2010). Information on persons receiving sanctions and measures (2010) and the number of community sanctions and measures imposed looks at minors and all offenders separately for each offence type. However, only a few countries have reported on community sanctions and measures. The unit for the table on sanctions and measures is the person on whom the sanction is imposed, not the sanction itself, which is different from the 4th edition of the Sourcebook. For the tables on community sanctions and measures the unit is again the sanction. Sentence lengths for custodial sentences for each offence type are also presented but only for all offenders and not separately for minors. For 11 countries data is available on the number of offenders that where held in pre-trial detention before their conviction.
Interpretation of such information is more difficult than for police statistics because conviction statistics closely reflect the different criminal justice systems in each country. These differences affect the likelihood that a suspect will appear before a court, the type of court and how this relates to the age of the suspect. Similarly there are differences in recording due to the inclusion or not of all possible convictions (e.g., including guilty pleas at the police/prosecutor stage) and the availability of data. The range of sentencing options for the court may also differ as once again they reflect the criminal code in question. For some countries, for example Greece, short custodial sentences will have automatically been converted to non-custodial alternatives through administrative procedures. These are not shown here as the statistics only reflect the initial court decision.
It is also important to note that the offence for which an offender is convicted may often differ substantially from the initial offence recorded by the police or for which the offender was initially charged. Often at the court stage, an offender may agree to plead guilty to a less serious offence or the prosecutor may decide there is insufficient evidence to convict for the original offence.
For an analysis of crime trends according to conviction statistics see also Aebi & Linde, 2012.31
3.1.2 Offence definitions
The definitions used in the various police statistics presented here show some uniformity between countries. In contrast, those for sanctions/measures often vary substantially in definition as they are based on the judicial system of each country and are entirely dependent on the definitions provided in national penal statutes. For this reason, the breakdown of data in this chapter does not follow that in Chapter 1. Thus ‘burglary’ and ‘car theft’ are often not identified as separate offences, for example in the Netherlands, but are included in the general category ‘theft’. For other offences the scope of the offence may vary: for example, classifying the offence as theft as opposed to theft of a motor vehicle depends on whether the owner was permanently deprived of an article or not.
31 Aebi, M.F. & Linde, A; Conviction Statistics as an Indicator of Crime Trends in Europe from 1990 to 2006. European Journal on Criminal Policy and Research, 18(1): pp 103-144; 2012.

148
3.1.3 Definition of a conviction
When preparing the questionnaire, an attempt was made to provide a definition for a ‘conviction’ of an offender that was acceptable to most criminal justice systems. The need for such a definition was created by the fact that (a) offenders in certain jurisdictions are not always convicted by a court and (b) sanctions/measures may be imposed by another authority (police or prosecutor). Therefore, the definition of ‘persons convicted’ included sanctions/measures imposed by a prosecutor based on an admission of guilt by the defendant. However, this definition did not include cases where (a) a prosecutor imposed sanctions/measures not based on the admission of guilt by the defendant, (b) the sanctions were imposed by the police and (c) other state authorities imposed the sanction/measure. In addition, there is a system of police cautioning or issuing a fixed penalty in many countries (e.g., the United Kingdom) while both the Dutch (the ‘transactie’) and the French have systems for diverting offenders from the courts. These cases are excluded from the convictions statistics. This position is more complex for offences committed by minors which are counted in many different ways for all offence types.
The information presented here cannot therefore be said to give an accurate measure of either how many crimes recorded by the police result in a conviction or how many suspected offenders are convicted, except for the most serious offences, e.g., homicide. However, even in such cases it should be noted that offenders may eventually be convicted for a less serious offence than the one for which they were initially prosecuted by the courts.
The definition of a minor varies. For example, in Germany, ‘minor’ covers all those under 18 years of age when they committed the crime. However for Germany this will also include a proportion of those aged between 18 to 20 years who are also covered by juvenile laws.
3.1.4 Minimum age of conviction
The sentencing options for convicted offenders depend upon their age as well as the scope of juvenile law. Usually the same minimum and maximum age are used as by the police, and is reported in chapter 1. Only 7 countries apply other age brackets, mostly for the minimum age. Below these minimum ages many countries have alternative ways of dealing with minors. In some cases they are offence dependent, with the aim of diverting young offenders from the formal criminal justice system.
3.1.5 Validation checks
Once the term ‘convictions’ had been defined, it was expected that the number of persons convicted would be equal to or less than the number of suspected offenders. Similarly the number of offenders convicted should be equal to the number of persons receiving a sanction or measure. Due to time delays and use of other sources this is not always the case.
Finally the number of custodial sentences given in the sentencing tables should be equal to the totals for which sentence lengths are shown. Some small differences in some countries arose as a result of the different times at which such statistics were recorded.
Although validation checks identified many errors in the figures, and in some cases called for further explanation, it is possible that some errors have gone undetected.
3.1.6 Methodology
Almost all countries apply some form of written rules to regulate the collection of conviction data. This normally includes some form of ‘principal offence rule’ so that an offender convicted at one court appearance for more than one offence will be shown only once in the statistics for each court appearance. However, for a few countries (Armenia, Lithuania and Turkey), no principal offence rule applies and a person convicted for several offences during the same trial

149
will be counted several times in each table. While most countries count the most serious offence, it was often not clear whether they determined the seriousness of the offence based upon a) the nature of the offence, b) the punishment imposed or c) the maximum sentence applicable. If more than one offender participates in committing an offence, then normally each perpetrator will be counted separately in all countries.
There were two different procedures identified with respect to the point at which statistics on court decisions were recorded. Fifteen countries replied that the information they provided was related to the position before any appeal on either the verdict or the sentence. For the remaining eighteen countries supplying data, information was collected only after any such appeals were completed. Variations in the point at which data was collected will affect any comparisons between court statistics.
3.1.7 Results
The tables cover convictions for the period 2007-2011. The commentary draws on the definitional material collected in this survey although a full analysis would require additional research in each country. In some countries limitations on the data available (e.g., type of thefts) reflects the absence of such a breakdown in their criminal code. In addition to the points made earlier, it is important to note the following in the ‘comments’, which show that simple comparisons between convictions rates can be misleading:
- In France it is impossible at this level to discriminate between theft with or without violence. Therefore robbery is included in total for theft.
- In the Netherlands many offenders will receive a sanction or measure from the prosecution. Although technically not a conviction (and therefore not included here) it is a real sanction. The number of convictions is therefore relatively low.
- In Poland, minors are excluded except when they are sentenced after having reached the age for adults.
- For England and Wales, 40% of known offenders were cautioned. Cautions are not included here.
Different migration patterns are reflected in the proportion of aliens among those convicted, with Cyprus, Austria and Spain having the highest proportions. Only eight countries (Austria, Bulgaria, Czech Republic, Finland, Portugal, Slovakia, Spain, and Switzerland) could identify those aliens with EU citizenship. In some countries, it is the ethnic origin of the suspect rather than nationality that is recorded for court decisions. In view of such variations, there is no discussion in this chapter of conviction rates for aliens.
3.1.8 Total crimes
Convictions
Here, as in previous reports, Finland showed a consistently high number of convictions per 100 000 inhabitants (3 851 in 2010). England & Wales also had a high number of convictions (2 461), while Albania (270 in 2010) and Armenia (135 in 2010) had the lowest levels. Many of the differences reflect both the way that major traffic offences and minors are dealt with within the formal criminal justice system and whether they are recorded in the court statistics. Because of the high number of traffic convictions in Finland, when these are excluded the rate in Finland would be the third highest after England & Wales and Turkey. Albania (65%), Kosovo (55%) and Bulgaria (37%) show large increases in the number of convictions, while the Netherlands (24%), Scotland (21%) and Finland (18%) show a decrease.
Wide variations in the percentage of minors measured under total crimes will also be indicative of the number of traffic offences that are included.

150
Sanctions and measures
For all countries, fines were the most frequently used sanction (37% of all sanctions), followed by non-custodial sanctions and measures (25%). The highest proportions of unsuspended custodial sanctions can be found in Bulgaria (57%) and Lithuania (53%).
For minors, non-custodial sanctions were most frequently used (55%).
Community sanctions and measures
Countries varied as the extent to which they used different community sanctions and measures or were able to give figures for the extent to which they did so. In total only 11 countries gave any figures for community measures, although it was not possible to distinguish whether this was because such measures did not exist or the statistics did not distinguish them: 8 countries gave figures on community service: 4 on supervision: 3 on restitution: 4 on ambulant therapeutic treatment and only 2 on probation as a sanction in its own right. When asked to provide figures for each type of offence, even fewer countries could do so. When asked to provide data on minors, only eight countries were able to give any figures on community sanctions and only one was able to say how many minors had been instructed to take part in specific educational measures.
3.1.9 Major traffic offences
Convictions
The number of convictions for major traffic offences varied widely between countries, from very low rates in Armenia and England & Wales (less than 7 per 100 000 population in 2010) to 2 000 and over in Finland. The percentage of those convicted for traffic offences who were minors was below 7% in all countries. The differences may reflect the age at which driving is permitted in each country and the seriousness of offences dealt with by fixed penalties but outside the court system.
Sanctions and measures
Offenders were fined in about half of countries with only 11% sentenced to custody. Bulgaria (37%) and England & Wales (34%) had the highest rates of custody, although this may reflect the more serious nature of offences included.
For minors, the sanctions used in the main were fines (32%) and non-custodial sentences (62%). England & Wales had a relatively high rate of custody at 20%.
3.1.10 Homicide
Convictions
Since the numbers of homicides in most countries are relatively small, conviction rates may fluctuate substantially. Turkey showed the highest levels of total homicide convictions (this included attempted homicide) at 22 per 100 000 population (in 2010), but provided no data for homicides when attempted homicides were excluded. With 3.6 convictions per 100 000 population Kosovo had the highest level for completed homicide. Many countries had conviction rates of about 1 per 100 000 population for completed homicide.
The mean percentage of minors among homicide convictions for all countries was 6%. High proportions were found in Hungary and Kosovo (both 12%). On average 9% of the convicted offenders for homicide were female.

151
Sanctions and measures
For the majority of countries, custody was the main sanction for completed and attempted homicides. Much lower rates for custody in homicides were found in the Croatia and Turkey, where this reflects the use of alternative sanctions.
Minors were mainly sentenced to custody except in Croatia (20%) and Poland (43%).
3.1.11 Assaults
Convictions
Variations in conviction rates for assault have been explained in previous reports by whether less serious assaults are included. In this report, as in the fourth edition, assaults with aggravated bodily injury are shown separately, although in some cases this was not possible (e.g., England and Wales). In 2010 the highest conviction rates for aggravated bodily injury were in Hungary (42 per 100 000), Germany (36) and Scotland (26), while very low rates were recorded in Turkey, Switzerland, Portugal and Poland (under 3). Even lower rates (0.1 to 0.2) could be found in Greece for the period 2007-2009.
In the majority of countries, less than 10% of aggravated assaults were committed by females with Finland (17%) being an exception. The average proportion of minor offenders is 12% with Portugal (47%) and Germany (25%) well above this average.
Sanctions and measures
Custody and suspended custodial sanctions and measures are the main sanctions for aggravated assault, each somewhat over one third of the total convictions. For minors, non-custodial sanctions were the main measure used (about half of the total).
3.1.12 Rape
Convictions
There were wide variations between countries in the rape conviction rate per 100 000 population, possibly reflecting both social as well as criminal justice variations. High levels were recorded in 2010 in Lithuania (6.2), Russia (5.4), and Sweden (3.8). Low levels were recorded in Albania (0.6), Armenia (0.6) and Ireland (0.2). Almost all countries showed a decrease in the period 2007-2011.
About 12% of those convicted were minors, with the highest proportions in Lithuania (20%), Hungary and the Netherlands (both 18%).
Sanctions and measures
The majority (typically more than 80%) of those offenders convicted of rape offences were sentenced to custody. However, custody was used less frequently in Czech Republic (57%), Finland (49%) and Germany (54%).
For minors, custody was the main sanction, followed by suspended sentences. More than half of the offenders were sentenced to custody in Hungary (72%), the Netherlands (71%), Ukraine (89%) and England and Wales (56%).

152
3.1.13 Sexual assaults
Convictions
Unlike for the fourth edition of the Sourcebook, sexual assaults also include rapes. Conviction rates for sexual assault vary from about 1 per 100 000 in Ireland (1.0), Albania (1.1) and Armenia (1.3) to more than 10 in England & Wales (10.5), Turkey (13.1) and France (15.8). Typically about half of the sexual assaults refer to sexual abuse of a child (minor). The highest proportion of minors convicted were in Slovakia (26%) and Hungary (25%).
Sanctions and measures
About half of the sanctions and measures for sexual assault were unsuspended custodial sanctions and measures. For minors non-custodial sanctions and measures were used most often.
3.1.14 Robbery
Convictions
The highest numbers of robbery convictions per 100 000 population were in Serbia (37), Lithuania (34), and Portugal (27) with the lowest rates in Albania (4) and Kosovo (5).
The number of minors convicted for robbery was high compared to other crimes. England & Wales (40%), Hungary (36%), Germany (32%), Sweden and Lithuania (both 31%) were the highest. Only three countries (Cyprus, Greece and Poland) had less than 10% convictions for minors. In Poland this was due to the underreporting of minors in general.
Sanctions and measures
A little over 50% of all offenders received custodial sanctions. However this fell to about one third or lower in Austria, Germany, Portugal and Ukraine. For minors, non-custodial and suspended sentences were the main sanctions used.
3.1.15 Theft
It is important to note that this group includes burglaries, which in countries such as the UK are normally considered separately. Also, it excludes theft with violence (robbery), which in countries such as France are included. The figures here therefore could relate to another range of offences than is often seen in international comparisons of police statistics.
Convictions
The highest rates for theft convictions were found in Finland (715 per 100 000 population), a much higher rate than in the next group with Denmark (326), Sweden (285) and Scotland (255). Very low levels of theft convictions were found in Serbia (18) and Armenia (28). In general, the number of theft convictions has increased over this period in particular in Kosovo, Ukraine, Albania and Denmark.
Wide variations in convictions for minors reflect how the criminal justice system in each country deals with minors. Albania (27%) and Sweden (18%) have the highest proportions of minors. A much higher proportion of theft offenders were female than for most other offences, in particular in Finland (30%), Germany (25%) and Sweden (36%).

153
Sanctions and measures
For thefts, custody was the most frequently applied sanction for offenders followed by suspended sentences. Only Finland, Kosovo and Germany showed a high use of fines, while non-custodial sanctions were applied most frequently in England & Wales and Hungary.
For minors, non-custodial sanctions were mainly used, although Austria (38%) and Turkey (36%) had a high use of custody.
3.1.16 Fraud
Convictions
The highest rates for fraud convictions were found in Germany (123) and Poland (93), with very low levels in Serbia (6), Portugal and Armenia (7). In general there was a decrease in the number of convictions for fraud, with some exceptions (Albania and Denmark).
A very low percentage of fraud offenders were minors, with the exception of Sweden (7%). A relatively high proportion of offenders were females, in particular in Northern Ireland (51%), Germany (33%) and England & Wales (30%).
Sanctions and measures
Suspended sentences were the most frequently used sanctions for fraud offences, with fines being the next most frequent. Bulgaria and Austria have a high use of custody.
The majority (59%) of minors were given non-custodial sanctions.
3.1.17 Money laundering
Convictions
Eighteen countries supplied data. However only Estonia (3.9), Switzerland (3.1) and the Netherlands (2.0) showed any significant level of convictions.
There were very few minors convicted of money laundering. Because of the very small numbers only the percentages of female convictions for Germany (22%), the Netherlands (23%) and Poland (16%) are meaningful.
Sanctions and measures
Again, only in Germany, the Netherlands and Poland are the numbers large enough to give meaningful results on sanctions and measures. In Germany fines were the most used (75%), in the Netherlands custody (48%) and in Poland suspended custodial sanctions and measures (84%). Too few minors were convicted to include any analysis.
3.1.18 Corruption
Convictions
The only countries with a significant level of convictions were Lithuania (9.4), Poland (6.9) and Estonia (4.9).
Only Hungary (4%) had any significant number of minors convicted. Corruption convictions were over 80% males, except in Hungary, Slovakia and Ukraine.

154
Sanctions and measures
Suspended sentences were the most frequent sanctions used, although custody was used in over 40% of cases in Bulgaria, Serbia and Turkey. Again, there were too few minors convicted to allow for analysis.
3.1.19 Drug trafficking
Convictions
The highest conviction rates were found in Finland (64 per 100 000 population) and Switzerland (82). There were sharp rises in convictions in Albania, Lithuania, Poland and Slovakia.
Under 6% of those convicted for drug trafficking were minors. In 10 of the 19 countries where information was available, over 10% of those convicted were female, with the highest proportion in Lithuania (17%).
Sanctions and measures
For the majority of countries custody was the most frequently used sanction for drug trafficking, with the exception of Czech Republic, Finland, Germany and Poland.
Non-custodial sanctions and measures were frequently used for minors.
3.1.20 Attrition
Attrition is defined as:
The “loss” of cases or, more technically, the filtering out of cases during the criminal justice process.
Because the Sourcebook collected data on different aspects of the criminal justice process, this enabled a study of attrition rates in the different countries of Europe. However, to describe attrition exactly it would be necessary to rely on case flow statistics which follows the path of individual cases throughout the system. The ESB survey showed that few such statistics are available and true attrition rates cannot be collected at present. However, the project was able to thoroughly scrutinize the available attrition indicators and assess their quality and usability, taking into account the status quo of attrition research. Full results were reported in Heiskanen et al (2014).32
In summary, twelve possible indicators for attrition on the level of police, prosecution, courts and prisons were identified, differentiating between intra level and inter level indicators. In the end, four indicators were proposed: the rate of offences, suspects, convicted persons and those sentenced to an unsuspended prison sentence. Their relation to each other reflects the different processes of attrition: Suspects per recorded offences (offender ratio), convicted per suspected persons (conviction ratio) and persons sentenced to unsuspended prison sentences per all persons convicted (punitivity ratio).
We show below how the data collected enabled good estimates to be made of the conviction ratio for various countries. Not all countries were able to provide data needed for the calculation of such a ratio. A small number of countries with a conviction ratio over 1.0 were also excluded as this almost certainly meant a statistical misalignment between the definitions for suspects and convictions. Table 3A summarises the information collected for 2011.
32 Heiskanen,M., Aebi,M., van der Brugge, W. And Jehle J-M (eds.) Recording Community Sanctions and Measures and Assessing Attrition A Methodological Study on Comparative Data in Europe, published by HEUNI, 2014.

155
Table 3A Attrition: Examples of conviction ratios for main offence groups: Europe, 2011
Number of countries for
which a conviction ratio was calculated
Low Conviction ratio
Medium Conviction ratio
High Conviction ratio
Intentional homicide 15 0.13(Slovenia) 0.69 (Hungary) 0.96 (Georgia) Total assault 17 0.11 (Portugal) 0.52 (Slovakia) 0.89 (Hungary) Rape 19 0.12 (Netherlands) 0.44 (Czech Rep) 0.93 (Bulgaria) Robbery 18 0.14 (Switzerland) 0.51 (Croatia) 0.93 (Hungary) Total theft 20 0.14 (Austria) 0.50 (Finland) 0,97 (Georgia)

156
3.2 Tables 3.2.1 Total number of convictions per 100 000 population
Table 3.2.1.1 Persons convicted per 100 000 population – Criminal offences: Total
2007 2008 2009 2010 2011
% change 2007-2011
Albania 195 256 240 270 322 65 Armenia 109 ... 111 135 121 11 Austria 521 460 453 458 434 -17 Bulgaria 408 473 537 517 557 37 Croatia 572 566 594 573 549 -4 Cyprus 251 211 221 ... ... ... Czech Republic 736 731 705 672 669 -9 Denmark 895 931 1002 1046 1080 21 Estonia 886 863 ... 681 746 -16 Finland 4580 4487 3876 3851 3776 -18 France 1010 1000 985 971 ... ... Georgia 482 475 419 450 406 -16 Germany 1090 1064 1030 994 988 -9 Greece 402 411 401 370 ... ... Hungary 869 841 866 892 852 -2 Ireland ... ... ... ... ... ... Italy 410 438 428 ... ... ... Kosovo (UNR) 659 616 615 449 1024 55 Latvia ... ... ... ... ... ... Lithuania 415 425 438 471 505 22 Malta ... ... ... ... ... ... Netherlands 720 709 700 578 549 -24 Poland 1118 1104 1089 1134 1099 -2 Portugal 797 843 748 747 755 -5 Serbia 550 602 583 319 455 -17 Slovakia 502 531 582 575 558 11 Slovenia 455 459 416 411 389 -15 Spain 362 456 484 468 480 33 Sweden 1373 1465 1530 1479 1448 5 Switzerland 1197 1300 132 1340 1265 6 Turkey 1530 1198 1804 1673 1683 10 Ukraine 329 318 318 369 337 3 UK: E & W 2604 2489 2552 2461 2303 -12 UK: N. Ireland 1798 1624 ... ... ... ... UK: Scotland 1518 1443 1323 1252 1205 -21 Mean 917 929 839 883 909
Median 690 709 589 578 669 Minimum 109 211 111 135 121 Maximum 4580 4487 3876 3851 3776

157
Table 3.2.1.2 Persons convicted per 100 000 population – Criminal offences: Major traffic offences
2007 2008 2009 2010 2011
% change 2007-2011
Albania 13 17 21 26 27 110 Armenia 6 ... 3 4 3 -44 Austria ... ... ... ... ... ... Bulgaria 88 154 182 150 144 64 Croatia 47 47 47 42 37 -20 Cyprus ... ... ... ... ... ... Czech Republic ... ... ... ... ... ... Denmark ... ... ... ... ... ... Estonia 266 ... ... 204 248 -7 Finland 3092 2882 2391 2221 2222 -28 France 431 417 420 416 ... ... Georgia 25 20 20 25 22 -10 Germany 257 249 229 213 210 -18 Greece 130 145 138 ... ... ... Hungary 14 12 12 10 8 -41 Ireland 373 311 257 198 ... ... Italy ... ... ... ... ... ... Kosovo (UNR) 69 74 75 61 146 113 Latvia ... ... ... ... ... ... Lithuania 16 19 17 13 11 -34 Malta ... ... ... ... ... ... Netherlands 167 153 167 106 76 -54 Poland 393 355 359 354 360 -8 Portugal 393 405 345 337 321 -18 Serbia 74 85 83 42 52 -30 Slovakia 51 58 57 49 47 -7 Slovenia 23 19 18 18 15 -32 Spain ... ... ... ... ... ... Sweden 306 319 318 299 303 -1 Switzerland 677 743 731 747 672 -1 Turkey 22 25 10 8 ... ... Ukraine 18 18 17 15 12 -32 UK: E & W 10 8 7 6 6 -44 UK: N. Ireland 194 158 ... ... ... ... UK: Scotland 222 197 165 137 132 -41 Mean 273 276 244 228 231
Median 88 145 83 61 64 Minimum 6 8 3 4 3 Maximum 3092 2882 2391 2221 2222
Notes on table 3.2.1.2:
Bulgaria: The number of convicted persons for major traffic offences is much higher than in the fourth edition because the statistics now include all traffic offences. UK: Northern Ireland: Major traffic offences include motoring offences causing death or grievous bodily injury.

158
Table 3.2.1.3 Persons convicted per 100 000 population – Intentional homicide: Total
2007 2008 2009 2010 2011
% change 2007-2011
Albania 6.2 6.8 6.4 5.7 7.5 22 Armenia 2.2 ... 1.9 2.5 1.7 -22 Austria 0.8 0.6 0.6 0.6 0.8 -3 Bulgaria 3.5 2.5 2.0 2.1 2.0 -43 Croatia 3.7 3.1 3.9 3.1 3.4 -8 Cyprus 2.1 1.0 1.4 ... ... ... Czech Republic 1.1 1.3 1.1 1.0 1.2 7 Denmark 0.5 0.7 1.1 1.3 0.8 52 Estonia 3.7 ... ... 3.5 1.8 -52 Finland 3.5 4.0 3.5 3.4 3.6 2 France 1.2 1.0 1.0 1.0 ... ... Georgia 12.9 11.3 8.9 9.1 7.9 -39 Germany 0.9 0.9 0.8 0.8 0.8 -19 Greece 0.3 0.2 0.2 ... ... ... Hungary 2.3 2.1 2.6 2.2 2.0 -14 Ireland 1.0 0.5 0.4 0.1 ... ... Italy 1.9 1.7 2.0 ... ... ... Kosovo (UNR) 5.5 5.3 6.3 5.8 9.0 64 Latvia ... ... ... ... ... ... Lithuania 6.2 8.2 6.7 6.9 7.1 14 Malta ... ... 1.0 1.9 1.9 ... Netherlands 5.7 6.1 5.0 5.0 4.5 -21 Poland 1.5 2.0 2.0 2.0 1.8 21 Portugal 2.8 2.4 2.9 2.5 2.8 -1 Serbia 2.5 2.7 2.8 2.5 2.9 16 Slovakia 1.4 1.0 0.9 1.1 0.8 -45 Slovenia 1.5 1.4 1.0 0.4 0.3 -77 Spain ... ... ... ... ... ... Sweden 1.7 1.6 1.6 1.8 1.4 -15 Switzerland 1.3 1.4 1.3 1.1 0.9 -33 Turkey 16.3 14.5 21.0 21.9 ... ... Ukraine 4.9 3.9 4.0 4.0 3.0 -39 UK: E & W 2.7 2.8 2.7 2.9 2.7 -1 UK: N. Ireland 1.7 1.4 ... ... ... ... UK: Scotland 3.3 3.0 2.8 2.7 2.9 -12 Mean 3.3 3.2 3.2 3.4 2.9
Median 2.3 2.1 2.0 2.5 2.0 Minimum 0.3 0.2 0.2 0.1 0.3 Maximum 16.3 14.5 21.0 21.9 9.0
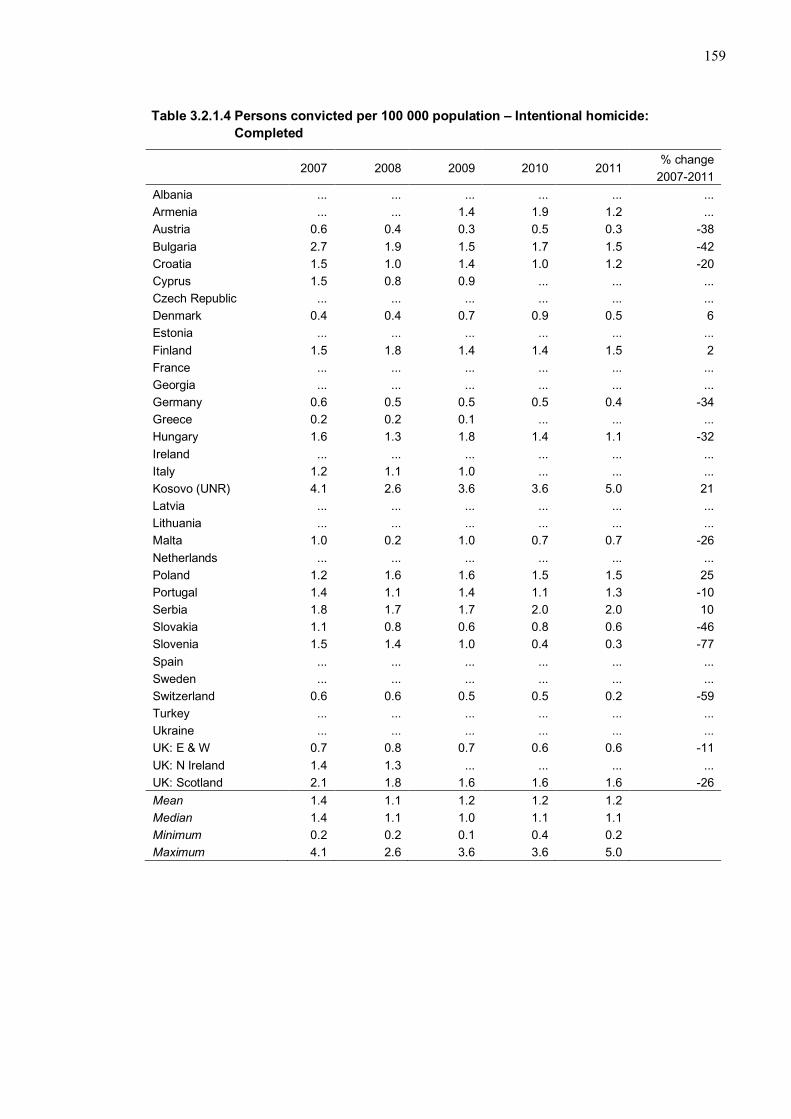
159
Table 3.2.1.4 Persons convicted per 100 000 population – Intentional homicide: Completed
2007 2008 2009 2010 2011
% change 2007-2011
Albania ... ... ... ... ... ... Armenia ... ... 1.4 1.9 1.2 ... Austria 0.6 0.4 0.3 0.5 0.3 -38 Bulgaria 2.7 1.9 1.5 1.7 1.5 -42 Croatia 1.5 1.0 1.4 1.0 1.2 -20 Cyprus 1.5 0.8 0.9 ... ... ... Czech Republic ... ... ... ... ... ... Denmark 0.4 0.4 0.7 0.9 0.5 6 Estonia ... ... ... ... ... ... Finland 1.5 1.8 1.4 1.4 1.5 2 France ... ... ... ... ... ... Georgia ... ... ... ... ... ... Germany 0.6 0.5 0.5 0.5 0.4 -34 Greece 0.2 0.2 0.1 ... ... ... Hungary 1.6 1.3 1.8 1.4 1.1 -32 Ireland ... ... ... ... ... ... Italy 1.2 1.1 1.0 ... ... ... Kosovo (UNR) 4.1 2.6 3.6 3.6 5.0 21 Latvia ... ... ... ... ... ... Lithuania ... ... ... ... ... ... Malta 1.0 0.2 1.0 0.7 0.7 -26 Netherlands ... ... ... ... ... ... Poland 1.2 1.6 1.6 1.5 1.5 25 Portugal 1.4 1.1 1.4 1.1 1.3 -10 Serbia 1.8 1.7 1.7 2.0 2.0 10 Slovakia 1.1 0.8 0.6 0.8 0.6 -46 Slovenia 1.5 1.4 1.0 0.4 0.3 -77 Spain ... ... ... ... ... ... Sweden ... ... ... ... ... ... Switzerland 0.6 0.6 0.5 0.5 0.2 -59 Turkey ... ... ... ... ... ... Ukraine ... ... ... ... ... ... UK: E & W 0.7 0.8 0.7 0.6 0.6 -11 UK: N Ireland 1.4 1.3 ... ... ... ... UK: Scotland 2.1 1.8 1.6 1.6 1.6 -26 Mean 1.4 1.1 1.2 1.2 1.2
Median 1.4 1.1 1.0 1.1 1.1 Minimum 0.2 0.2 0.1 0.4 0.2 Maximum 4.1 2.6 3.6 3.6 5.0

160
Table 3.2.1.5 Persons convicted per 100 000 population – Bodily injury (Assault): Total
2007 2008 2009 2010 2011
% change 2007-2011
Albania 9 13 13 16 22 142 Armenia ... ... 6 7 6 ... Austria 75 76 73 72 67 -10 Bulgaria 13 15 16 15 14 7 Croatia 24 27 30 25 23 -4 Cyprus 10 10 8 ... ... ... Czech Republic 23 28 26 26 26 11 Denmark 106 106 106 112 104 -2 Estonia 94 ... ... 87 96 2 Finland 198 217 196 192 199 1 France 110 113 111 109 ... ... Georgia ... ... ... ... ... ... Germany 102 103 103 97 94 -7 Greece 14 14 15 ... ... ... Hungary 51 53 52 55 51 -1 Ireland 57 44 39 25 ... ... Italy 13 14 14 ... ... ... Kosovo (UNR) 70 75 85 60 142 103 Latvia ... ... ... ... ... ... Lithuania 38 41 41 40 43 13 Malta ... ... ... ... ... ... Netherlands 83 89 88 71 72 -14 Poland 95 101 94 90 87 -8 Portugal 72 71 67 68 67 -7 Serbia 42 45 39 18 28 -34 Slovakia 26 29 24 26 21 -18 Slovenia 37 38 35 30 32 -15 Spain ... ... ... ... ... ... Sweden 99 108 100 102 100 0 Switzerland 31 36 36 36 34 12 Turkey 181 137 179 146 ... ... UK: E & W 74 72 75 77 71 -4 UK: N. Ireland 45 46 ... ... ... ... UK: Scotland 336 328 304 293 294 -12 Ukraine 22 20 19 19 ... ... Mean 72 71 69 71 74
Median 54 46 41 60 67 Minimum 9 10 6 7 6 Maximum 336 328 304 293 294
Notes on table 3.2.1.5:
Bulgaria: The number of convicted persons for bodily injury in 2007 is higher than the same number in the fourth edition because it includes also assaults only causing pain, slapping and punching (excluded in the fourth edition).

161
Table 3.2.1.6 Persons convicted per 100 000 population – Bodily injury (Assault): Aggravated bodily injury
2007 2008 2009 2010 2011
% change 2007-2011
Albania 2.4 2.8 3.0 3.8 4.3 79 Armenia 4.0 ... 4.0 4.6 3.4 -15 Austria 15.4 16.6 16.2 15.5 14.0 -9 Bulgaria ... ... ... ... ... ... Croatia 14.4 15.2 17.2 13.4 12.9 -11 Cyprus 7.1 8.1 5.9 ... ... ... Czech Republic 3.8 4.3 4.1 3.9 4.6 21 Denmark 15.3 16.2 16.5 16.4 16.3 7 Estonia 5.5 ... ... 4.8 4.4 -20 Finland 12.8 14.2 13.6 12.1 12.2 -5 France 14.8 14.5 13.9 13.9 ... ... Georgia 2.8 3.9 2.6 3.6 2.3 -17 Germany 40.4 41.3 40.0 36.4 34.7 -14 Greece 0.1 0.1 0.2 ... ... ... Hungary 37.3 37.9 38.3 42.3 33.9 -9 Ireland 23.8 18.4 15.8 8.3 ... ... Italy ... ... ... ... ... ... Kosovo (UNR) 6.8 6.2 6.1 4.9 10.0 48 Latvia ... ... ... ... ... ... Lithuania 6.9 8.1 7.4 6.8 7.1 2 Malta ... ... ... ... ... ... Netherlands 14.6 13.8 12.3 10.3 9.8 -33 Poland 2.9 3.1 3.0 2.8 2.7 -6 Portugal 5.9 4.9 3.0 2.7 2.6 -56 Serbia 15.3 15.3 13.0 7.6 11.0 -28 Slovakia ... ... ... ... ... ... Slovenia 8.4 8.9 7.5 4.7 4.5 -46 Spain ... ... ... ... ... ... Sweden 9.6 10.4 8.8 8.7 7.9 -17 Switzerland 1.5 2.1 2.0 2.4 2.0 35 Turkey 3.8 3.5 2.8 2.2 ... ... Ukraine 9.0 8.2 8.1 7.1 6.6 -27 UK: E & W ... ... ... ... ... ... UK: N. Ireland 3.2 2.8 ... ... ... ... UK: Scotland 32.5 31.8 27.9 25.9 24.3 -25 Mean 11.4 12.0 11.3 10.6 10.5
Median 7.7 8.5 7.8 7.1 7.5 Minimum 0.1 0.1 0.2 2.2 2.0 Maximum 40.4 41.3 40.0 42.3 34.7

162
Table 3.2.1.7 Persons convicted per 100 000 population – Sexual assault: Total
2007 2008 2009 2010 2011
% change 2007-2011
Albania 1.1 1.0 0.9 1.1 0.7 -38 Armenia ... ... 0.6 1.3 0.9 ... Austria 4.4 3.5 3.7 4.0 3.8 -14 Bulgaria 5.8 4.6 4.5 3.5 2.9 -49 Croatia 5.3 5.3 6.2 5.4 5.0 -6 Cyprus 3.6 3.2 1.4 ... ... ... Czech Republic 4.4 4.8 4.9 5.0 4.6 5 Denmark 4.9 4.8 5.9 5.6 4.9 0 Estonia ... ... ... 5.1 3.9 ... Finland 10.6 10.0 9.3 8.6 9.4 -11 France 18.6 18.2 17.2 15.8 ... ... Georgia ... ... ... ... ... ... Germany 5.7 5.4 4.9 4.7 4.3 -24 Greece 0.4 0.4 0.4 ... ... ... Hungary 3.6 3.1 3.3 3.3 3.7 2 Ireland 3.5 2.7 1.7 1.0 ... ... Italy 2.7 2.6 3.6 ... ... ... Kosovo (UNR) 3.5 2.4 2.4 3.3 3.5 0 Latvia ... ... ... ... ... ... Lithuania 6.4 6.1 6.2 7.0 9.3 44 Malta ... ... ... ... ... ... Netherlands 7.2 6.2 5.0 4.8 4.1 -43 Poland 4.1 4.7 4.5 4.1 3.8 -7 Portugal 3.9 3.8 4.3 4.7 4.9 28 Serbia 3.3 3.9 3.8 2.5 3.1 -6 Slovakia 4.5 4.3 4.9 4.6 4.8 6 Slovenia 6.2 5.6 4.6 5.1 4.2 -31 Spain ... ... ... ... ... ... Sweden 5.1 5.8 5.6 5.2 5.0 -3 Switzerland 7.7 8.1 7.8 7.0 5.2 -33 Turkey 13.0 12.5 12.9 13.1 ... ... Ukraine ... ... ... ... ... ... UK: E & W 9.4 9.4 9.3 10.5 10.6 13 UK: N. Ireland 6.8 7.4 ... ... ... ... UK: Scotland 3.1 3.1 3.4 2.0 1.5 -51 Mean 5.7 5.5 5.1 5.3 4.5
Median 4.7 4.7 4.6 4.8 4.2 Minimum 0.4 0.4 0.4 1.0 0.7 Maximum 18.6 18.2 17.2 15.8 10.6
Notes on table 3.2.1.7 UK: England & Wales: Sexual assault refers to all sexual offences.

163
Table 3.2.1.8 Persons convicted per 100 000 population – Sexual assault: Rape
2007 2008 2009 2010 2011
% change 2007-2011
Albania 0.6 0.6 0.5 0.6 0.3 -47 Armenia 0.3 ... 0.5 0.6 0.2 -28 Austria 2.1 1.4 1.8 2.0 1.8 -15 Bulgaria 3.4 2.5 2.3 2.0 1.2 -65 Croatia 2.5 2.3 2.8 2.2 1.8 -28 Cyprus 0.6 0.5 0.5 ... ... ... Czech Republic 1.5 1.5 1.6 1.7 1.7 16 Denmark 1.8 1.6 1.8 1.6 1.9 4 Estonia 2.0 ... ... 2.2 1.3 -37 Finland 2.0 2.1 2.2 1.8 2.4 22 France 2.6 2.3 2.2 2.1 ... ... Georgia 1.5 1.8 0.9 1.0 0.6 -61 Germany 1.4 1.3 1.1 1.1 0.9 -35 Greece 0.2 0.1 0.2 ... ... ... Hungary 0.8 0.8 0.9 1.0 0.8 -3 Ireland 1.1 0.8 0.3 0.2 ... ... Italy ... ... ... ... ... ... Kosovo (UNR) 0.6 0.6 0.8 0.9 1.1 73 Latvia ... ... ... ... ... ... Lithuania 6.0 5.5 5.7 6.2 8.7 44 Malta ... ... ... ... ... ... Netherlands 1.4 1.1 0.9 0.8 0.6 -54 Poland 2.3 2.5 2.5 2.2 2.0 -13 Portugal 0.6 0.9 0.5 0.7 0.9 39 Serbia 1.0 1.3 1.2 0.9 0.9 -12 Slovakia 0.9 0.8 0.7 0.7 0.6 -38 Slovenia 1.7 1.0 1.0 0.8 0.7 -58 Spain ... ... ... ... ... ... Sweden 4.0 4.6 4.4 3.8 3.5 -13 Switzerland 1.8 1.8 1.6 1.6 1.0 -46 Turkey ... ... ... ... ... ... Ukraine 1.1 1.0 1.0 1.0 0.8 -32 UK: E & W 1.6 1.7 1.8 1.9 2.1 27 UK: N. Ireland 0.9 0.9 ... ... ... ... UK: Scotland 1.0 0.8 1.0 0.7 0.7 -26 Mean 1.8 1.7 1.7 1.7 1.5
Median 1.5 1.3 1.1 1.3 1.0 Minimum 0.2 0.1 0.2 0.2 0.2 Maximum 6.9 6.1 5.7 6.2 8.7

164
Table 3.2.1.9 Persons convicted per 100 000 population – Sexual assault: Sexual abuse of a child
2007 2008 2009 2010 2011
% change 2007-2011
Albania 0.5 0.5 0.4 0.5 0.4 -28 Armenia ... ... 0.1 0.6 0.4 ... Austria 2.0 1.8 1.6 1.8 1.8 -10 Bulgaria ... ... ... ... ... ... Croatia 2.0 2.1 2.1 2.2 2.2 11 Cyprus 2.8 1.8 0.4 ... ... ... Czech Republic 2.9 3.4 3.3 3.3 2.9 -3 Denmark 1.9 2.1 2.8 2.5 2.2 12 Estonia 0.5 ... ... 1.1 1.0 100 Finland 5.2 6.0 5.2 5.6 5.1 -1 France 5.5 5.4 5.3 4.9 ... ... Georgia ... ... ... ... ... ... Germany 2.5 2.5 2.3 2.2 2.2 -15 Greece 0.1 0.2 0.1 ... ... ... Hungary 0.9 0.9 0.9 0.8 0.8 -11 Ireland 0.3 0.2 0.2 0.0 ... ... Italy 0.3 0.3 0.4 ... ... ... Kosovo (UNR) 1.2 0.9 1.1 1.4 1.8 46 Latvia ... ... ... ... ... ... Lithuania 0.4 0.5 0.4 0.6 1.4 233 Malta ... ... ... ... ... ... Netherlands 2.1 1.7 1.3 1.4 1.1 -45 Poland 1.7 2.1 2.0 1.9 1.8 1 Portugal 1.9 2.0 2.1 2.4 2.2 17 Serbia 0.5 0.5 0.5 0.2 0.4 -24 Slovakia 3.1 2.9 3.5 3.6 3.8 22 Slovenia 3.0 3.5 2.2 2.7 2.4 -20 Spain ... ... ... ... ... ... Sweden 0.9 1.0 1.0 1.2 1.4 53 Switzerland 5.1 5.5 5.0 4.3 3.3 -35 Turkey 2.9 3.2 5.2 6.4 ... ... Ukraine ... 0.1 0.1 0.1 0.1 ... UK: E & W 5.2 5.9 6.0 6.8 6.9 33 UK: N. Ireland 1.6 2.1 ... ... ... ... UK: Scotland 1.9 1.9 2.0 1.2 0.6 -66 Mean 2.1 2.2 2.1 2.3 2.0
Median 1.9 1.9 1.8 1.9 1.8 Minimum 0.1 0.1 0.1 0.0 0.1 Maximum 5.5 6.0 6.0 6.8 6.9
Notes on table 3.2.1.9:
Lithuania: Sexual abuse of a child in 2007-2010 refers to sexual abuse of a child under 14 years of age. In 2011, sexual abuse of a child refers to two crimes: sexual abuse of a child under 14 years of age and satisfaction of sexual desires in violation of a minor's sexual self-determination, and/or integrity.

165
Table 3.2.1.10 Persons convicted per 100 000 population – Robbery: Total
2007 2008 2009 2010 2011
% change 2007-2011
Albania 3 3 3 4 5 60 Armenia 4 ... 4 6 4 -1 Austria 10 9 9 11 9 -9 Bulgaria 18 15 19 18 18 0 Croatia 10 10 11 12 10 -5 Cyprus 4 1 2 ... ... ... Czech Republic 14 13 13 14 13 -6 Denmark 6 7 8 8 6 11 Estonia 27 ... ... 22 19 -31 Finland 11 10 10 10 10 -3 France ... ... ... ... ... ... Georgia 33 28 21 17 12 -63 Germany 13 12 12 12 12 -10 Greece 2 1 2 ... ... ... Hungary 14 15 17 17 15 7 Ireland 13 11 11 8 ... ... Italy 12 12 14 ... ... ... Kosovo (UNR) 3 5 4 5 9 206 Latvia ... ... ... ... ... ... Lithuania 41 41 39 34 32 -23 Malta ... ... ... ... ... ... Netherlands 18 16 16 16 16 -10 Poland 22 24 23 23 21 -7 Portugal 25 29 27 27 30 20 Serbia 55 67 69 37 52 -7 Slovakia 12 11 12 11 9 -25 Slovenia 6 8 6 7 7 21 Spain ... ... ... ... ... ... Sweden 9 10 11 11 10 11 Switzerland 7 7 7 8 5 -23 Turkey 17 14 25 22 ... ... Ukraine 31 27 27 25 21 -32 UK: E & W 16 16 16 15 16 1 UK: N. Ireland 8 7 ... ... ... ... UK: Scotland 11 11 10 10 11 5 Mean 15 15 15 15 15
Median 12 11 12 12 12 Minimum 2 1 2 4 4 Maximum 55 67 69 37 52
Notes on table 3.2.1.10
France: Data are not available at the conviction level because some aggravated thefts include violence. Offences are differentiated according to the number of aggravating factors. Therefore theft with violence is included in the total for Theft instead.

166
Table 3.2.1.11 Persons convicted per 100 000 population – Theft: Total
2007 2008 2009 2010 2011
% change 2007-2011
Albania 39 46 41 55 65 68 Armenia 27 ... 22 28 24 -10 Austria 104 93 97 95 87 -16 Bulgaria 154 163 167 163 201 30 Croatia 113 113 102 117 121 7 Cyprus 73 60 52 ... ... ... Czech Republic 133 152 147 148 154 16 Denmark 243 264 310 326 334 37 Estonia 172 186 ... 195 214 24 Finland 640 668 676 715 625 -2 France 142 136 129 129 ... ... Georgia 89 92 76 86 91 2 Germany 181 175 173 168 168 -7 Greece 16 15 14 ... ... ... Hungary 203 196 206 226 213 5 Ireland 257 266 251 219 ... ... Italy 55 59 49 ... ... ... Kosovo (UNR) 84 83 94 85 221 162 Latvia ... ... ... ... ... ... Lithuania 162 160 178 167 176 9 Malta ... ... ... ... ... ... Netherlands 135 134 134 130 138 3 Poland 147 143 138 156 165 12 Portugal 50 57 54 55 61 23 Serbia 33 33 31 18 28 -15 Slovakia 114 99 135 144 140 22 Slovenia 108 111 104 94 84 -22 Spain ... ... ... ... ... ... Sweden 255 271 306 284 274 7 Switzerland 95 100 108 111 118 23 Turkey 172 121 154 149 ... ... Ukraine 71 63 71 133 130 84 UK: E & W 196 204 204 220 214 9 UK: N. Ireland 124 122 ... ... ... ... UK: Scotland 295 285 263 255 242 -18 Mean 146 151 149 167 172
Median 128 122 131 146 154 Minimum 16 15 14 18 24 Maximum 640 668 676 715 625

167
Table 3.2.1.12 Persons convicted per 100 000 population – Theft: Theft of a motor vehicle
2007 2008 2009 2010 2011
% change 2007-2011
Albania ... ... ... ... ... ... Armenia ... ... 0.4 0.1 0.2 ... Austria ... ... ... ... ... ... Bulgaria 4.3 3.9 4.8 4.2 3.6 -18 Croatia 2.4 2.6 3.3 2.3 2.5 4 Cyprus ... ... ... ... ... ... Czech Republic ... ... ... ... ... ... Denmark 13.1 12.8 14.8 16.1 14.8 13 Estonia ... ... ... ... ... ... Finland 12.8 12.5 12.2 10.6 9.2 -28 France ... ... ... ... ... ... Georgia ... ... ... ... ... ... Germany ... ... ... ... ... ... Greece ... 0.0 0.0 ... ... ... Hungary 7.6 6.9 6.6 6.1 4.4 -43 Ireland 25.6 22.4 20.6 17.2 ... ... Italy ... ... ... ... ... ... Kosovo (UNR) ... ... ... ... ... ... Latvia ... ... ... ... ... ... Lithuania ... ... ... ... ... ... Malta ... ... ... ... ... ... Netherlands ... ... ... ... ... ... Poland ... ... ... ... ... ... Portugal 1.7 1.9 1.9 1.8 1.5 -10 Serbia ... ... ... ... ... ... Slovakia 1.1 0.8 0.7 0.4 0.7 -38 Slovenia ... ... ... ... ... ... Spain ... ... ... ... ... ... Sweden 11.7 10.9 8.9 6.1 5.9 -49 Switzerland ... ... ... ... ... ... Turkey ... ... ... ... ... ... Ukraine 7.5 6.7 6.4 5.9 4.7 -37 UK: E & W 6.8 5.4 4.7 3.8 3.9 -44 UK: N. Ireland 9.9 10.2 ... ... ... ... UK: Scotland 15.1 14.2 11.0 9.3 8.6 -43 Mean 9.2 7.9 6.9 6.4 5.0
Median 7.6 6.8 5.6 5.9 4.1 Minimum 1.1 0.0 0.0 0.1 0.2 Maximum 25.6 22.4 20.6 17.2 14.8

168
Table 3.2.1.13 Persons convicted per 100 000 population – (Theft) Burglary: Total
2007 2008 2009 2010 2011
% change 2007-2011
Albania ... ... ... ... ... ... Armenia ... ... ... ... ... ... Austria 19 18 29 18 15 -18 Bulgaria ... ... ... ... ... ... Croatia 61 59 58 65 64 5 Cyprus 44 38 29 ... ... ... Czech Republic ... ... ... ... ... ... Denmark 29 31 35 42 42 48 Estonia ... ... ... ... ... ... Finland ... ... ... ... ... ... France ... ... ... ... ... ... Georgia ... ... ... ... ... ... Germany 22 21 20 19 18 -16 Greece ... ... ... ... ... ... Hungary ... ... ... ... ... ... Ireland 59 64 63 51 ... ... Italy ... ... ... ... ... ... Kosovo (UNR) 44 41 31 21 46 4 Latvia ... ... ... ... ... ... Lithuania ... ... ... ... ... ... Malta ... ... ... ... ... ... Netherlands 75 73 69 65 66 -11 Poland 44 43 41 48 51 15 Portugal 2 2 3 3 3 52 Serbia ... ... ... ... ... ... Slovakia 34 34 35 39 39 13 Slovenia 37 43 42 38 29 -21 Spain ... ... ... ... ... ... Sweden ... ... ... ... ... ... Switzerland ... ... ... ... ... ... Turkey ... ... ... ... ... ... Ukraine ... ... ... ... ... ... UK: E & W 44 44 42 43 45 1 UK: N. Ireland 26 30 ... ... ... ... UK: Scotland 36 36 31 29 28 -22 Mean 38 38 38 37 37
Median 37 38 35 39 40 Minimum 2 2 3 3 3 Maximum 75 73 69 65 66

169
Table 3.2.1.14 Persons convicted per 100 000 population – (Theft) Burglary: Domestic burglary
2007 2008 2009 2010 2011
% change 2007-2011
Denmark 13 14 17 19 21 63
Germany 3 3 3 3 3 -5 Portugal 1 1 1 1 1 86
Slovakia 7 6 5 5 5 -30
Ukraine 37 30 32 57 56 52 UK: E & W 24 25 24 26 26 6
UK: N. Ireland 15 ... ... ... ... ...
Mean 14 13 14 19 19 Median 13 10 11 12 13
Minimum 1 1 1 1 1
Maximum 37 30 32 57 56
Notes on table 3.2.1.14:
UK: England & Wales: Burglary is not a subset of Theft, it is a stand-alone category. UK: Northern Ireland: Those offences which in their definition refer to burglary in a dwelling. UK: Scotland: Domestic burglary is not separately identifiable from other types of burglary.
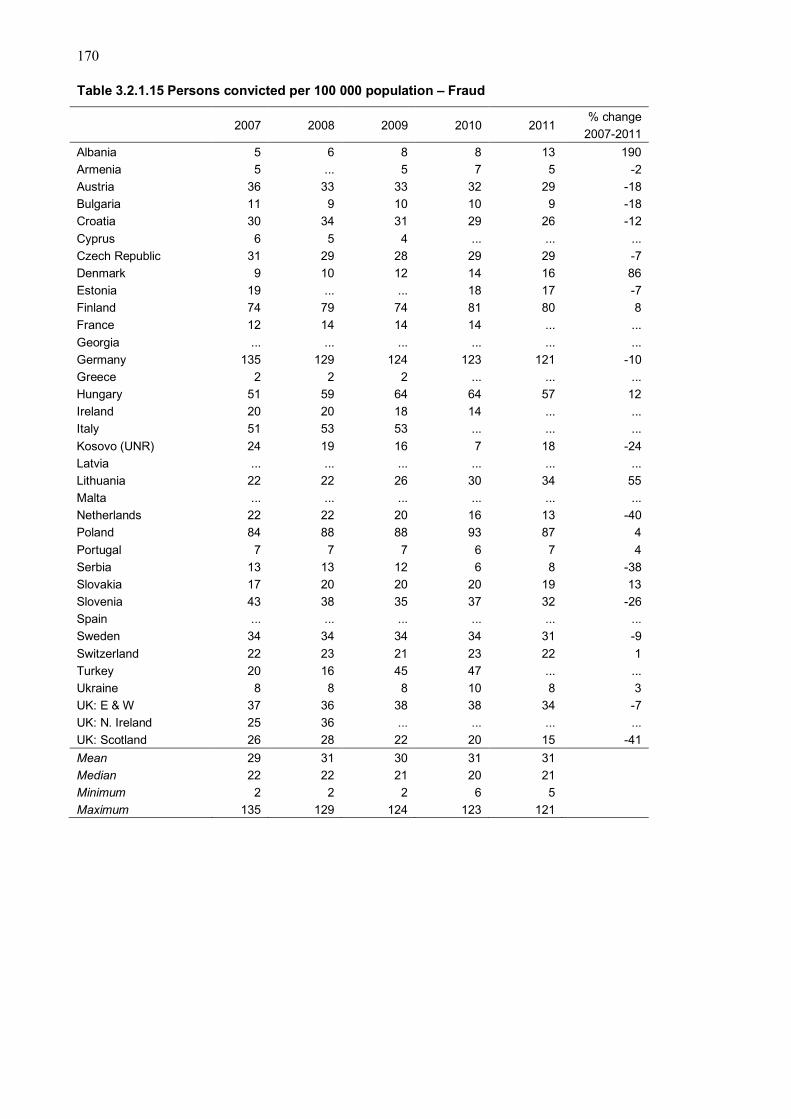
170
Table 3.2.1.15 Persons convicted per 100 000 population – Fraud
2007 2008 2009 2010 2011
% change 2007-2011
Albania 5 6 8 8 13 190 Armenia 5 ... 5 7 5 -2 Austria 36 33 33 32 29 -18 Bulgaria 11 9 10 10 9 -18 Croatia 30 34 31 29 26 -12 Cyprus 6 5 4 ... ... ... Czech Republic 31 29 28 29 29 -7 Denmark 9 10 12 14 16 86 Estonia 19 ... ... 18 17 -7 Finland 74 79 74 81 80 8 France 12 14 14 14 ... ... Georgia ... ... ... ... ... ... Germany 135 129 124 123 121 -10 Greece 2 2 2 ... ... ... Hungary 51 59 64 64 57 12 Ireland 20 20 18 14 ... ... Italy 51 53 53 ... ... ... Kosovo (UNR) 24 19 16 7 18 -24 Latvia ... ... ... ... ... ... Lithuania 22 22 26 30 34 55 Malta ... ... ... ... ... ... Netherlands 22 22 20 16 13 -40 Poland 84 88 88 93 87 4 Portugal 7 7 7 6 7 4 Serbia 13 13 12 6 8 -38 Slovakia 17 20 20 20 19 13 Slovenia 43 38 35 37 32 -26 Spain ... ... ... ... ... ... Sweden 34 34 34 34 31 -9 Switzerland 22 23 21 23 22 1 Turkey 20 16 45 47 ... ... Ukraine 8 8 8 10 8 3 UK: E & W 37 36 38 38 34 -7 UK: N. Ireland 25 36 ... ... ... ... UK: Scotland 26 28 22 20 15 -41 Mean 29 31 30 31 31
Median 22 22 21 20 21 Minimum 2 2 2 6 5 Maximum 135 129 124 123 121

171
Table 3.2.1.16 Persons convicted per 100 000 population – Money laundering
2007 2008 2009 2010 2011
% change 2007-2011
Albania 0.2 0.0 0.6 0.4 0.4 123 Armenia ... ... 0.0 0.0 0.0 ... Austria 0.2 0.1 0.1 0.1 0.1 -58 Bulgaria ... ... ... ... ... ... Croatia ... ... ... ... ... ... Cyprus ... ... ... ... ... ... Czech Republic 0.0 0.0 0.2 0.0 0.2 538 Denmark ... ... ... ... ... ... Estonia 0.7 ... ... 3.9 4.6 521 Finland 0.3 0.5 0.4 0.4 0.7 162 France ... ... ... ... ... ... Georgia ... ... ... ... ... ... Germany 0.7 0.7 0.5 0.9 1.1 51 Greece ... ... ... ... ... ... Hungary ... ... ... ... 0.2 ... Ireland 0.1 0.1 0.0 0.0 ... ... Italy ... ... ... ... ... ... Kosovo (UNR) ... ... ... 0.0 ... ... Latvia ... ... ... ... ... ... Lithuania 0.3 0.0 0.0 0.0 0.3 23 Malta ... ... ... ... ... ... Netherlands 1.4 1.9 1.9 2.0 2.0 48 Poland 0.2 0.3 0.2 0.4 0.3 61 Portugal 0.0 0.1 0.1 0.1 0.1 40 Serbia 0.0 0.1 0.1 0.0 0.0 205 Slovakia 0.1 0.2 0.1 0.2 0.2 43 Slovenia 0.0 0.0 0.0 0.0 0.0 ... Spain ... ... ... ... ... ... Sweden 0.2 1.1 0.5 0.4 1.1 404 Switzerland 2.1 2.6 2.4 3.1 2.2 2 Turkey ... ... ... ... ... ... Ukraine 0.1 0.1 0.1 0.1 0.1 10 UK: E & W ... ... ... ... ... ... UK: N. Ireland ... ... ... ... ... ... UK: Scotland 0.0 0.0 0.0 0.0 0.0 ... Mean 0.4 0.5 0.4 0.6 0.7
Median 0.2 0.1 0.1 0.1 0.2 Minimum 0.0 0.0 0.0 0.0 0.0 Maximum 2.1 2.6 2.4 3.9 4.6

172
Table 3.2.1.17 Persons convicted per 100 000 population – Corruption
2007 2008 2009 2010 2011
% change 2007-2011
Albania 0.7 1.1 0.9 1.5 1.7 132 Armenia 0.3 ... 2.2 1.4 1.1 223 Austria 1.1 0.7 0.5 0.8 1.1 1 Bulgaria 1.2 1.1 1.7 1.8 1.5 23 Croatia 1.3 1.3 1.5 1.5 1.5 22 Cyprus 0.5 0.3 0.0 ... ... ... Czech Republic 1.0 0.9 0.7 0.7 1.0 -2 Denmark 0.0 0.1 0.1 0.0 0.0 96 Estonia 4.0 ... ... 4.9 3.1 -24 Finland 0.2 0.1 0.1 0.1 0.0 -80 France 0.4 0.4 0.3 0.3 ... ... Georgia ... ... ... ... ... ... Germany 0.4 0.4 0.3 0.3 0.3 -20 Greece 0.0 ... ... ... ... ... Hungary 2.8 1.8 2.2 2.6 2.9 3 Ireland 0.0 0.0 0.0 0.0 ... ... Italy 0.4 0.5 0.5 ... ... ... Kosovo (UNR) 3.2 3.7 4.4 3.4 5.7 82 Latvia ... ... ... ... ... ... Lithuania 8.5 7.7 9.9 9.4 11.2 32 Malta ... ... ... ... ... ... Netherlands 0.1 0.0 0.0 0.0 0.1 107 Poland 6.5 7.3 7.5 6.9 6.9 5 Portugal 0.5 0.5 0.6 0.6 0.5 -4 Serbia 0.8 0.7 0.9 0.8 0.7 -17 Slovakia 2.3 1.8 2.3 2.8 2.3 -1 Slovenia 0.7 0.4 0.2 0.4 0.2 -74 Spain ... ... ... ... ... ... Sweden 0.5 0.4 0.2 0.1 0.1 -71 Switzerland 0.2 0.2 0.1 0.1 0.1 -64 Turkey 0.9 0.9 1.3 1.1 ... ... Ukraine 1.5 1.5 1.5 1.8 1.8 19 UK: E & W ... ... ... ... ... ... UK: N. Ireland 0.0 0.1 ... ... ... ... UK: Scotland 0.0 0.0 0.0 0.0 0.0 -100 Mean 1.3 1.2 1.5 1.7 1.9
Median 0.6 0.5 0.6 0.8 1.1 Minimum 0.0 0.0 0.0 0.0 0.0 Maximum 8.5 7.7 9.9 9.4 11.2
Notes on table 3.2.1.17: Sweden: Only includes bribery.

173
Table 3.2.1.18 Persons convicted per 100 000 population – Drug offences: Total
2007 2008 2009 2010 2011
% change 2007-2011
Albania 9 10 13 12 19 101 Armenia 8 ... 16 19 15 98 Austria 66 52 47 52 53 -19 Bulgaria 14 12 17 20 19 41 Croatia 82 73 61 52 54 -34 Cyprus 49 43 58 ... ... ... Czech Republic 13 15 15 15 17 27 Denmark 191 202 206 203 239 26 Estonia 33 ... ... 37 36 7 Finland 132 126 124 148 155 17 France 59 68 74 78 ... ... Georgia 44 48 50 54 22 -50 Germany 69 75 72 68 68 -2 Greece 15 16 16 ... ... ... Hungary 21 21 21 21 22 3 Ireland 130 127 114 84 ... ... Italy 41 41 48 ... ... ... Kosovo (UNR) 6 6 6 6 10 69 Latvia ... ... ... ... ... ... Lithuania 30 33 39 47 42 40 Malta ... ... ... ... ... ... Netherlands 48 48 45 39 38 -21 Poland 55 54 53 54 55 0 Portugal 28 32 32 36 38 36 Serbia 43 54 49 36 51 18 Slovakia 15 17 20 21 22 53 Slovenia 18 18 19 20 25 33 Spain ... ... ... ... ... ... Sweden 175 193 211 226 239 37 Switzerland 133 142 145 161 131 -2 Turkey 36 39 106 125 ... ... Ukraine 66 66 68 59 56 -15 UK: E & W 82 97 104 112 108 31 UK: N. Ireland 53 57 ... ... ... ... UK: Scotland 166 141 148 144 133 -20 Mean 60 64 67 70 67
Median 46 50 50 52 42 Minimum 6 6 6 6 10 Maximum 191 202 211 226 239
Notes on table 3.2.1.18:
Bulgaria: The rise in the number of convicted persons for drug offences in 2009 and 2010 could partly be explained by two legislative changes in 2006: the decrease of sanctions for the possession of small amount for personal use (before that more severe penalties lead to prosecutors often refusing to initiate proceedings) and the allowing of plea bargaining for drug offences. Germany: Drug trafficking data actually refer to aggravated cases only.

174
Table 3.2.1.19 Persons convicted per 100 000 population – Drug offences: Drug trafficking
2007 2008 2009 2010 2011
% change 2007-2011
Albania 9 10 13 12 19 101 Armenia ... ... 5 6 4 ... Austria ... ... 14 16 12 ... Bulgaria ... ... ... ... ... ... Croatia 20 17 18 19 17 -13 Cyprus ... ... ... ... ... ... Czech Republic 11 11 11 13 14 30 Denmark 26 27 28 33 33 29 Estonia 26 ... ... 30 30 17 Finland 48 48 49 63 66 37 France ... ... ... ... ... ... Georgia 2 2 2 3 1 -63 Germany 13 12 12 11 11 -14 Greece 5 5 5 ... ... ... Hungary ... ... ... ... ... ... Ireland 46 46 42 30 ... ... Italy ... ... ... ... ... ... Kosovo (UNR) 5 6 5 5 8 61 Latvia ... ... ... ... ... ... Lithuania 7 9 10 12 13 87 Malta ... ... ... ... ... ... Netherlands ... ... ... ... ... ... Poland 3 4 4 5 5 77 Portugal 18 21 18 20 20 14 Serbia 42 51 48 34 29 -31 Slovakia 6 7 8 9 10 73 Slovenia 17 16 16 18 22 31 Spain ... ... ... ... ... ... Sweden ... ... ... ... ... ... Switzerland 70 74 75 82 60 -15 Turkey 14 16 46 48 ... ... Ukraine 13 12 13 12 11 -12 UK: E & W 2 1 1 1 1 -22 UK: N. Ireland ... ... ... ... ... ... UK: Scotland 42 42 43 45 44 6 Mean 20 21 21 23 21
Median 13 12 13 16 14 Minimum 2 1 1 1 1 Maximum 70 74 75 82 66

175
Notes on tables 3.2.1.1 to 3.2.1.19
Albania: The increase over the years is due to social and economic factors, financial crises, and lack of crime prevention. Bulgaria: For some crimes the number of convictions is higher than the number of suspects. This might be due to the duration of criminal proceedings, which usually exceeds one calendar year, i.e., persons suspected during one year could be convicted several years later. Denmark: Police tickets are included. Germany: Convictions include formal decisions of the court imposing a certain sanction on the offender as well as cases brought before a court by indictment or by applications according to sections 413 and 417 Code of Criminal Procedure, section 76 Act on Juvenile Courts and ”Strafbefehle“ (penal orders). The Netherlands: 2011: provisional data. In the Netherlands many cases are dealt with by the prosecution by imposing a fine ( 'transactie'). The case is not brought before a court and, technically, the offender does not admit guilt, so these cases are excluded from the tables in Chapter 3. However, there is a kind of criminal record, so a 'transactie' could also be considered as a conviction. Poland: Minors convicted in juvenile criminal proceedings are excluded except for those who committed the offence as a minor (under 17 years old) but were sentenced when they were 17 or over. Russia: No statistics publicly available. UK: Northern Ireland: Data for 2007 and 2008 are not directly comparable to previous years.

176
3.2.2 Percentage of females, minors, and aliens among convicted persons in 2010
Table 3.2.2.1 Percentage of females, minors, aliens, and aliens from EU countries among convicted persons in 2010 – Criminal offences: Total
Total offenders per 100 000 pop.
of which % of Females
of which % of Minors
of which % of Aliens
% of EU citizens
amongst aliens
Albania 270 6.8 8.1 ... ... Armenia 135 5.2 4.0 2.7 ... Austria 458 14.5 8.0 31.4 35.1 Bulgaria 517 6.6 7.0 5.9 84.2 Croatia 547 10.2 3.4 4.7 ... Cyprus 215 8.8 2.1 45.5 ... Czech Republic 672 13.0 3.4 6.9 56.8 Denmark 676 18.9 23.1 21.9 ... Estonia 746 9.0 2.6 ... ... Finland 3851 19.8 5.9 6.9 48.7 France 971 ... ... ... ... Georgia ... ... ... ... ... Germany 994 18.8 6.8 20.9 ... Greece 384 11.7 1.9 ... ... Hungary 892 16.0 7.3 3.4 ... Ireland ... ... ... ... ... Italy ... ... ... ... ... Kosovo (UNR) 449 4.1 4.3 0.7 ... Latvia ... ... ... ... ... Lithuania 471 11.2 7.6 ... ... Malta ... ... ... ... ... Netherlands 578 11.3 9.4 ... ... Poland 1134 8.4 0.2 1.7 ... Portugal 747 10.4 2.3 13.1 16.4 Serbia 319 9.8 7.0 1.9 ... Slovakia 575 14.8 5.6 1.9 50.5 Slovenia 411 10.9 3.9 ... ... Spain 468 9.9 8.5 27.8 29.0 Sweden 1479 17.4 10.2 ... ... Switzerland ... ... ... ... 46.2 Turkey 1673 7.1 3.9 0.5 ... Ukraine 369 13.1 6.4 1.3 ... UK: E & W 2461 22.4 5.4 ... ... UK: N. Ireland 1602 14.1 4.2 ... ... UK: Scotland 1252 16.4 4.9 ... ... Mean 873 12.2 6.0 11.0 45.9 Median 578 11.2 5.5 5.3 47.5 Minimum 135 4.1 0.2 0.5 16.4 Maximum 3851 22.4 23.1 45.5 84.2

177
Table 3.2.2.2 Percentage of females, minors, aliens, and aliens from EU countries among convicted persons in 2010 – Criminal offences: Major traffic offences
Total offenders per 100 000 pop.
of which % of Females
of which % of Minors
of which % of Aliens
% of EU citizens
amongst aliens
Albania 26 1.7 5.9 ... ... Armenia 4 0.0 0.0 0.0 ... Austria ... ... ... ... ... Bulgaria 150 2.4 0.5 2.2 0.0 Croatia 37 14.7 0.6 5.4 ... Cyprus ... ... ... ... ... Czech Republic ... ... ... ... ... Denmark ... ... ... ... ... Estonia ... ... ... ... ... Finland 2221 18.4 4.6 2.9 60.6 France 416 ... ... ... ... Georgia ... ... ... ... ... Germany 213 14.9 2.7 16.7 ... Greece 138 8.3 3.0 ... ... Hungary 10 12.1 7.3 5.6 ... Ireland 198 12.2 0.7 ... ... Italy ... ... ... ... ... Kosovo (UNR) 61 4.8 1.2 0.2 ... Latvia ... ... ... ... ... Lithuania 13 14.4 1.4 ... ... Malta ... ... ... ... ... Netherlands 106 15.5 1.7 ... ... Poland 354 3.8 0.0 0.8 ... Portugal 337 5.9 1.5 15.6 12.3 Serbia 42 9.6 2.0 ... ... Slovakia 49 5.8 1.3 1.8 77.6 Slovenia 18 9.9 1.4 ... ... Spain ... ... ... ... ... Sweden 299 11.5 6.7 ... ... Switzerland ... ... ... ... 6.4 Turkey 8 1.6 1.2 0.1 ... Ukraine 15 2.7 7.3 1.3 ... UK: E & W 6 4.9 5.5 ... ... UK: N. Ireland 156 12.9 1.0 ... ... UK: Scotland 137 15.2 1.7 ... ... Mean 209 8.8 2.6 4.4 31.4 Median 84 9.6 1.5 2.0 12.3 Minimum 4 0.0 0.0 0.0 0.0 Maximum 2221 18.4 7.3 16.7 77.6

178
Table 3.2.2.3 Percentage of females, minors, aliens, and aliens from EU countries among convicted persons in 2010 – Intentional homicide: Total
Total offenders per 100 000 pop.
of which% of Females
of which % of Minors
of which % of Aliens
% of EU citizens
amongst aliens
Albania 5.7 2.9 2.3 ... ... Armenia 2.5 4.9 2.5 0.0 ... Austria 0.6 7.7 7.7 26.9 21.4 Bulgaria 2.1 9.3 4.3 3.1 0.0 Croatia 3.4 6.7 3.3 1.3 ... Cyprus 1.3 0.0 0.0 90.9 ... Czech Republic 1.0 16.5 3.7 16.5 ... Denmark ... ... ... ... ... Estonia ... ... ... ... ... Finland 3.4 12.6 1.1 2.2 0.0 France 1.0 ... ... ... ... Georgia ... ... ... ... ... Germany 0.8 8.6 5.4 27.8 ... Greece 0.2 ... ... ... ... Hungary 2.2 11.2 11.6 2.2 ... Ireland 0.1 0.0 0.0 ... ... Italy ... ... ... ... ... Kosovo (UNR) 5.8 1.6 11.8 ... ... Latvia ... ... ... ... ... Lithuania 6.9 7.4 10.9 ... ... Malta 1.9 0.0 ... ... ... Netherlands 5.0 7.2 10.2 ... ... Poland 2.0 12.3 1.6 0.9 ... Portugal 2.5 4.6 1.5 16.0 11.9 Serbia 2.5 6.6 5.5 ... ... Slovakia 1.1 1.7 1.7 1.7 0.0 Slovenia 0.4 12.5 0.0 ... ... Spain ... ... ... ... ... Sweden 1.8 10.2 4.8 ... ... Switzerland ... ... ... ... 19.1 Turkey 21.9 3.0 5.3 0.4 ... Ukraine 4.0 11.3 4.9 1.9 ... UK: E & W 2.9 9.6 4.3 ... ... UK: N. Ireland 1.4 8.0 0.0 ... ... UK: Scotland 2.7 10.0 7.1 ... ... Mean 3.1 7.2 4.5 13.7 8.7 Median 2.2 7.5 4.3 2.2 6.0 Minimum 0.1 0.0 0.0 0.0 0.0 Maximum 21.9 16.5 11.8 90.9 21.4

179
Table 3.2.2.4 Percentage of females, minors, aliens, and aliens from EU countries among convicted persons in 2010 – Intentional homicide: Completed
Total offenders per 100 000 pop.
of which % of Females
of which % of Minors
of which % of Aliens
% of EU citizens
amongst aliens
Albania ... ... ... ... ... Armenia 1.9 ... ... ... ... Austria 0.5 7.7 7.7 ... ... Bulgaria 1.7 10.3 4.0 2.4 0.0 Croatia 1.2 7.5 1.9 ... ... Cyprus 0.9 0.0 0.0 85.7 ... Czech Republic ... ... ... ... ... Denmark 0.9 12.2 0.0 14.3 ... Estonia ... ... ... ... ... Finland 1.4 9.5 0.0 2.7 0.0 France ... ... ... ... ... Georgia ... ... ... ... ... Germany 0.5 ... ... ... ... Greece 0.1 ... ... ... ... Hungary 1.4 12.5 11.8 1.5 ... Ireland ... ... ... ... ... Italy ... ... ... ... ... Kosovo (UNR) 3.6 2.5 13.9 ... ... Latvia ... ... ... ... ... Lithuania ... ... ... ... ... Malta 0.7 0.0 ... ... ... Netherlands ... ... ... ... ... Poland 1.5 ... ... ... ... Portugal 1.1 5.2 ... 20.7 12.5 Serbia 2.0 0.0 4.1 ... ... Slovakia 0.8 2.2 2.2 2.2 0.0 Slovenia 0.4 12.5 0.0 ... ... Spain ... ... ... ... ... Sweden ... ... ... ... ... Switzerland ... ... ... ... 22.2 Turkey ... ... ... ... ... Ukraine ... ... ... ... ... UK: E & W 0.6 5.2 5.5 ... ... UK: N. Ireland 1.3 8.7 0.0 ... ... UK: Scotland 1.6 17.3 12.3 ... ... Mean 1.2 7.1 4.5 18.5 6.9 Median 1.1 7.6 3.1 2.7 0.0 Minimum 0.1 0.0 0.0 1.5 0.0 Maximum 3.6 17.3 13.9 85.7 22.2

180
Table 3.2.2.5 Percentage of females, minors, aliens, and aliens from EU countries among convicted persons in 2010 – Bodily injury (Assault): Total
Total offenders per 100 000 pop.
of which % of Females
of which % of Minors
of which % of Aliens
% of EU citizens
amongst aliens
Albania 16 5.9 3.6 ... ... Armenia 7 4.6 7.9 0.9 ... Austria 72 7.2 8.4 23.7 12.9 Bulgaria 15 2.4 5.7 0.7 0.0 Croatia 23 5.1 10.3 1.2 ... Cyprus 7 4.9 0.0 37.7 ... Czech Republic 26 6.0 7.4 4.1 ... Denmark ... ... ... ... ... Estonia ... ... ... ... ... Finland 192 13.8 8.3 9.0 33.5 France 109 ... ... ... ... Georgia ... ... ... ... ... Germany 97 9.5 17.5 20.9 ... Greece 14 8.5 0.9 ... ... Hungary 55 11.4 7.9 2.5 ... Ireland 25 12.1 8.7 ... ... Italy ... ... ... ... ... Kosovo (UNR) 60 4.5 9.4 ... ... Latvia ... ... ... ... ... Lithuania 40 10.1 8.8 ... ... Malta ... ... ... ... ... Netherlands 71 8.4 11.2 ... ... Poland 90 4.3 0.2 0.3 ... Portugal 68 16.6 2.0 7.0 9.4 Serbia 18 8.7 11.0 ... ... Slovakia 26 5.5 6.9 0.9 46.2 Slovenia 30 6.7 5.9 ... ... Spain ... ... ... ... ... Sweden 102 13.6 18.4 ... ... Switzerland ... ... ... ... 32.1 Turkey 146 5.1 4.6 0.1 ... Ukraine 19 ... ... ... ... UK: E & W 77 11.2 14.9 ... ... UK: N. Ireland 46 9.0 5.0 ... ... UK: Scotland 293 17.3 6.6 ... ... Mean 65 8.5 7.7 8.4 22.3 Median 46 8.4 7.9 2.5 22.5 Minimum 7 2.4 0.0 0.1 0.0 Maximum 293 17.3 18.4 37.7 46.2

181
Table 3.2.2.6 Percentage of females, minors, aliens, and aliens from EU countries among convicted persons in 2010 – Bodily injury (Assault): Aggravated bodily injury
Total offenders per 100 000 pop.
of which % of Females
of which % of Minors
of which % of Aliens
% of EU citizens
amongst aliens
Albania 3.8 1.7 10.4 ... ... Armenia 4.6 2.7 9.5 0.7 ... Austria 15.5 4.5 10.3 27.4 14.3 Bulgaria ... ... ... ... ... Croatia 12.8 4.4 6.2 1.6 ... Cyprus 5.7 2.1 0.0 40.4 ... Czech Republic 3.9 8.4 11.6 7.6 ... Denmark ... ... ... ... ... Estonia ... ... ... ... ... Finland 12.1 17.4 6.5 7.3 34.0 France 13.9 ... ... ... ... Georgia ... ... ... ... ... Germany 36.4 10.3 24.9 21.4 ... Greece 0.2 ... 4.0 ... ... Hungary 42.3 8.7 8.1 2.7 ... Ireland 8.3 8.4 9.2 ... ... Italy ... ... ... ... ... Kosovo (UNR) 4.9 0.9 13.0 ... ... Latvia ... ... ... ... ... Lithuania 6.8 10.1 7.9 ... ... Malta ... ... ... ... ... Netherlands 10.3 6.1 15.0 ... ... Poland 2.8 7.8 0.2 0.9 ... Portugal 2.7 8.1 47.0 12.7 11.1 Serbia 7.6 4.9 12.9 ... ... Slovakia ... ... ... ... ... Slovenia 4.7 7.3 3.1 ... ... Spain ... ... ... ... ... Sweden 8.7 6.3 13.6 ... ... Switzerland ... ... ... ... 23.9 Turkey 2.2 2.5 3.3 ... ... Ukraine 7.1 0.2 4.1 0.2 ... UK: E & W ... ... ... ... ... UK: N. Ireland 2.8 2.0 2.0 ... ... UK: Scotland 25.9 8.0 10.0 ... ... Mean 10.2 6.0 10.1 11.2 20.8 Median 7.0 6.2 9.2 7.3 19.1 Minimum 0.2 0.2 0.0 0.2 11.1 Maximum 42.3 17.4 47.0 40.4 34.0

182
Table 3.2.2.7 Percentage of females, minors, aliens, and aliens from EU countries among convicted persons in 2010 – Sexual assault: Total
Total offenders per 100 000 pop.
of which % of Females
of which % of Minors
of which % of Aliens
% of EU citizens
amongst aliens
Albania 1.1 0.0 21.9 ... ... Armenia 1.3 0.0 2.4 7.1 ... Austria 4.0 2.7 8.4 21.3 25.4 Bulgaria 3.5 0.0 9.9 0.8 50.0 Croatia 4.9 0.5 9.6 2.7 ... Cyprus 1.3 18.2 0.0 36.4 ... Czech Republic 5.0 1.5 21.2 6.8 ... Denmark ... ... ... ... ... Estonia ... ... ... ... ... Finland 8.6 1.1 7.6 15.2 8.6 France 15.8 ... ... ... ... Georgia ... ... ... ... ... Germany 4.7 1.2 13.5 18.7 ... Greece 0.4 2.4 ... ... ... Hungary 3.3 5.2 25.3 2.4 ... Ireland 1.0 0.0 11.6 ... ... Italy ... ... ... ... ... Kosovo (UNR) 3.3 ... 9.7 ... ... Latvia ... ... ... ... ... Lithuania 7.0 2.6 19.3 ... ... Malta ... ... ... ... ... Netherlands 4.8 0.5 17.0 ... ... Poland 4.1 0.8 0.5 0.5 ... Portugal 4.7 6.8 3.0 11.8 5.1 Serbia 2.5 4.4 9.4 ... ... Slovakia 4.6 1.2 25.9 1.2 0.0 Slovenia 5.1 0.0 10.6 ... ... Spain ... ... ... ... ... Sweden 5.2 0.4 13.0 ... ... Switzerland ... ... ... ... 35.2 Turkey 13.1 2.0 9.2 0.2 ... Ukraine ... ... ... ... ... UK: E & W 10.5 1.3 10.1 ... ... UK: N. Ireland 7.3 0.0 3.8 ... ... UK: Scotland 2.0 0.0 16.0 ... ... Mean 5.0 2.2 11.6 9.6 20.7 Median 4.7 1.1 10.0 6.8 17.0 Minimum 0.4 0.0 0.0 0.2 0.0 Maximum 15.8 18.2 25.9 36.4 50.0

183
Table 3.2.2.8 Percentage of females, minors, aliens, and aliens from EU countries among convicted persons in 2010 – Sexual assault: Rape
Total offenders per 100 000 pop.
of which % of Females
of which % of Minors
of which % of Aliens
% of EU citizens
amongst aliens
Albania 0.6 0.0 11.8 ... ... Armenia 0.6 0.0 0.0 16.7 ... Austria 2.0 2.4 10.0 28.8 24.5 Bulgaria 2.0 0.0 6.7 0.0 ... Croatia 1.8 1.3 8.9 6.3 ... Cyprus 0.5 0.0 0.0 25.0 ... Czech Republic 1.7 0.6 7.5 16.1 ... Denmark ... ... ... ... ... Estonia ... ... ... ... ... Finland 1.8 0.0 7.4 29.5 3.6 France 2.1 ... ... ... ... Georgia ... ... ... ... ... Germany 1.1 1.0 15.4 28.9 ... Greece 0.2 4.8 ... ... ... Hungary 1.0 ... 18.2 3.0 ... Ireland 0.2 0.0 0.0 ... ... Italy ... ... ... ... ... Kosovo (UNR) 0.9 ... 10.0 ... ... Latvia ... ... ... ... ... Lithuania 6.2 2.4 20.0 ... ... Malta ... ... ... ... ... Netherlands 0.8 0.0 17.5 ... ... Poland 2.2 0.4 0.8 0.7 ... Portugal 0.7 ... ... 24.4 ... Serbia 0.9 0.0 7.5 ... ... Slovakia 0.7 0.0 2.8 0.0 ... Slovenia 0.8 0.0 0.0 ... ... Spain ... ... ... ... ... Sweden 3.8 0.6 8.8 ... ... Switzerland ... ... ... ... 20.2 Turkey ... ... ... ... ... Ukraine 1.0 1.8 10.4 1.4 ... UK: E & W 1.9 0.3 7.6 ... ... UK: N. Ireland 0.9 0.0 0.0 ... ... UK: Scotland 0.7 0.0 2.9 ... ... Mean 1.4 0.7 7.6 13.9 16.1 Median 0.9 0.0 7.5 16.1 20.2 Minimum 0.2 0.0 0.0 0.0 3.6 Maximum 6.2 4.8 20.0 29.5 24.5

184
Table 3.2.2.9 Percentage of females, minors, aliens, and aliens from EU countries among convicted persons in 2010 – Sexual abuse of a child
Total offenders per 100 000 pop.
of which % of Females
of which % of Minors
of which % of Aliens
% of EU citizens
amongst aliens
Albania 0.5 0.0 33.3 ... ... Armenia 0.6 0.0 5.3 0.0 ... Austria 1.8 3.3 7.2 12.4 26.3 Bulgaria ... ... ... ... ... Croatia 2.2 ... 14.4 1.0 ... Cyprus 0.4 33.3 0.0 0.0 ... Czech Republic 3.3 2.0 28.4 2.3 ... Denmark ... ... ... ... ... Estonia ... ... ... ... ... Finland 5.6 1.7 8.4 9.7 17.2 France 4.9 ... ... ... ... Georgia ... ... ... ... ... Germany 2.2 1.5 13.4 9.8 ... Greece 0.1 ... ... ... ... Hungary 0.8 6.0 40.5 ... ... Ireland 0.0 0.0 0.0 ... ... Italy ... ... ... ... ... Kosovo (UNR) 1.4 ... 6.5 ... ... Latvia ... ... ... ... ... Lithuania 0.6 ... 15.8 ... ... Malta ... ... ... ... ... Netherlands 1.4 0.4 13.7 ... ... Poland 1.9 1.4 0.1 0.3 ... Portugal 2.4 1.6 3.6 8.4 ... Serbia 0.2 0.0 28.6 ... ... Slovakia 3.6 1.6 33.2 1.6 0.0 Slovenia 2.7 0.0 8.9 ... ... Spain ... ... ... ... ... Sweden 1.2 0.0 27.8 ... ... Switzerland ... ... ... ... 43.5 Turkey 6.4 3.1 14.7 0.1 ... Ukraine 0.1 0.0 7.7 0.0 ... UK: E & W 6.8 0.5 0.0 ... ... UK: N. Ireland 2.1 2.7 10.8 ... ... UK: Scotland 1.2 0.0 24.6 ... ... Mean 2.1 2.8 14.5 3.8 21.8 Median 1.6 1.4 12.1 1.3 21.8 Minimum 0.0 0.0 0.0 0.0 0.0 Maximum 6.8 33.3 40.5 12.4 43.5

185
Table 3.2.2.10 Percentage of females, minors, aliens, and aliens from EU countries among convicted persons in 2010 – Robbery
Total offenders per 100 000 pop.
of which % of Females
of which % of Minors
of which % of Aliens
% of EU citizens
amongst aliens
Albania 3.7 0.0 14.3 ... ... Armenia 5.8 4.3 9.6 2.1 ... Austria 10.8 8.9 30.5 42.9 34.4 Bulgaria 17.6 2.9 18.6 0.5 83.3 Croatia 9.7 5.6 11.7 3.0 ... Cyprus 2.1 0.0 5.9 64.7 ... Czech Republic 14.3 6.5 18.7 7.3 ... Denmark ... ... ... ... ... Estonia ... ... ... ... ... Finland 10.1 12.2 14.9 12.2 43.9 France ... ... ... ... ... Georgia ... ... ... ... ... Germany 12.0 6.6 31.8 27.3 ... Greece 1.6 1.7 1.7 ... ... Hungary 16.8 9.6 35.9 2.0 ... Ireland 8.1 6.3 15.9 ... ... Italy ... ... ... ... ... Kosovo (UNR) 5.0 ... 12.6 ... ... Latvia ... ... ... ... ... Lithuania 33.9 3.4 30.6 ... ... Malta ... ... ... ... ... Netherlands 15.8 5.8 28.6 ... ... Poland 23.0 4.2 0.6 0.5 ... Portugal 27.3 5.7 16.7 18.0 6.5 Serbia 36.9 4.8 22.8 ... ... Slovakia 11.3 6.0 23.5 0.5 100.0 Slovenia 7.3 9.4 21.5 ... ... Spain ... ... ... ... ... Sweden 10.6 5.4 30.6 ... ... Switzerland ... ... ... ... 27.1 Turkey 22.1 2.5 14.3 0.6 ... Ukraine 25.3 5.5 11.6 1.3 ... UK: E & W 15.4 7.9 40.2 ... ... UK: N. Ireland 6.1 0.9 8.3 ... ... UK: Scotland 10.1 11.4 9.9 ... ... Mean 13.9 5.5 18.5 13.1 49.2 Median 11.0 5.6 16.3 2.6 39.2 Minimum 1.6 0.0 0.6 0.5 6.5 Maximum 36.9 12.2 40.2 64.7 100.0
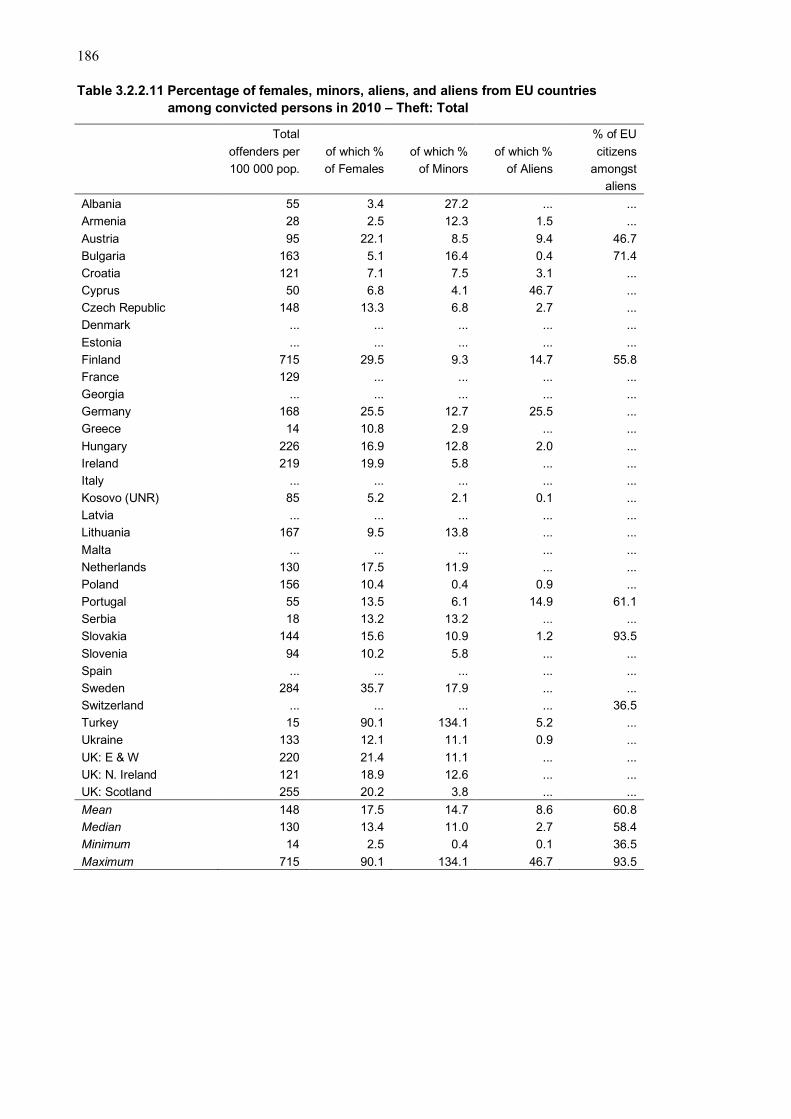
186
Table 3.2.2.11 Percentage of females, minors, aliens, and aliens from EU countries among convicted persons in 2010 – Theft: Total
Total offenders per 100 000 pop.
of which % of Females
of which % of Minors
of which % of Aliens
% of EU citizens
amongst aliens
Albania 55 3.4 27.2 ... ... Armenia 28 2.5 12.3 1.5 ... Austria 95 22.1 8.5 9.4 46.7 Bulgaria 163 5.1 16.4 0.4 71.4 Croatia 121 7.1 7.5 3.1 ... Cyprus 50 6.8 4.1 46.7 ... Czech Republic 148 13.3 6.8 2.7 ... Denmark ... ... ... ... ... Estonia ... ... ... ... ... Finland 715 29.5 9.3 14.7 55.8 France 129 ... ... ... ... Georgia ... ... ... ... ... Germany 168 25.5 12.7 25.5 ... Greece 14 10.8 2.9 ... ... Hungary 226 16.9 12.8 2.0 ... Ireland 219 19.9 5.8 ... ... Italy ... ... ... ... ... Kosovo (UNR) 85 5.2 2.1 0.1 ... Latvia ... ... ... ... ... Lithuania 167 9.5 13.8 ... ... Malta ... ... ... ... ... Netherlands 130 17.5 11.9 ... ... Poland 156 10.4 0.4 0.9 ... Portugal 55 13.5 6.1 14.9 61.1 Serbia 18 13.2 13.2 ... ... Slovakia 144 15.6 10.9 1.2 93.5 Slovenia 94 10.2 5.8 ... ... Spain ... ... ... ... ... Sweden 284 35.7 17.9 ... ... Switzerland ... ... ... ... 36.5 Turkey 15 90.1 134.1 5.2 ... Ukraine 133 12.1 11.1 0.9 ... UK: E & W 220 21.4 11.1 ... ... UK: N. Ireland 121 18.9 12.6 ... ... UK: Scotland 255 20.2 3.8 ... ... Mean 148 17.5 14.7 8.6 60.8 Median 130 13.4 11.0 2.7 58.4 Minimum 14 2.5 0.4 0.1 36.5 Maximum 715 90.1 134.1 46.7 93.5

187
Table 3.2.2.12 Percentage of females, minors, aliens, and aliens from EU countries among convicted persons in 2010 – Theft: Theft of a motor vehicle
Total offenders per 100 000 pop.
of which % of Females
of which % of Minors
of which % of Aliens
% of EU citizens
amongst aliens
Albania ... ... ... ... ... Armenia 0.1 0.0 0.0 50.0 ... Austria ... ... ... ... ... Bulgaria 4.2 0.6 23.1 1.3 50.0 Croatia 2.5 1.8 10.8 2.7 ... Cyprus ... ... ... ... ... Czech Republic ... ... ... ... ... Denmark 16.1 5.5 19.2 13.0 ... Estonia ... ... ... ... ... Finland 10.6 8.8 22.0 2.6 40.0 France ... ... ... ... ... Georgia ... ... ... ... ... Germany ... ... ... ... ... Greece 0.0 ... ... ... ... Hungary 6.1 3.5 24.7 2.1 ... Ireland 17.2 1.8 17.2 ... ... Italy ... ... ... ... ... Kosovo (UNR) ... ... ... ... ... Latvia ... ... ... ... ... Lithuania ... ... ... ... ... Malta ... ... ... ... ... Netherlands ... ... ... ... ... Poland ... ... ... ... ... Portugal 1.8 2.6 13.8 11.7 13.0 Serbia ... ... ... ... ... Slovakia 0.4 0.0 4.3 0.0 ... Slovenia ... ... ... ... ... Spain ... ... ... ... ... Sweden 6.1 7.2 34.8 ... ... Switzerland ... ... ... ... ... Turkey ... ... ... ... ... Ukraine 5.9 1.2 16.6 0.9 ... UK: E & W 3.8 4.0 22.9 ... ... UK: N. Ireland 10.1 6.1 15.5 ... ... UK: Scotland 9.3 3.7 13.6 ... ... Mean 6.3 3.3 17.0 9.4 34.3 Median 5.9 3.0 16.9 2.6 40.0 Minimum 0.0 0.0 0.0 0.0 13.0 Maximum 17.2 8.8 34.8 50.0 50.0

188
Table 3.2.2.13 Percentage of females, minors, aliens, and aliens from EU countries among convicted persons in 2010 – (Theft) Burglary: Total
Total offenders per 100 000 pop.
of which % of Females
of which % of Minors
of which % of Aliens
% of EU citizens
amongst aliens
Albania ... ... ... ... ... Armenia ... ... ... ... ... Austria 18 5.9 19.3 1.1 43.8 Bulgaria ... ... ... ... ... Croatia 63 3.8 9.3 2.8 ... Cyprus 29 4.3 4.3 50.4 ... Czech Republic ... ... ... ... ... Denmark 42 4.3 13.8 14.5 ... Estonia ... ... ... ... ... Finland ... ... ... ... ... France ... ... ... ... ... Georgia ... ... ... ... ... Germany 19 5.5 23.0 24.5 ... Greece ... ... ... ... ... Hungary ... ... ... ... ... Ireland 51 4.3 8.3 ... ... Italy ... ... ... ... ... Kosovo (UNR) 21 1.1 20.9 0.6 ... Latvia ... ... ... ... ... Lithuania ... ... ... ... ... Malta ... ... ... ... ... Netherlands 65 14.2 17.4 ... ... Poland 48 2.6 0.7 0.4 ... Portugal 3 5.4 5.7 11.4 72.2 Serbia ... ... ... ... ... Slovakia 39 4.6 20.4 1.1 100.0 Slovenia 38 2.6 5.6 ... ... Spain ... ... ... ... ... Sweden ... ... ... ... ... Switzerland ... ... ... ... ... Turkey ... ... ... ... ... Ukraine ... ... ... ... ... UK: E & W 43 4.1 21.5 ... ... UK: N. Ireland 30 1.3 6.3 ... ... UK: Scotland 29 4.7 8.6 ... ... Mean 36 4.6 12.3 11.9 72.0 Median 38 4.3 9.3 2.8 72.2 Minimum 3 1.1 0.7 0.4 43.8 Maximum 65 14.2 23.0 50.4 100.0

189
Table 3.2.2.14 Percentage of females, minors, aliens, and aliens from EU countries
among convicted persons in 2010 – (Theft) Burglary: Domestic burglary
Total offenders per 100 000 pop.
of which % of Females
of which % of Minors
of which % of Aliens
% of EU citizens
amongst aliens
Germany 3.1 10.0 25.2 27.0 ... Portugal 1.3 9.2 3.5 8.5 58.3 Slovakia 5.3 7.7 20.2 0.7 100.0 Ukraine 56.7 6.6 15.6 0.9 ... UK: England & Wales 25.9 5.1 23.5 ... ...

190
Table 3.2.2.15 Percentage of females, minors, aliens, and aliens from EU countries among convicted persons in 2010 – Fraud
Total offenders per 100 000 pop.
of which % of Females
of which % of Minors
of which % of Aliens
% of EU citizens
amongst aliens
Albania 8 20.3 0.0 ... ... Armenia 7 16.0 0.0 1.4 ... Austria 32 23.3 1.9 24.7 44.2 Bulgaria 10 21.9 1.9 1.2 66.7 Croatia 26 18.8 0.1 4.9 ... Cyprus 4 6.9 0.0 31.0 ... Czech Republic 29 29.2 0.7 4.5 ... Denmark ... ... ... ... ... Estonia ... ... ... ... ... Finland 81 29.5 3.5 9.9 34.3 France 14 ... ... ... ... Georgia ... ... ... ... ... Germany 123 32.7 1.0 17.3 ... Greece 2 16.6 ... ... ... Hungary 64 27.0 0.5 1.2 ... Ireland 14 19.9 1.7 ... ... Italy ... ... ... ... ... Kosovo (UNR) 7 5.6 1.2 1.2 ... Latvia ... ... ... ... ... Lithuania 30 16.8 2.7 ... ... Malta ... ... ... ... ... Netherlands 16 26.7 2.5 ... ... Poland 93 24.6 0.1 0.4 ... Portugal 6 27.5 0.6 11.1 15.8 Serbia 6 13.1 0.2 ... ... Slovakia 20 27.8 0.3 1.1 50.0 Slovenia 37 19.3 0.5 ... ... Spain ... ... ... ... ... Sweden 34 22.6 7.0 ... ... Switzerland ... ... ... ... 48.5 Turkey 47 5.8 0.6 0.3 ... Ukraine 10 19.9 3.4 1.1 ... UK: E & W 38 30.0 2.6 ... ... UK: N. Ireland 36 50.8 0.6 ... ... UK: Scotland 20 32.9 1.5 ... ... Mean 30 22.5 1.4 7.4 43.2 Median 20 22.2 0.7 1.4 46.3 Minimum 2 5.6 0.0 0.3 15.8 Maximum 123 50.8 7.0 31.0 66.7

191
Table 3.2.2.16 Percentage of females, minors, aliens, and aliens from EU countries among convicted persons in 2010 – Money laundering
Total offenders per 100 000 pop.
of which % of Females
of which % of Minors
of which % of Aliens
% of EU citizens
amongst aliens
Albania 0.4 0.0 9.1 ... ... Armenia 0.0 0.0 0.0 0.0 ... Austria 0.1 66.7 16.7 50.0 ... Bulgaria ... ... ... ... ... Croatia ... ... ... ... ... Cyprus ... ... ... ... ... Czech Republic 0.0 0.0 0.0 0.0 ... Denmark ... ... ... ... ... Estonia ... ... ... ... ... Finland 0.4 55.0 5.0 20.0 25.0 France ... ... ... ... ... Georgia ... ... ... ... ... Germany 0.9 22.2 0.1 21.4 ... Greece ... ... ... ... ... Hungary ... ... ... ... ... Ireland 0.0 0.0 0.0 ... ... Italy ... ... ... ... ... Kosovo (UNR) 0.0 ... ... ... ... Latvia ... ... ... ... ... Lithuania 0.0 ... ... ... ... Malta ... ... ... ... ... Netherlands 2.0 23.4 2.4 ... ... Poland 0.4 16.4 0.0 0.0 ... Portugal 0.1 50.0 ... ... ... Serbia 0.0 ... ... ... ... Slovakia 0.2 0.0 0.0 15.4 50.0 Slovenia 0.0 0.0 0.0 ... ... Spain ... ... ... ... ... Sweden 0.4 10.0 5.0 ... ... Switzerland ... ... ... ... 24.0 Turkey ... ... ... ... ... Ukraine 0.1 17.9 0.0 0.0 ... UK: E & W ... ... ... ... ... UK: N. Ireland ... ... ... ... ... UK: Scotland 0.0 ... ... ... ... Mean 0.3 18.7 2.9 13.4 33.0 Median 0.1 13.2 0.0 7.7 25.0 Minimum 0.0 0.0 0.0 0.0 24.0 Maximum 2.0 66.7 16.7 50.0 50.0

192
Table 3.2.2.17 Percentage of females, minors, aliens, and aliens from EU countries among convicted persons in 2010 – Corruption
Total offenders per 100 000 pop.
of which % of Females
of which % of Minors
of which % of Aliens
% of EU citizens
amongst aliens
Albania 1.5 15.6 0.0 ... ... Armenia 1.4 13.0 0.0 0.0 ... Austria 0.8 ... ... 7.4 40.0 Bulgaria 1.8 6.7 0.0 4.5 0.0 Croatia 1.5 5.9 ... 16.2 ... Cyprus 0.0 ... ... ... ... Czech Republic 0.7 4.0 0.0 8.0 ... Denmark ... ... ... ... ... Estonia ... ... ... ... ... Finland 0.1 0.0 0.0 25.0 100.0 France 0.3 ... ... ... ... Georgia ... ... ... ... ... Germany 0.3 13.3 0.0 30.2 ... Greece ... ... ... ... ... Hungary 2.6 20.2 3.9 11.3 ... Ireland 0.0 0.0 0.0 ... ... Italy ... ... ... ... ... Kosovo (UNR) 3.4 5.4 ... 2.7 ... Latvia ... ... ... ... ... Lithuania 9.4 12.1 0.3 ... ... Malta ... ... ... ... ... Netherlands 0.0 0.0 0.0 ... ... Poland 6.9 9.8 0.0 6.1 ... Portugal 0.6 ... ... 13.2 ... Serbia 0.8 10.5 0.0 ... ... Slovakia 2.8 24.0 0.0 0.0 ... Slovenia 0.4 0.0 0.0 ... ... Spain ... ... ... ... ... Sweden 0.1 0.0 0.0 ... ... Switzerland ... ... ... ... 0.0 Turkey 1.1 2.8 0.6 0.5 ... Ukraine 1.8 21.1 0.0 0.0 ... UK: E & W ... ... ... ... ... UK: N. Ireland 0.1 0.0 0.0 ... ... UK: Scotland 0.0 ... ... ... ... Mean 1.5 8.2 0.3 8.9 35.0 Median 0.8 6.3 0.0 6.7 20.0 Minimum 0.0 0.0 0.0 0.0 0.0 Maximum 9.4 24.0 3.9 30.2 100.0

193
Table 3.2.2.18 Percentage of females, minors, aliens, and aliens from EU countries among convicted persons in 2010 – Drug offences: Total
Total offenders per 100 000 pop.
of which % of Females
of which % of Minors
of which % of Aliens
% of EU citizens
amongst aliens
Albania 12 3.5 2.7 ... ... Armenia 19 2.6 0.6 5.8 ... Austria 52 10.7 5.6 38.0 8.7 Bulgaria 20 8.7 4.0 2.8 35.7 Croatia 54 12.5 1.9 18.4 ... Cyprus 57 6.7 0.0 35.3 ... Czech Republic 15 15.3 5.2 4.2 ... Denmark 203 7.7 5.0 15.5 ... Estonia ... ... ... ... ... Finland 148 14.6 3.0 8.5 39.0 France 78 ... ... ... ... Georgia ... ... ... ... ... Germany 68 9.7 3.9 20.5 ... Greece 16 3.6 1.2 ... ... Hungary 21 8.9 8.3 3.8 ... Ireland 84 7.3 2.3 ... ... Italy ... ... ... ... ... Kosovo (UNR) 6 6.6 4.1 ... ... Latvia ... ... ... ... ... Lithuania 47 12.4 3.9 ... ... Malta ... ... ... ... ... Netherlands 39 13.2 2.5 ... ... Poland 54 4.2 1.0 1.2 ... Portugal 36 10.2 2.4 18.5 15.1 Serbia 36 5.8 3.5 ... ... Slovakia 21 9.2 4.4 2.5 64.3 Slovenia 20 12.7 3.7 ... ... Spain ... ... ... ... ... Sweden 226 14.2 7.5 ... ... Switzerland ... ... ... ... 30.4 Turkey 125 2.5 5.9 1.6 ... Ukraine 59 14.8 1.6 ... ... UK: E & W 112 7.7 9.5 ... ... UK: N. Ireland 56 6.8 3.2 ... ... UK: Scotland 144 14.2 1.4 ... ... Mean 65 9.1 3.6 12.6 32.2 Median 53 8.9 3.5 7.2 33.0 Minimum 6 2.5 0.0 1.2 8.7 Maximum 226 15.3 9.5 38.0 64.3

194
Table 3.2.2.19 Percentage of females, minors, aliens, and aliens from EU countries among convicted persons in 2010 – Drug offences: Drug trafficking
Total offenders per 100 000 pop.
of which % of Females
of which % of Minors
of which % of Aliens
% of EU citizens
amongst aliens
Albania 12 3.5 3.3 ... ... Armenia 6 1.6 0.5 14.4 ... Austria 16 10.8 1.4 37.8 20.6 Bulgaria ... ... ... ... ... Croatia 17 6.3 2.1 5.2 ... Cyprus ... ... ... ... ... Czech Republic 13 16.3 5.6 4.2 ... Denmark ... ... ... ... ... Estonia ... ... ... ... ... Finland 63 12.6 2.7 11.2 48.7 France ... ... ... ... ... Georgia ... ... ... ... ... Germany 11 9.5 1.0 31.3 ... Greece 5 4.3 ... ... ... Hungary ... ... ... ... ... Ireland 30 11.6 3.3 ... ... Italy ... ... ... ... ... Kosovo (UNR) 5 7.0 4.3 ... ... Latvia ... ... ... ... ... Lithuania 12 17.3 3.9 ... ... Malta ... ... ... ... ... Netherlands ... ... ... ... ... Poland 5 6.0 1.3 4.7 ... Portugal 20 13.1 2.0 24.5 19.6 Serbia 34 5.6 2.7 ... ... Slovakia 9 11.2 4.7 3.1 53.3 Slovenia 18 12.6 3.0 ... ... Spain ... ... ... ... ... Sweden ... ... ... ... ... Switzerland ... ... ... ... 22.0 Turkey 48 4.2 3.2 3.7 ... Ukraine 12 ... 2.1 ... ... UK: E & W 1 16.5 0.3 ... ... UK: N. Ireland ... ... ... ... ... UK: Scotland 45 15.9 0.9 ... ... Mean 19 9.8 2.6 14.0 32.8 Median 12 10.8 2.7 8.2 22.0 Minimum 1 1.6 0.3 3.1 19.6 Maximum 63 17.3 5.6 37.8 53.3

195
Notes on tables 3.2.2.1 to 3.2.2.19
In general, the notes for tables 3.2.1.1 to 3.2.1.19 also apply here. Croatia: Data relate to the year 2011 (instead of 2010). Cyprus: Data relate to the year 2009 (instead of 2010). The data refer to adults and minors convicted for serious offences only, as classified by the police. Denmark: The figures in this table differ somewhat from those in table 3.2.1, as it is not possible to take the numbers from the same source. Table 3.2.2. includes some minor convictions and sanctions for mentally ill offenders, neither of which are included in table 3.2.1. Estonia: Data relate to the year 2011 (instead of 2010). Greece: Data relate to the year 2009 (instead of 2010). Poland: Minors convicted in juvenile criminal proceedings are excluded except for those who committed the offence as a minor (under 17 years old) but were sentenced when they were 17 years old or more. Serbia: In 2010, out of the total number of aliens, 50% were foreigners from the region, i.e., the countries of former Yugoslavia. The Statistical Office has the data on the citizenship of the convicted persons, but it is not separately analysed at the moment and presented in the tables, due to the small number of foreigners, particularly those from the EU. UK: Northern Ireland: Data relate to the year 2008 (instead of 2010).

196
Table 3.2.3 Total persons receiving sanctions/measures in 2010
Table 3.2.3.1. Total persons receiving sanctions/measures in 2010 – Criminal offences: Total
Tota
l san
ctio
ns a
nd m
easu
res
per 1
00 0
00
pop.
Of w
hich
: % v
erdi
ct /
adm
oniti
on o
nly
Of w
hich
: % fi
nes
Of which: % non-custodial sanctions and measures
Of which: % suspended custodial sanctions and measures
Of which: % unsuspended custodial sanctions and measures
Of w
hich
: % o
ther
mea
sure
s
Tota
l
Of w
hich
: % c
omm
unity
se
rvic
e
Of w
hich
: % s
uper
visi
on
Of w
hich
: % p
roba
tion
as a
sa
nctio
n of
its
own
right
Tota
l
Of w
hich
: % w
ith c
omm
unity
se
rvic
e
Of w
hich
: % w
ith s
uper
visi
on
Tota
l
Of w
hich
: % p
artia
lly
susp
ende
d
Of w
hich
: % p
sych
iatri
c ho
spita
l
Albania 270 59.1 41.4 13.5 ... ... ... ... ... ... 45.1 ... ... ... Armenia 137 ... 17.7 19.4 0.1 8.5 ... ... ... ... ... ... ... 0.0 Austria 458 ... 31.8 ... ... ... ... 43.1 ... ... 50.4 16.6 ... ... Bulgaria 517 ... 5.4 ... ... ... ... ... ... ... 57.4 ... ... 2.0 Croatia 670 1.1 4.4 7.8 36.8 63.2 ... 57.3 ... ... 15.6 ... ... 21.6 Cyprus ... ... ... ... ... ... ... ... ... ... ... ... ... ... Czech Republic 672 2.9 4.9 ... ... ... ... 62.8 ... 6.3 16.7 ... ... 1.8 Denmark 2611 ... 83.9 ... ... ... ... 7.8 ... ... 6.8 ... ... 1.5 Estonia 681 ... ... ... ... ... ... ... ... ... ... ... ... ... Finland 3851 0.0 87.9 1.3 99.2 0.8 ... 7.3 1.2 ... 3.1 ... ... 0.4 France 1082 1.0 39.5 15.7 ... ... ... 26.0 5.1 30.6 17.8 27.5 ... ... Georgia 382 ... ... ... ... ... ... ... ... ... ... ... ... ... Germany 1005 1.0 70.0 11.1 ... ... ... 12.5 ... ... 5.4 ... ... ... Greece 384 ... 47.9 ... ... ... ... ... ... ... ... ... ... ... Hungary 892 0.5 32.4 66.1 16.9 ... 13.4 22.3 50.2 ... 11.6 ... ... ... Ireland ... ... ... ... ... ... ... ... ... ... ... ... ... ... Italy ... ... ... ... ... ... ... ... ... ... ... ... ... ... Kosovo (UNR) 449 2.0 46.8 ... ... ... ... ... ... ... ... ... ... ... Latvia ... ... ... ... ... ... ... ... ... ... ... ... ... ... Lithuania 471 0.7 31.0 12.4 60.1 ... ... 12.8 ... ... 52.9 ... ... ... Malta ... ... ... ... ... ... ... ... ... ... ... ... ... ... Netherlands 578 1.1 38.9 25.6 98.9 ... ... 10.4 75.9 ... 23.0 33.5 0.6 0.9 Poland 1134 ... 21.3 11.5 100.0 ... ... 58.0 ... 27.5 9.2 ... ... 0.0 Portugal 732 1.5 67.5 0.5 19.2 ... ... 18.5 ... 54.7 8.1 ... 0.2 0.2 Serbia 297 0.8 11.1 60.9 0.5 ... ... 59.2 ... ... 27.2 ... ... ... Slovakia ... ... ... ... ... ... ... ... ... ... ... ... ... ... Slovenia 395 1.5 3.0 0.0 ... ... ... ... ... ... 15.0 ... ... 0.7 Spain ... ... ... ... ... ... ... ... ... ... ... ... ... ... Sweden 1479 46.1 26.1 5.3 19.2 ... ... 8.3 41.0 ... 9.6 1.4 1.8 4.6 Switzerland 1339 ... ... 90.6 4.6 ... ... 2.4 ... ... 7.0 ... ... ... Turkey 1673 ... 29.4 12.3 ... ... ... 6.3 ... ... 17.6 ... ... 34.5 Ukraine 369 ... 14.9 ... ... ... ... ... ... ... 24.2 ... ... 3.5 UK: E & W 2458 ... 65.3 92.5 ... ... ... 3.5 ... ... 7.5 ... ... 9.7 UK: N. Ireland 1602 ... 63.0 9.7 30.0 42.4 ... 9.6 ... ... 8.9 ... ... 3.7 UK: Scotland 1252 17.0 41.4 20.9 47.4 1.5 47.7 ... ... ... 20.7 ... 0.1 ... Mean 994 9.1 37.1 25.1 41.0 23.3 30.5 23.8 34.7 29.8 20.0 19.7 0.7 5.7 Median 677 1.1 32.4 12.4 30.0 8.5 30.5 12.7 41.0 29.1 15.6 22.0 0.4 1.8 Minimum 137 0.0 3.0 0.0 0.1 0.8 13.4 2.4 1.2 6.3 3.1 1.4 0.1 0.0 Maximum 3851 59.1 87.9 92.5 100.0 63.2 47.7 62.8 75.9 54.7 57.4 33.5 1.8 34.5

197
Table 3.2.3.2 Total persons receiving sanctions/measures in 2010 – Criminal offences: Major traffic offences
To
tal s
anct
ions
and
mea
sure
s pe
r 100
000
po
p.
Of w
hich
: % v
erdi
ct /
adm
oniti
on o
nly
Of w
hich
: % fi
nes
Of which: % non-custodial sanctions and measures
Of which: % suspended custodial sanctions and measures
Of which: % unsuspended custodial sanctions and measures
Of w
hich
: % o
ther
mea
sure
s
Tota
l
Of w
hich
: % c
omm
unity
se
rvic
e
Of w
hich
: % s
uper
visi
on
Of w
hich
: % p
roba
tion
as a
sa
nctio
n of
its
own
right
Tota
l
Of w
hich
: % w
ith c
omm
unity
se
rvic
e
Of w
hich
: % w
ith s
uper
visi
on
Tota
l
Of w
hich
: % p
artia
lly
susp
ende
d
Of w
hich
: % p
sych
iatri
c ho
spita
l
Albania 26 27.6 72.4 ... ... ... ... ... ... ... ... ... ... ... Armenia 4 ... 4.2 4.2 0.0 0.0 ... ... ... 0.0 ... ... 0.0 0.0 Austria ... ... ... ... ... ... ... ... ... ... ... ... ... ... Bulgaria 150 ... 1.8 ... ... ... ... ... ... ... 37.0 ... ... 0.5 Croatia 43 ... 15.4 2.8 84.9 15.1 ... 58.0 ... ... 10.9 ... ... 15.6 Cyprus ... ... ... ... ... ... ... ... ... ... ... ... ... ... Czech Republic ... ... ... ... ... ... ... ... ... ... ... ... ... ... Denmark ... ... ... ... ... ... ... ... ... ... ... ... ... ... Estonia ... ... ... ... ... ... ... ... ... ... ... ... ... ... Finland 2221 0.0 90.7 1.3 99.7 0.3 ... 6.3 0.0 ... 1.6 ... ... 0.1 France 453 0.2 57.7 15.2 ... ... ... 18.6 4.7 33.5 8.3 15.6 ... ... Georgia 25 ... ... ... ... ... ... ... ... ... ... ... ... ... Germany 214 0.3 86.6 6.0 ... ... ... 5.5 ... ... 1.6 ... ... ... Greece 138 ... 56.5 91.2 ... ... ... 8.8 ... ... ... ... ... ... Hungary 10 0.1 33.1 43.6 2.1 ... 24.4 3.3 93.8 ... 10.3 ... ... ... Ireland ... ... ... ... ... ... ... ... ... ... ... ... ... ... Italy ... ... ... ... ... ... ... ... ... ... ... ... ... ... Kosovo (UNR) 61 1.3 49.6 ... ... ... ... ... ... ... ... ... ... ... Latvia ... ... ... ... ... ... ... ... ... ... ... ... ... ... Lithuania ... ... ... ... ... ... ... ... ... ... ... ... ... ... Malta ... ... ... ... ... ... ... ... ... ... ... ... ... ... Netherlands 106 0.4 72.7 16.3 93.7 ... ... 3.3 83.3 ... 7.0 8.6 0.0 0.3 Poland 354 ... 37.8 17.0 100.0 ... ... 43.3 ... 9.1 2.0 ... ... 0.0 Portugal 337 2.2 81.5 0.1 92.5 ... ... 8.8 ... 45.5 3.4 ... ... 0.2 Serbia 41 0.8 23.1 67.2 0.4 ... ... 65.3 ... ... 8.5 ... ... ... Slovakia ... ... ... ... ... ... ... ... ... ... ... ... ... ... Slovenia 18 10.0 0.6 0.0 ... ... ... ... ... ... 15.0 ... ... 0.8 Spain ... ... ... ... ... ... ... ... ... ... ... ... ... ... Sweden 299 56.4 20.8 4.7 26.9 ... ... 4.3 89.2 ... 12.2 0.1 0.1 1.6 Switzerland ... ... ... ... ... ... ... ... ... ... ... ... ... ... Turkey 8 ... 75.2 6.6 ... ... ... 2.7 ... ... 10.1 ... ... 5.4 Ukraine 15 ... ... ... ... ... ... ... ... ... ... ... ... ... UK: E & W 6 ... 8.8 66.4 ... ... ... 26.0 ... ... 33.6 ... ... 2.6 UK: N. Ireland 155 ... 89.6 2.8 14.3 81.8 ... 4.4 ... ... 2.6 ... ... 0.6 UK: Scotland 137 3.2 79.1 11.3 58.7 3.8 37.5 ... ... ... 6.3 ... 0.0 ... Mean 219 8.6 47.9 21.0 52.1 20.2 30.9 18.5 54.2 22.0 10.7 8.1 0.0 2.3 Median 84 1.0 53.0 6.6 58.7 3.8 30.9 7.6 83.3 21.3 8.4 8.6 0.0 0.6 Minimum 4 0.0 0.6 0.0 0.0 0.0 24.4 2.7 0.0 0.0 1.6 0.1 0.0 0.0 Maximum 2221 56.4 90.7 91.2 100.0 81.8 37.5 65.3 93.8 45.5 37.0 15.6 0.1 15.6

198
Table 3.2.3.3 Total persons receiving sanctions/measures in 2010 – Intentional homicide: Total
Tota
l san
ctio
ns a
nd m
easu
res
per 1
00 0
00
pop.
Of w
hich
: % v
erdi
ct /
adm
oniti
on o
nly
Of w
hich
: % fi
nes
Of which: % non-custodial sanctions and measures
Of which: % suspended custodial sanctions and measures
Of which: % unsuspended custodial sanctions and measures
Of w
hich
: % o
ther
mea
sure
s
Tota
l
Of w
hich
: % c
omm
unity
ser
vice
Of w
hich
: % s
uper
visi
on
Of w
hich
: % p
roba
tion
as a
sa
nctio
n of
its
own
right
Tota
l
Of w
hich
: % w
ith c
omm
unity
se
rvic
e
Of w
hich
: % w
ith s
uper
visi
on
Tota
l
Of w
hich
: % p
artia
lly
susp
ende
d
Of w
hich
: % p
sych
iatri
c ho
spita
l
Albania 5.7 98.2 1.8 ... ... ... ... ... ... ... ... ... ... ... Armenia 2.7 ... 3.4 3.4 0.0 33.3 ... ... ... ... ... ... ... 0.0 Austria 0.6 ... ... ... ... ... ... 1.9 ... ... 78.8 4.9 ... ... Bulgaria 2.1 ... 0.0 ... ... ... ... ... ... ... 98.8 ... ... 0.0 Croatia 5.1 ... ... 0.9 50.0 50.0 ... 3.1 ... ... 59.3 ... ... 37.6 Cyprus ... ... ... ... ... ... ... ... ... ... ... ... ... ... Czech Republic 1.0 0.0 0.0 ... 0.0 ... ... 3.7 ... ... 96.3 ... ... ... Denmark ... ... ... ... ... ... ... ... ... ... ... ... ... ... Estonia ... ... ... ... ... ... ... ... ... ... ... ... ... ... Finland 3.4 0.0 0.0 0.0 ... ... ... 2.2 0.0 ... 91.8 ... ... 6.0 France 1.0 0.0 0.0 0.0 ... ... ... 1.7 0.0 27.3 98.3 10.1 ... ... Georgia 9.2 ... ... ... ... ... ... ... ... ... ... ... ... ... Germany 0.8 0.1 0.1 0.6 ... ... ... 7.2 ... ... 91.9 ... ... ... Greece 0.2 ... ... ... ... ... ... 100.0 ... ... ... ... ... ... Hungary 2.2 ... ... 1.8 50.0 ... 50.0 7.1 12.5 ... 91.1 ... ... ... Ireland ... ... ... ... ... ... ... ... ... ... ... ... ... ... Italy ... ... ... ... ... ... ... ... ... ... ... ... ... ... Kosovo (UNR) 5.8 0.0 1.6 ... ... ... ... ... ... ... ... ... ... ... Latvia ... ... ... ... ... ... ... ... ... ... ... ... ... ... Lithuania ... ... ... ... ... ... ... ... ... ... ... ... ... ... Malta ... ... ... ... ... ... ... ... ... ... ... ... ... ... Netherlands 5.0 0.2 0.6 3.9 121.9 ... ... 8.1 89.6 ... 86.4 47.7 4.8 0.7 Poland 2.0 ... 0.4 0.3 100.0 ... ... 2.4 ... 50.0 96.2 ... ... 0.8 Portugal 2.5 ... ... ... ... ... ... 25.2 ... 84.8 73.3 ... ... ... Serbia 2.4 0.0 0.0 3.5 0.0 ... ... 2.3 ... ... 96.5 ... ... ... Slovakia ... ... ... ... ... ... ... ... ... ... ... ... ... ... Slovenia 0.4 0.0 0.0 0.0 ... ... ... ... ... ... 87.5 ... ... 12.5 Spain ... ... ... ... ... ... ... ... ... ... ... ... ... ... Sweden 1.8 0.0 0.0 0.6 100.0 ... ... 0.6 0.0 ... 98.8 0.0 15.9 0.0 Switzerland ... ... ... ... ... ... ... ... ... ... ... ... ... ... Turkey 21.9 ... 0.2 43.5 ... ... ... 0.3 ... ... 54.5 ... ... 1.5 Ukraine 4.0 ... ... ... ... ... ... ... ... ... 93.0 ... ... ... UK: E & W 2.9 ... 0.6 32.2 ... ... ... 10.2 ... ... 67.8 ... ... 5.2 UK: N. Ireland 1.4 ... 0.0 0.0 ... ... ... 0.0 ... ... 100.0 ... ... 0.0 UK: Scotland 2.7 0.0 0.0 0.7 0.0 0.0 0.0 ... ... ... 99.3 ... 0.7 ... Mean 3.6 9.0 0.5 6.1 46.9 27.8 25.0 11.0 20.4 54.0 87.3 15.7 7.1 5.9 Median 2.4 0.0 0.0 0.7 50.0 33.3 25.0 2.7 0.0 50.0 91.9 7.5 4.8 0.8 Minimum 0.2 0.0 0.0 0.0 0.0 0.0 0.0 0.0 0.0 27.3 54.5 0.0 0.7 0.0 Maximum 21.9 98.2 3.4 43.5 121.9 50.0 50.0 100.0 89.6 84.8 100.0 47.7 15.9 37.6

199
Table 3.2.3.4 Total persons receiving sanctions/measures in 2010 – Intentional homicide: Completed
To
tal s
anct
ions
and
mea
sure
s pe
r 100
000
po
p.
Of w
hich
: % v
erdi
ct /
adm
oniti
on o
nly
Of w
hich
: % fi
nes
Of which: % non-custodial sanctions and measures
Of which: % suspended custodial sanctions and measures
Of which: % unsuspended custodial sanctions and measures
Of w
hich
: % o
ther
mea
sure
s
Tota
l
Of w
hich
: % c
omm
unity
se
rvic
e
Of w
hich
: % s
uper
visi
on
Of w
hich
: % p
roba
tion
as a
sa
nctio
n of
its
own
right
Tota
l
Of w
hich
: % w
ith c
omm
unity
se
rvic
e
Of w
hich
: % w
ith s
uper
visi
on
Tota
l
Of w
hich
: % p
artia
lly
susp
ende
d
Of w
hich
: % p
sych
iatri
c ho
spita
l
Albania ... ... ... ... ... ... ... ... ... ... ... ... ... ... Armenia ... ... ... ... 0.0 ... ... ... ... ... ... ... ... 0.0 Austria 0.5 ... ... ... ... ... ... 2.6 ... ... 82.1 ... ... ... Bulgaria 1.7 ... 0.0 ... ... ... ... ... ... ... 98.4 ... ... 0.0 Croatia 1.1 ... ... ... ... ... ... 14.9 ... ... 85.1 ... ... ... Cyprus ... ... ... ... ... ... ... ... ... ... ... ... ... ... Czech Republic ... ... ... ... ... ... ... ... ... ... ... ... ... ... Denmark 1.0 0.0 0.0 ... ... ... ... 0.0 ... ... 86.0 ... ... ... Estonia ... ... ... ... ... ... ... ... ... ... ... ... ... ... Finland 1.4 0.0 0.0 0.0 ... ... ... 0.0 ... ... 95.9 ... ... 4.1 France ... ... ... ... ... ... ... ... ... ... ... ... ... ... Georgia ... ... ... ... ... ... ... ... ... ... ... ... ... ... Germany ... ... ... ... ... ... ... ... ... ... ... ... ... ... Greece 0.1 ... ... ... ... ... ... ... ... ... ... ... ... ... Hungary 1.4 ... ... 2.9 50.0 ... 50.0 3.7 40.0 ... 93.4 ... ... ... Ireland ... ... ... ... ... ... ... ... ... ... ... ... ... ... Italy ... ... ... ... ... ... ... ... ... ... ... ... ... ... Kosovo (UNR) 3.6 0.0 2.5 ... ... ... ... ... ... ... ... ... ... ... Latvia ... ... ... ... ... ... ... ... ... ... ... ... ... ... Lithuania ... ... ... ... ... ... ... ... ... ... ... ... ... ... Malta ... ... ... ... ... ... ... ... ... ... ... ... ... ... Netherlands ... ... ... ... ... ... ... ... ... ... ... ... ... ... Poland 1.5 ... ... ... ... ... ... ... ... ... ... ... ... ... Portugal 1.1 ... ... ... ... ... ... 10.3 ... 83.3 87.9 ... ... ... Serbia 1.9 0.0 0.0 0.0 ... ... ... ... ... ... ... ... ... ... Slovakia ... ... ... ... ... ... ... ... ... ... ... ... ... ... Slovenia ... ... ... ... ... ... ... ... ... ... ... ... ... ... Spain ... ... ... ... ... ... ... ... ... ... ... ... ... ... Sweden ... ... ... ... ... ... ... ... ... ... ... ... ... ... Switzerland ... ... ... ... ... ... ... ... ... ... ... ... ... ... Turkey ... ... ... ... ... ... ... ... ... ... ... ... ... ... Ukraine ... ... ... ... ... ... ... ... ... ... ... ... ... ... UK: E & W 0.6 ... 0.0 0.0 ... ... ... 0.0 ... ... 100.0 ... ... 0.0 UK: N. Ireland 1.3 ... 0.0 0.0 ... ... ... 0.0 ... ... 100.0 ... ... 0.0 UK: Scotland 1.6 0.0 0.0 0.0 ... ... ... ... ... ... 100.0 ... 1.2 ... Mean 1.3 0.0 0.3 0.5 25.0 ... 50.0 3.9 40.0 83.3 92.9 ... 1.2 0.8 Median 1.3 0.0 0.0 0.0 25.0 ... 50.0 1.3 40.0 83.3 94.7 ... 1.2 0.0 Minimum 0.1 0.0 0.0 0.0 0.0 0.0 50.0 0.0 40.0 83.3 82.1 0.0 1.2 0.0 Maximum 3.6 0.0 2.5 2.9 50.0 0.0 50.0 14.9 40.0 83.3 100.0 0.0 1.2 4.1

200
Table 3.2.3.5 Total persons receiving sanctions/measures in 2010 – Bodily injury (Assault): Total
Tota
l san
ctio
ns a
nd m
easu
res
per 1
00 0
00
pop .
Of w
hich
: % v
erdi
ct /
adm
oniti
on o
nly
Of w
hich
: % fi
nes
Of which: % non-custodial sanctions and measures
Of which: % suspended custodial sanctions and measures
Of which: % unsuspended custodial sanctions and measures
Of w
hich
: % o
ther
mea
sure
s
Tota
l
Of w
hich
: % c
omm
unity
ser
vice
Of w
hich
: % s
uper
visi
on
Of w
hich
: % p
roba
tion
as a
sa
nctio
n of
its
own
right
Tota
l
Of w
hich
: % w
ith c
omm
unity
se
rvic
e
Of w
hich
: % w
ith s
uper
visi
on
Tota
l
Of w
hich
: % p
artia
lly
susp
ende
d
Of w
hich
: % p
sych
iatri
c ho
spita
l
Albania 16 35.4 64.6 ... ... ... ... ... ... ... ... ... ... ... Armenia 7 ... 19.6 19.6 0.0 0.0 ... ... ... ... ... ... ... 0.0 Austria 72 ... 46.9 ... ... ... ... 40.1 ... ... 52.0 4.6 ... ... Bulgaria 15 ... 5.1 ... ... ... ... ... ... ... 49.5 ... ... 2.5 Croatia 27 1.3 3.6 3.2 84.2 15.8 ... 59.8 ... ... 10.7 ... ... 24.5 Cyprus ... ... ... ... ... ... ... ... ... ... ... ... ... ... Czech Republic 26 2.2 2.3 ... ... ... ... 72.8 ... ... 12.1 ... ... ... Denmark ... ... ... ... ... ... ... ... ... ... ... ... ... ... Estonia ... ... ... ... ... ... ... ... ... ... ... ... ... ... Finland 192 0.0 62.0 3.9 98.8 1.2 ... 22.5 2.3 ... 9.9 ... ... 1.7 France 118 1.7 19.8 15.0 ... ... ... 40.5 3.8 36.3 23.0 42.9 ... ... Georgia 9 ... ... ... ... ... ... ... ... ... ... ... ... ... Germany 98 1.3 41.3 25.9 ... ... ... 24.0 ... ... 7.5 ... ... ... Greece 14 ... 0.2 121.1 ... ... ... 1.6 ... ... ... ... ... ... Hungary 55 0.9 21.7 54.9 15.4 ... 43.0 2.4 354.5 ... 11.1 ... ... ... Ireland ... ... ... ... ... ... ... ... ... ... ... ... ... ... Italy ... ... ... ... ... ... ... ... ... ... ... ... ... ... Kosovo (UNR) 60 3.3 46.3 ... ... ... ... ... ... ... ... ... ... ... Latvia ... ... ... ... ... ... ... ... ... ... ... ... ... ... Lithuania ... ... ... ... ... ... ... ... ... ... ... ... ... ... Malta ... ... ... ... ... ... ... ... ... ... ... ... ... ... Netherlands 71 1.7 26.1 40.0 99.8 ... ... 15.8 77.5 ... 15.3 54.4 1.7 1.1 Poland 90 ... 6.9 8.1 100.0 ... ... 74.4 ... 57.8 10.6 ... ... 0.0 Portugal 68 0.6 57.8 1.9 3.6 ... ... 31.8 ... 57.2 3.2 ... 1.3 0.2 Serbia 16 0.6 10.3 67.5 0.2 ... ... 66.3 ... ... 21.7 ... ... ... Slovakia ... ... ... ... ... ... ... ... ... ... ... ... ... ... Slovenia 23 5.2 3.9 0.0 ... ... ... ... ... ... 4.6 ... ... 0.9 Spain ... ... ... ... ... ... ... ... ... ... ... ... ... ... Sweden 102 5.5 12.0 14.3 30.6 ... ... 32.0 68.4 ... 17.7 2.4 3.9 18.5 Switzerland ... ... ... ... ... ... ... ... ... ... ... ... ... ... Turkey 146 ... 40.2 14.1 ... ... ... 13.5 ... ... 20.7 ... ... 11.5 Ukraine 19 ... ... ... ... ... ... ... ... ... ... ... ... ... UK: E & W 76 ... 4.8 69.8 ... ... ... 20.3 ... ... 30.2 ... ... 7.7 UK: N. Ireland 46 ... 10.0 19.4 46.3 43.8 ... 32.9 ... ... 28.8 ... ... ... UK: Scotland 293 18.5 33.7 28.3 41.3 0.7 47.5 ... ... ... 19.4 ... 0.1 ... Mean 69 5.6 24.5 29.8 47.3 12.3 45.2 34.4 101.3 50.5 19.3 26.1 1.7 6.2 Median 58 1.7 19.7 19.4 41.3 1.2 45.2 31.9 68.4 57.2 16.5 23.7 1.5 1.7 Minimum 7 0.0 0.2 0.0 0.0 0.0 43.0 1.6 2.3 36.3 3.2 2.4 0.1 0.0 Maximum 293 35.4 64.6 121.1 100.0 43.8 47.5 74.4 354.5 57.8 52.0 54.4 3.9 24.5

201
Table 3.2.3.6 Total persons receiving sanctions/measures in 2010 – Bodily injury (Assault): Aggravated bodily injury
To
tal s
anct
ions
and
mea
sure
s pe
r 100
000
po
p.
Of w
hich
: % v
erdi
ct /
adm
oniti
on o
nly
Of w
hich
: % fi
nes
Of which: % non-custodial sanctions and measures
Of which: % suspended custodial sanctions and measures
Of which: % unsuspended custodial sanctions and measures
Of w
hich
: % o
ther
mea
sure
s
Tota
l
Of w
hich
: % c
omm
unity
ser
vice
Of w
hich
: % s
uper
visi
on
Of w
hich
: % p
roba
tion
as a
sa
nctio
n of
its
own
right
Tota
l
Of w
hich
: % w
ith c
omm
unity
se
rvic
e
Of w
hich
: % w
ith s
uper
visi
on
Tota
l
Of w
hich
: % p
artia
lly
susp
ende
d
Of w
hich
: % p
sych
iatri
c ho
spita
l
Albania 3.8 98.3 1.7 ... ... ... ... ... ... ... ... ... ... ... Armenia 4.7 ... 2.0 2.0 0.0 0.0 ... ... ... ... ... ... ... 0.0 Austria 15.5 ... 13.5 ... ... ... ... 55.3 ... ... 33.3 27.9 ... ... Bulgaria ... ... ... ... ... ... ... ... ... ... ... ... ... ... Croatia 14.0 ... 0.5 4.8 83.3 16.7 ... 67.0 ... ... 16.3 ... ... 16.3 Cyprus ... ... ... ... ... ... ... ... ... ... ... ... ... ... Czech Republic 3.9 0.5 0.0 ... ... ... ... 71.7 ... ... 27.3 ... ... ... Denmark ... ... ... ... ... ... ... ... ... ... ... ... ... ... Estonia ... ... ... ... ... ... ... ... ... ... ... ... ... ... Finland 12.1 0.0 0.2 1.4 100.0 0.0 ... 45.7 16.3 ... 51.3 ... ... 1.4 France 14.1 1.2 5.2 7.9 ... ... ... 49.2 2.9 36.3 36.5 59.8 ... ... Georgia 3.6 ... ... ... ... ... ... ... ... ... ... ... ... ... Germany 36.7 0.8 13.0 34.0 ... ... ... 41.7 ... ... 10.6 ... ... ... Greece 0.2 ... ... 96.0 ... ... ... 28.0 ... ... ... ... ... ... Hungary 42.3 0.1 22.7 49.2 19.3 ... 33.8 2.3 414.4 ... 11.4 ... ... ... Ireland ... ... ... ... ... ... ... ... ... ... ... ... ... ... Italy ... ... ... ... ... ... ... ... ... ... ... ... ... ... Kosovo (UNR) 4.9 0.0 7.4 ... ... ... ... ... ... ... ... ... ... ... Latvia ... ... ... ... ... ... ... ... ... ... ... ... ... ... Lithuania ... ... ... ... ... ... ... ... ... ... ... ... ... ... Malta ... ... ... ... ... ... ... ... ... ... ... ... ... ... Netherlands 10.3 0.6 3.3 35.9 99.8 ... ... 25.6 88.8 ... 33.8 65.3 2.1 0.8 Poland 2.8 ... 0.8 0.3 100.0 ... ... 66.2 ... 47.2 32.8 ... ... 0.0 Portugal 2.7 ... 21.9 ... ... ... ... 45.9 ... 65.4 10.6 ... ... ... Serbia 6.6 0.0 1.0 63.6 0.0 ... ... 62.6 ... ... 35.3 ... ... ... Slovakia ... ... ... ... ... ... ... ... ... ... ... ... ... ... Slovenia 5.6 0.0 0.0 0.0 ... ... ... ... ... ... 16.5 ... ... 1.7 Spain ... ... ... ... ... ... ... ... ... ... ... ... ... ... Sweden 8.7 0.2 0.1 14.4 29.9 ... ... 3.8 96.8 ... 70.6 5.4 3.7 10.9 Switzerland ... ... ... ... ... ... ... ... ... ... ... ... ... ... Turkey 2.2 ... 12.9 24.3 ... ... ... 15.8 ... ... 37.5 ... ... 9.5 Ukraine 7.1 ... ... ... ... ... ... ... ... ... 64.9 ... ... ... UK: E & W ... ... ... ... ... ... ... 0.0 ... ... ... ... ... ... UK: N. Ireland 2.8 ... 4.0 6.0 0.0 33.3 ... 8.0 ... ... 78.0 ... ... 4.0 UK: Scotland 25.9 1.8 6.9 40.1 58.3 0.0 37.5 ... ... ... 51.2 ... 0.3 ... Mean 10.5 8.6 6.2 25.3 49.1 10.0 35.6 36.8 123.8 49.6 36.3 39.6 2.0 4.9 Median 6.1 0.4 3.3 14.4 44.1 0.0 35.6 43.7 88.8 47.2 33.8 43.9 2.1 1.7 Minimum 0.2 0.0 0.0 0.0 0.0 0.0 33.8 0.0 2.9 36.3 10.6 5.4 0.3 0.0 Maximum 42.3 98.3 22.7 96.0 100.0 33.3 37.5 71.7 414.4 65.4 78.0 65.3 3.7 16.3

202
Table 3.2.3.7 Total persons receiving sanctions/measures in 2010 – Sexual assault: Total
Tota
l san
ctio
ns a
nd m
easu
res
per 1
00 0
00
pop.
Of w
hich
: % v
erdi
ct /
adm
oniti
on o
nly
Of w
hich
: % fi
nes
Of which: % non-custodial sanctions and measures
Of which: % suspended custodial sanctions and measures
Of which: % unsuspended custodial sanctions and measures
Of w
hich
: % o
ther
mea
sure
s
Tota
l
Of w
hich
: % c
omm
unity
se
rvic
e
Of w
hich
: % s
uper
visi
on
Of w
hich
: % p
roba
tion
as a
sa
nctio
n of
its
own
right
Tota
l
Of w
hich
: % w
ith c
omm
unity
se
rvic
e
Of w
hich
: % w
ith s
uper
visi
on
Tota
l
Of w
hich
: % p
artia
lly
susp
ende
d
Of w
hich
: % p
sych
iatri
c ho
spita
l
Albania 1.1 100.0 0.0 ... ... ... ... ... ... ... ... ... ... ... Armenia 1.3 ... 35.7 35.7 0.0 0.0 ... ... ... ... ... ... 0.0 0.0 Austria 4.0 ... 0.3 ... ... ... ... 29.0 ... ... 57.5 32.3 ... ... Bulgaria 3.5 ... 0.0 ... ... ... ... ... ... ... 89.7 ... ... 2.3 Croatia 5.4 ... ... 4.6 81.8 18.2 ... 32.8 ... ... 51.5 ... ... 15.8 Cyprus ... ... ... ... ... ... ... ... ... ... ... ... ... ... Czech Republic 5.0 10.2 0.0 ... ... ... ... 59.8 ... ... 29.5 ... ... ... Denmark ... ... ... ... ... ... ... ... ... ... ... ... ... ... Estonia ... ... ... ... ... ... ... ... ... ... ... ... ... ... Finland 8.6 0.0 5.8 3.0 100.0 0.0 ... 66.2 8.8 ... 23.6 ... ... 1.3 France 10.7 0.6 1.3 9.4 ... ... ... 47.0 0.2 50.7 41.8 45.4 ... ... Georgia 1.9 ... ... ... ... ... ... ... ... ... ... ... ... ... Germany 4.7 0.3 3.0 9.8 ... ... ... 55.4 ... ... 31.6 ... ... ... Greece 0.4 ... 2.3 97.7 ... ... ... ... ... ... ... ... ... ... Hungary 3.3 ... 4.9 12.5 4.9 ... 70.7 28.0 2.2 ... 59.5 ... ... ... Ireland ... ... ... ... ... ... ... ... ... ... ... ... ... ... Italy ... ... ... ... ... ... ... ... ... ... ... ... ... ... Kosovo (UNR) 3.3 0.0 56.9 ... ... ... ... ... ... ... ... ... ... ... Latvia ... ... ... ... ... ... ... ... ... ... ... ... ... ... Lithuania ... ... ... ... ... ... ... ... ... ... ... ... ... ... Malta ... ... ... ... ... ... ... ... ... ... ... ... ... ... Netherlands 4.8 1.1 2.8 19.3 99.4 ... ... 28.2 78.7 ... 47.6 68.2 1.8 1.0 Poland 4.1 ... 0.1 0.3 100.0 ... ... 48.4 ... 65.4 51.1 ... ... 0.1 Portugal 4.7 ... 12.0 ... ... ... ... 54.7 ... 60.1 31.5 ... 1.9 ... Serbia 2.2 0.0 3.0 21.3 0.0 ... ... 20.7 ... ... 75.6 ... ... ... Slovakia ... ... ... ... ... ... ... ... ... ... ... ... ... ... Slovenia 4.5 0.0 0.0 0.0 ... ... ... ... ... ... 39.8 ... ... 2.2 Spain ... ... ... ... ... ... ... ... ... ... ... ... ... ... Sweden 5.2 0.0 0.2 9.1 13.6 ... ... 5.6 77.8 ... 74.7 1.9 4.1 10.5 Switzerland ... ... ... ... ... ... ... ... ... ... ... ... ... ... Turkey 13.1 ... 13.7 31.3 ... ... ... 3.3 ... ... 48.3 ... ... 3.2 Ukraine ... ... ... ... ... ... ... ... ... ... ... ... ... ... UK: E & W 10.4 ... 1.9 43.1 ... ... ... 8.1 ... ... 56.9 ... ... 4.6 UK: N. Ireland 7.3 ... 3.1 24.4 6.3 93.8 ... 16.0 ... ... 55.0 ... ... 1.5 UK: Scotland 2.0 8.5 5.7 37.7 30.0 0.0 67.5 ... ... ... 48.1 ... 3.9 ... Mean 4.9 11.0 7.3 22.4 43.6 22.4 69.1 33.6 33.5 58.8 50.7 36.9 2.4 3.9 Median 4.5 0.3 2.8 15.9 21.8 0.0 69.1 29.0 8.8 60.1 49.7 38.9 1.9 2.2 Minimum 0.4 0.0 0.0 0.0 0.0 0.0 67.5 3.3 0.2 50.7 23.6 1.9 0.0 0.0 Maximum 13.1 100.0 56.9 97.7 100.0 93.8 70.7 66.2 78.7 65.4 89.7 68.2 4.1 15.8

203
Table 3.2.3.8 Total persons receiving sanctions/measures in 2010 – Sexual assault: Rape
To
tal s
anct
ions
and
mea
sure
s pe
r 100
000
po
p.
Of w
hich
: % v
erdi
ct /
adm
oniti
on o
nly
Of w
hich
: % fi
nes
Of which: % non-custodial sanctions and measures
Of which: % suspended custodial sanctions and measures
Of which: % unsuspended custodial sanctions and measures
Of w
hich
: % o
ther
mea
sure
s
Tota
l
Of w
hich
: % c
omm
unity
ser
vice
Of w
hich
: % s
uper
visi
on
Of w
hich
: % p
roba
tion
as a
sa
nctio
n of
its
own
right
Tota
l
Of w
hich
: % w
ith c
omm
unity
se
rvic
e
Of w
hich
: % w
ith s
uper
visi
on
Tota
l
Of w
hich
: % p
artia
lly s
uspe
nded
Of w
hich
: % p
sych
iatri
c ho
spita
l
Albania 0.6 100.0 0.0 ... ... ... ... ... ... ... ... ... ... ... Armenia 0.6 ... 0.0 0.0 ... ... ... ... ... ... ... ... 0.0 0.0 Austria 2.0 ... ... ... ... ... ... 25.3 ... ... 59.4 29.7 ... ... Bulgaria 2.0 ... 0.0 ... ... ... ... ... ... ... 98.0 ... ... 1.3 Croatia 1.8 ... ... ... ... ... ... 7.5 ... ... 76.3 ... ... 16.3 Cyprus ... ... ... ... ... ... ... ... ... ... ... ... ... ... Czech Republic 1.7 1.1 0.0 ... 0.0 ... ... 41.4 ... ... 57.5 ... ... ... Denmark ... ... ... ... ... ... ... ... ... ... ... ... ... ... Estonia ... ... ... ... ... ... ... ... ... ... ... ... ... ... Finland 1.8 0.0 2.1 1.1 100.0 0.0 ... 47.4 13.3 ... 49.5 ... ... 0.0 France 2.1 0.0 0.0 2.1 ... ... ... 16.6 0.0 64.0 81.3 17.9 ... ... Georgia 1.0 ... ... ... ... ... ... ... ... ... ... ... ... ... Germany 1.1 0.0 0.3 3.8 ... ... ... 42.3 ... ... 53.6 ... ... ... Greece 0.2 ... 4.8 14.3 ... ... ... 81.0 ... ... ... ... ... ... Hungary 1.0 ... ... 2.0 ... ... 50.0 14.1 7.1 ... 83.8 ... ... ... Ireland ... ... ... ... ... ... ... ... ... ... ... ... ... ... Italy ... ... ... ... ... ... ... ... ... ... ... ... ... ... Kosovo (UNR) 0.9 0.0 0.0 ... ... ... ... ... ... ... ... ... ... ... Latvia ... ... ... ... ... ... ... ... ... ... ... ... ... ... Lithuania ... ... ... ... ... ... ... ... ... ... ... ... ... ... Malta ... ... ... ... ... ... ... ... ... ... ... ... ... ... Netherlands 0.8 0.7 0.0 1.5 50.0 ... ... 8.8 66.7 ... 88.3 51.2 2.5 0.7 Poland 2.2 ... 0.2 0.0 ... ... ... 39.8 ... 58.3 59.9 ... ... 0.1 Portugal 0.7 ... ... ... ... ... ... 37.2 ... 86.2 60.3 ... ... ... Serbia 0.8 0.0 0.0 4.8 0.0 ... ... 3.2 ... ... 95.2 ... ... ... Slovakia ... ... ... ... ... ... ... ... ... ... ... ... ... ... Slovenia 0.8 0.0 0.0 0.0 ... ... ... ... ... ... 68.8 ... ... 0.0 Spain ... ... ... ... ... ... ... ... ... ... ... ... ... ... Sweden 3.8 0.0 0.0 6.0 9.5 ... ... 2.0 57.1 ... 86.9 2.0 4.6 5.1 Switzerland ... ... ... ... ... ... ... ... ... ... ... ... ... ... Turkey ... ... ... ... ... ... ... ... ... ... ... ... ... ... Ukraine 1.0 ... ... ... ... ... ... ... ... ... 83.0 ... ... ... UK: E & W 1.9 ... 0.0 7.0 ... ... ... 0.6 ... ... 93.0 ... ... 2.0 UK: N. Ireland 0.9 ... 0.0 0.0 ... ... ... 0.0 ... ... 100.0 ... ... 0.0 UK: Scotland 0.7 2.9 0.0 5.7 50.0 0.0 50.0 ... ... ... 91.4 ... 0.0 ... Mean 1.3 9.5 0.4 3.5 34.9 0.0 50.0 24.5 28.9 69.5 77.0 25.2 1.8 2.6 Median 1.0 0.0 0.0 2.1 29.8 0.0 50.0 16.6 13.3 64.0 82.1 23.8 1.2 0.4 Minimum 0.2 0.0 0.0 0.0 0.0 0.0 50.0 0.0 0.0 58.3 49.5 2.0 0.0 0.0 Maximum 3.8 100.0 4.8 14.3 100.0 0.0 50.0 81.0 66.7 86.2 100.0 51.2 4.6 16.3

204
Table 3.2.3.9 Total persons receiving sanctions/measures in 2010 – Sexual assault:
Sexual abuse of a child
Tota
l san
ctio
ns a
nd m
easu
res
per 1
00 0
00
pop.
Of w
hich
: % v
erdi
ct /
adm
oniti
on o
nly
Of w
hich
: % fi
nes
Of which: % non-custodial sanctions and measures
Of which: % suspended custodial sanctions and measures
Of which: % unsuspended custodial sanctions and measures
Of w
hich
: % o
ther
mea
sure
s
Tota
l
Of w
hich
: % c
omm
unity
se
rvic
e
Of w
hich
: % s
uper
visi
on
Of w
hich
: % p
roba
tion
as a
sa
nctio
n of
its
own
right
Tota
l
Of w
hich
: % w
ith c
omm
unity
se
rvic
e
Of w
hich
: % w
ith s
uper
visi
on
Tota
l
Of w
hich
: % p
artia
lly
susp
ende
d
Of w
hich
: % p
sych
iatri
c ho
spita
l
Albania 0.5 100.0 0.0 ... ... ... ... ... ... ... ... ... ... ... Armenia 0.6 ... 68.4 68.4 0.0 0.0 ... ... ... ... ... ... 0.0 0.0 Austria 1.8 ... 0.7 ... ... ... ... 32.7 ... ... 58.2 36.0 ... ... Bulgaria ... ... ... ... ... ... ... ... ... ... ... ... ... ... Croatia 2.4 ... ... 7.5 87.5 12.5 ... 36.8 ... ... 44.3 ... ... 18.9 Cyprus ... ... ... ... ... ... ... ... ... ... ... ... ... ... Czech Republic 3.3 14.9 0.0 ... ... ... ... 68.4 ... ... 16.1 ... ... ... Denmark ... ... ... ... ... ... ... ... ... ... ... ... ... ... Estonia ... ... ... ... ... ... ... ... ... ... ... ... ... ... Finland 5.6 0.0 3.7 3.7 100.0 0.0 ... 73.2 9.2 ... 17.4 ... ... 2.0 France 0.5 4.1 2.5 1.3 ... ... ... 66.3 1.0 36.4 25.7 60.5 ... ... Georgia ... ... ... ... ... ... ... ... ... ... ... ... ... ... Germany 2.2 0.3 2.5 12.5 ... ... ... 54.1 ... ... 30.6 ... ... ... Greece 0.1 ... ... 25.0 ... ... ... 75.0 ... ... ... ... ... ... Hungary 0.8 ... 6.0 26.2 ... ... 77.3 47.6 ... ... 26.2 ... ... ... Ireland ... ... ... ... ... ... ... ... ... ... ... ... ... ... Italy ... ... ... ... ... ... ... ... ... ... ... ... ... ... Kosovo (UNR) 1.4 0.0 3.2 ... ... ... ... ... ... ... ... ... ... ... Latvia ... ... ... ... ... ... ... ... ... ... ... ... ... ... Lithuania ... ... ... ... ... ... ... ... ... ... ... ... ... ... Malta ... ... ... ... ... ... ... ... ... ... ... ... ... ... Netherlands 1.4 0.4 0.9 10.3 100.0 ... ... 34.6 81.5 ... 53.0 77.4 1.6 0.9 Poland 1.9 ... 0.0 0.5 100.0 ... ... 58.5 ... 71.1 40.9 ... ... 0.0 Portugal 2.4 ... 4.0 ... ... ... ... 61.4 ... 62.3 33.1 ... ... ... Serbia 0.1 0.0 0.0 60.0 0.0 ... ... 60.0 ... ... 40.0 ... ... ... Slovakia ... ... ... ... ... ... ... ... ... ... ... ... ... ... Slovenia 2.5 0.0 0.0 0.0 ... ... ... ... ... ... 39.2 ... ... 3.9 Spain ... ... ... ... ... ... ... ... ... ... ... ... ... ... Sweden 1.2 0.0 0.9 16.5 21.1 ... ... 14.8 82.4 ... 39.1 2.2 2.2 28.7 Switzerland ... ... ... ... ... ... ... ... ... ... ... ... ... ... Turkey 6.4 ... 0.6 37.5 ... ... ... 1.5 ... ... 58.2 ... ... 2.2 Ukraine 0.1 ... ... ... ... ... ... ... ... ... 15.4 ... ... ... UK: E & W 6.7 ... 0.0 45.4 ... ... ... 11.7 ... ... 54.6 ... ... 2.4 UK: N. Ireland 2.1 ... 0.0 18.9 14.3 0.0 ... 16.2 ... ... 62.2 ... ... 2.7 UK: Scotland 1.2 12.3 6.2 56.9 29.7 0.0 67.6 ... ... ... 24.6 ... 0.0 ... Mean 2.1 12.0 5.2 24.4 50.3 2.5 72.4 44.6 43.5 56.6 37.7 44.0 1.0 6.2 Median 1.6 0.3 0.9 17.7 29.7 0.0 72.4 50.9 45.3 62.3 39.2 48.2 0.8 2.3 Minimum 0.1 0.0 0.0 0.0 0.0 0.0 67.6 1.5 1.0 36.4 15.4 2.2 0.0 0.0 Maximum 6.7 100.0 68.4 68.4 100.0 12.5 77.3 75.0 82.4 71.1 62.2 77.4 2.2 28.7

205
Table 3.2.3.10 Total persons receiving sanctions/measures in 2010 – Robbery: Total
To
tal s
anct
ions
and
mea
sure
s pe
r 100
000
po
p.
Of w
hich
: % v
erdi
ct /
adm
oniti
on o
nly
Of w
hich
: % fi
nes
Of which: % non-custodial sanctions and measures
Of which: % suspended custodial sanctions and measures
Of which: % unsuspended custodial sanctions and measures
Of w
hich
: % o
ther
mea
sure
s
Tota
l
Of w
hich
: % c
omm
unity
se
rvic
e
Of w
hich
: % s
uper
visi
on
Of w
hich
: % p
roba
tion
as a
sa
nctio
n of
its
own
right
Tota
l
Of w
hich
: % w
ith c
omm
unity
se
rvic
e
Of w
hich
: % w
ith s
uper
visi
on
Tota
l
Of w
hich
: % p
artia
lly
susp
ende
d
Of w
hich
: % p
sych
iatri
c ho
spita
l
Albania 4 100.0 0.0 ... ... ... ... ... ... ... ... ... ... ... Armenia 6 ... 6.8 6.8 0.0 15.4 ... ... ... ... ... ... ... 0.0 Austria 95 23.9 0.1 ... ... ... ... 3.7 ... ... 7.9 37.7 ... ... Bulgaria 18 ... 0.1 ... ... ... ... ... ... ... 86.5 ... ... 3.2 Croatia 12 ... ... 4.6 88.0 12.0 ... 17.1 ... ... 53.4 ... ... 29.5 Cyprus ... ... ... ... ... ... ... ... ... ... ... ... ... ... Czech Republic 14 1.8 0.0 ... ... ... ... 47.2 ... ... 50.2 ... ... ... Denmark ... ... ... ... ... ... ... ... ... ... ... ... ... ... Estonia ... ... ... ... ... ... ... ... ... ... ... ... ... ... Finland 10 0.0 1.1 5.7 87.1 12.9 ... 43.8 7.6 ... 48.6 ... ... 0.7 France ... ... ... ... ... ... ... ... ... ... ... ... ... ... Georgia 17 ... ... ... ... ... ... ... ... ... ... ... ... ... Germany 12 0.2 1.0 24.0 ... ... ... 39.3 ... ... 35.5 ... ... ... Greece 2 ... 20.7 60.9 ... ... ... 18.4 ... ... ... ... ... ... Hungary 17 ... 0.1 6.6 9.0 ... 1.8 28.5 2.1 ... 64.9 ... ... ... Ireland ... ... ... ... ... ... ... ... ... ... ... ... ... ... Italy ... ... ... ... ... ... ... ... ... ... ... ... ... ... Kosovo (UNR) 5 0.0 0.9 ... ... ... ... ... ... ... ... ... ... ... Latvia ... ... ... ... ... ... ... ... ... ... ... ... ... ... Lithuania ... ... ... ... ... ... ... ... ... ... ... ... ... ... Malta ... ... ... ... ... ... ... ... ... ... ... ... ... ... Netherlands 16 0.2 1.1 12.7 98.5 ... ... 10.6 85.6 ... 74.9 58.0 0.2 0.5 Poland 23 ... 0.2 0.5 100.0 ... ... 48.5 ... 73.6 50.8 ... ... 0.0 Portugal 27 ... 3.8 0.2 100.0 ... ... 54.2 ... 73.3 37.6 ... ... ... Serbia 28 0.0 0.0 27.0 0.0 ... ... 25.6 ... ... 73.0 ... ... ... Slovakia ... ... ... ... ... ... ... ... ... ... ... ... ... ... Slovenia 6 0.0 0.0 0.9 ... ... ... ... ... ... 57.3 ... ... 1.7 Spain ... ... ... ... ... ... ... ... ... ... ... ... ... ... Sweden 11 0.3 0.1 19.6 20.1 ... ... 2.3 87.0 ... 54.1 11.0 0.7 23.5 Switzerland ... ... ... ... ... ... ... ... ... ... ... ... ... ... Turkey 22 ... 0.8 39.3 ... ... ... 2.4 ... ... 55.6 ... ... 1.9 Ukraine 25 ... ... ... ... ... ... ... ... ... 16.7 ... ... ... UK: E & W 15 ... 0.0 41.9 ... ... ... 5.9 ... ... 58.1 ... ... 3.4 UK: N. Ireland 7 ... 0.0 7.2 33.3 55.6 ... 8.0 ... ... 81.6 ... ... 4.0 UK: Scotland 10 2.1 2.9 23.4 40.7 0.8 52.0 ... ... ... 71.7 ... 0.0 ... Mean 17 11.7 2.0 17.6 52.4 19.3 26.9 23.7 45.5 73.5 54.4 35.6 0.3 6.2 Median 14 0.2 0.2 10.0 40.7 12.9 26.9 18.4 46.6 73.5 54.9 37.7 0.2 1.9 Minimum 2 0.0 0.0 0.2 0.0 0.8 1.8 2.3 2.1 73.3 7.9 11.0 0.0 0.0 Maximum 95 100.0 20.7 60.9 100.0 55.6 52.0 54.2 87.0 73.6 86.5 58.0 0.7 29.5

206
Table 3.2.3.11 Total persons receiving sanctions/measures in 2010 – Theft: Total
Tota
l san
ctio
ns a
nd m
easu
res
per 1
00 0
00
pop.
Of w
hich
: % v
erdi
ct /
adm
oniti
on o
nly
Of w
hich
: % fi
nes
Of which: % non-custodial sanctions and measures
Of which: % suspended custodial sanctions and measures
Of which: % unsuspended custodial sanctions and measures
Of w
hich
: % o
ther
mea
sure
s
Tota
l
Of w
hich
: % c
omm
unity
ser
vice
Of w
hich
: % s
uper
visi
on
Of w
hich
: % p
roba
tion
as a
sa
nctio
n of
its
own
right
Tota
l
Of w
hich
: % w
ith c
omm
unity
se
rvic
e
Of w
hich
: % w
ith s
uper
visi
on
Tota
l
Of w
hich
: % p
artia
lly s
uspe
nded
Of w
hich
: % p
sych
iatri
c ho
spita
l
Albania 55 98.5 1.5 ... ... ... ... ... ... ... ... ... ... ... Armenia 28 ... 2.8 2.8 0.0 176.9 ... ... ... ... ... ... ... 0.0 Austria 82 ... 27.6 ... ... ... ... 39.1 ... ... 71.9 27.0 ... ... Bulgaria 163 ... 2.2 ... ... ... ... ... ... ... 70.8 ... ... 4.3 Croatia 136 0.3 0.6 8.2 48.5 51.5 ... 59.1 ... ... 21.8 ... ... 18.2 Cyprus ... ... ... ... ... ... ... ... ... ... ... ... ... ... Czech Republic 148 5.4 0.9 ... ... ... ... 46.8 ... ... 30.1 ... ... ... Denmark ... ... ... ... ... ... ... ... ... ... ... ... ... ... Estonia ... ... ... ... ... ... ... ... ... ... ... ... ... ... Finland 715 0.0 92.6 0.5 99.5 0.5 ... 2.5 0.3 ... 2.5 ... ... 1.8 France 137 1.2 11.3 21.2 ... ... ... 32.6 9.1 21.8 33.6 28.6 ... ... Georgia 81 ... ... ... ... ... ... ... ... ... ... ... ... ... Germany 169 0.4 57.4 17.4 ... ... ... 15.1 ... ... 9.7 ... ... ... Greece 14 ... 47.7 7.7 ... ... ... 17.6 ... ... ... ... ... ... Hungary 226 0.2 19.9 61.8 27.5 ... 39.3 3.1 547.3 ... 18.1 ... ... ... Ireland ... ... ... ... ... ... ... ... ... ... ... ... ... ... Italy ... ... ... ... ... ... ... ... ... ... ... ... ... ... Kosovo (UNR) 85 2.8 59.8 ... ... ... ... ... ... ... ... ... ... ... Latvia ... ... ... ... ... ... ... ... ... ... ... ... ... ... Lithuania ... ... ... ... ... ... ... ... ... ... ... ... ... ... Malta ... ... ... ... ... ... ... ... ... ... ... ... ... ... Netherlands 130 0.7 26.6 25.2 99.7 ... ... 12.3 72.7 ... 34.8 23.8 0.1 0.4 Poland 156 ... 7.6 11.6 100.0 ... ... 65.1 ... 42.9 15.7 ... ... 0.0 Portugal 55 0.8 37.8 0.1 100.0 ... ... 33.2 ... 55.0 22.5 ... ... 0.2 Serbia 15 0.1 9.1 52.8 2.0 ... ... 51.5 ... ... 38.0 ... ... ... Slovakia ... ... ... ... ... ... ... ... ... ... ... ... ... ... Slovenia 89 0.3 2.5 0.0 ... ... ... ... ... ... 22.2 ... ... 0.4 Spain ... ... ... ... ... ... ... ... ... ... ... ... ... ... Sweden 284 52.9 17.5 5.9 7.4 ... ... 9.6 3.6 ... 7.5 0.9 0.5 6.5 Switzerland ... ... ... ... ... ... ... ... ... ... ... ... ... ... Turkey 149 ... 9.7 24.2 ... ... ... 15.4 ... ... 37.3 ... ... 13.4 Ukraine 133 ... ... ... ... ... ... ... ... ... 24.3 ... ... ... UK: E & W 219 ... 13.8 81.6 ... ... ... 6.7 ... ... 18.4 ... ... 25.8 UK: N. Ireland 121 ... 19.1 18.1 39.2 47.8 ... 19.0 ... ... 25.3 ... ... 18.5 UK: Scotland 255 20.8 26.5 22.2 44.0 1.8 44.2 ... ... ... 30.6 ... 0.0 ... Mean 152 13.2 22.5 21.3 51.6 55.7 41.7 26.8 126.6 39.9 28.2 20.1 0.2 7.4 Median 134 0.7 15.7 17.4 44.0 47.8 41.7 18.3 9.1 42.9 24.3 25.4 0.1 3.0 Minimum 14 0.0 0.6 0.0 0.0 0.5 39.3 2.5 0.3 21.8 2.5 0.9 0.0 0.0 Maximum 715 98.5 92.6 81.6 100.0 176.9 44.2 65.1 547.3 55.0 71.9 28.6 0.5 25.8

207
Table 3.2.3.12 Total persons receiving sanctions/measures in 2010 – Theft: Theft of a motor vehicle
Tota
l san
ctio
ns a
nd m
easu
res
per 1
00 0
00
pop.
Of w
hich
: % v
erdi
ct /
adm
oniti
on o
nly
Of w
hich
: % fi
nes
Of which: % non-custodial sanctions and measures
Of which: % suspended custodial sanctions and measures
Of which: % unsuspended custodial sanctions and measures
Of w
hich
: % o
ther
mea
sure
s
Tota
l
Of w
hich
: % c
omm
unity
ser
vice
Of w
hich
: % s
uper
visi
on
Of w
hich
: % p
roba
tion
as a
sa
nctio
n of
its
own
right
Tota
l
Of w
hich
: % w
ith c
omm
unity
se
rvic
e
Of w
hich
: % w
ith s
uper
visi
on
Tota
l
Of w
hich
: % p
artia
lly
susp
ende
d
Of w
hich
: % p
sych
iatri
c ho
spita
l
Albania ... ... ... ... ... ... ... ... ... ... ... ... ... ... Armenia 0.1 ... 0.0 0.0 ... ... ... ... ... 0.0 ... ... 0.0 0.0 Austria ... ... ... ... ... ... ... ... ... ... ... ... ... ... Bulgaria 4.2 ... 0.0 ... ... ... ... ... ... ... 72.8 ... ... 10.1 Croatia 2.6 3.5 10.4 3.5 75.0 25.0 ... 54.8 ... ... 17.4 ... ... 13.9 Cyprus ... ... ... ... ... ... ... ... ... ... ... ... ... ... Czech Republic ... ... ... ... ... ... ... ... ... ... ... ... ... ... Denmark 14.5 ... 5.5 ... ... ... ... 46.6 ... ... 40.3 ... ... 7.6 Estonia ... ... ... ... ... ... ... ... ... ... ... ... ... ... Finland 10.6 0.0 53.1 4.2 100.0 0.0 ... 13.2 1.3 ... 25.6 ... ... 3.9 France ... ... ... ... ... ... ... ... ... ... ... ... ... ... Georgia ... ... ... ... ... ... ... ... ... ... ... ... ... ... Germany ... ... ... ... ... ... ... ... ... ... ... ... ... ... Greece 0.0 ... 100.0 ... ... ... ... ... ... ... ... ... ... ... Hungary 6.1 0.7 17.3 52.2 30.0 ... 33.1 7.6 100.0 ... 14.0 ... ... ... Ireland ... ... ... ... ... ... ... ... ... ... ... ... ... ... Italy ... ... ... ... ... ... ... ... ... ... ... ... ... ... Kosovo (UNR) ... ... ... ... ... ... ... ... ... ... ... ... ... ... Latvia ... ... ... ... ... ... ... ... ... ... ... ... ... ... Lithuania ... ... ... ... ... ... ... ... ... ... ... ... ... ... Malta ... ... ... ... ... ... ... ... ... ... ... ... ... ... Netherlands ... ... ... ... ... ... ... ... ... ... ... ... ... ... Poland ... ... ... ... ... ... ... ... ... ... ... ... ... ... Portugal 1.8 1.5 50.5 ... ... ... ... 21.4 ... 35.7 21.4 ... ... ... Serbia ... ... ... ... ... ... ... ... ... ... ... ... ... ... Slovakia ... ... ... ... ... ... ... ... ... ... ... ... ... ... Slovenia ... ... ... ... ... ... ... ... ... ... ... ... ... ... Spain ... ... ... ... ... ... ... ... ... ... ... ... ... ... Sweden 6.1 14.9 5.9 16.6 8.4 ... ... 11.9 4.4 ... 12.4 0.0 2.8 38.3 Switzerland ... ... ... ... ... ... ... ... ... ... ... ... ... ... Turkey ... ... ... ... ... ... ... ... ... ... ... ... ... ... Ukraine 5.9 ... ... ... ... ... ... ... ... ... 39.1 ... ... ... UK: E & W 3.8 ... 1.8 65.3 ... ... ... 11.4 ... ... 34.7 ... ... 7.4 UK: N. Ireland 10.1 ... 16.6 21.0 23.7 65.8 ... 22.1 ... ... 27.1 ... ... 13.3 UK: Scotland 9.3 6.8 24.0 41.9 46.3 1.5 40.9 ... ... ... 27.3 ... 0.0 ... Mean 5.8 4.6 23.8 25.6 47.2 23.1 37.0 23.6 35.2 17.9 30.2 0.0 0.9 11.8 Median 5.9 2.5 13.5 18.8 38.1 13.2 37.0 17.3 4.4 17.9 27.1 0.0 0.0 8.9 Minimum 0.0 0.0 0.0 0.0 8.4 0.0 33.1 7.6 1.3 0.0 12.4 0.0 0.0 0.0 Maximum 14.5 14.9 100.0 65.3 100.0 65.8 40.9 54.8 100.0 35.7 72.8 0.0 2.8 38.3

208
Table 3.2.3.13 Total persons receiving sanctions/measures in 2010 – (Theft) Burglary: Total
Tota
l san
ctio
ns a
nd m
easu
res
per 1
00 0
00
pop.
Of w
hich
: % v
erdi
ct /
adm
oniti
on o
nly
Of w
hich
: % fi
nes
Of which: % non-custodial sanctions and measures
Of which: % suspended custodial sanctions and measures
Of which: % unsuspended custodial sanctions and measures
Of w
hich
: % o
ther
mea
sure
s
Tota
l
Of w
hich
: % c
omm
unity
se
rvic
e
Of w
hich
: % s
uper
visi
on
Of w
hich
: % p
roba
tion
as a
sa
nctio
n of
its
own
right
Tota
l
Of w
hich
: % w
ith c
omm
unity
se
rvic
e
Of w
hich
: % w
ith s
uper
visi
on
Tota
l
Of w
hich
: % p
artia
lly
susp
ende
d
Of w
hich
: % p
sych
iatri
c ho
spita
l
Albania ... ... ... ... ... ... ... ... ... ... ... ... ... ... Armenia ... ... ... ... ... ... ... ... ... ... ... ... ... ... Austria 18 ... 8.8 ... ... ... ... 47.4 ... ... 51.1 35.2 ... ... Bulgaria ... ... ... ... ... ... ... ... ... ... ... ... ... ... Croatia 72 0.1 0.3 7.2 50.4 49.6 ... 52.3 ... ... 26.2 ... ... 21.0 Cyprus ... ... ... ... ... ... ... ... ... ... ... ... ... ... Czech Republic ... ... ... ... ... ... ... ... ... ... ... ... ... ... Denmark 34 ... 5.4 ... ... ... ... 48.4 ... ... 38.2 ... ... ... Estonia ... ... ... ... ... ... ... ... ... ... ... ... ... ... Finland ... ... ... ... ... ... ... ... ... ... ... ... ... ... France ... ... ... ... ... ... ... ... ... ... ... ... ... ... Georgia ... ... ... ... ... ... ... ... ... ... ... ... ... ... Germany 19 0.2 12.2 29.0 ... ... ... 36.3 ... ... 22.2 ... ... ... Greece ... ... ... ... ... ... ... ... ... ... ... ... ... ... Hungary ... ... ... ... ... ... ... ... ... ... ... ... ... ... Ireland ... ... ... ... ... ... ... ... ... ... ... ... ... ... Italy ... ... ... ... ... ... ... ... ... ... ... ... ... ... Kosovo (UNR) 21 2.4 10.5 ... ... ... ... ... ... ... ... ... ... ... Latvia ... ... ... ... ... ... ... ... ... ... ... ... ... ... Lithuania ... ... ... ... ... ... ... ... ... ... ... ... ... ... Malta ... ... ... ... ... ... ... ... ... ... ... ... ... ... Netherlands 65 0.4 15.8 30.8 99.7 ... ... 14.8 82.1 ... 37.7 30.7 0.0 0.4 Poland 48 ... 0.8 3.3 100.0 ... ... 71.4 ... 60.8 24.4 ... ... 0.0 Portugal 3 ... 7.9 ... ... ... ... 49.4 ... 62.8 37.0 ... ... ... Serbia ... ... ... ... ... ... ... ... ... ... ... ... ... ... Slovakia ... ... ... ... ... ... ... ... ... ... ... ... ... ... Slovenia 35 0.0 0.1 0.0 ... ... ... ... ... ... 31.9 ... ... 0.7 Spain ... ... ... ... ... ... ... ... ... ... ... ... ... ... Sweden ... ... ... ... ... ... ... ... ... ... ... ... ... ... Switzerland ... ... ... ... ... ... ... ... ... ... ... ... ... ... Turkey ... ... ... ... ... ... ... ... ... ... ... ... ... ... Ukraine ... ... ... ... ... ... ... ... ... ... ... ... ... ... UK: E & W 43 ... 1.6 55.7 ... ... ... 11.0 ... ... 44.3 ... ... 5.0 UK: N. Ireland 26 ... 6.1 19.3 32.6 48.3 ... 16.7 ... ... 43.0 ... ... 14.8 UK: Scotland 29 8.1 9.7 29.7 54.3 0.4 38.3 ... ... ... 52.5 ... 0.0 ... Mean 34 1.9 6.6 21.9 67.4 32.8 38.3 38.7 82.1 61.8 37.2 32.9 0.0 7.0 Median 32 0.3 7.0 24.2 54.3 48.3 38.3 47.4 82.1 61.8 37.7 32.9 0.0 2.8 Minimum 3 0.0 0.1 0.0 32.6 0.4 38.3 11.0 82.1 60.8 22.2 30.7 0.0 0.0 Maximum 72 8.1 15.8 55.7 100.0 49.6 38.3 71.4 82.1 62.8 52.5 35.2 0.0 21.0

209
Table 3.2.3.14 Total persons receiving sanctions/measures in 2010 – (Theft) Burglary: Domestic burglary
To
tal s
anct
ions
and
mea
sure
s pe
r 100
000
pop
.
Of w
hich
: % v
erdi
ct /
adm
oniti
on o
nly
Of w
hich
: % fi
nes
Of which: % non-custodial sanctions and measures
Of which: % suspended custodial sanctions and measures
Of which: % unsuspended custodial sanctions and measures
Of w
hich
: % o
ther
mea
sure
s
Tota
l
Of w
hich
: % c
omm
unity
ser
vice
Of w
hich
: % s
uper
visi
on
Of w
hich
: % p
roba
tion
as a
san
ctio
n of
its
own
right
Tota
l
Of w
hich
: % w
ith c
omm
unity
ser
vice
Of w
hich
: % w
ith s
uper
visi
on
Tota
l
Of w
hich
: % p
artia
lly s
uspe
nded
Of w
hich
: % p
sych
iatri
c ho
spita
l
Germany 3 0.1 3.2 25.8 ... ... ... 42.0 ... ... 28.8 ... ... ... Portugal 1 ... 12.7 ... ... ... ... 42.3 ... 66.7 42.3 ... ... ... Ukraine 57 ... ... ... ... ... ... ... ... ... 34.1 ... ... ... UK: E & W 26 ... 0.3 46.6 ... ... ... 11.2 ... ... 53.4 ... ... 3.5 UK: N. Ireland 12 ... 3.2 18.3 20.0 55.0 ... 15.1 ... ... 52.8 ... ... 10.6

210
Table 3.2.3.15 Total persons receiving sanctions/measures in 2010 – Fraud
Tota
l san
ctio
ns a
nd m
easu
res
per 1
00 0
00
pop.
Of w
hich
: % v
erdi
ct /
adm
oniti
on o
nly
Of w
hich
: % fi
nes
Of which: % non-custodial sanctions and measures
Of which: % suspended custodial sanctions and measures
Of which: % unsuspended custodial sanctions and measures
Of w
hich
: % o
ther
mea
sure
s
Tota
l
Of w
hich
: % c
omm
unity
se
rvic
e
Of w
hich
: % s
uper
visi
on
Of w
hich
: % p
roba
tion
as a
sa
nctio
n of
its
own
right
Tota
l
Of w
hich
: % w
ith c
omm
unity
se
rvic
e
Of w
hich
: % w
ith s
uper
visi
on
Tota
l
Of w
hich
: % p
artia
lly
susp
ende
d
Of w
hich
: % p
sych
iatri
c ho
spita
l
Albania 8 40.8 59.2 ... ... ... ... ... ... ... ... ... ... ... Armenia 7 ... 1.8 1.8 0.0 75.0 ... ... ... ... ... ... 0.0 0.0 Austria 32 ... 22.4 ... ... ... ... 51.3 ... ... 43.1 21.8 ... ... Bulgaria 10 ... 7.1 ... ... ... ... ... ... ... 66.8 ... ... 0.8 Croatia 27 0.1 0.2 24.9 8.3 91.7 ... 71.5 ... ... 24.8 ... ... 3.4 Cyprus ... ... ... ... ... ... ... ... ... ... ... ... ... ... Czech Republic 29 2.9 0.7 ... ... ... ... 72.8 ... ... 18.2 ... ... ... Denmark ... ... ... ... ... ... ... ... ... ... ... ... ... ... Estonia ... ... ... ... ... ... ... ... ... ... ... ... ... ... Finland 81 0.0 75.1 1.9 100.0 0.0 ... 15.8 1.0 ... 5.9 ... ... 1.3 France 15 1.7 23.0 8.9 ... ... ... 43.9 2.1 22.2 22.5 30.1 ... ... Georgia 20 ... ... ... ... ... ... ... ... ... ... ... ... ... Germany 126 2.2 79.0 3.2 ... ... ... 12.2 ... ... 3.5 ... ... ... Greece 2 ... 55.9 ... ... ... ... 24.9 ... ... ... ... ... ... Hungary 64 0.5 25.5 46.5 17.5 ... 11.2 39.1 20.9 ... 14.4 ... ... ... Ireland ... ... ... ... ... ... ... ... ... ... ... ... ... ... Italy ... ... ... ... ... ... ... ... ... ... ... ... ... ... Kosovo (UNR) 7 0.6 64.0 ... ... ... ... ... ... ... ... ... ... ... Latvia ... ... ... ... ... ... ... ... ... ... ... ... ... ... Lithuania ... ... ... ... ... ... ... ... ... ... ... ... ... ... Malta ... ... ... ... ... ... ... ... ... ... ... ... ... ... Netherlands 16 1.9 18.1 36.6 99.8 ... ... 16.1 82.5 ... 26.3 28.2 0.1 1.0 Poland 93 ... 4.0 2.2 100.0 ... ... 83.7 ... 18.2 10.0 ... ... 0.0 Portugal 6 ... 36.7 ... ... ... ... 43.9 ... 49.8 15.6 ... ... ... Serbia 6 0.0 10.7 60.0 0.8 ... ... 59.3 ... ... 29.3 ... ... ... Slovakia ... ... ... ... ... ... ... ... ... ... ... ... ... ... Slovenia 37 0.3 1.1 0.0 ... ... ... ... ... ... 10.7 ... ... 0.3 Spain ... ... ... ... ... ... ... ... ... ... ... ... ... ... Sweden 34 22.3 8.0 12.9 14.8 ... ... 29.7 8.8 ... 18.9 1.9 0.7 8.2 Switzerland ... ... ... ... ... ... ... ... ... ... ... ... ... ... Turkey 47 ... 36.5 22.9 ... ... ... 5.2 ... ... 29.4 ... ... 6.1 Ukraine 10 ... ... ... ... ... ... ... ... ... 21.1 ... ... ... UK: E & W 38 ... 14.2 77.4 ... ... ... 15.8 ... ... 22.6 ... ... 13.6 UK: N. Ireland 36 ... 35.3 18.8 69.2 27.5 ... 16.6 ... ... 4.2 ... ... 25.2 UK: Scotland 20 13.8 31.6 31.8 62.8 0.9 21.5 ... ... ... 22.7 ... 0.0 ... Mean 32 6.7 27.7 23.3 47.3 39.0 16.4 37.6 23.1 30.1 21.6 20.5 0.2 5.4 Median 24 1.7 22.7 18.8 40.2 27.5 16.4 34.4 8.8 22.2 21.1 25.0 0.1 1.3 Minimum 2 0.0 0.2 0.0 0.0 0.0 11.2 5.2 1.0 18.2 3.5 1.9 0.0 0.0 Maximum 126 40.8 79.0 77.4 100.0 91.7 21.5 83.7 82.5 49.8 66.8 30.1 0.7 25.2

211
Table 3.2.3.16 Total persons receiving sanctions/measures in 2010 – Money laundering
To
tal s
anct
ions
and
mea
sure
s pe
r 100
000
po
p.
Of w
hich
: % v
erdi
ct /
adm
oniti
on o
nly
Of w
hich
: % fi
nes
Of which: % non-custodial sanctions and measures
Of which: % suspended custodial sanctions and measures
Of which: % unsuspended custodial sanctions and measures
Of w
hich
: % o
ther
mea
sure
s
Tota
l
Of w
hich
: % c
omm
unity
ser
vice
Of w
hich
: % s
uper
visi
on
Of w
hich
: % p
roba
tion
as a
sa
nctio
n of
its
own
right
Tota
l
Of w
hich
: % w
ith c
omm
unity
se
rvic
e
Of w
hich
: % w
ith s
uper
visi
on
Tota
l
Of w
hich
: % p
artia
lly s
uspe
nded
Of w
hich
: % p
sych
iatri
c ho
spita
l
Albania 0.4 90.9 9.1 ... ... ... ... ... ... ... ... ... ... ... Armenia 0.0 ... 0.0 0.0 ... ... ... ... ... 0.0 ... ... 0.0 0.0 Austria 0.1 ... 33.3 ... ... ... ... 50.0 ... ... 33.3 100.0 ... ... Bulgaria ... ... ... ... ... ... ... ... ... ... ... ... ... ... Croatia ... ... ... ... ... ... ... ... ... ... ... ... ... ... Cyprus ... ... ... ... ... ... ... ... ... ... ... ... ... ... Czech Republic 0.0 0.0 0.0 ... 0.0 ... ... 100.0 ... ... 0.0 ... ... ... Denmark ... ... ... ... ... ... ... ... ... ... ... ... ... ... Estonia ... ... ... ... ... ... ... ... ... ... ... ... ... ... Finland 0.4 0.0 35.0 0.0 ... ... ... 55.0 0.0 ... 10.0 ... ... 0.0 France ... ... ... ... ... ... ... ... ... ... ... ... ... ... Georgia ... ... ... ... ... ... ... ... ... ... ... ... ... ... Germany 0.9 7.0 74.8 2.5 ... ... ... 13.6 ... ... 2.1 ... ... ... Greece ... ... ... ... ... ... ... ... ... ... ... ... ... ... Hungary ... ... ... ... ... ... ... ... ... ... ... ... ... ... Ireland ... ... ... ... ... ... ... ... ... ... ... ... ... ... Italy ... ... ... ... ... ... ... ... ... ... ... ... ... ... Kosovo (UNR) 0.0 0.0 0.0 ... ... ... ... ... ... ... ... ... ... ... Latvia ... ... ... ... ... ... ... ... ... ... ... ... ... ... Lithuania ... ... ... ... ... ... ... ... ... ... ... ... ... ... Malta ... ... ... ... ... ... ... ... ... ... ... ... ... ... Netherlands 2.0 0.3 9.2 22.0 97.3 ... ... 19.6 77.3 ... 48.1 27.8 0.0 0.9 Poland 0.4 ... 0.7 0.0 ... ... ... 83.6 ... 40.9 15.8 ... ... 0.0 Portugal 0.1 ... ... ... ... ... ... 50.0 ... ... 50.0 ... ... ... Serbia 0.0 ... ... ... ... ... ... ... ... ... ... ... ... ... Slovakia ... ... ... ... ... ... ... ... ... ... ... ... ... ... Slovenia 0.0 0.0 0.0 0.0 ... ... ... ... ... ... 0.0 ... ... 0.0 Spain ... ... ... ... ... ... ... ... ... ... ... ... ... ... Sweden 0.4 0.0 12.5 20.0 0.0 ... ... 40.0 12.5 ... 12.5 0.0 0.0 15.0 Switzerland ... ... ... ... ... ... ... ... ... ... ... ... ... ... Turkey ... ... ... ... ... ... ... ... ... ... ... ... ... ... Ukraine 0.1 ... ... ... ... ... ... ... ... ... 20.5 ... ... ... UK: E & W ... ... ... ... ... ... ... ... ... ... ... ... ... ... UK: N. Ireland ... ... ... ... ... ... ... ... ... ... ... ... ... ... UK: Scotland 0.0 ... ... ... ... ... ... ... ... ... ... ... ... ... Mean 0.3 12.3 15.9 6.4 32.4 ... ... 51.5 29.9 20.5 19.2 42.6 0.0 2.6 Median 0.1 0.0 9.1 0.0 0.0 ... ... 50.0 12.5 20.5 14.1 27.8 0.0 0.0 Minimum 0.0 0.0 0.0 0.0 0.0 0.0 0.0 13.6 0.0 0.0 0.0 0.0 0.0 0.0 Maximum 2.0 90.9 74.8 22.0 97.3 0.0 0.0 100.0 77.3 40.9 50.0 100.0 0.0 15.0

212
Table 3.2.3.17 Total persons receiving sanctions/measures in 2010 – Corruption
Tota
l san
ctio
ns a
nd m
easu
res
per 1
00 0
00
pop.
Of w
hich
: % v
erdi
ct /
adm
oniti
on o
nly
Of w
hich
: % fi
nes
Of which: % non-custodial sanctions and measures
Of which: % suspended custodial sanctions and measures
Of which: % unsuspended custodial sanctions and measures
Of w
hich
: % o
ther
mea
sure
s
Tota
l
Of w
hich
: % c
omm
unity
se
rvic
e
Of w
hich
: % s
uper
visi
on
Of w
hich
: % p
roba
tion
as a
sa
nctio
n of
its
own
right
Tota
l
Of w
hich
: % w
ith c
omm
unity
se
rvic
e
Of w
hich
: % w
ith s
uper
visi
on
Tota
l
Of w
hich
: % p
artia
lly
susp
ende
d
Of w
hich
: % p
sych
iatri
c ho
spita
l
Albania 1.5 82.2 17.8 ... ... ... ... ... ... ... ... ... ... ... Armenia 1.4 ... 23.9 23.9 0.0 0.0 ... ... ... ... ... ... 0.0 0.0 Austria 0.8 ... 11.8 ... ... ... ... 57.4 ... ... 16.2 18.2 ... ... Bulgaria 1.8 ... 0.0 ... ... ... ... ... ... ... 41.0 ... ... 0.0 Croatia 2.1 ... 1.1 7.5 85.7 14.3 ... 52.7 ... ... 19.4 ... ... 26.9 Cyprus ... ... ... ... ... ... ... ... ... ... ... ... ... ... Czech Republic 0.7 0.0 22.7 ... ... ... ... 64.0 ... ... 10.7 ... ... ... Denmark ... ... ... ... ... ... ... ... ... ... ... ... ... ... Estonia ... ... ... ... ... ... ... ... ... ... ... ... ... ... Finland 0.1 0.0 100.0 0.0 ... ... ... 0.0 ... ... 0.0 ... ... 0.0 France 0.3 1.5 23.6 5.6 ... ... ... 55.4 0.9 4.6 13.8 33.3 ... ... Georgia ... ... ... ... ... ... ... ... ... ... ... ... ... ... Germany 0.4 3.1 62.6 0.7 ... ... ... 25.2 ... ... 8.5 ... ... ... Greece ... ... ... ... ... ... ... ... ... ... ... ... ... ... Hungary 2.6 ... 29.6 35.8 4.3 ... 4.3 47.9 3.3 ... 16.3 ... ... ... Ireland ... ... ... ... ... ... ... ... ... ... ... ... ... ... Italy ... ... ... ... ... ... ... ... ... ... ... ... ... ... Kosovo (UNR) 3.4 4.1 33.8 ... ... ... ... ... ... ... ... ... ... ... Latvia ... ... ... ... ... ... ... ... ... ... ... ... ... ... Lithuania ... ... ... ... ... ... ... ... ... ... ... ... ... ... Malta ... ... ... ... ... ... ... ... ... ... ... ... ... ... Netherlands 0.0 0.0 16.7 66.7 100.0 ... ... 16.7 100.0 ... 0.0 ... ... 0.0 Poland 6.9 ... 2.3 0.4 100.0 ... ... 92.3 ... 8.1 4.9 ... ... 0.1 Portugal 0.6 ... 29.4 ... ... ... ... 67.6 ... 34.8 22.1 ... ... ... Serbia 0.8 0.0 1.8 43.9 0.0 ... ... 38.6 ... ... 54.4 ... ... ... Slovakia ... ... ... ... ... ... ... ... ... ... ... ... ... ... Slovenia 0.4 0.0 0.0 0.0 ... ... ... ... ... ... 12.5 ... ... 0.0 Spain ... ... ... ... ... ... ... ... ... ... ... ... ... ... Sweden 0.1 7.7 53.8 0.0 ... ... ... 23.1 0.0 ... 7.7 0.0 0.0 7.7 Switzerland ... ... ... ... ... ... ... ... ... ... ... ... ... ... Turkey 1.1 ... 4.7 43.8 ... ... ... 1.6 ... ... 45.2 ... ... 4.7 Ukraine 1.8 ... ... ... ... ... ... ... ... ... 12.0 ... ... ... UK: E & W ... ... ... ... ... ... ... ... ... ... ... ... ... ... UK: N. Ireland 0.1 ... 0.0 0.0 ... ... ... 100.0 ... ... 0.0 ... ... 0.0 UK: Scotland 0.0 ... ... ... ... ... ... ... ... ... ... ... ... ... Mean 1.3 9.9 22.9 17.6 48.3 7.1 4.3 45.9 26.0 15.9 16.8 17.2 0.0 3.9 Median 0.8 0.8 17.8 5.6 45.0 7.1 4.3 50.3 2.1 8.1 12.5 18.2 0.0 0.0 Minimum 0.0 0.0 0.0 0.0 0.0 0.0 4.3 0.0 0.0 4.6 0.0 0.0 0.0 0.0 Maximum 6.9 82.2 100.0 66.7 100.0 14.3 4.3 100.0 100.0 34.8 54.4 33.3 0.0 26.9

213
Table 3.2.3.18 Total persons receiving sanctions/measures in 2010 – Drug offences: Total
To
tal s
anct
ions
and
mea
sure
s pe
r 100
000
po
p.
Of w
hich
: % v
erdi
ct /
adm
oniti
on o
nly
Of w
hich
: % fi
nes
Of which: % non-custodial sanctions and measures
Of which: % suspended custodial sanctions and measures
Of which: % unsuspended custodial sanctions and measures
Of w
hich
: % o
ther
mea
sure
s
Tota
l
Of w
hich
: % c
omm
unity
se
rvic
e
Of w
hich
: % s
uper
visi
on
Of w
hich
: % p
roba
tion
as a
sa
nctio
n of
its
own
right
Tota
l
Of w
hich
: % w
ith c
omm
unity
se
rvic
e
Of w
hich
: % w
ith s
uper
visi
on
Tota
l
Of w
hich
: % p
artia
lly
susp
ende
d
Of w
hich
: % p
sych
iatri
c ho
spita
l
Albania 12 100.0 0.0 ... ... ... ... ... ... ... ... ... ... ... Armenia 19 ... 0.8 0.8 0.0 80.0 ... ... ... ... ... ... ... 0.0 Austria 52 ... 21.0 ... ... ... ... 34.0 ... ... 0.0 100.0 ... ... Bulgaria 20 ... 17.4 ... ... ... ... ... ... ... 77.5 ... ... 1.9 Croatia 93 4.6 7.2 3.0 88.8 11.2 ... 26.0 ... ... 18.8 ... ... 43.5 Cyprus ... ... ... ... ... ... ... ... ... ... ... ... ... ... Czech Republic 15 2.3 0.9 ... ... ... ... 61.4 ... ... 30.3 ... ... ... Denmark 179 ... 78.0 ... ... ... ... 8.1 ... ... 10.6 ... ... 3.3 Estonia ... ... ... ... ... ... ... ... ... ... ... ... ... ... Finland 148 0.0 81.5 1.4 100.0 0.0 ... 8.8 3.5 ... 7.5 ... ... 0.8 France 91 0.4 34.6 16.1 ... ... ... 23.1 4.9 41.7 25.8 39.3 ... ... Georgia 110 ... ... ... ... ... ... ... ... ... ... ... ... ... Germany 68 0.5 56.9 9.9 ... ... ... 21.1 ... ... 11.6 ... ... ... Greece 16 ... 5.4 ... ... ... ... ... ... ... ... ... ... ... Hungary 21 0.9 31.5 65.9 18.5 ... 31.8 20.4 59.6 ... 13.7 ... ... ... Ireland ... ... ... ... ... ... ... ... ... ... ... ... ... ... Italy ... ... ... ... ... ... ... ... ... ... ... ... ... ... Kosovo (UNR) 6 0.0 5.7 ... ... ... ... ... ... ... ... ... ... ... Latvia ... ... ... ... ... ... ... ... ... ... ... ... ... ... Lithuania ... ... ... ... ... ... ... ... ... ... ... ... ... ... Malta ... ... ... ... ... ... ... ... ... ... ... ... ... ... Netherlands 39 0.6 20.0 22.4 99.5 ... ... 13.7 81.7 ... 43.0 29.8 0.0 0.4 Poland 54 ... 17.3 10.8 100.0 ... ... 60.6 ... 49.8 11.3 ... ... 0.0 Portugal 36 1.0 21.7 ... ... ... ... 44.2 ... 59.4 29.6 ... ... 0.1 Serbia 35 0.1 15.0 38.8 0.9 ... ... 34.8 ... ... 46.2 ... ... ... Slovakia ... ... ... ... ... ... ... ... ... ... ... ... ... ... Slovenia 19 0.0 0.0 0.5 ... ... ... ... ... ... 33.1 ... ... 0.0 Spain ... ... ... ... ... ... ... ... ... ... ... ... ... ... Sweden 226 56.4 26.3 4.5 17.4 ... ... 1.6 64.6 ... 8.9 0.9 0.4 2.3 Switzerland ... ... ... ... ... ... ... ... ... ... ... ... ... ... Turkey 125 ... 14.1 12.4 ... ... ... 2.4 ... ... 15.3 ... ... 55.9 Ukraine 59 ... ... ... ... ... ... ... ... ... 25.3 ... ... ... UK: E & W 111 ... 38.0 84.2 ... ... ... 6.2 ... ... 15.8 ... ... 18.1 UK: N. Ireland 56 ... 52.2 13.9 31.9 51.8 ... 15.6 ... ... 13.5 ... ... 4.7 UK: Scotland 144 14.6 50.1 16.6 58.0 0.0 38.0 ... ... ... 18.7 ... 0.0 ... Mean 70 13.0 25.9 20.1 51.5 28.6 34.9 23.9 42.8 50.3 22.8 42.5 0.1 10.1 Median 54 0.7 20.0 12.4 44.9 11.2 34.9 20.8 59.6 49.8 17.2 34.6 0.0 1.9 Minimum 6 0.0 0.0 0.5 0.0 0.0 31.8 1.6 3.5 41.7 0.0 0.9 0.0 0.0 Maximum 226 100.0 81.5 84.2 100.0 80.0 38.0 61.4 81.7 59.4 77.5 100.0 0.4 55.9

214
Table 3.2.3.19 Total persons receiving sanctions/measures in 2010 – Drug offences: Drug trafficking
Tota
l san
ctio
ns a
nd m
easu
res
per 1
00 0
00 p
op.
Of w
hich
: % v
erdi
ct /
adm
oniti
on o
nly
Of w
hich
: % fi
nes
Of which: % non-custodial sanctions and measures
Of which: % suspended custodial sanctions and measures
Of which: % unsuspended custodial sanctions and measures
Of w
hich
: % o
ther
mea
sure
s
Tota
l
Of w
hich
: % c
omm
unity
ser
vice
Of w
hich
: % s
uper
visi
on
Of w
hich
: % p
roba
tion
as a
san
ctio
n of
its
ow
n rig
ht
Tota
l
Of w
hich
: % w
ith c
omm
unity
ser
vice
Of w
hich
: % w
ith s
uper
visi
on
Tota
l
Of w
hich
: % p
artia
lly s
uspe
nded
Of w
hich
: % p
sych
iatri
c ho
spita
l
Albania 12 100.0 0.0 ... ... ... ... ... ... ... ... ... ... ... Armenia 6 ... 1.1 1.1 0.0 0.0 ... ... ... ... ... ... ... 0.0 Austria 16 ... 0.1 ... ... ... ... ... ... ... ... ... ... ... Bulgaria ... ... ... ... ... ... ... ... ... ... ... ... ... ... Croatia 27 0.1 ... 4.5 100.0 ... ... 7.2 ... ... 55.0 ... ... 37.7 Cyprus ... ... ... ... ... ... ... ... ... ... ... ... ... ... Czech Republic 13 2.3 0.8 ... ... ... ... 59.5 ... ... 33.3 ... ... ... Denmark ... ... ... ... ... ... ... ... ... ... ... ... ... ... Estonia ... ... ... ... ... ... ... ... ... ... ... ... ... ... Finland 63 0.0 57.8 3.3 100.0 0.0 ... 20.4 3.5 ... 17.3 ... ... 0.4 France 17 0.1 3.1 5.3 ... ... ... 33.6 4.8 38.0 57.8 47.8 ... ... Georgia 2 ... ... ... ... ... ... ... ... ... ... ... ... ... Germany 11 0.2 2.2 1.7 ... ... ... 54.9 ... ... 41.0 ... ... ... Greece 5 ... 16.7 ... ... ... ... 65.7 ... ... ... ... ... ... Hungary ... ... ... ... ... ... ... ... ... ... ... ... ... ... Ireland ... ... ... ... ... ... ... ... ... ... ... ... ... ... Italy ... ... ... ... ... ... ... ... ... ... ... ... ... ... Kosovo (UNR) 5 0.0 6.1 ... ... ... ... ... ... ... ... ... ... ... Latvia ... ... ... ... ... ... ... ... ... ... ... ... ... ... Lithuania ... ... ... ... ... ... ... ... ... ... ... ... ... ... Malta ... ... ... ... ... ... ... ... ... ... ... ... ... ... Netherlands ... ... ... ... ... ... ... ... ... ... ... ... ... ... Poland 5 ... 6.5 1.3 100.0 ... ... 47.0 ... 43.0 45.3 ... ... 0.0 Portugal 20 ... 6.5 ... ... ... ... 43.5 ... 64.2 47.0 ... ... 0.2 Serbia 33 0.1 15.3 38.0 0.9 ... ... 34.1 ... ... 46.7 ... ... ... Slovakia ... ... ... ... ... ... ... ... ... ... ... ... ... ... Slovenia 17 0.0 0.0 0.6 ... ... ... ... ... ... 36.3 ... ... 0.0 Spain ... ... ... ... ... ... ... ... ... ... ... ... ... ... Sweden ... ... ... ... ... ... ... ... ... ... ... ... ... ... Switzerland ... ... ... ... ... ... ... ... ... ... ... ... ... ... Turkey 48 ... 32.6 29.7 ... ... ... 0.4 ... ... 33.4 ... ... 3.8 Ukraine 12 ... ... ... ... ... ... ... ... ... 54.6 ... ... ... UK: E & W 1 ... 0.3 6.5 ... ... ... 3.7 ... ... 93.5 ... ... 0.8 UK: N. Ireland ... ... ... ... ... ... ... ... ... ... ... ... ... ... UK: Scotland 45 3.6 12.5 34.5 67.7 0.0 31.4 ... ... ... 49.4 ... 0.0 ... Mean 19 10.6 10.1 11.5 61.4 0.0 31.4 33.6 4.1 48.4 47.0 47.8 0.0 5.4 Median 13 0.1 4.6 4.5 83.9 0.0 31.4 34.1 4.1 43.0 46.7 47.8 0.0 0.3 Minimum 1 0.0 0.0 0.6 0.0 0.0 31.4 0.4 3.5 38.0 17.3 47.8 0.0 0.0 Maximum 63 100.0 57.8 38.0 100.0 0.0 31.4 65.7 4.8 64.2 93.5 47.8 0.0 37.7
Notes on tables 3.2.3.1 to 3.2.3.19
Croatia: Data relate to the year 2011 (instead of 2010). Greece: Data relate to the year 2009 (instead of 2010). UK: Northern Ireland: Data relate to the year 2008 (instead of 2010).

215
Table 3.2.4 Community sanctions and measures imposed in 2010
Table 3.2.4.1 Community sanctions and measures imposed in 2010 – Criminal offences: Total
Tota
l san
ctio
ns a
nd m
easu
res
per 1
00 0
00 p
op.
Tota
l com
mun
ity s
anct
ions
and
m
easu
res
per 1
00 0
00 p
op.
Of w
hich
: %
com
mun
ity s
ervi
ce
Of w
hich
: %
sup
ervi
sion
Of w
hich
: %
rest
itutio
n
Of w
hich
: %
am
bula
nt th
erap
eutic
tre
atm
ent
Of w
hich
: %
pro
batio
n as
a s
anct
ion
in it
s ow
n rig
ht
Of w
hich
: %
oth
er c
omm
unity
san
ctio
ns
and
mea
sure
s
Albania 272 37 ... ... ... ... ... ... Armenia ... ... ... ... ... ... ... ... Austria 1154 695 5.5 3.5 ... 2.3 0.6 ... Bulgaria 517 182 ... ... ... ... 100.0 ... Croatia ... 24 81.8 18.2 ... ... ... ... Cyprus 215 ... ... ... ... ... ... ... Czech Republic ... ... ... ... ... ... ... ... Denmark 676 158 22.2 ... ... ... ... ... Estonia ... ... ... ... ... ... ... ... Finland ... ... ... ... ... ... ... ... France 1546 ... ... ... ... ... ... ... Georgia ... ... ... ... ... ... ... ... Germany ... ... ... ... ... ... ... ... Greece ... ... ... ... ... ... ... ... Hungary ... ... ... ... ... ... ... ... Ireland ... ... ... ... ... ... ... ... Italy ... ... ... ... ... ... ... ... Kosovo (UNR) 455 ... ... ... ... ... ... ... Latvia ... ... ... ... ... ... ... ... Lithuania 540 132 26.7 ... 7.8 2.5 ... 16.1 Malta ... ... ... ... ... ... ... ... Netherlands 814 212 98.7 ... ... ... ... 1.3 Poland 2361 1029 12.6 17.6 7.3 0.6 ... 61.8 Portugal ... ... ... ... ... ... ... ... Serbia 297 ... ... ... ... ... ... ... Slovakia ... ... ... ... ... ... ... ... Slovenia ... ... ... ... ... ... ... ... Spain 1413 ... ... ... ... ... ... ... Sweden ... ... ... ... ... ... ... ... Switzerland 1339 56 100.0 ... ... ... ... ... Turkey ... ... ... ... ... ... ... ... Ukraine 369 ... ... ... ... ... ... ... UK: E & W 2458 343 ... ... ... ... ... ... UK: N. Ireland 1602 155 30.0 42.4 0.1 0.2 ... 27.6 UK: Scotland ... ... ... ... ... ... ... ... Mean 1002 275 47.2 20.4 5.1 1.4 50.3 26.7 Median 745 158 28.4 17.9 7.3 1.5 50.3 21.9 Minimum 215 24 5.5 3.5 0.1 0.2 0.6 1.3 Maximum 2458 1029 100.0 42.4 7.8 2.5 100.0 61.8

216
Table 3.2.4.2 Community sanctions and measures imposed in 2010 – Criminal offences: Major traffic offences
Tota
l san
ctio
ns a
nd m
easu
res
per 1
00 0
00 p
op.
Tota
l com
mun
ity s
anct
ions
and
m
easu
res
per 1
00 0
00 p
op.
Of w
hich
: %
com
mun
ity s
ervi
ce
Of w
hich
: %
sup
ervi
sion
Of w
hich
: %
rest
itutio
n
Of w
hich
: %
am
bula
nt th
erap
eutic
tre
atm
ent
Of w
hich
: %
pro
batio
n as
a s
anct
ion
in it
s ow
n rig
ht
Of w
hich
: %
oth
er c
omm
unity
san
ctio
ns
and
mea
sure
s
Bulgaria 150 91 ... ... ... ... 100.0 ... Netherlands 180 26 98.1 ... ... ... ... 1.9 Poland 858 475 12.6 2.9 0.1 0.1 ... 84.3 UK: E & W 6 2 ... ... ... ... ... ... UK: N. Ireland 155 4 14.3 81.8 0.0 0.0 ... 3.9 Table 3.2.4.3 Community sanctions and measures imposed in 2010 –
Intentional homicide: Total
Bulgaria 2.1 0.0 ... ... ... ... 100.0 ... Cyprus 1.3 ... 0.0 ... ... ... 0.0 ... Denmark 1.3 0.0 ... ... ... ... ... ... Netherlands 9.9 0.8 98.5 ... ... ... ... 1.5 Poland 2.6 0.4 1.3 5.8 0.0 0.0 ... 92.9 UK: E & W 2.9 0.5 ... ... ... ... ... ... UK: N. Ireland 1.4 0.0 ... ... ... ... ... ... Table 3.2.4.4 Community sanctions and measures imposed in 2010 –
Intentional homicide: Completed
Bulgaria 1.7 0.0 ... ... ... ... 100.0 ... Cyprus 0.9 ... 0.0 ... ... ... 0.0 ... Denmark 0.9 0.0 ... ... ... ... ... ... UK: E & W 0.6 0.0 ... ... ... ... ... ... UK: N. Ireland 1.3 0.0 ... ... ... ... ... ... Table 3.2.4.5 Community sanctions and measures imposed in 2010 –
Bodily injury (Assault): Total
Bulgaria 15 6 ... ... ... ... 100.0 ... Cyprus 7 ... 0.0 ... ... ... 0.0 ... Netherlands 97 39 98.8 ... ... ... ... 1.2 Poland 200 100 7.3 38.8 1.2 4.1 ... 48.6 UK: E & W 76 28 ... ... ... ... ... ... UK: N. Ireland 46 9 46.3 43.8 0.0 1.3 ... 8.8 Table 3.2.4.6 Community sanctions and measures imposed in 2010 –
Bodily injury (Assault): Aggravated bodily injury
Cyprus 5.7 ... 0.0 ... ... ... 0.0 ... Netherlands 18.1 6.6 99.2 ... ... ... ... 0.8 Poland 5.6 2.1 0.4 41.1 3.1 1.9 ... 53.6 UK: N. Ireland 2.8 0.2 0.0 33.3 0.0 66.7 ... 0.0

217
Table 3.2.4.7 Community sanctions and measures imposed in 2010 –
Sexual assault: Total
Tota
l san
ctio
ns a
nd m
easu
res
per 1
00 0
00 p
op.
Tota
l com
mun
ity s
anct
ions
and
m
easu
res
per 1
00 0
00 p
op.
Of w
hich
: %
com
mun
ity s
ervi
ce
Of w
hich
: %
sup
ervi
sion
Of w
hich
: %
rest
itutio
n
Of w
hich
: %
am
bula
nt th
erap
eutic
tre
atm
ent
Of w
hich
: %
pro
batio
n as
a s
anct
ion
in it
s ow
n rig
ht
Of w
hich
: %
oth
er c
omm
unity
san
ctio
ns
and
mea
sure
s
Bulgaria 3.5 0.3 ... ... ... ... 100.0 ... Cyprus 1.3 ... 0.0 ... ... ... 0.0 ... Netherlands 8.8 2.2 97.0 ... ... ... ... 3.0 Poland 7.9 3.1 0.3 41.6 1.2 3.7 ... 53.1 UK: E & W 10.4 3.0 ... ... ... ... ... ... UK: N. Ireland 7.3 1.8 6.3 93.8 0.0 0.0 ... 0.0 Table 3.2.4.8 Community sanctions and measures imposed in 2010 –
Sexual assault: Rape
Bulgaria 2.0 0.0 ... ... ... ... 100.0 ... Cyprus 0.5 ... 0.0 ... ... ... 0.0 ... Netherlands 1.6 0.1 94.4 ... ... ... ... 5.6 Poland 3.8 1.3 0.0 39.4 1.8 3.6 ... 55.2 UK: E & W 1.9 0.1 ... ... ... ... ... ... UK: N. Ireland 0.9 0.0 ... ... ... ... ... ... Table 3.2.4.9 Community sanctions and measures imposed in 2010 – Sexual assault:
Sexual abuse of a child
Cyprus 0.4 ... 0.0 ... ... ... 0.0 ... Netherlands 2.7 0.6 98.1 ... ... ... ... 1.9 Poland 4.0 1.8 0.6 43.2 0.9 3.7 ... 51.6 UK: E & W 6.7 2.1 ... ... ... ... ... ... UK: N. Ireland 2.1 0.4 14.3 0.0 0.0 0.0 ... 100.0 Table 3.2.4.10 Community sanctions and measures imposed in 2010 – Robbery: Total
Bulgaria 17.6 1.8 ... ... ... ... 100.0 ... Cyprus 2.0 ... 0.0 ... ... ... 0.0 ... Netherlands 27.8 4.9 97.9 ... ... ... ... 2.1 Poland 46.7 15.3 0.7 53.7 13.3 1.0 ... 31.3 UK: E & W 15.4 5.0 ... ... ... ... ... ... UK: N. Ireland 6.9 0.5 33.3 55.6 0.0 11.1 ... 0.0 Table 3.2.4.11 Community sanctions and measures imposed in 2010 – Theft: Total
Bulgaria 163 37 ... ... ... ... 100.0 ... Netherlands 168 47 98.7 ... ... ... ... 1.3 Poland 264 105 17.2 41.4 25.2 0.3 ... 15.9 UK: E & W 219 78 ... ... ... ... ... ... UK: N. Ireland 121 22 39.2 47.8 0.0 0.0 ... 13.0

218
Table 3.2.4.12 Community sanctions and measures imposed in 2010 – Theft: Theft of a motor vehicle
Tota
l san
ctio
ns a
nd m
easu
res
per 1
00 0
00 p
op.
Tota
l com
mun
ity s
anct
ions
and
m
easu
res
per 1
00 0
00 p
op.
Of w
hich
: %
com
mun
ity s
ervi
ce
Of w
hich
: %
sup
ervi
sion
Of w
hich
: %
rest
itutio
n
Of w
hich
: %
am
bula
nt th
erap
eutic
tre
atm
ent
Of w
hich
: %
pro
batio
n as
a s
anct
ion
in it
s ow
n rig
ht
Of w
hich
: %
oth
er c
omm
unity
san
ctio
ns
and
mea
sure
s
Bulgaria 4.2 0.7 ... ... ... ... 100.0 ... Denmark 16.1 7.2 36.2 ... ... ... ... ... UK: E & W 3.8 1.7 ... ... ... ... ... ... UK: N. Ireland 10.1 2.1 23.7 65.8 0.0 0.0 ... 10.5 Table 3.2.4.13 Community sanctions and measures imposed in 2010 –
(Theft) Burglary: Total
Denmark 42 18 12.4 ... ... ... ... ... Netherlands 94 30 98.9 ... ... ... ... 1.1 Poland 104 39 4.1 53.5 26.8 0.3 ... 15.3 UK: E & W 43 16 ... ... ... ... ... ... UK: N. Ireland 26 5 32.6 48.3 0.0 0.0 ... 19.1 Table 3.2.4.14 Community sanctions and measures imposed in 2010 – (Theft) Burglary:
Domestic burglary
UK: E & W 25.7 8.1 ... ... ... ... ... ... UK: N. Ireland 12.1 2.2 20.0 55.0 0.0 0.0 ... 25.0 Table 3.2.4.15 Community sanctions and measures imposed in 2010 – Fraud
Bulgaria 9.7 2.4 ... ... ... ... 100.0 ... Cyprus 3.5 ... 0.0 ... ... ... ... ... Netherlands 22.6 8.5 99.9 ... ... ... ... 0.1 Poland 186.4 26.7 7.6 53.4 10.0 0.4 ... 28.7 UK: E & W 37.8 12.8 ... ... ... ... ... ... UK: N. Ireland 35.6 6.7 69.2 27.5 0.0 0.0 ... 3.3 Table 3.2.4.16 Community sanctions and measures imposed in 2010 – Money laundering
Netherlands 3.7 0.8 100.0 ... ... ... ... 0.0 Poland 1.0 0.3 0.0 45.6 25.4 0.0 ... 28.9 Table 3.2.4.17 Community sanctions and measures imposed in 2010 – Corruption
Bulgaria 1.8 1.0 ... ... ... ... 100.0 ... Cyprus 0.0 ... 0.0 ... ... ... 0.0 0.0 Netherlands 0.1 0.0 100.0 ... ... ... ... 0.0 Poland 15.1 4.0 0.8 12.8 2.5 0.4 ... 83.5 UK: N. Ireland 0.1 0.0 ... ... ... ... ... ...

219
Table 3.2.4.18 Community sanctions and measures imposed in 2010 – Drug offences: Total
Tota
l san
ctio
ns a
nd m
easu
res
per 1
00 0
00 p
op.
Tota
l com
mun
ity s
anct
ions
and
m
easu
res
per 1
00 0
00 p
op.
Of w
hich
: %
com
mun
ity s
ervi
ce
Of w
hich
: %
sup
ervi
sion
Of w
hich
: %
rest
itutio
n
Of w
hich
: %
am
bula
nt th
erap
eutic
tre
atm
ent
Of w
hich
: %
pro
batio
n as
a s
anct
ion
in it
s ow
n rig
ht
Of w
hich
: %
oth
er c
omm
unity
san
ctio
ns
and
mea
sure
s
Bulgaria 20 1 ... ... ... ... 100.0 ... Cyprus 57 ... 0.0 ... ... ... ... ... Denmark 203 14 22.7 ... ... ... ... ... Netherlands 61 15 99.5 ... ... ... ... 0.5 Poland 109 42 13.8 38.4 0.1 0.7 ... 47.0 UK: E & W 111 24 ... ... ... ... ... ... UK: N. Ireland 56 8 31.9 51.8 0.0 0.0 ... 16.3 Table 3.2.4.19 Community sanctions and measures imposed in 2010 – Drug offences:
Drug trafficking
Poland 12.9 3.8 1.6 26.5 0.0 0.2 ... 71.7 UK: E& W 1.1 0.0 ... ... ... ... ... ...
Notes on tables 3.2.4.1 to 3.2.4.19
Croatia: Data relate to the year 2011 (instead of 2010). Cyprus: Data relate to the year 2009 (instead of 2010). UK: Northern Ireland: Data relate to the year 2006 (instead of 2010).

220
Table 3.2.5 Minors receiving sanctions/measures in 2010
Table 3.2.5.1 Minors receiving sanctions/measures in 2010 – Criminal offences: Total
Tota
l san
ctio
ns a
nd m
easu
res
per 1
00 0
00
pop .
Of w
hich
: % v
erdi
ct /
adm
oniti
on o
nly
Of w
hich
: % fi
nes
Of which: % non-custodial sanctions and measures
Of which: % suspended custodial sanctions and measures
Of which: % unsuspended custodial sanctions and measures
Of w
hich
: % o
ther
mea
sure
s
Tota
l
Of w
hich
: % c
omm
unity
se
rvic
e
Of w
hich
: % s
uper
visi
on
Of w
hich
: % p
roba
tion
as a
sa
nctio
n of
its
own
right
Tota
l
Of w
hich
: % w
ith c
omm
unity
se
rvic
e
Of w
hich
: % w
ith s
uper
visi
on
Tota
l
Of w
hich
: % p
artia
lly
susp
ende
d
Of w
hich
: % p
sych
iatri
c ho
spita
l
Albania 22 88.9 10.8 ... ... ... ... ... ... ... ... ... ... ... Armenia 5 ... ... 15.9 ... 53.6 ... ... ... ... ... ... 0.0 0.0 Austria 27 ... 42.8 ... ... ... ... 11.0 ... ... 38.7 32.4 ... ... Bulgaria ... ... ... ... ... ... ... ... ... ... ... ... ... ... Croatia 19 ... ... 90.8 44.0 40.3 15.7 3.9 ... ... 1.8 ... ... 3.6 Cyprus ... ... ... ... ... ... ... ... ... ... ... ... ... ... Czech Republic 23 20.2 0.0 ... ... ... ... 49.7 ... 14.3 8.4 ... ... 1.0 Denmark ... ... ... ... ... ... ... ... ... ... ... ... ... ... Estonia ... ... ... ... ... ... ... ... ... ... ... ... ... ... Finland 228 0.0 93.5 0.2 28.6 71.4 ... 4.8 1.4 ... 0.2 ... ... 1.2 France 83 3.7 4.6 58.3 ... ... ... 24.5 7.2 32.3 8.9 37.8 ... ... Georgia ... ... ... ... ... ... ... ... ... ... ... ... ... ... Germany 133 ... ... 84.1 ... ... ... 10.0 ... 100.0 5.9 ... ... ... Greece 15 ... ... 95.7 ... ... ... ... ... ... 3.8 ... 14.1 ... Hungary 65 0.9 3.2 69.9 10.3 ... 77.9 23.1 31.2 ... 7.0 ... ... ... Ireland ... ... ... ... ... ... ... ... ... ... ... ... ... ... Italy ... ... ... ... ... ... ... ... ... ... ... ... ... ... Kosovo (UNR) 19 9.2 4.3 ... ... ... ... ... ... ... ... ... ... 60.4 Latvia ... ... ... ... ... ... ... ... ... ... ... ... ... ... Lithuania 36 9.4 5.2 71.3 12.9 ... ... 24.5 ... ... 61.2 ... ... ... Malta ... ... ... ... ... ... ... ... ... ... ... ... ... ... Netherlands 54 2.5 5.0 67.5 99.7 ... ... 9.8 72.2 ... 13.9 64.3 ... 1.2 Poland 60 ... ... 92.8 ... ... ... 1.8 ... ... 5.5 ... ... ... Portugal 17 7.8 45.3 0.5 77.8 ... ... 32.4 ... 73.4 7.3 ... ... ... Serbia 22 ... ... 96.1 ... ... ... ... ... ... 3.9 ... ... ... Slovakia ... ... ... ... ... ... ... ... ... ... ... ... ... ... Slovenia 16 ... 0.6 97.9 5.9 49.5 ... ... ... ... 0.6 ... ... 0.9 Spain 40 ... ... ... ... ... ... ... ... ... ... ... ... ... Sweden 151 57.5 12.7 0.4 5.9 ... ... 0.2 8.0 ... 0.6 2.5 4.9 28.7 Switzerland 201 22.3 20.5 51.7 90.1 7.4 ... 4.7 ... ... 2.5 38.9 ... ... Turkey 65 ... 40.7 3.7 ... ... ... 7.6 ... ... 27.8 ... ... 20.1 Ukraine 24 ... 4.9 ... ... ... ... ... ... ... 18.7 ... ... 0.8 UK: E & W 134 ... 8.8 94.3 ... ... ... ... ... ... 5.7 ... ... 20.8 UK: N. Ireland 68 ... 16.5 13.2 14.9 37.3 ... 3.8 ... ... 9.7 ... ... 56.8 UK: Scotland 62 22.4 25.6 39.3 30.8 2.2 54.2 ... ... ... 12.6 ... 0.0 ... Mean 64 20.4 19.2 54.9 38.3 37.4 49.2 14.1 24.0 55.0 11.6 35.2 4.8 16.3 Median 40 9.3 9.8 67.5 28.6 40.3 54.2 9.8 8.0 52.9 7.0 37.8 2.5 2.4 Minimum 5 0.0 0.0 0.2 5.9 2.2 15.7 0.2 1.4 14.3 0.2 2.5 0.0 0.0 Maximum 228 88.9 93.5 97.9 99.7 71.4 77.9 49.7 72.2 100.0 61.2 64.3 14.1 60.4

221
Table 3.2.5.2 Minors receiving sanctions/measures in 2010 – Criminal offences: Major
traffic offences
To
tal s
anct
ions
and
mea
sure
s pe
r 10
0 00
0 po
p.
Of w
hich
: % v
erdi
ct /
adm
oniti
on o
nly
Of w
hich
: % fi
nes
Of which: % non-custodial sanctions and measures
Of which: % suspended custodial sanctions and measures
Of which: % unsuspended custodial sanctions and measures
Of w
hich
: % o
ther
mea
sure
s
Tota
l
Of w
hich
: % c
omm
unity
se
rvic
e
Of w
hich
: % s
uper
visi
on
Of w
hich
: % p
roba
tion
as
a sa
nctio
n of
its
own
right
Tota
l
Of w
hich
: % w
ith
com
mun
ity s
ervi
ce
Of w
hich
: % w
ith
supe
rvis
ion
Tota
l
Of w
hich
: % p
artia
lly
susp
ende
d
Of w
hich
: % p
sych
iatri
c ho
spita
l
Albania 1.5 97.8 2.2 ... ... ... ... ... ... ... ... ... ... ... Armenia 0.0 ... ... ... ... ... ... ... ... 0.0 ... ... 0.0 ... Austria ... ... ... ... ... ... ... ... ... ... ... ... ... ... Bulgaria ... ... ... ... ... ... ... ... ... ... ... ... ... ... Croatia 0.2 ... ... 90.0 88.9 11.1 ... ... ... ... 10.0 ... ... ... Cyprus ... ... ... ... ... ... ... ... ... ... ... ... ... ... Czech Republic ... ... ... ... ... ... ... ... ... ... ... ... ... ... Denmark ... ... ... ... ... ... ... ... ... ... ... ... ... ... Estonia ... ... ... ... ... ... ... ... ... ... ... ... ... ... Finland 102.2 0.0 97.4 0.1 0.0 100.0 ... 2.2 0.0 ... 0.1 ... ... 0.3 France 4.1 4.3 8.6 67.8 ... ... ... 13.1 8.4 32.9 6.3 21.1 ... ... Georgia ... ... ... ... ... ... ... ... ... ... ... ... ... ... Germany 13.4 ... ... 95.7 ... ... ... 2.8 ... 100.0 1.5 ... ... ... Greece 10.3 ... ... 99.3 ... ... ... ... ... ... 0.7 ... ... ... Hungary 0.7 ... 9.9 74.6 3.8 ... 84.9 22.5 12.5 ... 2.8 ... ... ... Ireland ... ... ... ... ... ... ... ... ... ... ... ... ... ... Italy ... ... ... ... ... ... ... ... ... ... ... ... ... ... Kosovo (UNR)) 0.7 6.3 0.0 ... ... ... ... ... ... ... ... ... ... 93.8 Latvia ... ... ... ... ... ... ... ... ... ... ... ... ... ... Lithuania ... ... ... ... ... ... ... ... ... ... ... ... ... ... Malta ... ... ... ... ... ... ... ... ... ... ... ... ... ... Netherlands 1.8 1.7 34.4 57.8 98.2 ... ... 3.7 63.6 ... 1.4 100.0 ... 1.0 Poland 1.2 ... ... 97.9 ... ... ... 0.4 ... ... 1.7 ... ... ... Portugal 4.9 22.8 70.2 ... ... ... ... 1.9 ... 40.0 1.1 ... ... ... Serbia 0.8 ... ... 100.0 ... ... ... ... ... ... 0.0 ... ... ... Slovakia ... ... ... ... ... ... ... ... ... ... ... ... ... ... Slovenia 0.2 ... 20.0 80.0 0.0 50.0 ... ... ... ... 0.0 ... ... 0.0 Spain ... ... ... ... ... ... ... ... ... ... ... ... ... ... Sweden 20.1 82.1 11.9 0.1 0.0 ... ... 0.0 ... ... 0.0 ... ... 6.0 Switzerland 28.2 ... ... ... ... ... ... ... ... ... ... ... ... ... Turkey 0.1 ... 87.5 2.8 ... ... ... ... ... ... 2.8 ... ... 6.9 Ukraine ... ... ... ... ... ... ... ... ... ... ... ... ... ... UK: E & W 0.3 ... 0.0 79.9 ... ... ... ... ... ... 20.1 ... ... 9.0 UK: N. Ireland 1.5 ... 11.1 74.1 0.0 0.0 ... 11.1 ... ... 3.7 ... ... 0.0 UK: Scotland 2.4 24.2 65.3 7.3 22.2 44.4 22.2 ... ... ... 3.2 ... 0.0 ... Mean 9.7 29.9 32.2 61.8 26.6 41.1 53.6 6.4 21.1 43.2 3.5 60.5 0.0 14.6 Median 1.5 14.5 11.9 74.6 1.9 44.4 53.6 2.8 10.4 36.4 1.6 60.5 0.0 3.5 Minimum 0.0 0.0 0.0 0.1 0.0 0.0 22.2 0.0 0.0 0.0 0.0 21.1 0.0 0.0 Maximum 102.2 97.8 97.4 100.0 98.2 100.0 84.9 22.5 63.6 100.0 20.1 100.0 0.0 93.8

222
Table 3.2.5.3 Minors receiving sanctions/measures in 2010 – Intentional homicide: Total
Tota
l san
ctio
ns a
nd m
easu
res
per
100
000
pop.
Of w
hich
: % v
erdi
ct /
adm
oniti
on o
nly
Of w
hich
: % fi
nes
Of which: % non-custodial sanctions and measures
Of which: % suspended custodial sanctions and measures
Of which: % unsuspended custodial sanctions and measures
Of w
hich
: % o
ther
mea
sure
s
Tota
l
Of w
hich
: % c
omm
unity
se
rvic
e
Of w
hich
: % s
uper
visi
on
Of w
hich
: % p
roba
tion
as
a sa
nctio
n of
its
own
right
Tota
l
Of w
hich
: % w
ith
com
mun
ity s
ervi
ce
Of w
hich
: % w
ith
supe
rvis
ion
Tota
l
Of w
hich
: % p
artia
lly
susp
ende
d
Of w
hich
: % p
sych
iatri
c ho
spita
l
Albania 0.1 100.0 0.0 ... ... ... ... ... ... ... ... ... ... ... Armenia 0.1 ... ... 0.0 ... ... ... ... ... 0.0 ... ... 0.0 0.0 Austria 0.0 ... ... ... ... ... ... ... ... ... 100.0 25.0 ... ... Bulgaria ... ... ... ... ... ... ... ... ... ... ... ... ... ... Croatia 0.1 ... ... 60.0 ... 66.7 33.3 ... ... ... 20.0 ... ... 20.0 Cyprus ... ... ... ... ... ... ... ... ... ... ... ... ... ... Czech Republic 0.0 0.0 0.0 ... 0.0 0.0 ... 0.0 ... ... 100.0 ... ... ... Denmark ... ... ... ... ... ... ... ... ... ... ... ... ... ... Estonia ... ... ... ... ... ... ... ... ... ... ... ... ... ... Finland 0.0 0.0 0.0 0.0 ... ... ... 50.0 100.0 ... 50.0 ... ... 0.0 France 0.1 0.0 0.0 0.0 ... ... ... 8.3 0.0 33.3 91.7 42.4 ... ... Georgia ... ... ... ... ... ... ... ... ... ... ... ... ... ... Germany 0.1 ... ... 3.8 ... ... ... 10.6 ... 100.0 85.6 ... ... ... Greece ... ... ... ... ... ... ... ... ... ... ... ... ... ... Hungary 0.3 ... ... 3.8 100.0 ... ... 15.4 25.0 ... 80.8 ... ... ... Ireland ... ... ... ... ... ... ... ... ... ... ... ... ... ... Italy ... ... ... ... ... ... ... ... ... ... ... ... ... ... Kosovo (UNR) 0.7 6.7 0.0 ... ... ... ... ... ... ... ... ... ... 93.3 Latvia ... ... ... ... ... ... ... ... ... ... ... ... ... ... Lithuania ... ... ... ... ... ... ... ... ... ... ... ... ... ... Malta ... ... ... ... ... ... ... ... ... ... ... ... ... ... Netherlands 0.5 0.0 0.0 7.1 100.0 ... ... 25.0 95.2 ... 66.7 44.6 ... 1.2 Poland 0.0 ... ... 42.9 ... ... ... 14.3 ... ... 42.9 ... ... ... Portugal 0.0 ... ... ... ... ... ... ... ... ... ... ... ... ... Serbia 0.1 ... ... 50.0 ... ... ... ... ... ... 50.0 ... ... ... Slovakia ... ... ... ... ... ... ... ... ... ... ... ... ... ... Slovenia 0.0 ... ... ... ... ... ... ... ... ... ... ... ... ... Spain ... ... ... ... ... ... ... ... ... ... ... ... ... ... Sweden 0.1 0.0 0.0 12.5 100.0 ... ... 0.0 ... ... 87.5 0.0 14.3 0.0 Switzerland 0.2 ... ... ... ... ... ... ... ... ... ... ... ... ... Turkey 1.2 ... 0.9 6.4 ... ... ... 2.7 ... ... 87.9 ... ... 2.0 Ukraine 0.2 ... ... ... ... ... ... ... ... ... 100.0 ... ... ... UK: E & W 0.1 ... 0.0 31.9 ... ... ... ... ... ... 68.1 ... ... 1.4 UK: N. Ireland 0.0 ... ... ... ... ... ... ... ... ... ... ... ... ... UK: Scotland 0.2 0.0 0.0 0.0 ... ... ... ... ... ... 100.0 ... 0.0 ... Mean 0.2 13.3 0.1 16.8 75.0 33.3 33.3 14.0 55.1 44.4 75.4 28.0 4.8 14.7 Median 0.1 0.0 0.0 6.4 100.0 33.3 33.3 10.6 60.1 33.3 85.6 33.7 0.0 1.3 Minimum 0.0 0.0 0.0 0.0 0.0 0.0 33.3 0.0 0.0 0.0 20.0 0.0 0.0 0.0 Maximum 1.2 100.0 0.9 60.0 100.0 66.7 33.3 50.0 100.0 100.0 100.0 44.6 14.3 93.3

223
Table 3.2.5.4 Minors receiving sanctions/measures in 2010 – Intentional homicide:
Completed
To
tal s
anct
ions
and
mea
sure
s pe
r 10
0 00
0 po
p.
Of w
hich
: % v
erdi
ct /
adm
oniti
on o
nly
Of w
hich
: % fi
nes
Of which: % non-custodial sanctions and measures
Of which: % suspended custodial sanctions and measures
Of which: % unsuspended custodial sanctions and measures
Of w
hich
: % o
ther
mea
sure
s
Tota
l
Of w
hich
: %
com
mun
ity s
ervi
ce
Of w
hich
: %
supe
rvis
ion
Of w
hich
: % p
roba
tion
as a
san
ctio
n of
its
own
right
Tota
l
Of w
hich
: % w
ith
com
mun
ity s
ervi
ce
Of w
hich
: % w
ith
supe
rvis
ion
Tota
l
Of w
hich
: % p
artia
lly
susp
ende
d
Of w
hich
: %
psyc
hiat
ric h
ospi
tal
Albania ... ... ... ... ... ... ... ... ... ... ... ... ... ... Armenia ... ... ... 0.0 ... ... ... ... ... 0.0 ... ... 0.0 0.0 Austria 0.0 ... ... ... ... ... ... ... ... ... 100.0 ... ... ... Bulgaria ... ... ... ... ... ... ... ... ... ... ... ... ... ... Croatia 0.0 ... ... ... ... ... ... ... ... ... 100.0 ... ... ... Cyprus ... ... ... ... ... ... ... ... ... ... ... ... ... ... Czech Republic ... ... ... ... ... ... ... ... ... ... ... ... ... ... Denmark ... ... ... ... ... ... ... ... ... ... ... ... ... ... Estonia ... ... ... ... ... ... ... ... ... ... ... ... ... ... Finland 0.0 ... ... ... ... ... ... ... ... ... ... ... ... ... France ... ... ... ... ... ... ... ... ... ... ... ... ... ... Georgia ... ... ... ... ... ... ... ... ... ... ... ... ... ... Germany ... ... ... ... ... ... ... ... ... ... ... ... ... ... Greece ... ... ... ... ... ... ... ... ... ... ... ... ... ... Hungary 0.2 ... ... 6.3 100.0 ... ... 12.5 50.0 ... 81.3 ... ... ... Ireland ... ... ... ... ... ... ... ... ... ... ... ... ... ... Italy ... ... ... ... ... ... ... ... ... ... ... ... ... ... Kosovo (UNR) 0.5 9.1 0.0 ... ... ... ... ... ... ... ... ... ... 90.9 Latvia ... ... ... ... ... ... ... ... ... ... ... ... ... ... Lithuania ... ... ... ... ... ... ... ... ... ... ... ... ... ... Malta ... ... ... ... ... ... ... ... ... ... ... ... ... ... Netherlands ... ... ... ... ... ... ... ... ... ... ... ... ... ... Poland ... ... ... ... ... ... ... ... ... ... ... ... ... ... Portugal ... ... ... ... ... ... ... ... ... ... ... ... ... ... Serbia 0.1 ... ... ... ... ... ... ... ... ... ... ... ... ... Slovakia ... ... ... ... ... ... ... ... ... ... ... ... ... ... Slovenia ... ... ... ... ... ... ... ... ... ... ... ... ... ... Spain ... ... ... ... ... ... ... ... ... ... ... ... ... ... Sweden ... ... ... ... ... ... ... ... ... ... ... ... ... ... Switzerland 0.1 ... ... ... ... ... ... ... ... ... ... ... ... ... Turkey ... ... ... ... ... ... ... ... ... ... ... ... ... ... Ukraine ... ... ... ... ... ... ... ... ... ... ... ... ... ... UK: E & W 0.0 ... 0.0 0.0 ... ... ... ... ... ... 100.0 ... ... 0.0 UK: N. Ireland 0.0 ... ... ... ... ... ... ... ... ... ... ... ... ... UK: Scotland 0.2 0.0 0.0 0.0 ... ... ... ... ... ... 100.0 ... 0.0 ... Mean 0.1 4.5 0.0 1.6 100.0 ... ... 12.5 50.0 0.0 96.3 ... 0.0 30.3 Median 0.1 4.5 0.0 0.0 100.0 ... ... 12.5 50.0 0.0 100.0 ... 0.0 0.0 Minimum 0.0 0.0 0.0 0.0 100.0 0.0 0.0 12.5 50.0 0.0 81.3 0.0 0.0 0.0 Maximum 0.5 9.1 0.0 6.3 100.0 0.0 0.0 12.5 50.0 0.0 100.0 0.0 0.0 90.9

224
Table 3.2.5.5 Minors receiving sanctions/measures in 2010 – Bodily injury (Assault):
Total
Tota
l san
ctio
ns a
nd m
easu
res
per
100
000
pop .
Of w
hich
: % v
erdi
ct /
adm
oniti
on
only
Of w
hich
: % fi
nes
Of which: % non-custodial sanctions and measures
Of which: % suspended custodial sanctions and measures
Of which: % unsuspended custodial sanctions and measures
Of w
hich
: % o
ther
mea
sure
s
Tota
l
Of w
hich
: %
com
mun
ity s
ervi
ce
Of w
hich
: %
supe
rvis
ion
Of w
hich
: %
prob
atio
n as
a
sanc
tion
of it
s ow
n rig
ht
Tota
l
Of w
hich
: % w
ith
com
mun
ity s
ervi
ce
Of w
hich
: % w
ith
supe
rvis
i on
Tota
l
Of w
hich
: % p
artia
lly
susp
ende
d
Of w
hich
: %
psyc
hiat
ric h
ospi
tal
Albania 0.6 100.0 0.0 ... ... ... ... ... ... ... ... ... ... ... Armenia 0.5 ... ... 0.0 ... ... ... ... ... ... ... ... 0.0 0.0 Austria 5.2 ... 3.2 ... ... ... ... 2.8 ... ... 37.8 7.9 ... ... Bulgaria ... ... ... ... ... ... ... ... ... ... ... ... ... ... Croatia 2.4 ... ... 99.1 62.9 30.5 6.7 0.9 ... ... ... ... ... ... Cyprus ... ... ... ... ... ... ... ... ... ... ... ... ... ... Czech Republic 1.9 14.1 0.0 ... ... ... ... 57.8 ... 11.3 2.5 ... ... ... Denmark ... ... ... ... ... ... ... ... ... ... ... ... ... ... Estonia ... ... ... ... ... ... ... ... ... ... ... ... ... ... Finland 15.8 0.0 74.9 0.7 16.7 83.3 ... 19.9 3.0 ... 0.6 ... ... 3.9 France 15.8 3.9 3.2 60.6 ... ... ... 23.9 7.5 34.8 8.4 42.4 ... ... Georgia ... ... ... ... ... ... ... ... ... ... ... ... ... ... Germany 31.4 ... ... 80.9 ... ... ... 12.1 ... 100.0 7.0 ... ... ... Greece 0.2 ... ... ... ... ... ... ... ... ... ... ... ... ... Hungary 4.4 0.2 3.7 73.4 10.3 ... 82.5 21.6 35.1 ... 5.0 ... ... ... Ireland ... ... ... ... ... ... ... ... ... ... ... ... ... ... Italy ... ... ... ... ... ... ... ... ... ... ... ... ... ... Kosovo (UNR) 5.7 7.2 9.6 ... ... ... ... ... ... ... ... ... ... 83.2 Latvia ... ... ... ... ... ... ... ... ... ... ... ... ... ... Lithuania ... ... ... ... ... ... ... ... ... ... ... ... ... ... Malta ... ... ... ... ... ... ... ... ... ... ... ... ... ... Netherlands 7.9 4.4 2.1 72.5 99.9 ... ... 10.2 68.4 ... 9.1 63.9 ... 1.7 Poland 7.1 ... ... 94.7 ... ... ... 1.3 ... ... 4.1 ... ... ... Portugal 1.4 2.0 74.5 2.0 ... ... ... 15.4 ... 65.2 ... ... ... ... Serbia 2.0 ... ... 98.7 ... ... ... ... ... ... 1.3 ... ... ... Slovakia ... ... ... ... ... ... ... ... ... ... ... ... ... ... Slovenia 1.8 ... 0.0 100.0 8.3 44.4 ... ... ... ... 0.0 ... ... 0.0 Spain ... ... ... ... ... ... ... ... ... ... ... ... ... ... Sweden 18.7 5.9 13.3 0.8 0.0 ... ... 0.4 0.0 ... 0.8 0.0 7.1 78.8 Switzerland 10.2 ... ... ... ... ... ... ... ... ... ... ... ... ... Turkey 6.7 ... 62.9 3.0 ... ... ... 9.2 ... ... 11.8 ... ... 13.1 Ukraine ... ... ... ... ... ... ... ... ... ... ... ... ... ... UK: E & W 11.4 ... 0.3 88.8 ... ... ... ... ... ... 11.2 ... ... 8.2 UK: N. Ireland 41.0 ... 9.1 19.6 47.6 42.1 ... 33.5 ... ... 29.5 ... ... 8.3 UK: Scotland 19.2 18.7 24.4 43.3 34.8 1.2 53.2 ... ... ... 13.7 ... 0.0 ... Mean 9.6 15.6 18.7 52.4 35.1 40.3 47.5 16.1 22.8 52.8 9.5 28.6 2.4 21.9 Median 6.2 5.2 3.7 66.5 25.7 42.1 53.2 12.1 7.5 50.0 7.0 25.2 0.0 8.2 Minimum 0.2 0.0 0.0 0.0 0.0 1.2 6.7 0.4 0.0 11.3 0.0 0.0 0.0 0.0 Maximum 41.0 100.0 74.9 100.0 99.9 83.3 82.5 57.8 68.4 100.0 37.8 63.9 7.1 83.2

225
Table 3.2.5.6 Minors receiving sanctions/measures in 2010 – Bodily injury (Assault):
Aggravated bodily injury
To
tal s
anct
ions
and
mea
sure
s pe
r 10
0 00
0 po
p .
Of w
hich
: % v
erdi
ct /
adm
oniti
on
only
Of w
hich
: % fi
nes
Of which: % non-custodial sanctions and measures
Of which: % suspended custodial sanctions and measures
Of which: % unsuspended custodial sanctions and measures
Of w
hich
: % o
ther
mea
sure
s
Tota
l
Of w
hich
: % c
omm
unity
se
rvic
e
Of w
hich
: %
supe
rvis
ion
Of w
hich
: % p
roba
tion
as a
san
ctio
n of
its
own
right
Tota
l
Of w
hich
: % w
ith
com
mun
ity s
ervi
ce
Of w
hich
: % w
ith
s upe
rvis
ion
Tota
l
Of w
hich
: % p
artia
lly
susp
ende
d
Of w
hich
: % p
sych
iatri
c ho
spita
l
Albania 0.4 83.3 0.0 ... ... ... ... ... ... ... ... ... ... ... Armenia 0.4 ... ... 0.0 ... ... ... ... ... ... ... ... 0.0 0.0 Austria 1.4 ... 11.6 ... ... ... ... 9.9 ... ... 26.4 40.6 ... ... Bulgaria ... ... ... ... ... ... ... ... ... ... ... ... ... ... Croatia 0.8 ... ... 100.0 62.9 34.3 2.9 ... ... ... ... ... ... ... Cyprus ... ... ... ... ... ... ... ... ... ... ... ... ... ... Czech Republic 0.4 2.1 0.0 ... 0.0 ... ... 85.1 ... 12.5 4.3 ... ... ... Denmark ... ... ... ... ... ... ... ... ... ... ... ... ... ... Estonia ... ... ... ... ... ... ... ... ... ... ... ... ... ... Finland 0.8 0.0 0.0 0.0 ... ... ... 88.1 13.5 ... 9.5 ... ... 2.4 France 1.6 2.2 1.8 41.8 ... ... ... 38.6 7.7 37.8 15.6 68.8 ... ... Georgia ... ... ... ... ... ... ... ... ... ... ... ... ... ... Germany 16.5 ... ... 75.8 ... ... ... 15.8 ... 100.0 8.4 ... ... ... Greece 0.0 ... ... ... ... ... ... ... ... ... 100.0 ... ... ... Hungary 3.4 ... 4.1 73.6 11.0 ... 81.1 22.0 36.8 ... 4.3 ... ... ... Ireland ... ... ... ... ... ... ... ... ... ... ... ... ... ... Italy ... ... ... ... ... ... ... ... ... ... ... ... ... ... Kosovo (UNR) 0.6 0.0 0.0 ... ... ... ... ... ... ... ... ... ... 100.0 Latvia ... ... ... ... ... ... ... ... ... ... ... ... ... ... Lithuania ... ... ... ... ... ... ... ... ... ... ... ... ... ... Malta ... ... ... ... ... ... ... ... ... ... ... ... ... ... Netherlands 1.5 0.4 0.0 54.7 100.0 ... ... 20.7 84.9 ... 23.4 76.7 ... 0.8 Poland 0.1 ... ... 78.4 ... ... ... 9.8 ... ... 11.8 ... ... ... Portugal 0.1 ... 41.7 ... ... ... ... 41.7 ... 100.0 ... ... ... ... Serbia 1.0 ... ... 97.2 ... ... ... ... ... ... 2.8 ... ... ... Slovakia ... ... ... ... ... ... ... ... ... ... ... ... ... ... Slovenia 0.2 ... 0.0 100.0 20.0 80.0 ... ... ... ... 0.0 ... ... 0.0 Spain ... ... ... ... ... ... ... ... ... ... ... ... ... ... Sweden 1.2 0.0 0.9 3.6 0.0 ... ... 0.9 0.0 ... 12.6 0.0 7.1 82.0 Switzerland 1.2 ... ... ... ... ... ... ... ... ... ... ... ... ... Turkey 0.1 ... 34.0 3.8 ... ... ... 20.8 ... ... 35.8 ... ... 5.7 Ukraine 0.3 ... ... ... ... ... ... ... ... ... 55.2 ... ... ... UK: E & W ... ... ... ... ... ... ... ... ... ... ... ... ... ... UK: N. Ireland 1.7 ... 3.3 6.7 0.0 0.0 ... 6.7 ... ... 76.7 ... ... 6.7 UK: Scotland 2.6 1.5 180.7 48.9 36.4 0.0 57.6 ... ... ... 42.2 ... 0.0 ... Mean 1.7 11.2 19.9 48.9 28.8 28.6 47.2 30.0 28.6 62.6 26.8 46.5 2.4 24.7 Median 0.8 0.9 1.3 51.8 15.5 17.1 57.6 20.7 13.5 68.9 14.1 54.7 0.0 4.0 Minimum 0.0 0.0 0.0 0.0 0.0 0.0 2.9 0.9 0.0 12.5 0.0 0.0 0.0 0.0 Maximum 16.5 83.3 180.7 100.0 100.0 80.0 81.1 88.1 84.9 100.0 100.0 76.7 7.1 100.0

226
Table 3.2.5.7 Minors receiving sanctions/measures in 2010 – Sexual assault: Total
Tota
l san
ctio
ns a
nd m
easu
res
per
100
000
pop.
Of w
hich
: % v
erdi
ct /
adm
oniti
on o
nly
Of w
hich
: % fi
nes
Of which: % non-custodial sanctions and measures
Of which: % suspended custodial sanctions and measures
Of which: % unsuspended custodial sanctions and measures
Of w
hich
: % o
ther
mea
sure
s
Tota
l
Of w
hich
: % c
omm
unity
se
rvic
e
Of w
hich
: %
supe
rvis
ion
Of w
hich
: % p
roba
tion
as a
san
ctio
n of
its
own
right
Tota
l
Of w
hich
: % w
ith
com
mun
ity s
ervi
ce
Of w
hich
: % w
ith
supe
rvis
ion
Tota
l
Of w
hich
: % p
artia
lly
susp
ende
d
Of w
hich
: % p
sych
iatri
c ho
spita
l
Albania 0.2 85.7 14.3 ... ... ... ... ... ... ... ... ... ... ... Armenia 0.0 ... ... 0.0 ... ... ... ... ... 0.0 ... ... 0.0 0.0 Austria 0.3 ... ... ... ... ... ... 20.7 ... ... 37.9 54.5 ... ... Bulgaria ... ... ... ... ... ... ... ... ... ... ... ... ... ... Croatia 0.5 ... ... 58.3 28.6 50.0 21.4 25.0 ... ... 4.2 ... ... 12.5 Cyprus ... ... ... ... ... ... ... ... ... ... ... ... ... ... Czech Republic 1.1 29.5 0.0 ... ... ... ... 60.7 ... 20.6 0.9 ... ... ... Denmark ... ... ... ... ... ... ... ... ... ... ... ... ... ... Estonia ... ... ... ... ... ... ... ... ... ... ... ... ... ... Finland 0.7 0.0 28.6 0.0 ... ... ... 57.1 0.0 ... 11.4 ... ... 2.9 France 2.6 1.1 0.1 35.0 ... ... ... 49.7 0.2 57.0 14.0 71.2 ... ... Georgia ... ... ... ... ... ... ... ... ... ... ... ... ... ... Germany 1.0 ... ... 46.5 ... ... ... 39.6 ... 100.0 13.9 ... ... ... Greece 0.0 ... ... ... ... ... ... ... ... ... ... ... ... ... Hungary 0.8 ... 1.2 26.5 ... ... 122.7 42.2 ... ... 31.3 ... ... ... Ireland ... ... ... ... ... ... ... ... ... ... ... ... ... ... Italy ... ... ... ... ... ... ... ... ... ... ... ... ... ... Kosovo (UNR) 0.3 0.0 14.3 ... ... ... ... ... ... ... ... ... ... 85.7 Latvia ... ... ... ... ... ... ... ... ... ... ... ... ... ... Lithuania ... ... ... ... ... ... ... ... ... ... ... ... ... ... Malta ... ... ... ... ... ... ... ... ... ... ... ... ... ... Netherlands 0.8 2.9 0.0 41.2 98.2 ... ... 23.5 59.4 ... 28.7 61.5 ... 3.7 Poland 0.6 ... ... 73.0 ... ... ... 10.4 ... ... 16.6 ... ... ... Portugal 0.2 ... ... ... ... ... ... 47.1 ... 87.5 29.4 ... ... ... Serbia 0.2 ... ... 88.2 ... ... ... ... ... ... 11.8 ... ... ... Slovakia ... ... ... ... ... ... ... ... ... ... ... ... ... ... Slovenia 0.5 ... 0.0 100.0 0.0 81.8 ... ... ... ... 0.0 ... ... 0.0 Spain ... ... ... ... ... ... ... ... ... ... ... ... ... ... Sweden 0.7 0.0 1.6 3.2 0.0 ... ... 3.2 100.0 ... 14.3 0.0 11.1 77.8 Switzerland 1.1 ... ... ... ... ... ... ... ... ... ... ... ... ... Turkey 1.2 ... 7.0 6.9 ... ... ... 6.8 ... ... 74.0 ... ... 5.3 Ukraine ... ... ... ... ... ... ... ... ... ... ... ... ... ... UK: E & W 1.1 ... 0.0 83.8 ... ... ... ... ... ... 16.2 ... ... 4.3 UK: N. Ireland 0.5 ... 0.0 77.8 100.0 0.0 ... 11.1 ... ... 11.1 ... ... 0.0 UK: Scotland 0.3 35.3 5.9 47.1 25.0 0.0 75.0 ... ... ... 11.8 ... 0.0 ... Mean 0.7 19.3 5.6 45.8 42.0 33.0 73.1 30.5 39.9 53.0 19.3 46.8 3.7 19.2 Median 0.5 2.0 1.2 46.5 26.8 25.0 75.0 25.0 29.8 57.0 14.0 58.0 0.0 4.0 Minimum 0.0 0.0 0.0 0.0 0.0 0.0 21.4 3.2 0.0 0.0 0.0 0.0 0.0 0.0 Maximum 2.6 85.7 28.6 100.0 100.0 81.8 122.7 60.7 100.0 100.0 74.0 71.2 11.1 85.7

227
Table 3.2.5.8 Minors receiving sanctions/measures in 2010 – Sexual assault: Rape
To
tal s
anct
ions
and
mea
sure
s pe
r 10
0 00
0 po
p .
Of w
hich
: % v
erdi
ct /
adm
oniti
on o
nly
Of w
hich
: % fi
nes
Of which: % non-custodial sanctions and measures
Of which: % suspended custodial sanctions and measures
Of which: % unsuspended custodial sanctions and measures
Of w
hich
: % o
ther
mea
sure
s
Tota
l
Of w
hich
: % c
omm
unity
se
rvic
e
Of w
hich
: %
supe
rvis
ion
Of w
hich
: % p
roba
tion
as a
san
ctio
n of
its
own
right
To
tal
Of w
hich
: % w
ith
com
mun
ity s
ervi
ce
Of w
hich
: % w
ith
supe
rvis
ion
Tota
l
Of w
hich
: % p
artia
lly
susp
ende
d
Of w
hich
: % p
sych
iatri
c ho
spita
l
Albania 0.1 100.0 0.0 ... ... ... ... ... ... ... ... ... ... ... Armenia 0.0 ... ... ... ... ... ... ... ... 0.0 ... ... 0.0 ... Austria 0.2 ... ... ... ... ... ... 21.4 ... ... 50.0 42.9 ... ... Bulgaria ... ... ... ... ... ... ... ... ... ... ... ... ... ... Croatia 0.2 ... ... 50.0 25.0 25.0 50.0 12.5 ... ... 12.5 ... ... 25.0 Cyprus ... ... ... ... ... ... ... ... ... ... ... ... ... ... Czech Republic 0.1 0.0 0.0 ... 0.0 0.0 ... 76.9 ... 70.0 7.7 ... ... ... Denmark ... ... ... ... ... ... ... ... ... ... ... ... ... ... Estonia ... ... ... ... ... ... ... ... ... ... ... ... ... ... Finland 0.1 0.0 28.6 0.0 ... ... ... 28.6 0.0 ... 42.9 ... ... 0.0 France 0.6 0.0 0.0 7.7 ... ... ... 53.2 0.0 64.0 39.1 68.0 ... ... Georgia ... ... ... ... ... ... ... ... ... ... ... ... ... ... Germany 0.3 ... ... 15.9 ... ... ... 58.7 ... 100.0 25.5 ... ... ... Greece ... ... ... ... ... ... ... ... ... ... ... ... ... ... Hungary 0.2 ... ... 5.6 ... ... ... 22.2 ... ... 72.2 ... ... ... Ireland ... ... ... ... ... ... ... ... ... ... ... ... ... ... Italy ... ... ... ... ... ... ... ... ... ... ... ... ... ... Kosovo (UNR) 0.1 0.0 0.0 ... ... ... ... ... ... ... ... ... ... 100.0 Latvia ... ... ... ... ... ... ... ... ... ... ... ... ... ... Lithuania ... ... ... ... ... ... ... ... ... ... ... ... ... ... Malta ... ... ... ... ... ... ... ... ... ... ... ... ... ... Netherlands 0.1 4.2 0.0 4.2 0.0 ... ... 16.7 50.0 ... 70.8 70.6 ... 4.2 Poland 0.2 ... ... 59.2 ... ... ... 13.2 ... ... 27.6 ... ... ... Portugal ... ... ... ... ... ... ... ... ... ... ... ... ... ... Serbia 0.1 ... ... 60.0 ... ... ... ... ... ... 40.0 ... ... ... Slovakia ... ... ... ... ... ... ... ... ... ... ... ... ... ... Slovenia 0.0 ... ... ... ... ... ... ... ... ... ... ... ... ... Spain ... ... ... ... ... ... ... ... ... ... ... ... ... ... Sweden 0.3 0.0 0.0 6.5 0.0 ... ... 3.2 100.0 ... 29.0 0.0 11.1 61.3 Switzerland 0.2 ... ... ... ... ... ... ... ... ... ... ... ... ... Turkey ... ... ... ... ... ... ... ... ... ... ... ... ... ... Ukraine 0.1 ... ... ... ... ... ... ... ... ... 89.1 ... ... ... UK: E & W 0.1 ... 0.0 43.8 ... ... ... ... ... ... 56.3 ... ... 2.5 UK: N. Ireland 0.0 ... ... ... ... ... ... ... ... ... ... ... ... ... UK: Scotland 0.0 100.0 0.0 0.0 ... ... ... ... ... ... 0.0 ... ... ... Mean 0.2 25.5 3.2 23.0 6.3 12.5 50.0 30.7 37.5 58.5 40.2 45.4 5.6 32.2 Median 0.1 0.0 0.0 7.7 0.0 12.5 50.0 21.8 25.0 67.0 39.5 55.4 5.6 14.6 Minimum 0.0 0.0 0.0 0.0 0.0 0.0 50.0 3.2 0.0 0.0 0.0 0.0 0.0 0.0 Maximum 0.6 100.0 28.6 60.0 25.0 25.0 50.0 76.9 100.0 100.0 89.1 70.6 11.1 100.0

228
Table 3.2.5.9 Minors receiving sanctions/measures in 2010 – Sexual assault: Sexual abuse of a child
Tota
l san
ctio
ns a
nd m
easu
res
per
100
000
pop
Of w
hich
: % v
erdi
ct /
adm
oniti
on o
nly
Of w
hich
: % fi
nes
Of which: % non-custodial sanctions and measures
Of which: % suspended custodial sanctions and measures
Of which: % unsuspended custodial sanctions and measures
Of w
hich
: % o
ther
mea
sure
s
Tota
l
Of w
hich
: % c
omm
unity
se
rvic
e
Of w
hich
: %
supe
rvis
ion
Of w
hich
: % p
roba
tion
as a
san
ctio
n of
its
own
right
To
tal
Of w
hich
: % w
ith
com
mun
ity s
ervi
ce
Of w
hich
: % w
ith
supe
rvis
ion
Tota
l
Of w
hich
: % p
artia
lly
susp
ende
d
Of w
hich
: % p
sych
iatri
c ho
spita
l
Albania 0.2 80.0 20.0 ... ... ... ... ... ... ... ... ... ... ... Armenia 0.0 ... ... 0.0 ... ... ... ... ... 0.0 ... ... 0.0 0.0 Austria 0.2 ... ... ... ... ... ... 20.0 ... ... 26.7 75.0 ... ... Bulgaria ... ... ... ... ... ... ... ... ... ... ... ... ... ... Croatia 0.3 ... ... 66.7 30.0 60.0 10.0 26.7 ... ... ... ... ... 6.7 Cyprus ... ... ... ... ... ... ... ... ... ... ... ... ... ... Czech Republic 0.9 33.3 0.0 ... ... ... ... 58.6 ... 12.1 0.0 ... ... ... Denmark ... ... ... ... ... ... ... ... ... ... ... ... ... ... Estonia ... ... ... ... ... ... ... ... ... ... ... ... ... ... Finland 0.5 0.0 28.0 0.0 ... ... ... 60.0 0.0 ... 4.0 ... ... 8.0 France 0.0 0.0 0.0 0.0 ... ... ... 100.0 0.0 0.0 0.0 ... ... ... Georgia ... ... ... ... ... ... ... ... ... ... ... ... ... ... Germany 0.4 ... ... 62.1 ... ... ... 30.2 ... 100.0 7.6 ... ... ... Greece 0.0 ... ... 100.0 ... ... ... ... ... ... ... ... ... ... Hungary 0.3 ... 2.9 52.9 ... ... 94.4 44.1 ... ... 2.9 ... ... ... Ireland ... ... ... ... ... ... ... ... ... ... ... ... ... ... Italy ... ... ... ... ... ... ... ... ... ... ... ... ... ... Kosovo (UNR) 0.1 0.0 50.0 ... ... ... ... ... ... ... ... ... ... 50.0 Latvia ... ... ... ... ... ... ... ... ... ... ... ... ... ... Lithuania ... ... ... ... ... ... ... ... ... ... ... ... ... ... Malta ... ... ... ... ... ... ... ... ... ... ... ... ... ... Netherlands 0.2 3.1 0.0 18.8 100.0 ... ... 50.0 62.5 ... 28.1 55.6 ... 0.0 Poland 0.4 ... ... 80.7 ... ... ... 8.9 ... ... 10.4 ... ... ... Portugal 0.1 ... ... ... ... ... ... 77.8 ... 85.7 ... ... ... ... Serbia 0.1 ... ... 100.0 ... ... ... ... ... ... 0.0 ... ... ... Slovakia ... ... ... ... ... ... ... ... ... ... ... ... ... ... Slovenia 0.2 ... 0.0 100.0 0.0 80.0 ... ... ... ... 0.0 ... ... 0.0 Spain ... ... ... ... ... ... ... ... ... ... ... ... ... ... Sweden 0.3 0.0 3.1 0.0 ... ... ... 3.1 100.0 ... 0.0 ... ... 93.8 Switzerland 0.9 ... ... ... ... ... ... ... ... ... ... ... ... ... Turkey 0.9 ... 0.9 7.3 ... ... ... 6.6 ... ... 80.4 ... ... 4.8 Ukraine ... ... ... ... ... ... ... ... ... ... ... ... ... ... UK: E & W 0.6 ... 0.0 82.2 ... ... ... ... ... ... 17.8 ... ... 5.6 UK: N. Ireland 0.2 ... 0.0 75.0 100.0 0.0 ... 0.0 ... ... 25.0 ... ... 0.0 UK: Scotland 0.3 31.3 6.3 50.0 25.0 0.0 75.0 ... ... ... 12.5 ... 0.0 ... Mean 0.3 18.5 8.6 49.7 51.0 35.0 59.8 37.4 40.6 39.6 14.4 65.3 0.0 16.9 Median 0.3 1.6 0.9 57.5 30.0 30.0 75.0 30.2 31.3 12.1 7.6 65.3 0.0 5.2 Minimum 0.0 0.0 0.0 0.0 0.0 0.0 10.0 0.0 0.0 0.0 0.0 55.6 0.0 0.0 Maximum 0.9 80.0 50.0 100.0 100.0 80.0 94.4 100.0 100.0 100.0 80.4 75.0 0.0 93.8

229
Table 3.2.5.10 Minors receiving sanctions/measures in 2010 – Robbery: Total
To
tal s
anct
ions
and
mea
sure
s pe
r 10
0 00
0 po
p
Of w
hich
: % v
erdi
ct /
adm
oniti
on o
nly
Of w
hich
: % fi
nes
Of which: % non-custodial sanctions and measures
Of which: % suspended custodial sanctions and measures
Of which: % unsuspended custodial sanctions and measures
Of w
hich
: % o
ther
mea
sure
s
Tota
l
Of w
hich
: % c
omm
unity
se
rvic
e
Of w
hich
: %
supe
rvis
ion
Of w
hich
: % p
roba
tion
as a
san
ctio
n of
its
own
right
To
tal
Of w
hich
: % w
ith
com
mun
ity s
ervi
ce
Of w
hich
: % w
ith
supe
rvis
ion
Tota
l
Of w
hich
: % p
artia
lly
susp
ende
d
Of w
hich
: % p
sych
iatri
c ho
spita
l
Albania 0.5 100.0 0.0 ... ... ... ... ... ... ... ... ... ... ... Armenia 0.6 ... ... 11.1 ... 0.0 ... ... ... ... ... ... 0.0 0.0 Austria 2.6 ... ... ... ... ... ... 43.8 ... ... 57.6 77.6 ... ... Bulgaria ... ... ... ... ... ... ... ... ... ... ... ... ... ... Croatia 1.1 ... ... 76.0 26.3 44.7 28.9 16.0 ... ... 8.0 ... ... ... Cyprus ... ... ... ... ... ... ... ... ... ... ... ... ... ... Czech Republic 2.7 1.1 0.0 ... ... ... ... 67.3 ... 28.0 20.6 ... ... ... Denmark ... ... ... ... ... ... ... ... ... ... ... ... ... ... Estonia ... ... ... ... ... ... ... ... ... ... ... ... ... ... Finland 1.5 0.0 6.2 3.7 0.0 100.0 ... 87.7 2.8 ... 2.5 ... ... 0.0 France ... ... ... ... ... ... ... ... ... ... ... ... ... ... Georgia ... ... ... ... ... ... ... ... ... ... ... ... ... ... Germany 6.5 ... ... 44.6 ... ... ... 34.0 ... 100.0 21.4 ... ... ... Greece 0.2 ... ... 57.9 ... ... ... ... ... ... 42.1 ... ... ... Hungary 6.0 ... ... 17.4 7.6 ... ... 54.8 2.4 ... 27.7 ... ... ... Ireland ... ... ... ... ... ... ... ... ... ... ... ... ... ... Italy ... ... ... ... ... ... ... ... ... ... ... ... ... ... Kosovo (UNR) 0.6 21.4 0.0 ... ... ... ... ... ... ... ... ... ... 78.6 Latvia ... ... ... ... ... ... ... ... ... ... ... ... ... ... Lithuania ... ... ... ... ... ... ... ... ... ... ... ... ... ... Malta ... ... ... ... ... ... ... ... ... ... ... ... ... ... Netherlands 4.5 0.3 0.0 27.4 99.5 ... ... 14.2 85.8 ... 57.6 76.8 ... 0.5 Poland 3.0 ... ... 68.1 ... ... ... 11.0 ... ... 20.9 ... ... ... Portugal 4.6 ... 9.1 ... ... ... ... 68.3 ... 77.4 15.8 ... ... ... Serbia 8.4 ... ... 94.3 ... ... ... ... ... ... 5.7 ... ... ... Slovakia ... ... ... ... ... ... ... ... ... ... ... ... ... ... Slovenia 1.6 ... 0.0 93.8 6.7 53.3 ... ... ... ... 6.3 ... ... 3.1 Spain ... ... ... ... ... ... ... ... ... ... ... ... ... ... Sweden 3.2 0.7 0.3 3.0 22.2 ... ... 0.0 ... ... 10.9 3.0 0.0 85.1 Switzerland 5.3 ... ... ... ... ... ... ... ... ... ... ... ... ... Turkey 3.8 ... 1.7 4.8 ... ... ... 13.3 ... ... 73.8 ... ... 7.4 Ukraine 2.9 ... ... ... ... ... ... ... ... ... 24.7 ... ... ... UK: E & W 6.2 ... 0.0 77.8 ... ... ... ... ... ... 22.2 ... ... 6.9 UK: N. Ireland 0.5 ... 0.0 11.1 0.0 100.0 ... 11.1 ... ... 33.3 ... ... 44.4 UK: Scotland 1.0 0.0 3.8 59.6 29.0 0.0 19.4 ... ... ... 36.5 ... 0.0 ... Mean 3.1 17.6 1.8 43.4 23.9 49.7 24.2 35.1 30.4 68.5 27.1 52.5 0.0 25.1 Median 2.8 0.7 0.0 44.6 14.9 49.0 24.2 25.0 2.8 77.4 21.8 76.8 0.0 6.9 Minimum 0.2 0.0 0.0 3.0 0.0 0.0 19.4 0.0 2.4 28.0 2.5 3.0 0.0 0.0 Maximum 8.4 100.0 9.1 94.3 99.5 100.0 28.9 87.7 85.8 100.0 73.8 77.6 0.0 85.1

230
Table 3.2.5.11 Minors receiving sanctions/measures in 2010 – Theft: Total
Tota
l san
ctio
ns a
nd m
easu
res
per
100
000
pop .
Of w
hich
: % v
erdi
ct /
adm
oniti
on o
nly
Of w
hich
: % fi
nes
Of which: % non-custodial sanctions and measures
Of which: % suspended custodial sanctions and measures
Of which: % unsuspended custodial sanctions and measures
Of w
hich
: % o
ther
mea
sure
s
Tota
l
Of w
hich
: % c
omm
unity
se
rvic
e
Of w
hich
: %
supe
rvis
ion
Of w
hich
: % p
roba
tion
as a
san
ctio
n of
its
own
right
To
tal
Of w
hich
: % w
ith
com
mun
ity s
ervi
ce
Of w
hich
: % w
ith
supe
rvis
ion
Tota
l
Of w
hich
: % p
artia
lly
susp
ende
d
Of w
hich
: % p
sych
iatri
c ho
spita
l
Albania 15 99.3 0.7 ... ... ... ... ... ... ... ... ... ... ... Armenia 3 ... ... 0.0 ... ... ... ... ... ... ... ... 0.0 0.0 Austria 6 ... ... ... ... ... ... 9.0 ... ... 37.7 30.5 ... ... Bulgaria ... ... ... ... ... ... ... ... ... ... ... ... ... ... Croatia 9 ... ... 96.5 34.1 45.4 20.5 1.5 ... ... 1.2 ... ... 0.7 Cyprus ... ... ... ... ... ... ... ... ... ... ... ... ... ... Czech Republic 10 14.6 0.0 ... ... ... ... 41.4 ... 12.6 7.8 ... ... ... Denmark ... ... ... ... ... ... ... ... ... ... ... ... ... ... Estonia ... ... ... ... ... ... ... ... ... ... ... ... ... ... Finland 67 0.0 95.7 0.1 80.0 20.0 ... 3.3 0.0 ... 0.1 ... ... 0.7 France 31 3.1 3.4 54.9 ... ... ... 27.8 7.4 27.6 10.9 35.9 ... ... Georgia ... ... ... ... ... ... ... ... ... ... ... ... ... ... Germany 35 ... ... 84.7 ... ... ... 9.2 ... 100.0 6.1 ... ... ... Greece 2 ... ... 84.1 ... ... ... ... ... ... 15.5 ... ... 0.4 Hungary 29 0.6 3.7 74.7 11.8 ... 78.8 20.2 43.7 ... 5.1 ... ... ... Ireland ... ... ... ... ... ... ... ... ... ... ... ... ... ... Italy ... ... ... ... ... ... ... ... ... ... ... ... ... ... Kosovo (UNR) 6 10.2 2.9 ... ... ... ... ... ... ... ... ... ... 86.9 Latvia ... ... ... ... ... ... ... ... ... ... ... ... ... ... Lithuania ... ... ... ... ... ... ... ... ... ... ... ... ... ... Malta ... ... ... ... ... ... ... ... ... ... ... ... ... ... Netherlands 15 1.4 3.0 71.3 99.7 ... ... 11.3 69.7 ... 12.0 56.8 ... 0.9 Poland 12 ... ... 89.0 ... ... ... 2.2 ... ... 8.8 ... ... ... Portugal 3 2.0 36.6 ... ... ... ... 39.4 ... 68.8 8.1 ... ... ... Serbia 2 ... ... 94.2 ... ... ... ... ... ... 5.8 ... ... ... Slovakia ... ... ... ... ... ... ... ... ... ... ... ... ... ... Slovenia 5 ... 0.0 99.1 8.2 55.5 ... ... ... ... 0.0 ... ... 0.9 Spain ... ... ... ... ... ... ... ... ... ... ... ... ... ... Sweden 51 70.4 7.7 0.3 0.0 ... ... 0.2 0.0 ... 0.0 0.0 0.0 21.4 Switzerland 61 ... ... ... ... ... ... ... ... ... ... ... ... ... Turkey 20 ... 33.3 3.9 ... ... ... 11.2 ... ... 36.3 ... ... 15.2 Ukraine 15 ... ... ... ... ... ... ... ... ... 13.5 ... ... ... UK: E & W 25 ... 2.4 96.3 ... ... ... ... ... ... 3.7 ... ... 20.2 UK: N. Ireland 15 ... 3.6 17.9 2.0 42.9 ... 4.4 ... ... 14.6 ... ... 59.5 UK: Scotland 10 23.2 21.4 42.5 26.8 2.8 57.3 ... ... ... 13.0 ... 0.0 ... Mean 20 22.5 15.3 56.8 32.8 33.3 52.2 13.9 24.1 52.2 10.5 30.8 0.0 18.8 Median 15 6.6 3.5 73.0 19.3 42.9 57.3 9.2 7.4 48.2 8.1 33.2 0.0 0.9 Minimum 2 0.0 0.0 0.0 0.0 2.8 20.5 0.2 0.0 12.6 0.0 0.0 0.0 0.0 Maximum 67 99.3 95.7 99.1 99.7 55.5 78.8 41.4 69.7 100.0 37.7 56.8 0.0 86.9

231
Table 3.2.5.12 Minors receiving sanctions/measures in 2010 – Theft: Theft of a motor vehicle
To
tal s
anct
ions
and
mea
sure
s pe
r 10
0 00
0 po
p.
Of w
hich
: % v
erdi
ct /
adm
oniti
on o
nly
Of w
hich
: % fi
nes
Of which: % non-custodial sanctions and measures
Of which: % suspended custodial sanctions and measures
Of which: % unsuspended custodial sanctions and measures
Of w
hich
: % o
ther
mea
sure
s
Tota
l
Of w
hich
: % c
omm
unity
se
rvic
e
Of w
hich
: %
supe
rvis
ion
Of w
hich
: % p
roba
tion
as a
san
ctio
n of
its
own
right
To
tal
Of w
hich
: % w
ith
com
mun
ity s
ervi
ce
Of w
hich
: % w
ith
supe
rvis
ion
Tota
l
Of w
hich
: % p
artia
lly
susp
ende
d
Of w
hich
: % p
sych
iatri
c ho
spita
l
Albania ... ... ... ... ... ... ... ... ... ... ... ... ... ... Armenia 0.0 ... ... ... ... ... ... ... ... 0.0 ... ... 0.0 ... Austria ... ... ... ... ... ... ... ... ... ... ... ... ... ... Bulgaria ... ... ... ... ... ... ... ... ... ... ... ... ... ... Croatia 0.3 ... ... 100.0 41.7 25.0 33.3 ... ... ... ... ... ... ... Cyprus ... ... ... ... ... ... ... ... ... ... ... ... ... ... Czech Republic ... ... ... ... ... ... ... ... ... ... ... ... ... ... Denmark ... ... ... ... ... ... ... ... ... ... ... ... ... ... Estonia ... ... ... ... ... ... ... ... ... ... ... ... ... ... Finland 2.3 0.0 84.8 2.4 100.0 … ... 10.4 0.0 ... 0.0 ... ... 2.4 France ... ... ... ... ... ... ... ... ... ... ... ... ... ... Georgia ... ... ... ... ... ... ... ... ... ... ... ... ... ... Germany ... ... ... ... ... ... ... ... ... ... ... ... ... ... Greece ... ... ... ... ... ... ... ... ... ... ... ... ... ... Hungary 1.5 1.3 4.7 66.0 19.2 ... 64.6 28.7 44.2 ... 5.3 ... ... ... Ireland ... ... ... ... ... ... ... ... ... ... ... ... ... ... Italy ... ... ... ... ... ... ... ... ... ... ... ... ... ... Kosovo (UNR) ... ... ... ... ... ... ... ... ... ... ... ... ... ... Latvia ... ... ... ... ... ... ... ... ... ... ... ... ... ... Lithuania ... ... ... ... ... ... ... ... ... ... ... ... ... ... Malta ... ... ... ... ... ... ... ... ... ... ... ... ... ... Netherlands ... ... ... ... ... ... ... ... ... ... ... ... ... ... Poland ... ... ... ... ... ... ... ... ... ... ... ... ... ... Portugal 0.2 ... 65.4 ... ... ... ... 11.5 ... ... 15.4 ... ... ... Serbia ... ... ... ... ... ... ... ... ... ... ... ... ... ... Slovakia ... ... ... ... ... ... ... ... ... ... ... ... ... ... Slovenia ... ... ... ... ... ... ... ... ... ... ... ... ... ... Spain ... ... ... ... ... ... ... ... ... ... ... ... ... ... Sweden 2.1 13.1 8.0 0.5 0.0 ... ... 0.5 0.0 ... 0.0 ... ... 77.9 Switzerland ... ... ... ... ... ... ... ... ... ... ... ... ... ... Turkey ... ... ... ... ... ... ... ... ... ... ... ... ... ... Ukraine 1.0 ... ... ... ... ... ... ... ... ... 31.2 ... ... ... UK: E & W 0.9 ... 0.4 82.7 ... ... ... ... ... ... 17.3 ... ... 14.2 UK: N. Ireland 1.6 ... 7.1 35.7 0.0 70.0 ... 0.0 ... ... 10.7 ... ... 46.4 UK: Scotland 1.3 16.7 12.1 51.5 26.5 5.9 47.1 ... ... ... 19.7 ... 0.0 ... Mean 1.1 7.8 26.1 48.4 31.2 33.6 48.3 10.2 14.7 0.0 12.5 ... 0.0 35.2 Median 1.1 7.2 8.0 51.5 22.8 25.0 47.1 10.4 0.0 0.0 13.0 ... 0.0 30.3 Minimum 0.0 0.0 0.4 0.5 0.0 5.9 33.3 0.0 0.0 0.0 0.0 0.0 0.0 2.4 Maximum 2.3 16.7 84.8 100.0 100.0 70.0 64.6 28.7 44.2 0.0 31.2 0.0 0.0 77.9

232
Table 3.2.5.13 Minors receiving sanctions/measures in 2010 – (Theft) Burglary: Total
Tota
l san
ctio
ns a
nd m
easu
res
per
100
000
pop.
Of w
hich
: % v
erdi
ct /
adm
oniti
on o
nly
Of w
hich
: % fi
nes
Of which: % non-custodial sanctions and measures
Of which: % suspended custodial sanctions and measures
Of which: % unsuspended custodial sanctions and measures
Of w
hich
: % o
ther
mea
sure
s
Tota
l
Of w
hich
: % c
omm
unity
se
rvic
e
Of w
hich
: %
supe
rvis
ion
Of w
hich
: % p
roba
tion
as a
san
ctio
n of
its
own
right
To
tal
Of w
hich
: % w
ith
com
mun
ity s
ervi
ce
Of w
hich
: % w
ith
supe
rvis
ion
Tota
l
Of w
hich
: % p
artia
lly
susp
ende
d
Of w
hich
: % p
sych
iatri
c ho
spita
l
Albania ... ... ... ... ... ... ... ... ... ... ... ... ... ... Armenia ... ... ... ... ... ... ... ... ... ... ... ... ... 0.0 Austria 2.9 ... ... ... ... ... ... 14.8 ... ... ... ... ... ... Bulgaria ... ... ... ... ... ... ... ... ... ... ... ... ... ... Croatia 5.9 ... ... 95.4 32.0 46.0 22.0 2.3 ... ... 1.5 ... ... 0.8 Cyprus ... ... ... ... ... ... ... ... ... ... ... ... ... ... Czech Republic ... ... ... ... ... ... ... ... ... ... ... ... ... ... Denmark ... ... ... ... ... ... ... ... ... ... ... ... ... ... Estonia ... ... ... ... ... ... ... ... ... ... ... ... ... ... Finland ... 0.0 ... ... ... ... ... ... ... ... ... ... ... ... France ... ... ... ... ... ... ... ... ... ... ... ... ... ... Georgia ... ... ... ... ... ... ... ... ... ... ... ... ... ... Germany 7.9 ... ... 69.1 ... ... ... 18.6 ... 100.0 12.2 ... ... ... Greece ... ... ... ... ... ... ... ... ... ... ... ... ... ... Hungary ... ... ... ... ... ... ... ... ... ... ... ... ... ... Ireland ... ... ... ... ... ... ... ... ... ... ... ... ... ... Italy ... ... ... ... ... ... ... ... ... ... ... ... ... ... Kosovo (UNR) 4.4 0.0 4.1 ... ... ... ... ... ... ... ... ... ... 96.9 Latvia ... ... ... ... ... ... ... ... ... ... ... ... ... ... Lithuania ... ... ... ... ... ... ... ... ... ... ... ... ... ... Malta ... ... ... ... ... ... ... ... ... ... ... ... ... ... Netherlands 11.3 0.9 2.2 70.7 99.8 ... ... 11.4 74.0 ... 14.2 58.4 ... 0.6 Poland 4.7 ... ... 84.8 ... ... ... 3.8 ... ... 11.4 ... ... ... Portugal 0.2 ... ... ... ... ... ... 55.6 ... 80.0 ... ... ... ... Serbia ... ... ... ... ... ... ... ... ... ... ... ... ... ... Slovakia ... ... ... ... ... ... ... ... ... ... ... ... ... ... Slovenia 2.1 ... 0.0 100.0 7.0 65.1 ... ... ... ... 0.0 ... ... 0.0 Spain ... ... ... ... ... ... ... ... ... ... ... ... ... ... Sweden ... ... ... ... ... ... ... ... ... ... ... ... ... ... Switzerland ... ... ... ... ... ... ... ... ... ... ... ... ... ... Turkey ... ... ... ... ... ... ... ... ... ... ... ... ... ... Ukraine ... ... ... ... ... ... ... ... ... ... ... ... ... ... UK: E & W 9.3 ... 0.2 83.3 ... ... ... ... ... ... 16.7 ... ... 9.8 UK: N. Ireland 4.5 ... 1.2 18.5 6.7 53.3 ... 6.2 ... ... 13.6 ... ... 60.5 UK: Scotland 2.5 18.9 9.8 55.3 39.7 1.4 53.4 ... ... ... 15.9 ... 0.0 ... Mean 5.1 4.9 2.9 72.1 37.0 41.5 37.7 16.1 74.0 90.0 10.7 58.4 0.0 24.1 Median 4.5 0.4 1.7 77.0 32.0 49.7 37.7 11.4 74.0 90.0 12.9 58.4 0.0 0.8 Minimum 0.2 0.0 0.0 18.5 6.7 1.4 22.0 2.3 74.0 80.0 0.0 58.4 0.0 0.0 Maximum 11.3 18.9 9.8 100.0 99.8 65.1 53.4 55.6 74.0 100.0 16.7 58.4 0.0 96.9

233
Table 3.2.5.14 Minors receiving sanctions/measures in 2010 – (Theft) Burglary: Domestic burglary
Germany 1.4 ... ... 58.3 ... ... ... 24.2 ... 100.0 17.6 ... ... ... Portugal 0.0 ... ... ... ... ... ... 60.0 ... 100.0 ... ... ... ... UK: E & W 6.1 ... 0.1 78.3 ... ... ... ... ... ... 21.7 ... ... 8.6 UK: N. Ireland 1.9 ... 0.0 26.5 11.1 55.6 ... 5.9 ... ... 17.6 ... ... 50.0
Table 3.2.5.15 Minors receiving sanctions/measures in 2010 – Fraud
To
tal s
anct
ions
and
mea
sure
s pe
r 100
000
pop
.
Of w
hich
: % v
erdi
ct /
adm
oniti
on
only
Of w
hich
: % fi
nes
Of which: % non-custodial sanctions and measures
Of which: % suspended custodial sanctions and measures
Of which: % unsuspended custodial sanctions and measures
Of w
hich
: % o
ther
mea
sure
s
Tota
l
Of w
hich
: %
com
mun
ity s
ervi
ce
Of w
hich
: %
supe
rvis
ion
Of w
hich
: %
prob
atio
n as
a
sanc
tion
of it
s ow
n rig
ht
Tota
l
Of w
hich
: % w
ith
com
mun
ity s
ervi
ce
Of w
hich
: % w
ith
supe
rvis
ion
Tota
l
Of w
hich
: % p
artia
lly
susp
ende
d
Of w
hich
: %
psyc
hiat
ric h
ospi
tal
Albania 0.0 ... ... ... ... ... ... ... ... ... ... ... ... ... Armenia 0.0 ... ... ... ... ... ... ... ... 0.0 ... ... 0.0 ... Austria 0.4 ... 10.0 ... ... ... ... ... ... ... 216.7 27.7 ... ... Bulgaria ... ... ... ... ... ... ... ... ... ... ... ... ... ... Croatia 0.0 ... ... 100.0 100.0 ... ... ... ... ... ... ... ... ... Cyprus ... ... ... ... ... ... ... ... ... ... ... ... ... ... Czech Republic 0.2 5.0 0.0 ... ... ... ... 55.0 ... 9.1 0.0 ... ... ... Denmark ... ... ... ... ... ... ... ... ... ... ... ... ... ... Estonia ... ... ... ... ... ... ... ... ... ... ... ... ... ... Finland 2.9 0.0 91.5 0.7 100.0 0.0 ... 7.8 0.0 ... 7.8 ... ... 0.0 France 0.5 6.0 6.0 64.4 ... ... ... 19.9 3.2 30.2 3.8 16.7 ... ... Georgia ... ... ... ... ... ... ... ... ... ... ... ... ... ... Germany 4.8 ... ... 83.5 ... ... ... 11.2 ... 100.0 5.4 ... ... ... Greece 0.0 ... ... ... ... ... ... ... ... ... ... ... ... ... Hungary 0.3 ... ... 79.4 11.1 ... 88.9 17.6 50.0 ... 2.9 ... ... ... Ireland ... ... ... ... ... ... ... ... ... ... ... ... ... ... Italy ... ... ... ... ... ... ... ... ... ... ... ... ... ... Kosovo (UNR) 0.1 50.0 0.0 ... ... ... ... ... ... ... ... ... ... 50.0 Latvia ... ... ... ... ... ... ... ... ... ... ... ... ... ... Lithuania ... ... ... ... ... ... ... ... ... ... ... ... ... ... Malta ... ... ... ... ... ... ... ... ... ... ... ... ... ... Netherlands 0.4 6.0 16.4 58.2 97.4 ... ... 9.0 66.7 ... 10.4 42.9 ... 0.0 Poland 0.4 ... ... 93.0 ... ... ... 0.7 ... ... 6.3 ... ... ... Portugal 0.0 ... 100.0 ... ... ... ... ... ... ... ... ... ... ... Serbia 0.0 ... ... 100.0 ... ... ... ... ... ... 0.0 ... ... ... Slovakia ... ... ... ... ... ... ... ... ... ... ... ... ... ... Slovenia 0.2 ... 0.0 100.0 0.0 75.0 ... ... ... ... 0.0 ... ... 0.0 Spain ... ... ... ... ... ... ... ... ... ... ... ... ... ... Sweden 2.4 24.0 13.6 0.9 0.0 ... ... 0.9 0.0 ... 0.9 50.0 0.0 59.7 Switzerland 1.0 ... ... ... ... ... ... ... ... ... ... ... ... ... Turkey 0.3 ... 51.6 13.6 ... ... ... 9.5 ... ... 17.2 ... ... 8.1 Ukraine 0.3 ... ... ... ... ... ... ... ... ... ... ... ... ... UK: E & W 1.0 ... 3.1 96.0 ... ... ... ... ... ... 4.0 ... ... 22.8 UK: N. Ireland 0.2 ... 25.0 0.0 ... ... ... 0.0 ... ... 0.0 ... ... 75.0 UK: Scotland 0.3 25.0 12.5 37.5 50.0 0.0 50.0 ... ... ... 25.0 ... 0.0 ... Mean 0.7 16.6 25.4 59.1 51.2 25.0 69.4 13.2 24.0 34.8 20.0 34.3 0.0 27.0 Median 0.3 6.0 12.5 71.9 50.0 0.0 69.4 9.2 3.2 19.6 4.0 35.3 0.0 15.4 Minimum 0.0 0.0 0.0 0.0 0.0 0.0 50.0 0.0 0.0 0.0 0.0 16.7 0.0 0.0 Maximum 4.8 50.0 100.0 100.0 100.0 75.0 88.9 55.0 66.7 100.0 216.7 50.0 0.0 75.0

234
Table 3.2.5.16 Minors receiving sanctions/measures in 2010 – Money laundering
Tota
l san
ctio
ns a
nd m
easu
res
per 1
00
000
pop
Of w
hich
: % v
erdi
ct /
adm
oniti
on o
nly
Of w
hich
: % fi
nes
Of which: % non-custodial sanctions and measures
Of which: % suspended custodial sanctions and measures
Of which: % unsuspended custodial sanctions and measures
Of w
hich
: % o
ther
mea
sure
s
Tota
l
Of w
hich
: % c
omm
unity
se
rvic
e
Of w
hich
: %
supe
rvis
ion
Of w
hich
: % p
roba
tion
as
a sa
nctio
n of
its
own
right
To
tal
Of w
hich
: % w
ith
com
mun
ity s
ervi
ce
Of w
hich
: % w
ith
supe
rvis
ion
Tota
l
Of w
hich
: % p
artia
lly
susp
ende
d
Of w
hich
: % p
sych
iatri
c ho
spita
l
Albania 0.0 100.0 0.0 ... ... ... ... ... ... ... ... ... ... ... Finland 0.0 0.0 100.0 0.0 ... ... ... 0.0 ... ... 0.0 ... ... 0.0 Germany 0.0 ... ... 95.0 ... ... ... 0.0 ... ... 5.0 ... ... ... Netherlands 0.0 0.0 0.0 100.0 100.0 ... ... 0.0 ... ... 0.0 ... ... 0.0 Sweden 0.0 0.0 0.0 0.0 ... ... ... 0.0 ... ... 0.0 ... ... 100.0
Table 3.2.5.17 Minors receiving sanctions/measures in 2010 – Corruption
France 0.0 0.0 25.0 25.0 ... ... ... 25.0 0.0 0.0 25.0 0.0 ... ... Germany 0.0 ... ... 100.0 ... ... ... 0.0 ... ... 0.0 ... ... ... Hungary 0.1 ... ... 80.0 25.0 ... 25.0 20.0 ... ... ... ... ... ... Turkey 0.0 ... 20.0 40.0 ... ... ... ... ... ... 40.0 ... ... ...

235
Table 3.2.5.18 Minors receiving sanctions/measures in 2010 – Drug offences: Total
To
tal s
anct
ions
and
mea
sure
s pe
r 10
0 00
0 po
p
Of w
hich
: % v
erdi
ct /
adm
oniti
on o
nly
Of w
hich
: % fi
nes
Of which: % non-custodial sanctions and measures
Of which: % suspended custodial sanctions and measures
Of which: % unsuspended custodial sanctions and measures
Of w
hich
: % o
ther
mea
sure
s
Tota
l
Of w
hich
: % c
omm
unity
se
rvic
e
Of w
hich
: %
supe
rvis
ion
Of w
hich
: % p
roba
tion
as a
san
ctio
n of
its
own
right
To
tal
Of w
hich
: % w
ith
com
mun
ity s
ervi
ce
Of w
hich
: % w
ith
supe
rvis
ion
Tota
l
Of w
hich
: % p
artia
lly
susp
ende
d
Of w
hich
: % p
sych
iatri
c ho
spita
l
Albania 0.3 100.0 0.0 ... ... ... ... ... ... ... ... ... ... ... Armenia 0.1 ... ... 25.0 ... 0.0 ... ... ... ... ... ... 0.0 0.0 Austria 2.5 ... 19.8 ... ... ... ... 12.6 ... ... 44.9 30.1 ... ... Bulgaria ... ... ... ... ... ... ... ... ... ... ... ... ... ... Croatia 1.4 ... ... 61.9 46.2 46.2 7.7 9.5 ... ... 1.6 ... ... 27.0 Cyprus ... ... ... ... ... ... ... ... ... ... ... ... ... ... Czech Republic 0.8 19.3 0.0 ... ... ... ... 53.0 ... 13.6 4.8 ... ... ... Denmark ... ... ... ... ... ... ... ... ... ... ... ... ... ... Estonia ... ... ... ... ... ... ... ... ... ... ... ... ... ... Finland 4.4 0.0 89.5 0.4 100.0 0.0 ... 2.9 0.0 ... 2.9 ... ... 7.1 France 5.7 2.9 9.1 51.7 ... ... ... 27.7 5.8 36.6 8.6 44.7 ... ... Georgia ... ... ... ... ... ... ... ... ... ... ... ... ... ... Germany 8.3 ... ... 80.7 ... ... ... 13.7 ... 100.0 5.6 ... ... ... Greece 0.2 ... ... ... ... ... ... 100.0 ... ... ... ... ... ... Hungary 1.8 2.8 6.8 87.5 16.2 ... 71.4 11.9 119.0 ... 0.6 ... ... ... Ireland ... ... ... ... ... ... ... ... ... ... ... ... ... ... Italy ... ... ... ... ... ... ... ... ... ... ... ... ... ... Kosovo (UNR) 0.2 0.0 0.0 ... ... ... ... ... ... ... ... ... ... 100.0 Latvia ... ... ... ... ... ... ... ... ... ... ... ... ... ... Lithuania ... ... ... ... ... ... ... ... ... ... ... ... ... ... Malta ... ... ... ... ... ... ... ... ... ... ... ... ... ... Netherlands 1.0 1.8 7.4 58.9 100.0 ... ... 14.7 79.2 ... 16.0 69.2 ... 1.2 Poland 2.8 ... ... 96.5 ... ... ... 1.4 ... ... 2.1 ... ... ... Portugal 0.9 ... 29.7 ... ... ... ... 54.9 ... 76.0 6.6 ... ... ... Serbia 1.2 ... ... 97.8 ... ... ... ... ... ... 2.2 ... ... ... Slovakia ... ... ... ... ... ... ... ... ... ... ... ... ... ... Slovenia 0.7 ... 0.0 93.3 0.0 42.9 ... ... ... ... 0.0 ... ... 6.7 Spain ... ... ... ... ... ... ... ... ... ... ... ... ... ... Sweden 16.9 71.5 15.4 0.1 0.0 ... ... 0.0 ... ... 0.2 0.0 0.0 12.8 Switzerland 59.2 ... ... ... ... ... ... ... ... ... ... ... ... ... Turkey 7.4 ... 13.0 1.3 ... ... ... 2.7 ... ... 6.3 ... ... 76.7 Ukraine 1.0 ... ... ... ... ... ... ... ... ... 11.2 ... ... ... UK: E & W 10.7 ... 16.7 96.2 ... ... ... ... ... ... 3.8 ... ... 30.1 UK: N. Ireland 1.8 ... 21.9 15.6 40.0 40.0 ... 3.1 ... ... 3.1 ... ... 56.3 UK: Scotland 2.0 22.6 51.9 18.9 45.0 5.0 35.0 ... ... ... 6.6 ... 0.0 ... Mean 5.7 24.6 18.7 52.4 43.4 22.3 38.0 22.0 51.0 56.6 7.1 36.0 0.0 31.8 Median 1.8 2.9 13.0 58.9 42.5 22.5 35.0 12.2 42.5 56.3 4.3 37.4 0.0 19.9 Minimum 0.1 0.0 0.0 0.1 0.0 0.0 7.7 0.0 0.0 13.6 0.0 0.0 0.0 0.0 Maximum 59.2 100.0 89.5 97.8 100.0 46.2 71.4 100.0 119.0 100.0 44.9 69.2 0.0 100.0

236
Table 3.2.5.19 Minors receiving sanctions/measures in 2010 – Drug offences: Drug trafficking
Tota
l san
ctio
ns a
nd m
easu
res
per 1
00
000
pop
Of w
hich
: % v
erdi
ct /
adm
oniti
on o
nly
Of w
hich
: % fi
nes
Of which: % non-custodial sanctions and measures
Of which: % suspended custodial sanctions and measures
Of which: % unsuspended custodial sanctions and measures
Of w
hich
: % o
ther
mea
sure
s
Tota
l
Of w
hich
: % c
omm
unity
se
rvic
e
Of w
hich
: %
supe
rvis
ion
Of w
hich
: % p
roba
tion
as a
san
ctio
n of
its
own
right
To
tal
Of w
hich
: % w
ith
com
mun
ity s
ervi
ce
Of w
hich
: % w
ith
s upe
rvis
ion
Tota
l
Of w
hich
: % p
artia
lly
susp
ende
d
Of w
hich
: % p
sych
iatri
c ho
spita
l
Albania 0.3 100.0 0.0 ... ... ... ... ... ... ... ... ... ... ... Armenia 0.0 ... ... 0.0 ... ... ... ... ... 0.0 ... ... 0.0 0.0 Austria ... ... ... ... ... ... ... ... ... ... ... ... ... ... Bulgaria ... ... ... ... ... ... ... ... ... ... ... ... ... ... Croatia 0.5 ... ... 42.9 33.3 55.6 11.1 28.6 ... ... 4.8 ... ... 23.8 Cyprus ... ... ... ... ... ... ... ... ... ... ... ... ... ... Czech Republic 0.7 18.9 0.0 ... ... ... ... 52.7 ... 12.8 4.1 ... ... ... Denmark ... ... ... ... ... ... ... ... ... ... ... ... ... ... Estonia ... ... ... ... ... ... ... ... ... ... ... ... ... ... Finland 1.7 0.0 83.9 1.1 100.0 0.0 ... 7.5 0.0 ... 7.5 ... ... 0.0 France 1.1 1.0 5.9 33.2 ... ... ... 45.0 4.8 33.3 14.9 57.3 ... ... Georgia ... ... ... ... ... ... ... ... ... ... ... ... ... ... Germany 0.8 ... ... 25.0 ... ... ... 56.5 ... 100.0 18.5 ... ... ... Greece ... ... ... ... ... ... ... ... ... ... ... ... ... ... Hungary ... ... ... ... ... ... ... ... ... ... ... ... ... ... Ireland ... ... ... ... ... ... ... ... ... ... ... ... ... ... Italy ... ... ... ... ... ... ... ... ... ... ... ... ... ... Kosovo (UNR) 0.2 0.0 0.0 ... ... ... ... ... ... ... ... ... ... 100.0 Latvia ... ... ... ... ... ... ... ... ... ... ... ... ... ... Lithuania ... ... ... ... ... ... ... ... ... ... ... ... ... ... Malta ... ... ... ... ... ... ... ... ... ... ... ... ... ... Netherlands ... ... ... ... ... ... ... ... ... ... ... ... ... ... Poland 0.1 ... ... 96.7 ... ... ... 0.0 ... ... 3.3 ... ... ... Portugal 0.4 ... 17.1 ... ... ... ... 68.3 ... 82.1 12.2 ... ... ... Serbia 0.9 ... ... 97.0 ... ... ... ... ... ... 3.0 ... ... ... Slovakia ... ... ... ... ... ... ... ... ... ... ... ... ... ... Slovenia 0.5 ... 0.0 100.0 0.0 36.4 ... ... ... ... 0.0 ... ... 0.0 Spain ... ... ... ... ... ... ... ... ... ... ... ... ... ... Sweden ... ... ... ... ... ... ... ... ... ... ... ... ... ... Switzerland 7.4 ... ... ... ... ... ... ... ... ... ... ... ... ... Turkey 1.5 ... 35.5 4.6 ... ... ... 12.2 ... ... 28.5 ... ... 19.3 Ukraine ... ... ... ... ... ... ... ... ... ... ... ... ... ... UK: E & W 0.0 ... 0.0 0.0 ... ... ... ... ... ... 100.0 ... ... 0.0 UK: N. Ireland ... ... ... ... ... ... ... ... ... ... ... ... ... ... UK: Scotland 0.4 9.1 13.6 50.0 63.6 9.1 27.3 ... ... ... 27.3 ... 0.0 ... Mean 1.0 21.5 15.6 40.9 49.2 25.3 19.2 33.9 2.4 45.7 18.7 57.3 0.0 20.4 Median 0.5 5.1 3.0 33.2 48.5 22.7 19.2 36.8 2.4 33.3 9.9 57.3 0.0 0.0 Minimum 0.0 0.0 0.0 0.0 0.0 0.0 11.1 0.0 0.0 0.0 0.0 57.3 0.0 0.0 Maximum 7.4 100.0 83.9 100.0 100.0 55.6 27.3 68.3 4.8 100.0 100.0 57.3 0.0 100.0

237
Notes on tables 3.2.5.1 to 3.2.5.19
Croatia: Data relate to the year 2011 (instead of 2010). Greece: Data relate to the year 2009 (instead of 2010). UK: Northern Ireland: Data relate to the year 2006 (instead of 2010).
Table 3.2.6 Community sanctions and measures imposed upon minors in 2010
Table 3.2.6.1 Community sanctions and measures imposed upon minors in 2010 – Criminal offences: Total
Tota
l san
ctio
ns a
nd
mea
sure
s pe
r 100
000
po
p.
Tota
l com
mun
ity
sanc
tions
and
mea
sure
s pe
r 100
000
pop
.
Of w
hich
: % c
omm
unity
se
rvic
e
Of w
hich
: % s
uper
visi
on
Of w
hich
: % re
stitu
tion
Of w
hich
: % a
mbu
lant
th
erap
eutic
trea
tmen
t
Of w
hich
: % p
rob a
tion
as
a sa
nctio
n in
its
own
right
Of w
hich
: % e
duca
tiona
l sa
nctio
ns a
nd m
easu
res
Of w
hich
: % o
ther
co
mm
unity
san
ctio
ns a
nd
mea
sure
s
Denmark 89 27 8.3 ... ... ... ... ... ... Germany 205 160 ... ... ... ... ... ... ... Kosovo (UNR) 19 19 ... ... ... ... ... 85.8 ... Netherlands 73 43 95.9 ... ... ... ... 4.1 ... Poland 72 47 6.1 44.1 2.0 2.2 ... ... 45.5 Switzerland 201 94 100.0 8.2 ... 5.2 ... 3.2 ... UK: England & Wales 134 86 ... ... ... ... ... ... ... UK: Northern Ireland 68 9 14.9 37.3 0.0 0.0 0.0 0.0 47.8 Mean 78 61 45.0 29.9 1.0 2.5 0.0 23.3 46.7 Median 68 45 14.9 37.3 1.0 2.2 0.0 3.7 46.7 Minimum 5 9 6.1 8.2 0.0 0.0 0.0 0.0 45.5 Maximum 205 160 100.0 44.1 2.0 5.2 0.0 85.8 47.8
Table 3.2.6.2 Community sanctions and measures imposed upon minors in 2010 –
Criminal offences: Major traffic offences
Germany 20.8 19.0 ... ... ... ... ... ... ... Kosovo (UNR) 0.0 0.0 ... 100.0 ... ... ... 100.0 ... Netherlands 2.5 1.2 93.4 ... ... ... ... 6.6 ... Poland 1.7 1.3 2.2 21.5 0.0 1.2 ... ... 75.1 UK: England & Wales 0.3 0.2 ... ... ... ... ... ... ... UK: Northern Ireland 1.5 1.1 0.0 0.0 0.0 0.0 0.0 0.0 100.0
Table 3.2.6.3 Community sanctions and measures imposed upon minors in 2010 –
Intentional homicide: Total
Germany 0.1 0.0 ... ... ... ... ... ... ... Kosovo (UNR) 0.7 0.7 33.3 20.0 ... ... ... 66.7 ... Netherlands 1.1 0.2 96.9 ... ... ... ... 3.1 ... Poland 0.0 0.0 0.0 62.5 0.0 25.0 ... ... 12.5 UK: England & Wales 0.1 0.0 ... ... ... ... ... ... ... UK: Northern Ireland 0.0 0.0 ... ... ... ... ... ... ...

238
Table 3.2.6.4 Community sanctions and measures imposed upon minors in 2010 – Intentional homicide: Completed
Tota
l san
ctio
ns a
nd
mea
sure
s pe
r 10
0 00
0 po
p.
Tota
l com
mun
ity s
anct
ions
an
d m
easu
res
per
100
000
pop.
Of w
hich
: %
com
mun
ity s
ervi
ce
Of w
hich
: %
sup
ervi
sion
Of w
hich
: %
rest
itutio
n
Of w
hich
: %
am
bula
nt th
erap
eutic
tre
atm
ent
Of w
hich
: %
pro
batio
n as
a s
anct
ion
in it
s ow
n rig
ht
Of w
hich
: %
edu
catio
nal s
anct
ions
an
d m
easu
res
Of w
hich
: %
oth
er c
omm
unity
sa
nctio
ns a
nd m
easu
res
Kosovo (UNR) 0.5 0.4 55.6 33.3 ... ... ... 77.8 ... Table 3.2.6.5 Community sanctions and measures imposed upon minors in 2010 –
Bodily injury (Assault): Total
Germany 51.0 36.9 ... ... ... ... ... ... ... Kosovo (UNR) 5.7 5.7 ... 1.6 ... ... ... 84.8 ... Netherlands 10.1 6.4 95.0 ... ... ... ... 5.0 ... Poland 8.4 5.9 6.9 42.3 0.2 1.6 ... ... 49.0 UK: E & W 11.4 9.2 ... ... ... ... ... ... ... UK: N. Ireland 41.0 8.1 47.6 42.1 0.0 0.0 0.0 0.0 10.3
Table 3.2.6.6 Community sanctions and measures imposed upon minors in 2010 –
Bodily injury (Assault): Aggravated bodily injury
Germany 26.6 18.0 ... ... ... ... ... ... ... Kosovo (UNR) 0.6 0.6 ... ... ... ... ... 85.7 ... Netherlands 2.6 1.2 96.4 ... ... ... ... 3.6 ... Poland 0.2 0.1 2.6 61.5 0.0 0.0 ... ... 35.9 UK: N. Ireland 1.7 0.1 0.0 0.0 0.0 0.0 0.0 0.0 100.0
Table 3.2.6.7 Community sanctions and measures imposed upon minors in 2010 –
Sexual assault: Total
Germany 1.4 0.7 ... ... ... ... ... ... ... Kosovo (UNR) 0.3 0.3 ... ... ... ... ... 71.4 ... Netherlands 1.3 0.5 86.7 ... ... ... ... 13.3 ... Poland 0.7 0.5 1.1 61.2 0.0 5.5 ... ... 32.2 UK: E & W 1.1 0.8 ... ... ... ... ... ... ... UK: N. Ireland 0.5 0.4 100.0 0.0 0.0 0.0 0.0 0.0 0.0
Table 3.2.6.8 Community sanctions and measures imposed upon minors in 2010 –
Sexual assault: Rape
Germany 0.3 0.1 ... ... ... ... ... ... ... Kosovo (UNR) 0.1 0.1 ... ... ... ... ... 50.0 ... Netherlands 0.3 0.0 87.5 ... ... ... ... 12.5 ... Poland 0.3 0.1 0.0 68.0 0.0 4.0 ... ... 28.0 UK: E & W 0.1 0.1 ... ... ... ... ... ... ...

239
Table 3.2.6.9 Community sanctions and measures imposed upon minors in 2010 –
Sexual assault: Sexual abuse of a child To
tal s
anct
ions
and
m
easu
res
per
100
000
pop.
Tota
l com
mun
ity s
anct
ions
an
d m
easu
res
per
100
000
pop.
Of w
hich
: %
com
mun
ity s
ervi
ce
Of w
hich
: %
sup
ervi
sion
Of w
hich
: %
rest
itutio
n
Of w
hich
: %
am
bula
nt th
erap
eutic
tre
atm
ent
Of w
hich
: %
pro
batio
n as
a s
anct
ion
in it
s ow
n rig
ht
Of w
hich
: %
edu
catio
nal s
anct
ions
an
d m
easu
res
Of w
hich
: %
oth
er c
omm
unity
sa
nctio
ns a
nd m
easu
res
Germany 0.7 0.4 ... ... ... ... ... ... ... Kosovo (UNR) 0.1 0.1 ... ... ... ... ... 50.0 ... Netherlands 0.3 0.1 88.2 ... ... ... ... 11.8 ... Poland 0.5 0.3 1.5 58.6 0.0 6.0 ... ... 33.8 UK: E & W 0.6 0.5 ... ... ... ... ... ... ... UK: N. Ireland 0.2 0.2 100.0 0.0 0.0 0.0 0.0 0.0 0.0
Table 3.2.6.10 Community sanctions and measures imposed upon minors in 2010 –
Robbery: Total
Germany 9.2 4.4 ... ... ... ... ... ... ... Kosovo (UNR) 0.6 0.6 ... ... ... ... ... 35.7 ... Netherlands 8.3 2.7 96.2 ... ... ... ... 3.8 ... Poland 4.1 2.7 3.9 59.7 0.7 3.1 ... ... 32.7 UK: E & W 6.2 4.4 ... ... ... ... ... ... ... UK: N. Ireland 0.5 0.1 0.0 100.0 0.0 0.0 0.0 0.0 0.0
Table 3.2.6.11 Community sanctions and measures imposed upon minors in 2010 –
Theft: Total
Germany 52 40 ... ... ... ... ... ... ... Kosovo (UNR) 6 6 ... ... ... ... ... 86.9 ... Netherlands 20 13 96.7 ... ... ... ... 3.3 ... Poland 15 11 5.7 50.1 2.5 2.1 ... ... 39.5 UK: E & W 25 18 ... ... ... ... ... ... ... UK: N. Ireland 15 3 2.0 42.9 0.0 0.0 0.0 0.0 0.0
Table 3.2.6.12 Community sanctions and measures imposed upon minors in 2010 –
Theft: Theft of a motor vehicle
Denmark 3.0 2.5 1.4 ... ... ... ... ... ... UK: E & W 0.9 0.6 ... ... ... ... ... ... ... UK: N. Ireland 1.6 0.6 0.0 70.0 0.0 0.0 0.0 0.0 30.0

240
Table 3.2.6.13 Community sanctions and measures imposed upon minors in 2010 –
(Theft) Burglary: Total
Tota
l san
ctio
ns a
nd
mea
sure
s pe
r 10
0 00
0 po
p.
Tota
l com
mun
ity s
anct
ions
an
d m
easu
res
per
100
000
pop
Of w
hich
: %
com
mun
ity s
ervi
ce
Of w
hich
: %
sup
ervi
sion
Of w
hich
: %
rest
itutio
n
Of w
hich
: %
am
bula
nt th
erap
eutic
tre
atm
ent
Of w
hich
: %
pro
batio
n as
a s
anct
ion
in it
s ow
n rig
ht
Of w
hich
: %
edu
catio
nal s
anct
ions
an
d m
easu
res
Of w
hich
: %
oth
er c
omm
unity
sa
nctio
ns a
nd m
easu
res
Denmark 5.5 3.4 4.2 ... ... ... ... ... ... Germany 11.8 7.5 ... ... ... ... ... ... ... Kosovo (UNR) 4.4 4.4 ... ... ... ... ... 84.7 ... Netherlands 15.4 9.4 97.0 ... ... ... ... 3.0 ... Poland 5.8 4.2 5.3 54.7 2.6 1.8 ... ... 35.6 UK: E & W 9.3 6.8 ... ... ... ... ... ... ... UK: N. Ireland 4.5 0.8 6.7 53.3 0.0 0.0 0.0 0.0 40.0
Table 3.2.6.14 Community sanctions and measures imposed upon minors in 2010 –
(Theft) Burglary: Domestic burglary
Germany 2.0 1.1 ... ... ... ... ... ... ... UK: E & W 6.1 4.2 ... ... ... ... ... ... ...
Table 3.2.6.15 Community sanctions and measures imposed upon minors in 2010 –
Fraud
Germany 7.5 6.0 ... ... ... ... ... ... ... Kosovo (UNR) 0.1 0.1 ... ... ... ... ... 100.0 ... Netherlands 0.6 0.3 97.9 ... ... ... ... 2.1 ... Poland 0.5 0.3 8.5 46.2 12.0 1.7 ... ... 31.6 UK: E & W 1.0 0.7 ... ... ... ... ... ... ... UK: N. Ireland 0.2 0.0 ... ... ... ... ... ... ...
Table 3.2.6.16 Community sanctions and measures imposed upon minors in 2010 –
Money laundering
Netherlands 0.1 0.0 100.0 ... ... ... ... 0.0 ... Table 3.2.6.17 Community sanctions and measures imposed upon minors in 2010 –
Corruption
Poland 0.0 0.0 0.0 100.0 0.0 0.0 ... ... 0.0

241
Table 3.2.6.18 Community sanctions and measures imposed upon minors in 2010 – Drug offences: Total
Tota
l san
ctio
ns a
nd
mea
sure
s pe
r 10
0 00
0 po
p .
Tota
l com
mun
ity s
anct
ions
an
d m
easu
res
per
100
000
pop
Of w
hich
: %
com
mun
ity s
ervi
ce
Of w
hich
: %
sup
ervi
sion
Of w
hich
: %
rest
itutio
n
Of w
hich
: %
am
bula
nt th
erap
eutic
tre
atm
ent
Of w
hich
: %
pro
batio
n as
a s
anct
ion
in it
s ow
n rig
ht
Of w
hich
: %
edu
catio
nal s
anct
ions
an
d m
easu
res
Of w
hich
: %
oth
er c
omm
unity
sa
nctio
ns a
nd m
easu
res
Denmark 10.1 0.2 9.1 ... ... ... ... ... ... Germany 13.3 10.7 ... ... ... ... ... ... ... Kosovo (UNR) 0.2 0.2 20.0 60.0 ... ... ... 60.0 ... Netherlands 1.4 0.7 94.3 ... ... ... ... 5.7 ... Poland 3.5 2.7 4.4 50.9 0.2 5.1 ... ... 39.4 UK: E & W 10.7 5.3 ... ... ... ... ... ... ... UK: N. Ireland 1.8 0.3 40.0 40.0 0.0 0.0 0.0 0.0 20.0
Table 3.2.6.19 Community sanctions and measures imposed upon minors in 2010 –
Drug offences: Drug trafficking Germany 1.0 0.3 ... ... ... ... ... ... ... Kosovo (UNR) 0.2 0.2 ... ... ... ... ... 60.0 ... Poland 0.1 0.1 8.7 56.5 0.0 4.3 ... ... 30.4
Notes on tables 3.2.6.1 to 3.2.6.19
Cyprus: Data relate to the year 2009 (instead of 2010). Greece: Data relate to the year 2009 (instead of 2010). Notes on tables 3.2.3 to 3.2.6 Bulgaria: Unsuspended custodial sanctions include also suspended custodial sanctions. Croatia: The counting unit in tables 3.2.3 and 3.2.5 is the sanction/measure, not the person. France: Partially suspended custodial sentences are counted with unsuspended sentences. Germany: Only formal convictions by the court are counted. Greece: For minors only those measures that are imposed by the juvenile court judge are counted. The same measures may be imposed by the prosecutor on minors and are listed under prosecution statistics. Serbia: A suspended sentence cannot be imposed in the case of a minor.

242
Table 3.2.7 Persons convicted by length of unsuspended custodial sanctions and
measures imposed in 2010 Table 3.2.7.1 Persons convicted by length of unsuspended custodial sanctions and
measures imposed in 2010 – Criminal offences: Total
Tota
l uns
uspe
nded
cus
todi
al
sanc
tions
Of w
hich
: % u
nder
6 m
onth
s
Of w
hich
: % 6
mon
ths
and
less
than
12
mon
ths
Of w
hich
: % 1
2 m
onth
s an
d le
ss th
an 2
4 m
onth
s
Of w
hich
: % 2
4 m
onth
s an
d le
ss th
an 6
0 m
onth
s
Of w
hich
: % 6
0 m
onth
s an
d le
ss th
an 1
20 m
onth
s
Of w
hich
: % 1
20 m
onth
s an
d ov
er
Aver
age
leng
th o
f cus
todi
al
sanc
tions
/ m
easu
res
(in
mon
ths)
Of w
hich
: % L
ife
Of w
hich
: % In
dete
rmin
ate
sanc
tions
/ m
easu
res
Albania 160 ... ... 80.1 11.6 5.0 3.1 ... 0.1 ... Armenia 96 ... 21.0 26.6 38.7 11.7 1.7 ... 0.4 ... Austria 245 56.1 16.7 11.9 2.0 1.2 ... ... 0.0 ... Bulgaria 296 51.5 28.9 16.1 2.2 0.8 0.4 ... 0.0 ... Croatia 105 37.3 26.8 18.7 14.7 1.8 0.8 ... ... ... Cyprus 98 27.9 20.9 19.3 22.9 5.4 3.5 ... 0.1 0.1 Czech Republic 112 ... 65.0 ... 30.7 4.1 0.1 ... 0.0 ... Denmark 210 ... ... ... ... ... ... ... ... ... Estonia ... ... ... ... ... ... ... ... ... ... Finland 118 61.2 15.5 11.4 9.3 1.8 0.3 ... 0.4 ... France 193 57.2 20.3 17.3 2.8 1.4 1.0 80 0.0 ... Georgia ... ... ... ... ... ... ... ... ... ... Germany 54 24.1 28.6 18.8 24.4 3.5 0.3 ... 0.3 ... Greece 193 158.8 19.7 ... ... ... 2.8 ... 0.1 ... Hungary 103 18.3 29.8 25.9 11.4 9.1 5.3 ... 0.2 ... Ireland ... ... ... ... ... ... ... ... ... ... Italy 426 0.7 0.0 0.0 0.7 3.7 3.3 ... ... ... Kosovo (UNR) 42 31.5 26.5 184.7 15.5 4.2 3.8 ... ... ... Latvia ... ... ... ... ... ... ... ... ... ... Lithuania 232 18.9 4.4 ... ... 23.6 16.6 ... 1.4 ... Malta ... ... ... ... ... ... ... ... ... ... Netherlands 133 74.1 10.8 6.3 4.9 1.2 0.4 6 0.0 2.3 Poland 104 17.5 28.8 37.6 12.9 2.1 1.0 19 0.1 ... Portugal ... ... ... ... ... ... ... ... ... ... Serbia 81 42.3 20.3 17.4 15.7 2.6 1.7 ... ... ... Slovakia 111 18.1 34.2 26.0 13.5 6.5 1.7 ... 0.0 ... Slovenia 59 34.4 27.3 23.2 12.1 2.3 0.6 ... ... ... Spain ... ... ... ... ... ... ... ... ... ... Sweden 142 60.6 14.2 14.3 5.4 3.1 ... 9 0.0 1.8 Switzerland ... ... ... ... ... ... ... ... ... ... Turkey 294 ... ... ... ... ... ... ... ... ... Ukraine 89 ... 8.0 15.9 59.0 15.1 2.0 ... 0.2 ... UK: E & W 184 52.7 17.4 12.6 11.4 3.8 0.7 ... 0.4 1.0 UK: N. Ireland ... ... ... ... ... ... ... ... ... ... UK: Scotland 259 55.0 23.4 10.7 8.2 1.8 0.4 ... 0.3 0.0 Mean 159 44.9 22.1 28.3 15.0 5.0 2.3 29 0.2 1.0 Median 125 39.8 20.9 17.4 11.9 3.5 1.3 14 0.1 1.0 Minimum 42 0.7 0.0 0.0 0.7 0.8 0.1 6 0.0 0.0 Maximum 426 158.8 65.0 184.7 59.0 23.6 16.6 80 1.4 2.3

243
Table 3.2.7.2 Persons convicted by length of unsuspended custodial sanctions and
measures imposed in 2010 – Criminal offences: Major traffic offences
Tota
l uns
uspe
nded
cus
todi
al
sanc
tions
Of w
hich
: % u
nder
6 m
onth
s
Of w
hich
: % 6
mon
ths
and
less
than
12
mon
ths
Of w
hich
: % 1
2 m
onth
s an
d le
ss th
an 2
4 m
onth
s
Of w
hich
: % 2
4 m
onth
s an
d le
ss th
an 6
0 m
onth
s
Of w
hich
: % 6
0 m
onth
s an
d le
ss th
an 1
20 m
onth
s
Of w
hich
: % 1
20 m
onth
s an
d ov
er
Aver
age
leng
th o
f cus
todi
al
sanc
tion
s/ m
easu
res
(in
mon
ths)
Of w
hich
: % L
ife
Of w
hich
: % In
dete
rmin
ate
sanc
tions
/ m
easu
res
Albania 7.2 ... ... 87.6 10.1 2.3 ... ... ... ... Armenia 3.6 ... 3.4 0.0 0.0 0.0 0.0 ... 0.0 ... Austria ... ... ... ... ... ... ... ... ... ... Bulgaria 55.4 81.7 11.3 6.4 0.5 0.0 0.0 ... 0.0 ... Croatia 4.7 32.9 27.5 25.6 13.5 0.5 ... ... ... ... Cyprus ... ... ... ... ... ... ... ... ... ... Czech Republic ... ... ... ... ... ... ... ... ... ... Denmark ... ... ... ... ... ... ... ... ... ... Estonia ... ... ... ... ... ... ... ... ... ... Finland 34.6 86.6 11.5 1.7 0.2 0.0 0.0 ... 0.0 ... France 37.7 81.2 15.1 3.6 0.1 0.0 0.0 ... 0.0 ... Georgia ... ... ... ... ... ... ... ... ... ... Germany 3.4 45.3 43.4 7.7 3.4 0.1 0.0 ... 0.0 ... Greece 71.4 173.6 0.3 0.3 ... ... 0.0 ... ... ... Hungary 1.0 11.0 25.0 35.0 21.0 7.0 1.0 ... ... ... Ireland ... ... ... ... ... ... ... ... ... ... Italy ... ... ... ... ... ... ... ... ... ... Kosovo (UNR) 2.5 44.6 32.1 12.5 10.7 ... ... ... ... ... Latvia ... ... ... ... ... ... ... ... ... ... Lithuania ... ... ... ... ... ... ... ... ... ... Malta ... ... ... ... ... ... ... ... ... ... Netherlands 7.5 97.6 1.5 0.4 0.4 0.1 0.0 1.0 0.0 0.0 Poland 6.9 34.2 35.6 18.7 8.0 3.2 0.2 14.0 0.0 ... Portugal ... ... ... ... ... ... ... ... ... ... Serbia 3.6 49.8 27.2 9.8 12.5 0.8 0.0 ... ... ... Slovakia 0.1 0.0 60.0 40.0 0.0 0.0 0.0 ... 0.0 ... Slovenia 2.6 38.9 37.0 22.2 0.0 1.9 0.0 ... ... ... Spain ... ... ... ... ... ... ... ... ... ... Sweden 36.6 98.5 1.4 0.1 0.0 0.0 ... ... 0.0 0.1 Switzerland ... ... ... ... ... ... ... ... ... ... Turkey ... ... ... ... ... ... ... ... ... ... Ukraine 3.5 ... 1.7 3.6 70.8 23.8 0.1 ... 0.0 ... UK: E & W 2.1 17.0 62.4 20.5 0.0 0.0 0.0 ... 0.0 0.0 UK: N. Ireland ... ... ... ... ... ... ... ... ... ... UK: Scotland 8.6 47.3 44.9 5.1 1.3 1.3 0.0 ... 0.0 0.0 Mean 15.4 58.8 24.5 15.8 8.5 2.4 0.1 7.5 0.0 0.0 Median 4.7 46.3 26.1 7.7 0.9 0.1 0.0 7.5 0.0 0.0 Minimum 0.1 0.0 0.3 0.0 0.0 0.0 0.0 1.0 0.0 0.0 Maximum 71.4 173.6 62.4 87.6 70.8 23.8 1.0 14.0 0.0 0.1

244
Table 3.2.7.3 Persons convicted by length of unsuspended custodial sanctions and
measures imposed in 2010 – Intentional homicide: Total
Tota
l uns
uspe
nded
cus
todi
al
sanc
tions
Of w
hich
: % u
nder
6 m
onth
s
Of w
hich
: % 6
mon
ths
and
less
than
12
mon
ths
Of w
hich
: % 1
2 m
onth
s an
d le
ss th
an 2
4 m
onth
s
Of w
hich
: % 2
4 m
onth
s an
d le
ss th
an 6
0 m
onth
s
Of w
h ich
: % 6
0 m
onth
s an
d le
ss th
an 1
20 m
onth
s
Of w
hich
: % 1
20 m
onth
s an
d ov
er
Aver
age
leng
th o
f cus
todi
al
sanc
tion s
/ m
easu
re s
(in
mon
ths)
Of w
hich
: % L
ife
Of w
hich
: % In
dete
rmin
ate
sanc
tions
/ m
easu
res
Albania 5.6 ... ... 8.3 10.1 28.0 51.2 ... 2.4 ... Armenia 2.4 ... 2.6 5.1 6.4 53.8 19.2 ... 12.8 ... Austria 0.5 ... ... ... ... 82.1 ... ... 17.9 ... Bulgaria 2.1 0.6 3.1 11.9 11.3 25.6 44.4 ... 3.1 ... Croatia 3.0 1.5 9.0 24.6 32.8 12.7 19.4 ... ... ... Cyprus 1.2 0.0 0.0 0.0 20.0 10.0 60.0 ... 10.0 0.0 Czech Republic 1.0 ... 1.0 ... 8.6 76.2 14.3 ... 1.0 ... Denmark 1.2 ... ... ... ... ... ... ... ... ... Estonia ... ... ... ... ... ... ... ... ... ... Finland 3.1 0.0 0.0 0.0 46.7 27.5 11.4 ... 14.4 ... France 1.0 0.0 1.3 5.0 3.9 21.1 66.9 ... 1.9 ... Georgia ... ... ... ... ... ... ... ... ... ... Germany 0.8 0.0 0.2 0.3 28.7 39.7 9.9 ... 21.3 ... Greece 0.2 ... ... ... ... ... 57.1 ... 42.9 ... Hungary 2.0 ... ... 2.9 8.3 12.7 64.2 ... 11.8 ... Ireland ... ... ... ... ... ... ... ... ... ... Italy 3.8 0.0 0.0 0.0 0.0 0.2 51.1 ... ... ... Kosovo (UNR) 4.9 5.5 11.9 22.0 23.9 12.8 23.9 ... ... ... Latvia ... ... ... ... ... ... ... ... ... ... Lithuania 8.9 ... ... ... ... ... ... 134 ... ... Malta ... ... ... ... ... ... ... ... ... ... Netherlands 4.3 17.4 14.5 21.1 20.5 12.0 8.4 38 0.1 5.9 Poland 1.9 0.3 0.8 1.5 11.5 34.1 48.2 128 3.7 ... Portugal ... ... ... ... ... ... ... ... ... ... Serbia 2.3 0.6 3.6 10.2 23.4 21.0 41.3 ... ... ... Slovakia 1.1 0.0 0.0 0.0 1.7 6.8 91.5 ... 0.0 ... Slovenia 0.3 0.0 0.0 14.3 28.6 14.3 42.9 ... ... ... Spain ... ... ... ... ... ... ... ... ... ... Sweden 1.8 0.0 0.6 1.8 14.0 61.0 ... ... 2.4 15.9 Switzerland ... ... ... ... ... ... ... ... ... ... Turkey 11.9 ... ... ... ... ... ... ... ... ... Ukraine 3.7 ... 0.1 0.2 3.2 55.5 41.0 ... 5.5 ... UK: E & W 1.9 3.6 8.2 10.7 16.7 13.7 5.5 ... 33.5 8.1 UK: N. Ireland ... ... ... ... ... ... ... ... ... ... UK: Scotland 2.6 0.0 0.0 0.0 14.5 31.9 18.8 ... 31.2 3.6 Mean 2.8 1.8 3.0 7.0 15.9 29.7 37.6 100 12.0 6.7 Median 2.1 0.0 0.8 4.0 14.0 23.3 41.3 128 7.7 5.9 Minimum 0.2 0.0 0.0 0.0 0.0 0.2 5.5 38 0.0 0.0 Maximum 11.9 17.4 14.5 24.6 46.7 82.1 91.5 134 42.9 15.9
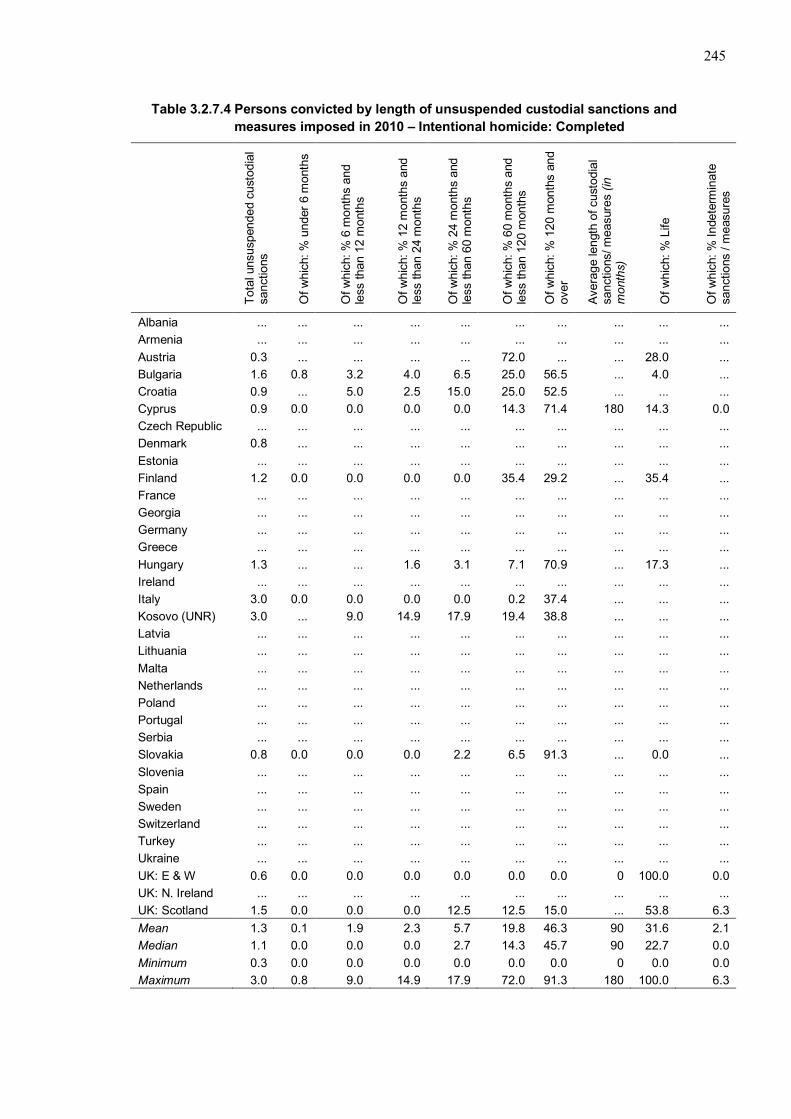
245
Table 3.2.7.4 Persons convicted by length of unsuspended custodial sanctions and
measures imposed in 2010 – Intentional homicide: Completed
Tota
l uns
uspe
nded
cus
todi
al
sanc
tions
Of w
hich
: % u
nder
6 m
onth
s
Of w
hich
: % 6
mon
ths
and
less
than
12
mon
ths
Of w
hich
: % 1
2 m
onth
s an
d le
ss th
an 2
4 m
onth
s
Of w
hich
: % 2
4 m
onth
s an
d le
ss th
an 6
0 m
onth
s
Of w
hich
: % 6
0 m
onth
s an
d le
ss th
an 1
20 m
onth
s
Of w
hich
: % 1
20 m
onth
s an
d ov
er
Aver
age
leng
th o
f cus
todi
al
sanc
tions
/ mea
s ure
s (in
m
onth
s)
Of w
hich
: % L
ife
Of w
hich
: % In
dete
rmin
ate
sanc
tions
/ m
easu
res
Albania ... ... ... ... ... ... ... ... ... ... Armenia ... ... ... ... ... ... ... ... ... ... Austria 0.3 ... ... ... ... 72.0 ... ... 28.0 ... Bulgaria 1.6 0.8 3.2 4.0 6.5 25.0 56.5 ... 4.0 ... Croatia 0.9 ... 5.0 2.5 15.0 25.0 52.5 ... ... ... Cyprus 0.9 0.0 0.0 0.0 0.0 14.3 71.4 180 14.3 0.0 Czech Republic ... ... ... ... ... ... ... ... ... ... Denmark 0.8 ... ... ... ... ... ... ... ... ... Estonia ... ... ... ... ... ... ... ... ... ... Finland 1.2 0.0 0.0 0.0 0.0 35.4 29.2 ... 35.4 ... France ... ... ... ... ... ... ... ... ... ... Georgia ... ... ... ... ... ... ... ... ... ... Germany ... ... ... ... ... ... ... ... ... ... Greece ... ... ... ... ... ... ... ... ... ... Hungary 1.3 ... ... 1.6 3.1 7.1 70.9 ... 17.3 ... Ireland ... ... ... ... ... ... ... ... ... ... Italy 3.0 0.0 0.0 0.0 0.0 0.2 37.4 ... ... ... Kosovo (UNR) 3.0 ... 9.0 14.9 17.9 19.4 38.8 ... ... ... Latvia ... ... ... ... ... ... ... ... ... ... Lithuania ... ... ... ... ... ... ... ... ... ... Malta ... ... ... ... ... ... ... ... ... ... Netherlands ... ... ... ... ... ... ... ... ... ... Poland ... ... ... ... ... ... ... ... ... ... Portugal ... ... ... ... ... ... ... ... ... ... Serbia ... ... ... ... ... ... ... ... ... ... Slovakia 0.8 0.0 0.0 0.0 2.2 6.5 91.3 ... 0.0 ... Slovenia ... ... ... ... ... ... ... ... ... ... Spain ... ... ... ... ... ... ... ... ... ... Sweden ... ... ... ... ... ... ... ... ... ... Switzerland ... ... ... ... ... ... ... ... ... ... Turkey ... ... ... ... ... ... ... ... ... ... Ukraine ... ... ... ... ... ... ... ... ... ... UK: E & W 0.6 0.0 0.0 0.0 0.0 0.0 0.0 0 100.0 0.0 UK: N. Ireland ... ... ... ... ... ... ... ... ... ... UK: Scotland 1.5 0.0 0.0 0.0 12.5 12.5 15.0 ... 53.8 6.3 Mean 1.3 0.1 1.9 2.3 5.7 19.8 46.3 90 31.6 2.1 Median 1.1 0.0 0.0 0.0 2.7 14.3 45.7 90 22.7 0.0 Minimum 0.3 0.0 0.0 0.0 0.0 0.0 0.0 0 0.0 0.0 Maximum 3.0 0.8 9.0 14.9 17.9 72.0 91.3 180 100.0 6.3

246
Table 3.2.7.5 Persons convicted by length of unsuspended custodial sanctions and measures imposed in 2010 – Bodily injury (Assault): Total
Tota
l uns
uspe
nded
cus
todi
al
sanc
tions
Of w
hich
: % u
nder
6 m
onth
s
Of w
hich
: % 6
mon
ths
and
less
than
12
mon
ths
Of w
hich
: % 1
2 m
onth
s an
d le
ss th
an 2
4 m
onth
s
Of w
hich
: % 2
4 m
onth
s an
d le
ss th
an 6
0 m
onth
s
Of w
hich
: % 6
0 m
onth
s an
d le
ss th
an 1
20 m
onth
s
Of w
hich
: % 1
20 m
onth
s an
d ov
er
Aver
age
leng
th o
f cus
todi
al
sanc
tions
/ m
easu
res
(in
mon
ths)
Of w
hich
: % L
ife
Of w
hich
: % In
dete
rmin
ate
sanc
tions
/ m
easu
res
Albania 6 ... ... 60.7 34.7 4.6 4.6 ... ... ... Armenia 5 ... 11.6 7.9 65.2 14.6 0.6 ... 0.0 ... Austria 31 43.0 30.2 9.0 3.6 0.5 ... ... ... ... Bulgaria 7 41.0 35.8 21.0 1.1 1.1 0.0 ... 0.0 ... Croatia 3 56.3 35.9 6.3 0.8 0.8 ... ... ... ... Cyprus 2 55.6 27.8 11.1 0.0 5.6 0.0 ... 0.0 0.0 Czech Republic 3 ... 36.6 ... 56.3 7.1 0.0 ... 0.0 ... Denmark 50 ... ... ... ... ... ... ... ... ... Estonia ... ... ... ... ... ... ... ... ... ... Finland 19 46.0 19.2 20.2 13.6 1.0 0.0 ... 0.0 ... France 27 51.1 25.9 20.0 2.0 0.6 0.4 ... 0.0 ... Georgia ... ... ... ... ... ... ... ... ... ... Germany 7 11.3 39.0 27.1 21.7 0.8 0.0 ... 0.0 ... Greece 4 279.4 79.9 39.3 ... ... 3.4 ... ... ... Hungary 6 13.6 36.9 27.6 9.3 8.3 4.2 ... ... ... Ireland ... ... ... ... ... ... ... ... ... ... Italy 14 2.0 0.0 0.0 3.4 17.9 32.3 ... ... ... Kosovo (UNR) 4 65.4 19.8 8.6 6.2 ... ... ... ... ... Latvia ... ... ... ... ... ... ... ... ... ... Lithuania ... ... ... ... ... ... ... ... ... ... Malta ... ... ... ... ... ... ... ... ... ... Netherlands 11 83.2 9.8 2.9 1.4 0.1 0.1 3 0.0 2.6 Poland 10 8.7 35.9 46.0 7.1 2.1 0.2 17 0.0 ... Portugal ... ... ... ... ... ... ... ... ... ... Serbia 4 65.4 15.4 6.2 11.5 1.5 0.0 ... ... ... Slovakia 4 3.1 26.2 25.8 31.4 12.7 0.9 ... 0.0 ... Slovenia 2 45.0 22.5 20.0 7.5 5.0 0.0 ... ... ... Spain ... ... ... ... ... ... ... ... ... ... Sweden 18 52.8 14.2 23.3 4.3 0.7 ... ... 0.0 3.9 Switzerland ... ... ... ... ... ... ... ... ... ... Turkey 30 ... ... ... ... ... ... ... ... ... Ukraine ... ... ... ... ... ... ... ... ... ... UK: E & W 23 29.5 31.3 20.6 11.4 4.4 0.4 ... 0.0 2.4 UK: N. Ireland ... ... ... ... ... ... ... ... ... ... UK: Scotland 57 46.4 26.7 14.6 10.3 1.9 0.0 ... 0.0 0.0 Mean 14 52.5 27.6 19.9 14.4 4.6 2.6 10 0.0 1.8 Median 7 46.0 26.7 20.0 7.5 2.0 0.1 10 0.0 2.4 Minimum 2 2.0 0.0 0.0 0.0 0.1 0.0 3 0.0 0.0 Maximum 57 279.4 79.9 60.7 65.2 17.9 32.3 17 0.0 3.9

247
Table 3.2.7.6 Persons convicted by length of unsuspended custodial sanctions and
measures imposed in 2010 – Aggravated bodily injury
Tota
l uns
uspe
nded
cus
todi
al
sanc
tions
Of w
hich
: % u
nder
6 m
onth
s
Of w
hich
: % 6
mon
ths
and
less
than
12
mon
ths
Of w
hich
: % 1
2 m
onth
s an
d le
ss th
an 2
4 m
onth
s
Of w
hich
: % 2
4 m
onth
s an
d le
ss th
an 6
0 m
onth
s
Of w
hich
: % 6
0 m
onth
s an
d le
ss th
an 1
20 m
onth
s
Of w
hich
: % 1
20 m
onth
s an
d ov
er
Aver
age
leng
th o
f cus
todi
al
sanc
tions
/ m
easu
res
(in
mon
ths)
Of w
hich
: % L
ife
Of w
hich
: % In
dete
rmin
ate
sanc
tions
/ m
easu
res
Albania 3.8 ... ... 41.6 51.3 7.1 0.0 ... ... ... Armenia 4.4 ... 5.6 4.2 72.9 16.7 0.7 ... 0.0 ... Austria 10.2 21.1 45.2 21.4 10.7 1.6 ... ... ... ... Bulgaria ... ... ... ... ... ... ... ... ... ... Croatia 2.3 54.5 35.6 7.9 1.0 1.0 ... ... ... ... Cyprus 1.8 60.0 26.7 6.7 0.0 6.7 0.0 ... 0.0 0.0 Czech Republic 1.1 ... 0.0 ... 82.9 17.1 0.0 ... 0.0 ... Denmark 12.4 ... ... ... ... ... ... ... ... ... Estonia ... ... ... ... ... ... ... ... ... ... Finland 6.2 0.3 6.9 48.9 40.8 3.0 0.0 ... 0.0 ... France 5.2 30.9 28.6 31.7 6.4 1.9 0.5 ... 0.0 ... Georgia ... ... ... ... ... ... ... ... ... ... Germany 3.9 2.3 31.4 33.1 32.1 1.2 0.0 ... 0.0 ... Greece 0.1 30.8 38.5 92.3 ... ... 30.8 ... ... ... Hungary 4.8 15.1 44.1 27.1 6.2 5.0 2.5 ... ... ... Ireland ... ... ... ... ... ... ... ... ... ... Italy ... ... ... ... ... ... ... ... ... ... Kosovo (UNR) 1.5 44.1 29.4 14.7 11.8 ... ... ... ... ... Latvia ... ... ... ... ... ... ... ... ... ... Lithuania 6.1 ... ... ... ... ... ... 54 ... ... Malta ... ... ... ... ... ... ... ... ... ... Netherlands 3.5 70.2 18.2 6.1 2.4 0.2 0.2 5 0.0 2.8 Poland 0.9 0.0 4.3 40.2 35.3 18.1 2.0 42 ... ... Portugal ... ... ... ... ... ... ... ... ... ... Serbia 2.3 54.7 18.2 8.2 16.5 2.4 0.0 ... ... ... Slovakia ... ... ... ... ... ... ... ... ... ... Slovenia 0.9 10.5 31.6 31.6 15.8 10.5 0.0 ... ... ... Spain ... ... ... ... ... ... ... ... ... ... Sweden 6.2 6.3 6.4 66.3 12.3 2.1 ... ... 0.0 3.7 Switzerland ... ... ... ... ... ... ... ... ... ... Turkey 0.8 ... ... ... ... ... ... ... ... ... Ukraine 4.6 ... 0.3 2.1 40.3 57.0 0.2 ... 0.0 ... UK: E & W ... ... ... ... ... ... ... ... ... ... UK: N. Ireland ... ... ... ... ... ... ... ... ... ... UK: Scotland 13.3 2.6 16.8 39.3 34.4 6.8 0.1 ... 0.0 0.0 Mean 4.4 26.9 21.5 29.1 26.3 9.3 2.5 34 0.0 1.6 Median 3.8 21.1 22.5 29.4 16.1 5.0 0.1 42 0.0 1.4 Minimum 0.1 0.0 0.0 2.1 0.0 0.2 0.0 5 0.0 0.0 Maximum 13.3 70.2 45.2 92.3 82.9 57.0 30.8 54 0.0 3.7

248
Table 3.2.7.7 Persons convicted by length of unsuspended custodial sanctions and
measures imposed in 2010 – Sexual assault: Total
Tota
l uns
uspe
nded
cus
todi
al
sanc
tions
Of w
hich
: % u
nder
6 m
onth
s
Of w
hich
: % 6
mon
ths
and
less
than
12
mon
ths
Of w
hich
: % 1
2 m
onth
s an
d le
ss th
an 2
4 m
onth
s
Of w
hich
: % 2
4 m
onth
s an
d le
ss th
an 6
0 m
onth
s
Of w
hich
: % 6
0 m
onth
s an
d le
ss th
an 1
20 m
onth
s
Of w
hich
: % 1
20 m
onth
s an
d ov
er
Aver
age
leng
th o
f cus
todi
al
sanc
tions
/ m
easu
res
(in
mon
ths)
Of w
hich
: % L
ife
Of w
hich
: % In
dete
rmin
ate
sanc
tions
/ m
easu
res
Albania 1.1 ... ... 25.0 40.6 28.1 6.3 ... ... ... Armenia 0.8 ... 18.5 14.8 40.7 18.5 3.7 ... 0.0 ... Austria 3.1 3.8 7.6 19.1 33.6 33.6 ... ... ... ... Bulgaria 3.1 6.8 19.5 55.1 10.6 5.9 2.1 ... 0.0 ... Croatia 2.8 12.1 23.4 23.4 32.3 7.3 1.6 ... ... ... Cyprus 1.1 11.1 33.3 0.0 11.1 22.2 22.2 ... 0.0 0.0 Czech Republic 1.5 ... 6.4 ... 67.9 25.6 0.0 ... 0.6 ... Denmark 2.7 ... ... ... ... ... ... ... ... ... Estonia ... ... ... ... ... ... ... ... ... ... Finland 1.8 4.0 10.1 46.5 33.3 6.1 0.0 ... 0.0 ... France 4.5 8.2 12.9 33.6 10.7 16.6 18.1 ... 0.0 ... Georgia ... ... ... ... ... ... ... ... ... ... Germany 1.5 0.0 2.7 9.7 67.2 19.4 1.0 ... 0.0 ... Greece 0.3 17.2 27.6 48.3 ... ... 20.7 ... ... ... Hungary 1.9 0.5 7.2 13.3 17.9 31.8 29.2 ... ... ... Ireland ... ... ... ... ... ... ... ... ... ... Italy 3.7 0.0 0.0 0.0 0.0 0.2 99.7 ... ... ... Kosovo (UNR) 2.0 9.1 31.8 18.2 27.3 11.4 2.3 ... ... ... Latvia ... ... ... ... ... ... ... ... ... ... Lithuania ... ... ... ... ... ... ... ... ... ... Malta ... ... ... ... ... ... ... ... ... ... Netherlands 2.3 34.7 22.6 17.9 17.1 3.2 0.8 15 0.0 3.7 Poland 2.1 0.9 1.7 31.2 52.8 11.8 1.6 ... 0.0 ... Portugal ... ... ... ... ... ... ... ... ... ... Serbia 1.7 18.5 14.5 21.0 26.6 15.3 4.0 ... ... ... Slovakia 1.3 0.0 2.8 2.8 46.5 36.6 11.3 ... 0.0 ... Slovenia 1.8 5.4 21.6 21.6 43.2 5.4 2.7 ... ... ... Spain ... ... ... ... ... ... ... ... ... ... Sweden 3.9 4.7 11.3 34.7 35.0 7.4 ... ... 0.0 4.1 Switzerland ... ... ... ... ... ... ... ... ... ... Turkey 6.3 ... ... ... ... ... ... ... ... ... Ukraine ... ... ... ... ... ... ... ... 0.0 ... UK: E & W 6.0 6.2 13.2 17.5 24.5 19.2 8.9 ... 0.5 10.0 UK: N. Ireland ... ... ... ... ... ... ... ... ... ... UK: Scotland 1.0 5.9 9.8 7.8 31.4 29.4 15.7 ... 0.0 0.0 Mean 2.4 7.9 14.2 22.0 31.9 16.9 12.6 15 0.1 3.6 Median 2.0 5.9 12.9 19.1 32.3 16.6 3.9 15 0.0 3.7 Minimum 0.3 0.0 0.0 0.0 0.0 0.2 0.0 15 0.0 0.0 Maximum 6.3 34.7 33.3 55.1 67.9 36.6 99.7 15 0.6 10.0

249
Table 3.2.7.8 Persons convicted by length of unsuspended custodial sanctions and
measures imposed in 2010 – Rape
Tota
l uns
uspe
nded
cus
todi
al
sanc
tions
Of w
hich
: % u
nder
6 m
onth
s
Of w
hich
: % 6
mon
ths
and
less
than
12
mon
ths
Of w
hich
: % 1
2 m
onth
s an
d le
ss th
an 2
4 m
onth
s
Of w
hich
: % 2
4 m
onth
s an
d le
ss th
an 6
0 m
onth
s
Of w
hich
: % 6
0 m
onth
s an
d le
ss th
an 1
20 m
onth
s
Of w
hich
: % 1
20 m
onth
s an
d ov
er
Aver
age
leng
th o
f cus
todi
al
sanc
tions
/ m
easu
res
(in
mon
ths)
Of w
hich
: % L
ife
Of w
hich
: % In
dete
rmin
ate
sanc
tions
/ m
easu
res
Albania 0.5 ... ... 18.8 31.3 37.5 12.5 ... ... ... Armenia 0.6 ... 0.0 0.0 61.1 27.8 5.6 ... 0.0 ... Austria 1.4 6.1 21.7 47.0 13.9 11.3 ... ... ... ... Bulgaria 1.9 3.4 14.4 60.3 11.0 7.5 3.4 ... 0.0 ... Croatia 1.4 ... 8.2 24.6 50.8 13.1 3.3 ... ... ... Cyprus 0.5 0.0 0.0 0.0 0.0 50.0 50.0 117 0.0 0.0 Czech Republic 1.0 ... 3.0 ... 65.0 32.0 0.0 ... 1.0 ... Denmark 1.4 ... ... ... ... ... ... ... ... ... Estonia ... ... ... ... ... ... ... ... ... ... Finland 0.9 0.0 10.6 48.9 36.2 4.3 0.0 ... 0.0 ... France 1.7 0.0 2.4 12.4 5.8 31.9 47.4 ... 0.1 ... Georgia ... ... ... ... ... ... ... ... ... ... Germany 0.6 0.0 0.2 6.5 67.0 24.6 1.7 ... 0.0 ... Greece 0.2 11.1 ... 38.9 ... ... 66.7 ... ... ... Hungary 0.8 ... 9.6 10.8 13.3 33.7 32.5 ... ... ... Ireland ... ... ... ... ... ... ... ... ... ... Italy ... ... ... ... ... ... ... ... ... ... Kosovo (UNR) 0.8 5.9 17.6 35.3 11.8 23.5 5.9 ... ... ... Latvia ... ... ... ... ... ... ... ... ... ... Lithuania 3.8 ... ... ... ... ... ... 73 ... ... Malta ... ... ... ... ... ... ... ... ... ... Netherlands 0.7 20.7 14.9 23.1 29.8 5.8 0.8 22 0.0 5.0 Poland 1.3 1.0 2.4 26.1 55.4 13.2 2.0 43 0.0 ... Portugal ... ... ... ... ... ... ... ... ... ... Serbia 0.8 3.4 5.1 23.7 35.6 25.4 6.8 ... ... ... Slovakia 0.4 0.0 0.0 0.0 45.8 33.3 20.8 ... 0.0 ... Slovenia 0.5 9.1 36.4 9.1 36.4 9.1 0.0 ... ... ... Spain ... ... ... ... ... ... ... ... ... ... Sweden 3.3 2.6 4.3 35.1 41.3 8.9 ... ... 0.0 4.6 Switzerland ... ... ... ... ... ... ... ... ... ... Turkey ... ... ... ... ... ... ... ... ... ... Ukraine 0.8 ... 0.5 1.6 33.9 59.0 4.9 ... 0.0 ... UK: E & W 1.8 0.1 0.3 1.0 15.0 38.6 25.3 ... 1.2 18.3 UK: N. Ireland ... ... ... ... ... ... ... ... ... ... UK: Scotland 0.6 0.0 0.0 0.0 40.6 43.8 15.6 ... 0.0 0.0 Mean 1.1 4.0 7.6 20.2 33.4 25.4 15.3 64 0.2 5.6 Median 0.8 1.8 3.6 18.8 35.6 25.4 5.7 58 0.0 4.6 Minimum 0.2 0.0 0.0 0.0 0.0 4.3 0.0 22 0.0 0.0 Maximum 3.8 20.7 36.4 60.3 67.0 59.0 66.7 117 1.2 18.3

250
Table 3.2.7.9 Persons convicted by length of unsuspended custodial sanctions and
measures imposed in 2010 – Sexual abuse of a child
Tota
l uns
uspe
nded
cus
todi
al
sanc
tions
Of w
hich
: % u
nder
6 m
onth
s
Of w
hich
: % 6
mon
ths
and
less
than
12
mon
ths
Of w
hich
: % 1
2 m
onth
s an
d le
ss th
an 2
4 m
onth
s
Of w
hich
: % 2
4 m
onth
s an
d le
ss th
an 6
0 m
onth
s
Of w
hich
: % 6
0 m
onth
s an
d le
ss th
an 1
20 m
onth
s
Of w
hich
: % 1
20 m
onth
s an
d ov
er
Aver
age
leng
th o
f cus
todi
al
sanc
tions
/ mea
sure
s (in
m
onth
s)
Of w
hich
: % L
ife
Of w
hich
: % In
dete
rmin
ate
sanc
tions
/ m
easu
res
Albania 0.5 ... ... 33.3 53.3 13.3 ... ... ... ... Armenia 0.2 ... 50.0 50.0 0.0 0.0 0.0 ... 0.0 ... Austria 1.3 18.9 21.7 32.1 16.0 11.3 ... ... ... ... Bulgaria ... ... ... ... ... ... ... ... ... ... Croatia 1.1 21.3 42.6 19.1 14.9 2.1 ... ... ... ... Cyprus 0.2 50.0 0.0 0.0 50.0 0.0 0.0 16 0.0 0.0 Czech Republic 0.5 ... 12.5 ... 73.2 14.3 0.0 ... 0.0 ... Denmark 1.1 ... ... ... ... ... ... ... ... ... Estonia ... ... ... ... ... ... ... ... ... ... Finland 1.0 7.7 9.6 44.2 30.8 7.7 0.0 ... 0.0 ... France 0.1 19.8 25.9 44.4 7.4 2.5 0.0 ... 0.0 ... Georgia ... ... ... ... ... ... ... ... ... ... Germany 0.7 0.0 1.6 7.5 69.9 20.2 0.7 ... 0.0 ... Greece 0.0 20.0 ... 120.0 ... ... 100.0 ... ... ... Hungary 0.2 4.5 13.6 45.5 18.2 9.1 9.1 ... ... ... Ireland ... ... ... ... ... ... ... ... ... ... Italy 0.4 0.0 0.0 0.0 0.0 0.0 100.0 ... ... ... Kosovo (UNR) 0.8 11.8 47.1 ... 41.2 ... ... ... ... ... Latvia ... ... ... ... ... ... ... ... ... ... Lithuania ... ... ... ... ... ... ... ... ... ... Malta ... ... ... ... ... ... ... ... ... ... Netherlands 0.7 28.2 33.1 15.3 16.1 2.4 0.8 14 0.0 4.0 Poland 0.8 0.7 0.7 39.9 48.3 9.4 1.0 38 0.0 ... Portugal ... ... ... ... ... ... ... ... ... ... Serbia 0.1 25.0 25.0 0.0 25.0 25.0 0.0 ... ... ... Slovakia 0.9 0.0 2.1 4.3 46.8 38.3 8.5 ... 0.0 ... Slovenia 1.0 0.0 15.0 35.0 40.0 5.0 5.0 ... ... ... Spain ... ... ... ... ... ... ... ... ... ... Sweden 0.5 13.3 44.4 37.8 2.2 0.0 ... ... 0.0 2.2 Switzerland ... ... ... ... ... ... ... ... ... ... Turkey 3.7 ... ... ... ... ... ... ... ... ... Ukraine ... ... ... ... ... ... ... ... 0.0 ... UK: E & W 3.7 3.9 10.3 21.1 32.4 12.3 10.8 ... 9.2 8.9 UK: N Ireland ... ... ... ... ... ... ... ... ... ... UK: Scotland 0.3 18.8 31.3 18.8 18.8 6.3 18.8 ... 0.0 0.0 Mean 0.9 13.5 20.3 29.9 30.2 9.4 15.9 23 0.7 3.0 Median 0.7 12.5 15.0 32.1 27.9 7.7 0.9 16 0.0 2.2 Minimum 0.0 0.0 0.0 0.0 0.0 0.0 0.0 14 0.0 0.0 Maximum 3.7 50.0 50.0 120.0 73.2 38.3 100.0 38 9.2 8.9

251
Table 3.2.7.10 Persons convicted by length of unsuspended custodial sanctions and
measures imposed in 2010 – Robbery
Tota
l uns
uspe
nded
cus
todi
al
sanc
tions
Of w
hich
: % u
nder
6 m
onth
s
Of w
hich
: % 6
mon
ths
and
less
than
12
mon
ths
Of w
hich
: % 1
2 m
onth
s an
d le
ss th
an 2
4 m
onth
s
Of w
hich
: % 2
4 m
onth
s an
d le
ss th
an 6
0 m
onth
s
Of w
hich
: % 6
0 m
onth
s an
d le
ss th
an 1
20 m
onth
s
Of w
hich
: % 1
20 m
onth
s an
d ov
er
Aver
age
leng
th o
f cus
todi
al
sanc
tions
/ m
easu
res
(in
mon
ths)
Of w
hich
: % L
ife
Of w
hich
: % In
dete
rmin
ate
sanc
tions
/ m
easu
res
Albania 3.7 ... ... 16.1 26.8 28.6 26.8 ... 1.8 ... Armenia 5.3 ... 4.6 5.8 37.6 48.6 2.9 ... 0.6 ... Austria 7.5 17.1 16.8 35.6 10.6 19.9 ... ... ... ... Bulgaria 15.2 16.4 23.3 40.7 14.9 3.6 0.9 ... 0.2 ... Croatia 6.6 11.0 21.0 33.7 29.6 4.1 0.7 ... ... ... Cyprus 1.3 0.0 27.3 18.2 36.4 9.1 0.0 ... 0.0 9.1 Czech Republic 7.2 ... 3.3 ... 77.6 19.0 0.1 ... 0.0 ... Denmark 5.5 ... ... ... ... ... ... ... ... ... Estonia ... ... ... ... ... ... ... ... ... ... Finland 4.9 11.4 32.2 31.1 24.6 0.8 0.0 ... 0.0 ... France ... ... ... ... ... ... ... ... ... ... Georgia ... ... ... ... ... ... ... ... ... ... Germany 4.3 0.2 8.0 27.0 53.6 10.5 0.7 ... 0.0 ... Greece 1.3 4.2 1.4 73.6 ... ... 43.1 ... ... ... Hungary 10.9 0.5 2.3 17.3 24.8 34.7 20.5 ... ... ... Ireland ... ... ... ... ... ... ... ... ... ... Italy 14.1 0.0 0.0 0.0 0.0 0.3 99.5 ... ... ... Kosovo (UNR) 4.1 9.9 18.7 28.6 34.1 5.5 3.3 ... ... ... Latvia ... ... ... ... ... ... ... ... ... ... Lithuania 22.4 ... ... ... ... ... ... 45 ... ... Malta ... ... ... ... ... ... ... ... ... ... Netherlands 11.8 43.6 17.7 17.1 15.4 3.8 0.4 14 0.0 1.9 Poland 11.7 0.8 2.0 36.5 56.8 3.6 0.4 34 0.0 ... Portugal ... ... ... ... ... ... ... ... ... ... Serbia 20.8 19.6 27.3 31.3 18.7 3.0 0.2 ... ... ... Slovakia 5.7 0.6 1.0 5.5 44.5 40.6 7.8 ... 0.0 ... Slovenia 3.3 7.5 29.9 34.3 23.9 4.5 0.0 ... ... ... Spain ... ... ... ... ... ... ... ... ... ... Sweden 5.7 13.2 8.0 48.3 17.5 5.8 ... ... 0.0 0.7 Switzerland ... ... ... ... ... ... ... ... ... ... Turkey 12.3 ... ... ... ... ... ... ... ... ... Ukraine 11.8 ... 2.7 7.8 85.4 4.1 0.0 ... 0.0 ... UK: E & W 9.0 2.3 16.5 25.8 37.7 12.9 1.4 ... 0.0 3.3 UK: N. Ireland ... ... ... ... ... ... ... ... ... ... UK: Scotland 7.2 5.3 18.8 28.4 39.5 7.2 0.8 ... 0.0 0.0 Mean 8.5 9.1 13.5 26.8 33.8 12.9 10.5 31 0.2 3.0 Median 7.2 6.4 16.5 28.4 29.6 5.8 0.7 34 0.0 1.9 Minimum 1.3 0.0 0.0 0.0 0.0 0.3 0.0 14 0.0 0.0 Maximum 22.4 43.6 32.2 73.6 85.4 48.6 99.5 45 1.8 9.1

252
Table 3.2.7.11 Persons convicted by length of unsuspended custodial sanctions and measures imposed in 2010 – Theft: Total
Tota
l uns
uspe
nded
cus
todi
al
sanc
tions
Of w
hich
: % u
nder
6 m
onth
s
Of w
hich
: % 6
mon
ths
and
less
than
12
mon
ths
Of w
hich
: % 1
2 m
o nth
s an
d le
ss th
an 2
4 m
onth
s
Of w
hich
: % 2
4 m
onth
s an
d le
ss th
an 6
0 m
onth
s
Of w
hich
: % 6
0 m
onth
s an
d le
ss th
an 1
20 m
onth
s
Of w
hich
: % 1
20 m
onth
s an
d ov
er
Aver
age
leng
th o
f cus
todi
al
sanc
tions
/ m
easu
res
(in
mon
ths)
Of w
hich
: % L
ife
Of w
hich
: % In
dete
rmin
ate
sanc
tions
/ m
easu
res
Albania 54 ... ... 97.1 2.1 0.5 0.3 ... ... ... Armenia 27 ... 4.3 44.5 47.0 4.2 0.1 ... 0.0 ... Austria 37 61.6 15.8 18.1 3.9 0.5 ... ... ... ... Bulgaria 116 47.5 35.8 15.5 1.0 0.2 0.0 ... 0.0 ... Croatia 30 46.4 35.4 14.9 3.4 ... ... ... ... ... Cyprus 27 20.2 21.5 40.4 22.4 0.0 0.0 ... 0.0 0.0 Czech Republic 45 ... 69.0 ... 29.9 1.2 0.0 ... 0.0 ... Denmark 40 ... ... ... ... ... ... ... ... ... Estonia ... ... ... ... ... ... ... ... ... ... Finland 21 74.3 14.7 7.5 3.2 0.4 0.0 ... 0.0 ... France 46 50.3 22.8 22.1 3.4 1.0 0.5 ... 0.0 ... Georgia ... ... ... ... ... ... ... ... ... ... Germany 16 33.8 35.9 18.8 11.1 0.4 0.0 ... 0.0 ... Greece 7 82.1 46.2 35.1 ... ... 7.8 ... ... ... Hungary 41 24.8 36.7 28.3 7.3 2.8 0.2 ... ... ... Ireland ... ... ... ... ... ... ... ... ... ... Italy 42 3.6 0.0 0.0 3.2 19.6 6.7 ... ... ... Kosovo (UNR) 2 83.0 11.3 5.7 ... ... ... ... ... ... Latvia ... ... ... ... ... ... ... ... ... ... Lithuania 56 ... ... ... ... ... ... 20 ... ... Malta ... ... ... ... ... ... ... ... ... ... Netherlands 45 89.9 4.4 1.5 0.9 0.1 0.0 2 0.0 3.2 Poland 25 13.3 26.7 54.7 5.0 0.3 0.0 15 0.0 ... Portugal ... ... ... ... ... ... ... ... ... ... Serbia 6 71.3 19.3 7.9 1.4 0.0 0.0 ... ... ... Slovakia 39 15.1 53.9 26.4 4.2 0.4 0.0 ... 0.0 ... Slovenia 20 42.2 27.3 20.6 9.2 0.7 0.0 ... ... ... Spain ... ... ... ... ... ... ... ... ... ... Sweden 21 68.3 21.4 9.2 0.6 0.0 ... ... 0.0 0.5 Switzerland ... ... ... ... ... ... ... ... ... ... Turkey 55 ... ... ... ... ... ... ... ... ... Ukraine 32 ... 10.7 18.0 7.0 1.6 0.0 ... 0.0 ... UK: E & W 40 83.9 10.0 4.2 1.7 0.3 0.0 ... 0.0 0.0 UK: N. Ireland ... ... ... ... ... ... ... ... ... ... UK: Scotland 78 68.4 25.4 4.4 1.5 0.0 0.0 ... 0.0 0.0 Mean 37 51.6 24.9 22.5 8.1 1.7 0.8 12 0.0 0.7 Median 38 50.3 22.1 18.0 3.4 0.4 0.0 15 0.0 0.0 Minimum 2 3.6 0.0 0.0 0.6 0.0 0.0 2 0.0 0.0 Maximum 116 89.9 69.0 97.1 47.0 19.6 7.8 20 0.0 3.2

253
Table 3.2.7.12 Persons convicted by length of unsuspended custodial sanctions and
measures imposed in 2010 – Theft: Theft of a motor vehicle
Tota
l uns
uspe
nded
cus
todi
al
sanc
tions
Of w
hich
: % u
nder
6 m
onth
s
Of w
hich
: % 6
mon
ths
and
less
than
12
mon
ths
Of w
hich
: % 1
2 m
onth
s an
d le
ss th
an 2
4 m
onth
s
Of w
hich
: % 2
4 m
onth
s an
d le
ss th
an 6
0 m
onth
s
Of w
hich
: % 6
0 m
onth
s an
d le
ss th
an 1
20 m
onth
s
Of w
hich
: % 1
20 m
onth
s an
d ov
er
Aver
age
leng
th o
f cus
todi
al
sanc
tions
/ m
easu
res
(in
mon
ths)
Of w
hich
: % L
ife
Of w
hich
: % In
dete
rmin
ate
sanc
tions
/ m
easu
res
Albania ... ... ... ... ... ... ... ... ... ... Armenia 0.1 ... 100.0 0.0 0.0 0.0 0.0 ... 0.0 ... Austria ... ... ... ... ... ... ... ... ... ... Bulgaria 3.0 53.5 35.7 10.4 0.0 0.4 0.0 ... 0.0 ... Croatia 0.5 100.0 ... ... ... ... ... ... ... ... Cyprus ... ... ... ... ... ... ... ... ... ... Czech Republic ... ... ... ... ... ... ... ... ... ... Denmark 6.1 ... ... ... ... ... ... ... ... ... Estonia ... ... ... ... ... ... ... ... ... ... Finland 2.7 94.5 4.1 1.4 0.0 0.0 0.0 ... 0.0 ... France ... ... ... ... ... ... ... ... ... ... Georgia ... ... ... ... ... ... ... ... ... ... Germany ... ... ... ... ... ... ... ... ... ... Greece 0.0 300.0 ... 100.0 ... ... ... ... ... ... Hungary 0.8 24.7 50.6 17.6 4.7 ... 2.4 ... ... ... Ireland ... ... ... ... ... ... ... ... ... ... Italy ... ... ... ... ... ... ... ... ... ... Kosovo (UNR) ... ... ... ... ... ... ... ... ... ... Latvia ... ... ... ... ... ... ... ... ... ... Lithuania ... ... ... ... ... ... ... ... ... ... Malta ... ... ... ... ... ... ... ... ... ... Netherlands ... ... ... ... ... ... ... ... ... ... Poland ... ... ... ... ... ... ... ... ... ... Portugal ... ... ... ... ... ... ... ... ... ... Serbia ... ... ... ... ... ... ... ... ... ... Slovakia 0.1 0.0 25.0 75.0 0.0 0.0 0.0 ... 0.0 ... Slovenia ... ... ... ... ... ... ... ... ... ... Spain ... ... ... ... ... ... ... ... ... ... Sweden 0.8 85.9 7.0 2.8 0.0 0.0 ... ... 0.0 2.8 Switzerland ... ... ... ... ... ... ... ... ... ... Turkey ... ... ... ... ... ... ... ... ... ... Ukraine ... ... ... ... ... ... ... ... 0.0 ... UK: E & W 1.3 40.7 4.0 16.4 1.4 0.1 0.0 ... 0.0 0.0 UK: N. Ireland ... ... ... ... ... ... ... ... ... ... UK: Scotland 2.5 62.9 32.6 3.8 0.8 0.0 0.0 ... 0.0 0.0 Mean 1.6 84.7 32.4 25.3 0.9 0.1 0.3 ... 0.0 0.9 Median 0.8 62.9 28.8 10.4 0.0 0.0 0.0 ... 0.0 0.0 Minimum 0.0 0.0 4.0 0.0 0.0 0.0 0.0 0.0 0.0 0.0 Maximum 6.1 300.0 100.0 100.0 4.7 0.4 2.4 0.0 0.0 2.8

254
Table 3.2.7.13 Persons convicted by length of unsuspended custodial sanctions and
measures imposed in 2010 – (Theft) Burglary: Total
Tota
l uns
uspe
nded
cus
todi
al
sanc
tions
Of w
hich
: % u
nder
6 m
onth
s
Of w
hich
: % 6
mon
ths
and
less
than
12
mon
ths
Of w
hich
: % 1
2 m
onth
s an
d le
ss th
an 2
4 m
onth
s
Of w
hich
: % 2
4 m
onth
s an
d le
ss th
an 6
0 m
onth
s
Of w
hich
: % 6
0 m
onth
s an
d le
ss th
an 1
20 m
onth
s
Of w
hich
: % 1
20 m
onth
s an
d ov
er
Aver
age
leng
th o
f cus
todi
al
sanc
tions
/ mea
sure
s (in
m
onth
s)
Of w
hich
: % L
ife
Of w
hich
: % In
dete
rmin
ate
sanc
tions
/ m
easu
res
Albania ... ... ... ... ... ... ... ... ... ... Armenia ... ... ... ... ... ... ... ... ... ... Austria 12 50.6 35.3 13.8 0.3 ... ... ... ... ... Bulgaria ... ... ... ... ... ... ... ... ... ... Croatia 19 35.2 41.4 18.4 5.0 ... ... ... ... ... Cyprus 17 13.5 16.3 44.0 26.2 0.0 0.0 ... 0.0 0.0 Czech Republic ... ... ... ... ... ... ... ... ... ... Denmark 17 ... ... ... ... ... ... ... ... ... Estonia ... ... ... ... ... ... ... ... ... ... Finland ... ... ... ... ... ... ... ... ... ... France ... ... ... ... ... ... ... ... ... ... Georgia ... ... ... ... ... ... ... ... ... ... Germany 4 4.4 36.9 35.4 22.8 0.5 0.0 ... 0.0 ... Greece ... ... ... ... ... ... ... ... ... ... Hungary ... ... ... ... ... ... ... ... ... ... Ireland ... ... ... ... ... ... ... ... ... ... Italy 7 0.3 0.0 0.0 0.4 3.0 75.8 ... ... ... Kosovo (UNR) 9 43.4 37.8 14.3 5.6 0.5 0.0 ... ... ... Latvia ... ... ... ... ... ... ... ... ... ... Lithuania ... ... ... ... ... ... ... ... ... ... Malta ... ... ... ... ... ... ... ... ... ... Netherlands 25 86.2 7.2 2.6 1.5 0.1 0.0 3 0.0 2.3 Poland 12 1.7 3.5 84.6 9.6 0.6 0.0 20 0.0 ... Portugal ... ... ... ... ... ... ... ... ... ... Serbia ... ... ... ... ... ... ... ... ... ... Slovakia 8 11.9 69.3 14.6 3.8 0.4 0.0 ... 0.0 ... Slovenia 11 31.6 35.5 20.8 11.7 0.4 0.0 ... ... ... Spain ... ... ... ... ... ... ... ... ... ... Sweden ... ... ... ... ... ... ... ... ... ... Switzerland ... ... ... ... ... ... ... ... ... ... Turkey ... ... ... ... ... ... ... ... ... ... Ukraine ... ... ... ... ... ... ... ... 0.0 ... UK: E & W 19 24.5 24.8 22.2 25.3 2.7 0.2 ... 0.0 0.3 UK: N. Ireland ... ... ... ... ... ... ... ... ... ... UK: Scotland 15 38.4 42.0 13.6 5.6 0.1 0.0 ... 0.0 0.0 Mean 13 28.5 29.2 23.7 9.8 0.9 7.6 12 0.0 0.7 Median 12 28.1 35.4 16.5 5.6 0.5 0.0 12 0.0 0.1 Minimum 4 0.3 0.0 0.0 0.3 0.0 0.0 3 0.0 0.0 Maximum 25 86.2 69.3 84.6 26.2 3.0 75.8 20 0.0 2.3

255
Table 3.2.7.14 Persons convicted by length of unsuspended custodial sanctions and measures imposed in 2010 – (Theft) Burglary: Domestic burglary
Tota
l uns
uspe
nded
cus
todi
al
sanc
tions
Of w
hich
: % u
nder
6 m
onth
s
Of w
hich
: % 6
mon
ths
and
less
than
12
mon
ths
Of w
hich
: % 1
2 m
onth
s an
d le
ss th
an 2
4 m
onth
s
Of w
hich
: % 2
4 m
onth
s an
d le
ss th
an 6
0 m
onth
s
Of w
hich
: % 6
0 m
onth
s an
d le
ss th
an 1
20 m
onth
s
Of w
hich
: % 1
20 m
onth
s an
d ov
er
Aver
age
leng
th o
f cus
todi
al
sanc
tions
/ m
easu
res (
in
mon
ths)
Of w
hich
: % L
ife
Of w
hich
: % In
dete
rmin
ate
sanc
tions
/ m
easu
res
Germany 0.9 1.0 28.0 40.0 29.9 1.2 0.0 ... 0.0 ... Slovakia 1.7 5.5 47.3 34.1 12.1 1.1 0.0 ... 0.0 ... Ukraine 19.3 ... 2.4 3.9 92.4 1.3 0.0 ... 0.0 ... UK: E & W 13.7 10.4 25.8 27.4 32.5 3.3 0.2 ... 0.0 0.4

256
Table 3.2.7.15 Persons convicted by length of unsuspended custodial sanctions and
measures imposed in 2010 – Fraud
Tota
l uns
uspe
nded
cus
todi
al
sanc
tions
Of w
hich
: % u
nder
6 m
onth
s
Of w
hich
: % 6
mon
ths
and
less
than
12
mon
ths
Of w
hich
: % 1
2 m
onth
s an
d le
ss th
an 2
4 m
onth
s
Of w
hich
: % 2
4 m
onth
s an
d le
ss th
an 6
0 m
onth
s
Of w
hich
: % 6
0 m
onth
s an
d le
ss th
an 1
20 m
onth
s
Of w
hich
: % 1
20 m
onth
s an
d ov
er
Aver
age
leng
th o
f cus
todi
al
sanc
tions
/ m
easu
res(
in
mon
ths)
Of w
hich
: % L
ife
Of w
hich
: % In
dete
rmin
ate
sanc
tions
/ m
easu
res
Albania 3.2 ... ... 58.8 27.8 12.4 1.0 ... ... ... Armenia 6.6 ... 5.6 12.7 71.4 9.9 0.5 ... 0.0 ... Austria 20.3 52.0 26.4 18.9 1.6 0.5 ... ... ... ... Bulgaria 6.5 29.4 34.8 30.7 4.3 0.8 0.0 ... 0.0 ... Croatia 6.8 26.3 40.0 26.7 7.0 ... ... ... ... ... Cyprus 2.1 17.6 23.5 11.8 29.4 17.6 0.0 ... 0.0 0.0 Czech Republic 5.2 ... 25.4 ... 58.2 16.2 0.2 ... 0.0 ... Denmark 2.0 ... ... ... ... ... ... ... ... ... Estonia ... ... ... ... ... ... ... ... ... ... Finland 4.7 63.4 17.7 15.0 3.9 0.0 0.0 ... ... ... France 3.5 39.6 28.9 26.5 4.0 1.1 0.0 ... 0.0 ... Georgia ... ... ... ... ... ... ... ... ... ... Germany 4.4 18.2 30.4 22.6 27.2 1.5 0.1 ... 0.0 ... Greece 1.1 24.8 47.3 64.3 ... ... 11.6 ... ... ... Hungary 9.3 9.5 27.8 37.5 14.3 8.7 2.0 ... ... ... Ireland ... ... ... ... ... ... ... ... ... ... Italy 9.5 1.6 0.0 0.0 1.0 9.7 58.1 ... ... ... Kosovo (UNR) 7.3 3.1 2.5 4.3 2.5 ... ... ... ... ... Latvia ... ... ... ... ... ... ... ... ... ... Lithuania 7.7 ... ... ... ... ... ... 40 ... ... Malta ... ... ... ... ... ... ... ... ... ... Netherlands 4.3 75.0 12.3 8.2 3.7 0.4 0.0 5 0.0 0.4 Poland 9.4 1.8 39.8 51.5 6.5 0.4 0.0 16 0.0 ... Portugal ... ... ... ... ... ... ... ... ... ... Serbia 1.6 49.2 28.0 20.3 2.5 0.0 0.0 ... ... ... Slovakia 2.1 11.4 29.8 20.2 16.7 18.4 3.5 ... 0.0 ... Slovenia 4.0 48.1 14.8 22.2 12.3 1.2 1.2 ... ... ... Spain ... ... ... ... ... ... ... ... ... ... Sweden 6.4 43.8 19.7 28.1 6.9 0.7 ... ... 0.0 0.7 Switzerland ... ... ... ... ... ... ... ... ... ... Turkey 13.9 ... ... ... ... ... ... ... ... ... Ukraine 2.0 ... 23.9 38.5 29.0 8.6 0.0 ... 0.0 ... UK: E& W 8.5 32.1 45.7 14.1 6.5 1.5 0.0 ... 0.0 0.0 UK: N. Ireland ... ... ... ... ... ... ... ... ... ... UK: Scotland 4.6 55.8 26.4 11.6 5.0 1.2 0.0 ... 0.0 0.0 Mean 6.0 31.7 25.0 24.7 15.5 5.6 4.1 20 0.0 0.2 Median 5.0 29.4 26.4 21.3 6.7 1.4 0.0 16 0.0 0.0 Minimum 1.1 1.6 0.0 0.0 1.0 0.0 0.0 5 0.0 0.0 Maximum 20.3 75.0 47.3 64.3 71.4 18.4 58.1 40 0.0 0.7

257
Table 3.2.7.16 Persons convicted by length of unsuspended custodial sanctions and
measures imposed in 2010 – Money laundering
Tota
l uns
uspe
nded
cus
todi
al
sanc
tions
Of w
hich
: % u
nder
6 m
onth
s
Of w
hich
: % 6
mon
ths
and
less
than
12
mon
ths
Of w
hich
: % 1
2 m
onth
s an
d le
ss th
an 2
4 m
onth
s
Of w
hich
: % 2
4 m
onth
s an
d le
ss th
an 6
0 m
onth
s
Of w
hich
: % 6
0 m
onth
s an
d le
ss th
an 1
20 m
onth
s
Of w
hich
: % 1
20 m
onth
s an
d ov
er
Aver
age
leng
th o
f cus
todi
al
sanc
tions
/ m
easu
res
(in
mon
ths)
Of w
hich
: % L
ife
Of w
hich
: % In
dete
rmin
ate
sanc
tions
/ m
easu
res
Albania 0.3 ... ... 100.0 0.0 0.0 0.0 ... ... ... Armenia 0.0 ... 0.0 0.0 0.0 100.0 0.0 ... 0.0 ... Austria 0.0 100.0 ... ... ... ... ... ... ... ... Bulgaria ... ... ... ... ... ... ... ... ... ... Croatia ... ... ... ... ... ... ... ... ... ... Cyprus ... ... ... ... ... ... ... ... ... ... Czech Republic 0.0 ... ... ... ... ... ... ... ... ... Denmark ... ... ... ... ... ... ... ... ... ... Estonia ... ... ... ... ... ... ... ... ... ... Finland 0.9 100.0 0.0 0.0 0.0 0.0 0.0 2.0 ... ... France ... ... ... ... ... ... ... ... ... ... Georgia ... ... ... ... ... ... ... ... ... ... Germany 0.0 25.0 31.3 31.3 12.5 0.0 0.0 ... 0.0 ... Greece ... ... ... ... ... ... ... ... ... ... Hungary ... ... ... ... ... ... ... ... ... ... Ireland ... ... ... ... ... ... ... ... ... ... Italy 3.2 30.4 0.1 0.0 28.8 104.8 83.6 ... ... ... Kosovo (UNR) 0.0 ... 100.0 ... ... ... ... ... ... ... Latvia ... ... ... ... ... ... ... ... ... ... Lithuania ... ... ... ... ... ... ... ... ... ... Malta ... ... ... ... ... ... ... ... ... ... Netherlands 1.0 48.1 17.9 19.1 13.0 1.9 0.0 11.0 0.0 0.0 Poland 0.1 4.2 0.0 25.0 45.8 25.0 0.0 46.0 0.0 ... Portugal ... ... ... ... ... ... ... ... ... ... Serbia 0.0 ... ... ... ... ... ... ... ... ... Slovakia 0.0 50.0 0.0 0.0 50.0 0.0 0.0 ... 0.0 ... Slovenia 0.0 ... ... ... ... ... ... ... ... ... Spain ... ... ... ... ... ... ... ... ... ... Sweden 0.1 40.0 0.0 60.0 0.0 0.0 ... ... 0.0 0.0 Switzerland ... ... ... ... ... ... ... ... ... ... Turkey ... ... ... ... ... ... ... ... ... ... Ukraine 0.0 ... 0.0 25.0 25.0 50.0 0.0 ... 0.0 ... UK: E & W ... ... ... ... ... ... ... ... ... ... UK: N Ireland ... ... ... ... ... ... ... ... ... ... UK: Scotland 0.0 ... ... ... ... ... ... 0.0 ... ... Mean 0.4 49.7 14.9 26.0 17.5 28.2 9.3 14.8 0.0 0.0 Median 0.0 44.1 0.0 22.1 12.7 0.9 0.0 6.5 0.0 0.0 Minimum 0.0 4.2 0.0 0.0 0.0 0.0 0.0 0.0 0.0 0.0 Maximum 3.2 100.0 100.0 100.0 50.0 104.8 83.6 46.0 0.0 0.0

258
Table 3.2.7.17 Persons convicted by length of unsuspended custodial sanctions and
measures imposed in 2010 – Corruption
Tota
l uns
uspe
nded
cus
todi
al
sanc
tions
Of w
hich
: % u
nder
6 m
onth
s
Of w
hich
: % 6
mon
ths
and
less
than
12
mon
ths
Of w
hich
: % 1
2 m
onth
s an
d le
ss th
an 2
4 m
onth
s
Of w
hich
: % 2
4 m
onth
s an
d le
ss th
an 6
0 m
onth
s
Of w
hich
: % 6
0 m
onth
s an
d le
ss th
an 1
20 m
onth
s
Of w
hich
: % 1
20 m
onth
s an
d ov
er
Aver
age
leng
th o
f cus
todi
al
sanc
tion s
/ m
easu
res
(in
mon
ths)
Of w
hich
: % L
ife
Of w
hich
: % In
dete
rmin
ate
sanc
tions
/ m
easu
res
Albania 1.2 ... ... 59.5 37.8 2.7 ... ... ... ... Armenia 1.0 ... 2.9 32.4 50.0 14.7 0.0 ... 0.0 ... Austria 0.5 47.5 47.5 2.5 2.5 ... ... ... ... ... Bulgaria 0.7 34.5 38.2 25.5 1.8 0.0 0.0 ... 0.0 ... Croatia 0.4 50.0 22.2 22.2 5.6 ... ... ... ... ... Cyprus 0.0 ... ... ... ... ... ... ... ... ... Czech Republic 0.1 ... 0.0 ... 100.0 0.0 0.0 ... 0.0 ... Denmark 0.0 ... ... ... ... ... ... ... ... ... Estonia ... ... ... ... ... ... ... ... ... ... Finland ... ... ... ... ... ... ... ... ... ... France 0.0 63.0 11.1 22.2 3.7 0.0 0.0 ... 0.0 ... Georgia ... ... ... ... ... ... ... ... ... ... Germany 0.0 4.0 16.0 12.0 68.0 0.0 0.0 ... 0.0 ... Greece ... ... ... ... ... ... ... ... ... ... Hungary 0.4 7.1 28.6 31.0 19.0 11.9 2.4 ... ... ... Ireland ... ... ... ... ... ... ... ... ... ... Italy 0.2 0.7 0.0 0.0 0.0 2.8 96.5 ... ... ... Kosovo (UNR) 3.4 16.2 ... ... ... ... ... ... ... ... Latvia ... ... ... ... ... ... ... ... ... ... Lithuania 0.1 ... ... ... ... ... ... 34.0 ... ... Malta ... ... ... ... ... ... ... ... ... ... Netherlands 0.0 ... ... ... ... ... ... 0.0 ... ... Poland 0.3 1.6 10.1 78.3 10.1 0.0 0.0 19.0 0.0 ... Portugal ... ... ... ... ... ... ... ... ... ... Serbia 0.4 45.2 38.7 6.5 9.7 0.0 0.0 ... ... ... Slovakia 0.1 0.0 0.0 0.0 28.6 71.4 0.0 ... 0.0 ... Slovenia 0.0 0.0 0.0 100.0 0.0 0.0 0.0 ... ... ... Spain ... ... ... ... ... ... ... ... ... ... Sweden 0.0 100.0 0.0 0.0 0.0 0.0 ... ... 0.0 0.0 Switzerland ... ... ... ... ... ... ... ... ... ... Turkey 0.5 ... ... ... ... ... ... ... ... ... Ukraine 0.2 ... 2.0 17.0 62.0 19.0 0.0 ... 0.0 ... UK: E & W ... ... ... ... ... ... ... ... ... ... UK: N. Ireland ... ... ... ... ... ... ... ... ... ... UK: Scotland 0.0 ... ... ... ... ... ... 0.0 ... ... Mean 0.4 28.4 14.5 27.3 24.9 8.8 8.2 13.3 0.0 0.0 Median 0.2 16.2 10.1 22.2 9.9 0.0 0.0 9.5 0.0 0.0 Minimum 0.0 0.0 0.0 0.0 0.0 0.0 0.0 0.0 0.0 0.0 Maximum 3.4 100.0 47.5 100.0 100.0 71.4 96.5 34.0 0.0 0.0

259
Table 3.2.7.18 Persons convicted by length of unsuspended custodial sanctions and measures imposed in 2010 – Drug offences: Total
Tota
l uns
uspe
nded
cus
todi
al
sanc
tions
Of w
hich
: % u
nder
6 m
onth
s
Of w
hich
: % 6
mon
ths
and
less
than
12
mon
ths
Of w
hich
: % 1
2 m
onth
s an
d le
ss th
an 2
4 m
onth
s
Of w
hich
: % 2
4 m
onth
s an
d le
ss th
an 6
0 m
onth
s
Of w
hich
: % 6
0 m
onth
s an
d le
ss th
an 1
20 m
onth
s
Of w
hich
: % 1
20 m
onth
s an
d ov
er
Aver
age
leng
th o
f cus
todi
al
sanc
tions
/ m
easu
res
(in
mon
ths)
Of w
hich
: % L
ife
Of w
hich
: % In
dete
rmin
ate
sanc
tions
/ m
easu
res
Albania 12 ... ... 13.9 58.4 23.9 3.8 ... ... ... Armenia 16 ... 42.6 15.7 20.5 17.6 4.4 ... 0.0 ... Austria 31 50.0 22.3 21.7 4.5 1.5 ... ... ... ... Bulgaria 15 30.4 38.0 26.1 4.5 0.9 0.1 ... 0.0 ... Croatia 18 20.9 9.4 24.0 41.0 4.5 0.1 ... ... ... Cyprus 19 22.2 5.1 13.9 26.6 20.3 12.0 ... 0.0 0.0 Czech Republic 5 ... 13.8 ... 74.6 11.7 0.0 ... 0.0 ... Denmark 22 ... ... ... ... ... ... ... ... ... Estonia ... ... ... ... ... ... ... ... ... ... Finland 11 36.4 13.4 17.9 24.4 7.4 0.5 ... ... ... France 23 38.8 21.5 30.1 6.9 2.6 0.1 ... 0.0 ... Georgia ... ... ... ... ... ... ... ... ... ... Germany 8 16.7 13.0 18.1 45.4 6.5 0.3 ... 0.0 ... Greece 7 130.3 15.8 41.2 ... ... 28.5 ... ... ... Hungary 3 6.6 12.8 21.1 14.9 27.7 17.0 ... ... ... Ireland ... ... ... ... ... ... ... ... ... ... Italy 46 0.1 0.0 0.0 0.1 0.8 9.9 ... ... ... Kosovo (UNR) 6 2.5 27.0 21.3 13.1 5.7 ... ... ... ... Latvia ... ... ... ... ... ... ... ... ... ... Lithuania 15 ... ... ... ... ... ... 50 ... ... Malta ... ... ... ... ... ... ... ... ... ... Netherlands 17 46.5 28.7 12.4 10.3 1.7 0.2 10 0.0 28.7 Poland 6 11.4 13.7 48.0 23.1 3.5 0.4 23 0.0 ... Portugal ... ... ... ... ... ... ... ... ... ... Serbia 16 32.8 17.8 19.4 27.7 2.1 0.1 ... ... ... Slovakia 5 9.1 12.1 9.1 33.2 29.2 7.4 ... 0.0 ... Slovenia 6 9.2 26.2 37.7 21.5 4.6 0.8 ... ... ... Spain ... ... ... ... ... ... ... ... ... ... Sweden 20 37.9 19.4 18.7 12.6 10.9 ... ... 0.0 0.4 Switzerland ... ... ... ... ... ... ... ... ... ... Turkey 19 ... ... ... ... ... ... ... ... ... Ukraine 15 ... 8.7 25.7 54.7 10.9 0.1 ... 0.0 ... UK: E & W 18 16.0 13.0 26.2 31.9 10.9 2.0 ... 0.0 0.0 UK: N. Ireland ... ... ... ... ... ... ... ... ... ... UK: Scotland 27 27.1 18.7 23.6 25.6 4.7 0.4 ... 0.0 0.0 Mean 16 28.7 17.9 22.1 26.2 9.5 4.4 28 0.0 5.8 Median 16 22.2 14.8 21.2 23.8 6.1 0.4 23 0.0 0.0 Minimum 3 0.1 0.0 0.0 0.1 0.8 0.0 10 0.0 0.0 Maximum 46 130.3 42.6 48.0 74.6 29.2 28.5 50 0.0 28.7

260
Table 3.2.7.19 Persons convicted by length of unsuspended custodial sanctions and measures imposed in 2010 – Drug offences: Drug trafficking
Tota
l uns
uspe
nded
cu
stod
ial s
anct
ions
Of w
hich
: % u
nder
6
mon
ths
Of w
hich
: % 6
mon
ths
and
less
than
12
mon
ths
Of w
hich
: % 1
2 m
onth
s an
d le
ss th
an 2
4 m
onth
s
Of w
hich
: % 2
4 m
onth
s an
d le
ss th
an 6
0 m
onth
s
Of w
hich
: % 6
0 m
onth
s an
d le
ss th
an 1
20
mon
ths
Of w
hich
: % 1
20 m
onth
s an
d ov
er
Aver
age
leng
th o
f cu
stod
ial s
anct
ions
/ m
easu
res
(in m
onth
s)
Of w
hich
: % L
ife
Of w
hich
: %
Inde
term
inat
e sa
nctio
ns /
mea
sure
s
Albania 12 ... ... 13.9 58.4 23.9 3.8 ... ... ... Armenia 5 ... 5.6 3.9 27.5 50.6 12.4 ... 0.0 ... Austria ... ... ... ... ... ... ... ... ... ... Bulgaria ... ... ... ... ... ... ... ... ... ... Croatia 15 10.2 8.5 28.0 47.9 5.3 0.2 ... ... ... Cyprus ... ... ... ... ... ... ... ... ... ... Czech Republic 4 ... 10.9 ... 77.4 11.8 0.0 ... 0.0 ... Denmark 17 ... ... ... ... ... ... ... ... ... Estonia ... ... ... ... ... ... ... ... ... ... Finland 5 1.0 3.1 30.1 49.5 15.2 1.0 ... ... ... France 10 20.6 23.6 40.0 11.1 4.5 0.3 ... 0.0 ... Georgia ... ... ... ... ... ... ... ... ... ... Germany 5 0.1 3.0 17.5 68.5 10.5 0.4 ... 0.0 ... Greece 4 ... ... ... ... ... ... ... ... ... Hungary ... ... ... ... ... ... ... ... ... ... Ireland ... ... ... ... ... ... ... ... ... ... Italy ... ... ... ... ... ... ... ... ... ... Kosovo (UNR) 5 1.8 25.5 22.7 14.5 6.4 ... ... ... ... Latvia ... ... ... ... ... ... ... ... ... ... Lithuania ... ... ... ... ... ... ... ... ... ... Malta ... ... ... ... ... ... ... ... ... ... Netherlands ... ... ... ... ... ... ... ... ... ... Poland 2 1.3 5.4 45.8 38.3 8.2 1.0 34 0.0 ... Portugal ... ... ... ... ... ... ... ... ... ... Serbia 15 31.6 17.4 19.9 28.8 2.2 0.1 ... ... ... Slovakia 4 0.0 0.0 0.5 46.7 42.2 10.6 ... 0.0 ... Slovenia 6 8.5 26.4 38.0 21.7 4.7 0.8 ... ... ... Spain ... ... ... ... ... ... ... ... ... ... Sweden ... ... ... ... ... ... ... ... ... ... Switzerland ... ... ... ... ... ... ... ... ... ... Turkey 16 ... ... ... ... ... ... ... ... ... Ukraine 7 ... 1.3 4.8 73.9 19.9 0.1 ... 0.0 ... UK: E & W 1 0.5 6.4 12.5 19.1 46.4 15.0 ... 0.0 0.0 UK: N. Ireland ... ... ... ... ... ... ... ... ... ... UK: Scotland 22 13.3 21.2 28.4 30.9 5.7 0.4 ... 0.0 0.0 Mean 9 8.1 11.3 21.9 40.9 17.2 3.3 34 0.0 0.0 Median 6 1.8 7.5 21.3 38.3 10.5 0.6 34 0.0 0.0 Minimum 1 0.0 0.0 0.5 11.1 2.2 0.0 34 0.0 0.0 Maximum 22 31.6 26.4 45.8 77.4 50.6 15.0 34 0.0 0.0
Notes on tables 3.2.7.1 to 3.2.7.19
Armenia: The data for 6-12 months actually refer to 0-12 months. Croatia: Data relate to the year 2011 (instead of 2010). Cyprus, Greece, Italy: Data relate to the year 2009 (instead of 2010). Czech Republic: 6-12 months refer to 0-12 months; 24-60 months to 12-60; 60-120 months to 60-180 and over 120 to 180-300. Denmark: In total 9119 of the 11608 sanctions were 6 months or shorter. France: 12-24 months refer to 12-36 months and 24-60 months to 36-60 months. Serbia: Data refer to the length of the prison sentence imposed on adult offenders only. UK: England & Wales: Average length of custodial sanction excludes life and indeterminate sentences.

261
Table 3.2.8 Persons held in pre-trial detention (at least temporarily) among persons convicted in 2010 – Criminal offences: Total
Total of persons convicted of which: % held in pre-trial detention (at least temporarily)
Albania 270 23.2 Armenia 135 ... Austria ... ... Bulgaria 517 ... Croatia ... ... Cyprus 215 ... Czech Republic 672 6.8 Denmark ... ... Estonia ... ... Finland 3851 1.1 France ... ... Georgia ... ... Germany 1265 2.6 Greece 103 30.4 Hungary 827 6.9 Ireland ... ... Italy 426 30.8 Kosovo (UNR) 449 ... Latvia ... ... Lithuania 471 ... Malta ... ... Netherlands ... ... Poland 1134 7.6 Portugal ... ... Serbia 319 13.6 Slovakia ... ... Slovenia 411 8.6 Spain 468 ... Sweden ... ... Switzerland ... ... Turkey ... ... Ukraine ... ... UK: England & Wales 2461 3.7 UK: Northern Ireland ... ... UK: Scotland ... ... Mean 823 12.3 Median 468 7.6 Minimum 103 1.1 Maximum 3851 30.8
Notes on table 3.2.8
Italy: Data relate to the year 2009 (instead of 2010). Cyprus: Data relate to the year 2009 (instead of 2010). Germany: Number of persons held in pre-trial detention does not refer only to persons convicted later on.

262
3.3 Technical information 3.3.1 Technical comments
What is recorded?
Next to court convictions, the conviction statistics in this chapter include sanctions imposed by the prosecutor (or by the court, but on application of the prosecutor and without a formal court hearing) that lead to a formal verdict and count as a conviction (e.g., penal order, Strafbefehl) for most countries as well, except for Bulgaria, Hungary, Italy, the Netherlands, Poland, Serbia, Slovenia, Spain, UK: England & Wales and UK: Scotland. All countries except UK: England & Wales exclude sanctions imposed by the prosecutor that do not lead to a formal verdict and do not count as a conviction (e.g., conditional disposals).
Only Denmark includes sanctions/measures imposed by the police as convictions. France includes sanctions / measures imposed by other state bodies. Both the principal offence and the principal sanction rule are applied in most countries. Recording is based on the main conviction.
All countries have written rules regarding the way they record sanctions and measures, except Denmark, France, Georgia, Italy and Kosovo.
Differences between Chapters 1 and 3 with regard to offence definitions
The offence definitions used in Chapter 1 reflect the definitions that are used in the national police statistics. They are usually based on concepts that are close to everyday life experience, e.g., burglary, armed robbery and car theft.
On the other hand, the definitions used for convictions reflect different legal traditions and criminal codes. For this reason, in some countries there are no separate conviction statistics for some offences, such as car theft, drug trafficking, burglary, robbery, and sexual abuse of minors.
Differences in convictions and sanctions/measures
Countries have different rules for counting sanctions and measures and non-custodial sanctions.
The sentence length of unsuspended custodial sanctions and measures imposed upon adults or minors in many countries differs from the standard used in this publication. In addition, the time of publication of the statistics varies among countries. Some countries were not able to provide detailed figures for 2010.
3.3.2 Minors in conviction statistics
Age brackets used in the Tables
All countries count minors as persons who are under 18 years. The exceptions are Austria, Poland, Switzerland and Ukraine where only those under 17 years are included, and in Cyprus and Malta those under 16.
The lower limit varies widely among countries as far as criminal responsibility is concerned. Persons below the age of criminal responsibility will not be convicted and therefore not counted in convictions statistics (regardless of the ‘civil’ or administrative treatment or sanction they will actually receive). This was not necessarily the case for police statistics where persons below the age of criminal responsibility were sometimes included (for details see Table 1.3.3).
For the offences considered here, the following age limits were indicated.

263
Table 3.3.1 Minimum age for consideration in conviction statistics 2010
Albania … Armenia 14 Austria Azerbaijan
1 …
Belgium … Bosnia-Herzegovina ... Bulgaria 14 Croatia 14 Cyprus 10 Czech Republic 15 Denmark … Estonia 14 Finland 0 France … Georgia … Germany 14 Greece 8 Hungary 14 Iceland ... Ireland … Italy Kosovo (UNR)
0 …
Latvia … Lithuania 14 Luxembourg ... Malta ... Moldova Montenegro
… …
Netherlands 12 Norway ... Poland 15 Portugal 15 Romania … Russia Serbia
14 16
Slovakia 0 Slovenia 14 Spain 14 Sweden 15 Switzerland 10 TFYR of Macedonia ... Turkey 12 Ukraine 14 UK: England and Wales … UK: Northern Ireland … UK: Scotland …
The transition from the status of minor to adult raises difficult legal and statistical questions as to how a person is treated who, having committed an offence as a minor, is dealt with in court once they have reached the age of adulthood. Some countries apply rules for minors, and count them as such, whereas others treat and count them as adults. For example, in Germany young adults aged 18-20 years are often sanctioned according to juvenile law so that this age group is partially included in the sentencing tables for minors and partially in adults.

264
3.4 Sources
Albania Ministry of Justice, yearbook 2007, 2008, 2009, 2010, 2011. General Directory of the Prisons Ministry of Justice Tirana, Albania.
Armenia http://www.court.am/files/news/2151_am.pdf http://www.court.am/?l=lo&id=50&cat_id=0&page_num=4
Austria Conviction Statistics (Gerichtliche Kriminalstatistik 2007-2011), Bundesministerium für Justiz, Ministry of Justice, www.statistik.at (Statistik Austria STATCUBE) http://www.statistik.at/web_de/services/datenbank_superstar/index.html Sicherheitsbericht 2010 p.59 3.3.a, p. 64 (Neustart), 69 (Total), 70 3.4.a, p. 72 (minors)
Bulgaria National Statistical Institute: Crimes, Accused and Persons Convicted 2004-2011, available at: http://www.nsi.bg/otrasalen.php?otr=50
Croatia State Bureau of Statistics, www.dzs.hr Cyprus Criminal Statistics Reports and unpublished data of CYSTAT. Czech Republic 2007 Statistical Sourcebook of Criminality, The Ministry of Justice, 2008-2011 Central
Information System for Statistical Lists and Reporting, The Ministry of Justice. Czech Statistical Office - Foreigners: Criminality Data, www.czso.cz Central Information System for Statistical Lists and Reporting, The Ministry of Justice, www.justice.cz
Denmark Ministry of Justice - data from files bought at Statistics Denmark. Statistics Denmark: Yearbook on crime 2010. www.dst.dk
Estonia Ministry of Justice – not published. Finland Statistics Finland database; Statistics Finland, unpublished table 6.7 for year 2010.
Statistics Finland, public table on the use of force by the police: pakkokeinot 2010. http://www.stat.fi/til/pkei/2010/pkei_2010_2011-06-01_tau_002_fi.html
France Ministry of Justice, Annuaire Statistique de la Justice. Georgia Supreme Court of Georgia. Germany Statistisches Bundesamt (Ed.): Strafverfolgungsstatistik 2007 - 2011, Wiesbaden 2008 -
2012. Greece Hellenic Statistical Authority; Ministry of Justice, Transparency and Human Rights. Hungary National Office for the Judiciary. Ireland Garda Pulse (Police Using Leading Systems Effectively) Italy Italian Institute of Statistics - http://www.istat.it Kosovo UN Kosovo Agency of Statistics Social Statistics – Statistics on Jurisprudence
[email protected] http://esk.rks-gov.net/eng/Statistics of jurisprudence for minors and adults 2010
Lithuania Source: National Courts Administration, Analysis of Judicial Activities Division, not published. Information Technology and Statistical Department under the Ministry of Interior of the Republic of Lithuania.
Netherlands Statistics Netherlands http://statline.cbs.nl http://www.cbs.nl/nl-NL/menu/themas/ veiligheid-recht/publicaties/publicaties/archief/2012/2012-criminaliteit-en-rechtshandhaving-2011.htm
Poland Ministry of Justice. Department of Statistics. Portugal Directorate-General for Justice Policy – Ministry of Justice. Russia Data on persons convicted for rape statistics is provided by the United Nations Office on
Drugs and Crime Serbia Statistical Office of The Republic of Serbia / SORS. Slovakia Ministry of Justice - Section of Informatics and Coordination of Projects, partially
published at: http://www.justice.gov.sk/stat/statr.htm Slovenia Statistic office of Republic of Slovenia. Spain Instituto Nacional de Estadística. Available online: http://www.ine.es (Consulted on 30
April and 15 May 2013). Sweden National Council for Crime Prevention, Sweden, www.bra.se. Turkey For 2007: Ministry of Justice; General Directorate of Judicial Records and Statistics.

265
(2009). Judicial Statistics 2007. Ankara: Turkish Statistical Institute. For 2008: Ministry of Justice; General Directorate of Judicial Records and Statistics. (2010). Judicial Statistics 2008. Ankara: Turkish Statistical Institute. For 2009: Ministry of Justice; General Directorate of Judicial Records and Statistics. (2011). Judicial Statistics 2009. Ankara: Turkish Statistical Institute. For 2010: Ministry of Justice; General Directorate of Judicial Records and Statistics. (2012). Judicial Statistics 2010. Ankara: Turkish Statistical Institute. For 2011: Ministry of Justice; General Directorate of Judicial Records and Statistics, online data: http://www.adlisicil.adalet. gov.tr/istatistik_ 2011/ist_tab.htm
Ukraine Data for 2007-2010 from reports of the State Judicial Administration of Ukraine. Data for 2011 from report of High Specialized Court of Ukraine for Civil and Criminal Cases. Judicial Statistics of Supreme Court of Ukraine - http://sc.gov.ua/ua/sudova_statistika .html
UK: England & Wales UK: E and W http://www.justice.gov.uk/statistics/criminal-justice/criminal-justice-statistics UK: N. Ireland Northern Ireland Criminal Records Viewer extract held by the Statistics and Research
Branch, Criminal Justice and Law Branch, Department of Justice. UK: Scotland The Scottish Government Justice Statistics Unit Criminal proceedings in Scottish courts.

266

267
4. Prison Statistics
4.1. General Comments 4.1.1 Introduction
This chapter provides information on prison populations on 1st September for each year from 2007 to 2011 (stock), entries into penal institutions during each of these years (flow of entries), and convicted prison population by offence on 1st September 2010. Information on the number and capacity of penal institutions, expenditure and prison staff is not included because it can be found in the Council of Europe Annual Penal Statistics (SPACE), which are available online (www.unil.ch/space).
The ‘stock’ and ‘flow’ perspective
Generally speaking, data on prison and on probation populations can be described from two perspectives, which generate different but equally important results. The first perspective refers to ‘how many persons are held in penal institutions (or under the supervision of probation agencies) on a given day’ (‘stock’). The second perspective refers to ‘how many people have been admitted into penal institutions (or have been placed under the supervision of probation agencies) during the course of the year’ (‘flow of entries’) and to ‘how many people have left penal institutions (or the supervision of probation agencies) during the course of the year’ (‘flow of exits’).
Regarding prison populations, the following data were requested:
Number of persons held in penal institutions on 1st September 2007 to 2011: ‘stock’ including pre-trial detention, and breakdown into the following sub-categories: pre-trial detainees, females, minors, and aliens and EU citizens (see tables 4.2.1).
Number of persons that entered into penal institutions during the years 2007 to 2011: ‘flow of entries’ including pre-trial detention, and breakdown into the following sub-categories: pre-trial detainees, females, minors, aliens and those aliens who were EU citizens (see tables 4.2.2).
Convicted prison population (‘stock of sentenced prisoners’, i.e., excluding pre-trial detainees) breakdown by the type of offence for which the prisoner was convicted (see table 4.2.3.1): major traffic offences, intentional homicide (including attempts), bodily injury/assault (total), aggravated bodily injury, sexual assault (total), rape, sexual abuse of a child, robbery, theft (total), and total drug offences (total).
Convicted prison population by offence (according to the offences listed above) breakdown into the following sub-categories: pre-trial detainees, females, minors, aliens and those aliens who were EU citizens (see tables 4.2.3.2–4.2.3.12).
Comparisons of prison populations are not as straightforward as they may seem because quite often there are differences across countries regarding the categories of persons included under the total number of persons held in prison. For example, some countries include minors and others do not include them. Basic information on such differences is presented under the heading Technical information (4.3). More detailed information can be found in the latest annual SPACE I reports (www.unil.ch/space).

268
4.1.2 Quality of the data
A comparison of Sourcebook and SPACE data showed an overall agreement between both sources for the stock data. Significant differences could be found only in the cases of Cyprus and the Netherlands. Sourcebook figures for Cyprus were roughly 25% lower than in SPACE because they do not include persons held in police stations, while Sourcebook figures for Netherlands were roughly 20% higher than in SPACE because they included subcategories such as minors, aliens in administrative detention, and custodial clinics. In the case of flow data, there were significant differences in the cases of Cyprus – for the reason noted above – Bulgaria and Sweden –because of differences in the subcategories included in the total– and Ukraine, a country for which data were available only for two years. This was not surprising since it is technically more difficult to measure flow data than it is to measure stock data.
The SPACE collection was used to complete data for some countries that were unable to provide it either for the whole chapter, for a particular table, or for specific years. In all these cases, the reference to SPACE is indicated in the sources section (4.4).
Forty-four countries provided data on their prison population on 1st September (stock) of at least four of the years covered by the Sourcebook, while 43 provided data on persons admitted to penal institutions (flow) during at least two of these years. Most of the countries that provided stock data were also able to indicate the number of pre-trial detainees, females, minors, aliens and EU citizens included in the total prison population. The number of countries that provided detailed information for flow data was lower, ranging from 41 countries indicating the number of pre-trial detainees admitted during one year to 7 countries specifying the number of EU citizens entering into penal institutions. The number of countries providing data on prison population by type of offence varied according to the offence ranging from a maximum of 43 for all criminal offences and 40 for homicide, to a minimum of 10 for sexual abuse of a child.
4.1.3 Results
There are considerable differences between the countries as regards the size of their prison populations: in 2011, the prison population rates ranged from 47 detainees per 100 000 population in Iceland to 540 in Georgia. Between 2007 and 2011, the median prison population rate increased by 19%, rising from 109 to 130 detainees per 100 000 population; while the mean prison population rate increased from 147 to 157 (i.e., 6%). Across countries, changes during this period ranged from –22% to +90%. Twelve countries showed a decrease, and in 6 cases (Cyprus, Finland, Luxembourg, Moldova, Netherlands and Poland) the decrease reached 10%:. The highest increases were found in Albania (90%), Kosovo UN R/1244/99 (60%), Malta (50%), Lithuania (40%), Italy and Turkey (both with a 34% increase). In 2011, the percentage of pre-trial detainees in penal institutions varied from 5% to 65%.
The percentage of females in penal institutions was low (5%) and varied very little between the countries. In 2011, Cyprus (9%) and Spain (8%) were the countries with the highest percentage of females in their prison population.
In 2011, the percentage of aliens in penal institutions varied considerably, ranging from 1% (Albania, Georgia, Latvia, Lithuania, Poland and Romania) to 71% (Switzerland). These differences reflect diverse factors such as geographical location, economic development, and immigration policies. Also, definitions of aliens showed variations between countries. From 2007 to 2011, the average percentage of aliens in the prison population remained stable at 18%. The percentage of aliens who were EU citizens varied between 0% (Azerbaijan) and 71% (Iceland).
Minors (i.e., persons under the age of 18) do not usually enter the prison system and sometimes were not included in the total prison population (see the Technical information in chapter 4.3). When they are included, on average they accounted for about 1% of the prison populations in Europe in 2011.

269
On average, in 2010, 120 detainees per 100 000 population had been convicted for criminal offences. Theft accounted for the highest percentage (19%) of the convicted prison population, followed by robbery (17%) and drug offences (17%). Sexual abuse of a child and rape each accounted for 4% of the convicted population. Between 2007 and 2011, the number of prisoners admitted to prisons (‘flow’) was relatively stable, fluctuating from 240 to 265 detainees per 100 000 population.
4.1.4 Recidivism
As in previous editions, data on recidivism was not collected. However, a brief account of some of the main methodological issues and some common features in the results from available reconviction studies are presented here. Measuring reconviction varies between countries. Some do this by defining the concept of a recidivist within their penal code and simply count the persons that reoffend whereas other countries rely on research studies to estimate reconviction rates of offenders. Some countries have built up large databases of offender histories, which enable reconviction rates and criminal careers to be studied on a regular basis.
However, there is little standardisation between countries in the methodology used. In general, results are dependent, among other factors, on the size of the studied sample or population; the characteristics of the offenders (are all offenders chosen or only special subgroups according to gender, age, prior conviction, type of offence, type of sanction, et cetera); the length of the follow-up period; the definition of the event that constitutes ‘reconviction’/’recidivism’ (e.g., all offences or only special offences/sanctions meet the criterion of reconviction).
Indeed, when choosing different offender characteristics, follow-up periods and reconviction criterions, it is possible to synthetically increase or decrease recidivism rates. Therefore, care should be taken in interpreting reconviction rates, even within one country, and special care should be taken when comparing rates across countries. Nor should it be forgotten that reconviction rates are in fact ‘rates of recapture’. Therefore, recidivism rates may depend on the efficiency of the different criminal justice systems.
Although the magnitude of reconviction rates varies considerably between countries, there are some common features in the results, namely:
- Past criminal history is the most important predictor of reconviction rates, the highest rates being for offenders with the longest criminal history.
- Reconviction rates are higher for males than for females; this is mostly explained by differences in criminal history and age.
- Younger persons tend to have higher reconviction rates than older persons. - Reconviction rates are highest in the first year after the initial conviction/release.
There is no simple relationship between the seriousness of the offence and reconviction.
There is no simple relationship between the first conviction and the subsequent offences.
There is no simple relationship between the type of sentence and the reconviction rate.
The SPACE website includes a page dedicated to recidivism studies: http://www3.unil.ch/wpmu/space/publications/recidivism-studies/

270
4.2 Tables 4.2.1 Prison population (including pre-trial detainees): Stock
Table 4.2.1.1 Prison population per 100 000 population: Stock – Total
2007 2008 2009 2010 2011
% change 2007-2011
Albania 88 157 141 159 166 90 Armenia 109 118 124 151 138 27 Austria 108 99 101 103 105 -3 Azerbaijan ... 243 230 410 417 ... Belgium 99 102 105 109 111 13 Bosnia-Herzegovina ... ... ... ... ... ... Bulgaria 141 130 121 125 134 -5 Croatia 97 107 110 117 115 19 Cyprus 86 82 84 78 75 -13 Czech Republic 184 197 208 208 221 20 Denmark 69 66 71 75 77 12 Estonia 257 273 265 253 254 -1 Finland 69 67 67 63 61 -11 France 100 104 103 104 111 12 Georgia 417 426 484 534 540 30 Germany 95 91 90 88 87 -8 Greece 93 104 104 103 109 18 Hungary 148 148 155 163 172 17 Iceland 37 44 46 52 47 25 Ireland ... 65 74 82 79 ... Italy 83 92 106 113 111 34 Kosovo (UNR) 49 54 61 61 79 60 Latvia 283 288 310 301 316 12 Lithuania 232 238 258 275 325 40 Luxembourg 156 139 138 137 126 -19 Malta 94 161 119 144 140 50 Moldova 227 203 190 180 178 -22 Montenegro ... ... 156 233 214 ... Netherlands 95 89 87 87 84 -12 Norway 73 73 72 78 76 4 Poland 237 222 224 212 212 -11 Portugal 109 102 104 109 120 10 Romania 136 122 124 132 143 5 Russia 621 625 609 577 ... ... Serbia 121 132 147 153 152 26 Slovakia 153 154 167 186 199 30 Slovenia 66 66 67 66 62 -7 Spain 149 159 171 165 156 4 Sweden 74 75 77 74 72 -4 Switzerland 76 76 79 79 77 1 TFYR of Macedonia 100 109 120 123 122 22 Turkey 130 147 162 166 174 34 Ukraine 332 321 319 332 338 2 UK: England & Wales 147 153 152 154 152 3 UK: Northern Ireland 82 87 81 82 94 15 UK: Scotland 145 156 156 151 157 9 Mean 147 151 154 163 157 Median 109 120 121 132 130 Minimum 37 44 46 52 47 Maximum 621 625 609 577 540

271
Table 4.2.1.2 Prison population as percentage of total stock: Pre-trial detainees
2007 2008 2009 2010 2011
% change 2007-2011
Albania ... 39 34 42 41 ... Armenia 18 21 26 27 27 52 Austria 23 21 23 22 19 -14 Azerbaijan ... 11 14 6 43 ... Belgium 30 30 28 28 28 -8 Bosnia-Herzegovina ... ... ... ... ... ... Bulgaria 7 8 10 13 11 51 Croatia 30 29 25 23 18 -42 Cyprus 16 21 24 22 22 38 Czech Republic 12 12 11 11 11 -5 Denmark 28 55 34 33 32 17 Estonia 27 27 24 22 23 -14 Finland 14 16 16 17 18 30 France 28 25 24 24 23 -18 Georgia 15 23 ... 12 7 -55 Germany 17 17 16 16 16 -9 Greece 30 26 27 30 33 11 Hungary 26 29 30 29 28 8 Iceland 10 10 17 8 8 -23 Ireland ... 21 17 18 17 ... Italy 32 55 49 43 42 32 Kosovo (UNR) 33 38 37 37 44 34 Latvia 16 26 28 5 23 45 Lithuania 17 17 18 17 17 2 Luxembourg 39 38 39 40 38 -1 Malta 78 72 64 59 65 -17 Moldova 15 13 12 12 24 58 Montenegro ... ... ... ... 24 ... Netherlands 39 39 40 41 42 7 Norway 19 22 23 27 23 19 Poland 15 11 11 11 11 -29 Portugal 20 20 19 20 19 -3 Romania 5 7 10 8 5 1 Russia 17 16 15 14 ... ... Serbia 24 24 24 30 28 16 Slovakia 24 20 18 15 13 -43 Slovenia 29 26 25 29 25 -14 Spain 24 24 21 20 17 -30 Sweden 21 20 20 21 21 1 Switzerland 29 31 31 31 28 -3 TFYR of Macedonia ... ... ... ... ... ... Turkey 58 56 33 27 28 -52 Ukraine 21 19 25 22 22 1 UK: England & Wales 11 11 10 10 10 -8 UK: Northern Ireland ... 39 37 38 38 ... UK: Scotland 22 23 20 18 19 -10 Mean 24 26 24 23 24 Median 22 23 24 22 23 Minimum 5 7 10 5 5 Maximum 78 72 64 59 65

272
Table 4.2.1.3 Prison population as percentage of total stock: Females
2007 2008 2009 2010 2011
% change 2007-2011
Albania 4.9 1.9 2.7 2.0 1.9 -61 Armenia 3.6 3.4 4.0 3.9 4.3 18 Austria 4.9 5.5 6.0 6.2 6.5 31 Azerbaijan ... 1.9 2.1 1.9 1.7 ... Belgium 4.3 4.5 4.2 4.1 4.4 1 Bosnia-Herzegovina ... ... ... ... ... ... Bulgaria 3.4 3.1 2.9 3.1 3.1 -10 Croatia 4.4 4.4 4.6 4.6 4.9 11 Cyprus 4.5 6.0 5.8 6.0 8.7 95 Czech Republic 5.3 5.3 5.3 5.9 6.4 22 Denmark 4.7 4.3 4.8 4.3 4.1 -13 Estonia 4.5 5.2 5.5 5.7 5.4 21 Finland 6.8 6.3 6.7 7.3 7.1 4 France 3.8 3.6 3.5 3.5 3.5 -7 Georgia 4.4 4.4 4.6 5.0 5.0 15 Germany 5.3 5.3 5.4 5.2 5.5 5 Greece 5.6 4.8 5.9 4.8 4.7 -17 Hungary 6.4 6.7 6.8 6.3 7.2 12 Iceland 7.0 6.4 4.7 4.8 5.4 -23 Ireland ... 2.1 3.1 3.0 3.1 ... Italy 4.5 4.4 4.4 4.4 4.3 -5 Kosovo (UNR) 2.8 2.7 2.5 2.5 2.1 -23 Latvia 5.1 5.6 5.9 6.5 6.5 29 Lithuania 4.4 4.5 4.3 4.6 4.3 -2 Luxembourg 3.5 3.9 4.7 3.6 5.6 60 Malta 7.3 4.4 5.7 5.7 6.0 -18 Moldova 5.1 5.6 6.2 6.3 6.2 21 Montenegro ... ... ... ... 2.8 ... Netherlands 7.2 7.5 7.2 7.1 6.7 -8 Norway 4.5 4.7 4.5 4.1 4.3 -4 Poland 3.0 3.1 3.1 3.2 3.2 5 Portugal 6.9 6.0 5.5 5.4 5.6 -18 Romania 4.7 4.7 4.5 4.5 4.5 -5 Russia 5.8 6.2 ... 8.0 ... ... Serbia 2.1 1.9 2.2 1.8 2.5 21 Slovakia 4.6 4.8 5.2 5.6 3.4 -26 Slovenia 4.5 4.5 4.7 3.9 4.5 0 Spain 8.2 8.2 7.8 7.9 7.6 -7 Sweden 5.8 5.7 5.2 5.9 5.9 3 Switzerland 5.5 5.8 6.1 5.6 5.3 -2 TFYR of Macedonia 2.7 2.3 2.6 2.3 2.6 -4 Turkey 3.5 3.5 3.5 3.5 3.6 2 Ukraine 4.9 4.6 4.4 6.0 4.4 -11 UK: England & Wales 5.4 5.4 5.2 5.0 4.9 -9 UK: Northern Ireland ... 3.6 3.6 2.8 3.2 ... UK: Scotland 5.0 5.4 5.4 5.6 5.6 12 Mean 4.9 4.6 4.7 4.8 4.7 Median 4.7 4.7 4.7 4.8 4.6 Minimum 2.1 1.9 2.1 1.8 1.7 Maximum 8.2 8.2 7.8 8.0 8.7

273
Table 4.2.1.4 Prison population as percentage of total stock: Minors
2007 2008 2009 2010 2011
% change 2007-2011
Albania 0.1 1.9 1.3 2.4 1.0 590 Armenia 0.0 0.0 2.6 0.7 0.5 ... Austria 3.4 1.9 2.3 2.0 1.7 -50 Azerbaijan ... 0.0 0.2 0.1 0.0 … Belgium 0.5 0.7 0.7 0.7 0.7 51 Bosnia-Herzegovina … … … ... ... ... Bulgaria 0.8 0.7 0.5 0.6 0.8 3 Croatia 1.1 1.0 1.0 0.8 1.1 1 Cyprus 5.8 5.3 4.5 3.3 2.4 -59 Czech Republic 0.9 1.0 1.0 0.9 0.9 0 Denmark 2.7 0.2 0.5 0.4 0.2 -92 Estonia 2.1 1.3 1.0 1.3 1.6 -24 Finland 0.1 0.2 0.2 0.2 0.2 196 France 1.0 1.1 1.0 1.0 1.0 -8 Georgia 1.9 1.5 1.2 0.9 0.5 -75 Germany 1.0 0.9 0.9 0.9 0.9 -17 Greece 3.6 3.8 4.4 4.4 4.6 27 Hungary 3.0 3.7 3.3 3.4 3.0 0 Iceland 0.9 1.4 1.4 0.0 1.3 54 Ireland ... 1.3 1.3 0.7 0.7 ... Italy 0.9 0.9 0.7 0.7 0.7 -19 Kosovo (UNR) 2.7 3.2 3.8 3.6 3.0 14 Latvia 1.3 1.2 1.3 0.5 0.3 -77 Lithuania 2.4 2.5 2.2 1.7 1.3 -46 Luxembourg 0.5 0.1 0.6 1.0 0.2 -71 Malta 6.0 4.7 5.9 5.7 4.8 -20 Moldova 1.4 0.9 0.5 0.1 0.7 -50 Montenegro ... ... ... ... 0.0 … Netherlands 3.2 2.5 2.1 2.1 1.8 -42 Norway 0.1 0.2 0.4 0.2 0.2 47 Poland 0.0 0.0 0.0 0.0 0.0 -84 Portugal 0.9 0.7 0.3 0.8 0.6 -34 Romania 1.8 1.6 1.8 1.6 1.5 -20 Russia 1.6 1.3 0.9 0.7 ... ... Serbia 2.0 2.4 2.4 2.2 2.2 10 Slovakia 0.6 0.7 1.3 1.1 2.1 230 Slovenia 0.7 0.9 0.3 0.5 0.7 5 Spain 0.0 0.0 0.0 0.0 0.0 ... Sweden 0.0 0.0 0.0 0.0 0.0 (…) Switzerland 0.9 1.2 0.8 0.7 0.5 -49 TFYR of Macedonia 2.0 1.4 0.9 1.4 1.1 -43 Turkey 3.5 1.6 2.3 1.7 1.7 -52 Ukraine ... 0.8 0.6 0.8 0.7 ... UK: England & Wales 3.0 3.0 2.5 1.9 1.9 -39 UK: Northern Ireland ... 3.6 3.0 2.5 2.6 ... UK: Scotland 2.8 2.5 2.1 1.8 1.5 -44 Mean 1.6 1.5 1.5 1.3 1.2 Median 1.1 1.2 1.0 0.9 0.9 Minimum 0.0 0.0 0.0 0.0 0.0 Maximum 6.0 5.3 5.9 5.7 4.8

274
Table 4.2.1.5 Prison population as percentage of total stock: Aliens
2007 2008 2009 2010 2011
% change 2007-2011
Albania ... ... 1.0 1.3 1.5 ... Armenia 1.7 1.8 2.6 1.6 3.7 114 Austria 43.7 39.9 44.4 45.9 45.7 4 Azerbaijan ... 3.4 3.2 2.5 2.0 ... Belgium 41.7 40.0 40.1 40.1 41.3 -1 Bosnia-Herzegovina ... ... ... ... ... ... Bulgaria 2.1 2.0 1.9 1.7 1.7 -16 Croatia 6.7 6.2 5.7 4.7 5.7 -15 Cyprus 53.3 59.6 61.9 58.9 58.0 9 Czech Republic 7.4 7.1 7.5 7.3 7.5 1 Denmark 6.4 9.8 10.3 9.9 12.4 93 Estonia 40.9 ... 39.4 39.8 38.3 -6 Finland 8.3 9.5 9.9 11.1 13.3 61 France 19.4 18.3 18.1 17.8 17.5 -10 Georgia 1.0 1.1 ... 1.7 1.5 41 Germany 26.2 26.2 26.3 26.6 27.0 3 Greece 45.3 48.3 51.8 54.2 58.4 29 Hungary 3.6 3.5 3.9 3.5 3.4 -7 Iceland 13.9 20.7 20.9 16.4 18.8 35 Ireland ... 15.9 15.6 16.1 14.5 ... Italy 37.6 37.4 37.1 36.6 36.0 -4 Kosovo (UNR) 2.9 4.1 4.8 4.9 5.2 83 Latvia 1.3 1.0 1.1 1.3 1.3 0 Lithuania 0.9 1.1 1.4 1.1 1.3 41 Luxembourg 73.4 64.9 68.5 69.4 68.6 -6 Malta 34.3 23.3 43.5 47.8 35.6 4 Moldova 1.2 ... ... 1.6 1.6 34 Montenegro ... ... ... ... 11.4 ... Netherlands 17.8 17.6 18.3 18.3 17.9 1 Norway 20.2 24.0 24.6 30.3 29.6 46 Poland 0.7 0.6 0.7 0.7 0.7 3 Portugal 20.5 20.3 20.4 20.6 20.1 -2 Romania 0.7 0.7 0.8 0.7 0.7 -8 Russia ... 3.0 3.3 3.7 ... ... Serbia 1.6 1.7 1.8 2.8 1.7 3 Slovakia 2.0 1.8 1.6 1.8 1.9 -6 Slovenia 10.5 10.3 10.0 11.0 10.4 0 Spain 33.5 35.4 34.7 35.7 35.4 6 Sweden 21.0 21.7 22.0 22.0 21.0 0 Switzerland 69.7 69.7 70.2 71.6 71.4 2 TFYR of Macedonia 4.1 3.6 3.2 2.7 6.0 46 Turkey 1.2 1.3 1.6 1.8 1.8 45 Ukraine ... 1.6 1.7 1.6 1.7 ... UK: England & Wales 13.9 13.8 13.8 13.1 12.6 -9 UK: Northern Ireland ... 9.3 7.3 7.7 8.6 ... UK: Scotland 2.6 3.3 3.9 3.3 3.3 26 Mean 18.2 16.7 18.1 17.6 17.7 Median 9.4 9.5 10.0 8.8 10.9 Minimum 0.7 0.6 0.7 0.7 0.7 Maximum 73.4 69.7 70.2 71.6 71.4

275
Table 4.2.1.6 Prison population as percentage of aliens, stock: EU citizens
2007 2008 2009 2010 2011
% change 2007-2011
Albania ... ... 33 20 26 ... Armenia ... ... ... ... ... ... Austria 31 ... 34 13 12 -60 Azerbaijan ... ... 0 0 0 ... Belgium 29 29 27 28 29 -2 Bosnia-Herzegovina ... ... ... … … ... Bulgaria ... ... ... 10 ... ... Croatia ... ... 20 13 6 ... Cyprus ... ... 84 33 35 ... Czech Republic 39 45 45 46 44 14 Denmark ... ... 66 72 52 ... Estonia ... ... 2 3 3 ... Finland 48 46 49 55 57 19 France 23 23 23 24 24 3 Georgia ... ... ... ... 3 ... Germany ... ... 29 29 33 ... Greece ... ... ... 94 22 ... Hungary ... ... 53 ... ... ... Iceland 75 76 68 85 71 -5 Ireland ... ... 20 67 66 ... Italy 21 19 18 19 20 -4 Kosovo (UNR) ... ... ... ... ... ... Latvia ... ... ... 13 26 ... Lithuania 21 26 25 22 17 -18 Luxembourg ... ... 104 98 57 ... Malta ... ... ... ... ... ... Moldova ... ... ... ... ... ... Montenegro ... ... ... ... 3 ... Netherlands 22 27 30 31 37 66 Norway 44 41 39 45 46 6 Poland 31 35 39 40 39 25 Portugal ... ... 19 20 22 ... Romania 17 29 29 34 32 94 Russia ... ... ... ... ... ... Serbia ... ... ... 23 37 ... Slovakia 45 41 35 46 36 -19 Slovenia ... ... 20 19 23 ... Spain ... ... 18 18 19 ... Sweden ... ... ... 280 38 ... Switzerland ... ... ... ... ... ... TFYR of Macedonia ... ... 11 12 2 ... Turkey ... ... ... 15 10 ... Ukraine ... ... ... ... 3 ... UK: England & Wales ... ... 26 30 6 ... UK: Northern Ireland ... … 63 65 66 ... UK: Scotland 26 28 24 32 39 55 Mean 34 35 35 41 28 Median 30 30 29 29 26 Minimum 17 19 0 0 0

276
4.2.2 Prison population (including pre-trial detainees): Flow
Table 4.2.2.1 Prison population per 100 000 population: Flow – Total
2007 2008 2009 2010 2011
% change 2007-2011
Albania ... ... 81 117 125 ... Armenia ... ... 150 ... ... ... Austria 162 140 146 146 141 -13 Azerbaijan ... 98 264 ... 91 ... Belgium 163 168 172 174 172 6 Bosnia-Herzegovina ... ... 128 94 ... ... Bulgaria 88 82 85 93 102 15 Croatia 313 299 300 295 293 -6 Cyprus 307 301 352 338 337 10 Czech Republic 187 198 204 193 194 4 Denmark 296 281 289 296 290 -2 Estonia 991 ... ... 192 991 0 Finland 138 138 133 122 120 -13 France 142 139 131 128 135 -4 Georgia 274 ... ... 534 ... ... Germany 134 126 133 140 138 3 Greece 97 ... ... ... ... ... Hungary 203 224 237 250 250 23 Iceland 97 ... 117 101 105 8 Ireland 283 314 351 389 383 35 Italy 153 156 147 140 127 -17 Kosovo (UNR) 276 248 194 173 226 -18 Latvia ... 876 689 704 741 ... Lithuania 318 322 306 302 322 1 Luxembourg 269 234 248 197 213 -21 Malta 124 140 ... 176 ... ... Moldova 286 363 378 390 ... ... Montenegro ... ... ... 553 392 ... Netherlands 285 268 258 251 250 -12 Norway 273 267 251 240 221 -19 Poland 249 236 242 233 232 -7 Portugal 51 48 54 55 59 16 Romania 50 60 58 64 76 51 Russia ... ... ... ... ... ... Serbia 300 329 345 328 369 23 Slovakia 127 136 144 143 138 9 Slovenia 163 162 176 167 187 14 Spain 99 98 109 114 106 7 Sweden 442 422 434 413 414 -6 Switzerland 646 625 694 675 673 4 TFYR of Macedonia 180 217 116 110 109 -40 Turkey 183 109 104 122 109 -41 Ukraine ... ... 188 198 … ... UK: England & Wales 233 246 230 214 215 -8 UK: Northern Ireland 345 348 257 299 329 -4 UK: Scotland 807 766 710 678 706 -13 Mean 256 255 240 251 265 Median 218 229 199 195 214 Minimum 50 48 54 55 59 Maximum 991 876 710 704 991

277
Table 4.2.2.2 Prison population as percentage of total flow: Pre-trial detainees
2007 2008 2009 2010 2011
% change 2007-2011
Albania ... ... ... ... ... ... Armenia ... ... ... ... ... ... Austria 73 ... 70 71 71 -3 Azerbaijan ... 20 ... ... 94 ... Belgium 69 67 66 65 65 -7 Bosnia-Herzegovina ... ... 32 34 ... ... Bulgaria … ... ... ... ... ... Croatia 42 35 35 36 32 -23 Cyprus 46 47 49 53 50 9 Czech Republic 32 31 29 30 30 -4 Denmark ... 64 62 60 ... ... Estonia ... ... ... ... 29 ... Finland 26 26 15 31 32 25 France 62 59 57 57 54 -13 Georgia ... ... ... 12 ... ... Germany 39 42 43 44 47 20 Greece 27 ... ... ... ... ... Hungary 27 25 ... ... ... ... Iceland 41 ... 38 43 34 -16 Ireland 43 38 30 29 27 -37 Italy 93 94 90 88 88 -5 Kosovo (UNR) 27 33 54 40 46 72 Latvia … 58 66 65 67 … Lithuania 56 55 65 64 65 16 Luxembourg 64 50 63 78 63 -1 Malta 59 70 ... 22 ... ... Moldova 26 20 17 20 ... ... Montenegro ... ... ... 19 ... ... Netherlands 48 47 47 47 47 -1 Norway 24 25 31 33 33 36 Poland 31 27 26 24 24 -24 Portugal 49 42 41 42 43 -14 Romania ... ... 17 58 ... ... Russia ... ... ... ... ... ... Serbia 40 41 37 36 32 -20 Slovakia 51 52 47 43 40 -22 Slovenia 28 28 28 27 22 -21 Spain 70 71 60 57 56 -20 Sweden 76 73 76 75 76 0 Switzerland 34 36 35 32 27 -23 TFYR of Macedonia 36 15 7 7 4 -89 Turkey 0 0 0 0 0 ... Ukraine ... ... ... ... ... ... UK: England & Wales 63 61 60 77 78 23 UK: Northern Ireland 48 47 54 52 50 4 UK: Scotland 54 57 56 58 59 9 Mean 46 44 44 44 46 Median 43 42 45 43 46 Minimum 0 0 0 0 0 Maximum 93 94 90 88 94

278
Table 4.2.2.3 Prison population as percentage of total flow: Females
2007 2008 2009 2010 2011
% change 2007-2011
Albania ... ... ... ... ... ... Armenia ... ... ... ... ... ... Austria 8.3 8.9 8.9 ... ... ... Azerbaijan ... ... ... ... ... ... Belgium 7.3 7.1 7.0 6.7 7.1 -3 Bosnia-Herzegovina ... ... ... ... ... ... Bulgaria ... ... ... ... ... ... Croatia 4.6 4.5 4.5 4.9 4.8 5 Cyprus 7.7 8.5 9.7 10.7 11.9 55 Czech Republic ... ... ... ... ... ... Denmark ... ... ... ... ... ... Estonia ... ... ... ... ... ... Finland 8.4 8.0 8.5 8.8 8.4 0 France 4.1 3.8 3.6 3.6 3.7 -9 Georgia ... ... ... ... ... ... Germany ... ... ... ... ... ... Greece ... ... ... ... ... ... Hungary ... ... ... ... ... ... Iceland ... ... ... ... ... ... Ireland ... ... ... ... ... ... Italy 7.9 7.8 7.7 7.6 7.7 -2 Kosovo (UNR) 0.7 0.9 1.0 1.7 1.5 110 Latvia ... ... ... ... ... ... Lithuania 2.7 2.8 2.7 3.2 3.6 32 Luxembourg ... ... ... ... ... ... Malta ... ... ... ... ... ... Moldova ... ... ... ... ... ... Montenegro ... ... ... ... ... ... Netherlands 8.3 8.3 8.0 7.9 7.9 -5 Norway 8.9 9.4 9.5 9.0 8.0 -10 Poland ... ... ... ... ... ... Portugal 7.3 6.6 6.0 6.4 7.0 -5 Romania ... ... ... ... ... ... Russia ... ... ... ... ... ... Serbia 1.1 1.0 1.2 1.0 1.1 0 Slovakia ... ... ... ... ... ... Slovenia 4.1 5.1 3.7 4.5 5.6 36 Spain ... ... ... ... ... ... Sweden 1.7 1.9 1.7 1.7 1.8 3 Switzerland ... ... ... ... ... ... TFYR of Macedonia ... ... ... ... ... ... Turkey 3.5 3.5 4.1 4.0 4.2 18 Ukraine ... ... ... 5.7 ... ... UK: England & Wales ... ... ... ... ... ... UK: Northern Ireland ... ... 6.2 6.6 7.4 ... UK: Scotland 8.3 8.6 8.3 8.1 8.5 3 Mean 5.6 5.7 5.7 5.7 5.9 Median 7.3 6.6 6.1 6.0 7.0 Minimum 0.7 0.9 1.0 1.0 1.1 Maximum 8.9 9.4 9.7 10.7 11.9

279
Table 4.2.2.4 Prison population as percentage of total flow: Minors
2007 2008 2009 2010 2011
% change 2007-2011
Albania ... ... ... ... ... ... Armenia ... ... ... ... ... ... Austria 5.4 5.4 5.8 ... ... ... Azerbaijan ... ... ... ... ... ... Belgium 3.5 3.4 3.3 3.9 3.8 9 Bosnia-Herzegovina ... ... ... ... ... ... Bulgaria ... ... ... ... ... ... Croatia 0.3 0.2 0.3 0.2 0.4 39 Cyprus 8.7 8.6 6.3 5.2 4.0 -54 Czech Republic ... ... ... ... ... ... Denmark ... ... ... ... ... ... Estonia ... ... ... ... ... ... Finland 0.3 0.3 0.5 0.4 0.6 70 France 3.7 3.6 3.5 3.6 3.4 -9 Georgia ... ... ... ... ... ... Germany ... ... ... ... ... ... Greece ... ... ... ... ... ... Hungary ... ... ... ... ... ... Iceland ... ... ... ... ... ... Ireland ... ... ... ... ... ... Italy 1.5 1.2 1.3 1.4 1.6 9 Kosovo (UNR) 1.4 2.0 2.9 2.0 2.2 55 Latvia ... ... ... ... ... ... Lithuania 4.9 5.4 5.4 4.4 3.7 -24 Luxembourg ... ... ... ... ... ... Malta ... ... ... ... ... ... Moldova ... ... ... ... ... ... Montenegro ... ... ... ... ... ... Netherlands 2.5 2.0 1.8 1.6 1.4 -44 Norway 0.4 0.6 0.7 0.7 0.7 63 Poland ... ... ... ... ... ... Portugal 8.6 7.5 7.3 6.7 6.5 -24 Romania ... ... ... ... ... ... Russia ... ... ... ... ... ... Serbia 0.3 0.5 0.4 0.4 0.4 26 Slovakia ... ... ... ... ... ... Slovenia 0.1 0.3 0.3 0.0 0.3 158 Spain ... ... ... ... ... ... Sweden 0.0 0.0 0.0 0.0 0.0 -59 Switzerland ... ... ... ... ... ... TFYR of Macedonia ... ... ... ... ... ... Turkey 0.7 1.6 1.5 1.3 1.5 120 Ukraine ... ... ... ... ... ... UK: England & Wales ... ... ... ... ... ... UK: Northern Ireland ... ... 10.4 10.0 8.2 ... UK: Scotland 5.7 5.2 4.5 3.9 3.5 -39 Mean 2.8 2.8 3.1 2.7 2.5 Median 1.5 2.0 2.4 1.6 1.6 Minimum 0.0 0.0 0.0 0.0 0.0 Maximum 8.7 8.6 10.4 10.0 8.2

280
Table 4.2.2.5 Prison population as percentage of total flow: Aliens
2007 2008 2009 2010 2011 % change
2007-2011 Albania ... ... ... ... ... ... Armenia ... ... ... ... ... ... Austria 20 19 21 ... ... ... Azerbaijan ... ... ... ... ... ... Belgium 41 39 40 42 43 5 Bosnia-Herzegovina ... ... ... ... ... ... Bulgaria ... ... ... ... ... ... Croatia 5 6 6 5 6 17 Cyprus 74 74 75 73 68 -8 Czech Republic ... ... ... ... ... ... Denmark ... ... ... ... ... ... Estonia ... ... ... ... ... ... Finland 8 10 12 13 14 80 France 20 19 19 20 19 -4 Georgia ... ... ... ... ... ... Germany ... ... ... ... ... ... Greece ... ... ... ... ... ... Hungary ... ... ... ... ... ... Iceland ... ... ... ... ... ... Ireland ... ... ... ... ... ... Italy 48 46 46 44 43 -11 Kosovo (UNR) 2 2 2 2 2 -5 Latvia ... ... ... ... ... ... Lithuania 1 1 1 1 1 21 Luxembourg ... ... ... ... ... ... Malta ... ... ... ... ... ... Moldova ... ... ... ... ... ... Montenegro ... ... ... ... ... ... Netherlands 19 19 21 22 23 21 Norway ... ... ... ... ... ... Poland ... ... ... ... ... ... Portugal 21 19 19 20 19 -7 Romania ... ... ... ... ... ... Russia ... ... ... ... ... ... Serbia 5 4 5 10 8 71 Slovakia ... ... ... ... ... ... Slovenia 12 13 10 11 12 -3 Spain ... ... ... ... ... ... Sweden ... ... ... ... ... ... Switzerland ... ... ... ... ... ... TFYR of Macedonia ... ... ... ... ... ... Turkey 0 0 0 0 0 (…) Ukraine ... ... ... ... ... ... UK: England & Wales ... ... ... ... ... ... UK: Northern Ireland ... ... 10 9 9 ... UK: Scotland 4 5 6 5 5 34 Mean 19 18 18 18 18 Median 12 13 11 11 12 Minimum 0 0 0 0 0 Maximum 74 74 75 73 68

281
Table 4.2.2.6 Prison population as percentage of aliens, flow: EU citizens
2007 2008 2009 2010 2011
% change 2007-2011
Belgium 36 36 35 37 38 5 Finland 40 46 53 60 58 46 France 21 21 22 24 26 22 Netherlands 27 29 37 41 45 67 Serbia 29 30 16 8 16 -46 UK: Northern Ireland ... ... 64 72 75 ... UK: Scotland 26 28 32 37 42 62 Mean 30 32 37 40 43 Median 28 30 35 37 42 Minimum 21 21 16 8 16 Maximum 40 46 64 72 75 Notes on Tables 4.2.1.1 to 4.2.1.6
Albania: Pre-trail detainees are excluded in 2007 and only minors who were convicted are included. Since 2010, it is possible to impose alternatives to imprisonment for minors, which might explain the trend change in 2011. Armenia: Data for 2009 refer to 2 February 2009. Denmark: ‘Stock’ refers to average number during the year; however, aliens are counted on 29 November. Estonia: The figures do not include persons in police custody. France: Includes those who served their sentence outside prison (placed under electronic monitoring or outside placement). Netherlands: The rise in the number of EU-aliens reflects better recording of nationality. Poland: Data on aliens refers to 31 December. Sweden: Flow data for females, aliens and minors do not include pre-trial detainees. Turkey: Pre-trial detainees are not included: Since 2009, convicted offenders in prison who are in the appeal process are counted as 'convicted'. Prior to 2009 they were counted as 'pre-trial detainees'. Ukraine: Data about the total prison population in 2011 refer to 1 January 2011. Data about females in prison population for 2007, 2008, 2009 and 2011 excluded pre-trial detainees, while they were included for 2010.

282
4.2.3 Convicted prison population by type of offence on 1st September 2010
4.2.3.1 Convicted prison population in 2010 – all offences
Rate per 100 000
pop. of which %:
Tota
l crim
inal
of
fenc
es
Maj
or tr
affic
of
fenc
es
Inte
ntio
nal
hom
icid
e
Bodi
ly in
jury
(A
ssau
lt)
Aggr
avat
ed
bodi
ly in
jury
Sexu
al a
ssau
lt
Rap
e
Sexu
al a
buse
of
a c
hild
Rob
bery
Thef
t
Dru
g of
fenc
es
Albania 94 ... 41.0 3.7 ... 3.3 ... ... 12.1 9.3 14.4 Armenia 110 ... ... ... ... ... ... ... ... ... ... Austria 67 ... ... ... ... ... ... ... ... ... ... Azerbaijan 193 ... 13.1 4.6 ... ... ... ... 6.1 17.8 ... Belgium 63 6.1 13.9 30.9 8.3 13.7 11.7 7.2 41.3 48.2 36.0 Bulgaria 160 3.4 8.3 2.1 ... 4.6 2.9 ... 13.3 36.3 5.5 Croatia 86 4.3 11.2 3.8 ... 7.5 4.1 1.9 10.7 18.6 23.1 Cyprus 61 1.2 10.2 2.8 ... ... ... ... 5.2 24.4 28.1 Czech Republic 186 ... 6.4 6.3 2.9 ... 2.6 1.1 15.0 43.7 10.7 Denmark 46 ... 8.1 19.7 ... 4.9 1.1 ... 14.5 21.1 20.9 Estonia 196 4.2 20.2 6.7 3.8 4.3 3.5 0.3 19.1 14.1 21.3 Finland 51 12.4 22.0 20.8 ... ... ... ... 7.4 10.7 15.6 France 79 ... 6.7 26.2 ... 14.8 ... 9.3 ... 12.3 14.1 Georgia 534 3.4 1.5 1.8 ... 0.4 ... ... 2.3 17.1 7.8 Germany 74 4.3 7.5 12.2 7.6 7.1 6.6 3.2 12.2 20.3 14.6 Greece 133 ... 5.4 1.7 0.6 ... 1.1 ... 5.6 16.4 31.3 Hungary 121 1.2 9.8 7.1 ... 2.0 2.0 ... 19.6 25.3 3.0 Iceland 48 7.2 7.8 5.2 4.6 19.0 5.9 12.4 4.6 11.8 34.6 Ireland 83 ... 10.1 13.8 ... ... 4.3 ... 2.5 17.5 22.2 Italy 113 ... 8.8 0.1 ... ... 2.9 ... 7.5 3.1 20.9 Kosovo (UNR) 38 1.5 31.0 ... 5.2 ... 4.4 0.6 9.9 31.1 9.2 Latvia 216 ... 12.0 8.4 ... 6.6 4.7 ... 32.0 22.2 15.0 Lithuania 239 ... 22.9 5.7 5.7 ... 5.3 ... 16.1 22.5 9.4 Luxembourg 79 ... 12.4 6.8 ... ... 2.8 ... 10.4 17.4 36.1 Malta 56 ... ... ... ... ... ... ... 221.0 ... ... Moldova 151 ... 24.2 9.2 ... ... ... ... ... 22.5 4.3 Montenegro ... ... ... ... ... ... ... ... ... ... ... Netherlands 87 0.7 5.4 1.4 ... 1.2 0.5 ... 4.7 1.9 7.4 Norway 53 7.0 5.3 14.0 11.3 11.7 6.1 ... 5.5 10.2 27.8 Poland 188 8.0 6.8 ... ... ... 2.6 ... 16.0 22.4 ... Portugal 87 7.6 12.3 3.8 ... 4.9 2.5 ... 12.4 13.7 21.0 Romania 132 ... 21.8 1.0 0.6 6.8 6.4 0.3 18.2 29.3 5.4 Russia ... ... ... ... ... ... ... ... ... ... ... Serbia 105 3.8 2.7 4.1 ... ... 1.2 ... 9.9 28.1 18.1 Slovakia 171 ... 5.3 4.7 ... 3.3 1.5 ... 13.7 17.8 5.0 Slovenia 45 ... 11.0 3.0 ... 13.9 3.7 ... 15.3 17.0 9.6 Spain 131 ... 5.6 5.3 ... ... 4.2 ... ... ... 27.6 Sweden 61 2.8 10.1 7.8 7.8 7.7 4.6 ... 9.2 3.9 22.5 Switzerland 40 3.2 12.5 3.0 ... 9.5 4.2 1.8 7.7 15.5 23.0 TFYR of Macedonia 99 ... 11.3 2.2 ... ... 2.3 ... 11.7 31.7 15.5 Turkey 61 ... 6.7 18.9 ... 2.0 1.4 ... 4.0 14.7 9.9 Ukraine 332 ... 12.0 8.9 7.1 ... 1.7 ... 10.5 18.4 13.3 UK: England & Wales 128 1.3 10.1 18.4 ... 13.1 6.4 ... 12.5 9.7 15.6 UK: Northern Ireland 58 3.6 15.8 45.5 ... 13.0 3.9 ... 9.6 2.6 6.7 UK: Scotland 123 2.1 15.8 19.5 12.3 3.6 2.7 0.3 6.0 9.9 13.5 Mean 120 4.3 12.1 9.5 6.0 7.4 3.7 3.5 17.2 18.7 16.8 Median 94 3.6 10.2 6.0 5.7 6.7 3.5 1.8 10.6 17.5 15.2 Minimum 38 0.7 1.5 0.1 0.6 0.4 0.5 0.3 2.3 1.9 3.0 Maximum 534 12.4 41.0 45.5 12.3 19.0 11.7 12.4 221.0 48.2 36.1

283
Table 4.2.3.2 Convicted prison population in 2010 – Criminal offences: Total
Rate per 100 000
pop.
of which % of Females
of which % of Minors
of which % of Aliens
% of EU citizens
amongst Aliens
Albania 94 ... 0.4 ... ... Armenia 110 ... ... ... ... Austria 67 ... ... ... ... Azerbaijan 193 ... ... ... ... Belgium 63 3.6 0.1 38.1 23.3 Bosnia-Herzegovina ... ... ... ... ... Bulgaria 160 ... ... ... ... Croatia 86 5.0 ... ... ... Cyprus 61 5.2 3.4 75.2 ... Czech Republic 186 ... ... ... ... Denmark 46 ... ... ... ... Estonia 196 5.1 0.9 39.0 2.2 Finland 51 7.1 0.1 7.8 49.5 France 79 3.2 0.6 ... ... Georgia 534 5.0 0.9 ... ... Germany 74 5.1 1.1 22.0 ... Greece 133 6.3 ... 48.5 2.7 Hungary 121 6.4 2.7 2.7 29.9 Iceland 48 3.3 0.0 13.7 85.7 Ireland 83 ... ... ... ... Italy 113 4.4 0.7 36.6 19.2 Kosovo (UNR) 38 2.4 2.9 1.5 ... Latvia 216 ... ... ... ... Lithuania 239 4.4 1.3 0.8 17.5 Luxembourg 79 ... ... ... ... Malta 56 ... ... ... ... Moldova 151 ... ... ... ... Montenegro ... ... ... ... ... Netherlands 87 7.1 2.1 8.1 26.6 Norway 53 5.9 ... ... ... Poland 188 ... ... ... ... Portugal 87 4.8 0.1 17.1 ... Romania 132 4.5 1.6 0.7 33.8 Russia ... ... ... ... ... Serbia 105 3.1 1.1 ... ... Slovakia 171 6.0 1.1 2.2 36.3 Slovenia 45 ... ... ... ... Spain 131 ... ... ... ... Sweden 61 5.9 ... ... ... Switzerland 40 6.5 ... 77.5 ... TFYR of Macedonia 99 ... ... ... ... Turkey 61 7.9 2.6 0.6 ... Ukraine 332 6.0 0.8 ... ... UK: England & Wales 128 4.8 11.0 10.1 ... UK: Northern Ireland 58 2.4 1.2 5.1 71.7 UK: Scotland 123 5.1 1.4 2.7 30.9 Mean 120 5.1 1.6 20.5 33.0 Median 94 5.1 1.1 9.1 29.9 Minimum 38 2.4 0.0 0.6 2.2 Maximum 534 7.9 11.0 77.5 85.7

284
Table 4.2.3.3 Convicted prison population in 2010 – Major traffic offences
Rate per 100 000
pop. of which % of Females
of which % of Minors
of which % of Aliens
% of EU citizens
amongst Aliens
Albania ... ... ... ... ... Armenia ... ... ... ... ... Austria ... ... ... ... ... Azerbaijan ... ... ... ... ... Belgium 3.8 1.2 0.0 22.6 26.6 Bosnia-Herzegovina ... ... ... ... ... Bulgaria 5.5 ... ... ... ... Croatia 3.7 0.6 ... ... ... Cyprus 0.7 ... ... ... ... Czech Republic ... ... ... ... ... Denmark ... ... ... ... ... Estonia 8.3 0.0 0.0 18.9 0.0 Finland 6.3 3.3 ... 1.2 75.0 France ... ... ... ... ... Georgia 18.2 ... ... ... ... Germany 3.2 1.8 0.1 ... ... Greece ... ... ... ... ... Hungary 1.4 0.7 2.8 0.7 0.0 Iceland 3.5 18.2 0.0 27.3 100.0 Ireland ... ... ... ... ... Italy ... ... ... ... ... Kosovo (UNR) 0.6 7.7 ... ... ... Latvia ... ... ... ... ... Lithuania ... ... ... ... ... Luxembourg ... ... ... ... ... Malta ... ... ... ... ... Moldova ... ... ... ... ... Montenegro ... ... ... ... ... Netherlands 0.6 1.0 ... 16.8 23.5 Norway 3.7 10.6 ... ... ... Poland 15.0 ... ... ... ... Portugal 6.7 2.3 0.1 8.3 ... Romania ... ... ... ... ... Russia ... ... ... ... ... Serbia 4.0 ... 0.0 ... ... Slovakia ... ... ... ... ... Slovenia ... ... ... ... ... Spain ... ... ... ... ... Sweden 1.7 6.7 ... ... ... Switzerland 1.3 ... ... ... ... TFYR of Macedonia ... ... ... ... ... Turkey ... ... ... ... ... Ukraine ... ... ... ... ... UK: England & Wales 1.7 2.3 9.6 11.5 ... UK: Northern Ireland 2.1 0.0 2.7 5.4 100.0 UK: Scotland 2.6 3.7 0.0 2.9 75.0 Mean 4.5 4.0 1.5 11.6 50.0 Median 3.5 2.3 0.1 9.9 50.8 Minimum 0.6 0.0 0.0 0.7 0.0 Maximum 18.2 18.2 9.6 27.3 100.0

285
Table 4.2.3.4 Convicted prison population in 2010 – Intentional homicide: Total
Rate per 100 000
pop.
of which % of Females
of which % of Minors
of which % of Aliens
% of EU citizens
amongst Aliens
Albania 39 ... ... ... ... Armenia ... ... ... ... ... Austria ... ... ... ... ... Azerbaijan 25 ... ... ... ... Belgium 9 5.4 0.0 26.2 31.0 Bosnia-Herzegovina 12 ... ... ... ... Bulgaria 13 ... ... ... ... Croatia 10 4.0 ... ... ... Cyprus 6 ... ... ... ... Czech Republic 12 7.7 ... ... ... Denmark 4 ... ... ... ... Estonia 40 4.7 0.0 38.3 0.5 Finland 11 9.7 0.2 3.7 27.3 France 5 7.2 0.1 ... ... Georgia 8 ... ... ... ... Germany 6 6.8 0.4 ... ... Greece 7 4.4 1.5 32.0 3.4 Hungary 12 8.6 2.5 2.4 35.7 Iceland 4 8.3 0.0 16.7 50.0 Ireland 8 ... ... ... ... Italy 10 ... ... ... ... Kosovo (UNR) 12 4.2 4.6 ... ... Latvia 26 ... ... ... ... Lithuania 55 4.5 0.6 0.9 ... Luxembourg 10 ... ... ... ... Malta ... ... ... ... ... Moldova 37 ... ... ... ... Montenegro ... ... ... ... ... Netherlands 5 4.3 ... 18.9 24.8 Norway 3 10.3 ... ... ... Poland 13 ... ... ... ... Portugal 11 3.8 ... 13.2 ... Romania 29 ... 0.7 ... ... Russia ... ... ... ... ... Serbia 3 ... 6.8 ... ... Slovakia 9 ... ... ... ... Slovenia 5 ... ... ... ... Spain 7 ... ... ... ... Sweden 6 6.6 ... ... ... Switzerland 5 ... ... ... ... TFYR of Macedonia 11 ... ... ... ... Turkey 4 4.1 6.2 0.2 ... Ukraine 40 7.3 ... ... ... UK: England & Wales 13 ... ... ... ... UK: Northern Ireland 9 3.7 0.0 4.3 57.1 UK: Scotland 20 4.8 0.6 1.5 53.3 Mean 14 6.0 1.6 13.2 31.5 Median 10 5.1 0.6 8.7 31.0 Minimum 3 3.7 0.0 0.2 0.5 Maximum 55 10.3 6.8 38.3 57.1

286
Table 4.2.3.5 Convicted prison population in 2010 – Bodily injury (Assault): Total
Rate per 100 000
pop. of which % of Females
of which % of Minors
of which % of Aliens
% of EU citizens
amongst Aliens
Albania 3.5 ... ... ... ... Armenia ... ... ... ... ... Austria ... ... ... ... ... Azerbaijan 8.9 ... ... ... ... Belgium 19.4 1.8 0.0 28.9 22.4 Bosnia-Herzegovina 2.6 ... ... ... ... Bulgaria 3.4 ... ... ... ... Croatia 3.3 3.5 ... ... ... Cyprus 1.7 ... ... ... ... Czech Republic 11.8 2.8 ... ... ... Denmark 9.0 ... ... ... ... Estonia 13.2 6.2 1.1 30.5 1.9 Finland 10.6 7.0 ... 2.5 35.7 France 20.7 2.2 0.8 ... ... Georgia 9.5 ... ... ... ... Germany 9.1 2.7 2.0 ... ... Greece 2.3 3.9 4.3 30.6 7.6 Hungary 8.6 2.7 2.7 1.2 30.0 Iceland 2.5 0.0 0.0 12.5 100.0 Ireland 11.4 ... ... ... ... Italy 0.1 ... ... ... ... Kosovo (UNR) ... ... ... ... ... Latvia 18.2 ... ... ... ... Lithuania 13.5 4.0 0.9 0.2 ... Luxembourg 5.4 ... ... ... ... Malta ... ... ... ... ... Moldova 13.9 ... ... ... ... Montenegro ... ... ... ... ... Netherlands 1.2 4.0 ... 13.4 25.9 Norway 7.5 3.3 ... ... ... Poland ... ... ... ... ... Portugal 3.4 2.5 ... 11.7 ... Romania 1.4 ... 1.0 ... ... Russia ... ... ... ... ... Serbia 4.3 ... 0.0 ... ... Slovakia 8.0 ... ... ... ... Slovenia 1.4 ... ... ... ... Spain 6.9 ... ... ... ... Sweden 4.8 ... ... ... ... Switzerland 1.2 ... ... ... ... TFYR of Macedonia 2.1 ... ... ... ... Turkey 11.6 2.6 1.0 0.0 ... Ukraine 29.7 ... ... ... ... UK: England & Wales 23.6 ... ... ... ... UK: Northern Ireland 26.2 3.8 1.1 5.3 68.0 UK: Scotland 24.1 5.2 3.1 1.0 38.5 Mean 9.2 3.4 1.4 11.5 36.7 Median 8.0 3.3 1.0 8.5 30.0 Minimum 0.1 0.0 0.0 0.0 1.9 Maximum 29.7 7.0 4.3 30.6 100.0

287
Table 4.2.3.6 Convicted prison population in 2010 – Bodily injury (Assault): Aggravated bodily injury
Rate per 100 000
pop.
of which % of Females
of which % of Minors
of which % of Aliens
% of EU citizens
amongst Aliens
Albania ... ... ... ... ... Armenia ... ... ... ... ... Austria ... ... ... ... ... Azerbaijan ... ... ... ... ... Belgium 5.2 2.8 0.0 30.1 28.7 Bosnia-Herzegovina ... ... ... ... ... Bulgaria ... ... ... ... ... Croatia ... ... ... ... ... Cyprus ... ... ... ... ... Czech Republic 5.4 4.8 ... ... ... Denmark ... ... ... ... ... Estonia 7.5 8.0 1.0 41.0 0.0 Finland ... ... ... ... ... France ... ... ... ... ... Georgia ... ... ... ... ... Germany 5.7 2.5 2.4 ... ... Greece 0.8 4.3 5.4 29.3 7.4 Hungary ... ... ... ... ... Iceland 2.2 0.0 0.0 14.3 100.0 Ireland ... ... ... ... ... Italy ... ... ... ... ... Kosovo (UNR) 2.0 ... 9.1 ... ... Latvia ... ... ... ... ... Lithuania 13.5 4.0 0.9 0.2 ... Luxembourg ... ... ... ... ... Malta ... ... ... ... ... Moldova ... ... ... ... ... Montenegro ... ... ... ... ... Netherlands ... ... ... ... ... Norway 6.0 2.7 ... ... ... Poland ... ... ... ... ... Portugal ... ... ... ... ... Romania 0.8 ... 0.6 ... ... Russia ... ... ... ... ... Serbia ... ... ... ... ... Slovakia ... ... ... ... ... Slovenia ... ... ... ... ... Spain ... ... ... ... ... Sweden 4.8 4.9 ... ... ... Switzerland ... ... ... ... ... TFYR of Macedonia ... ... ... ... ... Turkey ... ... ... ... ... Ukraine 23.7 6.6 ... ... ... UK: England & Wales ... ... ... ... ... UK: Northern Ireland ... ... ... ... ... UK: Scotland 15.2 4.8 3.0 1.0 37.5 Mean 7.1 4.1 2.5 19.3 34.7 Median 5.4 4.3 1.0 21.8 28.7 Minimum 0.8 0.0 0.0 0.2 0.0 Maximum 23.7 8.0 9.1 41.0 100.0

288
Table 4.2.3.7 Convicted prison population in 2010 – Sexual assault: Total
Rate per 100 000
pop. of which % of Females
of which % of Minors
of which % of Aliens
% of EU citizens
amongst Aliens
Albania 3.1 ... ... ... ... Armenia ... ... ... ... ... Austria ... ... ... ... ... Azerbaijan ... ... ... ... ... Belgium 8.6 0.9 0.0 22.9 31.9 Bosnia-Herzegovina ... ... ... ... ... Bulgaria 7.4 ... ... ... ... Croatia 6.5 0.3 ... ... ... Cyprus ... ... ... ... ... Czech Republic ... ... ... ... ... Denmark 2.2 ... ... ... ... Estonia 8.4 0.0 0.0 21.4 0.0 Finland ... ... ... ... ... France 11.7 1.3 0.2 ... ... Georgia 2.2 ... ... ... ... Germany 5.3 0.4 0.7 ... ... Greece ... ... ... ... ... Hungary 2.5 0.4 4.0 0.8 0.0 Iceland 9.1 0.0 0.0 3.4 100.0 Ireland ... ... ... ... ... Italy ... ... ... ... ... Kosovo (UNR) ... ... ... ... ... Latvia 14.3 ... ... ... ... Lithuania ... ... ... ... ... Luxembourg ... ... ... ... ... Malta ... ... ... ... ... Moldova ... ... ... ... ... Montenegro ... ... ... ... ... Netherlands 1.0 0.6 ... 12.0 25.0 Norway 6.2 0.7 ... ... ... Poland ... ... ... ... ... Portugal 4.3 ... 0.4 14.8 ... Romania 8.9 ... 2.2 ... ... Russia ... ... ... ... ... Serbia ... ... ... ... ... Slovakia 5.6 ... ... ... ... Slovenia 6.3 ... ... ... ... Spain ... ... ... ... ... Sweden 4.7 0.5 ... ... ... Switzerland 3.8 ... ... ... ... TFYR of Macedonia ... ... ... ... ... Turkey 1.3 1.5 10.9 0.0 ... Ukraine ... ... ... ... ... UK: England & Wales 16.8 0.9 5.0 10.8 ... UK: Northern Ireland 7.5 0.0 0.7 6.7 55.6 UK: Scotland 4.5 0.4 1.3 5.2 33.3 Mean 6.3 0.6 2.1 9.8 35.1 Median 5.9 0.4 0.7 8.7 31.9 Minimum 1.0 0.0 0.0 0.0 0.0 Maximum 16.8 1.5 10.9 22.9 100.0

289
Table 4.2.3.8 Convicted prison population in 2010 – Sexual assault: Rape
Rate per 100 000
pop. of which % of Females
of which % of Minors
of which % of Aliens
% of EU citizens
amongst Aliens
Belgium 7.4 0.5 0.0 23.8 32.6 Czech Republic 4.8 0.6 ... ... ... Estonia 6.9 0.0 0.0 20.7 0.0 Greece 1.5 0.6 1.2 38.8 4.5 Hungary 2.4 0.0 4.1 0.0 ... Iceland 2.8 0.0 0.0 11.1 100.0 Lithuania 12.7 0.7 3.8 0.2 ... Netherlands 0.4 0.0 ... 12.9 22.2 Portugal 2.2 ... 0.9 17.6 ... Romania 8.4 ... 2.3 ... ... Serbia 1.2 ... 1.1 ... ... Ukraine 5.7 0.6 ... ... ... UK: Northern Ireland 2.2 0.0 2.5 20.0 62.5 UK: Scotland 3.3 0.6 1.7 6.4 36.4 Mean 3.9 0.3 1.6 15.1 36.9 Median 3.1 0.3 1.2 15.2 32.6 Minimum 0.4 0.0 0.0 0.0 0.0 Maximum 12.7 0.7 4.1 38.8 100.0 Table 4.2.3.9 Convicted prison population in 2010 – Sexual abuse of a child
Rate per 100 000
pop.
of which % of Females
of which % of Minors
of which % of Aliens
% of EU citizens
amongst Aliens
Belgium 4.5 1.0 0.0 12.4 50.8 Croatia 1.7 1.4 ... ... ... Czech Republic 2.1 2.7 ... ... ... Estonia 0.7 0.0 0.0 33.3 0.0 France 7.3 1.6 0.2 ... ... Germany 2.4 0.7 0.6 ... ... Iceland 6.0 0.0 0.0 0.0 ... Romania 0.4 ... 2.3 ... ... UK: Scotland 0.3 0.0 0.0 0.0 ... Mean 2.4 0.9 0.4 11.4 25.4 Median 1.7 0.8 0.0 6.2 25.4 Minimum 0.2 0.0 0.0 0.0 0.0 Maximum 7.3 2.7 2.3 33.3 50.8

290
Table 4.2.3.10 Convicted prison population in 2010 – Robbery
Rate per 100 000
pop. of which % of Females
of which % of Minors
of which % of Aliens
% of EU citizens
amongst Aliens
Albania 11 ... ... ... ... Armenia ... ... ... ... ... Austria ... ... ... ... ... Azerbaijan 12 ... ... ... ... Belgium 26 2.3 0.1 39.4 17.7 Bosnia-Herzegovina 10 ... ... ... ... Bulgaria 21 ... ... ... ... Croatia 9 2.9 ... ... ... Cyprus 3 ... ... ... ... Czech Republic 28 3.5 ... ... ... Denmark 7 ... ... ... ... Estonia 37 2.8 2.2 44.2 3.2 Finland 4 7.0 1.0 10.0 65.0 France ... ... ... ... ... Georgia 13 ... ... ... ... Germany 9 2.5 2.9 ... ... Greece 8 1.9 5.2 38.2 2.2 Hungary 24 5.9 2.7 2.0 31.3 Iceland 2 0.0 0.0 0.0 ... Ireland 2 ... ... ... ... Italy 8 ... ... ... ... Kosovo (UNR) 4 2.4 2.4 ... ... Latvia 69 ... ... ... ... Lithuania 38 1.9 3.0 0.4 ... Luxembourg 8 ... ... ... ... Malta 124 ... ... ... ... Moldova ... ... ... ... ... Montenegro ... ... ... ... ... Netherlands 4 2.7 ... 15.2 21.6 Norway 3 2.8 ... ... ... Poland 30 ... ... ... ... Portugal 11 2.2 0.2 7.1 ... Romania 24 ... 2.9 ... ... Russia ... ... ... ... ... Serbia 10 ... 2.4 ... ... Slovakia 23 ... ... ... ... Slovenia 7 ... ... ... ... Spain ... ... ... ... ... Sweden 6 2.7 ... ... ... Switzerland 3 ... ... ... ... TFYR of Macedonia 12 ... ... ... ... Turkey 2 3.4 25.9 0.4 ... Ukraine 35 3.0 ... ... ... UK: England & Wales 16 3.1 20.1 7.1 ... UK: Northern Ireland 6 0.0 1.0 0.0 ... UK: Scotland 7 1.5 1.3 2.1 62.5 Mean 17 2.7 4.6 12.8 29.0 Median 10 2.7 2.4 7.1 21.6 Minimum 2 0.0 0.0 0.0 2.2 Maximum 124 7.0 25.9 44.2 65.0

291
Table 4.2.3.11 Convicted prison population in 2010 – Theft: Total
Rate per 100 000
pop. of which % of Females
of which % of Minors
of which % of Aliens
% of EU citizens
amongst Aliens
Albania 9 ... ... ... ... Armenia ... ... ... ... ... Austria ... ... ... ... ... Azerbaijan 34 ... ... ... ... Belgium 30 2.6 0.0 36.3 20.1 Bosnia-Herzegovina 12 ... ... ... ... Bulgaria 58 ... ... ... ... Croatia 16 4.1 ... ... ... Cyprus 15 ... ... ... ... Czech Republic 81 7.1 ... ... ... Denmark 10 ... ... ... ... Estonia 28 7.5 1.6 38.8 3.5 Finland 5 6.5 ... 10.6 58.1 France 10 3.7 1.6 ... ... Georgia 91 ... ... ... ... Germany 15 6.3 1.5 ... ... Greece 22 8.3 6.4 35.9 3.2 Hungary 31 6.5 2.6 0.4 66.7 Iceland 6 5.6 0.0 5.6 100.0 Ireland 14 ... ... ... ... Italy 3 ... ... ... ... Kosovo (UNR) 12 0.8 2.7 ... ... Latvia 48 ... ... ... ... Lithuania 54 4.7 1.7 0.2 ... Luxembourg 14 ... ... ... ... Malta ... ... ... ... ... Moldova 34 ... ... ... ... Montenegro ... ... ... ... ... Netherlands 2 7.8 ... 22.6 41.0 Norway 5 4.6 ... ... ... Poland 42 ... ... ... ... Portugal 12 2.3 0.1 17.2 ... Romania 39 ... 2.5 ... ... Russia ... ... ... ... ... Serbia 29 ... 1.7 ... ... Slovakia 30 ... ... ... ... Slovenia 8 ... ... ... ... Spain ... ... ... ... ... Sweden 2 5.4 ... ... ... Switzerland 6 ... ... ... ... TFYR of Macedonia 32 ... ... ... ... Turkey 9 6.0 6.3 0.4 ... Ukraine 61 5.0 ... ... ... UK: England & Wales 12 6.4 5.8 5.2 ... UK: Northern Ireland 2 0.0 0.0 11.1 100.0 UK: Scotland 12 9.4 1.4 2.0 76.9 Mean 24 5.3 2.2 14.3 52.1 Median 15 5.6 1.7 10.6 58.1 Minimum 2 0.0 0.0 0.2 3.2 Maximum 91 7.8 6.4 38.8 100.0

292
Table 4.2.3.12 Convicted prison population in 2010 – Drug offences: Total
Rate per 100 000
pop. of which % of Females
of which % of Minors
of which % of Aliens
% of EU citizens
amongst Aliens
Albania 13 ... ... ... ... Armenia ... ... ... ... ... Austria ... ... ... ... ... Azerbaijan ... ... ... ... ... Belgium 23 4.1 0.0 42.1 17.4 Bosnia-Herzegovina 6 ... ... ... ... Bulgaria 9 ... ... ... ... Croatia 20 4.8 ... ... ... Cyprus 17 ... ... ... ... Czech Republic 20 7.6 ... ... ... Denmark 10 ... ... ... ... Estonia 42 8.9 0.2 48.0 3.0 Finland 8 7.1 ... 22.9 48.5 France 11 3.2 0.2 ... ... Georgia 42 ... ... ... ... Germany 11 5.7 0.1 ... ... Greece 42 5.8 0.4 ... ... Hungary 4 5.6 2.2 11.4 48.8 Iceland 17 1.9 0.0 20.8 81.8 Ireland 18 ... ... ... ... Italy 24 ... ... ... ... Kosovo (UNR) 4 1.3 1.3 ... ... Latvia 32 ... ... ... ... Lithuania 22 13.0 0.0 1.6 ... Luxembourg 28 ... ... ... ... Malta ... ... ... ... ... Moldova 7 ... ... ... ... Montenegro ... ... ... ... ... Netherlands 6 12.8 ... 33.4 22.8 Norway 15 7.8 ... ... ... Poland ... ... ... ... ... Portugal 18 12.3 ... 34.6 ... Romania 7 ... 0.0 ... ... Russia ... ... ... ... ... Serbia 19 ... 0.3 ... ... Slovakia 9 ... ... ... ... Slovenia 4 ... ... ... ... Spain 36 ... ... ... ... Sweden 14 6.4 ... ... ... Switzerland 9 ... ... ... ... TFYR of Macedonia 15 ... ... ... ... Turkey 6 2.2 1.4 4.1 ... Ukraine 44 ... ... ... ... UK: England & Wales 20 7.5 6.2 16.4 ... UK: Northern Ireland 4 1.4 0.0 4.3 33.3 UK: Scotland 17 7.8 0.1 7.9 1.4 Mean 17 6.4 0.8 20.6 32.1 Median 15 6.1 0.2 18.6 28.1 Minimum 4 1.3 0.0 1.6 1.4 Maximum 44 13.0 6.2 48.0 81.8 Notes on Tables 4.2.3.1 to 4.2.3.12
Turkey: Stock data did not allow an offence breakdown, and so flow data has been used.

293
4.3 Technical information
4.3.1 Stock
– Pre-trial detainees are included in all countries. – Untried detainees (i.e., no court decision reached yet) are included in all countries. – Persons convicted but not yet sentenced are included in all countries where this was
possible except Cyprus and Greece. – Sentenced detainees who have appealed or who are within the statutory limit for doing so
are included in all countries except Greece, Kosovo, Romania, Turkey, and UK: England and Wales.
- Fine defaulters are included in all countries except Armenia, Bulgaria, France, Georgia, Portugal, Romania, Slovakia and Ukraine.
– Persons held in institutions for juvenile offenders are included in all countries except Finland, Poland, Spain, Sweden and Turkey.
– Persons held in institutions for drug-addict offences are included in all countries except Croatia, Czech Republic, Estonia, Finland, France, Georgia, Germany, Norway, Poland, Portugal, Romania, Slovenia, Spain, Sweden, Switzerland, Turkey, and UK: Northern Ireland.
– Mentally ill offenders held in psychiatric institutions or hospitals are included in all countries except Albania, Croatia, Czech Republic, Denmark, Estonia, Finland, Georgia, Germany, Italy, Latvia, Lithuania, Norway, Poland, Romania, Slovenia, Spain, Sweden, Switzerland, Turkey, Ukraine, UK: Northern Ireland.
– Offenders serving their sentence under electronic surveillance are excluded in all countries except Austria, Belgium, Bulgaria, Denmark, Finland, France, the Netherlands, Russia, Spain, and UK: Scotland.
– Persons held in facilities under the responsibility of any ministry other than the Ministry of Justice are excluded in all countries except Armenia, Belgium, Denmark, Georgia, Italy and Turkey.
– Asylum seekers or illegal aliens held for administrative reasons are excluded in all countries except Ireland and Switzerland.
4.3.2 Flow
– Entry following a transfer from one penal institution to another in the same country is excluded in all countries except in Estonia, Iceland, Kosovo, Latvia, Poland, Romania, Serbia, Switzerland, Ukraine, and UK: Northern Ireland.
– Entry following the detainee’s removal from the institution in order to appear before a judicial authority is excluded in all countries except Estonia, Kosovo, Sweden and Switzerland.
– Entry following prison leave or a period of absence by permission is excluded in all countries except Cyprus, Estonia, Kosovo, Latvia, Romania, and Switzerland.
- Entry following an escape, after re-arrest by the police is excluded in all countries except Iceland, Kosovo, Latvia, Romania, Switzerland and Ukraine.
4.3.3 Description of data recording methods for Tables on Stock and Flow
The reference date: Stock data refers to 1 September: Stock data refers to another date: Stock data refers to average
stock:
Albania, Armenia, Belgium, Bulgaria, Cyprus, Georgia, Iceland, Kosovo, Malta, Norway, Russia, Slovakia, Slovenia, Switzerland, Ukraine, UK: Northern Ireland, UK: Scotland.
Germany (31st March) UK: England and Wales (30th June) Ireland (31stAugust) France, Sweden (1st October) Croatia, Czech Republic , Portugal, Serbia, Spain (31stDecember) Estonia, Finland, Hungary, Italy, Latvia, Lithuania, Netherlands, Poland, Romania, Turkey (date not specified).
Denmark.

294
Minors: Minors are included in the total of Tables for Stock and Flow:
Minors are not included in the total of Tables for Stock and Flow:
Minors are partially included in the total of Tables for Stock and Flow:
Albania, Armenia, Austria, Belgium, Bulgaria, Croatia, Cyprus, Czech Republic, Denmark, Estonia, Finland, France, Georgia, Germany, Greece, Hungary, Iceland, Ireland, Italy, Kosovo, Latvia, Lithuania, Malta, Netherlands, Norway, Romania, Russia, Serbia, Slovakia, Slovenia, Sweden, Switzerland, Ukraine, UK: England and Wales, UK: Northern Ireland, UK: Scotland.
Spain. Poland, Portugal, Turkey.
Notes regarding minors
Denmark: There are no minors sentenced to a special youth sanction that they serve under the Social Authorities or in pre-trial detention outside the prison service. Norway: Minors, where identified, applies to the age category between the age of criminal responsibility in Norway - 15 - and 18. Children under the age of criminal responsibility are never dealt with by the prison or probation system. Poland: Only minors convicted of the most serious offences. Portugal: Only minors between 16 and 18 years old (stock) and between 16 and 20 (flow). Spain: In Spain, juvenile offenders are under the responsibility of authorities other than the Prison Administration and not included. Turkey: Only minors who are in adult prisons are included.
Four countries apply a different age bracket for minors in correctional statistics compared to the one used in conviction statistics: Cyprus (15-21), Malta (9-18), UK: England and Wales (under 21), and UK: Scotland (16-18).
Written rules: Countries having written rules regulating the way in which the data shown for Stock and Flow are recorded:
Countries without written rules regulating the way in which the data shown for Stock and Flow are recorded:
Albania, Armenia, Austria, Belgium, Estonia, Finland, France, Germany, Hungary, Iceland, Kosovo, Latvia, Netherlands, Poland, Romania, Russia, Serbia, Slovenia, Sweden, Switzerland, Turkey, UK: England and Wales, UK: Scotland.
Bulgaria, Croatia, Cyprus, Czech Republic, Denmark, Georgia, Greece, Italy, Lithuania, Slovakia, Spain, UK: Northern Ireland.
Changes in data recording methods:
Three countries changed their data recording methods between 2007 and 2011: Austria, Romania and Turkey.

295
4.3.4 Description of data recording methods for Tables on the convicted population
The reference date: Stock data refers to 1 September 2010:
Stock data refers to another date: Stock data refers to average stock
Albania, Armenia, Belgium, Bulgaria, Cyprus, Georgia, Iceland, Kosovo, Malta, Norway, Romania, Russia, Slovakia, Slovenia, Switzerland, Ukraine, UK: Northern Ireland, UK: Scotland.
Germany (31 March 2010) UK: England and Wales(30 June 2010) Ireland (31 August 2010) Netherlands (30 September 2010) France, Sweden (1 October 2010) Denmark (14 December 2010) Croatia, Portugal, Serbia, Spain (31
December 2010) Estonia, Greece (1 September 2011) Czech Republic (31 December 2011) Hungary (1 April 2013) Finland, Italy, Latvia, Lithuania, Poland, Turkey (date not specified)
Denmark
Minors:
Two countries apply a different age bracket for minors in correctional statistics compared to the one used in conviction statistics: Malta (9-18), Portugal (16-18).
Three countries do not include (or only partially include) minors: Croatia, Denmark and Spain.
Offence definitions:
Eight countries used different definitions for correctional statistics compared to the ones used in the ‘Definitions’ section: Albania, Austria, Bulgaria, Estonia, France, Germany, Iceland and Latvia.
Written rules: Countries having written rules regulating the way in which the data shown in the tables on the convicted population are recorded:
Countries without written rules regulating the way in which the data shown in the tables on the convicted population are recorded:
Albania, Armenia, Austria, Belgium, Estonia, Finland, Germany, Hungary, Iceland, Kosovo, Latvia, Netherlands, Poland, Romania, Russia, Serbia, Slovenia, Sweden, Turkey, UK: England and Wales, UK: Scotland.
Bulgaria, Croatia, Cyprus, Czech Republic, France, Georgia, Greece, Italy, Lithuania, Slovakia, Spain, UK: Northern Ireland.
Principal offence rule: Six countries do not apply a principal offence rule: Armenia, Bulgaria, Georgia, Latvia, Romania, Spain and Turkey.
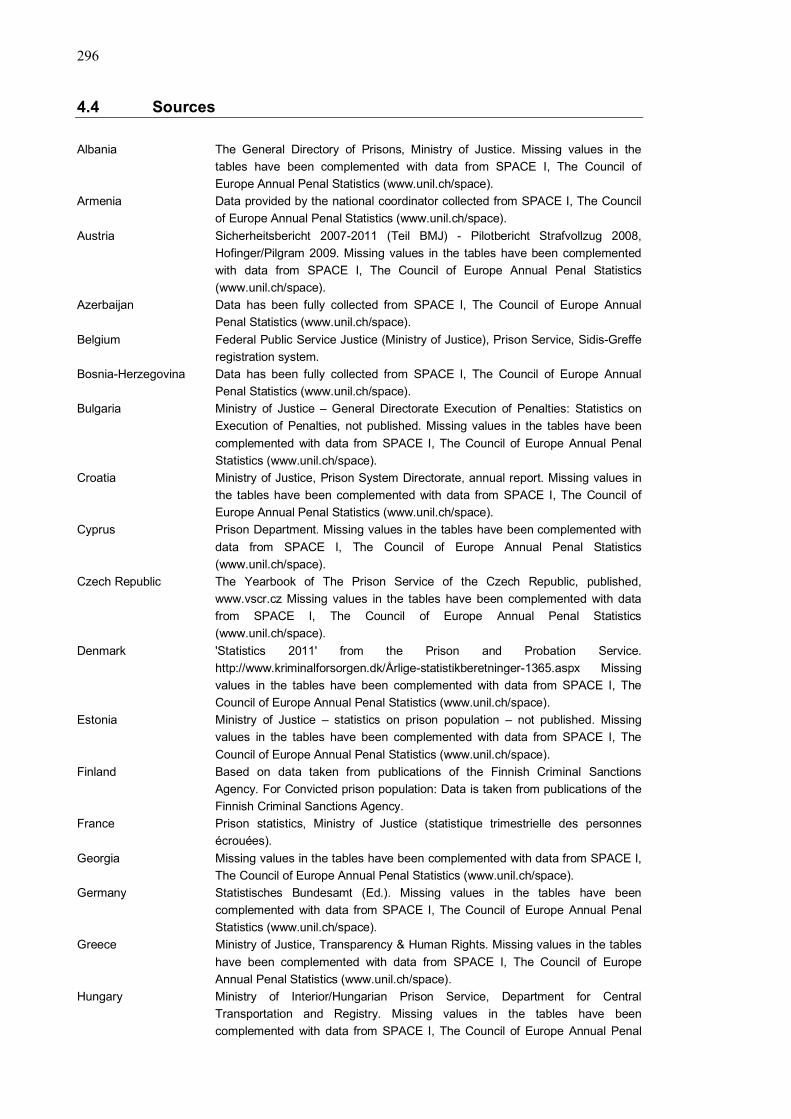
296
4.4 Sources Albania The General Directory of Prisons, Ministry of Justice. Missing values in the
tables have been complemented with data from SPACE I, The Council of Europe Annual Penal Statistics (www.unil.ch/space).
Armenia Data provided by the national coordinator collected from SPACE I, The Council of Europe Annual Penal Statistics (www.unil.ch/space).
Austria Sicherheitsbericht 2007-2011 (Teil BMJ) - Pilotbericht Strafvollzug 2008, Hofinger/Pilgram 2009. Missing values in the tables have been complemented with data from SPACE I, The Council of Europe Annual Penal Statistics (www.unil.ch/space).
Azerbaijan Data has been fully collected from SPACE I, The Council of Europe Annual Penal Statistics (www.unil.ch/space).
Belgium Federal Public Service Justice (Ministry of Justice), Prison Service, Sidis-Greffe registration system.
Bosnia-Herzegovina Data has been fully collected from SPACE I, The Council of Europe Annual Penal Statistics (www.unil.ch/space).
Bulgaria Ministry of Justice – General Directorate Execution of Penalties: Statistics on Execution of Penalties, not published. Missing values in the tables have been complemented with data from SPACE I, The Council of Europe Annual Penal Statistics (www.unil.ch/space).
Croatia Ministry of Justice, Prison System Directorate, annual report. Missing values in the tables have been complemented with data from SPACE I, The Council of Europe Annual Penal Statistics (www.unil.ch/space).
Cyprus Prison Department. Missing values in the tables have been complemented with data from SPACE I, The Council of Europe Annual Penal Statistics (www.unil.ch/space).
Czech Republic The Yearbook of The Prison Service of the Czech Republic, published, www.vscr.cz Missing values in the tables have been complemented with data from SPACE I, The Council of Europe Annual Penal Statistics (www.unil.ch/space).
Denmark 'Statistics 2011' from the Prison and Probation Service. http://www.kriminalforsorgen.dk/Årlige-statistikberetninger-1365.aspx Missing values in the tables have been complemented with data from SPACE I, The Council of Europe Annual Penal Statistics (www.unil.ch/space).
Estonia Ministry of Justice – statistics on prison population – not published. Missing values in the tables have been complemented with data from SPACE I, The Council of Europe Annual Penal Statistics (www.unil.ch/space).
Finland Based on data taken from publications of the Finnish Criminal Sanctions Agency. For Convicted prison population: Data is taken from publications of the Finnish Criminal Sanctions Agency.
France Prison statistics, Ministry of Justice (statistique trimestrielle des personnes écrouées).
Georgia Missing values in the tables have been complemented with data from SPACE I, The Council of Europe Annual Penal Statistics (www.unil.ch/space).
Germany Statistisches Bundesamt (Ed.). Missing values in the tables have been complemented with data from SPACE I, The Council of Europe Annual Penal Statistics (www.unil.ch/space).
Greece Ministry of Justice, Transparency & Human Rights. Missing values in the tables have been complemented with data from SPACE I, The Council of Europe Annual Penal Statistics (www.unil.ch/space).
Hungary Ministry of Interior/Hungarian Prison Service, Department for Central Transportation and Registry. Missing values in the tables have been complemented with data from SPACE I, The Council of Europe Annual Penal

297
Statistics (www.unil.ch/space). Iceland Prison and Probation Administration Borgartúni 7 150 Reykjavík
www.fangelsi.is. Missing values in the tables have been complemented with data from SPACE I, The Council of Europe Annual Penal Statistics (www.unil.ch/space).
Ireland Source: Irish Prison Service. Missing values in the tables have been complemented with data from SPACE I, The Council of Europe Annual Penal Statistics (www.unil.ch/space).
Italy Ministry of Justice – www.giustizia.it Kosovo (UNR) The data are taken from the books of the receiving daily reports on the
numerical situation and the Annual Statistics & Database Latvia Data provided by the national coordinator collected from Council of Europe,
SPACE I 2010.2 (years 2007-2010); Central Statistical Bureau of Latvia (for 2011 figures). Missing values in the tables have been complemented with data from SPACE I, The Council of Europe Annual Penal Statistics (www.unil.ch/space).
Lithuania Prison Department under the Ministry of Justice of the Republic of Lithuania http://www.kalejimudepartamentas.lt/?item=vkl_at_mt&lang=1.
Luxembourg Data has been fully collected from SPACE I, The Council of Europe Annual Penal Statistics (www.unil.ch/space).
Malta Missing values in the tables have been complemented with data from SPACE I, The Council of Europe Annual Penal Statistics (www.unil.ch/space).
Moldova Missing values in the tables have been complemented with data from SPACE I, The Council of Europe Annual Penal Statistics (www.unil.ch/space).
Montenegro Data has been fully collected from SPACE I, The Council of Europe Annual Penal Statistics (www.unil.ch/space).
Netherlands Custodial Institutions Agency (www.dji.nl) Norway Registration system of the Correctional Services of Norway. Poland Central Prison Authority, Department of Statistics. Portugal Directorate-General for Probation and Prison Services, Ministry of Justice.
Missing values in the tables have been complemented with data from SPACE I, The Council of Europe Annual Penal Statistics (www.unil.ch/space).
Romania National Administration of Penitentiaries. Missing values in the tables have been complemented with data from SPACE I, The Council of Europe Annual Penal Statistics (www.unil.ch/space).
Russia Data by United Nations Office on Drugs and Crime. Missing values in the tables have been complemented with data from SPACE I, The Council of Europe Annual Penal Statistics (www.unil.ch/space).
Serbia Annual Reports of Prison Administration Operations, Ministry of Justice, Prison Administration Available online: www.uiks.mpravde.gov.rs. Missing values in the tables have been complemented with data from SPACE I, The Council of Europe Annual Penal Statistics (www.unil.ch/space).
Slovakia Ministry of Justice, partially published at: http://www.justice.gov.sk/stat/statr.htm. Missing values in the tables have been complemented with data from SPACE I, The Council of Europe Annual Penal Statistics (www.unil.ch/space).
Slovenia Data provided by the national coordinator collected from SPACE I. 2007, 2008, 2009, 2010, 2011 ‘’Council of Europe Annual Penal Statistics – Survey on the population of penal institutions’’; Annual Reports 2007, 2008, 2009, 2010, 2011 – Prison Administration of Republic of Slovenia.
Spain Data provided by the national coordinator collected from Council of Europe Annual Penal Statistics (SPACE). Surveys 2007 to 2011.
Sweden The Swedish Prison and Probation Service www.kriminalvarden.se. Missing values in the tables have been complemented with data from SPACE I, The Council of Europe Annual Penal Statistics (www.unil.ch/space).
Switzerland http://www.bfs.admin.ch/bfs/portal/en/index/themen/19/03/05/key/ueberblick/wichtigsten_zahlen.html

298
TFYR of Macedonia
Data has been fully collected from SPACE I, The Council of Europe Annual Penal Statistics (www.unil.ch/space).
Turkey Turkish Statistical Institute. (2012). Prison Statistics 2011. Ankara. For convicted prison population: Turkish Statistical Institute http://www.turkstat.gov.tr/ VeriBilgi.do?alt_id=1. Missing values in the tables have been complemented with data from SPACE I, The Council of Europe Annual Penal Statistics (www.unil.ch/space).
Ukraine Data provided by the national coordinator collected from Council of Europe Annual Penal Statistics; Turemniy Portal (Prison Portal) http://ukrprison.org.ua/statistics/1301842616. Missing values in the tables have been complemented with data from SPACE I, The Council of Europe Annual Penal Statistics (www.unil.ch/space).
UK: England & Wales Based on data taken from ‘Offender Management Statistics quarterly' Annual Tables http://www.justice.gov.uk/statistics/prisons-and-probation/oms-quarterly. Missing values in the tables have been complemented with data from SPACE I, The Council of Europe Annual Penal Statistics (www.unil.ch/space).
UK: Northern Ireland UK: Northern Ireland Prison Service and Department of Justice NI - Youth Justice Agency – Woodlands Juvenile Justice Centre Population Database. Published on a financial year basis in the Quarterly/Annual Workload Statistics http://www.youthjusticeagencyni.gov.uk/. Missing values in the tables have been complemented with data from SPACE I, The Council of Europe Annual Penal Statistics (www.unil.ch/space).
UK: Scotland Scottish Government Justice Analytical Services prison statistics.
299
5. Probation Statistics
5.1 General comments 5.1.1 Introduction
This chapter provides information on the number of persons placed under the supervision of probation agencies during 2010 (flow of entries), persons leaving such supervision during the same year (flow of exits), as well as on the specific number of persons under such supervision on 31st December 2010 (stock). It also includes the same three types of information for the specific subcategories of persons under community service and under electronic monitoring. In all cases, detailed information on the reasons for ending supervision is also provided. Corresponding information on minors is provided separately. Finally, the chapter includes information on the staff of probation agencies in 2010, and on the number of written reports provided by these agencies during the same year.
5.1.2 Quality of the data
Probation statistics
- Data provided by the network of CEP correspondents were used to complete the series of non-custodial sanctions and measures for the following countries: Austria, Croatia, Italy, Malta, Moldova, Slovakia and Sweden.
Persons under the control, supervision and/or care of the probation agencies in 2010
- Thirty-one countries provided data on the total number of persons under the control, supervision and/or care of the probation agencies on 31st December 2010 (stock), 30 on the number placed under such supervision in 2010 (flow of entries), and 27 on those leaving supervision during the same year (flow of exits). Few countries were able to break down their data by type of supervision.
- There is little data on minors under the control, supervision and/or care of the probation. Only 22 countries were able to indicate their stock, 16 their flow of entries, and 13 their flow of exits, while even fewer countries provided information on the types of supervision.
- Regarding the reasons for ending supervision, 26 countries provided data for the total number of persons leaving supervision, and 12 of these for minors.
Persons serving community service in 2010
- Twenty-six countries provided data on the total number of persons serving community service on 31st December 2010 (stock), 25 countries provided data on the total number of persons starting to serve community service during 2010 (flow of entries), and 21 countries provided data on the total number of persons ending community service in 2010 (flow of exits).
- The number of countries that provided detailed data for minors serving community service was lower, as 13 provided data on their stock and on their flow of entries, and 11 on their flow of exits.
- Regarding the reasons for ending community service, 22 countries provided data for the total number of persons ending community service and 12 of these for minors.
Persons under electronic monitoring in 2010
- Fifteen countries provided data on the total number of persons under electronic monitoring on 31st December 2010 (stock), 12 countries provided data on the total number of persons placed under electronic monitoring during 2010 (flow of entries), and 11 countries provided data on the total number of persons ending electronic monitoring in 2010 (flow of exits).
- The number of countries that provided data for minors under electronic monitoring was lower: 6 provided data on the stock, 4 on the flow of entries, and 3 on the flow of exits.
- Regarding the reasons for ending electronic monitoring, 11 countries provided data for the total number of persons under electronic monitoring, but only 4 for minors.

300
5.1.3 Results
There were considerable differences between the countries as regards the total number of persons under the supervision of probation agencies in 2010. The rates per 100 000 population ranged from 10 (Croatia) to 944 (Poland), reflecting the recent development of supervision in many countries as well as different definitions of the concept. As a consequence, cross-national comparisons of the rates of persons under the supervision of probation agencies may be misleading.
The rate of minors under the control or supervision of probation agencies was 30 per 100 000 population (this rate could not be calculated using the total population of minors), with a maximum of 124 in Poland and a minimum of 0.4 for Belgium.
Supervision of a suspended custodial sentence showed the highest rate of implementation (43%), followed by probation as a sanction in its own right (35%). Supervision as a security measure after having fully served a prison sentence or other form of detention was a less used form of supervision (4%). The highest rate in respect of supervision of minors was probation as a sanction in its own right (46%).
The average rate of total persons ending supervision in 2010 was 160 per 100 000 population, of which 21 per 100 000 population were minors. The main reason for ending supervision for total persons (78%) and for minors (70%) was the completion of the sanction.
There were considerable differences between countries as regards the total persons undergoing community service in 2010: the rates ranged from under 1 per 100 000 population in Italy and Serbia to 277 in Poland. The rate of minors undergoing community service in 2010 was 12 per 100 000 population, with a maximum of 82 for Cyprus and less than 1 in Belgium, Malta and UK: Northern Ireland.
Community service as a non-custodial sanction in its own right was the type of community service showing a higher average rate of implementation among all persons (87%), while community service as a condition of conditional release, with a rate close to zero, was the form showing the lower rate of use. Community service as a custodial sanction in its own right was the type of community service showing a higher average percentage for minors (78%).
The average rate of persons ending community service in 2010 was 84 per 100 000 population, of which 8 per 100 000 population were minors. The main reason for ending it was due to the revocation or replacement by another sanction, resulting in imprisonment.
The average total persons under electronic monitoring in 2010 was quite low (8 per 100 000 population), with the highest rate for England and Wales (42), and the lowest rate in Serbia (close to zero). Also for minors, England and Wales showed the highest rate in 2010 (6 per 100 000 population).
On the reasons for ending electronic monitoring, fewer than 10 countries provided data, which rendered comparisons impossible.
On average, the staff of probation agencies (excluding volunteers) was 7 persons per 100 000 population. The maximum was found in England and Wales (33 per 100 000 population) with very nearly no staff in Serbia. On average, qualified probation workers represent 70% of the staff.
2077 reports per 100 000 population were written by probation agencies in European countries in 2010. The country producing more written rapports was Hungary (3904 per 100 000 population) while Moldova was the country with the lowest rate of written reports (155 per 100 000 population).

301
5.2 Tables 5.2.1 Persons under the control, supervision and / or care of the Probation
Agencies in 2010
Table 5.2.1.1 Total stock of persons under the control, supervision and / or care of the Probation Agencies in 2010: Rates per 100 000 population
Total per 100 000
pop.
of which (%): Supervision: Other:
Supe
rvis
ion
befo
re a
fina
l sen
tenc
e
Prob
atio
n as
a s
anct
ion
on it
s ow
n rig
ht
Oth
er fo
rms
of s
uper
visi
on o
f a n
on-
cust
odia
l san
ctio
n
Supe
rvis
ion
of a
sus
pend
ed c
usto
dial
se
nten
ce
Supe
rvis
ion
in c
onne
ctio
n w
ith th
e ex
ecut
ion
of a
pris
on s
ente
nce
outs
ide
pris
on (i
nclu
ding
sem
i- im
pris
onm
ent)
Supe
rvis
ion
afte
r con
ditio
nal r
elea
se fr
om
pris
on
Supe
rvis
ion
as a
sec
urity
mea
sure
afte
r ha
ving
fully
ser
ved
a pr
ison
sen
tenc
e or
ot
her f
orm
of d
eten
tion
Albania 62 ... ... 2.1 77.1 0.0 11.4 ... 9.3 Austria 124 0.8 4.2 0.0 55.1 0.0 34.0 0.6 5.4 Belgium 283 23.6 61.1 ... ... 0.3 14.9 0.2 ... Bulgaria 170 ... ... ... ... ... ... ... ... Croatia 10 ... ... ... 99.1 0.9 ... ... ... Cyprus 157 … ... ... ... ... ... ... ... Czech Republic ... ... ... ... ... ... ... ... ... Denmark 166 ... ... 25.9 29.2 0.5 18.4 ... 26.0 Estonia 565 ... 0.7 5.1 66.3 ... 7.8 ... 20.1 Finland 70 ... 34.9 31.5 ... ... 32.7 ... 0.8 France 271 2.0 ... ... 73.2 1.5 3.6 ... 19.6 Georgia 722 ... 100.0 ... ... ... ... ... ... Germany 304 … ... ... 59.7 ... 22.7 11.8 5.8 Hungary 241 ... ... 44.4 37.8 ... 13.0 ... 4.9 Iceland 56 ... ... 43.6 4.5 9.5 42.5 0.0 0.0 Italy 31 ... 0.7 31.3 27.4 5.0 20.1 15.5 ... Kosovo (UNR) 21 13.3 0.2 52.0 4.3 ... 28.8 ... 1.3 Latvia 467 ... ... ... 66.1 ... 11.7 ... 22.2 Lithuania 249 ... ... 26.2 48.5 ... 16.7 ... 8.6 Malta 182 12.9 64.5 3.3 19.4 ... ... ... ... Moldova 486 ... ... 13.9 74.9 ... 11.1 ... ... Netherlands 109 11.3 ... ... 75.7 1.8 5.6 ... 5.6 Norway 36 ... ... 55.6 28.5 1.0 14.9 ... ... Poland 944 0.3 12.6 2.0 55.4 ... 12.2 ... 17.6 Portugal 150 17.2 ... ... 40.7 ... 16.4 ... 25.7 Romania 45 ... 0.4 ... 99.6 ... ... ... ... Serbia ... ... ... ... ... ... ... ... ... Slovakia ... ... ... ... ... ... ... ... ... Slovenia ... ... ... ... ... ... ... ... ... Spain 58 ... ... ... 36.8 30.5 32.7 ... ... Sweden 146 ... 65.8 ... ... ... 34.2 ... ... Switzerland 60 … ... 11.0 14.9 ... 29.1 ... 45.0 Turkey 110 16.8 65.5 0.1 1.5 ... 0.4 0.4 15.3 UK: E & W 317 ... ... 53.9 24.9 ... 21.2 ... ... UK: N. Ireland 222 ... 40.4 22.9 ... ... 16.5 ... 20.2 UK: Scotland ... ... ... ... ... ... ... ... ... Mean 220 10.9 34.7 23.6 46.7 4.6 18.9 4.7 14.1 Median 157 12.9 34.9 24.4 44.6 1.0 16.5 0.5 12.3 Minimum 10 0.3 0.2 0.0 1.5 0.0 0.4 0.0 0.0 Maximum 944 23.6 100.0 55.6 99.6 30.5 42.5 15.5 45.0

302
Table 5.2.1.2 Total input of persons under the control, supervision and / or care of the Probation Agencies in 2010: Rates per 100 000 population
Total per 100 000
pop.
of which (%): Supervision: Other:
Supe
rvis
ion
befo
re a
fina
l sen
tenc
e
Prob
atio
n as
a s
anct
ion
on it
s ow
n rig
ht
Oth
er fo
rms
of s
uper
visi
on o
f a n
on-
cust
odia
l san
ctio
n
Supe
rvis
ion
of a
sus
pend
ed c
usto
dial
se
nten
ce
Supe
rvis
ion
in c
onne
ctio
n w
ith th
e ex
ecut
ion
of a
pris
on s
ente
nce
outs
ide
pris
on (i
nclu
ding
sem
i-im
pris
onm
ent)
Supe
rvis
ion
afte
r con
ditio
nal r
elea
se fr
om
pris
on
Supe
rvis
ion
as a
sec
urity
mea
sure
afte
r ha
ving
fully
ser
ved
a pr
ison
sen
tenc
e or
ot
her f
orm
of d
eten
tion
Albania 0 ... ... ... ... ... ... ... ... Austria 51 2.2 6.2 0.0 41.8 0.0 29.4 1.3 19.0 Belgium 176 56.4 34.2 ... ... 1.1 8.2 0.1 ... Bulgaria 153 ... ... ... ... ... ... ... ... Croatia 5 ... ... ... 97.1 2.9 ... ... ... Cyprus 66 … ... ... ... ... ... ... ... Czech Republic 49 6.4 ... ... 68.3 ... 24.7 ... 0.6 Denmark ... ... ... ... ... ... ... ... ... Estonia 512 ... 1.0 19.6 46.6 ... 6.2 ... 26.6 Finland 82 ... 66.0 14.7 ... ... 18.9 ... 0.4 France 25 ... ... ... ... 49.4 50.6 ... ... Georgia ... ... ... ... ... ... ... ... ... Germany ... ... ... ... ... ... ... ... ... Hungary 217 … ... 49.0 21.0 ... 13.7 ... 16.3 Iceland 101 ... ... 66.4 1.9 16.2 15.6 0.0 0.0 Italy 36 ... 0.7 42.0 25.2 4.7 19.1 8.2 ... Kosovo (UNR) 45 24.1 2.8 35.2 14.5 ... 22.6 ... 0.9 Latvia ... ... ... ... ... ... ... ... ... Lithuania 287 ... ... 34.6 33.2 ... 17.3 ... 14.9 Malta 80 8.1 67.3 4.5 20.1 ... ... ... ... Moldova 128 ... ... 27.3 57.4 ... 15.3 ... ... Netherlands 97 21.0 ... ... 52.2 13.1 9.2 ... 4.5 Norway 84 ... ... 64.8 13.5 1.6 20.1 ... ... Poland 483 0.6 10.8 3.7 49.0 ... 15.9 ... 19.9 Portugal 168 28.5 ... ... 27.8 ... 8.7 ... 35.0 Romania 16 ... 0.9 ... 99.1 ... ... ... ... Serbia 0 ... ... ... 100.0 ... ... ... ... Slovakia 107 ... ... ... 33.5 ... 10.0 ... ... Slovenia 6 ... ... ... 86.2 ... 13.8 ... ... Spain ... ... ... ... ... ... ... ... ... Sweden 137 ... 60.5 ... ... ... 39.5 ... ... Switzerland 59 … ... 2.5 6.3 ... 14.2 ... 77.0 Turkey ... ... ... ... ... ... ... ... ... UK: E & W 362 ... ... 60.3 24.0 ... 15.7 ... ... UK: N. Ireland 186 ... 38.4 40.2 ... ... 11.4 ... 10.0 UK: Scotland 425 … 2.0 14.5 25.6 ... ... 4.7 53.2 Mean 138 18.4 24.2 30.0 42.9 11.1 18.2 2.9 19.9 Median 91 14.5 8.5 30.9 33.3 3.8 15.6 1.3 15.6 Minimum 0 0.6 0.7 0.0 1.9 0.0 6.2 0.0 0.0 Maximum 512 56.4 67.3 66.4 100.0 49.4 50.6 8.2 77.0

303
Table 5.2.1.3 Total output of persons under the control, supervision and / or care of the
Probation Agencies in 2010: Rates per 100 000 population
Total per 100 000
pop.
of which (%): Supervision: Other:
Supe
rvis
ion
befo
re a
fina
l sen
tenc
e
Prob
atio
n as
a s
anct
ion
on it
s ow
n rig
ht
Oth
er fo
rms
of s
uper
visi
on o
f a n
on-
cust
odia
l san
ctio
n
Supe
rvis
ion
of a
sus
pend
ed c
usto
dial
se
nten
ce
Supe
rvis
ion
in c
onne
ctio
n w
ith th
e ex
ecut
ion
of a
pris
on s
ente
nce
outs
ide
pris
on (i
nclu
ding
sem
i-im
pris
onm
ent)
Supe
rvis
ion
afte
r con
ditio
nal r
elea
se fr
om
pris
on
Supe
rvis
ion
as a
sec
urity
mea
sure
afte
r ha
ving
fully
ser
ved
a pr
ison
sen
tenc
e or
ot
her f
orm
of d
eten
tion
Albania 0 ... ... ... ... ... ... ... ... Austria 43 0.6 7.5 0.0 34.8 0.0 27.0 2.5 27.6 Belgium 171 59.8 30.5 ... ... 1.2 8.4 0.0 ... Bulgaria 113 ... ... ... ... ... ... ... ... Croatia 5 ... ... ... 98.2 1.8 ... ... ... Cyprus 36 … ... ... ... ... ... ... ... Czech Republic 42 7.7 ... ... 66.7 ... 25.0 ... 0.6 Denmark ... ... ... ... ... ... ... ... ... Estonia 589 ... 1.4 17.7 50.7 ... 7.2 ... 23.0 Finland 82 ... 69.1 13.2 ... ... 17.4 ... 0.3 France ... ... ... ... ... ... ... ... ... Georgia ... ... ... ... ... ... ... ... ... Germany 87 … ... ... ... ... ... ... ... Hungary 203 … ... 52.7 18.8 ... 12.4 ... 16.1 Iceland 102 ... ... 74.4 0.9 ... 24.7 0.0 0.0 Italy ... ... ... ... ... ... ... ... ... Kosovo (UNR) 24 33.6 5.1 20.6 23.5 ... 17.3 ... ... Latvia ... ... ... ... ... ... ... ... ... Lithuania 281 ... ... 31.4 33.9 ... 18.4 ... 16.3 Malta 2 ... ... 100.0 ... ... ... ... ... Moldova 114 ... ... 17.3 57.8 ... 24.9 ... ... Netherlands 78 22.5 ... ... 60.6 ... 10.4 ... 6.5 Norway 90 ... ... 65.2 13.3 1.5 20.0 ... ... Poland 525 0.5 11.0 4.4 56.6 ... 14.0 ... 13.5 Portugal 172 … ... ... ... ... ... ... ... Romania 9 ... 2.4 ... 97.6 ... ... ... ... Serbia 0 ... ... ... 100.0 ... ... ... ... Slovakia 94 ... ... ... 24.5 ... 8.1 0.8 ... Slovenia 2 ... ... ... 100.0 ... ... ... ... Spain ... ... ... ... ... ... ... ... ... Sweden 123 ... 62.7 ... ... ... 37.3 ... ... Switzerland 61 … ... 3.1 5.4 ... 14.1 ... 77.3 Turkey ... ... ... ... ... ... ... ... ... UK: E & W 374 ... ... 59.0 22.0 ... 19.1 ... ... UK: N. Ireland ... ... ... ... ... ... ... ... ... UK: Scotland 376 … ... ... ... ... ... ... ... Mean 136 20.8 23.7 35.3 48.1 1.1 18.0 0.9 18.1 Median 89 15.1 9.2 20.6 42.8 1.4 17.4 0.4 14.8 Minimum 0 0.5 1.4 0.0 0.9 0.0 7.2 0.0 0.0 Maximum 589 59.8 69.1 100.0 100.0 1.8 37.3 2.5 77.3

304
Table 5.2.1.4 Stock of minors under the control, supervision and / or care of the
Probation Agencies in 2010: Rates per 100 000 population
Total per 100 000 pop.
of which (%): Supervision: Other:
Supe
rvis
ion
befo
re a
fina
l sen
tenc
e
Prob
atio
n as
a s
anct
ion
on it
s ow
n rig
ht
Oth
er fo
rms
of s
uper
visi
on o
f a n
on-
cust
odia
l san
ctio
n
Supe
rvis
ion
of a
sus
pend
ed c
usto
dial
se
nten
ce
Supe
rvis
ion
in c
onne
ctio
n w
ith th
e ex
ecut
ion
of a
pris
on s
ente
nce
outs
ide
pris
on (i
nclu
ding
sem
i-im
pris
onm
ent)
Supe
rvis
ion
afte
r con
ditio
nal r
elea
se fr
om
pris
on
Supe
rvis
ion
as a
sec
urity
mea
sure
afte
r ha
ving
fully
ser
ved
a pr
ison
sen
tenc
e or
ot
her f
orm
of d
eten
tion
Albania 13 ... ... ... ... ... ... ... ... Austria 36 1.1 7.5 0.0 71.3 0.0 11.6 0.3 8.2 Belgium 0 32.6 65.1 ... ... ... 2.3 ... ... Bulgaria ... ... ... ... ... ... ... ... ... Croatia ... ... ... ... ... ... ... ... ... Cyprus 117 ... ... ... ... ... ... ... ... Czech Republic ... ... ... ... ... ... ... ... ... Denmark 5 ... ... ... ... ... ... ... ... Estonia 19 ... 18.8 20.8 49.2 ... 0.4 ... 10.8 Finland 2 ... ... ... ... ... ... ... ... France ... ... ... ... ... ... ... ... ... Georgia 14 ... ... ... ... ... ... ... ... Germany 48 ... ... ... 77.6 ... 19.0 ... 3.5 Hungary 93 ... ... 60.2 36.2 ... 2.4 ... 1.2 Iceland 1 ... ... 100.0 0.0 0.0 0.0 0.0 0.0 Italy ... ... ... ... ... ... ... ... ... Kosovo (UNR) 14 19.7 3.2 77.1 ... ... ... ... ... Latvia ... ... ... ... ... ... ... ... ... Lithuania 20 ... ... 23.7 34.9 ... 2.6 ... 38.8 Malta ... ... ... ... ... ... ... ... ... Moldova 12 ... ... 0.7 79.0 ... 0.0 ... ... Netherlands 66 ... ... ... ... ... ... ... ... Norway ... ... ... ... ... ... ... ... ... Poland 124 1.9 95.8 ... 2.3 ... ... ... ... Portugal 8 32.8 ... ... 43.9 ... 0.7 ... 22.6 Romania 1 ... 20.0 ... 80.0 ... ... ... ... Serbia ... ... ... ... ... ... ... ... ... Slovakia ... ... ... ... ... ... ... ... ... Slovenia ... ... ... ... ... ... ... ... ... Spain 55 ... ... 14.3 ... ... 34.7 ... ... Sweden 17 ... 92.3 ... ... ... 7.7 ... ... Switzerland ... ... ... ... ... ... ... ... ... Turkey 9 14.0 47.3 0.0 2.7 ... 0.4 0.0 35.6 UK: E & W ... ... ... ... ... ... ... ... ... UK: N. Ireland 5 ... 62.2 8.9 ... ... 21.1 ... 7.8 UK: Scotland ... ... ... ... ... ... ... ... ... Mean 31 17.0 45.8 30.6 43.4 0.0 7.9 0.1 14.3 Median 14 16.9 47.3 17.5 43.9 0.0 2.4 0.0 8.2 Minimum 0 1.1 3.2 0.0 0.0 0.0 0.0 0.0 0.0 Maximum 124 32.8 95.8 100.0 80.0 0.0 34.7 0.3 38.8

305
Table 5.2.1.5 Input of minors under the control, supervision and / or care of the Probation Agencies in 2010: Rates per 100 000 population
Total per 100 000
pop.
of which (%): Supervision: Other:
Supe
rvis
ion
befo
re a
fina
l sen
tenc
e
Prob
atio
n as
a s
anct
ion
on it
s ow
n rig
ht
Oth
er fo
rms
of s
uper
visi
on o
f a n
on-
cust
odia
l san
ctio
n
Supe
rvis
ion
of a
sus
pend
ed c
usto
dial
se
nten
ce
Supe
rvis
ion
in c
onne
ctio
n w
ith th
e ex
ecut
ion
of a
pris
on s
ente
nce
outs
ide
pris
on (i
nclu
ding
sem
i-im
pris
onm
ent)
Supe
rvis
ion
afte
r con
ditio
nal r
elea
se fr
om
pris
on
Supe
rvis
ion
as a
sec
urity
mea
sure
afte
r ha
ving
fully
ser
ved
a pr
ison
sen
tenc
e or
ot
her f
orm
of d
eten
tion
Albania ... ... ... ... ... ... ... ... ... Austria 13 3.5 11.8 0.0 52.8 0.0 6.8 0.2 24.9 Belgium 1 48.4 49.7 ... ... ... 1.9 ... ... Bulgaria ... ... ... ... ... ... ... ... ... Croatia ... ... ... ... ... ... ... ... ... Cyprus 49 ... ... ... ... ... ... ... ... Czech Republic 8 3.1 51.8 ... 41.7 ... 1.6 ... 1.7 Denmark ... ... ... ... ... ... ... ... ... Estonia ... ... ... ... ... ... ... ... ... Finland ... ... ... ... ... ... ... ... ... France ... ... ... ... ... ... ... ... ... Georgia ... ... ... ... ... ... ... ... ... Germany ... ... ... ... ... ... ... ... ... Hungary 78 ... ... 69.2 22.4 ... 3.3 ... 5.1 Iceland 1 ... ... 100.0 0.0 0.0 0.0 0.0 0.0 Italy ... ... ... ... ... ... ... ... ... Kosovo (UNR) 28 38.3 5.2 56.0 0.5 ... ... ... ... Latvia ... ... ... ... ... ... ... ... ... Lithuania 40 ... ... 23.9 26.1 ... 3.3 ... 46.7 Malta 17 14.1 80.3 1.4 4.2 ... ... ... ... Moldova 6 ... ... 1.0 74.3 ... 0.5 ... ... Netherlands ... ... ... ... ... ... ... ... ... Norway ... ... ... ... ... ... ... ... ... Poland 57 5.3 91.6 ... 3.1 ... ... ... ... Portugal 13 50.8 ... ... 26.1 ... 0.5 ... 22.7 Romania 1 ... 22.5 ... 77.5 ... ... ... ... Serbia ... ... ... ... ... ... ... ... ... Slovakia 3 ... ... ... ... ... ... ... ... Slovenia ... ... ... ... ... ... ... ... ... Spain ... ... ... ... ... ... ... ... ... Sweden 18 ... 87.1 ... ... ... 12.9 ... ... Switzerland ... ... ... ... ... ... ... ... ... Turkey ... ... ... ... ... ... ... ... ... UK: E & W ... ... ... ... ... ... ... ... ... UK: N. Ireland 7 ... 52.1 21.8 ... ... 6.7 ... 19.3 UK: Scotland ... ... ... ... ... ... ... ... ... Mean 21 23.4 50.2 34.2 29.9 0.0 3.7 0.1 17.2 Median 13 14.1 51.8 22.9 26.1 0.0 2.6 0.1 19.3 Minimum 1 3.1 5.2 0.0 0.0 0.0 0.0 0.0 0.0 Maximum 78 50.8 91.6 100.0 77.5 0.0 12.9 0.2 46.7

306
Table 5.2.1.6 Output of minors under the control, supervision and / or care of the
Probation Agencies in 2010: Rates per 100 000 population
Total per 100 000
pop.
of which (%): Supervision: Other:
Supe
rvis
ion
befo
re a
fina
l sen
tenc
e
Prob
atio
n as
a s
anct
ion
on it
s ow
n rig
ht
Oth
er fo
rms
of s
uper
visi
on o
f a n
on-
cust
odia
l san
ctio
n
Supe
rvis
ion
of a
sus
pend
ed c
usto
dial
se
nten
ce
Supe
rvis
ion
in c
onne
ctio
n w
ith th
e ex
ecut
ion
of a
pris
on s
ente
nce
outs
ide
pris
on (i
nclu
ding
sem
i-im
pris
onm
ent)
Supe
rvis
ion
afte
r con
ditio
nal r
elea
se fr
om
pris
on
Supe
rvis
ion
as a
sec
urity
mea
sure
afte
r ha
ving
fully
ser
ved
a pr
ison
sen
tenc
e or
ot
her f
orm
of d
eten
tion
Albania ... ... ... ... ... ... ... ... ... Austria 12 0.5 14.4 0.0 40.9 0.0 8.5 1.2 34.5 Belgium 1 63.1 36.9 ... ... ... 0.0 ... ... Bulgaria ... ... ... ... ... ... ... ... ... Croatia ... ... ... ... ... ... ... ... ... Cyprus 30 ... ... ... ... ... ... ... ... Czech Republic 11 5.0 65.8 ... 28.8 ... 0.2 ... 0.3 Denmark ... ... ... ... ... ... ... ... ... Estonia 19 ... 15.6 57.8 21.1 ... 0.0 ... 5.5 Finland ... ... ... ... ... ... ... ... ... France ... ... ... ... ... ... ... ... ... Georgia ... ... ... ... ... ... ... ... ... Germany 5 ... ... ... ... ... ... ... ... Hungary 72 ... ... 69.9 21.5 ... 3.6 ... 4.9 Iceland 0 ... ... ... ... ... ... ... ... Italy ... ... ... ... ... ... ... ... ... Kosovo (UNR) 14 56.8 7.3 34.9 1.0 ... ... ... ... Latvia ... ... ... ... ... ... ... ... ... Lithuania 45 ... ... 22.5 24.5 ... 4.0 ... 49.1 Malta ... ... ... ... ... ... ... ... ... Moldova 7 ... ... 0.0 72.5 ... 0.0 ... ... Netherlands ... ... ... ... ... ... ... ... ... Norway ... ... ... ... ... ... ... ... ... Poland 62 4.5 92.4 ... 3.1 ... ... ... ... Portugal ... ... ... ... ... ... ... ... ... Romania 0 ... 50.5 ... 49.5 ... ... ... ... Serbia ... ... ... ... ... ... ... ... ... Slovakia ... ... ... ... ... ... ... ... ... Slovenia ... ... ... ... ... ... ... ... ... Spain ... ... ... ... ... ... ... ... ... Sweden ... ... ... ... ... ... ... ... ... Switzerland ... ... ... ... ... ... ... ... ... Turkey ... ... ... ... ... ... ... ... ... UK: E & W ... ... ... ... ... ... ... ... ... UK: N. Ireland ... ... ... ... ... ... ... ... ... UK: Scotland ... ... ... ... ... ... ... ... ... Mean 21 26.0 40.4 30.9 29.2 0.0 2.3 1.2 18.9 Median 12 5.0 36.9 28.7 24.5 0.0 0.2 1.2 5.5 Minimum 0 0.5 7.3 0.0 1.0 0.0 0.0 1.2 0.3 Maximum 72 63.1 92.4 69.9 72.5 0.0 8.5 1.2 49.1

307
5.2.2 Reasons for ending supervision by the Probation Agencies in 2010
Table 5.2.2.1 Total population under supervision of Probation Agencies: Reasons for ending supervision by the Probation Agencies in 2010 – Output
Total rate per 100 000 pop.
of which, percentage of: Completion Revocation or replacement by
another sanction / measure Other:
Total of which: % resulting in
imprisonment Albania ... ... ... ... ... Austria 43 81.2 10.3 92.4 8.5 Belgium 171 69.9 27.7 ... 1.0 Bulgaria ... ... ... ... ... Croatia 5 89.7 3.1 57.1 5.4 Cyprus 36 86.6 6.9 0.0 6.5 Czech Republic 42 ... ... ... ... Denmark ... ... ... ... ... Estonia 589 80.0 18.9 ... 1.1 Finland 82 87.2 15.3 75.0 ... France 157 ... ... ... ... Georgia ... ... ... ... ... Germany 87 66.1 26.2 … 7.8 Hungary 174 98.1 1.9 43.6 ... Iceland 97 78.5 21.5 0.0 0.0 Italy ... ... ... ... ... Kosovo (UNR) 25 ... ... ... ... Latvia 353 86.1 ... ... ... Lithuania 281 73.2 22.1 47.4 4.6 Malta ... ... ... ... ... Moldova 166 79.7 2.1 174.8 11.6 Netherlands 98 58.9 23.2 ... 17.9 Norway 108 88.1 9.4 ... 2.6 Poland 462 ... ... ... ... Portugal 172 89.0 3.7 24.3 7.3 Romania 9 67.8 19.6 100.0 12.6 Serbia 0 100.0 0.0 ... 0.0 Slovakia 94 40.1 12.6 87.3 ... Slovenia ... ... ... ... ... Spain ... ... ... ... ... Sweden 123 ... 8.1 97.7 0.2 Switzerland 61 ... ... ... ... Turkey ... ... ... ... ... UK: England & Wales 372 69.5 19.5 ... 10.9 UK: Northern Ireland ... ... ... ... ... UK: Scotland 359 65.9 14.1 47.8 11.7 Mean 160 77.8 13.3 65.2 6.5 Median 103 79.8 13.4 57.1 6.5 Minimum 0 40.1 0.0 0.0 0.0 Maximum 589 100.0 27.7 174.8 17.9
Table 5.2.2.2 Minors under supervision of Probation Agencies: Reasons for ending
supervision by the Probation Agencies in 2010 – Output Austria 12 82.5 9.6 90.8 7.9 Belgium 1 84.4 15.6 ... 0.0 Cyprus 30 88.2 6.5 0.0 5.3 Estonia 19 80.1 19.1 ... 0.8 Germany 5 38.9 11.9 … 49.2 Hungary 70 97.7 2.3 40.3 ... Lithuania 45 51.3 16.4 56.1 32.3 Moldova 7 62.7 0.4 100.0 20.6 Romania 0 45.2 30.1 100.0 24.7 Mean 21 70.1 12.4 64.5 17.6 Median 12 80.1 11.9 73.5 14.2 Minimum 0 38.9 0.4 0.0 0.0 Maximum 70 97.7 30.1 100.0 49.2

308
Notes on tables 5.2.1.1 – 5.2.1.6 and 5.2.2.1 – 5.2.2.2:
Albania: The total of minors in table 5.2.2.2 refer to all minors under the supervision of probation services during the period 1 June 2009 - 31 December 2010. Croatia: The data provided here refer to 2011 since the probation offices were opened in June 2011. In tables 5.2.1.1-5.2.1.3 only the number of completed cases is given. Cyprus: Table 5.2.2.1: ‘Other’ refers to one death and 18 transfers to another district. Czech Republic: Tables 5.2.1.1-5.2.1.3: ‘Other’ refers to supervision after release from protective treatment and conditional pardon or conditional discharge with probation. Table 5.2.1.4: ‘Other’ refers to supervision after release from protective treatment, conditional pardon or conditional discharge from a criminal measure with probation – there is some double counting. Table 5.2.2.1: Numbers refer to cases Germany: Supervision is carried out by agency 1 (Bewährungshilfe [= Probation assistance]). Only supervisions carried out by employees of the agency are counted; supervisions by volunteers are not included. Because most supervision data are not available for certain regions, all figures in these tables do not refer to: Brandenburg, Hamburg, Mecklenburg-Vorpommern, Sachsen, Sachsen-Anhalt and Thüringen. The rates in these tables are calculated in accordance with this regional reduction(Population figure used 67.090.459). Data for “supervision as a security measure after having fully served a prison sentence or other form of detention” stem from a different source (for all regions). However, the data for the mentioned six regions were excluded for this category as well, in order to refer to the same regional basis. This second source does neither provide separate figures for minors (assumedly only few cases), nor output data or information on the reasons for ending supervision. Therefore, the tables on minors, on output figures and on the reasons for ending supervision do not cover this form of supervision. Lithuania: One of the main tasks of correction inspections until 2012 was to ensure the execution of non-custodial sanctions (except restrictions on the property rights), suspended custodial sentence, conditional release from prison, conditional early discharge from punishment and the penal measure – unpaid work. There were no other forms of supervision mentioned in Tables 5.2.1.1-5.2.1.4. This has been changed on 1 July 2012 when the new Probation Law came into force. Malta: In order to increase pre-sentencing suitability assessment requests, in 2010, the Probation Act was amended to make it possible to issue a Community Service Order. Table 5.2.2.1: This includes breach reports submitted regarding ‘Probation as a sanction in its own right’, ‘Other forms of supervision of a non-custodial sanction’ and ‘Supervision of a suspended custodial sentence’. It excludes ‘Supervision before a final sentence’. Netherlands: The figures include electronic monitoring (EM). The figure for ‘Supervision after conditional release from prison’: includes the ‘Penitentiair Programme’, a trajectory to obtain a gradual return of a delinquent into society. This is supported by electronic supervision. Tables 5.2.1.4-5.2.1.6: Figures include regular youth probation, individual supervision and care for hard core offender and offenders (ITB HK) of cultural minorities (ITB CRIEM), educational programme (STP), behavioural programme order (GBM). Table 5.2.2.1: number of supervisions ended in 2010 instead of the number of persons. Poland: Tables 5.2.1.1-5.2.1.3. ‘Supervision before a final sentence’ and ‘Probation as a sanction in its own right’ include data for minors only. ‘Supervision after conditional release from prison’ includes data for adults only. ‘Supervision of a suspended custodial sentence’ contains data on suspended custodial sentence and conditional release. These data are not available separately. Romania: Probation sanction in its own right – the supervised liberty can be imposed only for minors. 5.2.1.4-5.2.1.6: The numbers mentioned in this table refer to persons who were still minors at the end of 2010. 5.2.1.1-5.2.1.3: The supervision ends due the revocation followed by imprisonment (decided by the judge in case of non-compliance or if another offence was committed), or due to other reasons such as death or some particular cases.

309
5.2.3 Persons under community service in 2010
Table 5.2.3.1 Total stock of persons under community service in 2010 – Rates per 100 000 pop.
Total of which percentage of:
Com
mun
ity s
ervi
ce a
s a
cond
ition
for d
ism
issa
l in
pre-
sent
ence
sta
ge
Com
mun
ity s
ervi
ce a
s a
non-
cust
odia
l san
ctio
n in
its
ow
n rig
ht
Com
mun
ity s
ervi
ce a
s a
cond
ition
of a
sus
pend
ed
/ con
ditio
nal s
ente
nce
Com
mun
ity s
ervi
ce a
s a
cond
ition
of c
ondi
tiona
l re
leas
e
Com
mun
ity s
ervi
ce a
s a
way
of s
ervi
ng a
cus
todi
al
sent
ence
Com
mun
ity s
ervi
ce fo
r fin
e de
faul
ters
Albania 6 ... ... ... ... ... ... Austria 22 70 ... ... ... ... 30 Belgium 98 7 93 ... ... ... ... Bulgaria 100 ... ... ... ... ... ... Croatia 34 1 ... ... ... 99 ... Cyprus 116 ... ... ... ... ... ... Czech Republic ... ... ... ... ... ... ... Denmark 42 ... ... 100 ... ... ... Estonia 113 26 ... ... ... 74 ... Finland 25 ... 100 ... ... ... ... France 42 ... 50 50 ... ... ... Georgia ... ... ... ... ... ... ... Germany ... ... ... ... ... ... ... Hungary 153 ... 100 ... ... ... ... Iceland 21 ... ... ... ... 57 43 Italy 0 ... ... ... ... 100 ... Kosovo (UNR) 1 ... ... ... ... ... 100 Latvia 101 ... 100 ... ... ... ... Lithuania ... ... ... ... ... ... ... Malta 6 ... 60 ... ... ... ... Moldova 76 ... ... ... ... 100 ... Netherlands 118 ... 100 ... ... ... ... Norway 20 ... 100 ... ... ... ... Poland 277 ... 83 ... ... ... 17 Portugal 43 15 ... 5 ... 16 65 Romania ... ... ... ... ... ... ... Serbia 0 ... 100 ... ... ... ... Slovakia ... ... ... ... ... ... ... Slovenia ... ... ... ... ... ... ... Spain 149 ... ... ... ... ... ... Sweden 52 ... 81 19 ... ... ... Switzerland ... ... ... ... ... ... ... Turkey ... ... ... ... ... ... ... UK: England & Wales 119 ... 68 32 ... ... ... UK: Northern Ireland 40 ... 100 ... ... ... ... UK: Scotland ... ... ... ... ... ... ... Mean 68 24 87 41 ... 74 51 Median 43 15 100 32 ... 87 43 Minimum 0 1 50 5 0 16 17 Maximum 277 70 100 100 0 100 100

310
Table 5.2.3.2 Total input of persons under community service in 2010 –
Rates per 100 000 pop. Total of which percentage of:
Com
mun
ity s
ervi
ce a
s a
cond
ition
for d
ism
issa
l in
pre-
sent
ence
sta
ge
Com
mun
ity s
ervi
ce a
s a
non-
cust
odia
l san
ctio
n in
its
ow
n rig
ht
Com
mun
ity s
ervi
ce a
s a
cond
ition
of a
sus
pend
ed
/ con
ditio
nal s
ente
nce
Com
mun
ity s
ervi
ce a
s a
cond
ition
of c
ondi
tiona
l re
leas
e
Com
mun
ity s
ervi
ce a
s a
way
of s
ervi
ng a
cus
todi
al
sent
ence
Com
mun
ity s
ervi
ce fo
r fin
e de
faul
ters
Albania ... ... ... ... ... ... ... Austria 82 46 ... ... ... ... 54 Belgium 111 12 88 ... ... ... ... Bulgaria 78 ... ... ... ... ... ... Croatia 22 1 ... ... ... 99 ... Cyprus 50 ... ... ... ... ... ... Czech Republic 80 ... 100 ... ... ... ... Denmark ... ... ... ... ... ... ... Estonia 224 45 ... ... ... 55 ... Finland 54 ... 100 ... ... ... ... France 42 ... ... ... ... ... ... Georgia ... ... ... ... ... ... ... Germany ... ... ... ... ... ... ... Hungary 103 ... 100 ... ... ... ... Iceland 56 ... ... ... ... 35 65 Italy 0 ... ... ... ... 1067 ... Kosovo (UNR) 1 ... ... ... ... ... 100 Latvia ... ... ... ... ... ... ... Lithuania ... ... ... ... ... ... ... Malta 4 ... 53 ... ... ... ... Moldova 52 ... ... ... ... 100 ... Netherlands 191 ... 100 ... ... ... ... Norway 54 ... 100 ... ... ... ... Poland 311 ... 78 ... ... ... 22 Portugal 82 28 ... 4 ... 10 58 Romania ... ... ... ... ... ... ... Serbia 0 ... 100 ... ... ... ... Slovakia 23 ... 100 ... ... ... ... Slovenia ... ... ... ... ... ... ... Spain ... ... ... ... ... ... ... Sweden 59 ... 27 73 ... ... ... Switzerland ... ... ... ... ... ... ... Turkey ... ... ... ... ... ... ... UK: England & Wales 161 ... 73 27 ... ... ... UK: Northern Ireland 66 ... 100 ... ... ... ... UK: Scotland 177 ... ... 64 ... ... 36 Mean 83 27 86 42 ... 228 56 Median 59 28 100 46 ... 77 56 Minimum 0 1 27 4 0 10 22 Maximum 311 46 100 73 0 1067 100

311
Table 5.2.3.3 Total output of persons under community service in 2010 –
Rates per 100 000 pop. Total of which percentage of:
Com
mun
ity s
ervi
ce a
s a
cond
ition
for d
ism
issa
l in
pre-
sent
ence
sta
ge
Com
mun
ity s
ervi
ce a
s a
non-
cust
odia
l san
ctio
n in
its
ow
n rig
ht
Com
mun
ity s
ervi
ce a
s a
cond
ition
of a
sus
pend
ed
/ con
ditio
nal s
ente
nce
Com
mun
ity s
ervi
ce a
s a
cond
ition
of c
ondi
tiona
l re
leas
e
Com
mun
ity s
ervi
ce a
s a
way
of s
ervi
ng a
cus
todi
al
sent
ence
Co m
mun
ity s
ervi
ce fo
r fin
e de
faul
ters
Albania ... ... ... ... ... ... ... Austria 83 46 ... ... ... ... 54 Belgium 108 12 88 ... ... ... ... Bulgaria 73 ... ... ... ... ... ... Croatia 15 1 ... ... ... 99 ... Cyprus 31 ... ... ... ... ... ... Czech Republic 127 ... 100 ... ... ... ... Denmark ... ... ... ... ... ... ... Estonia 223 47 ... ... ... 53 ... Finland 46 ... 100 ... ... ... ... France ... ... ... ... ... ... ... Georgia ... ... ... ... ... ... ... Germany ... ... ... ... ... ... ... Hungary 73 ... 100 ... ... ... ... Iceland 69 ... ... ... ... 31 69 Italy ... ... ... ... ... ... ... Kosovo (UNR) 0 ... ... ... ... ... 100 Latvia ... ... ... ... ... ... ... Lithuania ... ... ... ... ... ... ... Malta 2 313 ... ... ... ... ... Moldova 51 ... ... ... ... 100 ... Netherlands 202 ... 100 ... ... ... ... Norway 59 ... 100 ... ... ... ... Poland 258 ... 80 ... ... ... 20 Portugal ... ... ... ... ... ... ... Romania ... ... ... ... ... ... ... Serbia 0 ... 100 ... ... ... ... Slovakia 19 ... 100 ... ... ... ... Slovenia ... ... ... ... ... ... ... Spain ... ... ... ... ... ... ... Sweden 57 ... 27 73 ... ... ... Switzerland ... ... ... ... ... ... ... Turkey ... ... ... ... ... ... ... UK: England & Wales 139 ... 75 25 ... ... ... UK: Northern Ireland ... ... ... ... ... ... ... UK: Scotland 179 ... ... 65 ... ... 35 Mean 86 84 88 55 ... 71 56 Median 69 46 100 65 ... 76 54 Minimum 0 1 27 25 0 31 20 Maximum 258 313 100 73 0 100 100

312
Table 5.2.3.4 Stock of minors under community service in 2010 – Rates per 100 000 pop. Total of which percentage of:
Com
mun
ity s
ervi
ce a
s a
cond
ition
for d
ism
issa
l in
pre-
sent
ence
sta
ge
Com
mun
ity s
ervi
ce a
s a
non -
cust
odia
l san
ctio
n in
its
ow
n rig
ht
Com
mun
ity s
ervi
ce a
s a
cond
ition
of a
su s
pend
ed
/ con
ditio
nal s
ente
nce
Com
mun
ity s
ervi
ce a
s a
cond
ition
of c
ondi
tiona
l re
leas
e
Com
mun
ity s
ervi
ce a
s a
way
of s
ervi
ng a
cus
todi
al
sent
ence
Com
mun
ity s
ervi
ce fo
r fin
e de
faul
ters
Austria 7.2 97.9 ... ... ... ... 2.1 Belgium 0.6 11.4 88.6 ... ... ... ... Cyprus 82.0 ... ... ... ... ... ... Estonia 5.3 76.1 ... ... ... 23.9 ... Hungary 6.4 ... 100.0 ... ... ... ... Iceland 0.0 ... ... ... ... ... ... Italy 1.4 ... ... ... ... ... ... Lithuania ... ... 0.0 ... ... ... ... Malta 0.2 ... 100.0 ... ... ... ... Moldova 1.6 ... ... ... ... 100.0 ... Netherlands 28.9 ... ... ... ... ... ... Portugal 3.4 42.1 ... 4.2 ... 12.2 41.6 Spain 11.5 ... ... ... ... ... ... UK: Northern Ireland 0.5 ... 100.0 ... ... ... ... Mean 11.5 56.9 77.7 4.2 ... 45.4 21.9 Median 3.4 59.1 100.0 4.2 ... 23.9 21.9 Minimum 0.0 11.4 0.0 4.2 0.0 12.2 2.1 Maximum 82.0 97.9 100.0 4.2 0.0 100.0 41.6
Table 5.2.3.5 Input of minors under community service in 2010 – Rates per 100 000 pop.
Austria 19.8 96.7 ... ... ... ... 3.3 Belgium 2.5 9.9 90.1 ... ... ... ... Cyprus 34.7 ... ... ... ... ... ... Czech Republic 5.4 ... 100.0 ... ... ... ... Finland 0.0 ... 100.0 ... ... ... ... Hungary 5.2 ... 100.0 ... ... ... ... Iceland 0.0 ... ... ... ... ... ... Italy 3.4 ... ... ... ... ... ... Malta 0.2 ... 100.0 ... ... ... ... Moldova 0.9 ... ... ... ... 100.0 ... Netherlands 106.0 ... ... ... ... ... ... Portugal 8.0 59.0 ... 4.0 ... 6.1 30.9 UK: Northern Ireland 1.3 ... 100.0 ... ... ... ... Mean 14.4 55.2 98.3 4.0 ... 53.1 17.1 Median 3.4 59.0 100.0 4.0 ... 53.1 17.1 Minimum 0.0 9.9 90.1 4.0 0.0 6.1 3.3 Maximum 106.0 96.7 100.0 4.0 0.0 100.0 30.9
Table 5.2.3.6 Output of minors under community service in 2010 – Rates per 100 000 pop.
Austria 19.8 97.0 ... ... ... ... 3.0 Belgium 2.8 9.8 90.2 ... ... ... ... Cyprus 23.8 ... ... ... ... ... ... Czech Republic 6.1 ... 100.0 ... ... ... ... Estonia 11.6 94.9 ... ... ... 5.1 ... Hungary 3.4 ... 100.0 ... ... ... ... Iceland 0.0 ... ... ... ... ... ... Malta 0.2 ... 100.0 ... ... ... ... Moldova 1.3 ... ... ... ... 100.0 ... Netherlands 113.1 ... ... ... ... ... ... Slovakia 0.1 ... 100.0 ... ... ... ... Mean 16.6 67.2 98.0 ... ... 52.6 3.0 Median 3.4 94.9 100.0 ... ... 52.6 3.0 Minimum 0.0 9.8 90.2 0.0 0.0 5.1 3.0 Maximum 113.1 97.0 100.0 0.0 0.0 100.0 3.0

313
5.2.4 Reasons for ending community service in 2010
Table 5.2.4.1 Total persons under community service: Reasons for ending community service in 2010 – Output
Total rate per 100
000 pop.
of which, percentage of: Completion Revocation or replacement by
another sanction / measure Other:
Total of which: % resulting in
imprisonment Albania ... ... ... ... ... Austria 83 40.2 31.2 ... 28.5 Belgium 108 81.7 17.2 ... 0.4 Bulgaria ... ... ... ... ... Croatia 15 80.4 5.2 154.3 6.3 Cyprus 31 57.6 3.1 0.0 0.8 Czech Republic 127 ... ... ... ... Denmark ... ... ... ... ... Estonia 223 81.6 17.7 ... 0.7 Finland 57 81.5 ... ... ... France ... ... ... ... ... Georgia ... ... ... ... ... Germany ... ... ... ... ... Hungary 73 55.2 ... ... 23.6 Iceland 69 81.4 18.6 92.7 0.0 Italy 0 79.2 20.8 ... ... Kosovo (UNR) ... ... ... ... ... Latvia ... ... ... ... ... Lithuania 20 71.7 25.8 ... 2.6 Malta 2 100.0 0.0 ... 0.0 Moldova 51 83.2 0.1 … 5.6 Netherlands 228 78.1 10.2 ... 11.7 Norway 59 83.8 11.5 ... 1.5 Poland 258 58.1 38.6 50.4 ... Portugal ... ... ... ... ... Romania ... ... ... ... ... Serbia 0 100.0 0.0 ... 0.0 Slovakia 19 56.7 41.1 8.6 ... Slovenia ... ... ... ... ... Spain ... ... ... ... ... Sweden 60 95.6 4.4 71.0 1.3 Switzerland 51 88.4 11.6 ... ... Turkey ... ... ... ... ... UK: England & Wales 139 76.2 14.6 ... 9.1 UK: Northern Ireland ... ... ... ... ... UK: Scotland 177 69.8 9.4 56.8 8.8 Mean 84 76.2 14.8 62.0 6.3 Median 59 80.4 11.6 53.6 2.1 Minimum 0 40.2 0.0 0.0 0.0 Maximum 258 100.0 41.1 154.3 28.5

314
Table 5.2.4.2 Minors under community service: Reasons for ending community service in 2010 – Output
Total rate per 100 000
pop.
of which, percentage of: Completion Revocation or replacement by
another sanction / measure Other:
Total of which: % resulting in
imprisonment
Austria 19.8 81.3 14.5 ... 4.2 Belgium 2.8 85.7 14.0 ... 0.0 Cyprus 23.8 63.1 3.6 0.0 1.0 Estonia 11.6 87.8 12.2 ... 0.0 Hungary 3.4 46.4 ... … 31.0 Lithuania 0.4 66.7 16.7 ... 16.7 Malta 0.2 100.0 0.0 … 0.0 Moldova 1.3 64.4 0.0 … 20.0 Netherlands 113.1 85.0 ... ... ... Mean 15.2 75.6 8.7 0.0 9.1 Median 3.1 81.3 12.2 0.0 2.6 Minimum 0.0 46.4 0.0 0.0 0.0 Maximum 113.1 100.0 16.7 0.0 31.0
Notes on Tables 5.2.3.1 – 5.2.4.2
Belgium: Figures concern minors only in part. Cyprus: Tables 5.2.4.1 and 5.2.4.2 'other' refers to transfers to another district. Data provided refer to 2011, NOT to 2010 (i.e., the latest data available is provided). Czech Republic: Numbers refer to cases, not to persons. Iceland: The number of fine defaulters might change if some of the persons pay their fines before they begin to serve the rest of their sentences. Malta: Tables 5.2.3.4-5.2.3.6: Community service applies to adults, and minors between 16 and 18. Tables 5.2.3.1-5.2.3.3 and 5.2.4.1 to 5.2.4.2: Combination orders are classified together with community service orders. Netherlands: 'Community service for fine-defaulters' exists in the Dutch criminal system, but cannot be presented separately. The numbers are included in 'Community service as a non-custodial service in its own right'. Table 5.2.4.1: the number of community service orders ended in 2010 (not the number of persons). Romania: Tables 5.2.4.1 and 5.2.4.2: Data regarding noncompliance with each condition which is followed by revocation is not collected. UK: England & Wales: Data were obtained where unpaid work is ordered (community service) at sentence. UK: Northern Ireland: ‘Community service as a non-custodial sanction in its own right’: includes only those who have been given a community service order. Within Northern Ireland there is a sentence known as a combination order, which combines elements of a probation order and a community service order. Information on these orders has not been included. UK: Scotland: The totals under 'Input' and 'Output' in Tables 5.2.3.1-5.2.3.3 and the total in Tables 5.2.4.1-5.2.4.2 consist of community service orders and supervised attendance orders. The period covered is 1 April 2010 to 31 March 2011.

315
5.2.5 Persons under electronic monitoring in 2010
Table 5.2.5.1 Total stock of persons under electronic monitoring in 2010 – Rates per 100 000 pop.
Total per 100 000
pop.
of which % of electronic monitoring:
As a
n al
tern
ativ
e to
pre
-tria
l de
tent
ion
As a
san
ctio
n in
its
own
right
As a
con
ditio
n of
a n
on-c
usto
dial
or
susp
ende
d cu
stod
ial s
anct
ion
As p
art o
f the
exe
cutio
n of
an
unsu
spen
ded
cust
odia
l san
ctio
n
As a
con
ditio
n of
con
ditio
nal
rele
ase
Afte
r hav
ing
fully
ser
ved
a pr
ison
se
nten
ce o
r oth
er fo
rm o
f det
entio
n
Albania ... ... ... ... ... ... ... Austria 0.9 2.7 ... ... 97.3 ... ... Belgium 15.2 ... ... ... 100.0 ... ... Bulgaria 0.1 ... ... ... ... ... ... Croatia ... ... ... ... ... ... ... Cyprus ... ... ... ... ... ... ... Czech Republic ... ... ... ... ... ... ... Denmark 3.3 ... ... ... ... ... ... Estonia 5.2 ... ... ... ... ... ... Finland ... ... ... ... ... ... ... France 9.2 2.3 95.9 ... 1.0 0.7 ... Georgia ... ... ... ... ... ... ... Germany ... ... ... ... ... ... ... Hungary ... ... ... ... ... ... ... Iceland ... ... ... ... ... ... ... Italy ... ... ... ... ... ... ... Kosovo (UNR) ... ... ... ... ... ... ... Latvia ... ... ... ... ... ... ... Lithuania ... ... ... ... ... ... ... Malta ... ... ... ... ... ... ... Moldova ... ... ... ... ... ... ... Netherlands ... ... ... ... ... ... ... Norway ... ... ... ... ... ... ... Poland 0.7 ... ... ... 100.0 ... ... Portugal 4.8 76.1 13.8 ... 3.9 6.1 ... Romania ... ... ... ... ... ... ... Serbia 0.0 ... ... ... ... ... ... Slovakia ... ... ... ... ... ... ... Slovenia ... ... ... ... ... ... ... Spain 5.1 ... ... ... ... ... ... Sweden 3.9 ... ... ... 100.0 ... ... Switzerland 0.9 ... ... ... 73.9 ... 26.1 Turkey ... ... ... ... ... ... ... UK: England & Wales 42.0 31.1 29.8 24.3 0.0 14.8 0.0 UK: Northern Ireland 14.1 97.2 ... 1.2 ... ... 1.6 UK: Scotland 14.8 ... 50.5 ... ... 49.5 ... Mean 8.0 41.9 47.5 12.7 59.5 17.8 9.2 Median 4.8 31.1 40.2 12.7 85.6 10.5 1.6 Minimum 0.0 2.3 13.8 1.2 0.0 0.7 0.0 Maximum 42.0 97.2 95.9 24.3 100.0 49.5 26.1

316
Table 5.2.5.2 Total input of persons under electronic monitoring in 2010 –
Rates per 100 000 pop. Total per
100 000 population
of which % of electronic monitoring:
As a
n al
tern
ativ
e to
pre
- tria
l de
tent
ion
As a
san
ctio
n in
its
own
right
As a
con
ditio
n of
a n
on-c
usto
dial
or
sus
pend
ed c
usto
dial
san
ctio
n
As p
art o
f the
exe
cutio
n of
an
unsu
spen
ded
cust
odia
l san
ctio
n
As a
con
ditio
n of
con
ditio
nal
rele
ase
Afte
r hav
ing
fully
ser
ved
a pr
ison
se
nten
ce o
r oth
er fo
rm o
f de
tent
ion
Austria 1 3.1 ... ... 96.9 ... ... Belgium 32 ... ... ... 100.0 ... ... Estonia 10 ... ... ... ... ... ... Norway 21 ... ... ... 100.0 ... ... Poland 1 ... ... ... 100.0 ... ... Portugal 7 68.7 17.8 ... 4.0 9.5 ... Serbia 0 ... ... ... ... ... ... Sweden 38 ... ... ... 80.1 19.9 ... Switzerland 4 ... ... ... 88.9 ... 11.1 UK: England & Wales 211 33.7 ... 53.4 0.0 12.9 0.0 UK: Northern Ireland 18 97.8 ... 1.6 ... ... 0.6 UK: Scotland 60 ... 40.4 ... ... 59.6 ... Mean 34 50.8 29.1 27.5 71.2 25.5 3.9 Median 14 51.2 29.1 27.5 92.9 16.4 0.6 Minimum 0 3.1 17.8 1.6 0.0 9.5 0.0 Maximum 211 97.8 40.4 53.4 100.0 59.6 11.1
Table 5.2.5.3 Total output of persons under electronic monitoring in 2010 –
Rates per 100 000 pop. Austria 0.3 4.8 ... ... 95.2 ... ... Belgium 31.0 ... ... ... 100.0 ... ... Bulgaria 0.1 ... ... ... ... ... ... Estonia 8.4 ... ... ... ... ... ... Norway 20.3 ... ... ... 100.0 ... ... Poland 0.3 ... ... ... 100.0 ... ... Portugal 6.9 66.9 21.6 ... 1.8 9.7 ... Serbia 0.0 ... ... ... ... ... ... Switzerland 2.7 ... ... ... 131.3 ... 16.8 UK: England & Wales 204.9 33.4 ... 53.6 0.0 13.0 0.0 UK: Northern Ireland 5.8 96.2 ... 1.9 ... ... 1.9 Mean 25.5 50.3 21.6 27.8 75.5 11.4 6.2 Median 5.8 50.1 21.6 27.8 100.0 11.4 1.9 Minimum 0.0 4.8 21.6 1.9 0.0 9.7 0.0 Maximum 204.9 96.2 21.6 53.6 131.3 13.0 16.8
Table 5.2.5.4 Total stock of minors under electronic monitoring in 2010 –
Rates per 100 000 pop. Austria 0.0 ... ... ... 100.0 ... ... Belgium ... 0.0 ... ... 0.0 ... ... Denmark 0.0 ... ... ... ... ... ... Sweden 0.1 ... ... ... 100.0 ... ... UK: England & Wales 6.1 34.9 10.8 47.1 0.0 7.3 0.0 UK: Northern Ireland 0.9 76.5 ... 23.5 ... ... 0.0 UK: Scotland 0.1 ... 100.0 ... ... ... ...

317
Table 5.2.5.5 Total input of minors under electronic monitoring in 2010 –
Rates per 100 000 pop. Total per
100 000 population
of which % of electronic monitoring:
As a
n al
tern
ativ
e to
pre
- tria
l de
tent
ion
As a
san
ctio
n in
its
own
right
As a
con
ditio
n of
a n
on-c
usto
dial
or
sus
pend
ed c
usto
dial
san
ctio
n
As p
art o
f the
exe
cutio
n of
an
unsu
spen
ded
cust
odia
l san
ctio
n
As a
con
ditio
n of
con
ditio
nal
rele
ase
Afte
r hav
ing
fully
ser
ved
a pr
ison
se
nten
ce o
r oth
er fo
rm o
f de
tent
ion
Austria 0.0 ... ... ... 100.0 ... ... Belgium ... 0.0 ... ... 0.0 ... ... UK: England & Wales 41.4 47.9 ... 44.8 0.0 7.3 0.0 UK: Northern Ireland 4.2 93.3 ... 6.7 ... ... 0.0 UK: Scotland 0.2 ... 100.0 ... ... ... ...
Table 5.2.5.6 Total output of minors under electronic monitoring in 2010 –
Rates per 100 000 pop. Austria 0.0 ... ... ... ... ... ... Belgium ... 0.0 ... ... 0.0 ... ... UK: England & Wales 40.7 48.0 ... 44.4 0.0 7.6 0.0 UK: Northern Ireland 1.9 85.7 ... 14.3 ... ... 0.0
5.2.6 Reasons for ending electronic monitoring in 2010
Table 5.2.6.1 Total persons under electronic monitoring: Reasons for ending electronic monitoring in 2010 – Output
Total rate per 100 000
pop.
of which, percentage of: Completion Revocation or replacement by
another sanction / measure Other:
Total of which: % resulting in
imprisonment Austria 0.3 85.7 14.3 100.0 0.0 Belgium 31.0 78.7 14.4 ... 0.3 France 0.0 57.9 42.1 ... ... Netherlands 0.4 71.6 14.9 ... 13.4 Norway 20.3 94.8 5.2 100.0 ... Sweden ... ... ... 100.0 ... Switzerland 4.0 94.2 5.8 ... ... Table 5.2.6.2 Minors under electronic monitoring: Reasons for ending electronic monitoring in 2010 – Output No data available. Notes on tables 5.2.5.1 – 5.2.6.2
Netherlands: Electronic monitoring as a condition of conditional release exists, but cannot be separated from supervision after conditional release from prison (table 5.2.1.1). ‘Supervision after conditional release from prison’ (table 5.2.1.1) includes the number of persons with ‘Electronic monitoring as a condition of conditional release’. Tables 5.2.6.1 and 5.2.6.2 provide figures for the number of electronic monitoring ended in 2010, not the number of persons.

318
The stock, input and output in table 5.2.1.1 includes electronic monitoring. The figures for electronic monitoring that are included in table 5.2.1.1 are shown separately in table 5.2.5.1-5.2.5.3. The same is true for table 5.2.2.1 and tables 5.2.6.1 and 5.2.6.2. Turkey: Electronic monitoring has started to be used on experimental basis in 2012. It is not in widespread use at this time, nor are statistics available. UK: England and Wales: Tables 5.2.5.1-5.2.5.3: Cannot split single requirement electronic monitoring from multiple requirement electronic monitoring before April 2010, so for the input and output figures, electronic monitoring as a sanction in its own right has been included with electronic monitoring as part of the figures for non-custodial or suspended custodial sanctions. 5.2.6.1 and 5.2.6.2 - cannot separately identify reasons for leaving. UK: Northern Ireland: Tables 5.2.5.1-5.2.5.3 – Agreed recording mechanisms are in place for this information with EM Service Supplier Table 5.2.5.1-5.2.5.3 - As before, due to the nature of the types of orders that have EM as a condition in Northern Ireland, it is not possible to directly correlate the reasons for the end of electronic monitoring condition. Figures are from 1st April 2010 to 30th November 2010. A presumption has been made that all electronic monitoring conditions made for ‘pre-trial’ cases, both adult and juvenile, acted as a direct alternative to custody/detention.

319
5.2.7 Probation Agencies staff in 2010
Table 5.2.7.1 Probation Agencies Staff (excluding volunteers) per 100 000 pop.
Total of which, percentage of: Administrative
staff Qualified
probation workers Other probation
workers Albania ... ... ... ... Austria 5.2 31 69 ... Belgium 11.0 ... ... ... Bulgaria 5.2 ... ... ... Croatia 1.6 19 65 15 Cyprus 5.1 43 31 26 Czech Republic 3.6 ... 100 ... Denmark 7.9 ... ... ... Estonia 16.2 14 83 3 Finland 5.1 15 85 ... France 5.1 ... ... ... Georgia ... ... ... ... Germany ... ... ... ... Hungary 4.6 13 85 2 Iceland 2.8 11 44 44 Italy 2.5 31 61 9 Kosovo (UNR) 3.0 16 69 15 Latvia ... ... ... ... Lithuania 7.4 19 81 ... Malta 4.1 12 88 ... Moldova 7.0 18 ... 82 Netherlands ... ... ... ... Norway ... ... ... ... Poland 14.5 8 92 ... Portugal 10.7 37 37 26 Romania 1.4 1 95 4 Serbia 0.1 43 57 0 Slovakia 1.2 ... 100 ... Slovenia ... ... ... ... Spain 2.8 ... 34 ... Sweden 11.1 ... ... ... Switzerland ... ... ... ... Turkey ... ... ... ... UK: England & Wales 33.2 ... ... ... UK: Northern Ireland 24.5 31 53 16 UK: Scotland ... ... ... ... Mean 7.6 21 70 20 Median 5.1 18 69 15 Minimum 0.1 1 31 0 Maximum 33.2 43 100 82

320
Table 5.2.7.2 Probation Agencies Staff
Excluding volunteers Volunteers
Total rate per 100 000
pop.
of which, percentage: Total rate per 100 000
pop.
of which, percentage:
Competent for adults
Competent for minors
Competent for adults
Competent for minors
Albania ... ... ... ... ... ... Austria 5.2 ... ... 11.0 ... ... Belgium 11.0 ... ... ... ... ... Bulgaria 5.2 ... ... 0.2 ... ... Croatia 1.6 ... ... 0.0 ... ... Cyprus 5.1 100.0 100.0 0.0 ... ... Czech Republic 3.6 100.0 22.1 ... ... ... Denmark 7.9 100.0 100.0 0.0 ... ... Estonia 16.2 ... ... ... ... ... Finland 5.1 100.0 100.0 1.1 100.0 100.0 France 5.1 ... ... ... ... ... Georgia ... ... ... ... ... ... Germany ... ... ... ... ... ... Hungary 4.6 52.4 47.6 ... ... ... Iceland 2.8 ... ... 0.0 ... ... Italy 2.5 ... ... ... ... ... Kosovo (UNR) 3.0 ... ... ... ... ... Latvia ... ... ... ... ... ... Lithuania 7.4 ... ... ... ... ... Malta 4.1 100.0 100.0 ... ... ... Moldova 7.0 65.2 16.8 ... ... ... Netherlands ... ... ... ... ... ... Norway ... ... ... ... ... ... Poland 14.5 61.2 38.8 81.1 58.0 42.0 Portugal 10.7 ... ... ... ... ... Romania 1.4 ... ... 0.9 ... ... Serbia 0.1 100.0 ... 0.0 ... ... Slovakia 1.2 100.0 100.0 ... ... ... Slovenia ... ... ... ... ... ... Spain 2.8 ... ... ... ... ... Sweden 11.1 ... ... ... ... ... Switzerland ... ... ... ... ... ... Turkey ... ... ... ... ... ... UK: England & Wales ... ... ... ... ... ... UK: Northern Ireland 24.5 ... ... 0.0 ... ... UK: Scotland ... ... ... ... ... ... Mean 7 87.9 69.5 8.6 79.0 71.0 Median 5 100.0 100.0 0.0 79.0 71.0 Minimum 0 52.4 16.8 0.0 58.0 42.0 Maximum 25 100.0 100.0 81.1 100.0 100.0

321
5.2.8 Number of written reports provided by the Probation Agencies in 2010
Table 5.2.8.1 Number of written reports provided by the Probation Agencies in 2010 Total
rate per 100 000
pop.
of which, percentage of:
Pre-sentence
reports
Reports concerning supervision
during the execution of community
sanctions
Reports during the
execution of a suspend-
ed prison sentence
Reports concerning
the prerequi- sites of a
conditional release
Reports after a
conditional release
Albania ... 30.7 69.3 ... ... ... Austria ... ... ... ... ... ... Belgium 1083 36.0 ... ... 64.0 ... Bulgaria 3784 ... ... ... ... ... Croatia ... ... ... ... ... ... Cyprus ... ... ... ... ... ... Czech Republic 1093 83.6 ... ... 16.4 ... Denmark ... ... ... ... ... ... Estonia ... ... ... ... ... ... Finland 3010 92.9 7.1 ... ... ... France 1948 25.7 ... ... ... ... Georgia ... ... ... ... ... ... Germany ... ... ... ... ... ... Hungary 3904 18.0 ... ... 1.6 ... Iceland ... ... ... ... ... ... Italy ... ... ... ... ... ... Kosovo (UNR) 2636 64.6 30.2 ... ... 5.2 Latvia ... ... ... ... ... ... Lithuania ... ... ... ... ... ... Malta 494 100.0 ... ... ... ... Moldova 155 100.0 ... ... ... ... Netherlands ... ... ... ... ... ... Norway ... 100.0 ... ... ... ... Poland ... ... ... ... ... ... Portugal 1757 81.8 ... ... 18.2 ... Romania 2848 99.6 ... 0.4 ... ... Serbia 629 ... 100.0 0.0 ... ... Slovakia ... ... ... ... ... ... Slovenia ... ... ... ... ... ... Spain ... ... ... ... ... ... Sweden 3615 82.7 ... ... ... ... Switzerland ... ... ... ... ... ... Turkey ... ... ... ... ... ... UK: England & Wales ... ... ... ... ... ... UK: Northern Ireland 2124 64.6 14.4 ... ... 0.2 UK: Scotland ... 100.0 ... ... ... ... Mean 2077 72.0 44.2 0.2 25.1 2.7 Median 2036 82.7 30.2 0.2 17.3 2.7 Minimum 155 18.0 7.1 0.0 1.6 0.2 Maximum 3904 100.0 100.0 0.4 64.0 5.2

322
Table 5.2.8.2 Number of written reports provided by the Probation Agencies in 2010: Total
Total rate per 100 000
pop. of which, percentage of:
Reports on adults Reports on minors Albania ... ... ... Austria ... ... ... Belgium 1083 100 0 Bulgaria 3784 ... ... Croatia ... ... ... Cyprus ... ... ... Czech Republic 1093 99 1 Denmark ... ... ... Estonia ... ... ... Finland 3010 99 1 France 1948 ... ... Georgia ... ... ... Germany ... ... ... Hungary 3904 13 87 Iceland ... ... ... Italy ... ... ... Kosovo (UNR) 2636 18 82 Latvia ... ... ... Lithuania ... ... ... Malta 494 88 12 Moldova 155 29 71 Netherlands ... ... ... Norway ... ... ... Poland ... ... ... Portugal 1757 ... ... Romania 2848 40 60 Serbia 629 100 ... Slovakia ... ... ... Slovenia ... ... ... Spain ... ... ... Sweden 3615 ... ... Switzerland ... ... ... Turkey ... ... ... UK: England & Wales ... ... ... UK: Northern Ireland 2124 96 4 UK: Scotland ... 100 ... Mean 2077 71 35 Median 2036 96 12 Minimum 155 13 0 Maximum 3904 100 87
Notes on Tables 5.2.7.1 - 5.2.8.2
Albania: Tables 5.2.8.1-5.2.8.2: cover the period 1 June 2009 - 31 December 2010. Czech Republic: Tables 5.2.8.1-5.2.8.2: ’Pre-sentence report’ includes reports on community service and home arrests. ‘Reports concerning the prerequisites of a conditional release’ contain reports to conditional release with probation and documents to conditional release with probation. Estonia: Tables 5.2.7.1-5.2.7.2: figures for 31 December 2011 or the whole year 2011. Malta: Tables 5.2.8.1-5.2.8.2: Data do not include the periodical reports that are submitted to the courts regarding the behaviour of the person in cases of supervision before a final sentence or in cases of supervision at the post-sentencing stage.

323
UK: Northern Ireland: Tables 5.2.8.1-5.2.8.2: ‘Pre-Sentence- Reports’ includes both pre-sentence reports and shortened pre-sentence reports. ‘Reports concerning supervision during the execution of community sanctions’ include breach reports. ‘Reports after a conditional release’ include recall reports. Other reports not detailed in the tables 5.2.8.1-5.2.8.2 are included in the total figures.
5.3 Technical information This section provides information on the organization of probation agencies in each country. Experts of CEP helped to improve the questionnaires by inputting their special experience in the field of community sanctions and measures as well as the probation agencies. They checked the incoming data from the national ESB correspondents and involved their correspondents where necessary in order to improve data availability and quality. The following correspondents of CEP contributed to this chapter: Austria: Bernd Glaeser, NEUSTART, Wien
Croatia: Jana Spero, Ministry of Justice, Zagreb
Czech Republic: Michal Karban, Probation and Mediation Service, Prague
Estonia: Andri Ahven, Ministry of Justice, Tallinn
Italy: Roberta Palmisano, Office for Studies Research Legislation and International Relations, Rome
Malta: Mariella Camilleri, Department of Probation and Parole, Valetta
Moldova: Valeriu Melinte and Alisa Simicevscaia, Oficul Central de Probaţiune, Chişinău
Netherlands: Martine Wiekeraad, Reclassering Nederland, Utrecht
Romania: Evelina Obersterescu, Ministry of Justice, Bucharest
Slovakia: Ján Evin, Ministry of Justice, Bratislava
Sweden: Mats Johansson, Swedish Prison and Probation Service, Norrköping
UK: England and Wales: Francesca Emmett, National Offenders Management Service, Warrington
5.3.1 The structure and organization of Probation Agencies
All countries, with the exception of Iceland and Serbia, had probation agencies in their criminal justice system. Comments on the definition and existence of probation agencies are listed in table 5.3.1.1

324
Table 5.3.1.1 Comments on the definition and existence of probation agencies Albania The first probation service was set up in 2008. Austria “NEUSTART”, a private non-profit organisation, also offers various forms of
social work. Croatia Probation offices started opening in 2011 (12 local offices and a head office in
the Ministry of Justice). Cyprus There are no probation agencies as such, but the Social Welfare Service of
the Ministry of Labour and Social Insurance performs under court orders some of the tasks listed in the definition.
Czech Republic There is a Probation and Mediation Service (PMS). Supervision of the activities is carried out by the Ministry of Justice.
Estonia There are probation supervision departments of prisons. There are no separate agencies.
Italy A department of the Ministry of Justice manages probation through the offices for the execution of sentences in the community.
Lithuania Until 2012 there were correction inspections with territorial subdivisions. After a change in legislation, these were renamed as probation agencies (which have further tasks). Data refer to the year 2010.
Malta The current probation agency was set up in 2012; it is a department of the Ministry of Home Affairs and National Security. It replaced the former Probation Service (the prisons and the Probation Service were part of the Department for Correctional Services). Data refer to the year 2010.
Norway The probation offices are an integral part of the Correctional Services. They do not constitute a separate agency.
Portugal The Probation Agency, in the Ministry of Justice, is called the Directorate-General for Reintegration and Prison Services (DGRSP).
Romania There is a central department in the Ministry of Justice and 42 probation services (one in each county).
Serbia There are no probation agencies as specific bodies designated by law to implement probation activities. Instead, a department of the Prison Administration is responsible for alternative sanctions imposed on adult offenders, e.g., community service or suspended prison sentence with supervision, home incarceration (serving prison sentence at home) and measure of home detention curfew (supervision before a final sentence) - with or without electronic monitoring.
Slovakia Probation is performed by probation and mediation officers, who are in state employment; they work in the competent court. They are supervised and led by the Ministry of Justice (Criminal Law Department).
Slovenia Probation tasks are performed by social work centres, which are under the jurisdiction of the Ministry of Labour, Family, and Social Affairs.
Sweden The probation service consists of 34 offices, which are organised within the Prison and Probation Service.
Switzerland There is no uniform system for probation. UK: England & Wales The Probation Service is part of the National Offender Management Service
(NOMS) which itself is part of the Ministry of Justice. It comprises 42 probation areas which are coterminous with police force area boundaries and served by 35 probation trusts. The trusts are funded by NOMS and employ all staff except the Chief Probation Officer and are accountable to local boards and NOMS. The work of trusts is scrutinised both by NOMS and Her Majesty’s Inspector of Probation. The Probation Service works with the Police, the Prison Service and other organisations under the Multi Agency Public Protection Arrangement (MAPPA).
UK: N. Ireland The Probation Board is a non-departmental public body. It is sponsored by the Department of Justice.
UK: Scotland There is no central probation agency. It is the responsibility of local authority social work departments to arrange the appropriate supervision / work placements for offenders.

325
Table 5.3.1.2 Type and competency of the probation agencies
Number of agencies
Type Competency
Public Non-profit/
state subsidised
Private enterprise
Minors Adults
Pre-sentence
stage
Execution stage
Albania 1 X X X X X Austria 1 X X X X X Belgium 4 X X X X … … Bulgaria 1 X X X X X Croatia 1 X X X X Cyprus 1 X X X X X Czech Republic 1 X X X X X Denmark 1 X X X X X Estonia 1 X X X X X Finland 1 X X X X X X France 3 X X X X Georgia 1 X … … … … Germany 4 X X X X X X Hungary 1 X X X X X Iceland ... ... ... ... ... ... ... ... Italy 2 X X X Kosovo (UNR) 5 X X X X X X Latvia 1 X X X X X Lithuania 5 X X X X Malta 1 X X X X X Moldova 1 X X X X X Netherlands 5 X X X X X Norway … … … … … … … … Poland 2 X X X X X Portugal 1 X X X X X Romania 2 X X X X X Serbia ... ... ... ... ... ... ... ... Slovakia 1 X X X X X Slovenia … … … … … … … … Spain 3 X X X X Sweden 1 X X X X X X Switzerland 1 X X X Turkey 1 X X X X X UK: E & W 1 X X X X X UK: N. Ireland 1 X X X X X UK: Scotland 1 X X X X

326
Table 5.3.1.3 Tasks of the probation agencies competent for adults Pre-Sentence
Stage Execution Stage
Non-custodial sanctions
and measures
Suspended custodial sanctions
and measures
Unsuspended custodial sanctions of measures
while in prison
after conditional
release Providing information and / or reporting to the prosecuting authorities / court
30 countries: Albania Austria Belgium Bulgaria Croatia Cyprus Czech Rep Denmark Estonia Finland France Germany Hungary Kosovo (UNR) Latvia Malta Moldova Netherlands Norway Poland Portugal Romania Slovakia Slovenia Sweden Switzerland Turkey UK: E & W UK: N-Ireland UK: Scotland.
30 countries: Albania Austria Belgium Bulgaria Croatia Cyprus Czech Rep Denmark Finland Germany Hungary Italy Kosovo (UNR) Latvia Lithuania Malta Moldova Netherlands Norway Poland Portugal Romania Slovakia Slovenia Sweden Switzerland Turkey UK: E & W UK: N-Ireland UK: Scotland.
28 countries: Albania Austria Belgium Bulgaria Croatia Czech Rep Denmark Estonia Germany Hungary Italy Kosovo (UNR) Latvia Lithuania Malta Moldova Netherlands Norway Poland Portugal Romania Slovakia Slovenia Sweden Switzerland Turkey UK: E & W UK: Scotland.
12 countries: Albania Croatia Cyprus Estonia Hungary Kosovo (UNR) Latvia Netherlands Poland UK: E & W UK: N-Ireland UK: Scotland.
24 countries: Albania Belgium Bulgaria Croatia Czech Republic Denmark Estonia Finland Germany Hungary Italy Kosovo (UNR) Lithuania Moldova Netherlands Norway Poland Portugal Slovakia Sweden Turkey UK: E & W UK: N-Ireland UK: Scotland.
Monitoring and enforcing the conditions and / or measures imposed / ordered by the police / public prosecutor / court
20 countries: Albania Austria Belgium Croatia Czech Rep Estonia Germany Hungary Latvia Malta Moldova Netherlands Portugal Slovakia Slovenia Sweden Switzerland Turkey UK: E & W UK: Scotland.
32 countries: Albania Austria Belgium Bulgaria Croatia Cyprus Czech Rep Denmark Finland France Germany Hungary Italy Kosovo (UNR) Latvia Lithuania Malta Moldova Netherlands Norway Poland Portugal Romania Slovakia Slovenia Spain Sweden Switzerland Turkey
30 countries: Albania Austria Belgium Bulgaria Croatia Czech Rep Denmark Estonia France Germany Hungary Italy Kosovo (UNR) Latvia Lithuania Malta Moldova Netherlands Norway Poland Portugal Romania Slovakia Slovenia Spain Sweden Switzerland Turkey UK: E & W
4 countries: Albania France Spain UK: E & W
28 countries: Albania Austria Belgium Bulgaria Croatia Czech Rep Denmark Estonia Finland France Germany Hungary Italy Kosovo (UNR) Latvia Lithuania Moldova Netherlands Norway Poland Portugal Slovakia Spain Sweden Turkey UK: E & W UK: N-Ireland UK: Scotland.

327
Pre-Sentence Stage
Execution Stage Non-
custodial sanctions
and measures
Suspended custodial sanctions
and measures
Unsuspended custodial sanctions of measures
while in prison
after conditional
release UK: E & W UK: N-Ireland UK: Scotland.
UK: Scotland.
Assisting / providing guidance to the suspect
18 countries: Albania Austria Belgium Czech Rep Finland France Germany Hungary Latvia Malta Moldova Netherlands Slovakia Sweden Switzerland Turkey UK: E & W UK: Scotland.
26 countries: Albania Austria Belgium Bulgaria Czech Rep Denmark Finland France Germany Hungary Italy Latvia Malta Moldova Netherlands Norway Poland Portugal Slovakia Slovenia Spain Sweden Switzerland Turkey UK: E & W UK: Scotland.
23 countries: Albania Austria Belgium Bulgaria Croatia Czech Rep Denmark Estonia France Germany Hungary Italy Latvia Moldova Netherlands Norway Slovakia Spain Sweden Switzerland Turkey UK: E & W UK: Scotland.
13 countries: Albania Austria Cyprus Czech Rep France Hungary Italy Romania Spain Sweden Switzerland UK: E & W UK: Scotland.
23 countries: Albania Belgium Bulgaria Cyprus Czech Republic Denmark Estonia Finland France Germany Hungary Italy Kosovo (UNR) Moldova Netherlands Norway Slovakia Spain Sweden Switzerland Turkey UK: E & W UK: Scotland.
Finding alternatives to pre-trial-detention
13 countries: Albania Croatia Czech Rep Estonia France Germany Hungary Moldova Netherlands Portugal Slovakia UK: E & W UK: Scotland.
Finding possibilities for diversion (e.g., alternatives to a formal sentence)
16 countries: Albania Austria Croatia Czech Rep Denmark Estonia France Germany Hungary Latvia Moldova Netherlands Portugal Slovakia UK: E & W UK: Scotland.

328
Pre-Sentence Stage
Execution Stage Non-
custodial sanctions
and measures
Suspended custodial sanctions
and measures
Unsuspended custodial sanctions of measures
while in prison
after conditional
release Supervision during authorised leave from prison
Albania Belgium Croatia Italy Netherlands Portugal Spain Sweden UK: Scotland.
Table 5.3.1.4 Tasks of the probation agencies competent for minors
Pre-Sentence Stage
Execution Stage Non-custodial sanctions and
measures
Susp. cust. sanctions
and measures
Unsuspended custodial sanctions of measures while in prison
after cond. release
Providing information and / or reporting to the prosecuting authorities / court
16 countries: Austria Bulgaria Cyprus Czech Rep Denmark Estonia Finland Latvia Malta Moldova Netherlands Poland Slovakia Sweden Turkey UK: E & W.
16 countries: Austria Bulgaria Cyprus Czech Rep Denmark Finland Germany Latvia Malta Moldova Netherlands Poland Slovakia Sweden Turkey UK: E & W
15 countries: Austria Bulgaria Czech Rep Denmark Estonia Finland Latvia Malta Moldova Netherlands Poland Slovakia Sweden Turkey UK: E & W
7 countries: Cyprus Estonia Latvia Moldova Netherlands Poland UK: E & W
12 countries: Austria Bulgaria Czech Republic Estonia Finland Moldova Netherlands Poland Slovakia Sweden Turkey UK: E & W
Monitoring and enforcing the conditions and / or measures imposed / ordered by the police / public prosecutor / court
10 countries: Czech Rep Estonia Finland Malta Moldova Netherlands Poland Slovakia Turkey UK: E & W
16 countries: Austria Bulgaria Cyprus Czech Rep Denmark Finland Germany Latvia Malta Moldova Netherlands Poland Slovakia Sweden Turkey UK: E & W
15 countries: Austria Bulgaria Czech Rep Denmark Estonia Finland Latvia Malta Moldova Netherlands Poland Slovakia Sweden Turkey UK: E & W
1 country: UK: E & W
13 countries: Austria Bulgaria Czech Republic Estonia Finland Latvia Moldova Netherlands Poland Slovakia Sweden Turkey UK: E & W
Assisting / providing guidance to the suspect
11 countries: Austria Cyprus Czech Rep Finland Germany Malta Moldova Netherlands Slovakia Turkey UK: E & W
13 countries: Austria Bulgaria Czech Rep Denmark Finland Germany Latvia Moldova Netherlands Slovakia Sweden
13 countries: Austria Bulgaria Czech Rep Denmark Estonia Finland Latvia Moldova Netherlands Slovakia Sweden
6 countries: Austria Czech Rep Germany Moldova Sweden UK: E & W
13 countries: Austria Bulgaria Cyprus Czech Republic Denmark Estonia Finland Moldova Netherlands Slovakia

329
Turkey UK: E & W
Turkey UK: E & W
Sweden Turkey UK: E & W
Finding alternatives to pre-trial-detention
Austria Czech Rep Estonia Germany Malta Moldova Netherlands Slovakia UK: E & W
Finding possibilities for diversion (e.g., alternatives to a formal sentence)
Austria Denmark Estonia Germany Latvia Moldova Slovakia UK: E & W
Supervision during authorised leave from prison Austria, Netherlands
Table 5.3.1.5 Organizations, bureaus or persons able to initiate the involvement of the
probation agencies
Notes on tables 5.3.1.1 to 5.3.1.5
Austria: The organisation and system of the probation service in Austria is quite unique compared to other European countries. In Austria NEUSTART, a private non-profit organisation, offers various social work services to victims and offenders all over the country. The probation service in the narrow sense of a
Police Public Prosecutor
Examining Judge
Court of decision Lawyer Offender Other
8 countries: Czech Rep Denmark Latvia Moldova Netherlands Romania Slovakia Sweden.
21 countries: Albania Austria Belgium Croatia Czech Rep Denmark Estonia Finland Germany Hungary Kosovo(UNR) Latvia Moldova Netherlands Norway Poland Portugal Romania Slovakia Spain Turkey
21 countries: Albania Belgium Croatia Czech Rep Estonia Germany Hungary Kosovo(UNR) Latvia Malta Moldova Netherlands Portugal Romania Slovakia Spain Sweden Switzerland Turkey UK: N-Ireland UK: Scotland.
31 countries: Albania Austria Belgium Bulgaria Croatia Cyprus Czech Rep Denmark Estonia Finland France Georgia Germany Hungary Italy Kosovo(UNR) Latvia Lithuania Malta Moldova Netherlands Norway Portugal Romania Slovakia Spain Sweden Switzerland Turkey UK: N-Ireland UK: Scotland.
10 countries: Albania Belgium Czech Rep Denmark Kosovo(UNR) Moldova Poland Romania Slovakia Sweden.
10 countries: Albania Czech Rep Finland Hungary Kosovo(UNR) Latvia Romania Slovakia Switzerland UK: Scotland.
Belgium: Prison Administration. Croatia: Enforcement judge. Denmark: Prison Authorities. France: Sentencing judge. Italy Latvia: Victim. Netherlands: Municipality or prison. Romania: Prisons Slovakia UK: N-Ireland: Licencing Panel and Parole Commissioners.

330
supervision order is carried out either by professional social workers or volunteers trained and guided by professionals. Besides probation, victim-offender mediation (VOM), unpaid work as a diversion measure, unpaid work as an alternative to custody for fine defaulters and electronic monitoring are the main activities. At least part of the data in the tables on the tasks of probation agencies competent for adults and for minors stem from the update of v. Kalmthout & Durnescu “Probation in Europe” (www.cep-probation.org). Bulgaria: The Probation Agencies competent for minors are the same as the Probation Agencies competent for adults. There are no differences in the tasks of the Probation Agency when they are working with minor offenders and when they are working with adult offenders. Croatia: Probation tasks are conducted by Probation Officers in Probation Offices, on the basis of judicial decisions or requests by the State Attorney and by the penitentiary or prison. They refer to the presentence stage, to reporting, mainly supervision and community work connected with a suspended prison sentence and conditional release. The probation service has jurisdiction only over adult offenders. Denmark: The prison authorities decide on parole. At least part of the data in table on the tasks of probation agencies competent for adults stem from the ISTEP programme (www.probation-transfers.eu). Finland: At least part of the data in the table on the tasks of probation agencies competent for minors stem from the update of v. Kalmthout & Durnescu “Probation in Europe” (www.cep-probation.org). Hungary: At least part of the data in the table on the tasks of probation agencies competent for adults stem from the ISTEP programme (www.probation-transfers.eu). Italy: 5.3.1.3: The Ministry of Justice, Department of Penitentiary Administration manages probation in Italy, through the Offices for the Execution of Sentences in the Community (UEPE). Those Offices are staffed mainly with social workers of justice (probation officers). At the central level, at the Department Headquarters there is the Directorate General for the Execution of Sentences in the Community (DGEPE), providing coordination, directions and guidance to local Offices. Kosovo (UNR): The Service for Execution of Alternative Sanctions and social reintegration of convicted persons has duties and responsibilities referring to the presentence stage, to reporting, mainly supervision and community work connected with a suspended prison sentence and conditional release. Latvia: The police, the offender and other persons (if a victim) are able to initiate the mediation procedure. At least part of the data in the tables on the tasks of probation agencies competent for adults and for minors stem from the update of v. Kalmthout & Durnescu “Probation in Europe” (www.cep-probation.org). Lithuania: One of the main tasks of correction inspections was to ensure the execution of non-custodial sanctions, suspended custodial sentence, conditional release from prison, conditional early discharge from punishment and the penal measure – unpaid work. Correction inspections were not competent with the pre-sentence stage. On 1 July 2012 the new Probation Law came into force and all correction inspections were renamed as probation agencies. The tables in section 5.3.1.: Statistics on Probation Agencies and supervision refer to the year 2010. In Table 5.3.1.3 reports concerning risk assessment, criminogenic factors, behaviour of convicted persons, etc. were not written until 1 July 2012. The only information which was given to the court by correction inspections was about the execution of imposed sentence. Norway: Probation in Norway is provided by the Correctional Services of Norway through its probation offices. Such services are therefore provided by the state. The probation offices are an integral part of the Correctional Services and underlie the five regional levels and the central level where management of prison and probation are combined. They do not constitute a separate agency, and hence the "No answer" to the above question. At least part of the data in the tables on the existence of probation agencies, the tasks of probation agencies competent for adults, and on the involvement of probation agencies stem from the ISTEP programme (www.probation-transfers.eu). Poland: At least part of the data in the table on the tasks of probation agencies competent for adults stem from the ISTEP programme (www.probation-transfers.eu). Portugal: The Probation Agency is designated by law to implement activities and interventions such as supervision of and guidance and assistance to offenders. Its tasks refer to the presentence stage, to reporting, mainly supervision and community work connected with a suspended prison sentence and conditional release. At least part of the data in the table on the tasks of probation agencies competent for adults stem from the ISTEP programme (www.probation-transfers.eu). Romania: The probation services have a double role in coordination: methodological coordination performed by the Probation Department and financial and administrative coordination carried out by the tribunals using funds available in the Ministry of Justice's budget and directed into the tribunal's budget. The probation system has no powers regarding the alternatives to pre-trial detention and conditional

331
release for adults. There are alternatives to pre-trial detention with supervision carried out by the police. The penitentiary system, which could be included in the “other” category, can ask for the involvement of the probation service in the implementation of some rehabilitation programs for the inmates. Slovenia: At least part of the data in the tables on the existence of probation agencies and on the tasks of probation agencies competent for adults stem from the update of v. Kalmthout & Durnescu “Probation in Europe” (www.cep-probation.org). Spain: In the case of minors, the juvenile Public Prosecutor is able to initiate it. Sweden: 5.3.1.4 Minors under 15 years are not to be prosecuted but are handed over to the social services. Offenders between 15-17 years of age can instead of prison be sentenced to youth custody which is under the jurisdiction of the National Board of Institutional Care. Within SPPS the process is not different between adults and minors. 5.3.1.5 In Sweden the probation offices perform personal investigations at the request of the court. In respect of contract treatment (during the process before court) the case can be initiated by the offender, lawyer, court and, very rarely by the prosecutor. Normally it is the court that initiates the probation offices. At least part of the data in the table on the tasks of probation agencies competent for adults stem from the ISTEP programme (www.probation-transfers.eu) Switzerland: At least part of the data in the table on the tasks of probation agencies competent for adults stem from the update of v. Kalmthout & Durnescu “Probation in Europe” (www.cep-probation.org). UK: England & Wales: The Probation Service has a statutory requirement to assist the criminal courts by the provision of reports and to supervise offenders in the community. They work with other agencies to provide a multi-agency approach to deal with offenders. UK: Northern Ireland: The main services provided by PBNI are • Assessment of convicted offenders and preparation of reports for Courts, Parole Commissioners and others. • Supervision of offenders subject to a range of court orders and sentences at any given time. • Delivery of behavioural change programmes for offenders in custody and in the community covering areas such as violent offending, sexual offending and drug and alcohol misuse. • Provision of a Victim Information Scheme to any registered person who has been the direct victim of a criminal offence where the offender is subject to supervision. • Work alongside statutory and other partners to minimise the risk of harm posed by offenders.
5.3.2 Description of data recording methods for Tables on Supervision
Stock data
The reference date for stock data is 31st December 2010. One country (Slovakia) refers to the average stock in 2010, and four countries use another reference date: Bulgaria (1st December 2010), Croatia (31 December 2011), Cyprus (31st December 2012), Sweden (1st January 2010).
Minors
In most countries minors are included in the total:
Minors are included in the total of Supervision
Minors are not included in the total of Supervision
Minors are partially included in the total of Supervision
24 countries: Albania, Austria, Bulgaria, Cyprus, Denmark, Estonia, Finland, France, Georgia, Germany, Hungary, Iceland, Kosovo (UNR), Latvia, Lithuania, Malta, Moldova, Norway, Poland, Romania, Slovakia, Sweden, Turkey, UK: Northern Ireland.
11 countries: Croatia, Czech Republic, France, Italy, Netherlands, Serbia, Slovenia, Spain, Switzerland, UK: England and Wales, UK: Scotland.
2 countries: Belgium, Portugal.
Five countries apply a different age bracket for minors in correctional statistics compared to the one used in conviction statistics: Cyprus (14-20), Malta (9-18), Poland (0-21), Portugal (16-21), Sweden (15-21).

332
Notes on minors:
Belgium: Only minors that are judged by a court for adults, for a traffic offence or for a very serious offence are included. Croatia: The probation service in Croatia has jurisdiction only over adult offenders. Czech Republic: Minors between age 15–17 are partly liable under criminal law and minors age 14 or less are not liable under criminal law. Finland: Minors (15-17) are included. Italy: Minors do not fall under the competence of the Department of Penitentiary Administration, but under the competence of the Department of Juvenile Justice, which is also within the Ministry of Justice. Malta: A minor is a person under 18 years of age. A minor is chargeable from nine years of age upwards. The Juvenile Court hears charges against persons under the age of 16, unless the offence is committed together with a person over 16 years of age. A minor aged between 9 and 14 is exempt from criminal liability if it is established that the offensive act is committed without malice. Sweden: SPPS defines youth or minors between the age 15-20. UK: Scotland: Information on minors is not available centrally. UK: Northern Ireland: The age bracket used for minors within PBNI is 10-17 years old. Written rules Countries having written rules regulating the way in which the data shown for Supervision are recorded
Countries without written rules regulating the way in which the data shown for Supervision are recorded
18 countries: Belgium, Croatia, Cyprus, Estonia, Finland, Germany, Hungary, Iceland, Netherlands, Poland, Portugal, Romania, Serbia, Sweden, Switzerland, Turkey, UK: England and Wales, UK: Northern Ireland.
10 countries: Bulgaria, Czech Republic, Latvia, Lithuania, Malta, Moldova, Slovakia, Slovenia, Turkey, UK: Scotland.
Notes:
Croatia: There are specific rules on keeping data for each person under probation (what data will be collected, how and when it will be inserted in the Probation Information System, etc.) Italy: Decree of the Minister of Justice dated 24th May 2012, nr 102. “Regulations concerning the type and the modality of extraction, gathering and transmission of the statistical data of the Administration”. Malta: Although there are no written rules regarding how data is to be recorded, there are written rules included in Standard Operational Procedures regarding the type of information the probation officers have to submit to the person responsible for data collection. These rules refer mainly to when breach action is taken and to risk management. Poland: Data shown in tables collected by Ministry of Justice. There must be written rules regulating the way of data recording to be able to compare year over year, but they are available only for the Ministry of Justice.
The definition of Supervision
Notes:
Denmark: One can serve several measures and sanctions at the same time. It is the first measure referenced in the data base which is used here. Estonia: ‘Probation as a sanction in its own right’: supervision of minors who were released from punishment. ‘Other forms of supervision of a non-custodial sanction’: community service 10-240 hours. ‘Supervision after conditional release from prison’: includes electronic monitoring. ‘Other’: short-time unconditional prison sentence, followed by conditional prison sentence; community service max 1460 hours, applied instead of sentenced imprisonment up to 2 years. Finland: ‘Probation as a sanction in its own right’: consists of community service sentences. ‘Other forms of supervision of non-custodial sanctions’: juveniles. ‘Other’ = juvenile punishment.

333
France: One can serve several measures and sanctions at the same time. It is the first measure referenced in the data base which is used here. Hungary: ‘Other’: means victim-offender mediation cases. Italy: ‘Supervision before final sentence’ does not exist; ’Probation as a sanction of a non-custodial sanction’: Home detention; ‘Supervision after conditional release from prison: Assignment to the Probation Service from detention. Malta: Semi-imprisonment allows for part-time institutionalisation for a period of not more than six weeks. In practice, to date, part-time imprisonment has not been applied through this provision. Supervision includes supervision with EM. Semi-imprisonment includes semi-liberty and home-arrest. ‘Other forms of supervision of a non-custodial sanction’ include a community service order and combination order, and a community service order combined with a probation order. Netherlands: Semi-imprisonment includes semi-liberty and home-arrest. These are not executed by the probation agencies, but by the Custodial Institutions Agency. Norway: Norway only knows the ‘community sentence’ as a sanction imposed by the court (represented in ‘Other forms of supervision of a non-custodial sanction’). Other activities by probation offices include the supervision and implementation of a conditional sentence and of early release from an unconditional prison sentence. In addition, probation offices are responsible for supervising home detention - both with and without electronic monitoring ordered by the Correctional Services. Portugal: The number of persons supervised by the probation agencies doesn’t include the forms of ‘part-time-detention’, semi-detention and semi-liberty. The supervision on probation refers to a ‘suspended sentence’ and to a ‘conditional sentence’. Additionally, the imposition of a sentence can be conditionally deferred by imposing one or more probation measures. Such probation measures may be included in the judgment itself or determined in a separate probation decision taken by a competent authority. ‘Alternative sanction’ means a sanction, other than a custodial sentence, a measure involving deprivation of liberty or a financial penalty, imposing an obligation or instruction. Sweden: Semi-imprisonment does not apply. Others include e.g., psychiatric care, suspended sentence and others. Switzerland: Other: social assistance (Art. 96 CP). The figures only include official mandates. Turkey: 'Other forms of supervision of a non-custodial sanction' reflects cases of supervised sentenced administered at home (type of house arrest for convicts). '....as a security measure after having fully served a prison sentence or other form of detention' refers to repeat offenders supervised by probation service. 'other' - includes also cases of deferred decision in which supervision was ordered. UK: Northern Ireland: A person may be given more than one type of PBNI supervision order which may result in multiple order types per person for both annual input figures and point in time stock figures. A person will be counted once in the totals of each table and once per sub-category but may be included in multiple sub-categories. Sub-categories therefore will not sum to the total figures presented. ‘Other forms of supervision of a non-custodial sanction’ include – Community Service Order, Combination Order, Supervision and Treatment Order and Community Responsibility Order. ‘Supervision after conditional release from prison include’ - Custody Probation Order, Determinate Custodial Sentence, Extended Custodial Sentence, GB Licence, Indeterminate Custodial Sentence, Juvenile Justice Centre Order, Life Sentence/Licence and Sex Offender Licence. ‘Other’ includes people currently in custody.
5.3.3 Description of data recording methods for Tables on Community Service
Stock data
The reference date for stock data is 31st December 2010. Two countries (Slovakia and Slovenia) refer to the average stock in 2010, three countries use another reference date: Bulgaria (1st December 2010), Cyprus (31st December 2012), Sweden (1st January 2010).

334
Minors
In most countries minors are included in the total:
Minors are included in the total of Supervision
Minors are not included in the total of Supervision
Minors are partially included in the total of Supervision
20 countries: Albania, Austria, Bulgaria, Cyprus, Denmark, Estonia, Finland, Hungary, Iceland, Italy, Kosovo (UNR), Latvia, Lithuania, Malta, Moldova, Norway, Romania, Slovakia, Sweden, UK: Northern Ireland.
10 countries: Croatia, Czech Republic, Netherlands, Poland, Serbia, Slovenia, Spain, Switzerland, UK: England and Wales, UK: Scotland.
2 countries: Belgium, Portugal.
Four countries apply a different age bracket for minors in correctional statistics compared to the one used in conviction statistics: Cyprus (14-20), Malta (16-18), Poland (under 21), Sweden (15-21).
Notes on minors:
Malta: Minors under 16 years of age cannot be given a Community Service Order. Poland: Generally, persons between 13 and 17 are treated as a minor in all proceedings (police, prosecution and court). The system of probation includes also persons until 21 years of age if they have been sentenced before they are 18. Also every child under 13 years old may fall under the probation service but not for committing a crime. Sweden: SPPS defines youth or minors between the age 15-20. Turkey: A law on community service has just been enacted in April 2012. Hence no statistics at this time. UK: Northern Ireland: The age bracket used for minors within PBNI is 10-17 years old.
Written rules
Countries having written rules regulating the way in which the data shown for Community Service are recorded
Countries without written rules regulating the way in which the data shown for Community Service are recorded
16 countries: Belgium, Cyprus, Estonia, Finland, Hungary, Iceland, Latvia, Netherlands, Poland, Portugal, Romania, Serbia, Sweden, Switzerland, UK: England and Wales, UK: Northern Ireland.
9 countries: Bulgaria, Croatia, Czech Republic, Italy, Lithuania, Malta, Slovakia, Slovenia, UK: Scotland.
Notes:
Poland: Data are collected by the Ministry of Justice. There must be written rules regulating the way of data recording to be able to compare year over year, but they are available only for the Ministry of Justice.
The definition of Community service Notes:
Cyprus: The following sentence needs to be added to the definition of community service: 'for a definite number of hours, as ordered by the Court'. Estonia: Community service as a condition for dismissal in the pre-sentence stage and community service as a way of serving a custodial sentence. Iceland: The Prison and Probation Administration decides whether a prison sentence is to be executed in the form of community service and what type of community service the person sentenced is to perform in

335
each individual case. The same applies to the length of time for which community service is to be performed. However, this period may never be shorter than two months. Lithuania: In the Criminal Code community service exists as a non-custodial sanction in its own right and unpaid work as one of the penal (for adults) or educational (for minors) measures which can be imposed for persons who are exempted from criminal responsibility, exempted from penalty, suspended from custodial sentence or released from prison. Community service and unpaid work can be executed only with the consent of the convicted person. Community service for fine defaulters can be imposed only if the convicted person does not have money. Norway: Unpaid labour is only one of the elements that may be imposed in the framework of a community sentence. In 2010, it comprised around 62% of all hours implemented. Other activities may involve individual crime-prevention oriented conversations, education, training, skills, participation in behavioural programs, treatment, mediation, etc. The contents of Norwegian community sentences are therefore more extensive than unpaid labour. It is to a very large degree decided by the Correctional Services what the specific contents of the hours imposed by the court will be in individual cases. Portugal: Community service may be combined with other legal measures. Community service is a probation decision that can be an alternative sanction or can be a replacement of an amendment. As an alternative sanction, under certain circumstances, the judge can replace imprisonment with community service. Romania: Community service is not a sanction in its own right, but a condition of a suspended sentence that can be imposed on minors and adults. Serbia: Community service is implemented in the Serbian criminal justice system as a non-custodial sanction in its own right. It is applicable only to adults.
5.3.4 Description of data recording methods for Tables on Electronic monitoring
Stock data
The reference date for stock data is 31st December 2010. Five countries use another reference date: Bulgaria (1st December 2010), Croatia (31st December 2011), Denmark (14 December 2010), Sweden (1st January 2010), UK: Northern Ireland (30 November 2010).
Minors: Minors are included in the total of Electronic monitoring
Minors are not included in the total of Tables for Electronic monitoring
Minors are partially included in the total of Tables for Electronic monitoring
6 countries: Austria, Denmark, Estonia, Norway, Sweden, UK: England and Wales.
9 countries: Belgium, Croatia, Netherlands, Poland, Serbia, Spain, Switzerland, UK: Northern Ireland, UK: Scotland.
2 countries: Bulgaria, Portugal.
Three countries apply a different age bracket for minors in correctional statistics compared to the one used in conviction statistics: Portugal (16-21), Sweden ( 15-21), Northern Ireland (14-18).
Notes on minors:
Belgium, Poland, Serbia: Electronic monitoring is used for adults only. Bulgaria: Electronic monitoring cannot be applied to minors under 16 years of age.

336
Type and technique of electronic monitoring:
Notes:
Estonia: The majority of persons are monitored by use of a base station at the offender's home. Tracking movement means use of GPS equipment. Netherlands: There are two types of EM executed: Radio Frequence Identification (RFId) and Global Positioning System (GPS). Norway: The curfew implies that the offender will have to be at home during certain hours and has to be out and active (work, school, program, other - decided by the Correctional Services) during the rest of the time. His or her presence during out-time is checked through contact persons and random visits. Portugal: Tracking of movement is used only in domestic violence restraint orders. Sweden: The electronic supervision is made by radio frequency with electronic tag monitoring the offender in the home. Written rules
Countries having written rules regulating the way in which the data shown for Electronic monitoring are recorded
Countries without written rules regulating the way in which the data shown for Electronic monitoring are recorded
8 countries: Belgium, Estonia, Netherlands, Poland, Serbia, Sweden, Switzerland, UK: Northern Ireland.
5 countries: Bulgaria, Croatia, France, UK: England and Wales, UK: Scotland.
The definition of electronic monitoring
Albania: A new law on electronic monitoring was approved in 2011. It is not implemented yet, but the Ministry of Justice is preparing the infrastructure.
Croatia: Legislation provides for application of electronic monitoring with parole or with investigative imprisonment at home. However, it is still not applied in practice since it has not been fully implemented in the criminal justice system. Therefore, no data is available.
Czech Republic: Electronic monitoring does not exist independently in our criminal justice system. Electronic monitoring could be applicable in home detection within a measure of a home arrest from 1 January 2010, and a pilot test has been in progress since 2012.
Denmark: Electronic monitoring is in all cases an alternative way of serving a full (short) prison sentence. The decision is made by the Prison Service.
Technique Type Electronic tag Telephone
calls
Other electronic
system
Electronic curfew
Tracking of movement
17 countries: Austria, Belgium, Bulgaria, Denmark, Finland, France, Netherlands, Norway, Poland, Portugal, Serbia, Spain, Sweden, Switzerland, UK: England and Wales, UK: Northern Ireland, UK: Scotland.
3 countries: Bulgaria, Poland, UK: England and Wales.
2 countries: Netherlands UK: England and Wales.
12 countries: Austria, Belgium, Estonia, Netherlands, Norway, Poland, Portugal, Sweden, Switzerland, UK: England and Wales, UK: Northern Ireland, UK: Scotland.
7 countries: Bulgaria, Estonia, Netherlands, Poland, Portugal, Russia, Spain.

337
Finland: The law on electronic monitoring came into force at the end of 2011 in Finland. It was therefore not in use in 2010 and so far there are no available statistics on its use.
Lithuania: Electronic monitoring was not used in 2010. The new Probation Law came into force on 1 July 2012. This law also regulates the use of electronic monitoring.
Netherlands: Electronic monitoring in the Netherlands is not a sanction in its own right, but it is a condition attached to: - pre-trial supervision by probation agencies - fully or partially suspended custodial sentence with probation - home arrest - conditional release with probation.
Norway: Since electronic monitoring is a way of executing unconditional imprisonment granted by the Correctional Services, breach of conditions results in transfer to prison, and this is done without further intervention by the judicial authorities.
Spain: Electronic monitoring is not an autonomous alternative sanction. However, alternatives to imprisonment are only applied to prisoners during the execution of the imprisonment sanction. Data for adults are recorded as an input. Electronic monitoring is not provided by the juvenile criminal law.
Turkey: Electronic monitoring started to be used on experimental basis in 2012. No widespread use or statistics at this time.
5.3.5 Additional information on the staff and reports of Probation Agencies
Notes on the definition of Probation agencies staff
Albania: The probation service cooperates with many non-governmental organisations in providing services. There is a regulation on agreements and procedures for collaboration. Austria: There is no distinction between social workers who are responsible for adults or minors. Croatia: Probation offices were set up in 2011. Today, there are 12 local offices in the territory of Croatia, plus the head office in the Ministry of Justice. The most recent office to be opened was the office in Dubrovnik, in January 2013. Due to changes in the Criminal Code, on 1 January 2013 a new Probation Act entered into the force, giving the probation service more tasks. Volunteers do not perform probation tasks. Czech Republic: The category of qualified probation workers is divided into three subcategories: Probation officer– Chief of units of PMS, probation officer and probation assistant. Denmark: Most probation staff are qualified probation workers. Iceland: The staff of the Prison and Probation Administration includes the Director of the PPA. Reports are written in nearly all cases, all cases in community service and probation releases. Italy: 'Qualified Probation Workers' include Senior Executives, Executives and Directors of UEPEs. 'Other probation workers' include indentured psychologists. Malta: The minimum requirement for a qualified probation worker is a post-graduate diploma in Probation Service, or the equivalent. This post-graduate diploma carries an MQF Level of 7. Volunteers are not used in carrying out probation tasks. All probation workers are qualified to work with all types of offenders and on the whole range of services offered. Romania: In the probation system all the probation staff works both with minors and adults.

338
5.4 Sources Albania Ministry of Justice - General Directory of Probation Service,
unpublished. Part of the data on Probation Agencies Staff are published. Austria NEUSTART - Bewährungshilfe, Konfliktregelung, Soziale Arbeit
www.neustart.at. Belgium Database of the Houses of Justice. Bulgaria Ministry of Justice – General Directorate Execution of Penalties:
Statistics on Execution of Penalties, not published. Croatia The probation service in the Republic of Croatia is working with a
special Probation Information System database, which is available to probation officers. Through the database, the head office can extract different statistical data.
Cyprus Source of data: Evaluation study for the 'Probation supervision with or without community service' Programme, 2005-2011 (Social Welfare Services, 2012). The data provided in the above tables is for the year 2011, and NOT for the year 2010 (i.e., the latest data available is provided). Data on Probation Agencies Staff in 2010 and Number of written reports: Social Welfare Services Internal records.
Czech Republic Data export of Probation register of administrative information system of PMS and Administrative information system of PMS. Data on Probation Agencies Staff in 2010 and Number of written reports: Statistics of Conversion staff of PMS (1.12. 2010) and data export of Probation register of administrative information system of PMS.
Denmark 'Statistics 2010' from the Prison and Probation Service. http://www.kriminalforsorgen.dk/Årlige-statistikberetninger-1365.aspx.
Estonia Ministry of Justice, not published. France Ministry of Justice. Finland Criminal Sanctions Agency database and the following publication:
Rikosseuraamuslaitoksen tilastoja 2010. Germany Statistisches Bundesamt (Ed.), Bewährungshilfe 2010, Wiesbaden
2011. Data on supervision as a security measure after having fully served a prison sentence or other form of detention in table 5.2.1.1 stem from a separate source and are available here: http://www.dbh-online.de/fa/Zahlen-Laender_2011_DBH.pdf
Hungary Probation Client Tracking System. Data on Probation Agencies Staff in 2010 and Number of written reports: Probation yearly report about 2010.
Iceland Prison and probation Administration. Italy Directorate General for the Execution of Sentences in the Community
(DGEPE) - Observatory on Community Sanctions and Measures. Published on the Internet website www.giustizia/statistiche.
Kosovo (UNR) The data are taken from the 2010 annual report of the Kosovo Probation Service (KPS).
Latvia Council of Europe Annual Penal Statistics – SPACE II – 2010. Lithuania Prison Department under the Ministry of Justice of the Republic of
Lithuania – Planning and Project Management Division, not published. Malta The source for this data is the Department of Probation and Parole. In
instances where statistical information is marked as not available, other possible sources, such as police data and courts data, were taken into account.
Moldova Ministry of Justice – Central Probation Office. Netherlands SPACE II 2010. Norway Registration system of the Correctional Services of Norway. Poland Ministry of Justice. Portugal Directorate-General for Reintegration and Prison Services (DGRSP). Romania Data are gathered by the Probation Department and they partially
published on the Ministry of Justice website http://www.just.ro/Sectiuni/Direc% C5%A3ii/ Direc%C.5%A3iadeProba% C5%A3iune/datestatisticeprobati une/tabid/2466/Default.aspx
Serbia Annual Reports of Prison Administration Operations, Ministry of Justice, Prison Administration Available online: www.uiks.mpravde.gov.rs.

339
Slovakia Ministry of Justice of the Slovak Republic, Department of Informatics and Project Management, Department of Sectoral Statistics and Reporting, not published.
Spain Council of Europe Annual Penal Statistics (SPACE). Survey 2010 The National Statistics Institute of Spain (INE): http://www.ine.es.
Sweden Register of SPPS; KVR. Switzerland Source of the data for Supervision: http://www.bfs.admin.ch/bfs/portal/fr/
index/themen/19/03/05/key/bewaehrungshilfe.html Source of the data for Community Service: http://www.bfs.admin.ch/bfs/portal/en/index/themen/19/03/05/key/vollzug_von_sanktionen/alt_vollz.html Source of the data for Electronic Monitoring: http://www.bfs.admin.ch/ bfs/portal/en/index/themen/19/03/05/key/vollzug_von_sanktionen/elektronisch.html
Turkey Ministry of Justice, General Directorate for Probation website, Statistics http://www.cte-ds.adalet.gov.tr/menusayfalari/bilgibankasi/istatistik/ istatistik/istatistik.htm
UK: England & Wales
Source: Ministry of Justice - Justice Statistics Analytical Services - Prison Probations and Re-offending Team, Probation statistics not all published.
UK: Northern Ireland Information included is derived from PBNI’s Case Management System – Probation Information Management System (PIMS). Source of the data for Electronic monitoring: EM Service Supplier.
UK: Scotland Criminal Justice Social Work Statistics bulletin published by the Scottish Government.

340

341
6. National Victimization Surveys
6.1 General comments 6.1.1 Introduction
This chapter provides information on the national victimization surveys conducted in the countries participating in the European Sourcebook. It does not include information on local, regional or cross-national victimization surveys such as the ICVS (International Crime Victim Survey) and the EU-ICS (European Union Crime and Safety Survey), nor on surveys on specific types of victimisation such as the European Union minorities and discrimination survey (EU-MIDIS)33 and the Violence against women in the EU survey34 – both conducted by the European Union Agency for Fundamental Rights (FRA) – or surveys on crimes against businesses.
Thus, this chapter covers general victimisation surveys with national representative samples. To improve comparability with other types of crime data included in the different editions of the European Sourcebook, data were asked for five different victimization surveys (1990, 1995, 2000, 2005 and 2010) covering the period 1990 to 2010.35
Readers must keep in mind that the results of national victimization surveys conducted in different countries cannot be compared because their methodology differs (see point 6.3.Technical information).
As some countries used the ICVS as an alternative for a national survey, Table 6.1.1 indicates the European countries that participated in the different waves of the ICVS. Readers will find the relevant information in the ICVS publications (see http://www.unil.ch/icvs).
The following data on national victimization surveys were requested from the countries: - Availability and periodicity of national victimization surveys (see Table 6.1.2). - Wording of the questions for the following offences: bodily injury/assault, sexual assault,
robbery, theft of personal property, theft of a motor vehicle, domestic burglary and corruption (see Table 6.1.5 and 6.2.1.3 to 6.2.9.2).
- Wording of the questions on trust in the police and feelings of safety (see Table 6.1.5, 6.2.8.2 and 6.2.9.2).
- Methodology of the national victimization surveys: sample size (see Table 6.3.1), sample design (see Table 6.3.2), sample representativeness (see Table 6.3.3), response rate (see Table 6.3.4), age range of the persons interviewed (see Table 6.3.5) and survey mode (see Table 6.3.6).
- Main results of the national victimization surveys for the following indicators: prevalence and incidence of victimization in the last 12 months, and percentage of victims reporting to the police, for the following offences: bodily injury/assault, sexual assault, robbery, theft of personal property, theft of a motor vehicle, domestic burglary and corruption (see Tables 6.2.1.1 to 6.2.7.1).
- Incidence is not reported here, as the results are not at all comparable. The data received can be found in the raw data available in the website (http://www.unil.ch/europeansourcebook).
36 countries answered the section of the questionnaire covering national victimization surveys. 9 of them (Austria, Cyprus, Germany, Greece, Kosovo, Malta, Russia, Serbia, and Slovakia) had never conducted a national victimization survey; 13 others conduct a periodical national victimization survey (see Table 6.1.2 for a list of countries and frequency of the surveys); while
33 See http://fra.europa.eu/en/project/2011/eu-midis-european-union-minorities-and-discrimination-survey. 34 See http://fra.europa.eu/en/publication/2014/vaw-survey-main-results 35 For a full review of the victimization surveys conducted in the EU countries since their first developments in the 1960s until 2008, see Aebi M.F. & Linde A. (2010). A review of victimisation surveys in Europe from 1970 to 2010. In van Dijk J., Mayhew P., van Kesteren J., Aebi M.F. & Linde A. Final report on the study on crime victimisation (pp. D1-D76). Tilburg: Intervict/PrismaPrint Tilburg. Available online at: http://www3.unil.ch/wpmu/icvs/key-publications

342
13 countries do not conduct a periodical survey but have conducted one or more national victimization surveys (see Table 6.1.3 for a list of countries and characteristics of such surveys).
Table 6.1.1 European countries participating in the different waves of the ICVS with national samples
1989 1992 1996 2000 2004/05 Austria
•
*
Belgium • •
• * Bulgaria
•
Denmark
* Estonia
• • • •
Finland • • • • * France •
• • *
Germany •
* Greece
*
Hungary
* Iceland
•
Ireland
* Italy
• •
*
Luxembourg
* Netherlands • • • • * Norway •
•
Poland
• • • • Portugal
• *
Spain •
* Sweden
• • • •
Switzerland •
• • • UK: England & Wales • • • • * UK: Northern Ireland •
• • •
UK: Scotland •
• • •
* National surveys in 2005 plus 800 extra cases in the capital city. Source: Adapted from http://www3.unil.ch/wpmu/icvs/sources-for-the-icvs/
Table 6.1.2 Countries with periodical national victimization surveys and frequency of such surveys
Country Frequency Belgium Normally every two years, but the most recent survey was in 2008/2009 Bulgaria Annual Denmark Annual Georgia Last three years 2010-2012 France Annual Iceland Annual for the capital area but every two years for the whole country Ireland 3-6 years Italy About every five years Netherlands Annual Sweden Annual Turkey Annual UK: England & Wales Continuous (with annual results) UK: Northern Ireland Continuous (with annual results) UK: Scotland Every two years
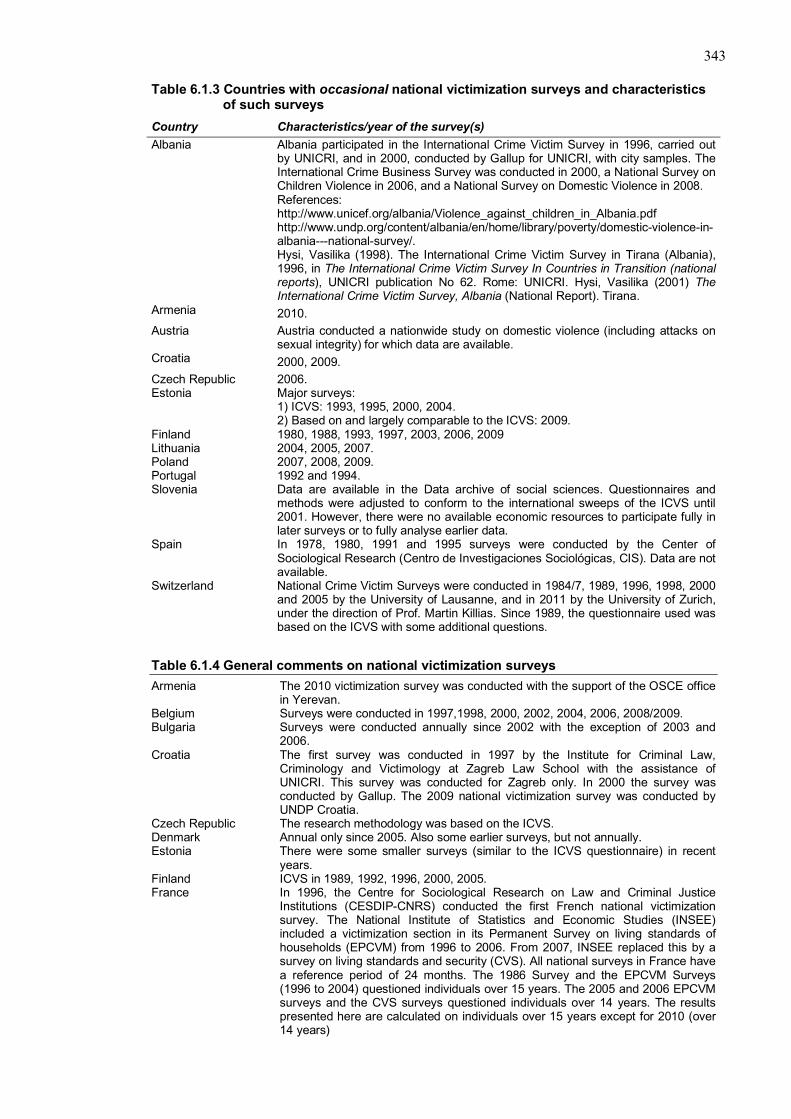
343
Table 6.1.3 Countries with occasional national victimization surveys and characteristics of such surveys
Country Characteristics/year of the survey(s) Albania
Albania participated in the International Crime Victim Survey in 1996, carried out by UNICRI, and in 2000, conducted by Gallup for UNICRI, with city samples. The International Crime Business Survey was conducted in 2000, a National Survey on Children Violence in 2006, and a National Survey on Domestic Violence in 2008. References: http://www.unicef.org/albania/Violence_against_children_in_Albania.pdf http://www.undp.org/content/albania/en/home/library/poverty/domestic-violence-in-albania---national-survey/. Hysi, Vasilika (1998). The International Crime Victim Survey in Tirana (Albania), 1996, in The International Crime Victim Survey In Countries in Transition (national reports), UNICRI publication No 62. Rome: UNICRI. Hysi, Vasilika (2001) The International Crime Victim Survey, Albania (National Report). Tirana.
Armenia 2010. Austria Austria conducted a nationwide study on domestic violence (including attacks on
sexual integrity) for which data are available. Croatia 2000, 2009. Czech Republic 2006. Estonia Major surveys:
1) ICVS: 1993, 1995, 2000, 2004. 2) Based on and largely comparable to the ICVS: 2009.
Finland 1980, 1988, 1993, 1997, 2003, 2006, 2009 Lithuania 2004, 2005, 2007. Poland 2007, 2008, 2009. Portugal 1992 and 1994. Slovenia Data are available in the Data archive of social sciences. Questionnaires and
methods were adjusted to conform to the international sweeps of the ICVS until 2001. However, there were no available economic resources to participate fully in later surveys or to fully analyse earlier data.
Spain In 1978, 1980, 1991 and 1995 surveys were conducted by the Center of Sociological Research (Centro de Investigaciones Sociológicas, CIS). Data are not available.
Switzerland National Crime Victim Surveys were conducted in 1984/7, 1989, 1996, 1998, 2000 and 2005 by the University of Lausanne, and in 2011 by the University of Zurich, under the direction of Prof. Martin Killias. Since 1989, the questionnaire used was based on the ICVS with some additional questions.
Table 6.1.4 General comments on national victimization surveys Armenia The 2010 victimization survey was conducted with the support of the OSCE office
in Yerevan. Belgium Surveys were conducted in 1997,1998, 2000, 2002, 2004, 2006, 2008/2009. Bulgaria Surveys were conducted annually since 2002 with the exception of 2003 and
2006. Croatia The first survey was conducted in 1997 by the Institute for Criminal Law,
Criminology and Victimology at Zagreb Law School with the assistance of UNICRI. This survey was conducted for Zagreb only. In 2000 the survey was conducted by Gallup. The 2009 national victimization survey was conducted by UNDP Croatia.
Czech Republic The research methodology was based on the ICVS. Denmark Annual only since 2005. Also some earlier surveys, but not annually. Estonia There were some smaller surveys (similar to the ICVS questionnaire) in recent
years. Finland ICVS in 1989, 1992, 1996, 2000, 2005. France In 1996, the Centre for Sociological Research on Law and Criminal Justice
Institutions (CESDIP-CNRS) conducted the first French national victimization survey. The National Institute of Statistics and Economic Studies (INSEE) included a victimization section in its Permanent Survey on living standards of households (EPCVM) from 1996 to 2006. From 2007, INSEE replaced this by a survey on living standards and security (CVS). All national surveys in France have a reference period of 24 months. The 1986 Survey and the EPCVM Surveys (1996 to 2004) questioned individuals over 15 years. The 2005 and 2006 EPCVM surveys and the CVS surveys questioned individuals over 14 years. The results presented here are calculated on individuals over 15 years except for 2010 (over 14 years)

344
Georgia The surveys were carried out with the financial support of the EU. Every wave of the survey contained 3000 respondents. Only results from 2010 are presented.
Greece No official crime or victim survey has been conducted. Ireland 1998, 2003, 2006 and 2010. Kosovo (UNR) Kosovo has never conducted a national victimization survey. Lithuania In Lithuania the methodology depends on the institutions conducting the
victimization survey. Two institutions (the Ministry of the Interior of the Republic of Lithuania, the Police Department under the Ministry of the Interior) have, since 2011, conducted one victimization survey. Other surveys relate to victimization of a single group such as young people or female victims of violence. ICVS surveys were conducted by the Law Institute of Lithuania in 1997, 2000 and 2005.
Portugal A victimization survey was conducted in 1990 but only covered some municipalities such as Lisbon and municipalities near Lisbon.
Serbia Serbia has not conducted a national victimization survey, although in 1996 the ICVS was conducted in Belgrade.
Slovakia No official national crime victimization survey has been carried in Slovakia. Turkey A few questions regarding criminal victimization are asked as part of a larger "Life
Satisfaction Survey" conducted by the Turkish Statistical Institute. Ukraine Regional victimization surveys have been carried out by separate government
agencies, research institutions and universities. UK: England & Wales
The Crime Survey for England and Wales is a continuous victimization survey, which asks respondents about their experiences of crime over the 12 month period prior to the interview.
UK: Northern Ireland The Northern Ireland Crime Survey (NICS) is a personal interview survey in which people over 16 living in private households are asked about their experiences of crime in the 12 months prior to the interview. The survey was first conducted in 1994/95, with further cycles in 1998, 2001 and 2003/04. The NICS moved to an annual cycle in 2005 and was aligned with the financial year from 2006/7. Source:http://www.dojni.gov.uk/index/statistics-research/stats-research-publications/northern-ireland-crime-survey-s-r/nics-user-guide-_april-2012_.pdf
UK: Scotland The survey in its current format was carried out on an annual basis in the 2008/09, 2009/10 and 2010/11 survey years. Since 2011/12 the survey has been conducted every two years, with the next report expected to cover the 2012/13 survey year.
6.1.2 Standard wording of the questions on victimization
Table 6.1.5 shows the wording of the questions for the different offences included in the surveys, as well as for trust in the police and feelings of safety. The table provides the standard wording inspired by the ICVS questionnaire, specifying the countries that applied a similar wording, those that did not include the question in their survey, and those that used a different wording. For the latter, the tables included in chapter 6.2 provide the wording used in their questionnaires.
Table 6.1.5 Wording of the questions included in national victimization surveys
Offence /Topic
Standard Wording Similar wording Different wording Question not included
Bodily injury
… have you been personally attacked (e.g., someone hit you with his/her fists, kicked you, or used force or violence on you in any other way)?
13 countries: Armenia, Belgium, Croatia, Estonia, Finland, Georgia, Ireland, Italy, Netherlands, Poland, Sweden, UK: Northern Ireland, UK: Scotland.
8 countries: Bulgaria, Czech Republic, Denmark, France, Iceland, Lithuania, Turkey, UK: England & Wales.
1 country: Portugal

345
Offence /Topic
Standard Wording Similar wording Different wording Question not included
Sexual assault
… has anyone grabbed you, touched you or assaulted you for sexual reasons in a really offensive way?
6 countries: Belgium, Estonia, Georgia, Italy, Netherlands, Sweden.
12 countries: Bulgaria, Croatia, Czech Republic, Denmark, Finland, France, Iceland, Lithuania, Portugal, Turkey, UK: England & Wales, UK: Scotland.
4 countries: Armenia, Ireland, Poland, UK: Northern Ireland.
Robbery …has anyone stolen something from you by using force or threatening you?
10 countries: Belgium, Bulgaria, Croatia, Denmark, Estonia, Georgia, Ireland, Italy, Poland, Sweden.
10 countries: Czech Republic, France, Iceland, Lithuania, Netherlands, Portugal, Turkey, UK: England & Wales, UK: Northern Ireland, UK: Scotland.
2 countries: Armenia, Finland
Theft of personal property
… have you personally been the victim of a theft of personal property, such as pick-pocketing or theft of a purse, wallet, clothing, jewellery, sports equipment, etc.?
9 countries: Armenia, Bulgaria, Croatia, Czech Republic, Estonia, Finland, Georgia, Italy, Poland.
13 countries: Belgium. Denmark, France, Iceland, Ireland, Lithuania, Netherlands, Portugal, Sweden, Turkey, UK: England & Wales, UK: Northern Ireland, UK: Scotland.
0 countries
Theft of a motor vehicle
… have you or other members of your household had any of their cars, vans or trucks stolen?
12 countries: Bulgaria, Czech Republic, Estonia, Finland, Georgia, Ireland, Italy, Netherlands, Portugal, Sweden, UK: Northern Ireland, UK: Scotland.
7 countries: Belgium, Croatia, France, Iceland, Poland, Turkey, UK: England & Wales.
3 countries: Armenia, Denmark, Lithuania.
Domestic burglary
… has anyone actually got into your house or flat without permission and stolen or tried to steal something?
13 countries: Bulgaria, Croatia, Czech Republic, Estonia, Finland, Georgia, Ireland, Italy, Netherlands, Poland, Sweden, UK: England & Wales, UK: Northern Ireland.
5 countries: France, Iceland, Portugal, Turkey, UK: Scotland.
3 countries: Armenia, Denmark, Lithuania,

346
Offence /Topic
Standard Wording Similar wording Different wording Question not included
Corruption … has any government official, for instance a customs officer, a police officer or inspector in your country asked you, or expected you to pay a bribe for his or her services?
3 countries: Czech Republic, Estonia, Georgia.
3 countries: Lithuania, Portugal, Sweden.
15 countries: Armenia, Bulgaria, Croatia, Denmark, Finland, France, Iceland, Ireland, Italy, Netherlands, Poland, Turkey, UK: England & Wales, UK: Northern Ireland, UK: Scotland.
Trust in the police
Taking everything into account, how good a job do you think the police do in your area in controlling crime? Do you think they do a very good job, a fairly good job, a poor job or a very poor job?
10 countries: Armenia, Bulgaria, Croatia, Czech Republic, Estonia, Georgia, Iceland, Ireland, Italy, Poland.
10 countries: Finland, France, Lithuania, Netherlands, Portugal, Sweden, Turkey, UK: England & Wales, UK: Northern Ireland, UK: Scotland.
1 country: Denmark.
Feelings of safety
How safe do you feel walking alone in your area after dark? Do you feel very safe, fairly safe, a bit unsafe, or very unsafe?
14 countries: Armenia, Bulgaria, Croatia, Czech Republic, Estonia, Finland, Georgia, Iceland, Ireland, Italy, Poland, UK: England & Wales, UK: Northern Ireland, UK: Scotland.
7 countries: Belgium, France, Lithuania, Netherlands, Portugal, Sweden, Turkey.
1 country: Denmark.
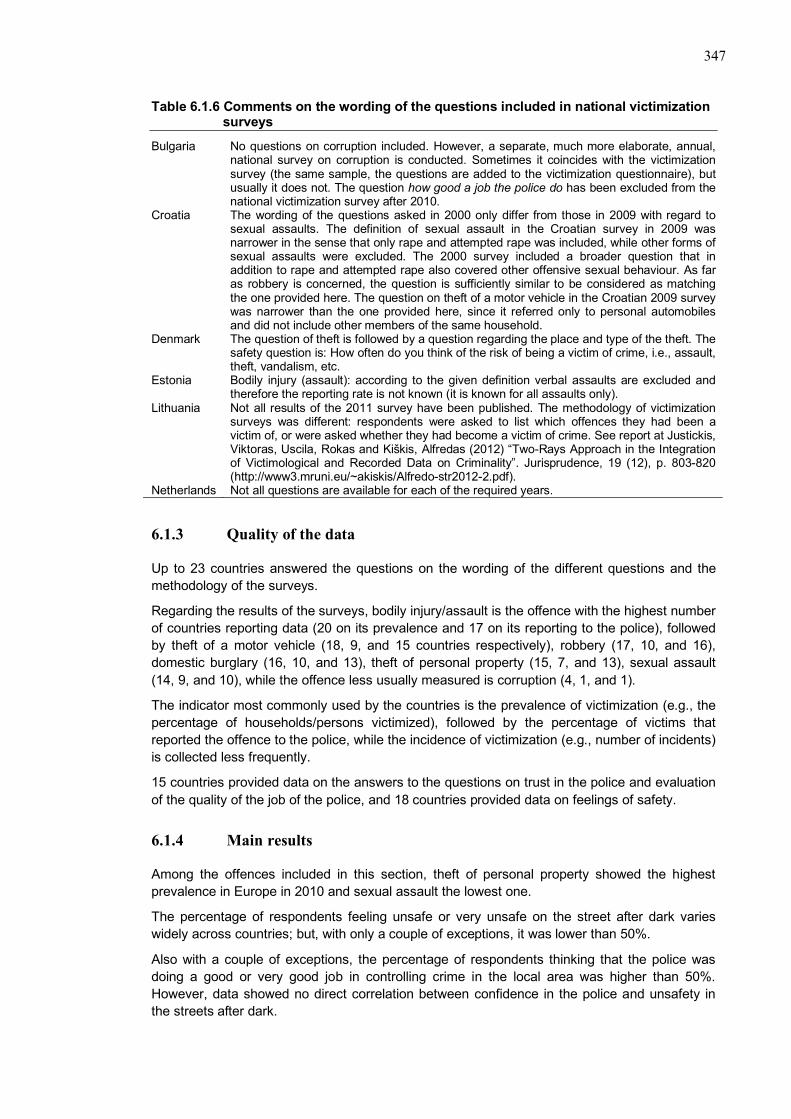
347
Table 6.1.6 Comments on the wording of the questions included in national victimization
surveys
Bulgaria No questions on corruption included. However, a separate, much more elaborate, annual, national survey on corruption is conducted. Sometimes it coincides with the victimization survey (the same sample, the questions are added to the victimization questionnaire), but usually it does not. The question how good a job the police do has been excluded from the national victimization survey after 2010.
Croatia The wording of the questions asked in 2000 only differ from those in 2009 with regard to sexual assaults. The definition of sexual assault in the Croatian survey in 2009 was narrower in the sense that only rape and attempted rape was included, while other forms of sexual assaults were excluded. The 2000 survey included a broader question that in addition to rape and attempted rape also covered other offensive sexual behaviour. As far as robbery is concerned, the question is sufficiently similar to be considered as matching the one provided here. The question on theft of a motor vehicle in the Croatian 2009 survey was narrower than the one provided here, since it referred only to personal automobiles and did not include other members of the same household.
Denmark The question of theft is followed by a question regarding the place and type of the theft. The safety question is: How often do you think of the risk of being a victim of crime, i.e., assault, theft, vandalism, etc.
Estonia Bodily injury (assault): according to the given definition verbal assaults are excluded and therefore the reporting rate is not known (it is known for all assaults only).
Lithuania Not all results of the 2011 survey have been published. The methodology of victimization surveys was different: respondents were asked to list which offences they had been a victim of, or were asked whether they had become a victim of crime. See report at Justickis, Viktoras, Uscila, Rokas and Kiškis, Alfredas (2012) “Two-Rays Approach in the Integration of Victimological and Recorded Data on Criminality”. Jurisprudence, 19 (12), p. 803-820 (http://www3.mruni.eu/~akiskis/Alfredo-str2012-2.pdf).
Netherlands Not all questions are available for each of the required years.
6.1.3 Quality of the data
Up to 23 countries answered the questions on the wording of the different questions and the methodology of the surveys.
Regarding the results of the surveys, bodily injury/assault is the offence with the highest number of countries reporting data (20 on its prevalence and 17 on its reporting to the police), followed by theft of a motor vehicle (18, 9, and 15 countries respectively), robbery (17, 10, and 16), domestic burglary (16, 10, and 13), theft of personal property (15, 7, and 13), sexual assault (14, 9, and 10), while the offence less usually measured is corruption (4, 1, and 1).
The indicator most commonly used by the countries is the prevalence of victimization (e.g., the percentage of households/persons victimized), followed by the percentage of victims that reported the offence to the police, while the incidence of victimization (e.g., number of incidents) is collected less frequently.
15 countries provided data on the answers to the questions on trust in the police and evaluation of the quality of the job of the police, and 18 countries provided data on feelings of safety.
6.1.4 Main results
Among the offences included in this section, theft of personal property showed the highest prevalence in Europe in 2010 and sexual assault the lowest one.
The percentage of respondents feeling unsafe or very unsafe on the street after dark varies widely across countries; but, with only a couple of exceptions, it was lower than 50%.
Also with a couple of exceptions, the percentage of respondents thinking that the police was doing a good or very good job in controlling crime in the local area was higher than 50%. However, data showed no direct correlation between confidence in the police and unsafety in the streets after dark.

348
6.2 Tables 6.2.1 Bodily Injury
Table 6.2.1.1 Prevalence of bodily injury (assault) victimization during the last 12 months according to national victimization surveys 1990 1995 2000 2005 2010 Armenia ... ... ... ... ... Belgium ... 1.2 2.3 2.1 2.8 Bulgaria ... ... (1.1) (0.3) (0.5) Croatia ... ... 0.9 ... 7 Czech Republic ... ... ... ... ... Denmark ... 1.7 3.2 1.8 1.4 Estonia 2.2 1.7 2.3 1.4 2.4 Finland 5.7 5.6 6.1 5.8 6.1 France 0.9 1.5 1.4 1.3 1.5 Georgia ... ... ... ... 0.4 Iceland ... ... ... ... 3.4 Ireland ... 1 1 1 1 Italy ... (0.5) (0.8) ... (0.6) Lithuania ... ... 8.2 11.5 4 Netherlands ... 1.8 1.3 1.5 1 Poland ... ... ... ... 1.1 Portugal ... 0.8 ... ... ... Sweden ... ... ... 2.7 2.4 Turkey ... ... ... (1.1) (2.4) UK: England & Wales 2.2 3.2 2.2 2 1.6 UK: Northern Ireland ... ... (2.1) (2.1) (1.6) UK: Scotland ... ... ... ... 2.8 Mean 3 2 3 3 2 Median 2 2 2 2 2 Minimum 1 1 1 0 0 Maximum 6 6 8 12 7
( ) Figures between brackets, see table 6.2.1.3 and notes on tables 6.2.1.1 to 6.2.9.2
Table 6.2.1.2 Bodily injury (assault) victimizations: Percentage of victims reporting to the police
1990 1995 2000 2005 2010 Armenia ... ... ... ... ... Belgium ... 39 29.6 33.9 32.7 Bulgaria ... ... ... ... ... Croatia ... ... 26.6 ... 39 Czech Republic ... ... ... ... ... Denmark ... 35 39 43 47 Estonia ... ... ... ... ... Finland 8.2 17.4 14.9 22.6 15 France 54.4 38.2 45.6 36.6 30.8 Georgia ... ... ... ... 43 Iceland ... ... ... ... 45.8 Ireland ... 62 51 53 55 Italy ... ... 21.8 ... 19 Lithuania ... ... 53.8 (42.6) ... Netherlands ... 48.2 40.5 52.8 41.3 Poland ... ... ... ... 52.8 Portugal ... ... ... ... ... Sweden ... ... ... 32 37 Turkey ... ... ... ... ... UK: England & Wales (47.7) (39.7) (55.9) (58.2) (64.9) UK: Northern Ireland ... ... 54 30 36 UK: Scotland ... ... ... ... 52 Mean 37 40 39 40 41 Median 48 39 41 40 41 Minimum 8 17 15 23 15 Maximum 54 62 56 58 65
( ) Figures between brackets, see table 6.2.1.3 and notes on tables 6.2.1.1 to 6.2.9.2

349
Table 6.2.1.3 Bodily injury (assault) victimizations: Deviations from the ICVS standard wording of the question
ESB Standard Wording … have you been personally attacked (e.g., someone hit you with his/her fists, kicked you, or used force or violence on you in any other way)?
Bulgaria Has someone attacked you or threatened you so that you experienced intense fear, indoors or outside – in a bar, on the street, at school, on public transport, at the beach or at your workplace? Other questions later in the survey ask if it was just a threat or an actual attack and whether the respondent was injured or not.
Czech Republic Have you been personally attacked or has someone threatened you so that you are really scared, whether at home or elsewhere, such as on the street, in a restaurant...?
Denmark Have you been a victim of violence during the last 12 months? France (In year n-1 or n-2 year), have you personally been a victim of physical violence
from a person who is not currently living in the same dwelling as you (including from a former spouse or a spouse who currently does not live with you)? Prior to the 2007 surveys, the respondent was asked if (s)he had been a victim of assault or acts of violence even verbal, and then (s)he was asked if it was a physical assault.
Iceland Were you a victim of a violent crime in 2011? Violent crimes include assault, for example being beaten with a fist or a weapon.
Lithuania Have you been beaten or has physical pain or health impairment been caused to you by the use of other types of violence during 2011?
Turkey Have you personally been a victim of one of the events below in (year): ...other (injury, sexual harassment, robbery)?
UK: England & Wales And again, [apart from anything you have already mentioned], since the first of [^DATE^] has anyone, including people you know well, DELIBERATELY hit you with their fists or with a weapon of any sort or kicked you or used force or violence in any other way?
Similar definition: Armenia, Belgium, Croatia, Estonia, Finland, Georgia, Ireland, Italy, Netherlands, Poland, Sweden, UK: Northern Ireland, UK: Scotland. Question not included: Portugal
6.2.2 Sexual assault
Table 6.2.2.1 Prevalence of sexual assault victimization during the last 12 months according to national victimization surveys
1990 1995 2000 2005 2010 Armenia ... ... ... ... ... Belgium ... ... 1.2 0.9 1.2 Bulgaria ... ... (0.2) (0.1) (0.3) Croatia ... ... 2.7 ... 0.3 Czech Republic ... ... ... 2 ... Denmark ... ... ... ... 0.1 Estonia (2.5) (1.3) (3.6) (1.4) (2) Finland ... ... ... ... ... France ... ... ... ... ... Georgia ... ... ... ... 0.5 Iceland ... ... ... ... 0.5 Ireland ... ... ... ... ... Italy ... ... ... ... ... Lithuania ... ... 0 0.7 0.3 Netherlands ... 1.1 1 0.9 1.5 Poland ... ... ... ... ... Portugal ... 0.1 ... ... ... Sweden ... ... ... 0.9 0.7 Turkey ... ... ... (0.5) ... UK: England & Wales ... ... ... 1.8 ... UK: Northern Ireland ... ... ... ... ... UK: Scotland ... ... ... ... ... Mean 3 1 1 1 1 Median 3 1 1 1 1 Minimum 3 0 0 0 0 Maximum 3 1 4 2 2
( ) Figures between brackets, see table 6.2.2.3 and notes on tables 6.2.1.1 to 6.2.9.2

350
Table 6.2.2.2 Sexual assault: Percentage of victims reporting to the police 1990 1995 2000 2005 2010 Armenia ... ... ... ... ... Belgium ... ... 3.8 4.8 7.2 Bulgaria ... ... ... ... ... Croatia ... ... 15.5 ... 16 Czech Republic ... ... ... ... ... Denmark ... ... ... ... 24 Estonia ... 8 10 25 ... Finland ... ... ... ... ... France ... ... ... ... ... Georgia ... ... ... ... 23 Iceland ... ... ... ... 18.2 Ireland ... ... ... ... ... Italy ... ... ... ... ... Lithuania ... ... 0 (40) ... Netherlands ... 15 6.8 11.3 7.3 Poland ... ... ... ... ... Portugal ... ... ... ... ... Sweden ... ... ... 11 23 Turkey ... ... ... ... ... UK: England & Wales ... ... ... ... ... UK: Northern Ireland ... ... ... ... ... UK: Scotland ... ... ... ... ... Mean … 12 7 18 17 Median … 12 7 11 18 Minimum 0 8 0 5 7 Maximum 0 15 16 40 24
( ) Figures between brackets, see table 6.2.2.3 and notes on tables 6.2.1.1 to 6.2.9.2

351
Table 6.2.2.3 Sexual assault: Deviations from the ICVS standard wording of the question ESB Standard Wording … has anyone grabbed you, touched you or assaulted you for sexual reasons
in a really offensive way? Bulgaria Let me ask you a very personal question. Sometimes a person can be touched
or attacked in a very offensive way, for sexual reasons. This can happen indoors or outside, for example in a bar, on the street, at school, on public transport, at the cinema, on the beach or at the workplace. Has someone touched you or attacked you for sexual reasons and against your will?
Croatia Has someone raped you or tried to rape you?
Czech Republic ...has anyone grabbed you, touched you or assaulted you for sexual reasons in a really offensive way? It can happen at home or elsewhere, such as on the street, in a restaurant...
Denmark Has a man during the last 5 years by use of force or threats tried to force you or actually forced you to have intercourse with him? This also includes boyfriends, a husband and other sexual partner. There is also a question of prevalence during the last 12 months. Only women are asked. The question was not included until 2008. The same goes for the question on robbery.
Finland This question has been asked in the latest national survey editions, but the results are not available yet.
France There are three questions in the CVS: (in year n-1 or n-2 year), (apart from the people who are currently living with you) Did someone engage in a sexual exhibition, for example a man that stripped in front of you against your will? (In year n-1 or n-2 year), (apart from the people who are currently living with you). Did someone try to kiss you against your will, to fondle or do other inappropriate gestures? (In year n-1 or n-2 year), (apart from the people who are currently living with you) Did someone require you to undergo sexual touching or to have sex against your will, or try to do it? Sexual assault was not included in the surveys from 1996 to 2006. It was in the investigation of 1986, but in a different form.
Iceland Were you a victim of a sexual crime in 2011? Sexual crimes include rape or an individual showing their genitals to others (flashing), incest and abuse.
Lithuania Did anyone satisfy their sexual passion by physical contact with you against your will by using physical violence or threatening to use it immediately, or otherwise denying the possibility of resistance as well as taking advantage of your helpless condition, dependence, or made you do that during 2011?
Portugal During the last year, were you victim of a sexual crime in which you were attacked, grabbed or groped? (If yes, how many times?)
Turkey Have you personally been a victim of one of the events below in (year): ...other (injury, sexual harassment, robbery)
UK: England & Wales During the last 12 months, have you been sexually interfered with, assaulted or attacked, either by someone you knew or by a stranger?
UK: Scotland Separate response categories for: Sexually threatened you and Touched you sexually when you did not want it (groping, touching of breasts, bottom or genitals, unwanted kissing).
Similar definition: Belgium, Estonia, Georgia, Italy, Netherlands, Sweden. Question not included: Armenia, Ireland, Poland, UK: Northern Ireland.

352
6.2.3 Robbery
Table 6.2.3.1 Prevalence of robbery victimization during the last 12 months according to national victimization surveys
1990 1995 2000 2005 2010 Armenia ... ... ... ... ... Belgium ... 0. 7 1 0.7 0.4 Bulgaria ... ... (0.7) (0.6) (0.3) Croatia ... ... 0.7 ... 3 Czech Republic ... ... ... 1.4 ... Denmark ... ... ... ... 1.1 Estonia 2.9 3.4 2.9 1.8 2.1 Finland ... ... ... ... ... France ... ... ... 0.4 0.5 Georgia ... ... ... ... 0.6 Iceland ... ... ... ... ... Ireland ... 1 1 1 1 Italy ... 0.3 0.4 ... 0.3 Lithuania ... ... 5.7 8.5 2.2 Netherlands ... ... ... 0.3 0.1 Poland ... ... ... ... 1.9 Portugal ... 0.5 ... ... ... Sweden ... ... ... 1 1 Turkey ... ... ... (2) 1.1 UK: England & Wales 0.4 0.7 0.6 0.5 0.5 UK: Northern Ireland ... ... (0.3) (0.2) (0.2) UK: Scotland ... ... ... ... 0.2 Mean 2 1 1 2 1 Median 2 1 1 1 1 Minimum 0 0 0 0 0 Maximum 3 3 6 9 3
( ) Figures between brackets, see table 6.2.3.3 and notes on tables 6.2.1.1 to 6.2.9.2 Table 6.2.3.2 Robbery: Percentage of victims reporting to the police
1990 1995 2000 2005 2010 Armenia ... ... ... ... ... Belgium ... 43.9 50.2 50 59.4 Bulgaria ... ... (36) (30) (76) Croatia ... ... 55 ... 62 Czech Republic ... ... ... ... ... Denmark ... ... ... ... 77 Estonia ... 35 39 38 ... Finland ... ... ... ... ... France ... ... ... 57.4 40.1 Georgia ... ... ... ... 47 Iceland ... ... ... ... ... Ireland ... ... ... ... ... Italy ... ... 49.6 ... 75.6 Lithuania ... ... 77.8 (45.7) ... Netherlands ... ... ... 92.1 ... Poland ... ... ... ... 56.6 Portugal ... ... ... ... ... Sweden ... ... ... 33 57 Turkey ... ... ... ... ... UK: England & Wales 47.2 55.1 44.5 47.4 55.3 UK: Northern Ireland ... ... 62 58 73 UK: Scotland ... ... ... ... 31 Mean 47 45 52 50 59 Median 47 44 50 47 58 Minimum 47 35 36 30 31 Maximum 47 55 78 92 77
( ) Figures between brackets, see table 6.2.3.3 and notes on tables 6.2.1.1 to 6.2.9.2

353
Table 6.2.3.3 Robbery: Deviations from the ICVS standard wording of the question ESB Standard Wording …has anyone stolen something from you by using force or threatening you? Czech Republic … has anyone stolen something from you by using force or threatening you?
Or has anyone tried?
France (In year n-1 or n-2 year), have you personally been a victim of theft or attempted theft with physical violence or threat (examples: theft with grievous bodily harm, hand-held or mobile phone bag snatching, theft with verbal threats or using a weapon, racketeering or extortion attempt)? This question is from the 2007 survey; in the 2005 and 2006 surveys, 'assaulted' people were asked if it was a robbery with violence. Previous investigations were unaware of this victimisation.
Iceland No specific question regarding robbery but it is probably included by most in the question of theft and burglary.
Lithuania Was your property robbed by using physical violence (threatening to use it immediately), or was there an attempt to do so during 2011?
Netherlands Actually it is the same, but data are only available since 2005.
Portugal There were 2 questions: - Did someone take or try to take from you any values or objects using force or threats? (If yes, how many times) - During the year 1994, did someone take or try to take your purse or any other object used or carried with you through the process of snatching? (If yes, how many times?)
Turkey Have you personally been a victim of one of the events below in (year): ...purse snatching, pickpocketing, theft ... other (injury, sexual harassment, robbery?
UK: England & Wales Apart from anything you have already mentioned], during that time has anyone TRIED to STEAL something you were carrying out of your hands or from your pockets or from a bag or case?
UK: Northern Ireland A combination of questions asked which equate to mugging which includes robbery and snatch theft.
Uk: Scotland Separate questions on using force and theft are asked in the incident form.
Similar definition: Belgium, Bulgaria, Croatia, Denmark, Estonia, Georgia, Ireland, Italy, Poland, Sweden. Question not included: Armenia, Finland.

354
6.2.4 Theft of personal property
Table 6.2.4.1 Prevalence of theft of personal property victimization during the last 12 months according to national victimization surveys
1990 1995 2000 2005 2010 Armenia ... ... ... ... ... Belgium ... ... ... ... ... Bulgaria ... ... (5.8) (2.8) (3) Croatia ... ... (1.3) ... (4) Czech Republic ... ... ... 17.5 ... Denmark ... 16 17 13 12 Estonia 8 5.5 5.5 6.3 3.6 Finland ... 2.8 2.8 2.3 2.3 France 2.7 3.5 (2.4) 2 1.8 Georgia ... ... ... ... 0.8 Iceland ... ... ... ... (9.9) Ireland ... ... ... ... ... Italy ... 2.1 2.1 ... 2.2 Lithuania ... ... 6.7 (5.8) (16) Netherlands ... ... ... ... ... Poland ... ... ... ... 2.3 Portugal ... 1.2 ... ... ... Sweden ... ... ... ... ... Turkey ... ... ... (7.1) (4.2) UK: England & Wales (3.3) (4.1) (2.8) (2.2) (2.1) UK: Northern Ireland ... ... ... ... ... UK: Scotland ... ... ... ... 2.5 Mean 5 5 5 7 5 Median 3 4 3 6 3 Minimum 3 1 1 2 1 Maximum 8 16 17 18 16
( ) Figures between brackets, see table 6.2.4.3 and notes on tables 6.2.1.1 to 6.2.9.2 Table 6.2.4.2 Theft of personal property: Percentage of victims reporting to the police
1990 1995 2000 2005 2010 Armenia ... ... ... ... ... Belgium ... ... ... ... ... Bulgaria ... ... (17) (35) (48) Croatia ... ... 50.1 ... 51 Czech Republic ... ... ... ... ... Denmark ... ... 67 67 65 Estonia ... 28 29 29 28 Finland ... 34 38 35 ... France 67.6 54.6 (53.1) 41.8 33.2 Georgia ... ... ... ... 18 Iceland ... ... ... ... 59.5 Ireland ... ... ... ... ... Italy ... ... 26.8 ... 29.3 Lithuania ... ... 74.5 (46.9) ... Netherlands ... ... ... ... ... Poland ... ... ... ... 43.6 Portugal ... ... ... ... ... Sweden ... ... ... ... ... Turkey ... ... ... ... ... UK: England & Wales 38 28.6 32 33.4 34.6 UK: Northern Ireland ... ... ... ... ... UK: Scotland ... ... ... ... 30 Mean 53 36 43 41 40 Median 53 31 38 35 35 Minimum 38 28 17 29 18 Maximum 68 55 75 67 65
( ) Figures between brackets, see table 6.2.4.3 and notes on tables 6.2.1.1 to 6.2.9.2

355
Table 6.2.4.3 Theft of personal property: Deviations from the ICVS standard wording of the question
ESB Standard Wording … have you personally been the victim of a theft of personal property, such as pick-pocketing or theft of a purse, wallet, clothing, jewellery, sports equipment, etc.?
Belgium In the last 12 months have you been the victim of a theft out of your home ? (1) when you were not there (2) when you were there, but without violence or threat.
Denmark Has anyone stolen or tried to steal money or things belonging to you during the last 12 months?
France (In year n-1 or n-2 year), have you personally been a victim of theft or attempted theft without physical violence or threats (pickpocket theft, theft of a portfolio, a bag, a coat, a mobile phone or any other property in a public place - restaurant, dressing room or at your place of work or study?) This victimization has been featured in all surveys, although the wording of the question may have minor modifications.
Iceland Were you a victim of a burglary or theft in 2011? Burglary includes someone entering your home, vehicle, summer cottage or other dwellings with the purpose of stealing, and theft includes stealing a wallet, bicycle or other valuables.
Ireland 3 distinct questions as follows: Theft of mobile phone, Theft with violence, Theft without violence.
Lithuania Was your property of a value over 130 LTL stolen or was there an attempt to steal it from you personally during 2011?
Netherlands It is specified in more categories: a. bicycle theft; b. car theft; c. theft out of car; d. pick-pocketing; e. other theft. Therefore the data for prevalence could not be provided.
Portugal There were 2 questions: - During the year 1994, was your wallet, purse or other valuables you carried taken from you by pickpocketing? (If yes, how many times) - Not counting the three situations that we have just spoken of (theft by pickpocketing and other thefts), during the year 1994, did someone take personal items from you in other circumstances? I shall ask you to disregard the theft of personal objects from your house or car. I am referring to clothes, wallet, purse, camera or any other personal items that you may have left anywhere – for instance, at the place you work or study, at a restaurant, coffee shop or cinema, at a transportation station or at the beach.
Sweden Different wording not provided.
Turkey Have you personally been a victim of one of the events below in (year): ...purse snatching, pickpocketing, theft?
UK: England & Wales Since the first of [^DATE^], [apart from anything you may have already mentioned], was anything you were carrying stolen out of your hands or from your pockets or from a bag or case? AND Apart from anything you have already mentioned], in that time has anyone TRIED to STEAL something you were carrying out of your hands or from your pockets or from a bag or case?
UK: Northern Ireland Several questions are asked in relation to personal theft including; …was anything you were carrying stolen - out of your hands or from your pockets or from a bag or case? …And (apart from anything you have already mentioned), in that time has anything (else) of yours been stolen, from a cloakroom, an office, a car or anywhere else you left it? and …Can I just check, were you/was he/she holding, carrying or wearing (any of) what was stolen, including items in pockets of clothes being worn at the time?
UK: Scotland Victim form asks what was taken? from either the respondent or members of their household and includes a variety of response categories detailing what was stolen, these include: “purse/wallet” and “briefcase/handbag/shopping bag”, “jewelry” etc.
Similar definition: Armenia, Bulgaria, Croatia, Czech Republic, Estonia, Finland, Georgia, Italy, Poland.

356
6.2.5 Theft of a motor vehicle
Table 6.2.5.1 Prevalence of theft of a motor vehicle victimization during the last 12 months according to national victimization surveys
1990 1995 2000 2005 2010 Armenia ... ... ... ... ... Belgium ... 1.1 1.2 0.6 0.4 Bulgaria ... ... (0.9) (0.5) (0.3) Croatia ... ... 0.8 ... 1 Czech Republic ... ... ... 2.8 ... Denmark ... ... ... ... ... Estonia 0.7 1.6 0.9 0.7 0.4 Finland ... 0.4 0.8 0.4 0.4 France ... ... ... 2.6 1.2 Georgia ... ... ... ... 0.1 Iceland ... ... ... ... ... Ireland ... 1 1 1 1 Italy ... 8 6.3 ... 6.3 Lithuania ... ... ... ... ... Netherlands 0.5 0.3 0.3 0.4 0.3 Poland ... ... ... ... 0.3 Portugal ... 0.7 ... ... ... Sweden ... ... ... 0.9 0.6 Turkey ... ... ... ... (0.1) UK: England & Wales 2.4 2.1 1.3 0.7 0.4 UK: Northern Ireland ... ... 1.8 0.5 0.4 UK: Scotland ... ... ... ... 0.2 Mean 1 2 2 1 1 Median 1 1 1 1 0 Minimum 1 0 0 0 0 Maximum 2 8 6 3 6
( ) Figures between brackets, see table 6.2.5.3 and notes on tables 6.2.1.1 to 6.2.9.2
Table 6.2.5.2 Theft of a motor vehicle: Percentage of victims reporting to the police 1990 1995 2000 2005 2010 Armenia ... ... ... ... ... Belgium ... 84.8 87.8 84.1 79.4 Bulgaria ... ... (100) (100) (100) Croatia ... ... 92.8 ... 88 Czech Republic ... ... ... ... ... Denmark ... ... ... ... ... Estonia ... 86 86 (56) 88 Finland ... ... ... ... ... France ... ... ... 44.6 46.3 Georgia ... ... ... ... 11 Iceland ... ... ... ... ... Ireland ... 95 ... ... ... Italy ... ... 93.4 ... 88.6 Lithuania ... ... ... ... ... Netherlands ... 93.2 94.6 92.7 ... Poland ... ... ... ... 90.2 Portugal ... ... ... ... ... Sweden ... ... ... 94 ... Turkey ... ... ... ... ... UK: England & Wales 98.6 97.7 93.5 93.4 93.8 UK: Northern Ireland ... ... 63 52 35 UK: Scotland ... ... ... ... 92 Mean 99 91 89 77 74 Median 99 93 93 88 88 Minimum 99 85 63 45 11 Maximum 99 98 100 100 100
( ) Figures between brackets, see table 6.2.5.3 and notes on tables 6.2.1.1 to 6.2.9.2

357
Table 6.2.5.3 Theft of motor vehicle: Deviations from the ICVS standard wording of the question
ESB Standard Wording … have you or other members of your household had any of their cars, vans or trucks stolen?
Belgium Different wording not provided
Croatia Did the following happen to you in the past twelve months? ...stolen personal automobile
France (In year n-1 or n-2 year), have you experienced a theft or attempted theft of your car? In surveys from 1996 to 2004, there was no distinction between car theft and theft in or on the car.
Iceland No such question but many might include such an experience in their answer to the question regarding burglary and theft.
Poland …has someone broken into your car and stolen it?
Turkey Has your household been a victim of one the events below in (year): ...theft of a car, motorcycle or similar
UK: England & Wales During the last 12 months, that is [since ^DATE^,] have [you/ you or anyone else now in your household] had [your/their] car, van, motorcycle or other motor vehicle stolen or driven away without permission?
Similar wording: Bulgaria, Czech Republic, Estonia, Finland, Georgia, Ireland, Italy, Netherlands, Portugal, Sweden, UK: Northern Ireland, UK: Scotland. Question not included: Armenia, Denmark, Lithuania.
6.2.6 Domestic burglary
Table 6.2.6.1 Prevalence of domestic burglary victimization during the last 12 months according to national victimization surveys
1990 1995 2000 2005 2010 Armenia ... ... ... ... ... Belgium ... 5.1 9.0 6.9 6.1 Bulgaria ... ... (3.1) (2.3) (2.1) Croatia ... ... 2.0 ... 5.0 Czech Republic ... ... ... 3.9 ... Denmark ... ... ... ... ... Estonia 5.7 4.2 3.7 3.1 3.0 Finland ... 0.3 0.5 0.5 0.5 France 2.3 1.8 1.3 1.1 1.5 Georgia ... ... ... ... 0.5 Iceland ... ... ... ... ... Ireland ... 3 3 3 3 Italy ... 2.8 1.8 ... 1.4 Lithuania ... ... 2 1.7 ... Netherlands 2.5 2.8 1.8 3 2.7 Poland ... ... ... ... 3 Portugal ... 2.4 ... ... ... Sweden ... ... ... 1 1 Turkey ... ... ... ... 2 UK: England & Wales 5.3 6.4 3.4 2.5 2.4 UK: Northern Ireland ... ... 2 1.8 2.2 UK: Scotland ... ... ... ... 1.1 Mean 4 3 3 3 2 Median 4 3 2 2 2 Minimum 2 0 1 1 1 Maximum 6 6 9 7 6
( ) Figures between brackets, see table 6.2.6.3 and notes on tables 6.2.1.1 to 6.2.9.2

358
Table 6.2.6.2 Domestic burglary: Percentage of victims reporting to the police
1990 1995 2000 2005 2010 Armenia ... ... ... ... ... Belgium ... ... ... ... ... Bulgaria ... ... (54) (70) (66) Croatia ... ... (64.4) ... 73 Czech Republic ... ... ... ... ... Denmark ... ... ... ... ... Estonia ... 55 62 51 38 Finland ... ... ... ... ... France 75.2 81.9 79.8 67.1 54.9 Georgia ... ... ... ... 48 Iceland ... ... ... ... ... Ireland ... 77 69 70 75 Italy ... ... 66.6 ... 74.2 Lithuania ... ... 81.8 (62.2) ... Netherlands ... 89 90.7 71.7 86.9 Poland ... ... ... ... 49.9 Portugal ... ... ... ... ... Sweden ... ... ... 72 89 Turkey ... ... ... ... ... UK: England & Wales 73 65.7 61.3 65.9 66.8 UK: Northern Ireland ... ... 65 57 67 UK: Scotland ... ... ... ... 62 Mean 74 74 69 65 65 Median 74 77 66 67 67 Minimum 73 55 54 51 38 Maximum 75 89 91 72 89
( ) Figures between brackets, see table 6.2.6.3 and notes on tables 6.2.1.1 to 6.2.9.2 Table 6.2.6.3 Domestic burglary: Deviations from the ICVS standard wording of the
question ESB Standard Wording … has anyone actually got into your house or flat without permission and stolen
or tried to steal something? France (In year n-1 or n-2 year), have you experienced a burglary or attempted
burglary in your home? (Burglary exists in all cases where people are breaking and entering in housing or one of its dependencies - cellar or attic - including the case where there is no theft. Entries by climbing or by the use of false keys are break-like entries). This victimization has been featured in all surveys, although the wording of the question may have minor modifications.
Iceland No such question but many might include such an experience in their answer to the question regarding burglary and theft.
Portugal Was your house burglarized or suffered any clear attempt of burglary? (If yes, how many times?)
Turkey Has your household been a victim of one the events below in (year): ...theft at home.
Uk: Scotland In Scotland the term burglary is not used. Instead we refer to housebreaking. The definition of housebreaking differs from burglary in that entry needs to be forced or through a non-standard entrance (e.g., a window). Where there is a theft/attempted theft from a dwelling and entry is not forced (e.g., the offender had legitimate access to the dwelling or entered under false pretences or through an unlocked door) the term used is theft in a dwelling.
Similar wording: Bulgaria, Croatia, Czech Republic, Estonia, Finland, Georgia, Ireland, Italy, Netherlands, Poland, Sweden, UK: England & Wales, UK: Northern Ireland. Question not included: Armenia, Denmark, Lithuania.

359
6.2.7 Corruption
Table 6.2.7.1 Prevalence of corruption victimization during the last 12 months according to national victimization surveys
1990 1995 2000 2005 2010 Czech Republic ... ... ... 9.6 ... Estonia 4.5 3.6 5.2 3.3 0.5 Georgia ... ... ... ... 0.5 Lithuania ... ... ... ... 7.1
Table 6.2.7.2 Corruption: Percentage of victims reporting to the police
1990 1995 2000 2005 2010 Czech Republic ... ... ... 5 ...
Table 6.2.7.3 Corruption: Deviations from the ICVS standard wording of the question ESB Standard Wording … has any government official, for instance a customs officer, a police officer
or inspector in your country asked you, or expected you to pay a bribe for his or her services?
Lithuania Did any public officer or an equivalent person demand a bribe from you, or provoke you to give a bribe for performance or non-performance of their obligations during 2011?
Portugal Different wording not provided. Sweden Different wording not provided.
Similar wording: Czech Republic, Estonia, Georgia. Question not included: Armenia, Bulgaria, Croatia, Denmark, Finland, France, Iceland, Ireland, Italy, Netherlands, Poland, Turkey, UK: England & Wales, UK: Northern Ireland, UK: Scotland.
6.2.8 Trust in the police
Table 6.2.8.1 Trust in the police: Percentage of the public who believe police are doing a good job or a very good job in controlling crime in the local area
1990 1995 2000 2005 2010 Armenia ... ... ... ... ... Belgium ... ... 78 86.4 89.2 Bulgaria ... ... (43) (46) ... Croatia ... ... 48 ... 61 Czech Republic ... ... ... 54.5 ... Denmark ... ... ... ... ... Estonia ... ... ... 47 63 Finland ... ... ... ... ... France ... ... ... ... ... Georgia ... ... ... ... 85 Iceland ... ... ... ... 86 Ireland ... 63 56 51 67 Italy ... 57.8 63.8 ... 61.6 Lithuania ... ... ... ... ... Netherlands ... ... 55.8 42.9 41.5 Poland ... ... ... ... 71.7 Portugal ... 56 ... ... ... Sweden ... ... ... 55 65 Turkey ... ... ... 69.3 78 UK: England & Wales 81 81 75 51 62 UK: Northern Ireland ... ... ... ... 43 UK: Scotland ... ... ... ... ... Mean 81 64 60 56 67 Median 81 60 56 51 65 Minimum 81 56 43 43 42 Maximum 81 81 78 86 89
( ) Figures between brackets, see table 6.2.8.2 and notes on tables 6.2.1.1 to 6.2.9.2

360
Table 6.2.8.2 Trust in the police: Deviations from the ICVS standard wording of the question
ESB Standard Wording Taking everything into account, how good a job do you think the police do in your area in controlling crime? Do you think they do a very good job, a fairly good job, a poor job or a very poor job?
Finland This kind of question is asked in later national surveys but it is not reported.
France Regarding the action of the police or the gendarmerie in the fight against crime in your neighbourhood (or your village), would you say that it is very effective, effective, ineffective, not effective at all, don’t know? This question is from the 2007 survey.
Lithuania How would you evaluate the work of the following institutions? (among them the police).
Netherlands Actually, the question is more or less similar, but data are only available since 2005.
Portugal What does the person who reported the crime think of the way he/she was treated by the authorities? Is he or she very satisfied; satisfied; not very satisfied; not satisfied at all?
Sweden How much confidence do you have in the way the police conduct their work? A great deal, Quite a lot, Neither a lot nor little, Not very much, Very little, No opinion/ Don’t know?
Turkey How satisfied are you with public security services? (Not satisfied at all, not satisfied, Medium, Satisfied, Very satisfied).
UK: England & Wales RATPOL2 Taking everything into account, how good a job do you think the police IN THIS AREA are doing?
UK: Northern Ireland The same question is asked in the NICS: Taking everything into account, how good a job do you think the police IN THIS AREA are doing? Excellent, Good, Fair, Poor and Very poor.
UK: Scotland There is no single question looking at confidence in the police. Instead, a battery of questions is used to look at different aspects of police performance: Investigating incidents after they occur, dealing with incidents as they occur, solving crimes, responding quickly to appropriate calls and information from the public, Catching criminals, and Preventing crime.
Similar wording: Armenia, Bulgaria, Croatia, Czech Republic, Estonia, Georgia, Iceland, Ireland, Italy, Poland. Question not included: Denmark.

361
6.2.9 Feelings of safety
Table 6.2.9.1 Feelings of safety: Percentage of the respondents feeling unsafe or very unsafe on the street after dark
1990 1995 2000 2005 2010 Armenia ... ... ... ... ... Belgium ... 20 20 18 16 Bulgaria ... ... (55) (48) (45) Croatia ... ... 27.6 ... 10 Czech Republic ... ... ... 48.7 ... Denmark ... ... ... ... ... Estonia 49 43 41 32 28 Finland 19 23 27 23 22 France ... ... ... ... ... Georgia ... ... ... ... 78 Iceland ... ... ... ... 9.5 Ireland ... 26 25 26 25 Italy ... ... 27.6 ... 28.9 Lithuania ... ... 42.5 72 52.9 Netherlands ... ... ... ... 4.4 Poland ... ... ... ... 20.4 Portugal ... 25 ... ... ... Sweden ... ... ... 21 16 Turkey ... ... ... 39.4 25.8 UK: England & Wales ... ... ... ... (24) UK: Northern Ireland ... ... 32 33 28 UK: Scotland ... ... ... ... 31 Mean 34 27 33 36 27 Median 34 25 28 33 25 Minimum 19 20 20 18 4 Maximum 49 43 55 72 78
( ) Figures between brackets, see table 6.2.9.2 and notes on tables 6.2.1.1 to 6.2.9.2

362
Table 6.2.9.2 Feelings of safety: Deviations from the ICVS standard wording of the question
ESB Standard Wording How safe do you feel walking alone in your area after dark? Do you feel very safe, fairly safe, a bit unsafe, or very unsafe?
Belgium Do you ever avoid leaving your home when it is dark?
France The question does not specifically target the night situation: Do you ever personally feel insecure in your neighborhood or in your village? Often, occasionally, rarely, never, do not know? From the 2007 survey, there is also a question: in everyday life, do you ever refrain from going out for safety reasons? yes often, yes sometimes, yes but very rarely, never, never goes out? If affirmative: in the vicinity of your home, are there in particular groups of people that you are concerned about to the point of refraining from going out? often, yes sometimes, yes but very rarely, no.
Lithuania Do you feel safe from different offences in Lithuania? (survey conducted by Centre for Crime Prevention). Do you feel safe in your local area? (survey conducted by the Police Department under the Ministry of the Interior) Do you feel safe in Lithuania? / In your local area (city/ district)? / In your inner environment (street/ village) (survey conducted by the Ministry of the Interior of the Republic of Lithuania).
Netherlands Again the question is more or less similar, but now data are only available since 2008.
Portugal When you have to walk on foot, alone, at night in your neighborhood, how do you feel? Very safe, Reasonably safe, Somewhat unsafe, Very unsafe, You don’t go out at night, Doesn’t know / Doesn’t answer.
Sweden If you go out alone late in the evening in the area where you live, do you feel very safe, quite safe, quite unsafe, very unsafe or do you never go out alone late in the evening?
Turkey How safe do you feel walking around your neighborhood at night? Not safe at all, Not safe, Medium, Safe, Very safe.
Similar wording: Armenia, Bulgaria, Croatia, Czech Republic, Estonia, Finland, Georgia, Iceland, Ireland, Italy, Poland, UK: England & Wales, UK: Northern Ireland, UK: Scotland. Question not included: Denmark. Notes on Tables 6.2.1.1 to 6.2.9.2
Armenia: The questions in the survey refer to victimization in the last 3 years. Bulgaria: Data include the answers “don’t know” or “refused to answer”. Croatia: In 2009 the percentage of victims of theft of a motor vehicle was 1%. Note that this % was calculated in relation to the number of all the persons interviewed (although 15 % did not own a motor vehicle). In 2000 the % of victims of theft of a motor vehicle was calculated taking into account only car owners. In 2000, the % of victims reporting the crime of burglary to the police refers only to completed burglaries. Attempted burglary was much less frequently reported to the police – only in 30.5 % of the cases. Czech Republic: Bodily injury: Data are available only for the five-year period (2002-2006), and not for any particular year. Percentage of victims reporting to police: with the exception of corruption, data are available only for the five-year period 2002-2006. Incidence has not been studied. Estonia: Sexual assault: From 1992 to 2003 this includes both verbal and physical harassment; in 2008 it includes physical harassment only (the question was not comparable to the previous surveys, conclusions on trends cannot be made). Theft of motor vehicle reporting rate: the 2003 figure is technically correct, but it may not be reliable. France: Data on sexual assault in 2010 is calculated only for persons aged 18-75 years. Finland: Wording of the Trust in police question differs: How much do you trust in police? Responses: very much 42.4% quite much 49.2% = 92% Iceland: Number for theft of a personal property might include burglary, robbery, and theft of a motor vehicle. Italy: Bodily injury (assault) includes sexual assault. Turkey: Bodily injury: In 2005 this includes being beaten or injured. In 2010 it includes threats, injuries, sexual harassment, etc. Sexual assault is defined as sexual harassment. Robbery is defined as bag-

363
snatching . Theft includes purse snatching, pickpocketing, etc. Motor vehicle includes theft of motorcycle. Percentages are based on whole sample, not just owners. UK: England & Wales: Reporting rates for bodily injury refer to the offence of wounding, i.e., more serious assaults with injury. Sexual assault questions are based not on the 'screeener' question asked in 6.1, but on an additional CASI module on inter-personal violence, only asked of people aged 16-59. Theft of personal property data are taken from 'Other theft of personal property'. This excludes pick-pocketing and theft of items on the victim's person at the time; but this is the more prevalent crime type of the two. Trust in police: Please note that, owing to a change in question wording, data before the 2002/03 survey (covering 2001) are not compatible with data from later years. An order effect occurred between the 2010/11 and 2011/12 surveys, and so the 2011/12 figure (referring to 2010) is not compatible with previous estimates UK: Northern Ireland: 1) No data available for 1990 or 1995. 2) The NICS common assault definition includes minor injuries. 3) Trust in the police – this question was only included in the NICS from 2007/08 onwards, and therefore no data are available for 1995, 2001, 2005. 4) In all NICS publications victimisation rates for robbery are not published separately. However, they are categorised with snatch theft as mugging. UK: Scotland: Since 2011/12, the SCJS has been delivered on a biennial basis with no data collection in that financial year. Fieldwork is underway for the 2012/13 sweep and findings are expected to be reported in November 2013. The SCJS in its current form started in 2008/09, and therefore comparable data does not exist for years 2005 and before. Please note that the survey fieldwork is based on financial (April-March) rather than calendar years. Data is from financial year 2010-11. Years of reference Armenia … … … … … Belgium … 1998 2000 2004 2010 Bulgaria … … 2001 2006 2010 Croatia … … 2000 … 2009 Czech Republic … … … 2006 … Denmark … … … … … Estonia 1992 1994 1999 2003 2008 Finland 1988 1997 2003 2006 2009 France 1985 1995 2000 2005 2010 Georgia … … … … 2010 Iceland … … … … 2010 Ireland … 1996 2003 2006 2010 Italy … 1997 2002 … 2008 Lithuania … … 2004 2005 2007 Netherlands 1990 1995 2000 2005 2010 Poland … … … … 2008 Portugal … 1994 … … … Sweden … … … 2005 2010 Turkey … … … 2005 2010 UK: England & Wales 1991 1995 2000 2005 2010 UK: Northern Ireland … … 2001 2005 2010 6.3. Technical information The following tables include information on the methodology applied in the different countries for their victimization surveys.
Table 6.3.1 shows the size of the samples used in each survey. It can be seen that they have been gradually increasing during the 20 years under observation. By 2010, 10 countries out of 20 used samples of more than 10,000 households.
Table 6.3.2 specifies the kind of sample design used in the national surveys. In general, the most common design is multistage probability sample.
Table 6.3.3 shows the level of representativeness of the national samples used in the surveys.

364
Table 6.3.4 shows the response rate of the surveys. It can be seen that such rate has been generally decreasing since 2000. The reliability of response rates reported to reach 100% seems doubtful.
Table 6.3.5 shows the age range of people interviewed. The minimum age is usually 15-16 years old. Most countries do not fix a maximum age.
Table 6.3.6 shows the survey modes that have been used for each year of reference. CATI and CAPI are the most frequent modes of survey.
Table 6.3.1 Sample size of national victimization surveys 1990 1995 2000 2005 2010 Albania ... 1200 1500 1500 2590 Armenia ... ... ... ... 5337 Belgium ... (6000) (6000) (12000) (12000 ) Bulgaria ... ... 1615 2500 2557 Croatia ... ... 1532 ... 4500 Czech Republic ... ... ... 3082 ... Denmark ... 12000 (1000) 11668 11585 Estonia 1000 1173 1700 1687 4181 Finland 9598 13762 8163 7715 7193 France 11156 5786 5594 13263 16958 Georgia ... ... 3000 3000 3000 Hungary ... ... ... ... ... Iceland ... ... ... ... 2177 Ireland ... 2690 2994 3243 11391 Italy ... 50001 60001 60001 Lithuania ... ... 1003 1001 1001 Netherlands 4513 5936 8756 5242 39220 Poland ... ... ... ... 17000 Portugal ... 13500 ... ... ... Sweden ... ... ... 10000 20000 Turkey ... ... ... 2880 3440 UK: England & Wales 10059 16348 32824 47023 46031 UK: Northern Ireland ... ... 3010 3692 4081 UK: Scotland ... ... ... ... 13010
( ) Figures in brackets, see notes on tables 6.3.1 – 6.3.6
Table 6.3.2 Sample design of national victimization surveys
Sample design 1990 1995 2000 2005 2010 Simple random sampling
2 countries: Finland, France.
3 countries: Denmark, Finland, France.
2 countries: Finland, France
3 countries: Denmark, Finland, France.
2 countries: Denmark, Finland, France.
Stratified random sampling
2 countries: Armenia, Italy.
2 countries: Armenia, Italy.
2 countries: Armenia, Italy.
3 countries: Armenia, Iceland, Italy.
Stratified two stage cluster sampling
1 country: Bulgaria.
2 countries: Bulgaria, .Turkey
2 countries: Bulgaria, Turkey.
Multistage probability sample
2 countries: Estonia, UK: England & Wales.
3 countries: Estonia, Ireland UK: England & Wales.
5 countries: Estonia, Ireland, Lithuania UK: England & Wales, UK: Scotland.
5 countries: Estonia, Ireland, Lithuania UK: England & Wales, UK: Scotland.
6 countries: Estonia, Georgia, Ireland, Lithuania UK: England & Wales, UK: Scotland.
Other quota sampling
1 country: France
1 country: Czech Republic

365
Table 6.3.3 Sample representativeness of national victimization surveys
Sample representativeness
1990 1995 2000 2005 2010
National level 2 countries: Estonia, France.
3 countries: Estonia, France, UK: England & Wales.
5 countries: Croatia, Estonia, France, Lithuania, UK: England & Wales.
4 countries: Estonia, France, Lithuania, UK: England & Wales.
4 countries: France, Georgia, Lithuania, UK: England & Wales.
National level and first regional level
1 country: Finland.
3 countries: Denmark, Finland, Italy.
3 countries: Bulgaria, Finland, Italy,
4 countries: Bulgaria, Czech Republic, Denmark, Finland,
7 countries: Bulgaria, Croatia, Denmark, Estonia, Finland, Iceland, Italy.
National level, first regional level and second regional level
1 country: Belgium.
1 country: Belgium.
1 country: Belgium.
1 country: Belgium.
National level, and urban-rural breakdown
1 country: Turkey.
1 country: Turkey.
Blocks then household
1 country: Ireland.
1 country: Ireland.
1 country: Ireland.
1 country: Ireland.
Table 6.3.4 Response rate of national victimization surveys, %
1990 1995 2000 2005 2010 Albania … (96.5) (93.6) (100) (100) Belgium … 72 59 66 63 Denmark … 64 … 64 63 Estonia … … … … 58 Finland 86.9 81.9 81.0 76.4 75.1 Iceland … … … … 55.3 Italy … (100) (100) … (100) Netherlands … 55 59 70 39 Poland … … … 64.6 Portugal … 99.9 … … … Sweden … … … 70 70 UK: England & Wales 77 83 73 75 (67 / 75) UK: Northern Ireland … … 69.7 64.4 68 UK: Scotland … … … … 62.4
Note to Table 6.3.4: The methodology applied for computing the response rate varies from country to country. Rates reaching 100% must be interpreted cautiously and are therefore presented between brackets.

366
Table 6.3.5 Age range of respondents in national victimization surveys
Age range 1990 1995 2000 2005 2010 Countries setting a minimum age for the persons interviewed
2 countries: Estonia (16), Finland (15).
7 countries: Belgium (15), Estonia (16), Finland (15), Ireland (18), Italy (14), Netherlands (15), Portugal (16).
10 countries: Belgium (15), Bulgaria (16), Croatia (16), Estonia (16), Finland (15), Georgia (26), Ireland (18), Italy (14), Lithuania (15), Netherlands (15).
9 countries: Belgium (15), Bulgaria (15), Czech Republic (15), Estonia (16), Finland (15), Georgia (16), Ireland (18), Lithuania (15), Netherlands (15).
13 countries: Armenia (14), Belgium (15), Bulgaria (15), Croatia (18), Estonia (16), Finland (15), Georgia (16), Iceland (18), Ireland (18), Italy (14), Lithuania (15), Netherlands (15), Poland (15).
Countries setting a maximum age for the persons interviewed
1 country: Estonia (74).
1 country: Estonia (74).
2 countries: Estonia (74), Finland (74)
3 countries: Czech Republic (79), Estonia (74), Lithuania (74).
5 countries: Armenia (70), Estonia (74), Georgia (65), Iceland (75), Lithuania (74).
Table 6.3.6 Survey mode of national victimization surveys
Survey Mode 1990 1995 2000 2005 2010 Face to face CATI 2 countries:
Denmark, Italy. 4 countries: Belgium, Croatia, Finland, Italy.
3 countries: Belgium, Denmark, Finland.
4 countries: Belgium, Finland, Iceland, Italy.
CATI + PAPI 1 country: Belgium.
1 country: Czech Republic.
1 country: Croatia.
CATI + CAWI 1 country Denmark. CATI + Face to face
1 country: Finland.
1 country: Finland.
CAPI 1 country: Ireland.
2 countries: Estonia, Ireland,
5 countries: Estonia, France, Ireland, Turkey, UK: Scotland,
4 countries: Estonia, Georgia, Turkey, UK: Scotland.
CAPI + CASI 1 country UK: England & Wales.
1 country UK: England & Wales.
1 country UK: England & Wales.
2 countries: France, UK: England & Wales.
PAPI 3 countries: Estonia, France, UK: England & Wales.
2 countries: Estonia, France.
4 countries: Bulgaria, France, Lithuania, UK: Scotland.
2 countries: Bulgaria, Lithuania.
2 countries: Bulgaria, Lithuania.
Notes on tables 6.3.1 – 6.3.6
Belgium: The figures for the sample size are weighted. In 2010 the N of the non-weighted sample is 37,000. Croatia: The counting unit in the 2000 and the 2009 surveys was the person. Czech Republic: 2006 means data collected November 2005-November 2006. Denmark: Data corresponds to the year in which surveys were carried out. There are no exact data for the sample size in 2000, but it was much smaller than the others. Estonia: The most recent survey was carried out from November 2008 to May 2009. The period of reference was 12 months prior to the interview. Accordingly, for most of the respondents the major reference period was 2008, but it could include also victimizations suffered from November 2007 to May 2009.

367
Finland: Since 2012, the Finnish National Research Institute of Legal Policy has started an annual victimization survey. Georgia: The respondents represented the whole country, with the exception of the breakaway territories (South Ossetia and Abkhazia). Iceland: Data from the ICVS for 2005 is available but it is not comparable to the data from 2010. Lithuania: The methodology and results presented here correspond to the surveys conducted by the Centre for Crime Prevention in 2005, 2006 and 2008. For the rest of the surveys mentioned in Table 6.1.3 there were no such detailed analyses of offences or the surveys covered a five-year period of reference. Turkey: Although detailed information is not available, it appears that more than one person was surveyed in each household, as the total number of interviews was 6983 for 2005, and 7027 for 2010. The survey was conducted for the first time in 2003, hence there are no data before that.

368
6.4 Sources Armenia Report on victimization funded by OSCE Yerevan office, 2010. Belgium Belgian Federal Police - Direction of the operational police information - service of
policy support Enquête bisannuelle. Bulgaria Source: Center for the Study of Democracy / Vitosha Research – National Crime
Survey 2002-2012, published in Crime Trends in Bulgaria 2000-2010, Center for the Study of Democracy, Sofia, 2011, available at: http://www.csd.bg/artShow.php?id=15693.
Croatia Ministry of Interior and United Nations Development Program, National Public Opinion Survey on Citizen Perception of Safety and Security in the Republic of Croatia, http://www.undp.hr/upload/file/230/115095/FILENAME/Survey_on_safety_and_security_E.pdf (for 2009 survey) For 2000 survey, the source is the unpublished report received from the survey coordinator, prof. dr. Turkovi.
Czech Republic Martinkova Milada: Experiences of Czech Republic citizens with some delicts - victimological survey results, ICSP, published 2007 http://www.ok.cz/iksp/ publikace. html#s2007 english summary.
Denmark 2005 and 2010: Ministry of Justice: http://www.justitsministeriet.dk/sites/default/ files/media/Arbejdsomraader/Forskning/Forskningsrapporter/2012/Offerrapport%202012.pdf 1995 a report by Flemming Balvig.
Estonia Kuriteoohvrite uuring 2009. Justiitsministeerium. Tallinn, 2010. (English summary) http://www.just.ee/victim
Finland The National Research Institute of Legal Policy in Finland is responsible for the data analysis. Rikollisuustilanne 2011, Omaisuusrikosten kohteeksi joutuminen 2006: yleisyys, piirteet ja muutokset, 2008 OPTL.
France For 1985, 1995, 2000 and 2005, according to Robert Ph., Zauberman R., Nevanen S., Didier E., the development of delinquency based on surveys of victimisation, France, 1984-2005, Déviance & Société, 2008, 32, 4, 435-471. Miceli l., Nevanen S., Robert Ph., Zauberman R., the survey living standards and security in the set of data on victimization, Economie & statistiques, 2009, 426, 3-28. For 2010, the embargo against the scientific world on the 2010 survey having been ended in fall 2012, we have not yet had the time necessary for the systematic review of the results of this survey. We therefore give the results for [2008-2009] / 2 which are the most recent one for which we have been able to conduct a systematic review.
Ireland Module included in Quarterly National Household Survey (QNHS), CSO Italy Italian Institute of Statistics – www.istat.it Lithuania The survey results are presented at the website of the Centre for Crime
Prevention (http://www.nplc.lt/lit/tyr/_tyrimai.aspx). Centre for Crime Prevention broke off the work.
Netherlands Incidence of victimization over the last 12 months are provisional figures. Theft of personal property is split up according to categories provided in Table on availability of questions in the survey.
Poland Data base of the Polish Crime Survey. Portugal Based on data from Inquérito de vitimação 1992, ISBN 972-8030-02-9; and
Inquérito de Vitimação 1994, ISBN 972-8030-05-3. Sweden National Council for Crime Prevention, Sweden, www.bra.se. Turkey Turkish Statistical Institute, Life Satisfaction Survey on-line statistical tables:
http://www.tuik.gov.tr/PreTabloArama.do UK: England & Wales
The User Guide to Crime Statistics in England and Wales http://www.ons.gov.uk/ons/guide-method/method-quality/specific/crime-statistics-methodology/index.html and BCS 2010/11 User Guide http://www.esds.ac.uk/findingData/snDescription.asp?sn=6937
UK: Northern Ireland Source: Based on data taken from NICS 2001, NICS 2005, NICS 2010/11 Technical reports. There is no data available for 1990 or 1995. The NICS 2010/11 Technical report can be found on the DOJ SRB webpage below; http://www.dojni.gov.uk/index/statistics-research/stats-research-publications/northern-ireland-crime-survey-s-r/ni-crime-survey-2010-11-technical-report.htm
UK: Scotland http://www.scotland.gov.uk/Publications/2011/10/28142346/19 2010/11 Scottish Crime and Justice Survey: Main Findings.

369
Appendix I: General definitions
A) Offences
The offence definitions given hereafter are operational, not legal definitions (“standard” definitions). They were devised to allow national correspondents to provide the necessary data for their countries and to specify the scope of the statistical (and legal) definitions underlying their (police and conviction) statistics. Standard definitions were chosen in a way to maximize the number of countries that could meet them without reservation. Standard definitions are listed for police-recorded offences and for convictions, with the possibility to state for both levels, using an include / exclude checklist, whether national definitions deviate from the standard definition.
The following Tables 1 and 2 show which countries were able to meet the standard definitions in all respects (marked “YES”), which countries provided data, but did not fully meet the standard definition (marked “NO”) and which countries did not provide any figures in chapters 1 and / or 3 for certain offences (marked “…”). In a very few cases, country responses were ambiguous or incomplete, thus making it unclear whether a certain definition had been fully met or not; the respective definitions are marked “Y/N” for these countries in the tables.
Table 1 refers to the police level, Table 2 to convictions. At the bottom of each table is indicated how many countries were able to meet the standard definitions. A high rate of deviation from the standard definition stands for substantial variation in definitions across Europe, while a low rate of deviation suggests rather uniform offence definitions across the continent.
For those countries that were unable to meet the standard definition, the following text (after Table 2) shows the way in which their offence definitions deviated from the standard. If a deviation refers to only one level (police or convictions), this level is indicated in brackets.36 Otherwise, deviations refer to both levels.
Deviations are relatively frequent with respect to offences that are rather vague and hard to distinguish from related offences, such as bodily injury. As the detailed indications in the following sections will illustrate, the deviations are often related to problems in statistical recording of cases on the fringes of other offences, such as assault leading to death. Such problems increase for offence groups between mere administrative and truly criminal offences, such as major traffic offences: Offences that are not defined as criminal in one country can and should typically not be included, while it is also difficult to exclude from a given offence group in another country offences that are considered criminal.
Consistency in definitions is rather high with respect to, for example, the definitions of robbery and sexual assault. The latter has been completely revised after it turned out that the definition used for the 4th edition did not work well.37 Sexual assault is now the main category for sexual offences, with rape and sexual abuse of a child as subcategories. Hence, results on sexual assault from this edition are not comparable to the results from the last edition.
How important are deviations in quantitative respect, and how much do they affect comparability? As a general rule, one may say that the inclusion or exclusion of “minor” offences (e.g., minor theft) has a greater impact on overall rates than deviations on relatively rare constellations, such as “assault leading to death”.
36 This does not necessarily mean that the rule was followed on the other level: It is also possible that data were not available or the reply of the country was insofar ambiguous or incomplete (also cf. Tables 1 and 2). 37 Cf. Aebi et al. (2010). European Sourcebook of Crime and Criminal Justice Statistics - 2010, 4th edition. Den Haag: Boom Juridische uitgevers, pp. 341-346, 356-358; Harrendorf (2012). Offence Definitions in the European Sourcebook of Crime and Criminal Justice Statistics and Their Influence on Data Quality and Comparability, European Journal on Criminal Policy and Research 18(1), 23-53.

370
Table 1: Standard definitions followed in all respects on police level (part 1)
Total criminal offences
Major traffic offences
Intentional homicide
Bodily Injury (assault)
Aggrav. bodily injury (assault)
Sexual assault Rape
Sexual abuse of a child Robbery
Albania YES NO NO YES NO NO YES NO YES Armenia YES NO NO NO NO YES YES … YES Austria YES NO YES YES NO YES YES YES YES Belgium NO … NO NO NO YES NO NO YES Bulgaria NO NO NO YES YES YES NO … YES Croatia NO NO YES YES YES YES YES YES YES Cyprus NO NO YES YES YES YES YES YES YES Czech Republic NO NO NO NO … YES YES YES NO Denmark NO … YES NO YES YES YES YES YES Estonia NO NO NO YES YES YES YES YES YES Finland YES YES YES NO NO YES YES YES YES France NO … YES NO … NO NO Y/N YES Georgia NO NO NO NO NO NO NO … YES Germany NO … YES NO NO YES YES NO YES Greece YES YES YES NO … YES YES … YES Hungary NO NO NO NO NO NO NO NO YES Iceland NO … YES NO NO NO YES NO YES Ireland … NO NO YES YES YES NO NO YES Italy YES YES YES YES … YES … YES NO Kosovo (UNR) NO NO NO NO NO NO NO NO NO Lithuania YES NO YES NO YES NO NO NO NO Malta Y/N … NO Y/N … Y/N Y/N Y/N Y/N Netherlands YES YES NO NO … NO NO … YES Norway NO Y/N Y/N Y/N Y/N Y/N Y/N Y/N Y/N Poland NO NO YES NO YES YES NO NO NO Portugal YES NO NO NO NO NO NO NO YES Russia NO NO NO NO … … NO … YES Serbia YES NO NO NO NO NO NO NO YES Slovakia YES NO YES YES … YES NO NO YES Slovenia NO … NO NO NO YES NO NO YES Spain NO NO NO YES … NO YES … YES Sweden YES Y/N NO NO … YES NO YES YES Switzerland NO … NO NO NO YES NO NO YES Turkey … … Y/N Y/N … Y/N … … Y/N Ukraine NO NO NO NO NO … NO NO YES UK: England & Wales NO NO NO YES NO YES NO Y/N YES UK: Northern Ireland YES NO YES YES YES YES YES YES YES UK: Scotland YES NO NO NO NO YES YES YES NO Total “YES” 14 4 14 12 9 22 15 11 29 Total “NO” 21 23 22 23 17 11 19 15 6 Total "Y/N" 1 2 2 3 1 3 2 4 3 Total "…" 2 9 0 0 11 2 2 8 0 % “YES” 37% 11% 37% 32% 24% 58% 39% 29% 76% % “NO” 55% 61% 58% 61% 45% 29% 50% 39% 16% % "Y/N" 3% 5% 5% 8% 3% 8% 5% 11% 8% % "…" 5% 24% 0% 0% 29% 5% 5% 21% 0%

371
Table 1 Standard definitions followed in all respects on police level (part 2)
Theft
Theft of a motor vehicle Burglary
Domestic burglary Fraud
Money laun-dering
Corruption in the public sector
Drug offences total
Drug trafficking
Firearm involved
Albania YES YES YES YES YES NO NO YES NO Y/N Armenia NO YES … … NO YES YES NO NO … Austria YES NO NO YES NO YES NO NO … NO Belgium YES NO YES YES YES YES YES NO NO Y/N Bulgaria YES NO … … YES … NO NO … NO Croatia NO YES YES YES NO YES YES YES YES NO Cyprus NO YES YES YES NO NO YES NO NO NO Czech Republic YES NO NO NO NO YES NO NO NO … Denmark YES YES YES YES YES … NO NO YES … Estonia NO NO … NO YES YES NO YES YES … Finland YES YES NO NO YES YES NO YES YES … France YES NO NO NO NO … … NO NO NO Georgia YES YES YES YES NO YES NO NO YES NO Germany YES NO YES YES YES YES YES NO YES YES Greece YES NO NO … NO … NO NO … … Hungary NO NO NO NO YES NO NO NO YES NO Iceland YES YES NO NO NO YES NO NO NO Y/N Ireland YES YES YES … NO YES YES YES YES NO Italy YES YES YES … NO YES … YES … … Kosovo (UNR) NO NO YES YES NO NO NO NO NO … Lithuania NO YES … YES NO YES NO NO YES NO Malta NO Y/N Y/N Y/N … … … … Y/N Y/N Netherlands YES NO … NO YES YES … NO … … Norway YES Y/N … Y/N Y/N … … Y/N … … Poland NO NO NO NO NO YES YES NO NO NO Portugal YES NO YES YES YES YES NO NO NO Y/N Russia NO NO … NO YES … NO NO … … Serbia NO YES Y/N NO YES Y/N NO NO YES Y/N Slovakia NO NO NO NO YES YES NO NO NO NO Slovenia YES NO NO YES NO YES NO NO YES … Spain Y/N NO … YES NO YES NO Y/N YES Y/N Sweden YES YES NO YES YES YES NO YES YES Y/N Switzerland YES YES YES YES NO NO YES YES YES … Turkey YES NO NO NO NO … NO Y/N … … Ukraine NO YES … YES NO YES NO NO NO … UK: England & Wales NO YES YES YES NO YES … Y/N NO Y/N UK: Northern Ireland YES NO YES YES NO … … YES YES NO UK: Scotland YES NO NO YES NO NO YES NO NO … Total “YES” 23 16 14 19 14 22 9 9 15 1 Total “NO” 14 20 13 12 22 6 22 24 14 12 Total "Y/N" 1 2 2 2 1 1 0 4 1 9 Total "…" 0 0 9 5 1 9 7 1 8 16 % “YES” 61% 42% 37% 50% 37% 58% 24% 24% 39% 3% % “NO” 37% 53% 34% 32% 58% 16% 58% 63% 37% 32% % "Y/N" 3% 5% 5% 5% 3% 3% 0% 11% 3% 24% % "…" 0% 0% 24% 13% 3% 24% 18% 3% 21% 42%

372
Table 2 Standard definitions followed in all respects on convictions level (part 1)
Total criminal offences
Major traffic offences
Intentional homicide
Bodily Injury (assault)
Aggrav. bodily injury (assault)
Sexual assault Rape
Sexual abuse of a child Robbery
Albania YES NO NO NO NO NO YES NO YES Armenia YES NO NO NO NO YES YES NO YES Austria YES … YES YES NO YES YES NO YES Belgium … … … … … … … … … Bulgaria NO NO NO NO … NO NO … YES Croatia YES NO YES YES YES YES YES NO YES Cyprus NO … YES YES YES NO YES NO YES Czech Republic NO … NO NO NO YES YES NO NO Denmark NO … YES NO YES YES YES NO YES Estonia NO NO NO YES YES YES YES YES YES Finland YES YES NO NO NO YES YES YES YES France NO NO YES YES YES NO NO NO … Georgia NO NO NO … NO … NO … YES Germany YES YES YES NO NO YES YES NO YES Greece NO NO NO NO YES YES YES Y/N YES Hungary YES NO NO NO NO NO NO YES YES Iceland … … … … … … … … … Ireland … NO NO YES YES YES NO NO YES Italy YES … YES YES … YES … YES NO Kosovo (UNR) NO Y/N NO NO NO NO NO NO YES Lithuania YES NO YES NO YES NO NO NO NO Malta … … Y/N … … … … … … Netherlands YES YES NO NO NO YES NO YES YES Norway … … … … … … … … … Poland NO NO YES NO YES YES NO NO NO Portugal YES NO NO NO NO NO YES NO YES Russia … … … … … … NO … … Serbia YES NO YES NO NO NO NO NO YES Slovakia Y/N Y/N Y/N Y/N … Y/N Y/N Y/N Y/N Slovenia NO NO NO NO NO YES NO NO YES Spain YES … … … … … … … … Sweden YES Y/N YES NO NO YES NO YES YES Switzerland NO NO NO NO NO YES NO NO Y/N Turkey YES NO YES NO NO YES … YES YES Ukraine NO NO NO NO NO … NO NO YES UK: England & Wales NO NO NO NO … NO YES NO NO UK: Northern Ireland NO NO YES YES YES YES YES YES YES UK: Scotland YES NO NO NO NO YES YES YES YES Total “YES” 16 3 13 8 10 19 15 9 24 Total “NO” 15 21 18 22 18 10 15 19 5 Total "Y/N" 1 3 2 1 0 1 1 2 2 Total "…" 6 11 5 7 10 8 7 8 7 % “YES” 42% 8% 34% 21% 26% 50% 39% 24% 63% % “NO” 39% 55% 47% 58% 47% 26% 39% 50% 13% % "Y/N" 3% 8% 5% 3% 0% 3% 3% 5% 5% % "…" 16% 29% 13% 18% 26% 21% 18% 21% 18%

373
Table 2 Standard definitions followed in all respects on convictions level (part 2)
Theft
Theft of a motor vehicle Burglary
Domestic burglary Fraud
Money laun-dering
Corruption in the public sector
Drug offences total
Drug trafficking
Albania YES … … … YES YES YES YES YES Armenia NO YES … … NO YES YES NO NO Austria YES … NO … NO YES NO NO NO Belgium … … … … … … … … … Bulgaria YES NO … … YES … NO NO … Croatia YES YES NO … NO … YES YES YES Cyprus NO … YES … NO … YES NO … Czech Republic YES … … … NO YES NO NO NO Denmark YES YES YES YES YES … NO NO YES Estonia NO … … … YES YES NO NO YES Finland YES YES … … YES YES NO YES YES France NO … … … NO … NO NO … Georgia YES … … … … … … NO YES Germany YES … NO NO NO YES YES NO YES Greece YES NO … … NO … NO NO NO Hungary YES YES … … YES NO NO NO … Iceland … … … … … … … … … Ireland YES YES YES … NO YES YES YES YES Italy YES … … … NO … YES YES … Kosovo (UNR) NO … YES … NO NO NO NO NO Lithuania YES … … … NO YES NO NO YES Malta … … … … … … … … … Netherlands YES … NO … YES YES YES NO … Norway … … … … … … … … … Poland NO … NO … NO YES YES NO NO Portugal YES YES YES YES YES YES NO NO YES Russia … … … … … … … … … Serbia NO … … … YES Y/N NO NO YES Slovakia Y/N Y/N Y/N Y/N Y/N Y/N Y/N Y/N Y/N Slovenia YES … NO … NO YES NO NO YES Spain … … … … … … … … … Sweden YES YES … … YES YES NO YES … Switzerland NO … … … Y/N NO YES NO YES Turkey YES … … … NO … NO YES YES Ukraine NO Y/N … YES NO YES NO NO NO UK: England & Wales NO YES YES YES NO … … Y/N Y/N UK: Northern Ireland YES YES YES YES NO … NO YES … UK: Scotland YES NO NO … NO NO YES NO NO Total “YES” 21 10 7 5 10 15 11 8 14 Total “NO” 10 3 7 1 19 4 18 22 8 Total "Y/N" 1 2 1 1 2 2 1 2 2 Total "…" 6 23 23 31 7 17 8 6 14 % “YES” 55% 26% 18% 13% 26% 39% 29% 21% 37% % “NO” 26% 8% 18% 3% 50% 11% 47% 58% 21% % "Y/N" 3% 5% 3% 3% 5% 5% 3% 5% 5% % "…" 16% 61% 61% 82% 18% 45% 21% 16% 37%

374
A. Total criminal offences
In principle, all offences subject to criminal proceedings should be included. This rule is, however, not trivial: There are some countries which follow a minor offence concept either excluding such offences from the criminal code (for example the wykroczenia in Poland in cases of minor thefts etc.) or making them subject to special proceedings (for example most contraventions in France which are handled by the police only) outside the criminal justice system. Sometimes they are recorded in police statistics, sometimes not.
Where possible, the figures include: • Minor theft and other minor property offences • Minor assault and other minor violent offences • Criminal offences committed by minors • Major traffic offences • All other criminal offences subject to criminal proceedings
They exclude: • All other traffic offences • Breaches of public order regulations • All minor offences subject to proceedings outside the criminal justice system (i.e misdemeanors, contraventions, wykroczenia, faltas etc.)
This means that the providers of the data (= national correspondents) were requested to ensure that “their” figures included, where available from their national statistics, “minor theft”, “minor assault”, etc.
The following countries exclude minor theft and other minor property offences from their data: • Croatia (police level) • Cyprus • Estonia (but included for repeat offenders from the 3rd offence on) • Georgia • Hungary (police level) • Lithuania (minor theft up to about 38 € only) • Poland • Switzerland (conviction level) • Ukraine
Regarding minor assault and other minor violent offences, the following countries exclude this offence category from the total: • Cyprus • Georgia • Poland • Slovenia • Switzerland (conviction level) • Ukraine
Criminal offences committed by minors are excluded in: • Denmark (conviction level) • Greece (conviction level) • Hungary (police level) • Poland (conviction level, except for most serious offences)
Major traffic offences are only excluded in: • Belgium (police level) • Denmark (police level) • France (police level) • Germany (police level) • Iceland (police level) • Russia (police level) • Slovenia

375
• Switzerland (police level) • Ukraine
Regarding all other criminal offences subject to criminal proceedings, these are – in general – included in the police and conviction statistics of all countries. There are – however – some specific offence categories which are excluded sometimes.
For example, in Bulgaria police statistics exclude all crimes against the Republic of Bulgaria (treason, espionage, etc.), crimes against the country’s defence capacity, military crimes, crimes against peace and humanity, and crimes committed abroad. In France, offences linked to economic and administrative policing (labour, food safety, environment, customs, etc.) are excluded. In Germany, tax and customs offences as well as offences against the security of the state (like treason, terrorism, etc.) and international crimes are excluded. Such exceptions will exist in many countries.
1.2 Countries deviating from exclude rules:
All other traffic offences (i.e., even minor ones) are included in: • Bulgaria • Czech Republic • France (conviction level) • Kosovo (UNR) • Spain • UK: England & Wales (conviction level) • UK: Northern Ireland (conviction level)
In the following countries, breaches of public order regulations are included: • Czech Republic • Hungary (police level) • Norway (police level) • Russia (police level) • Switzerland (police level) • UK: England & Wales • UK: Northern Ireland (conviction level)
Other minor offences subject to proceedings outside the criminal justice system are included in: • France (conviction level) • Kosovo (UNR) B. Major traffic offences
According to the standard definition, major traffic offences mean severe road traffic offences. Where possible, the figures include: • Negligent homicide and negligent injury in road traffic • Dangerous / reckless driving
(i.e., driving in a way that falls far below what would be expected of a competent and careful driver and is obviously endangering the life or health of another person or leads to the danger of serious damage to property)
• Seriously endangering road traffic in other ways (e.g., removing traffic signs, building obstacles, throwing objects onto the motorway) • Driving under the influence of drugs or alcohol • Driving while impaired for other reasons • Driving while disqualified or licence suspended / revoked • All other cases of driving without a valid licence • Hit-and-run driving

376
They exclude: • Offences committed outside road traffic (e.g., involving trains, airplanes, ships or boats) • Driving without insurance against damage to third parties (motor liability insurance) • Driving without paying motor vehicle tax • Driving without or using wrong number plates • Driving a motor vehicle that is not roadworthy (if not considered dangerous driving) • Speeding (if not considered dangerous driving) • Failing to stop at a red traffic light, disregard of right of way, overtaking incorrectly and
wrong-way driving (if not considered dangerous driving) • Parking violations • All other traffic offences 2.1 Countries deviating from include rules:
The following countries exclude negligent homicide and negligent injury in road traffic: • Cyprus (police level) • Greece (conviction level) • Hungary (conviction level) • Turkey (conviction level) • UK: England & Wales (conviction level)
Dangerous or reckless driving is excluded in: • Albania (conviction level) • Armenia • Austria (police level) • Croatia • Czech Republic (police level) • Estonia • Hungary (conviction level) • Lithuania • Ukraine
In these countries seriously endangering road traffic in other ways is excluded: • Albania • Armenia • Austria (police level) • Croatia • Estonia • Lithuania • Poland • Portugal • Russia (police level) • Ukraine • UK: England & Wales (conviction level) • UK: Northern Ireland (police level) • UK: Scotland
Driving under the influence of drugs or alcohol is excluded in: • Armenia • Austria (police level) • Croatia • Hungary (conviction level) • Kosovo (UNR) (police level) • Lithuania • Slovenia (conviction level) • Ukraine • UK: England & Wales • UK: Northern Ireland (police level)

377
A large number of countries have to exclude driving while impaired for other reasons from their data: • Albania • Armenia • Austria (police level) • Bulgaria • Croatia • Czech Republic (police level) • Estonia • Georgia • Hungary • Kosovo (UNR) (police level) • Lithuania • Poland • Portugal (police level) • Russia (police level) • Slovakia (police level) • Slovenia (conviction level) • Ukraine • UK: England & Wales • UK: Northern Ireland (police level) • UK: Scotland
Many countries also exclude driving while disqualified or licence suspended / revoked: • Armenia • Austria (police level) • Croatia • Estonia • Georgia • Hungary (conviction level) • Ireland • Kosovo (UNR) (police level) • Lithuania • Poland • Slovakia (police level) • Slovenia (conviction level) • Turkey (conviction level) • Ukraine • UK: England & Wales (police level) • UK: Northern Ireland (police level)
The same is true for all other cases of driving without a valid licence, which are excluded in: • Armenia • Austria (police level) • Croatia • Estonia • Georgia • Hungary • Ireland • Kosovo (UNR) (police level) • Lithuania • Poland • Slovakia (police level) • Slovenia (conviction level) • Turkey (conviction level) • Ukraine • UK: England & Wales (police level)

378
• UK: Northern Ireland (police level)
Hit-and-run driving is only excluded in: • Austria (police level) • Estonia • Hungary (conviction level) • Lithuania • Portugal • Turkey (conviction level) • UK: England & Wales 2.2 Countries deviating from exclude rules:
Offences committed outside road traffic are included in: • Bulgaria • Croatia • Czech Republic (police level) • France (conviction level) • Hungary • Kosovo (UNR) (police level) • Serbia • Switzerland (conviction level) • Turkey (conviction level) • Ukraine • UK: Northern Ireland (conviction level)
The following countries include driving without an insurance against damage to third parties (motor liability insurance) in their data: • Cyprus (police level) • France (conviction level) • Kosovo (UNR) (police level) • Russia (police level) • Switzerland (conviction level) • UK: England & Wales (conviction level) • UK: Northern Ireland (conviction level)
Driving without paying motor vehicle tax is only included in: • Cyprus (police level) • France (conviction level) • Kosovo (UNR) (police level) • Switzerland (conviction level) • UK: England & Wales (conviction level) • UK: Northern Ireland (conviction level)
In the following countries, driving without or using wrong number plates is included: • Bulgaria • Cyprus (police level) • France (conviction level) • Kosovo (UNR) (police level) • Russia (police level) • Spain (police level) • Switzerland (conviction level) • UK: England & Wales (conviction level) • UK: Northern Ireland (conviction level)
Driving a motor vehicle that is not roadworthy is included in: • Cyprus (police level) • France (conviction level) • Kosovo (UNR) (police level)

379
• Russia (police level) • Switzerland (conviction level) • UK: Northern Ireland (conviction level)
Only the following countries have to include speeding: • Cyprus (police level) • France (conviction level) • Russia (police level) • Switzerland (conviction level) • UK: Northern Ireland (conviction level)
Even failing to stop at a red traffic light, disregard of right of way, overtaking incorrectly and wrong-way driving are included in: • Cyprus (police level) • France (conviction level) • Kosovo (UNR) (police level) • Russia (police level) • UK: Northern Ireland (conviction level)
There are only very few countries which include parking violations: • France (conviction level) • Kosovo (UNR) (police level) • Russia (police level)
All other traffic offences are included in: • Bulgaria • Cyprus (police level) • France (conviction level) • Kosovo (UNR) (police level) • Russia (police level) C. Intentional homicide
According to the standard definition, intentional homicide means intentional killing of a person. Where possible, the figures include: • Assault leading to death • Euthanasia • Infanticide • Attempts
They exclude: • Assistance with suicide • Abortion • Negligent killing 3.1 Countries deviating from include rules:
The following countries exclude assault leading to death: 38 • Albania (conviction level) • Armenia • Belgium (police level) • Bulgaria • Czech Republic • Estonia • Finland (conviction level) • Hungary (conviction level) • Netherlands
38 As could be expected, many of these countries on the other hand include assault leading to death in bodily injury data.

380
• Portugal (conviction level) • Slovenia
These countries exclude cases of euthanasia: • Belgium (police level) • Estonia • Greece (conviction level) • Serbia (police level) • Slovenia • Spain (police level) • Switzerland • Ukraine • UK: England & Wales
Infanticide is excluded in: • Estonia • Greece (conviction level) • Serbia (police level) • Spain (police level) • Ukraine
Finally, attempts are excluded in: • Ireland • Kosovo (UNR) (police level) • Malta (police level) • Portugal (police level) • Sweden (police level) • UK: England & Wales (police level) 3.2 Countries deviating from exclude rules:
Assistance with suicide is included only in • Georgia • Hungary • Kosovo (UNR) • Russia (police level) • Switzerland (police level) • UK: England & Wales (police level) • UK: Scotland
Only three countries include abortion: • Hungary (conviction level) • Kosovo (UNR) • Netherlands
Some countries even include negligent killings: • Albania (police level; only for 2007 to 2009) • Hungary (police level) • Kosovo (UNR) (conviction level) • Russia (police level) • UK: England & Wales • UK: Scotland D. Bodily injury (assault)
According to the standard definition, bodily injury means inflicting bodily injury on another person with intent. Where possible, the figures include: • Minor bodily injury • Aggravated bodily injury

381
• Bodily injury of a public servant/official • Bodily injury in a domestic dispute • Attempts
They exclude: • Assault leading to death • Threats • Assault only causing pain (e.g., slapping) • Sexual assault • Negligent bodily injury 4.1 Countries deviating from include rules:
The following countries exclude minor bodily injury: • Czech Republic • France (police level) • Poland • Slovenia • Switzerland (conviction level) • Ukraine
All countries are able to include aggravated bodily injury.
Bodily injury of a public servant is excluded in: • Portugal • Slovenia • Turkey (conviction level) • Ukraine
Bodily injury in a domestic dispute is only excluded in Slovenia. For Poland, on the other hand, figures include domestic violence even if no bodily injury occurred.
Slovenia also excludes attempts.
4.2 Countries deviating from exclude rules:
Assault leading to death is included in the following countries:39 • Albania (conviction level) • Armenia • Belgium (police level) • Czech Republic • Georgia (police level) • Greece • Hungary • Iceland (police level) • Netherlands • Portugal (conviction level) • Serbia • Switzerland
Threats are only included in: • Georgia (police level) • Kosovo (UNR) • UK: England & Wales (conviction level)
39 As could be expected, many of these countries on the other hand exclude assault leading to death from homicide data.

382
Assault only causing pain is included in these countries: • Belgium (police level) • Bulgaria (conviction level) • Denmark • Finland • Germany • Hungary (police level) • Kosovo (UNR) • Lithuania • Netherlands • Portugal • Sweden • Switzerland (police level) • UK: Scotland
Sexual assault is included in the statistics only in • Hungary (police level) • Kosovo (UNR)
The following countries even include negligent bodily injury: • Bulgaria (conviction level) • Finland • Hungary • Kosovo (UNR) • Russia (police level) • Sweden • UK: Scotland E. Aggravated bodily injury (assault)
According to the standard definition, aggravated bodily injury means inflicting serious (e.g., life-threatening or disabling) bodily injury to another person with intent, or under aggravated circumstances (use of weapons, or on a vulnerable victim). Cases of aggravated bodily are counted under the total of bodily injury as well. Where possible, the figures include: • Serious and lasting (i.e., disabling) bodily injury • Life-threatening bodily injury • Use of weapons (dangerous objects) • Particularly vulnerable victim • Attempts
They exclude: • Assault leading to death • Mere threats • Sexual assault • Negligent bodily injury 5.1 Countries deviating from include rules:
All countries are able to include serious and lasting bodily injury and life-threatening bodily injury.
Use of weapons (dangerous objects) is excluded only in • Serbia • Switzerland • Turkey (conviction level) • Ukraine • UK: England & Wales (police level)

383
Particularly vulnerable victims are excluded in the statistics of: • Austria • Finland • Germany • Switzerland • Turkey (conviction level) • Ukraine • UK: England & Wales (police level)
Attempts are only excluded in: • Portugal (police level) • Slovenia • UK: Scotland 5.2 Countries deviating from exclude rules:
Assault leading to death is included in the data for the following countries: • Albania (conviction level) • Armenia • Belgium (police level) • Czech Republic (conviction level) • Georgia • Hungary • Iceland (police level) • Kosovo (UNR) (conviction level) • Netherlands (conviction level) • Portugal (conviction level) • Serbia • Switzerland • Ukraine
Threats are only included in Kosovo (UNR).
Sexual assault is included in: • Hungary (police level) • Kosovo (UNR) • Sweden (conviction level)
The following countries even include negligent bodily injury: • Hungary • Kosovo (UNR) (conviction level) • Portugal (police level) • Sweden (conviction level) F. Sexual assault
As already mentioned above, the definition of sexual assault has been revised for the 5th edition. It was changed to a general headline category covering all physical sexual contacts with persons against their will or with those who cannot validly consent, especially children. Rape and sexual abuse of a child are subcategories of this new definition of sexual assault. Data for sexual assault in the 5th edition will typically not be comparable with data provided for the 4th edition.
The new standard definition for sexual assault is sexual contact with a person against her/his will or with a person who cannot validly consent to sexual acts. Where possible, the figures include: • Any sexual acts committed with violence or threat of violence • Any sexual acts committed with abuse of authority or undue pressure • Any sexual acts committed against a helpless person

384
• Any sexual acts committed against a marital partner against her/his will • Acts considered as rape • Acts considered as physical sexual abuse of a child • Attempts
They exclude: • Any verbal or any other form of non-physical molestation • Pornography • Pimping • Buying / offering paid sex • Exhibitionism 6.1 Countries deviating from include rules:
All reporting countries include sexual acts committed with violence or threat of violence in their data.
Sexual acts committed with abuse of authority or undue pressure are mostly included, but excluded in: • Bulgaria (conviction level) • Hungary (conviction level)
Sexual acts committed against a helpless person are included in all countries.
Sexual acts committed against a marital partner against her/his will are only excluded in Hungary (conviction level).
Acts considered as rape are only excluded in • Georgia (police level) • Kosovo (UNR) (police level) • UK: England & Wales (conviction level)
Acts considered as physical sexual abuse of a child are included in all countries except for Kosovo (UNR), where such acts are excluded on police level.
Attempts are included in all countries. 6.2 Countries deviating from exclude rules:
Some countries actually report data based on a wider concept and thus include verbal or any other form of non-physical molestation: • Albania • Cyprus (conviction level) • France • Iceland (police level) • Kosovo (UNR) (conviction level) • Lithuania • Netherlands (police level) • Portugal
Pornography is only included in: • Hungary (conviction level) • Kosovo (UNR) • Serbia • Spain (police level)
The same countries include pimping: • Hungary • Kosovo (UNR) • Serbia • Spain (police level)

385
The list of countries which include buying / offering paid sex is almost identical: • Kosovo (UNR) • Serbia • Spain (police level)
Exhibitionism is also only included in countries which seem to follow a very wide concept of sexual assault: • Hungary • Kosovo (UNR) • Portugal • Serbia • Spain (police level) G. Rape
According to the standard definition, rape means sexual intercourse with a person against her/his will (per vaginam or other). Where possible, the figures include: • Penetration other than vaginal (e.g., buggery) • Violent intra-marital sexual intercourse • Sexual intercourse without force with a helpless person • Sexual intercourse with force with a child • Attempts
They exclude: • Sexual intercourse with a child without force • Other forms of sexual assault 7.1 Countries deviating from include rules:
Penetration other than vaginal is excluded from statistics on rape in: • Bulgaria • Russia • Switzerland • Ukraine
Violent intra-marital intercourse is excluded from rape statistics only in Russia.
Sexual intercourse without force with a helpless person is excluded in the following countries: • Netherlands • Slovenia • Switzerland
Sexual intercourse with force with a child is excluded in: • Slovakia (police level) • Slovenia
Just two countries exclude attempts: • Kosovo (UNR) (police level) • Portugal (police level) 7.2 Countries deviating from exclude rules:
Sexual intercourse with a child without force is included fairly often, which will typically be due to a rule of statutory rape: • Belgium (police level) • France • Georgia • Hungary • Ireland • Kosovo (UNR) • Lithuania

386
• Russia • Serbia • Sweden • UK: England & Wales (police level)
Other forms of sexual assault are included in the rape statistics of: • Hungary (police level) • Kosovo (UNR) • Poland • Serbia H. Sexual abuse of a child
According to the standard definition, sexual abuse of a child means sexual intercourse or any other form of physical sexual contact with a person below the age of consent. Where possible, the figures include: • Sexual intercourse or any other form of physical sexual contact committed without
violence • Acts committed by persons below the age of consent • Acts committed by persons above the age of consent • Attempts
They exclude: • Verbal or any other form of non-physical molestation • Child pornography • Acts considered as rape 8.1 Age of consent
Table 3 Age of consent for sexual abuse of a child by country40 14 15 16 17
Albania Czech Republic Armenia Cyprus Austria Denmark Belgium Ireland Croatia France Finland Estonia Greece Kosovo (UNR) Germany Iceland Lithuania Hungary Poland Netherlands Italy41 Slovakia Norway Portugal Sweden Switzerland Serbia Turkey UK: England & Wales Slovenia UK: Northern Ireland42 Ukraine UK: Scotland
Table 3 above shows the age of consent, i.e., the age under which a minor cannot validly consent to have sexual contacts for the responding countries.
8.2 Countries deviating from include rules:
All countries are able to include sexual intercourse or any other form of physical sexual contact committed without violence with a person below the age of consent in their data.
Acts committed by persons below the age of consent can not be included everywhere, especially in conviction statistics, probably because in many countries the age of consent is not 40 Malta did not provide an age of consent, although it provided data. 41 The age of consent in Italy is 13 if the partner is not more than three years older. 42 The age of consent was 17 until 1 February 2009.

387
higher than the age of criminal responsibility. Apart from that, in some countries sexual abuse additionally requires the author to be significantly older than the victim, i.e., not just above the age of consent (or even below that age). This is the case, for example, in France, Lithuania and Switzerland, and in the special constellation indicated in the footnote to Table 3 also in Italy.
Such acts are excluded in: • Armenia (conviction level) • Austria (conviction level) • Croatia (conviction level) • Czech Republic (conviction level) • Denmark (conviction level) • France (conviction level) • Germany • Hungary (police level) • Lithuania • Portugal (conviction level) • Serbia • Slovakia (police level) • Slovenia • Switzerland • Ukraine
Acts committed by persons above the age of consent, on the other hand, are included everywhere.
Attempts are only excluded in Portugal (police level).
8.3 Countries deviating from exclude rules:
Verbal or any other form of non-physical molestation of persons under the age of consent is included in the following countries: • Albania • Cyprus (conviction level) • Iceland (police level) • Kosovo (UNR) (conviction level) • Lithuania • Poland • Switzerland
Child pornography is included only in: • Hungary (police level) • Kosovo (UNR) (conviction level) • Switzerland
Acts considered as rape are included in: • Belgium (police level) • Hungary (police level) • Ireland • Kosovo (UNR) • Poland • Serbia • Switzerland • UK: England & Wales (conviction level)
I. Robbery
According to the standard definition, robbery means stealing from a person with force or threat of force. Where possible, the figures include: • Muggings (bag-snatchings)

388
• Theft immediately followed by force or threat of force used to keep hold of the stolen goods
• Attempts
They exclude: • Pick-pocketing • Extortion • Blackmailing 9.1 Countries deviating from include rules:
Countries excluding muggings are: • Italy • Lithuania • Poland
Only three countries exclude theft immediately followed by force or threat of force used to keep hold of the stolen goods: • Czech Republic • Kosovo (UNR) (police level) • UK: Scotland
Attempts are only excluded in Kosovo (UNR).
9.2 Countries deviating from exclude rules:
Pick-pocketing, extortion and blackmail are only included in: • Kosovo (UNR) • UK: England & Wales (conviction level)
J. Theft
According to the standard definition, theft means depriving a person or organisation of property with the intent to keep it. Where possible, the figures include: • Minor (e.g., small value) theft • Burglary • Theft of motor vehicles • Attempts
They exclude: • Embezzlement (including theft by employees) • Robbery • Receiving/handling stolen goods 10.1 Countries deviating from include rules:
Minor (e.g., small value) theft is excluded in: • Croatia (police level; threshold value: 130 €) • Cyprus (threshold value: 1000 €) • Estonia (only excluded for the first and second offence of an offender; threshold value: 64
€) • Hungary (police level; threshold value: 171 €) • Lithuania (police level; threshold value: 38 €) • Poland (threshold value: 60 €) • Russia (police level; threshold value: 25 €) • Serbia (threshold value: 130 €) • Slovakia (police level; threshold value: 266 €) • Switzerland (conviction level; no threshold provided) • Ukraine (threshold value: 10 € for 2011; 6 € for 2009 to 2010; no threshold provided for
2007 and 2008)

389
Only these countries exclude burglaries: • Armenia • Kosovo (UNR) (police level) • Malta (police level) • Serbia (conviction level)
Theft of motor vehicles is excluded in: • Hungary (police level) • Kosovo (UNR) (police level) • Malta (police level) • Ukraine
Apart from that, Estonia excludes joyriding with respect to the total of theft, while it is included in the subcategory theft of a motor vehicle.
Attempts are included everywhere.
10.2 Countries deviating from exclude rules:
Embezzlement (including theft by employees) is included in: • Cyprus • Kosovo (UNR) (conviction level) • Poland • UK: England & Wales
In France, embezzlement is excluded, but theft by employees is not considered embezzlement and is included.
Robbery is only included in the following countries: • Belgium (police level) • France (conviction level) • Kosovo (UNR)
These two countries include receiving / handling stolen goods: • Kosovo (UNR) (conviction level) • UK: England & Wales
K. Theft of a motor vehicle
According to the standard definition, theft of a motor vehicle means depriving a person or organisation of a motor vehicle with the intent to keep it or to use it. Where possible, the figures include: • Joyriding • Theft of trucks / lorries • Theft of motorcycles • Theft of motorboats • Attempts
They exclude: • Robbery • Receiving/handling a stolen vehicle 11.1 Countries deviating from include rules:
The following countries exclude joyriding: • Austria (police level) • Czech Republic (police level) • Greece • Netherlands (police level) • Russia (police level) • Slovenia (police level)

390
Theft of trucks / lorries and theft of motorcycles are only excluded in Poland on police level.
Theft of motorboats is excluded in these countries: • Austria (police level) • Belgium (police level) • Bulgaria • Czech Republic (police level) • Estonia (police level) • France (police level) • Germany (police level) • Netherlands (police level) • Poland (police level) • Portugal (police level) • Slovakia (police level) • UK: Northern Ireland (police level) • UK: Scotland
Attempts are excluded in: • Portugal (police level) • Turkey (police level) 11.2 Countries deviating from exclude rules:
Robbery is only included in the following countries: • Bulgaria • Hungary (police level) • Kosovo (UNR) (police level) • Spain (police level)
Kosovo (UNR) (police level) is also the only country to include receiving / handling a stolen vehicle.
L. Burglary
According to the standard definition, burglary means gaining access to a closed part of a building or other premises (e.g., by use of force against an object) with the objective to steal goods. Where possible, the figures include: • Domestic burglary • Theft from a factory, shop, office, etc. • Theft from a military establishment • Theft by using false keys • Attempts
They exclude: • Theft from a car • Theft from a container • Theft from a vending machine • Theft from a parking meter • Theft from a fenced meadow/compound 12.1 Countries deviating from include rules:
All countries are able to include domestic burglary and theft from a factory, shop, office, etc. in their data.
Only two countries exclude theft from a military establishment: • Slovenia • Turkey (police level)

391
Theft by using false keys is excluded in: • France (police level) • Scotland
Attempts are included everywhere.
12.2 Countries deviating from exclude rules:
Theft from a car is included in: • Austria • Croatia (conviction level) • Czech Republic (police level) • Finland (police level) • Germany (conviction level) • Greece (police level) • Hungary (police level) • Iceland (police level) • Netherlands (conviction level) • Poland • Slovenia
The following countries include theft from a container: • Austria • Croatia (conviction level) • Czech Republic (police level) • Finland (police level) • Greece (police level) • Hungary (police level) • Iceland (police level) • Netherlands (conviction level) • Poland • Slovakia (police level) • Slovenia
The group of countries including theft from a vending machine is almost identical: • Austria • Croatia (conviction level) • Czech Republic (police level) • Greece (police level) • Hungary (police level) • Iceland (police level) • Netherlands (conviction level) • Poland • Slovakia (police level) • Slovenia • Sweden (police level)
Again, almost the same group of countries includes theft from a parking meter: • Austria • Croatia (conviction level) • Czech Republic (police level) • Greece (police level) • Hungary (police level) • Netherlands (conviction level) • Poland • Slovakia (police level) • Slovenia • Sweden (police level)

392
Finally, theft from a fenced meadow / compound is included in the statistics of: • Croatia (conviction level) • Czech Republic (police level) • Greece (police level) • Hungary (police level) • Iceland (police level) • Netherlands (conviction level) • Poland • Sweden (police level)
M. Domestic burglary
According to the standard definition, domestic burglary means gaining access to closed private premises (e.g., by use of force against an object) with the objective to steal goods. Where possible, the figures include: • Theft from an attic or basement in a multi-dwelling building • Theft from a secondary residence (even if unoccupied) • Attempts
They exclude: • Theft from a factory, shop, office, etc. • Theft from a detached garage, shed, barn or stable • Theft from a fenced meadow/compound 13.1 Countries deviating from include rules:
Theft from an attic or basement in a multi-dwelling building is excluded in: • Estonia (police level) • Finland (police level) • France (police level) • Germany (conviction level) • Russia (police level)
Theft from a secondary residence (even if unoccupied) is only excluded in Slovakia (police level).
Attempts are included everywhere.
13.2 Countries deviating from exclude rules:
These countries include theft from a factory, shop, office, etc.: • Czech Republic (police level) • Hungary (police level) • Poland (police level) • Serbia (police level)
Theft from a detached shed, barn or stable is included for the following countries: • Czech Republic (police level) • Hungary (police level) • Iceland (police level) • Netherlands (police level) • Poland (police level) • Serbia (police level) • Turkey (police level)
Theft from a fenced meadow / compound is included in the statistics of: • Czech Republic (police level) • Hungary (police level) • Poland (police level) • Serbia (police level)

393
N. Fraud
According to the standard definition, fraud means deceiving someone or taking advantage of someone’s error with the intent to unlawfully gain financial benefits, thereby causing the deceived person to enter any operation that will be damaging to his or a third person’s financial interests. Where possible, the figures include: • Attempts
They exclude: • Receiving / handling stolen property • Forgery of documents, passports etc. • Tax and customs offences • Subsidy fraud • Fraud involving welfare payments • Money laundering • Forgery of money / payment instruments • Consuming goods or services • Breaching of trust / embezzlement 14.1 Countries deviating from include rules:
Attempts are only excluded in UK: Scotland.
14.2 Countries deviating from exclude rules:
Kosovo (UNR) is the only country to include receiving / handling stolen goods.
Forgery of documents, passports etc. is included in: • Ireland • Kosovo (UNR) • UK: England & Wales (conviction level) • UK: Northern Ireland (police level)
The following countries include tax and customs offences: • Ireland • Kosovo (UNR) • UK: Northern Ireland • UK: Scotland
A considerably large number of countries include subsidy fraud: • Armenia • Croatia • Cyprus • France • Greece • Iceland (police level) • Ireland • Italy • Kosovo (UNR) • Poland • Switzerland (police level) • Ukraine • UK: England & Wales • UK: Northern Ireland • UK: Scotland
Even more countries include fraud involving welfare payments: • Armenia • Croatia • Cyprus

394
• France • Germany (conviction level) • Greece • Iceland (police level) • Ireland • Italy • Kosovo (UNR) • Lithuania • Slovenia • Switzerland (police level) • Turkey • Ukraine • UK: England & Wales • UK: Northern Ireland (conviction level) • UK: Scotland
Money laundering is only included in: • Ireland • Kosovo (UNR)
Forgery of money / payment instruments is included in the statistics of: • Ireland • Kosovo (UNR) • Switzerland (police level) • UK: England & Wales (conviction level) • UK: Northern Ireland (police level)
The following countries follow a rather broad concept of deception, thus including consumption of goods and services in their fraud data: • Austria • Czech Republic • France (police level) • Germany • Iceland (police level) • Ireland • Italy • Kosovo (UNR) • Poland • Slovenia • Spain (police level) • Turkey • UK: Scotland
Breaching of trust / embezzlement is included in: • Cyprus (conviction level) • France (police level) • Georgia (police level) • Ireland • Italy • Kosovo (UNR) • Lithuania • Poland • Spain (police level) • Switzerland (police level)

395
O. Money laundering
According to the standard definition, money laundering means specific financial transactions to conceal the identity, source, and/or destination of money or non-monetary property deriving from criminal activities. Where possible, the figures include: • Receiving and handling illegally obtained (but not stolen) non-monetary property • Attempts
They exclude: • Receiving / handling stolen property • Violations of the ‘know-your-customer’ rule (i.e., negligence in identification of customer’s identity or origin of funds) 15.1 Countries deviating from include rules:
Receiving and handling illegally obtained (but not stolen) non-monetary property is only excluded in: • Hungary (police level) • Switzerland
Only two countries exclude attempts: • Cyprus (police level) • UK: Scotland 15.2 Countries deviating from exclude rules:
Receiving / handling stolen property is included in: • Cyprus (police level) • Kosovo (UNR)
Three countries include violations of the ‘know-your-customer’ rule: • Cyprus (police level) • Hungary • Kosovo (UNR)
P. Corruption in the public sector
According to the standard definition, corruption means offering or accepting financial or any other advantage in exchange of favourable treatment by public officials. Where possible, the figures include: • Active and passive corruption • Instigation to corruption • Complicity • Corruption of domestic officials • Corruption of foreign officials • Extortion by public officials • Offering officials advantages without immediate interest (i.e.: in order to get them hooked on receiving gifts) • Attempts
They exclude: • Corruption in the private sector • Extortion (except by public officials) • Bribery of the electorate 16.1 Countries deviating from include rules:
All countries include both active and passive corruption in their data.
Instigation to corruption is excluded in: • Greece (conviction level)

396
• Hungary (police level) • Portugal • UK: Northern Ireland (conviction level)
These countries exclude complicity: • Greece (conviction level) • Portugal • Slovenia • UK: Northern Ireland (conviction level)
Corruption of domestic officials is included everywhere.
Almost all countries are also able to include corruption of foreign officials. This kind of behavior is only excluded in: • Greece • Portugal • Russia (police level) • Ukraine • UK: Northern Ireland (conviction level)
Extortion by public officials is excluded in the following countries: • Austria • Bulgaria • Czech Republic • Denmark • Finland • France (conviction level) • Greece (conviction level) • Hungary • Slovakia (police level) • Slovenia • Sweden • Turkey • Ukraine • UK: Northern Ireland (conviction level)
Offering officials advantages without immediate interest is excluded in: • Bulgaria • Greece • Serbia • Turkey • UK: Northern Ireland (conviction level)
Attempts are excluded only in UK: Northern Ireland.
16.2 Countries deviating from exclude rules:
Corruption data for the following countries include corruption in the private sector: • Albania (police level) • Estonia • Georgia (police level) • Hungary (conviction level) • Kosovo (UNR) • Lithuania • Russia (police level) • Serbia • Slovakia (police level) • Spain (police level) • Sweden

397
Extortion (except by public officials) is included in: • Albania (police level) • Iceland (police level) • Kosovo (UNR) • Russia (police level)
Bribery of the electorate is included in the statistics for: • Albania (police level) • Iceland (police level) • Kosovo (UNR) • Russia (police level) • Turkey
Q Drug offences
According to the standard definition, drug offences mean all illicit intentional acts in connection with narcotic drugs and psychotropic substances as defined in the international drug control conventions.43 Where possible, the figures include: • Cultivation • Production and manufacture • Extraction and preparation • Offering and offering for sale • Distribution • Purchase • Sale • Delivery on any terms whatsoever • Brokerage • Dispatch and dispatch in transit • Transport • Importation • Exportation • Financing of drug operations • Possession not in connection with personal use • Possession for personal use (i.e.: possession of small quantities) • Consumption • Attempts
They exclude: • Offences with respect to precursor substances 17.1 Countries deviating from include rules:
All countries are able to include cultivation, production and manufacture, extraction and preparation, offering and offering for sale, distribution, purchase, sale and delivery on any terms whatsoever in their data.
Brokerage is excluded for: • Hungary (police level) • UK: Scotland
Dispatch, dispatch in transit and transport are again included for all countries.
Importation and exportation are only excluded in Bulgaria (conviction level).
Few countries exclude the financing of drug operations: • Belgium (police level) • Czech Republic 43 Single Convention on Narcotic Drugs, 1961, as amended by the 1972 protocol, Convention on Psychotropic Substances, 1971, and Convention against Illicit Traffic in Narcotic Drugs and Psychotropic Substances, 1988.

398
• Iceland (police level) • Russia (police level) • Ukraine
Possession not in connection with personal use is another category that is included for all countries.
Possession for personal use / possession of small quantities is excluded in: • Armenia • Czech Republic • Estonia (conviction level) • Germany (conviction level) • Netherlands • Portugal • Russia (police level) • Slovenia • Switzerland (conviction level) Table 4 Upper limits for possession for personal use Cannabis Heroin Cocaine Ecstasy Amphetamines
Armenia 0.5g 0.005g 0.001g 0.05g 0.01g Czech Republic 15g 1.5g 1g 4 tablets or 0.4g 2g Estonia prosecutorial
discretion prosecutorial discretion
prosecutorial discretion
prosecutorial discretion
prosecutorial discretion
Germany at least 6g (in some Federal States, the limit is higher)
prosecutorial discretion
prosecutorial discretion
prosecutorial discretion
prosecutorial discretion
Netherlands 5g - - - - Portugal personal use
not restricted by the quantity
personal use not restricted by the quantity
personal use not restricted by the quantity
personal use not restricted by the quantity
personal use not restricted by the quantity
Russia 6g 0.5g 0.5 g 0.3 g 0.2 g Slovenia police discretion police discretion police discretion police discretion police discretion Switzerland no information
provided no information provided
no information provided
no information provided
no information provided
Table 4 shows the upper limits of the “small quantity” for the countries that stated that possession for personal use is excluded. Typically, possession for personal use is pragmatically defined via a maximum quantity that may be possessed. However, as the example of Portugal shows, this is not necessarily always the case. In Estonia and Slovenia, no clear limits for the small quantities exist. The classification of an offence as possession of small quantities is based on prosecutorial or police discretion. The same is true for small quantities of heroin, cocaine, ecstasy and amphetamines in Germany. For cannabis, on the other hand, a more definite limit has been fixed in Germany. This limit is, however, only set down in prosecutorial guidelines that differ between Federal States. The Netherlands also have a fixed upper limit for the small quantity of cannabis. Others have such a limit for all common drugs (Armenia, Czech Republic, Russia). The amounts that make up a “small” quantity differ significantly between countries, e.g., for heroin between 0.005 g (Armenia) and 1.5g (Czech Republic), for cannabis between 0.5 g and 15 g (for the same countries).
The following countries exclude consumption from their data: • Armenia (since 2008) • Czech Republic • Denmark

399
• Estonia (conviction level) • Germany • Lithuania • Portugal • Russia (police level) • Serbia • Slovenia • Ukraine • UK: Scotland
In many of these countries, consumption will not constitute an offence at all.
Attempts are only excluded in • Denmark • UK: Scotland 17.2 Countries deviating from exclude rules:
The following countries include offences with respect to precursor substances: • Armenia • Austria • Belgium (police level) • Bulgaria • Cyprus • Denmark • France • Georgia • Greece • Hungary (conviction level) • Iceland (police level) • Kosovo (UNR) • Poland • Portugal • Russia (police level) • Slovakia (police level) • Ukraine
R. Drug trafficking
According to the standard definition, drug trafficking means drug offences which are not in connection with personal use. Where possible, the figures include: • Cultivation • Production and manufacture • Extraction and preparation • Offering and offering for sale • Distribution • Purchase • Sale • Delivery on any terms whatsoever • Brokerage • Dispatch and dispatch in transit • Transport • Importation • Exportation • Financing of drug operations • Possession • Attempts

400
They exclude: • Offences with respect to precursor substances • Possession for personal use (i.e.: possession of small quantities) • Consumption 18.1 Countries deviating from include rules:
Only Kosovo (UNR) excludes cultivation, production, manufacture, extraction and preparation.
All countries include offering, offering for sale and distribution.
Purchase is excluded in France (police level).
Sale is included in all countries.
Delivery on any terms whatsoever is excluded by Poland.
Brokerage, dispatch and dispatch in transit, transport, importation and exportation are also included in all countries.
Financing of drug operations is excluded in: • Belgium (police level) • Czech Republic
The following countries exclude possession: • Belgium (police level) • Poland • UK: England & Wales (police level)
Attempts are only excluded in UK: Scotland.
18.2 Countries deviating from exclude rules:
Offences with respect to precursor substances are included in: • Albania (police level) • Armenia • Belgium (police level) • Cyprus (police level) • Czech Republic • Greece (conviction level) • Kosovo (UNR) • Poland • Portugal (police level) • Slovakia (police level) • Ukraine
The following countries include possession for personal use / possession of small quantities in drug trafficking data, which makes it dubious for these countries whether the data reported actually refer to trafficking: • Albania (police level) • Cyprus (police level) • Greece (conviction level) • Iceland (police level) • Kosovo (UNR)
Finally, there are even countries which state to include consumption: • Cyprus (police level) • Greece (conviction level) • Iceland (police level) • Kosovo (UNR)

401
S. Firearm involved
According to the standard definition, “firearm involved” means that a firearm has been involved in committing the crime, regardless of whether it has been shot, used as a blunt weapon or threat, or just been carried or in any other way been ready to hand. This definition is used as a subcategory for homicide (completed and total) and robbery. Data were collected on police level only. Where possible, the figures include: • Firearm shot • Firearm used as a blunt weapon • Firearm used as a threat • Firearm carried • Firearm ready to hand, even if not carried (e.g.: lying readily available on a table directly at the crime scene)
They exclude: • Offences involving weapons not considered as firearms • Offences involving other dangerous object
There is a separate standard definition used for the firearm itself, which is defined as a weapon that launches a bullet or other projectile (or several at a time), making use of an explosive charge as a propellant, and that can be carried and used by a single person. Where possible, figures on the involvement of firearm include: • Pistols, revolvers • Rifles, shotguns • Sub-machine guns, light and medium machine guns • Improvised and special firearms (e.g., pen guns) • Unloaded firearms carried with ammunition at hand • Legally owned firearms
They exclude: • Heavy machine guns • Hand grenades, Molotov cocktails • Air guns, gas pistols, paintball rifles • Crossbows, bows and arrows • Replica firearms and other fakes • Unloaded firearms carried without ammunition at hand 19.1 Deviations from the firearm definition Countries deviating from include rules:
Pistols, revolvers, rifles, shotguns, sub-machine guns, light and medium machine guns, improvised and special firearms (e.g., pen guns), unloaded firearms carried with ammunition at hand and legally owned firearms are included in all countries.
Countries deviating from exclude rules:
Heavy machine guns are – at least theoretically – included in: • Austria • Croatia • Cyprus • Georgia • Hungary • Ireland • Poland • Slovakia • UK: Northern Ireland

402
Only two countries include hand grenades: • Hungary • UK: Northern Ireland
Air guns, gas pistols and/or paintball rifles are included in: • Croatia • Cyprus • Germany (for robbery offences only)44 • Ireland • Slovakia • UK: Northern Ireland
Crossbows, bows and arrows are – probably only theoretically – included in Slovakia.
The following countries include replica firearms and other fakes: • Croatia • Germany (for robbery offences only)45 • Slovakia • UK: Northern Ireland
Unloaded firearms carried without ammunition at hand are included in: • Austria • Croatia • Cyprus • Georgia • Germany (for robbery offences only)46 • Hungary • Ireland • Lithuania • Poland • Slovakia • UK: Northern Ireland 19.2 Deviations from the definition of involvement Countries deviating from include rules:
Firearm shot is included everywhere.
Firearm used as a blunt weapon and firearm used as a threat are excluded in: • Bulgaria • Germany (for homicide offences only)47 • Ireland
The following countries exclude firearm carried: • Bulgaria • Germany (for offences only)48 • Ireland • Lithuania • Poland
44 This means: Excluded for homicide offences and homicide and robbery suspects. 45 This means: Excluded for homicide offences and homicide and robbery suspects. 46 This means: Excluded for homicide offences and homicide and robbery suspects. 47 This means: Included for robbery offences and homicide and robbery suspects. 48 This means: Included for homicide and robbery suspects.

403
Firearm ready to hand, even if not carried, is excluded from the statistics of: • Austria • Bulgaria • Germany (for offences only)49 • Ireland • Poland Countries deviating from exclude rules:
All countries exclude offences involving weapons not considered as firearms.
Offences involving other dangerous objects are included in France.
B) Young offenders and state reactions to their offending
The following definitions refer to young offenders and the reactions of the state to offences committed by them. Young offenders are minors (persons who have not yet reached the age of adulthood) on the one hand and young adults on the other. The definitions assembled here have an impact on the recording of data on minors and young adults in all sections of this book. In addition, chapters 1 to 4 also feature specific information on minors. This information refers to the inclusion of minors in the reported data and on the relevant age brackets applied. The special metadata provided there should always be read against the backdrop of the overarching results presented here.
T. Age of criminal responsibility
Table 5 shows the age of criminal responsibility for minors in the different countries. While there are some countries which apply an early age of criminal responsibility of eight to ten years (Malta, Switzerland, UK: England & Wales, UK: Northern Ireland and UK: Scotland) and there are also a few countries which use a late age of criminal responsibility (16 in Portugal and, albeit with important exceptions, in Lithuania and Ukraine), in the vast majority of countries minors reach criminal responsibility at the age of 14.
49 This means: Included for homicide and robbery suspects.

404
Table 5 Age of criminal responsibility 8 9 10 11 12 13 14 15 16
UK: Scotland Malta Switzerland – Netherlands France Albania Czech Republic Lithuania50
UK: England & Wales
Greece Armenia Denmark51 Portugal
UK: Northern Ireland
Poland Austria Finland Ukraine52
Bulgaria Sweden
Croatia Turkey53
Cyprus
Estonia
Georgia
Germany
Hungary
Italy
Latvia
Russia54
Serbia
Slovakia
Slovenia
Spain
U. Age of adulthood in penal law
In almost all countries, persons are no longer considered as minors, but as adults when they reach the age of 18. The penal law in some countries, however, uses a lower age: • Cyprus: 16 • Poland: 17 • UK: Scotland: 16.
V. Treatment of young adults
In some countries, it is possible to apply juvenile criminal law to persons who have already reached adulthood before they committed their offences. Where this possibility is available, it is always restricted to young adults. Typically, the conditions for young adults are not identical to those for minors. One common possibility for this group of offenders is that juvenile criminal law competes with adult criminal law and the court has to decide which law to apply depending on the special characteristics of the offence and the offender. Another possibility is that the criminal law applied for young adults is a kind of intermediate criminal law that is milder than the criminal law for older adults, but also differs from the criminal law applicable for minors.
In the following countries, such specific rules for the treatment of young adults exist. The maximum age below which these rules can be applied is indicated: • Albania: 21 (only specific rules regarding probation service and prison) • Austria: 21 • Croatia: 23 • Finland: 21
50 14 for specific offences, including murder, aggravated bodily injury, rape, sexual assault, robbery and theft. 51 14 between about June 2010 and February 2012. 52 14 for specific offences, including murder, bodily injury of at least medium severity, rape, robbery and theft. 53 Children aged 12 to 14 may be determined to have criminal responsibility, based on their level of cognitive development. 54 The age of full criminal liability depends on the type of the offense and can be 14, 16 or 18 years.

405
• Germany: 21 • Greece: 21 • Lithuania: 21 • Netherlands: 21 • Poland: 1855 • Portugal: 22 • Serbia: 21 • Slovakia: 19
W. State reactions to criminal acts of minors
The results presented so far give only a rough idea about how criminal acts of minors are treated in different countries. The age of criminal responsibility alone does not give any information about the type of proceedings in which minors above that age are tried and whether such proceedings can also result in imprisonment.
It does not even give clear information about the possible reactions to criminal acts of minors below the age or, more precisely, to acts that would have been considered criminal if they had been committed by a person held criminally responsible. Such criminal acts of children can obviously have different consequences, among them reactions by family courts or youth welfare courts. Such reactions might be aiming at the parents only, but with increasing age the child himself or herself will come more and more into focus. Hence, such courts will often be able to impose certain educational measures to prevent further offending by persons below the age of responsibility. If such measures can even be imposed against the will of the parents and of the child, the difference to actual juvenile criminal sanctions or measures may be small, given that such sanctions and measures are also often educational in nature.
Table 6 shows the available state reactions to criminal acts of minors. Some countries did not enter any information on the state reactions available for criminal acts of minors below the age of criminal responsibility. In some cases this might mean that there are no reactions available that aim directly at the child (instead of aiming at the parents), or that there are no specific family court or youth welfare proceedings. More important will be that such proceedings will not necessarily be a direct reaction to the criminal act, but will often treat it just as a symptom of something else, especially of an endangerment of the child's welfare.
On the other hand, some countries even entered data into the line on juvenile criminal proceedings for age groups below the age of responsibility. This is, however, also possible. It means that courts specialized in juvenile offences are already in charge before criminal responsibility sets in. Greece, for example, states that minors between the ages of 8 and 15 (age of responsibility: 13) who violate penal laws are tried by the Juvenile Court, which then imposes educational or therapeutic measures.
Finally, as criminal responsibility is first of all a formal criterion, it does not even rule out that persons above that age are tried in family court or youth welfare proceedings, as the example of UK: Scotland clearly shows, where the age of responsibility is lowest of all countries (8 years), but it is not until the age of 16 that young offenders are tried in criminal proceedings.
Altogether, Table 6 shows that state reactions with increasing age move from family court and youth welfare proceedings to juvenile and general criminal proceedings. The reactions will also become more severe along the way. Juvenile imprisonment is typically not available before the age of 14.
55 Note that the age of adulthood in criminal law for Poland is 17.

406
Table 6 Available state reactions to criminal acts of minors56 Procedure type
Age
8 9 10 11 12 13 14 15 16 17
Youth welfare or family court proceedings (i.e., outside criminal justice)
AT,
BG,
DE57,
DK,
EE,
ES,
FI,
HU,
IS, IT,
LT,
PL,
PT,
SE,
SK,
SL,
UK:
Scot
AT,
BG,
DE22,
DK,
EE,
ES,
FI,
HU,
IS, IT,
LT,
PL,
PT,
SE,
SK,
SL,
UK:
Scot
AT,
BG,
DE22,
DK,
EE,
ES,
FI,
HU,
IS, IT,
LT,
PL,
PT,
SE,
SK,
SL,
UK:
Scot
AM,
AT,
BG,
DE22,
DK,
EE,
ES, FI,
HU,
IS, IT,
LT,
PL,
PT,
SE,
SK,
SL,
UA58,
UK:
Scot
AM,
AT,
BG,
DE22,
DK,
EE,
ES, FI,
HU,
IS, IT,
LT,
PL,
PT,
SE,
SK,
SL,
UA23,
UK:
Scot
AM,
AT,
BG,
DE22,
DK,
EE,
ES, FI,
HU,
IS, IT,
LT,
PT,
SE,
SK,
SL,
UA23,
UK:
Scot
DK,
EE, FI,
IS,
LT59,
PT, SE,
SK60,
UK:
Scot
EE, FI,
LT24,
PT, SE,
SK25,
UK:
Scot
EE, FI, SE,
SK25
EE, FI,
SE,
SK25
Juvenile criminal proceedings
BE,
CZ,
GR,
TR
BE,
CZ,
GR,
MT,
TR
BE,
CZ,
GR,
MT,
TR,
UK: NI
BE,
CZ,
GR,
MT,
TR,
UK: NI
BE,
CZ,
GR,
MT,
NL61,
PL,
TR,
UK: NI
BE,
CZ,
GR,
MT,
NL26,
PL,
TR,
UK: NI
AL,
AM,
AT, BE,
BG,
CZ,
DE,
ES,
GR,
HR,
HU, IT,
LT23,
MT,
NL26,
PL, RS,
SL, TR,
UK: NI
AL, AM,
AT, BE,
BG, CZ,
DE, ES,
FI, GR,
HR,
HU, IS,
IT, LT23,
MT,
NL26,
PL, RS,
SL, TR,
UK: NI
AL, AM,
AT, BE,
BG, CZ,
DE, ES, FI,
GR, HR,
HU, IS, IT,
LT, NL26,
PL, PT,
RS, SL,
TR, UK: NI,
UK: Scot
AL, AM,
AT, BE,
BG, CZ,
DE, ES,
FI, GR,
HR, HU,
IS, IT,
LT,
NL26,
PT, RS,
SL, TR,
UK: NI,
UK:
Scot
General criminal proceedings
MT MT,
UK: NI
MT,
UK: NI
MT,
UK: NI
MT,
UK: NI
AL23,
CY,
EE,
GE26,
LV, MT,
AL23,
CY, DK,
EE, FI,
GE26,
LV, MT,
AL23,
BE62,CY,
DK, EE, FI,
GE26, LV,
MT, NL26,
AL23,
BE27,
CY, DK,
EE, FI,
GE26,
56 Country codes according to ISO-3166-1 Alpha-2; NI = Northern Ireland; Scot = Scotland. 57 Only serious or repeated offences will have consequences, but not necessarily. Probability of consequences will increase with the age. 58 Serious offences only. 59 Not for serious offences. 60 Minor offences only. 61 Not for minor offences. 62 Traffic offences and exceptional cases of serious offences.

407
RU23,
SL,
UA23,
UK: NI
PL23,
RU23,
SL,
UA23,
UK: NI
PL23, PT,
RU26, SL,
UA23, UK:
NI, UK:
Scot
LV, MT,
NL26,
PL, PT,
RU26,
SL,
UA23,
UK: NI,
UK:
Scot
Juvenile or general criminal proceedings in which a custodial sanction or measure can be imposed
MT MT,
UK: NI
MT,
UK: NI
CZ23,
NL26,
MT,
TR,
UK: NI
CZ23,
GR23,
IT,
NL26,
MT,
PL,
TR,
UK: NI
AL,
AM,
AT,
BG,
CZ23,
DE,
EE, ES,
GE26,
GR23,
HR,
HU, IT,
LT23,
MT,
NL26,
PL,
RU23,
SK26,
SL, TR,
UA23,
UK: NI
AL, AM,
AT, BG,
CY, CZ,
DE, DK,
EE, ES,
FI26,
GE26,
GR23,
HR,
HU, IT,
LT23,
MT,
NL26,
PL,
RU23,
SK26,
SL, TR,
UA23,
UK: NI
AL, AM,
AT, BG,
CY, CZ,
DE, DK,
EE, ES,
FI26, GE26,
GR23, HR,
HU, IT,
LT26, MT,
NL26, PL,
PT, RU26,
SK26, SL,
TR, UA23,
UK: NI, UK:
Scot
AL, AM,
AT, BG,
CY, CZ,
DE, DK,
EE, ES,
FI26,
GE26,
GR23,
HR, HU,
IT, LT26,
MT,
NL26,
PL, PT,
RU26,
SK26,
SL, TR,
UA23,
UK: NI,
UK:
Scot

408

409
Appendix II: Population Population by country from 2006 to 2011 (in thousands)
2006 2007 2008 2009 2010 2011 Albania 3149 3153 3170 3185 3008 2832 Armenia 3219 3223 3230 3238 3249 3263 Austria 8254 8283 8319 8355 8375 8404 Azerbaijan 8436 8533 8630 8897 8998 9111 Belgium 10511 10585 10667 10753 10840 11001 Bosnia-Herzegovina 3843 3844 3844 3844 3844 3843 Bulgaria 7719 7679 7640 7607 7564 7369 Croatia 4443 4441 4436 4435 4426 4412 Cyprus 766 779 789 797 819 840 Czech Republic 10251 10287 10381 10468 10507 10487 Denmark 5427 5447 5476 5511 5535 5561 Estonia 1345 1342 1341 1340 1340 1340 Finland 5256 5277 5300 5326 5351 5375 France 63230 63645 64007 64350 64659 64995 Georgia 4401 4395 4382 4385 4436 4469 Germany 82438 82315 82218 82002 81802 81752 Greece 11125 11172 11214 11260 11305 11310 Hungary 10077 10066 10045 10031 10014 9986 Iceland 300 308 315 319 318 318 Ireland 4208 4313 4401 4450 4468 4571 Italy 58752 59131 59619 60045 60340 60626 Kosovo (UNR) 2100 2127 2153 2181 2208 1794 Latvia 2295 2281 2271 2261 2248 2075 Lithuania 3403 3385 3366 3350 3329 3053 Luxembourg 469 476 484 494 502 512 Malta 405 408 410 414 414 416 Moldova 3590 3581 3573 3568 3564 3560 Montenegro 624 625 628 630 616 620 Netherlands 16334 16358 16405 16486 16575 16656 Norway 4640 4681 4737 4799 4858 4920 Poland 38157 38125 38116 38136 38167 38530 Portugal 10570 10599 10618 10627 10638 10572 Romania 21610 21565 21529 21499 21462 21414 Russia 142754 142221 142009 141904 141915 142857 Serbia 7425 7398 7366 7335 7307 7276 Slovakia 5389 5394 5401 5412 5425 5392 Slovenia 2003 2010 2010 2032 2047 2050 Spain 43758 44475 45283 45828 45989 46153 Sweden 9048 9113 9183 9256 9341 9416 Switzerland 7459 7509 7593 7702 7786 7870 TFYR of Macedonia 2039 2042 2045 2049 2053 2057 Turkey 72520 69689 70586 71517 72561 73723 Ukraine 46749 46466 46192 45963 45783 45598 UK: England and Wales* 53729 54072 54440 54809 55241 56171
UK: Northern Ireland* 1742 1759 1775 1789 1799 1807 UK: Scotland* 5117 5144 5169 5194 5222 5255
Source: Eurostat Database, retrieved on 15 April 2013. *Source: Council of Europe Annual Penal Statistics (with references).

410