European Reanalysis and Observations for Monitoring EMS/ECAM, Berlin, Germany, 14 September 2011...
33
European Reanalysis and Observations for Monitoring EMS/ECAM, Berlin, Germany, 14 September 2011 • EURO4M: European Reanalysis and Observations for Monitoring • €4M contribution from European Commission • Project of EU-FP7-SPACE, April 2010 – March 2014, 9 partners
-
Upload
lesley-gibson -
Category
Documents
-
view
217 -
download
0
Transcript of European Reanalysis and Observations for Monitoring EMS/ECAM, Berlin, Germany, 14 September 2011...

European Reanalysis and Observations for MonitoringEMS/ECAM, Berlin, Germany, 14 September 2011
• EURO4M: European Reanalysis and Observations for Monitoring
• €4M contribution from European Commission
• Project of EU-FP7-SPACE, April 2010 – March 2014, 9 partners

European Reanalysis and Observations for MonitoringEMS/ECAM, Berlin, Germany, 14 September 2011
• EURO4M: European Reanalysis and Observations for Monitoring
• €4M contribution from European Commission
• Project of EU-FP7-SPACE, April 2010 – March 2014, 9 partners
(KNMI, Met Office, URV, NMA, Meteo Swiss, DWD, SMHI, UEA/CRU, Météo France)

European Reanalysis and Observations for MonitoringEMS/ECAM, Berlin, Germany, 14 September 2011
• Goal: meeting the need for climate monitoring information

European Reanalysis and Observations for MonitoringEMS/ECAM, Berlin, Germany, 14 September 2011
• Goal: meeting the need for climate monitoring information
• Need: according to user-consultations byJRC/EEA, EUMETNET, WMO-GFCS,and our own Climate Liaison Team
LONG-TERM CLIMATE DATA + ASSESSMENTS

European Reanalysis and Observations for MonitoringEMS/ECAM, Berlin, Germany, 14 September 2011
• Goal: meeting the need for climate monitoring information
• Need: according to user-consultations byJRC/EEA, EUMETNET, WMO-GFCS,and our own Climate Liaison Team
LONG-TERM CLIMATE DATA + ASSESSMENTS
…describing climate variability and change at European scale
…placing high-impact extreme events in a historical context

European Reanalysis and Observations for MonitoringEMS/ECAM, Berlin, Germany, 14 September 2011
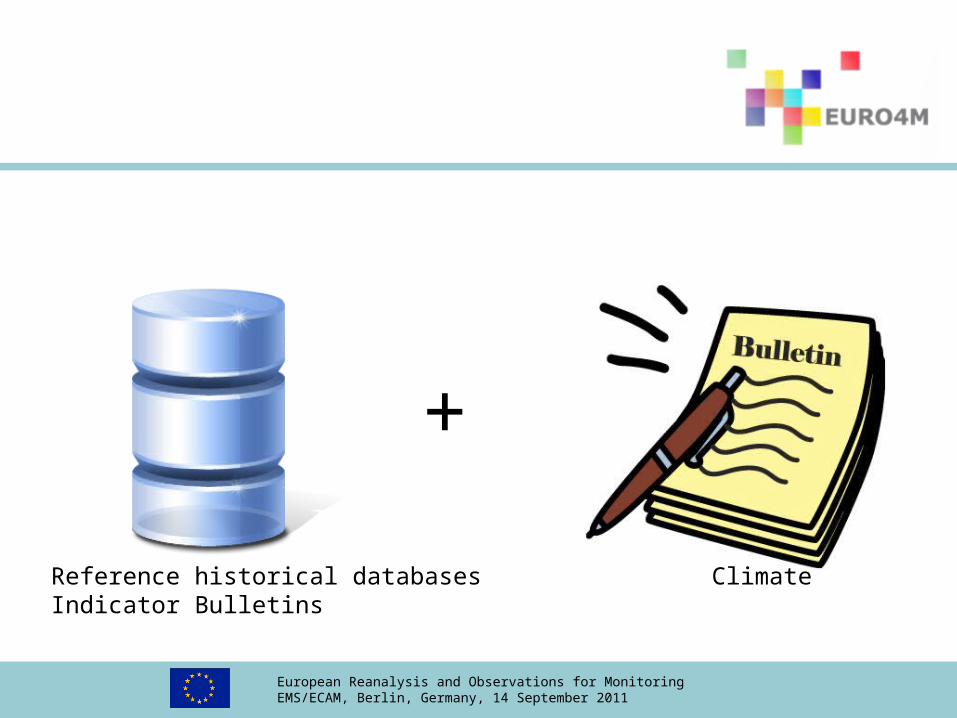
• EURO4M develops two core services (which are closely linked):
+
Reference historical databases Climate Indicator Bulletins
European Reanalysis and Observations for MonitoringEMS/ECAM, Berlin, Germany, 14 September 2011
• EURO4M develops two core services (which are closely linked):
+
Reference historical databases Climate Indicator Bulletins

European Reanalysis and Observations for MonitoringEMS/ECAM, Berlin, Germany, 14 September 2011
EURO4M
European Reanalysis and Observations for MonitoringEMS/ECAM, Berlin, Germany, 14 September 2011
EURO4M
ESA-CCI

European Reanalysis and Observations for MonitoringEMS/ECAM, Berlin, Germany, 14 September 2011
EURO4M
ESA-CCI
MACC

European Reanalysis and Observations for MonitoringEMS/ECAM, Berlin, Germany, 14 September 2011
1) satellite data (CM-SAF)
2) in-situ observations (ECA&D, HadCRU, GPCC)
3) regional reanalysis of past weather (new!)
Reference historical databases

European Reanalysis and Observations for MonitoringEMS/ECAM, Berlin, Germany, 14 September 2011
?
?

European Reanalysis and Observations for MonitoringEMS/ECAM, Berlin, Germany, 14 September 2011

European Reanalysis and Observations for MonitoringEMS/ECAM, Berlin, Germany, 14 September 2011
GPCC and CM-SAF (DWD)

European Reanalysis and Observations for MonitoringEMS/ECAM, Berlin, Germany, 14 September 2011
ECA&D/E-OBS (KNMI)
Example of E-OBS map for 31st of last month
European Reanalysis and Observations for MonitoringEMS/ECAM, Berlin, Germany, 14 September 2011
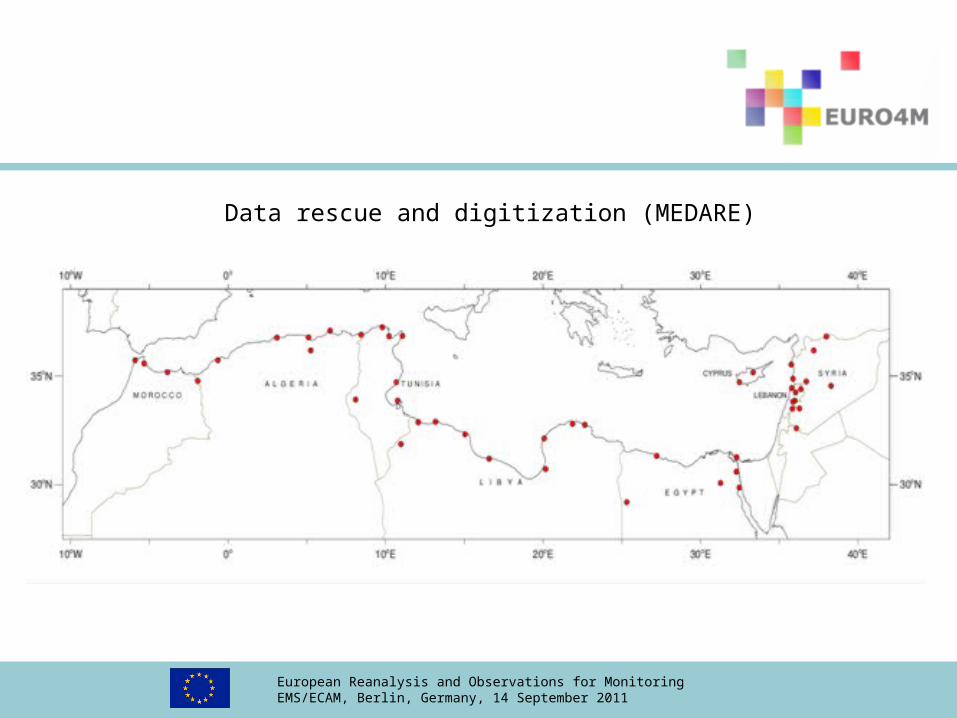
Data rescue and digitization (MEDARE)

European Reanalysis and Observations for MonitoringEMS/ECAM, Berlin, Germany, 14 September 2011
ECMWF-ERA Interim (80 km) HIRLAM (20 km) MESAN (5 km)
2m Temperature 2m Temperature 2m Temperature
Source: SMHI & Météo France

European Reanalysis and Observations for MonitoringEMS/ECAM, Berlin, Germany, 14 September 2011
1) satellite data (CM-SAF)
2) in-situ observations (ECA&D, HadCRU, GPCC)
3) regional reanalysis of past weather (new!)
Reference historical databases

European Reanalysis and Observations for MonitoringEMS/ECAM, Berlin, Germany, 14 September 2011
1) satellite data (CM-SAF)
spatially extensive but short
2) in-situ observations (ECA&D, HadCRU, GPCC)
long-term records but sparse
3) regional reanalysis of past weather (new!)
complete but expensive and some bias
Reference historical databases
European Reanalysis and Observations for MonitoringEMS/ECAM, Berlin, Germany, 14 September 2011
+
Reference historical databases Climate Indicator Bulletins

European Reanalysis and Observations for MonitoringEMS/ECAM, Berlin, Germany, 14 September 2011
+
Reference historical databases Climate Indicator Bulletins
European Reanalysis and Observations for MonitoringEMS/ECAM, Berlin, Germany, 14 September 2011
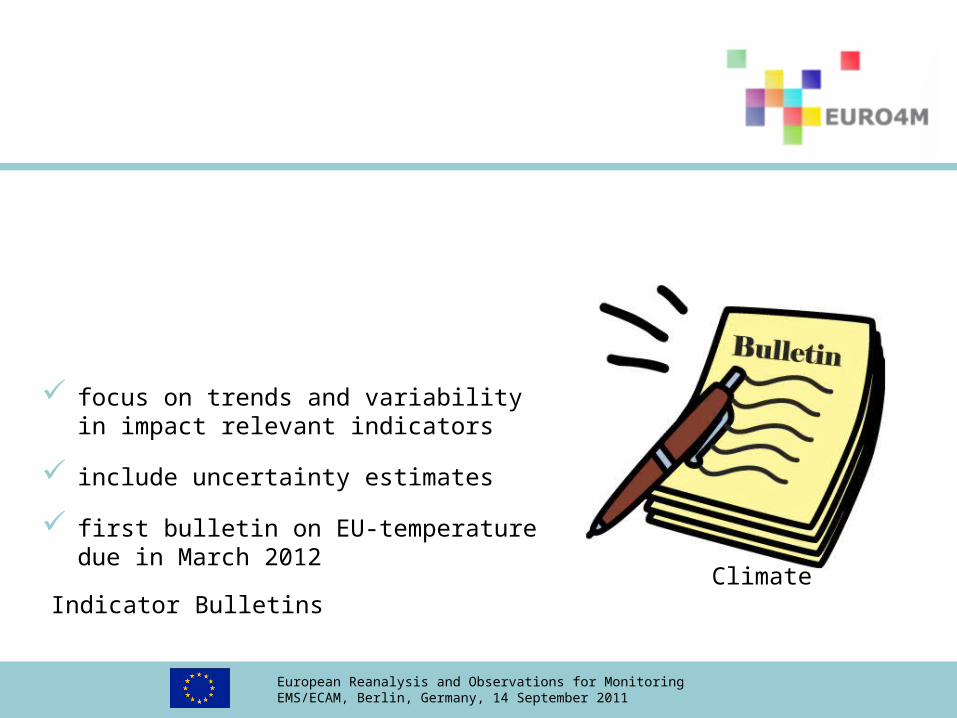
Reference historical databases Climate Indicator Bulletins
focus on trends and variability in impact relevant indicators
include uncertainty estimates
first bulletin on EU-temperaturedue in March 2012

European Reanalysis and Observations for MonitoringEMS/ECAM, Berlin, Germany, 14 September 2011
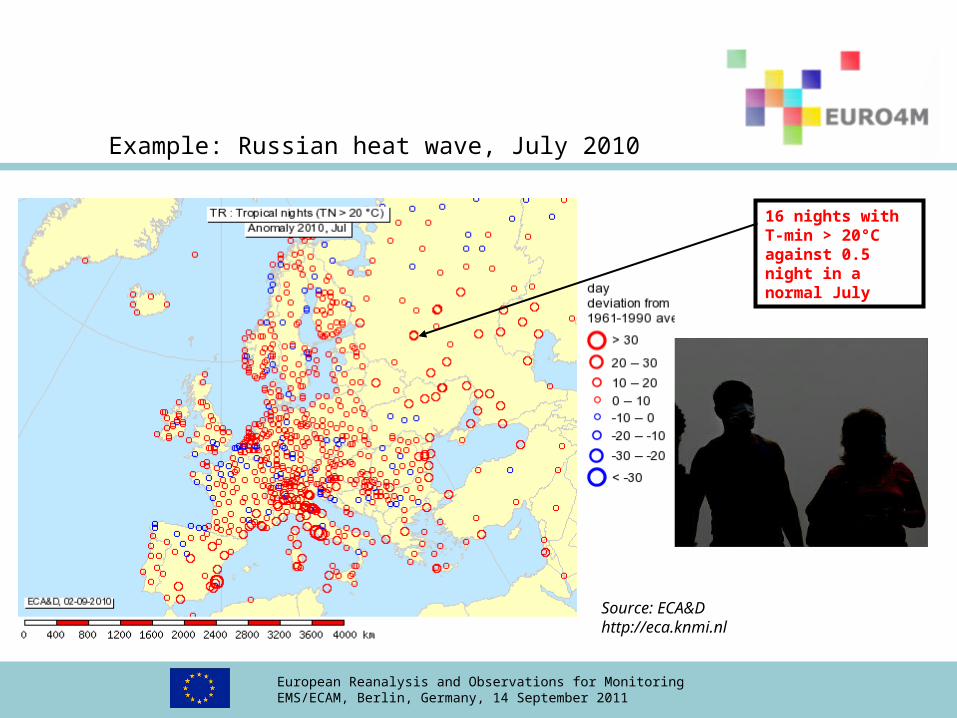
Example: Russian heat wave, July 2010
In-situNOAA

European Reanalysis and Observations for MonitoringEMS/ECAM, Berlin, Germany, 14 September 2011
ERA-InterimECMWF
MSUUAH
Courtesy: John Christy (top), Adrian Simmons (bottom)
In-situNOAA
Example: Russian heat wave, July 2010

European Reanalysis and Observations for MonitoringEMS/ECAM, Berlin, Germany, 14 September 2011
Assessment requiresimpact relevant indicators(EEA, IPCC/ETCCDI, WMO-GFCS)
In-situNOAA
Example: Russian heat wave, July 2010

European Reanalysis and Observations for MonitoringEMS/ECAM, Berlin, Germany, 14 September 2011
31 days withT-max > 25°C against 9.5 days in a normal July
Source: ECA&D http://eca.knmi.nl
Example: Russian heat wave, July 2010
European Reanalysis and Observations for MonitoringEMS/ECAM, Berlin, Germany, 14 September 2011
16 nights with T-min > 20°C against 0.5 night in a normal July
Source: ECA&D http://eca.knmi.nl
Example: Russian heat wave, July 2010

European Reanalysis and Observations for MonitoringEMS/ECAM, Berlin, Germany, 14 September 2011
From: EEA/JRC/WHO impact indicator report, 2008; Source: ECA&D, http://eca.knmi.nl
Trends in impact indicators since 1976:

European Reanalysis and Observations for MonitoringEMS/ECAM, Berlin, Germany, 14 September 2011
ETCCDI worldwide indicatoractivities
Working together
GH Africa Workshop(WCRP/World Bank)
04/2010
Indonesia, Malaysia,Thailand, Philippines
(NL) 12/2009
Southeast Asia (USA)
12/2007
Mexico (UK)03/2009
West IndianOcean (France)
09/2009
Central Africa (USA) 4/2007
South America (Ecuador) 01/2011

European Reanalysis and Observations for MonitoringEMS/ECAM, Berlin, Germany, 14 September 2011

European Reanalysis and Observations for MonitoringEMS/ECAM, Berlin, Germany, 14 September 2011
EURO4M EUMETGRID
4-year project (funding assured) Project with regular extensions (funding uncertain)
Focus on research and development Focus tools and methodologies for operational services
9 partners in consortium only Open to all ECSN members and targeted at RA VI
Top-down gridding with common method Bottom-up stitching national grids together
Based on central data archive ECA&D (selected stations only) Based on complete national archives (highest possible detail)
Includes DARE and digitization activities DARE is part of other projects outside EUMETGRID
In situ, satellite and reanalysis data Prime focus on in situ data
Bulletins with impact relevant indicators of extremes Various user applications
Relies on existing infrastructure only New infrastructure development (distributed databases, WIS)
Near-real time monitoring of extreme events Monitoring linked to WMO Pilot RCC on monitoring (DWD)
Initiated by EU Initiated by NMHSs
Building block for future GMES Climate Service Core of future EUMETNET Climate Capability
Liason with ERA-CLIM, ESA-CCI and future FP7 projects Keen eye on role in operational GMES Climate
GEOLAND2 MyOcean MACC SAFER G-Mosaic ???
How do we convince EUMETNET of synergy, and need for funding climate?

European Reanalysis and Observations for MonitoringEMS/ECAM, Berlin, Germany, 14 September 2011
SunCloud project: Motivation • Lack of long-term surface solar radiation (SSR, W/m2) series (Fig. 1).
• Sunshine measurements (Fig.2 ) can be used as a proxy of SSR data.
• Excellent relationship between SSR and sunshine data.
• Consequently, ECA&D sunshine data (Fig. 3) are very useful to study changes in radiation reaching the Earth’s surface during the last decades.
Fig. 1. Distribution of the longest SSR series in Europe.
Fig. 2. Campbell-Stokes sunshine duration recorder. Fig. 3. Current ECA&D sunshine duration data availability .

European Reanalysis and Observations for MonitoringEMS/ECAM, Berlin, Germany, 14 September 2011
Trends in radiation reaching Earth’s surface• Previous research has reported decadal changes in SSR / sunshine duration
during the last century in different regions across the World.
• For example over Western Europe, Sanchez-Lorenzo (2008) found substantial decadal variations during the 20th century in sunshine duration series using a set of only 79 stations. A new reassessment of the trends is needed using a most comprehensive data set.
Sanchez-Lorenzo et al. (2008)


![ECMWF 14/03/2011 Reanalysis: When observations meet models Dick Dee, ECMWF MSU Ch2 radiance bias [K], estimated by reanalysis CCI project integration meetingReanalysis.](https://static.fdocuments.in/doc/165x107/56649efc5503460f94c0fae6/ecmwf-14032011-reanalysis-when-observations-meet-models-dick-dee-ecmwf.jpg)