European Journal of Agronomy - CRIDA · of Crop Sciences, ICAR-Central Research Institute for...
15
Europ. J. Agronomy 79 (2016) 43–57 Contents lists available at ScienceDirect European Journal of Agronomy j ourna l h o mepage: www.elsevier.com/locate/eja Functional mechanisms of drought tolerance in maize through phenotyping and genotyping under well watered and water stressed conditions Mandapaka Maheswari ∗,1 , Vijaya Lakshmi Tekula 1 , Varalaxmi Yellisetty 1 , Basudeb Sarkar 1 , Sushil Kumar Yadav 1 , Jainender Singh, Seshu Babu G., Ashish Kumar, Sushma Amirineni, Jyothilakshmi Narayana, Vanaja Maddi Division of Crop Sciences, ICAR-Central Research Institute for Dryland Agriculture (CRIDA), Santoshnagar, Hyderabad, Telangana, India a r t i c l e i n f o Article history: Received 27 August 2015 Received in revised form 26 April 2016 Accepted 12 May 2016 Keywords: Zea mays Drought tolerance Morpho-physiological traits Genetic diversity SSR markers PCA Correlation Association analysis a b s t r a c t Developing tolerant genotypes is crucial for stabilizing maize productivity under drought stress condi- tions as it is one of the most important abiotic stresses affecting crop yields. Twenty seven genotypes of maize (Zea mays L.) were evaluated for drought tolerance for three seasons under well watered and water stressed conditions to identify interactions amongst various tolerance traits and grain yield as well as their association with SSR markers. The study revealed considerable genetic diversity and significant variations for genotypes, environment and genotype × environment interactions for all the traits. The ranking of genotypes based on drought susceptibility index for morpho-physiological traits was simi- lar to that based on grain yield and principal component analysis. Analysis of trait – trait and trait – yield associations indicated significant positive correlations amongst the water relations traits of relative water content (RWC), leaf water potential and osmotic potential as well as of RWC with grain yield under water stressed condition. Molecular analysis using 40 SSRs revealed 32 as polymorphic and 62 unique alleles were detected across 27 genotypes. Cluster analysis resulted in categorization of the genotypes into five distinct groups which was similar to that using principal component analysis. Based on overall performance across seasons tolerant and susceptible genotypes were identified for eventual utilization in breeding programs as well as for QTL identification. The marker-trait association analysis revealed significant associations between few SSR markers with water relations as well as yield contributing traits under water stressed conditions. These associations highlight the importance of functional mechanisms of intrinsic tolerance and cumulative traits for drought tolerance in maize. © 2016 Elsevier B.V. All rights reserved. 1. Introduction Maize is an important cereal and fodder crop cultivated across the world (White and Johnson, 2003). Drought is one of the most important abiotic stresses limiting crop yields including maize (Prasanna, 2012; Mir et al., 2012). The adverse effects of vari- Abbreviations: DSI, drought susceptibility index; LWP, leaf water potential; PCA, principal component analysis; PIC, polymorphism information content; QTL, quan- titative trait loci; RWC, relative water content; SAHN, sequential, agglomerative, hierarchical and nested clustering methods; SSR, simple sequence repeat; UPGMA, unweighted pair group method using arithmetic means. ∗ Corresponding author. E-mail addresses: [email protected], [email protected] (M. Maheswari). 1 These authors have made equal contribution. ous abiotic stresses including drought and high temperature are likely to be further accentuated by the impending climate change. Although a complex trait controlled by genotype × environment (G × E) interactions, improvement of grain yield in maize under harsh environments is an urgent priority to meet the increasing demands for food of ever increasing population. A major approach to identify drought tolerant genotypes is to assess tolerance on the basis of yield stability or drought susceptibility index (Sinha et al., 1986) as grain yield under water-deficit stress is the ultimate cul- mination of various physiological and metabolic functions in plant. It is well known that duration, intensity of drought stress as well as stage of crop growth determine the extent of yield losses. In maize, anthesis-silking interval (ASI) is known to be an indirect selection criterion for grain yield (Magorokosho et al., 2003) and it is indeed the most critical stage adversely affected by drought (Bolaoos and Edmeades, 1993). It is also well known that in maize the final ker- http://dx.doi.org/10.1016/j.eja.2016.05.008 1161-0301/© 2016 Elsevier B.V. All rights reserved.
Transcript of European Journal of Agronomy - CRIDA · of Crop Sciences, ICAR-Central Research Institute for...

Fpc
MBSD
a
ARRA
KZDMGSPCA
1
ti(
pthu
(
h1
Europ. J. Agronomy 79 (2016) 43–57
Contents lists available at ScienceDirect
European Journal of Agronomy
j ourna l h o mepage: www.elsev ier .com/ locate /e ja
unctional mechanisms of drought tolerance in maize throughhenotyping and genotyping under well watered and water stressedonditions
andapaka Maheswari ∗,1, Vijaya Lakshmi Tekula 1, Varalaxmi Yellisetty 1,asudeb Sarkar 1, Sushil Kumar Yadav 1, Jainender Singh, Seshu Babu G., Ashish Kumar,ushma Amirineni, Jyothilakshmi Narayana, Vanaja Maddiivision of Crop Sciences, ICAR-Central Research Institute for Dryland Agriculture (CRIDA), Santoshnagar, Hyderabad, Telangana, India
r t i c l e i n f o
rticle history:eceived 27 August 2015eceived in revised form 26 April 2016ccepted 12 May 2016
eywords:ea maysrought toleranceorpho-physiological traitsenetic diversitySR markersCAorrelationssociation analysis
a b s t r a c t
Developing tolerant genotypes is crucial for stabilizing maize productivity under drought stress condi-tions as it is one of the most important abiotic stresses affecting crop yields. Twenty seven genotypesof maize (Zea mays L.) were evaluated for drought tolerance for three seasons under well watered andwater stressed conditions to identify interactions amongst various tolerance traits and grain yield as wellas their association with SSR markers. The study revealed considerable genetic diversity and significantvariations for genotypes, environment and genotype × environment interactions for all the traits. Theranking of genotypes based on drought susceptibility index for morpho-physiological traits was simi-lar to that based on grain yield and principal component analysis. Analysis of trait – trait and trait –yield associations indicated significant positive correlations amongst the water relations traits of relativewater content (RWC), leaf water potential and osmotic potential as well as of RWC with grain yield underwater stressed condition. Molecular analysis using 40 SSRs revealed 32 as polymorphic and 62 uniquealleles were detected across 27 genotypes. Cluster analysis resulted in categorization of the genotypesinto five distinct groups which was similar to that using principal component analysis. Based on overall
performance across seasons tolerant and susceptible genotypes were identified for eventual utilizationin breeding programs as well as for QTL identification. The marker-trait association analysis revealedsignificant associations between few SSR markers with water relations as well as yield contributing traitsunder water stressed conditions. These associations highlight the importance of functional mechanismsof intrinsic tolerance and cumulative traits for drought tolerance in maize.© 2016 Elsevier B.V. All rights reserved.
. Introduction
Maize is an important cereal and fodder crop cultivated across
he world (White and Johnson, 2003). Drought is one of the mostmportant abiotic stresses limiting crop yields including maizePrasanna, 2012; Mir et al., 2012). The adverse effects of vari-Abbreviations: DSI, drought susceptibility index; LWP, leaf water potential; PCA,rincipal component analysis; PIC, polymorphism information content; QTL, quan-itative trait loci; RWC, relative water content; SAHN, sequential, agglomerative,ierarchical and nested clustering methods; SSR, simple sequence repeat; UPGMA,nweighted pair group method using arithmetic means.∗ Corresponding author.
E-mail addresses: [email protected], [email protected]. Maheswari).
1 These authors have made equal contribution.
ttp://dx.doi.org/10.1016/j.eja.2016.05.008161-0301/© 2016 Elsevier B.V. All rights reserved.
ous abiotic stresses including drought and high temperature arelikely to be further accentuated by the impending climate change.Although a complex trait controlled by genotype × environment(G × E) interactions, improvement of grain yield in maize underharsh environments is an urgent priority to meet the increasingdemands for food of ever increasing population. A major approachto identify drought tolerant genotypes is to assess tolerance on thebasis of yield stability or drought susceptibility index (Sinha et al.,1986) as grain yield under water-deficit stress is the ultimate cul-mination of various physiological and metabolic functions in plant.It is well known that duration, intensity of drought stress as well asstage of crop growth determine the extent of yield losses. In maize,
anthesis-silking interval (ASI) is known to be an indirect selectioncriterion for grain yield (Magorokosho et al., 2003) and it is indeedthe most critical stage adversely affected by drought (Bolaoos andEdmeades, 1993). It is also well known that in maize the final ker-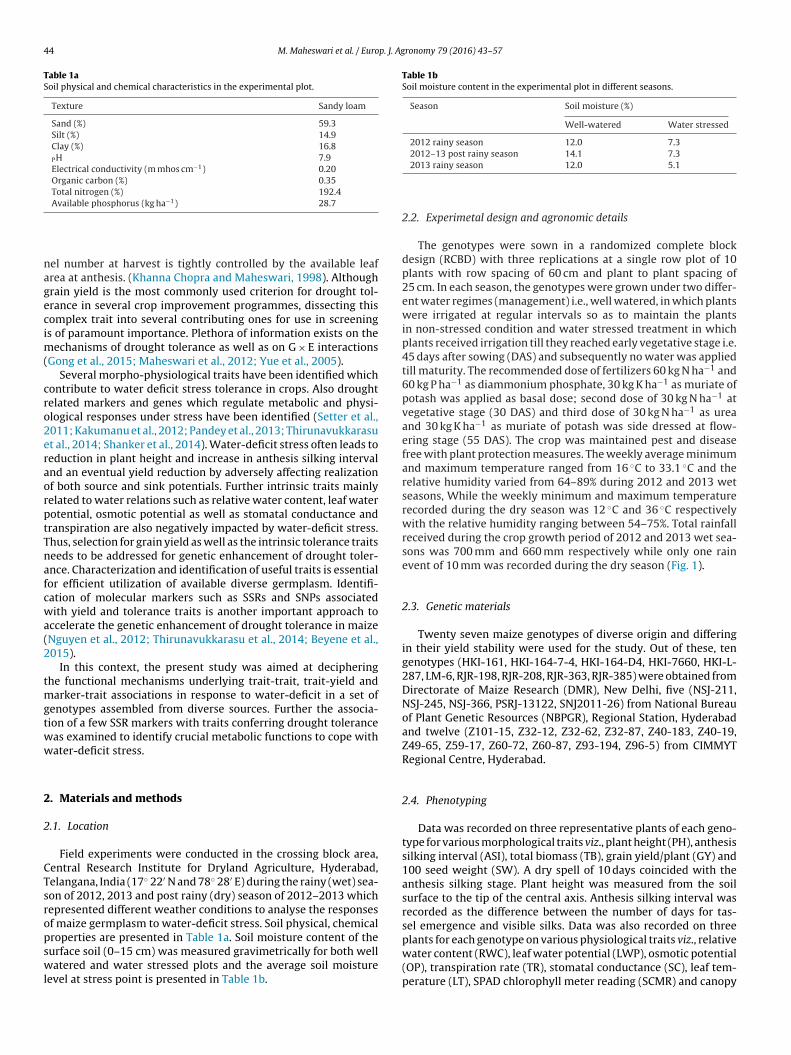
44 M. Maheswari et al. / Europ. J. Agronomy 79 (2016) 43–57
Table 1aSoil physical and chemical characteristics in the experimental plot.
Texture Sandy loam
Sand (%) 59.3Silt (%) 14.9Clay (%) 16.8PH 7.9Electrical conductivity (m mhos cm−1) 0.20Organic carbon (%) 0.35Total nitrogen (%) 192.4Available phosphorus (kg ha−1) 28.7
nagecim(
cro2eraorptTnafcwa(2
tmgtww
2
2
CTsropswl
Table 1bSoil moisture content in the experimental plot in different seasons.
Season Soil moisture (%)
Well-watered Water stressed
2012 rainy season 12.0 7.32012–13 post rainy season 14.1 7.3
water content (RWC), leaf water potential (LWP), osmotic potential
el number at harvest is tightly controlled by the available leafrea at anthesis. (Khanna Chopra and Maheswari, 1998). Althoughrain yield is the most commonly used criterion for drought tol-rance in several crop improvement programmes, dissecting thisomplex trait into several contributing ones for use in screenings of paramount importance. Plethora of information exists on the
echanisms of drought tolerance as well as on G × E interactionsGong et al., 2015; Maheswari et al., 2012; Yue et al., 2005).
Several morpho-physiological traits have been identified whichontribute to water deficit stress tolerance in crops. Also droughtelated markers and genes which regulate metabolic and physi-logical responses under stress have been identified (Setter et al.,011; Kakumanu et al., 2012; Pandey et al., 2013; Thirunavukkarasut al., 2014; Shanker et al., 2014). Water-deficit stress often leads toeduction in plant height and increase in anthesis silking intervalnd an eventual yield reduction by adversely affecting realizationf both source and sink potentials. Further intrinsic traits mainlyelated to water relations such as relative water content, leaf waterotential, osmotic potential as well as stomatal conductance andranspiration are also negatively impacted by water-deficit stress.hus, selection for grain yield as well as the intrinsic tolerance traitseeds to be addressed for genetic enhancement of drought toler-nce. Characterization and identification of useful traits is essentialor efficient utilization of available diverse germplasm. Identifi-ation of molecular markers such as SSRs and SNPs associatedith yield and tolerance traits is another important approach to
ccelerate the genetic enhancement of drought tolerance in maizeNguyen et al., 2012; Thirunavukkarasu et al., 2014; Beyene et al.,015).
In this context, the present study was aimed at decipheringhe functional mechanisms underlying trait-trait, trait-yield and
arker-trait associations in response to water-deficit in a set ofenotypes assembled from diverse sources. Further the associa-ion of a few SSR markers with traits conferring drought toleranceas examined to identify crucial metabolic functions to cope withater-deficit stress.
. Materials and methods
.1. Location
Field experiments were conducted in the crossing block area,entral Research Institute for Dryland Agriculture, Hyderabad,elangana, India (17◦ 22′ N and 78◦ 28′ E) during the rainy (wet) sea-on of 2012, 2013 and post rainy (dry) season of 2012–2013 whichepresented different weather conditions to analyse the responsesf maize germplasm to water-deficit stress. Soil physical, chemicalroperties are presented in Table 1a. Soil moisture content of theurface soil (0–15 cm) was measured gravimetrically for both well
atered and water stressed plots and the average soil moistureevel at stress point is presented in Table 1b.
2013 rainy season 12.0 5.1
2.2. Experimetal design and agronomic details
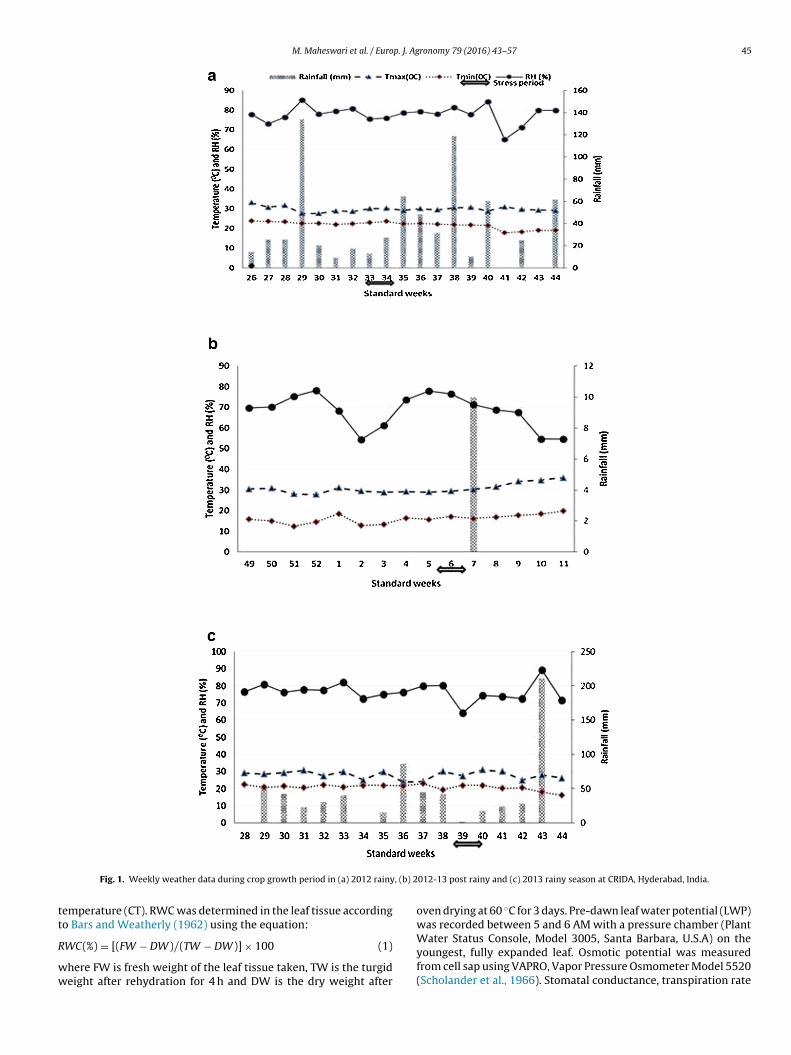
The genotypes were sown in a randomized complete blockdesign (RCBD) with three replications at a single row plot of 10plants with row spacing of 60 cm and plant to plant spacing of25 cm. In each season, the genotypes were grown under two differ-ent water regimes (management) i.e., well watered, in which plantswere irrigated at regular intervals so as to maintain the plantsin non-stressed condition and water stressed treatment in whichplants received irrigation till they reached early vegetative stage i.e.45 days after sowing (DAS) and subsequently no water was appliedtill maturity. The recommended dose of fertilizers 60 kg N ha−1 and60 kg P ha−1 as diammonium phosphate, 30 kg K ha−1 as muriate ofpotash was applied as basal dose; second dose of 30 kg N ha−1 atvegetative stage (30 DAS) and third dose of 30 kg N ha−1 as ureaand 30 kg K ha−1 as muriate of potash was side dressed at flow-ering stage (55 DAS). The crop was maintained pest and diseasefree with plant protection measures. The weekly average minimumand maximum temperature ranged from 16 ◦C to 33.1 ◦C and therelative humidity varied from 64–89% during 2012 and 2013 wetseasons, While the weekly minimum and maximum temperaturerecorded during the dry season was 12 ◦C and 36 ◦C respectivelywith the relative humidity ranging between 54–75%. Total rainfallreceived during the crop growth period of 2012 and 2013 wet sea-sons was 700 mm and 660 mm respectively while only one rainevent of 10 mm was recorded during the dry season (Fig. 1).
2.3. Genetic materials
Twenty seven maize genotypes of diverse origin and differingin their yield stability were used for the study. Out of these, tengenotypes (HKI-161, HKI-164-7-4, HKI-164-D4, HKI-7660, HKI-L-287, LM-6, RJR-198, RJR-208, RJR-363, RJR-385) were obtained fromDirectorate of Maize Research (DMR), New Delhi, five (NSJ-211,NSJ-245, NSJ-366, PSRJ-13122, SNJ2011-26) from National Bureauof Plant Genetic Resources (NBPGR), Regional Station, Hyderabadand twelve (Z101-15, Z32-12, Z32-62, Z32-87, Z40-183, Z40-19,Z49-65, Z59-17, Z60-72, Z60-87, Z93-194, Z96-5) from CIMMYTRegional Centre, Hyderabad.
2.4. Phenotyping
Data was recorded on three representative plants of each geno-type for various morphological traits viz., plant height (PH), anthesissilking interval (ASI), total biomass (TB), grain yield/plant (GY) and100 seed weight (SW). A dry spell of 10 days coincided with theanthesis silking stage. Plant height was measured from the soilsurface to the tip of the central axis. Anthesis silking interval wasrecorded as the difference between the number of days for tas-sel emergence and visible silks. Data was also recorded on threeplants for each genotype on various physiological traits viz., relative
(OP), transpiration rate (TR), stomatal conductance (SC), leaf tem-perature (LT), SPAD chlorophyll meter reading (SCMR) and canopy
M. Maheswari et al. / Europ. J. Agronomy 79 (2016) 43–57 45
, (b) 2
tt
R
ww
Fig. 1. Weekly weather data during crop growth period in (a) 2012 rainy
emperature (CT). RWC was determined in the leaf tissue accordingo Bars and Weatherly (1962) using the equation:
WC(%) = [(FW − DW)/(TW − DW)] × 100 (1)
here FW is fresh weight of the leaf tissue taken, TW is the turgideight after rehydration for 4 h and DW is the dry weight after
012-13 post rainy and (c) 2013 rainy season at CRIDA, Hyderabad, India.
oven drying at 60 ◦C for 3 days. Pre-dawn leaf water potential (LWP)was recorded between 5 and 6 AM with a pressure chamber (Plant
Water Status Console, Model 3005, Santa Barbara, U.S.A) on theyoungest, fully expanded leaf. Osmotic potential was measuredfrom cell sap using VAPRO, Vapor Pressure Osmometer Model 5520(Scholander et al., 1966). Stomatal conductance, transpiration rate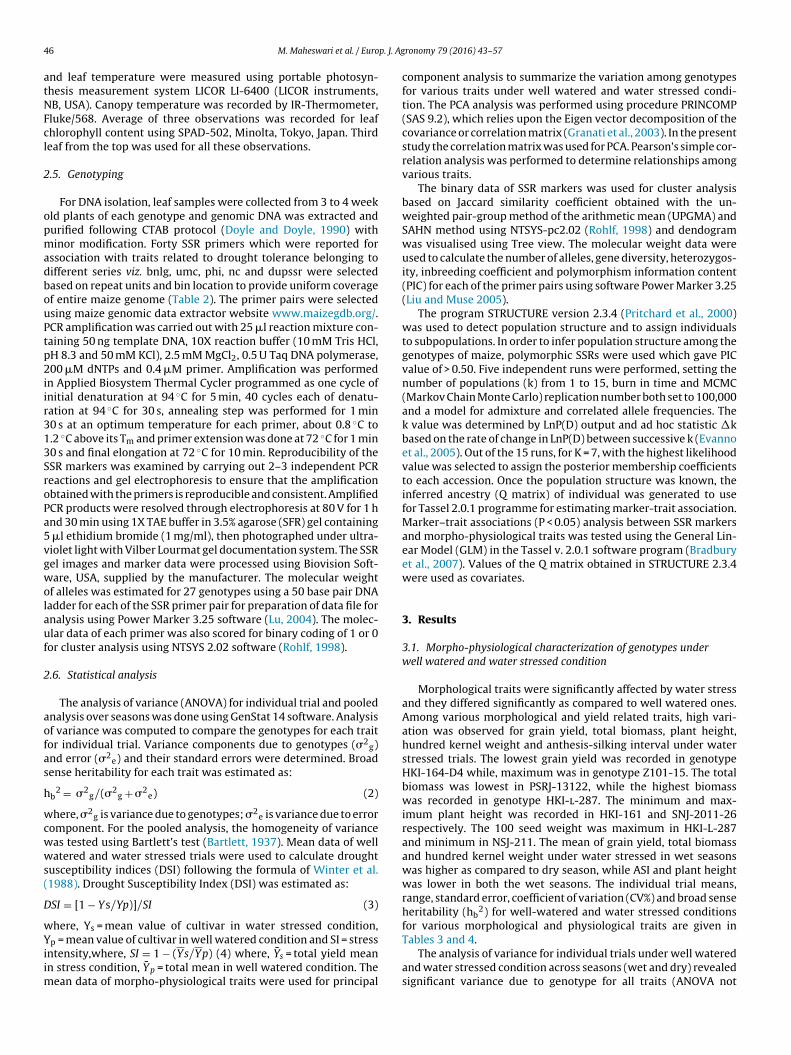
4 p. J. Ag
atNFcl
2
opmadbouPtp2iir313SroPa5vgwolauf
2
aofas
h
wcwws(
D
wYiim
6 M. Maheswari et al. / Euro
nd leaf temperature were measured using portable photosyn-hesis measurement system LICOR LI-6400 (LICOR instruments,B, USA). Canopy temperature was recorded by IR-Thermometer,luke/568. Average of three observations was recorded for leafhlorophyll content using SPAD-502, Minolta, Tokyo, Japan. Thirdeaf from the top was used for all these observations.
.5. Genotyping
For DNA isolation, leaf samples were collected from 3 to 4 weekld plants of each genotype and genomic DNA was extracted andurified following CTAB protocol (Doyle and Doyle, 1990) withinor modification. Forty SSR primers which were reported for
ssociation with traits related to drought tolerance belonging toifferent series viz. bnlg, umc, phi, nc and dupssr were selectedased on repeat units and bin location to provide uniform coveragef entire maize genome (Table 2). The primer pairs were selectedsing maize genomic data extractor website www.maizegdb.org/.CR amplification was carried out with 25 �l reaction mixture con-aining 50 ng template DNA, 10X reaction buffer (10 mM Tris HCl,H 8.3 and 50 mM KCl), 2.5 mM MgCl2, 0.5 U Taq DNA polymerase,00 �M dNTPs and 0.4 �M primer. Amplification was performed
n Applied Biosystem Thermal Cycler programmed as one cycle ofnitial denaturation at 94 ◦C for 5 min, 40 cycles each of denatu-ation at 94 ◦C for 30 s, annealing step was performed for 1 min0 s at an optimum temperature for each primer, about 0.8 ◦C to.2 ◦C above its Tm and primer extension was done at 72 ◦C for 1 min0 s and final elongation at 72 ◦C for 10 min. Reproducibility of theSR markers was examined by carrying out 2–3 independent PCReactions and gel electrophoresis to ensure that the amplificationbtained with the primers is reproducible and consistent. AmplifiedCR products were resolved through electrophoresis at 80 V for 1 hnd 30 min using 1X TAE buffer in 3.5% agarose (SFR) gel containing
�l ethidium bromide (1 mg/ml), then photographed under ultra-iolet light with Vilber Lourmat gel documentation system. The SSRel images and marker data were processed using Biovision Soft-are, USA, supplied by the manufacturer. The molecular weight
f alleles was estimated for 27 genotypes using a 50 base pair DNAadder for each of the SSR primer pair for preparation of data file fornalysis using Power Marker 3.25 software (Lu, 2004). The molec-lar data of each primer was also scored for binary coding of 1 or 0
or cluster analysis using NTSYS 2.02 software (Rohlf, 1998).
.6. Statistical analysis
The analysis of variance (ANOVA) for individual trial and poolednalysis over seasons was done using GenStat 14 software. Analysisf variance was computed to compare the genotypes for each traitor individual trial. Variance components due to genotypes (�2
g)nd error (�2
e) and their standard errors were determined. Broadense heritability for each trait was estimated as:
b2 = �2
g/(�2g + �2
e) (2)
here, �2g is variance due to genotypes; �2
e is variance due to erroromponent. For the pooled analysis, the homogeneity of varianceas tested using Bartlett’s test (Bartlett, 1937). Mean data of wellatered and water stressed trials were used to calculate drought
usceptibility indices (DSI) following the formula of Winter et al.1988). Drought Susceptibility Index (DSI) was estimated as:
SI = [1 − Ys/Yp)]/SI (3)
here, Ys = mean value of cultivar in water stressed condition,
p = mean value of cultivar in well watered condition and SI = stressntensity,where, SI = 1 − (Ys/Yp) (4) where, Ys = total yield meann stress condition, Yp = total mean in well watered condition. The
ean data of morpho-physiological traits were used for principal
ronomy 79 (2016) 43–57
component analysis to summarize the variation among genotypesfor various traits under well watered and water stressed condi-tion. The PCA analysis was performed using procedure PRINCOMP(SAS 9.2), which relies upon the Eigen vector decomposition of thecovariance or correlation matrix (Granati et al., 2003). In the presentstudy the correlation matrix was used for PCA. Pearson’s simple cor-relation analysis was performed to determine relationships amongvarious traits.
The binary data of SSR markers was used for cluster analysisbased on Jaccard similarity coefficient obtained with the un-weighted pair-group method of the arithmetic mean (UPGMA) andSAHN method using NTSYS-pc2.02 (Rohlf, 1998) and dendogramwas visualised using Tree view. The molecular weight data wereused to calculate the number of alleles, gene diversity, heterozygos-ity, inbreeding coefficient and polymorphism information content(PIC) for each of the primer pairs using software Power Marker 3.25(Liu and Muse 2005).
The program STRUCTURE version 2.3.4 (Pritchard et al., 2000)was used to detect population structure and to assign individualsto subpopulations. In order to infer population structure among thegenotypes of maize, polymorphic SSRs were used which gave PICvalue of > 0.50. Five independent runs were performed, setting thenumber of populations (k) from 1 to 15, burn in time and MCMC(Markov Chain Monte Carlo) replication number both set to 100,000and a model for admixture and correlated allele frequencies. Thek value was determined by LnP(D) output and ad hoc statistic �kbased on the rate of change in LnP(D) between successive k (Evannoet al., 2005). Out of the 15 runs, for K = 7, with the highest likelihoodvalue was selected to assign the posterior membership coefficientsto each accession. Once the population structure was known, theinferred ancestry (Q matrix) of individual was generated to usefor Tassel 2.0.1 programme for estimating marker-trait association.Marker–trait associations (P < 0.05) analysis between SSR markersand morpho-physiological traits was tested using the General Lin-ear Model (GLM) in the Tassel v. 2.0.1 software program (Bradburyet al., 2007). Values of the Q matrix obtained in STRUCTURE 2.3.4were used as covariates.
3. Results
3.1. Morpho-physiological characterization of genotypes underwell watered and water stressed condition
Morphological traits were significantly affected by water stressand they differed significantly as compared to well watered ones.Among various morphological and yield related traits, high vari-ation was observed for grain yield, total biomass, plant height,hundred kernel weight and anthesis-silking interval under waterstressed trials. The lowest grain yield was recorded in genotypeHKI-164-D4 while, maximum was in genotype Z101-15. The totalbiomass was lowest in PSRJ-13122, while the highest biomasswas recorded in genotype HKI-l-287. The minimum and max-imum plant height was recorded in HKI-161 and SNJ-2011-26respectively. The 100 seed weight was maximum in HKI-L-287and minimum in NSJ-211. The mean of grain yield, total biomassand hundred kernel weight under water stressed in wet seasonswas higher as compared to dry season, while ASI and plant heightwas lower in both the wet seasons. The individual trial means,range, standard error, coefficient of variation (CV%) and broad senseheritability (hb
2) for well-watered and water stressed conditionsfor various morphological and physiological traits are given in
Tables 3 and 4.The analysis of variance for individual trials under well wateredand water stressed condition across seasons (wet and dry) revealedsignificant variance due to genotype for all traits (ANOVA not
M.
Mahesw
ari et
al. /
Europ. J.
Agronom
y 79
(2016) 43–57
47
Table 2Details of SSR markers, their association with drought related traits.
Marker Forward primer (5′–3′) Reverse primer (5′–3′) Repeat type Bin no.* Trait References
bnlg1014 CACGCTGTTTCAGACAGGAA CGCCTGTGATTGCACTACAC AG(14) 1.01 ASI, FFT; EW, GW; RWC Gemenet et al. (2010),Zhang et al. (2012) andNikolic et al. (2012)
bnlg1028 AGGAAACGAACACAGCAGCT TGCATAGACAAAACCGACGT AG(12) 10.06 porin2 Dubey et al. (2009)bnlg1035 TGCTTGCACTGTCAGGAATC CAGCTCTGACACACCACACA AG(13) 3.05 GY, EL, EW, DTI Guo et al. (2008)bnlg1063 GGAGACAACCCCGACGAC GGTACCAGAGCCACAGATCC AG(42) 3.06 MFT, FFT Guo et al. (2008)bnlg1082 AAAGATCATGGGCGTACCAG CAGGAACCTGATGACCACCT AG(11) 9.02 PH Guo et al. (2008)bnlg1083 ACAGTCTGTTGGGGAACAGG CAACGCTGGTTTGTCGTTTA AG(29) 1.02 PH, HKW Guo et al. (2008)bnlg1136 CATCAGCTTCAACGAGTTCG TAACCGGATGAGCATCTTCC AG(14) 6.07 ASI Guo et al. (2008)bnlg1209 GTCCCGGGCAGAATAATACC TTCCTCCTTGAAGTGCTCGT AG(12) 9.04 – –bnlg1225 GCAGTAGAAGAGCGAGCGAG CATACGCTGTCACTGCCACT AG(14) 2.06 GY, EW Guo et al. (2008)bnlg1241 ATTCTTGACATCCATCCGGT TGTTGTTTCACTCAGCGTCC AG(21) 4.01 PH, MFT,FFT, HKW Guo et al. (2008)bnlg1297 TCTCGATCGCTCCGATCTAT GACTCAACTCCAAAAGGCGA AG(32) 2.02 – –bnlg1327 CTCTCTCGCGTGTGTGC TGGGTCTCCTTCTCCGTCTA CT(25) 2.02 MFT; RWC Guo et al. (2008), Nikolic
et al. (2012)bnlg1346 CATCATGAAGCAATGAAGCC CCGCGCCATTATCTAGTTGT AG(24) 5.07 ASI Guo et al. (2008)bnlg1434 TCCAAGCTGGAAGCCTTAAG TCTTGTCTCCTCTCTCCCCC AG(15) 4.01 – –bnlg1614 CCAACCCACCCAGAGGAGA AGCGGGCGAGATCTTCAT AG(15) 1.02 PH Guo et al. (2008)bnlg1655 ATTAAAATCTTGCTGATGGCG TTCTGTTCCCGCCTGTACTT AG(21) 10.03 PH, FFT Guo et al. (2008)bnlg1812 CGAGAAGACTTGCGTGAACA TTACGTGCGTCGTCAGAATC AG(22) 8.05 Sucrose phosphatase; MFT Dubey et al. (2009), Guo
et al. (2008)bnlg1866 CCCAGCGCATGTCAACTCT CCCCGGTAATTCAGTGGATA AG(11) 1.03 fad 8 Dubey et al. (2009)bnlg2190 TCCTCCTTCATCCCCTTCTT CCCAGTATCATTGCCCAATC AG(31) 10.06 DTI Guo et al. (2008)bnlg2248 CCACCACATCCGTTACATCA ACTTTGACACCGGCGAATAC AG(30) 2.03 ASI Guo et al. (2008)bnlg2252 GTCTTTGACCCCTTCCTCTTCTTG CACTGCACTGCAAGGTACATACG (TCC)4 2.05 – –bnlg2328 AGCAGTGAGGAAGAAGCAGG TTACCCTCCCTTGTCGTGAC AG(33) 2.05 KRN, DTI Guo et al. (2008)bnlg439 TTGACATCGCCATCTTGGTGACCA TCTTAATGCGATCGTACGAAGTTGTGGAA NA 1.03 – –dupssr12 CAGGTACTACGTGCCGTG CTAGAGACAAACGAGGCTAGG (AC)15 1.08 – –dupssr13 CAAATATCTCTCATCTTTGCTGAC TCGTTCGGTCCATGAAAT – 1.08 GY, PH, EH; EW, NE; SNF1- related
protein kinaseSibov et al. (2003); Sabadinet al. (2008) and Dubeyet al. (2009)
nc012 TAATTTAAACACCACACCACCG ACACACGCCAAAGAAAAACC CT 6.05 MFT, FFT, KRN Guo et al. (2008)phi022 TGCGCACCAGCGACTGACC GCGGGCGACGCTTCCAAAC GTGC 9.03 GY Guo et al. (2008)phi053 CTGCCTCTCAGATTCAGAGATTGAC AACCCAACGTACTCCGGCAG ATAC 3.05 PH, ASI Guo et al. (2008)phi081 AAGGAACTGGTGAGAGGGTCCTT AGCCCGATGCTCGCCATCTC GAT-TAC 6.05 FFT Guo et al. (2008)phi96100 AGGAGGACCCCAACTCCTG TTGCACGAGCCATCGTAT ACCT 2 – –umc1016 GTGATACCGGGTAATCTGGTGC GATGATGGGTGATCATCGGTTC (CT)25 7.02 ASI Guo et al. (2008)umc1042 AAGGCACTGCTACTCCTATGGCTA CTGACCTTTGAATTCTGTGCTCCT GA17 2.07 CBF3-like transcription factor Dubey et al. (2009)umc1056 CGGATCGCTTTTTACCGTCTATAA AGCAAGAGTAGCGTTCCATTTCAG (AGCA)4 5.03 Binding protein homolog1; ED Dubey et al. (2009) and
Sabadin et al. (2008)umc126b GACGCTTCCTCCGGCGACCACACC AGGAGCTGAAGCAATCGGTGTGGT NA 4.06 – –umc1344 GCGCTCTGACTTAATTAGAGGAGTTG GGCAGCAGATCTATGTCCAAGAAG (GTTC)5 10.07 Cytokinin response regulator 2 Dubey et al. (2009)umc1358 AGAACCTCCCGCTTGACGAC ACCTCAACCTCGACCTCTGCAT (CCT)6 1.07 – –umc1534 GACCCCAAATCTCTCCTTCCTC TAGCTAAGCTTGTGCTTGCTCG (AAG)5 1.1 – –umc1542 TAAAGCTATGATGGCACTTGCAGA CATATTTGCCTTTGCCCTTTTGTA (AG)10 2.02 ASI, KN, GY Gemenet et al. (2010)umc1922 CTTTTCCGCTGCTCTTCCTTTT TTCCCTTGTTCCAGATCCTCAATA (ATA)6 2.05 – –umc1962 ATAAGTGGGGGAGGCGAGCTA GAGAACCAACCACCAAAGAAGTCC – 10.03 FFT; Auxin binding protein homolog Marino et al. (2009) and
Dubey et al. (2009)
ASI: Anthesis Silking Interval; DTI: Drought Tolerance Index; EH: Ear Height; EL: Ear Length; EW: Ear Weight; FFT: Female Flowering Time; GW: Grain weight; GY: Grain Yield; HKW: Hundred Kernel Weight; KN: Kernel Number;KRN: Kernel rows per ear; MFT: Male Flowering Time; NE: No. of ears per plot; PH: Plant Height; RWC: Relative Water Content.
48 M. Maheswari et al. / Europ. J. Agronomy 79 (2016) 43–57
Table 3Trial mean, range and heritability for various morphological parameters tested under water stressed and well watered condition during three seasons of evaluation.
Season Management Trial mean Range of means SEd CV(%) Heritability (hb2)
Anthesis-silking interval (days)2012 rainy season Water stressed 2.70 1.00–5.00 0.31 14.24 0.88
Well watered 2.15 1.67–3.67 0.44 25.22 0.452012–13 post rainy Water stressed 4.22 1.67–8.67 0.39 11.45 0.95
Well watered 1.68 1.33–2.67 0.36 26.18 0.182013 rainy season Water stressed 2.95 1.33–5.33 0.30 12.38 0.88
Well watered 2.20 1.33–3.67 0.34 19.18 0.62Plant height (cm)2012 rainy season Water stressed 164.20 109.4–215.3 11.034 8.23 0.85
Well watered 161.05 110.5–207 11.034 8.39 0.732012–13 post rainy Water stressed 180.07 126.7–228.3 7.202 4.90 0.89
Well watered 233.94 178.3–276.7 7.701 4.03 0.902013 rainy season Water stressed 182.53 130.3–244.5 3.960 2.66 0.97
Well watered 186.72 130.8–251.3 3.575 2.35 0.97Total biomass per plant (g)2012 rainy season Water stressed 240.90 107.7–428.3 20.732 10.54 0.91
Well watered 275.74 85–429.3 31.678 14.07 0.842012–13 post rainy Water stressed 173.05 90.3–264.7 14.870 10.52 0.88
Well watered 317.21 168.3–534.3 36.622 14.14 0.792013 rainy season Water stressed 136.89 81–201.7 7.076 6.33 0.93
Well watered 176.63 101.7–398.3 6.383 4.43 0.99100 seed weight (g)2012 rainy season Water stressed 25.43 16.3–36.7 2.179 10.50 0.77
Well watered 26.63 18–35.7 2.361 10.86 0.692012–13 post rainy Water stressed 14.19 6.3–22 1.980 17.09 0.63
Well watered 24.07 18.3–33 2.253 11.46 0.632013 rainy season Water stressed 17.98 6.9–27.2 2.162 14.73 0.68
Well watered 24.70 14.5–32.5 1.954 9.69 0.78Grain yield per plant (g)2012 rainy season Water stressed 79.55 31.2–155.2 9.259 14.26 0.91
Well watered 96.45 43.6–183.8 11.391 14.46 0.912012–13 post rainy Water stressed 38.43 5.67–80.6 6.973 22.22 0.87
412
ph(art
ZwNdwthAiiZ2wytds
awTmi1r
Well watered 100.46
2013 rainy season Water stressed 51.02
Well watered 70.98
resented due to large data set). The pooled ANOVA revealedighly significant interaction between genotype, environmentwell watered or water stressed) and seasons (wet and dry) forll traits (Table 5). The significant variation due to genotype, envi-onment and their interaction for all the traits indicated that theseraits were influenced by both genetic and environment factors.
Among various morpho-physiological traits studied, genotypes32-87, HKI-L-287 and Z49-65 maintained higher RWC both underell watered and water stressed as compared to RJR-208 andSJ-245 (Table 6). While, Z49-65 had higher RWC, stomatal con-uctance, SPAD chlorophyll reading, 100 seed weight and leafater potential both under well watered and water stressed condi-
ion. Genotypes Z32-87, HKI-l-287, Z101-15 and SNJ2011-26 gaveigher values for RWC, transpiration rate and grain yield and lowSI both under well watered and water stressed condition indicat-
ng their better tolerance to drought stress. High ASI was recordedn NSJ-245 and HKI-161 (>6 days), while low ASI was recorded in101-15 and SNJ-2011-26 (<2 days). Among genotypes tested, NSJ-11, NSJ-245, HKI-161 were found to be poor performer underater stress in terms of ASI, transpiration rate, total biomass, grain
ield, RWC and LWP. Based on overall performance across seasonshe genotypes, Z101-15, SNJ-2011-26 were found to be tolerant torought while RJR-208, NSJ-211, HKI-161 and NSJ-245 were highlyusceptible to drought stress.
High variation was also observed for various physiological traitsmong genotypes under water stressed conditions. The mean SCMRas lowest for NSJ-211 while highest value was recorded in Z32-87.
he RWC showed high variation among genotypes with mini-
um value of 59.87% in NSJ-211 while maximum value of 81.08%n Z32-87. Leaf water potential varied between −1.93 MPa (Z59-7) to −0.89 MPa (HKI7660). The lowest leaf temperature waseported in HKI7660, while maximum was recorded in HKI-161.
0.4–155.6 10.239 12.48 0.864.67–84.2 8.588 20.62 0.674.8–118.4 9.534 16.45 0.78
The lowest stomatal conductance was found in NSJ-245, whilehigh stomatal conductance was in Z49-65. The osmotic potentialvaried between −2.34 MPa to −0.85 MPa among genotypes acrossseasons under water stressed and well water trials. Under wellwatered trials, most of the morpho-physiological traits gave highervalues than under water stressed conditions and all these traitshad been adversely affected under water stressed including grainyield. The days for anthesis-silking interval increased under waterstressed trials and resulted in poor seed setting as compared towell watered trials. The means ASI varied widely with a maximumdifference of about 8.67 days under water stressed condition asagainst maximum of 4 days in well watered condition. In general,medium to high heritability (broad sense) were obtained for major-ity of morpho-physiological traits across seasons both under wellwatered and water stressed trials except for ASI under well wateredin 2012 wet season and for canopy temperature during 2013 wetseason under water stressed condition.
3.2. Drought susceptibility index (DSI)
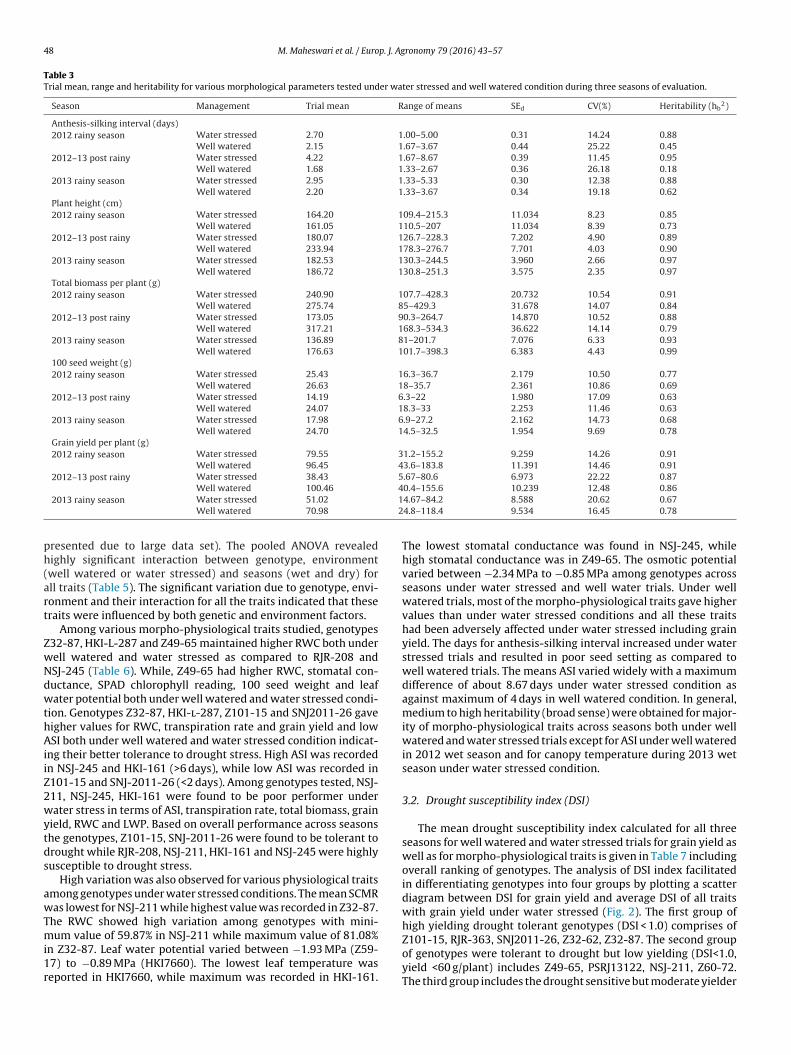
The mean drought susceptibility index calculated for all threeseasons for well watered and water stressed trials for grain yield aswell as for morpho-physiological traits is given in Table 7 includingoverall ranking of genotypes. The analysis of DSI index facilitatedin differentiating genotypes into four groups by plotting a scatterdiagram between DSI for grain yield and average DSI of all traitswith grain yield under water stressed (Fig. 2). The first group ofhigh yielding drought tolerant genotypes (DSI < 1.0) comprises of
Z101-15, RJR-363, SNJ2011-26, Z32-62, Z32-87. The second groupof genotypes were tolerant to drought but low yielding (DSI<1.0,yield <60 g/plant) includes Z49-65, PSRJ13122, NSJ-211, Z60-72.The third group includes the drought sensitive but moderate yielder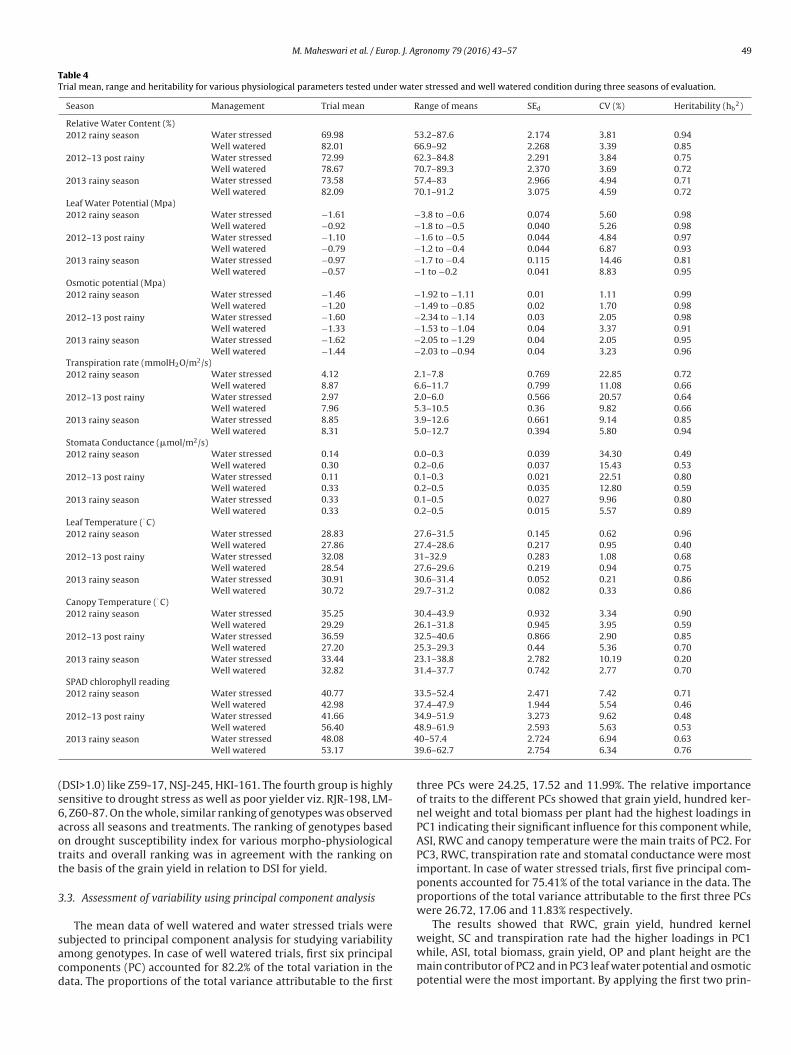
M. Maheswari et al. / Europ. J. Agronomy 79 (2016) 43–57 49
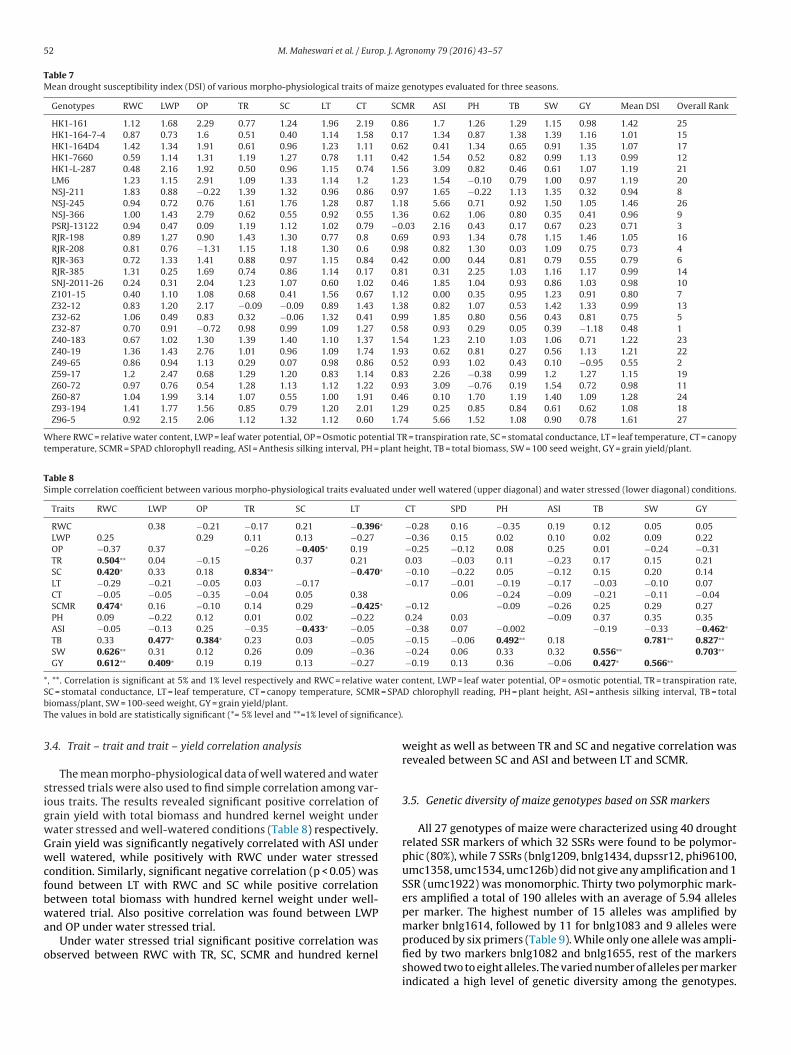
Table 4Trial mean, range and heritability for various physiological parameters tested under water stressed and well watered condition during three seasons of evaluation.
Season Management Trial mean Range of means SEd CV (%) Heritability (hb2)
Relative Water Content (%)2012 rainy season Water stressed 69.98 53.2–87.6 2.174 3.81 0.94
Well watered 82.01 66.9–92 2.268 3.39 0.852012–13 post rainy Water stressed 72.99 62.3–84.8 2.291 3.84 0.75
Well watered 78.67 70.7–89.3 2.370 3.69 0.722013 rainy season Water stressed 73.58 57.4–83 2.966 4.94 0.71
Well watered 82.09 70.1–91.2 3.075 4.59 0.72Leaf Water Potential (Mpa)2012 rainy season Water stressed −1.61 −3.8 to −0.6 0.074 5.60 0.98
Well watered −0.92 −1.8 to −0.5 0.040 5.26 0.982012–13 post rainy Water stressed −1.10 −1.6 to −0.5 0.044 4.84 0.97
Well watered −0.79 −1.2 to −0.4 0.044 6.87 0.932013 rainy season Water stressed −0.97 −1.7 to −0.4 0.115 14.46 0.81
Well watered −0.57 −1 to −0.2 0.041 8.83 0.95Osmotic potential (Mpa)2012 rainy season Water stressed −1.46 −1.92 to −1.11 0.01 1.11 0.99
Well watered −1.20 −1.49 to −0.85 0.02 1.70 0.982012–13 post rainy Water stressed −1.60 −2.34 to −1.14 0.03 2.05 0.98
Well watered −1.33 −1.53 to −1.04 0.04 3.37 0.912013 rainy season Water stressed −1.62 −2.05 to −1.29 0.04 2.05 0.95
Well watered −1.44 −2.03 to −0.94 0.04 3.23 0.96Transpiration rate (mmolH2O/m2/s)2012 rainy season Water stressed 4.12 2.1–7.8 0.769 22.85 0.72
Well watered 8.87 6.6–11.7 0.799 11.08 0.662012–13 post rainy Water stressed 2.97 2.0–6.0 0.566 20.57 0.64
Well watered 7.96 5.3–10.5 0.36 9.82 0.662013 rainy season Water stressed 8.85 3.9–12.6 0.661 9.14 0.85
Well watered 8.31 5.0–12.7 0.394 5.80 0.94Stomata Conductance (�mol/m2/s)2012 rainy season Water stressed 0.14 0.0–0.3 0.039 34.30 0.49
Well watered 0.30 0.2–0.6 0.037 15.43 0.532012–13 post rainy Water stressed 0.11 0.1–0.3 0.021 22.51 0.80
Well watered 0.33 0.2–0.5 0.035 12.80 0.592013 rainy season Water stressed 0.33 0.1–0.5 0.027 9.96 0.80
Well watered 0.33 0.2–0.5 0.015 5.57 0.89Leaf Temperature (◦ C)2012 rainy season Water stressed 28.83 27.6–31.5 0.145 0.62 0.96
Well watered 27.86 27.4–28.6 0.217 0.95 0.402012–13 post rainy Water stressed 32.08 31–32.9 0.283 1.08 0.68
Well watered 28.54 27.6–29.6 0.219 0.94 0.752013 rainy season Water stressed 30.91 30.6–31.4 0.052 0.21 0.86
Well watered 30.72 29.7–31.2 0.082 0.33 0.86Canopy Temperature (◦ C)2012 rainy season Water stressed 35.25 30.4–43.9 0.932 3.34 0.90
Well watered 29.29 26.1–31.8 0.945 3.95 0.592012–13 post rainy Water stressed 36.59 32.5–40.6 0.866 2.90 0.85
Well watered 27.20 25.3–29.3 0.44 5.36 0.702013 rainy season Water stressed 33.44 23.1–38.8 2.782 10.19 0.20
Well watered 32.82 31.4–37.7 0.742 2.77 0.70SPAD chlorophyll reading2012 rainy season Water stressed 40.77 33.5–52.4 2.471 7.42 0.71
Well watered 42.98 37.4–47.9 1.944 5.54 0.462012–13 post rainy Water stressed 41.66 34.9–51.9 3.273 9.62 0.48
443
(s6aott
3
sacd
Well watered 56.40
2013 rainy season Water stressed 48.08
Well watered 53.17
DSI>1.0) like Z59-17, NSJ-245, HKI-161. The fourth group is highlyensitive to drought stress as well as poor yielder viz. RJR-198, LM-, Z60-87. On the whole, similar ranking of genotypes was observedcross all seasons and treatments. The ranking of genotypes basedn drought susceptibility index for various morpho-physiologicalraits and overall ranking was in agreement with the ranking onhe basis of the grain yield in relation to DSI for yield.
.3. Assessment of variability using principal component analysis
The mean data of well watered and water stressed trials were
ubjected to principal component analysis for studying variabilitymong genotypes. In case of well watered trials, first six principalomponents (PC) accounted for 82.2% of the total variation in theata. The proportions of the total variance attributable to the first8.9–61.9 2.593 5.63 0.530–57.4 2.724 6.94 0.639.6–62.7 2.754 6.34 0.76
three PCs were 24.25, 17.52 and 11.99%. The relative importanceof traits to the different PCs showed that grain yield, hundred ker-nel weight and total biomass per plant had the highest loadings inPC1 indicating their significant influence for this component while,ASI, RWC and canopy temperature were the main traits of PC2. ForPC3, RWC, transpiration rate and stomatal conductance were mostimportant. In case of water stressed trials, first five principal com-ponents accounted for 75.41% of the total variance in the data. Theproportions of the total variance attributable to the first three PCswere 26.72, 17.06 and 11.83% respectively.
The results showed that RWC, grain yield, hundred kernel
weight, SC and transpiration rate had the higher loadings in PC1while, ASI, total biomass, grain yield, OP and plant height are themain contributor of PC2 and in PC3 leaf water potential and osmoticpotential were the most important. By applying the first two prin-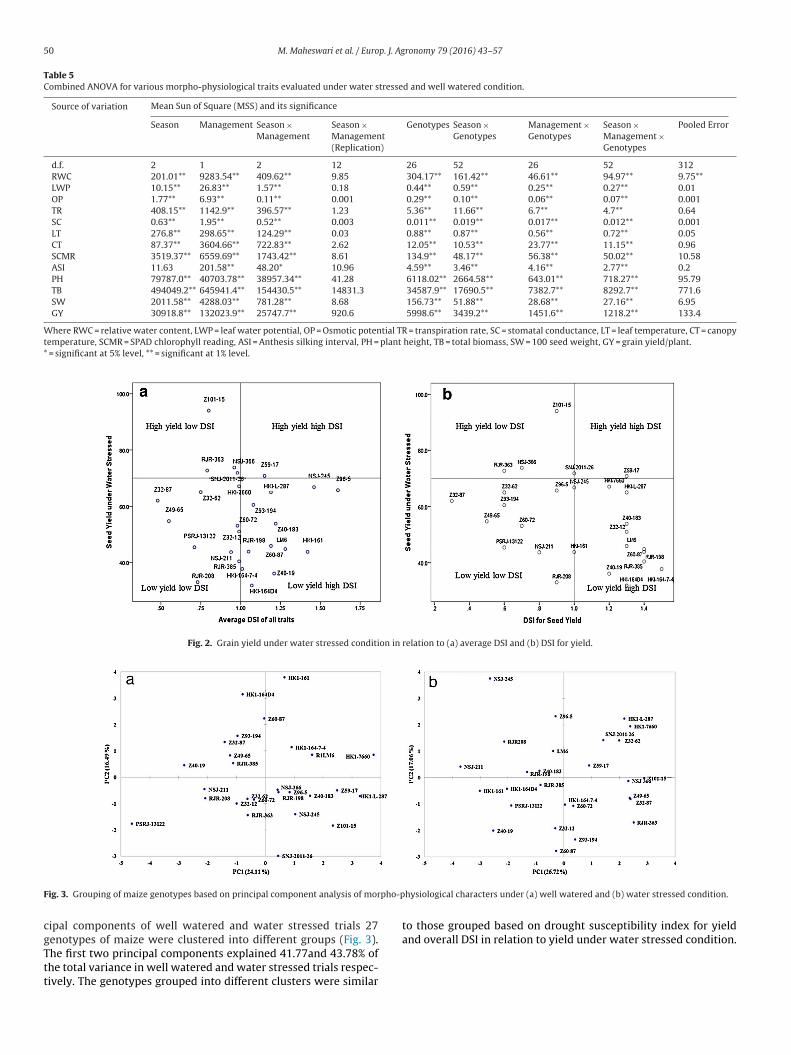
50 M. Maheswari et al. / Europ. J. Agronomy 79 (2016) 43–57
Table 5Combined ANOVA for various morpho-physiological traits evaluated under water stressed and well watered condition.
Source of variation Mean Sun of Square (MSS) and its significance
Season Management Season ×Management
Season ×Management(Replication)
Genotypes Season ×Genotypes
Management ×Genotypes
Season ×Management ×Genotypes
Pooled Error
d.f. 2 1 2 12 26 52 26 52 312RWC 201.01** 9283.54** 409.62** 9.85 304.17** 161.42** 46.61** 94.97** 9.75**LWP 10.15** 26.83** 1.57** 0.18 0.44** 0.59** 0.25** 0.27** 0.01OP 1.77** 6.93** 0.11** 0.001 0.29** 0.10** 0.06** 0.07** 0.001TR 408.15** 1142.9** 396.57** 1.23 5.36** 11.66** 6.7** 4.7** 0.64SC 0.63** 1.95** 0.52** 0.003 0.011** 0.019** 0.017** 0.012** 0.001LT 276.8** 298.65** 124.29** 0.03 0.88** 0.87** 0.56** 0.72** 0.05CT 87.37** 3604.66** 722.83** 2.62 12.05** 10.53** 23.77** 11.15** 0.96SCMR 3519.37** 6559.69** 1743.42** 8.61 134.9** 48.17** 56.38** 50.02** 10.58ASI 11.63 201.58** 48.20* 10.96 4.59** 3.46** 4.16** 2.77** 0.2PH 79787.0** 40703.78** 38957.34** 41.28 6118.02** 2664.58** 643.01** 718.27** 95.79TB 494049.2** 645941.4** 154430.5** 14831.3 34587.9** 17690.5** 7382.7** 8292.7** 771.6SW 2011.58** 4288.03** 781.28** 8.68 156.73** 51.88** 28.68** 27.16** 6.95GY 30918.8** 132023.9** 25747.7** 920.6 5998.6** 3439.2** 1451.6** 1218.2** 133.4
Where RWC = relative water content, LWP = leaf water potential, OP = Osmotic potential TR = transpiration rate, SC = stomatal conductance, LT = leaf temperature, CT = canopytemperature, SCMR = SPAD chlorophyll reading, ASI = Anthesis silking interval, PH = plant height, TB = total biomass, SW = 100 seed weight, GY = grain yield/plant.* = significant at 5% level, ** = significant at 1% level.
Fig. 2. Grain yield under water stressed condition in relation to (a) average DSI and (b) DSI for yield.
F pho-p
cgTtt
ig. 3. Grouping of maize genotypes based on principal component analysis of mor
ipal components of well watered and water stressed trials 27
enotypes of maize were clustered into different groups (Fig. 3).he first two principal components explained 41.77and 43.78% ofhe total variance in well watered and water stressed trials respec-ively. The genotypes grouped into different clusters were similarhysiological characters under (a) well watered and (b) water stressed condition.
to those grouped based on drought susceptibility index for yield
and overall DSI in relation to yield under water stressed condition.
M.
Mahesw
ari et
al. /
Europ. J.
Agronom
y 79
(2016) 43–57
51
Table 6Trial means of morpho-physiological and yield related traits in 27 genotypes evaluated under well watered and water stressed conditions for three seasons.
Genotypes RWC LWP OP TR SC LT CT SCMR ASI PH TB SW GY
WW WS WW WS WW WS WW WS WW WS WW WS WW WS WW WS WW WS WW WS WW WS WW WS WW WS
HKI161 84.2 73.1 −0.7 −1.4 −1.2 −1.4 7.0 5.0 0.4 0.2 28.8 31.5 28.1 38.6 44.6 38.9 2.2 4.3 168.9 147.3 256.0 150.7 26.6 18.8 71.6 43.8HKI16474 82.8 74.8 −0.7 −1.0 −1.3 −1.4 7.2 5.5 0.3 0.2 28.9 30.5 29.6 37.6 52.2 49.8 2.0 2.7 195.6 178.4 325.6 177.4 26.4 17.2 81.6 37.7HKI164D4 81.4 68.2 −0.7 −1.1 −1.1 −1.2 7.8 6.1 0.3 0.2 29.2 31.0 29.4 34.9 49.0 44.7 2.4 3.3 175.4 152.9 217.2 175.9 21.6 16.5 62.2 31.8HKI7660 85.3 79.6 −0.6 −0.9 −1.3 −1.4 9.5 5.1 0.4 0.2 28.9 30.0 28.8 33.9 53.5 48.7 1.7 3.0 190.3 176.2 332.0 242.4 29.0 22.9 120.9 67.1HKIL287 83.0 78.5 −0.6 −1.3 −1.3 −1.5 9.4 6.8 0.4 0.2 29.0 30.6 30.2 33.7 51.1 39.5 1.8 5.3 212.5 192.5 340.6 259.8 28.7 25.1 122.1 65.0NSJ211 75.5 59.9 −0.7 −1.1 −1.3 −1.3 9.2 4.6 0.3 0.2 29.2 30.6 29.9 34.4 46.5 38.6 2.0 3.7 182.6 175.6 209.1 128.9 17.9 12.5 61.4 43.7NSJ245 74.4 66.4 −0.7 −1.0 −1.2 −1.3 8.3 3.2 0.4 0.1 28.8 30.6 30.8 35.5 51.9 42.8 2.1 5.7 212.1 193.8 284.1 201.6 25.9 17.1 108.5 66.8NSJ366 79.6 70.9 −0.6 −1.0 −1.4 −1.6 8.5 6.3 0.3 0.2 29.0 30.3 30.2 33.0 54.3 44.2 2.2 3.0 197.0 173.8 268.6 177.1 25.0 22.7 97.8 73.8PSRJ13122 79.3 70.9 −1.0 −1.3 −1.7 −1.6 8.7 4.8 0.3 0.1 29.3 30.8 30.5 34.6 43.4 42.7 1.7 3.0 157.9 150.5 145.6 121.7 19.6 16.3 59.2 45.4LM6 79.3 68.4 −0.8 −1.4 −1.2 −1.5 8.7 5.3 0.3 0.2 29.1 30.7 29.5 35.3 52.3 42.1 2.0 2.7 188.6 190.3 309.8 226.1 30.0 22.9 91.3 45.9RJR198 76.4 69.0 −0.7 −1.4 −1.3 −1.4 9.7 4.5 0.3 0.2 29.3 30.4 30.0 34.1 50.4 45.0 1.8 3.0 170.5 149.1 245.2 182.4 26.3 19.3 92.6 43.9RJR363 82.9 76.4 −0.8 −1.3 −1.4 −1.6 8.8 6.1 0.4 0.2 28.6 30.2 29.9 33.9 47.7 44.7 1.6 1.7 202.7 188.2 208.0 156.8 21.9 17.7 94.7 72.7RJR385 82.2 70.1 −1.0 −1.1 −1.3 −1.4 8.5 5.3 0.3 0.2 29.0 30.6 29.2 29.8 50.3 43.9 2.4 2.3 210.5 162.0 245.6 163.2 22.0 15.3 81.0 40.4RJR208 73.1 66.7 −1.1 −1.5 −1.6 −1.4 8.7 4.8 0.3 0.2 28.9 30.7 30.4 33.5 50.7 43.5 2.4 3.7 242.9 211.1 183.9 173.4 25.7 17.9 48.3 33.0SNJ201126 75.7 73.7 −0.9 −1.1 −1.3 −1.5 8.5 4.7 0.3 0.2 29.4 30.3 29.9 34.9 46.5 42.5 1.7 2.3 239.0 214.0 286.1 188.2 27.5 22.0 113.4 71.8Z10115 80.9 77.3 −0.7 −1.0 −1.4 −1.4 8.1 6.1 0.3 0.2 29.0 31.2 30.0 33.5 52.0 42.3 1.8 1.3 212.2 196.7 332.0 224.0 29.8 21.1 139.3 94.0Z3212 76.1 69.3 −0.8 −1.4 −1.4 −1.6 6.8 5.9 0.2 0.2 29.5 30.8 29.9 37.2 52.6 41.8 1.9 2.3 183.0 161.8 254.0 213.1 24.2 16.1 101.8 51.0Z3262 85.3 75.4 −0.7 −1.0 −1.5 −1.5 7.4 5.8 0.3 0.2 28.7 30.5 31.4 32.8 47.2 40.3 1.9 4.0 207.5 189.2 271.1 234.3 24.3 21.9 84.8 65.0Z3287 87.9 81.1 −0.8 −1.2 −1.8 −1.7 8.5 5.5 0.3 0.2 29.0 30.5 29.8 36.3 56.5 51.0 2.1 3.0 165.5 160.9 192.2 177.9 23.6 21.1 69.8 88.7Z40183 77.3 71.5 −0.8 −1.2 −1.4 −1.5 9.5 4.9 0.3 0.2 29.1 30.7 29.1 35.7 52.9 41.5 1.9 3.3 212.7 171.0 317.3 174.1 27.1 19.4 100.2 53.8Z4019 78.6 65.6 −0.9 −1.7 −1.4 −1.7 7.4 4.7 0.3 0.2 29.3 30.8 29.6 38.0 55.1 39.4 1.9 2.3 180.8 163.5 154.2 143.1 19.7 17.4 65.2 36.1Z4965 86.6 78.3 −0.6 −1.0 −1.5 −1.5 7.2 6.1 0.3 0.2 28.7 30.1 30.0 34.3 51.4 46.8 2.1 3.3 190.4 174.7 193.9 133.2 23.9 22.0 68.2 54.7Z5917 84.1 72.6 −0.7 −1.9 −1.6 −1.6 9.2 4.9 0.3 0.2 29.4 30.6 29.3 35.0 52.2 45.0 2.1 3.0 195.4 195.5 347.4 239.3 29.9 21.5 135.0 70.8Z6072 81.3 72.1 −0.7 −1.1 −1.6 −1.7 9.7 5.6 0.4 0.2 29.2 30.8 30.1 36.6 49.4 42.3 1.7 3.0 178.6 181.5 221.3 213.1 26.4 16.5 72.2 53.1Z6087 83.3 73.2 −0.8 −1.4 −1.3 −1.7 7.8 5.5 0.3 0.2 29.2 30.6 28.6 37.8 53.3 49.5 2.7 3.0 192.4 161.3 269.0 131.0 25.3 16.5 90.1 44.8Z93194 86.6 73.0 −0.8 −1.5 −1.4 −1.6 8.5 6.0 0.3 0.2 29.0 30.7 29.4 39.3 52.2 42.6 2.4 2.3 182.1 169.2 251.3 184.9 21.2 17.9 77.6 60.5Z965 81.8 73.2 −0.8 −1.1 −1.4 −1.6 7.5 4.3 0.3 0.2 28.7 30.2 30.2 33.2 53.7 40.5 1.8 5.7 188.3 160.1 265.1 163.8 29.3 22.6 100.1 65.7GM 80.9 72.2 −0.8 −1.2 −1.4 −1.5 8.4 5.3 0.3 0.2 29.0 30.6 29.8 35.1 50.9 43.5 2.0 3.3 193.9 175.6 256.5 183.6 25.1 19.2 89.3 56.3SEd 1.5 1.4 0.001 0.5 0.8 0.8 0.5 0.4 0.5 0.5 0.5 0.5 0.5 0.5 0.5 1.6 0.2 0.2 0.5 0.5 0.5 0.5 1.3 1.2 6.0 4.8CV 3.9 4.2 6.7 6.6 1.7 1.1 8.2 15.5 9.3 17.2 0.6 0.4 2.7 4.0 5.8 8.0 23.4 12.6 3.8 4.3 8.2 8.6 10.7 13.5 14.3 18.1LSD 3.0 2.9 0 0.9 1.6 1.6 0.9 0.8 0.9 0.9 0.9 0.9 0.9 0.9 0.9 3.2 0.4 0.4 0.9 0.9 0.9 0.9 2.5 2.4 11.9 9.5
Where RWC = relative water content, LWP = leaf water potential, OP = Osmotic potential TR = transpiration rate, SC = stomatal conductance, LT = leaf temperature, CT = canopy temperature, SCMR = SPAD chlorophyll reading,ASI = Anthesis silking interval, PH = plant height, TB = total biomass, SW = 100 seed weight, GY = grain yield/plant.
52 M. Maheswari et al. / Europ. J. Agronomy 79 (2016) 43–57
Table 7Mean drought susceptibility index (DSI) of various morpho-physiological traits of maize genotypes evaluated for three seasons.
Genotypes RWC LWP OP TR SC LT CT SCMR ASI PH TB SW GY Mean DSI Overall Rank
HK1-161 1.12 1.68 2.29 0.77 1.24 1.96 2.19 0.86 1.7 1.26 1.29 1.15 0.98 1.42 25HK1-164-7-4 0.87 0.73 1.6 0.51 0.40 1.14 1.58 0.17 1.34 0.87 1.38 1.39 1.16 1.01 15HK1-164D4 1.42 1.34 1.91 0.61 0.96 1.23 1.11 0.62 0.41 1.34 0.65 0.91 1.35 1.07 17HK1-7660 0.59 1.14 1.31 1.19 1.27 0.78 1.11 0.42 1.54 0.52 0.82 0.99 1.13 0.99 12HK1-L-287 0.48 2.16 1.92 0.50 0.96 1.15 0.74 1.56 3.09 0.82 0.46 0.61 1.07 1.19 21LM6 1.23 1.15 2.91 1.09 1.33 1.14 1.2 1.23 1.54 −0.10 0.79 1.00 0.97 1.19 20NSJ-211 1.83 0.88 −0.22 1.39 1.32 0.96 0.86 0.97 1.65 −0.22 1.13 1.35 0.32 0.94 8NSJ-245 0.94 0.72 0.76 1.61 1.76 1.28 0.87 1.18 5.66 0.71 0.92 1.50 1.05 1.46 26NSJ-366 1.00 1.43 2.79 0.62 0.55 0.92 0.55 1.36 0.62 1.06 0.80 0.35 0.41 0.96 9PSRJ-13122 0.94 0.47 0.09 1.19 1.12 1.02 0.79 −0.03 2.16 0.43 0.17 0.67 0.23 0.71 3RJR-198 0.89 1.27 0.90 1.43 1.30 0.77 0.8 0.69 0.93 1.34 0.78 1.15 1.46 1.05 16RJR-208 0.81 0.76 −1.31 1.15 1.18 1.30 0.6 0.98 0.82 1.30 0.03 1.09 0.75 0.73 4RJR-363 0.72 1.33 1.41 0.88 0.97 1.15 0.84 0.42 0.00 0.44 0.81 0.79 0.55 0.79 6RJR-385 1.31 0.25 1.69 0.74 0.86 1.14 0.17 0.81 0.31 2.25 1.03 1.16 1.17 0.99 14SNJ-2011-26 0.24 0.31 2.04 1.23 1.07 0.60 1.02 0.46 1.85 1.04 0.93 0.86 1.03 0.98 10Z101-15 0.40 1.10 1.08 0.68 0.41 1.56 0.67 1.12 0.00 0.35 0.95 1.23 0.91 0.80 7Z32-12 0.83 1.20 2.17 −0.09 −0.09 0.89 1.43 1.38 0.82 1.07 0.53 1.42 1.33 0.99 13Z32-62 1.06 0.49 0.83 0.32 −0.06 1.32 0.41 0.99 1.85 0.80 0.56 0.43 0.81 0.75 5Z32-87 0.70 0.91 −0.72 0.98 0.99 1.09 1.27 0.58 0.93 0.29 0.05 0.39 −1.18 0.48 1Z40-183 0.67 1.02 1.30 1.39 1.40 1.10 1.37 1.54 1.23 2.10 1.03 1.06 0.71 1.22 23Z40-19 1.36 1.43 2.76 1.01 0.96 1.09 1.74 1.93 0.62 0.81 0.27 0.56 1.13 1.21 22Z49-65 0.86 0.94 1.13 0.29 0.07 0.98 0.86 0.52 0.93 1.02 0.43 0.10 −0.95 0.55 2Z59-17 1.2 2.47 0.68 1.29 1.20 0.83 1.14 0.83 2.26 −0.38 0.99 1.2 1.27 1.15 19Z60-72 0.97 0.76 0.54 1.28 1.13 1.12 1.22 0.93 3.09 −0.76 0.19 1.54 0.72 0.98 11Z60-87 1.04 1.99 3.14 1.07 0.55 1.00 1.91 0.46 0.10 1.70 1.19 1.40 1.09 1.28 24Z93-194 1.41 1.77 1.56 0.85 0.79 1.20 2.01 1.29 0.25 0.85 0.84 0.61 0.62 1.08 18Z96-5 0.92 2.15 2.06 1.12 1.32 1.12 0.60 1.74 5.66 1.52 1.08 0.90 0.78 1.61 27
Where RWC = relative water content, LWP = leaf water potential, OP = Osmotic potential TR = transpiration rate, SC = stomatal conductance, LT = leaf temperature, CT = canopytemperature, SCMR = SPAD chlorophyll reading, ASI = Anthesis silking interval, PH = plant height, TB = total biomass, SW = 100 seed weight, GY = grain yield/plant.
Table 8Simple correlation coefficient between various morpho-physiological traits evaluated under well watered (upper diagonal) and water stressed (lower diagonal) conditions.
Traits RWC LWP OP TR SC LT CT SPD PH ASI TB SW GY
RWC 0.38 −0.21 −0.17 0.21 −0.396∗ −0.28 0.16 −0.35 0.19 0.12 0.05 0.05LWP 0.25 0.29 0.11 0.13 −0.27 −0.36 0.15 0.02 0.10 0.02 0.09 0.22OP −0.37 0.37 −0.26 −0.405∗ 0.19 −0.25 −0.12 0.08 0.25 0.01 −0.24 −0.31TR 0.504∗∗ 0.04 −0.15 0.37 0.21 0.03 −0.03 0.11 −0.23 0.17 0.15 0.21SC 0.420∗ 0.33 0.18 0.834∗∗ −0.470∗ −0.10 −0.22 0.05 −0.12 0.15 0.20 0.14LT −0.29 −0.21 −0.05 0.03 −0.17 −0.17 −0.01 −0.19 −0.17 −0.03 −0.10 0.07CT −0.05 −0.05 −0.35 −0.04 0.05 0.38 0.06 −0.24 −0.09 −0.21 −0.11 −0.04SCMR 0.474∗ 0.16 −0.10 0.14 0.29 −0.425∗ −0.12 −0.09 −0.26 0.25 0.29 0.27PH 0.09 −0.22 0.12 0.01 0.02 −0.22 0.24 0.03 −0.09 0.37 0.35 0.35ASI −0.05 −0.13 0.25 −0.35 −0.433∗ −0.05 −0.38 0.07 −0.002 −0.19 −0.33 −0.462∗
TB 0.33 0.477∗ 0.384∗ 0.23 0.03 −0.05 −0.15 −0.06 0.492∗∗ 0.18 0.781∗∗ 0.827∗∗
SW 0.626∗∗ 0.31 0.12 0.26 0.09 −0.36 −0.24 0.06 0.33 0.32 0.556∗∗ 0.703∗∗
GY 0.612∗∗ 0.409∗ 0.19 0.19 0.13 −0.27 −0.19 0.13 0.36 −0.06 0.427∗ 0.566∗∗
*, **. Correlation is significant at 5% and 1% level respectively and RWC = relative water content, LWP = leaf water potential, OP = osmotic potential, TR = transpiration rate,S = SPAbT ance).
3
sigwGwcfbwa
o
C = stomatal conductance, LT = leaf temperature, CT = canopy temperature, SCMRiomass/plant, SW = 100-seed weight, GY = grain yield/plant.he values in bold are statistically significant (*= 5% level and **=1% level of signific
.4. Trait – trait and trait – yield correlation analysis
The mean morpho-physiological data of well watered and watertressed trials were also used to find simple correlation among var-ous traits. The results revealed significant positive correlation ofrain yield with total biomass and hundred kernel weight underater stressed and well-watered conditions (Table 8) respectively.rain yield was significantly negatively correlated with ASI underell watered, while positively with RWC under water stressed
ondition. Similarly, significant negative correlation (p < 0.05) wasound between LT with RWC and SC while positive correlationetween total biomass with hundred kernel weight under well-atered trial. Also positive correlation was found between LWP
nd OP under water stressed trial.
Under water stressed trial significant positive correlation wasbserved between RWC with TR, SC, SCMR and hundred kernel
D chlorophyll reading, PH = plant height, ASI = anthesis silking interval, TB = total
weight as well as between TR and SC and negative correlation wasrevealed between SC and ASI and between LT and SCMR.
3.5. Genetic diversity of maize genotypes based on SSR markers
All 27 genotypes of maize were characterized using 40 droughtrelated SSR markers of which 32 SSRs were found to be polymor-phic (80%), while 7 SSRs (bnlg1209, bnlg1434, dupssr12, phi96100,umc1358, umc1534, umc126b) did not give any amplification and 1SSR (umc1922) was monomorphic. Thirty two polymorphic mark-ers amplified a total of 190 alleles with an average of 5.94 allelesper marker. The highest number of 15 alleles was amplified bymarker bnlg1614, followed by 11 for bnlg1083 and 9 alleles were
produced by six primers (Table 9). While only one allele was ampli-fied by two markers bnlg1082 and bnlg1655, rest of the markersshowed two to eight alleles. The varied number of alleles per markerindicated a high level of genetic diversity among the genotypes.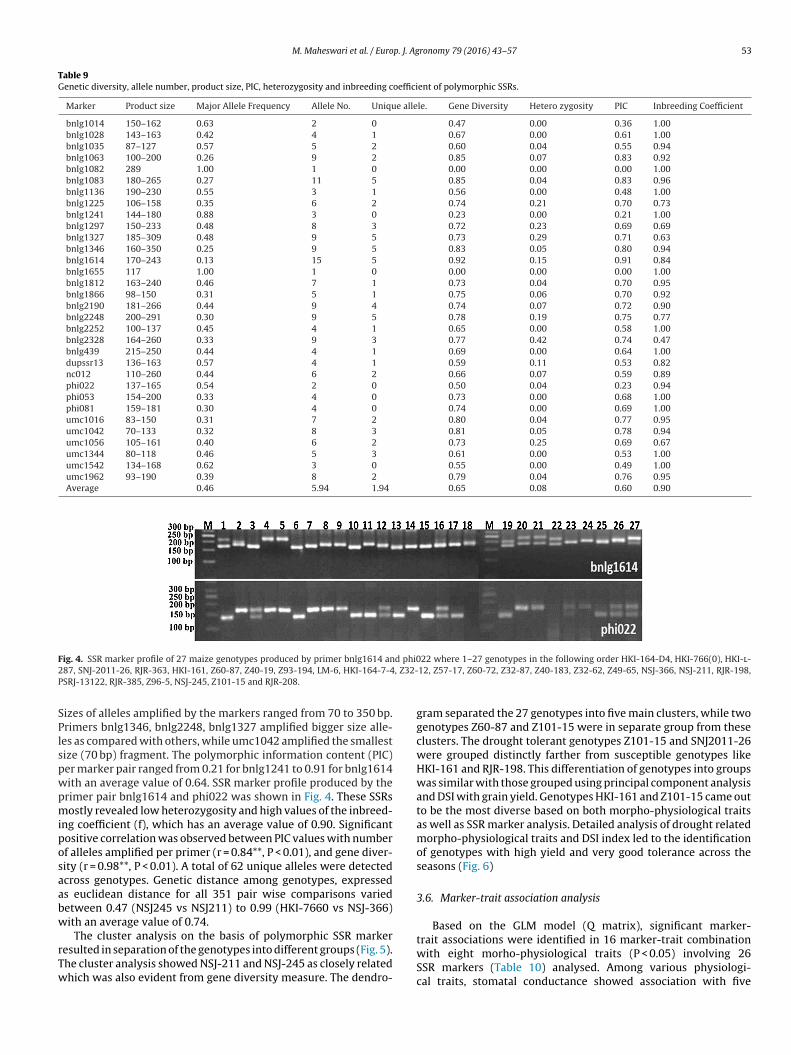
M. Maheswari et al. / Europ. J. Agronomy 79 (2016) 43–57 53
Table 9Genetic diversity, allele number, product size, PIC, heterozygosity and inbreeding coefficient of polymorphic SSRs.
Marker Product size Major Allele Frequency Allele No. Unique allele. Gene Diversity Hetero zygosity PIC Inbreeding Coefficient
bnlg1014 150–162 0.63 2 0 0.47 0.00 0.36 1.00bnlg1028 143–163 0.42 4 1 0.67 0.00 0.61 1.00bnlg1035 87–127 0.57 5 2 0.60 0.04 0.55 0.94bnlg1063 100–200 0.26 9 2 0.85 0.07 0.83 0.92bnlg1082 289 1.00 1 0 0.00 0.00 0.00 1.00bnlg1083 180–265 0.27 11 5 0.85 0.04 0.83 0.96bnlg1136 190–230 0.55 3 1 0.56 0.00 0.48 1.00bnlg1225 106–158 0.35 6 2 0.74 0.21 0.70 0.73bnlg1241 144–180 0.88 3 0 0.23 0.00 0.21 1.00bnlg1297 150–233 0.48 8 3 0.72 0.23 0.69 0.69bnlg1327 185–309 0.48 9 5 0.73 0.29 0.71 0.63bnlg1346 160–350 0.25 9 5 0.83 0.05 0.80 0.94bnlg1614 170–243 0.13 15 5 0.92 0.15 0.91 0.84bnlg1655 117 1.00 1 0 0.00 0.00 0.00 1.00bnlg1812 163–240 0.46 7 1 0.73 0.04 0.70 0.95bnlg1866 98–150 0.31 5 1 0.75 0.06 0.70 0.92bnlg2190 181–266 0.44 9 4 0.74 0.07 0.72 0.90bnlg2248 200–291 0.30 9 5 0.78 0.19 0.75 0.77bnlg2252 100–137 0.45 4 1 0.65 0.00 0.58 1.00bnlg2328 164–260 0.33 9 3 0.77 0.42 0.74 0.47bnlg439 215–250 0.44 4 1 0.69 0.00 0.64 1.00dupssr13 136–163 0.57 4 1 0.59 0.11 0.53 0.82nc012 110–260 0.44 6 2 0.66 0.07 0.59 0.89phi022 137–165 0.54 2 0 0.50 0.04 0.23 0.94phi053 154–200 0.33 4 0 0.73 0.00 0.68 1.00phi081 159–181 0.30 4 0 0.74 0.00 0.69 1.00umc1016 83–150 0.31 7 2 0.80 0.04 0.77 0.95umc1042 70–133 0.32 8 3 0.81 0.05 0.78 0.94umc1056 105–161 0.40 6 2 0.73 0.25 0.69 0.67umc1344 80–118 0.46 5 3 0.61 0.00 0.53 1.00umc1542 134–168 0.62 3 0 0.55 0.00 0.49 1.00umc1962 93–190 0.39 8 2 0.79 0.04 0.76 0.95Average 0.46 5.94 1.94 0.65 0.08 0.60 0.90
F d phi02 , Z32-P
SPlspwpmiposaabw
rTw
ig. 4. SSR marker profile of 27 maize genotypes produced by primer bnlg1614 an87, SNJ-2011-26, RJR-363, HKI-161, Z60-87, Z40-19, Z93-194, LM-6, HKI-164-7-4SRJ-13122, RJR-385, Z96-5, NSJ-245, Z101-15 and RJR-208.
izes of alleles amplified by the markers ranged from 70 to 350 bp.rimers bnlg1346, bnlg2248, bnlg1327 amplified bigger size alle-
es as compared with others, while umc1042 amplified the smallestize (70 bp) fragment. The polymorphic information content (PIC)er marker pair ranged from 0.21 for bnlg1241 to 0.91 for bnlg1614ith an average value of 0.64. SSR marker profile produced by the
rimer pair bnlg1614 and phi022 was shown in Fig. 4. These SSRsostly revealed low heterozygosity and high values of the inbreed-
ng coefficient (f), which has an average value of 0.90. Significantositive correlation was observed between PIC values with numberf alleles amplified per primer (r = 0.84**, P < 0.01), and gene diver-ity (r = 0.98**, P < 0.01). A total of 62 unique alleles were detectedcross genotypes. Genetic distance among genotypes, expresseds euclidean distance for all 351 pair wise comparisons variedetween 0.47 (NSJ245 vs NSJ211) to 0.99 (HKI-7660 vs NSJ-366)ith an average value of 0.74.
The cluster analysis on the basis of polymorphic SSR markeresulted in separation of the genotypes into different groups (Fig. 5).he cluster analysis showed NSJ-211 and NSJ-245 as closely relatedhich was also evident from gene diversity measure. The dendro-
22 where 1–27 genotypes in the following order HKI-164-D4, HKI-766(0), HKI-l-12, Z57-17, Z60-72, Z32-87, Z40-183, Z32-62, Z49-65, NSJ-366, NSJ-211, RJR-198,
gram separated the 27 genotypes into five main clusters, while twogenotypes Z60-87 and Z101-15 were in separate group from theseclusters. The drought tolerant genotypes Z101-15 and SNJ2011-26were grouped distinctly farther from susceptible genotypes likeHKI-161 and RJR-198. This differentiation of genotypes into groupswas similar with those grouped using principal component analysisand DSI with grain yield. Genotypes HKI-161 and Z101-15 came outto be the most diverse based on both morpho-physiological traitsas well as SSR marker analysis. Detailed analysis of drought relatedmorpho-physiological traits and DSI index led to the identificationof genotypes with high yield and very good tolerance across theseasons (Fig. 6)
3.6. Marker-trait association analysis
Based on the GLM model (Q matrix), significant marker-
trait associations were identified in 16 marker-trait combinationwith eight morho-physiological traits (P < 0.05) involving 26SSR markers (Table 10) analysed. Among various physiologi-cal traits, stomatal conductance showed association with five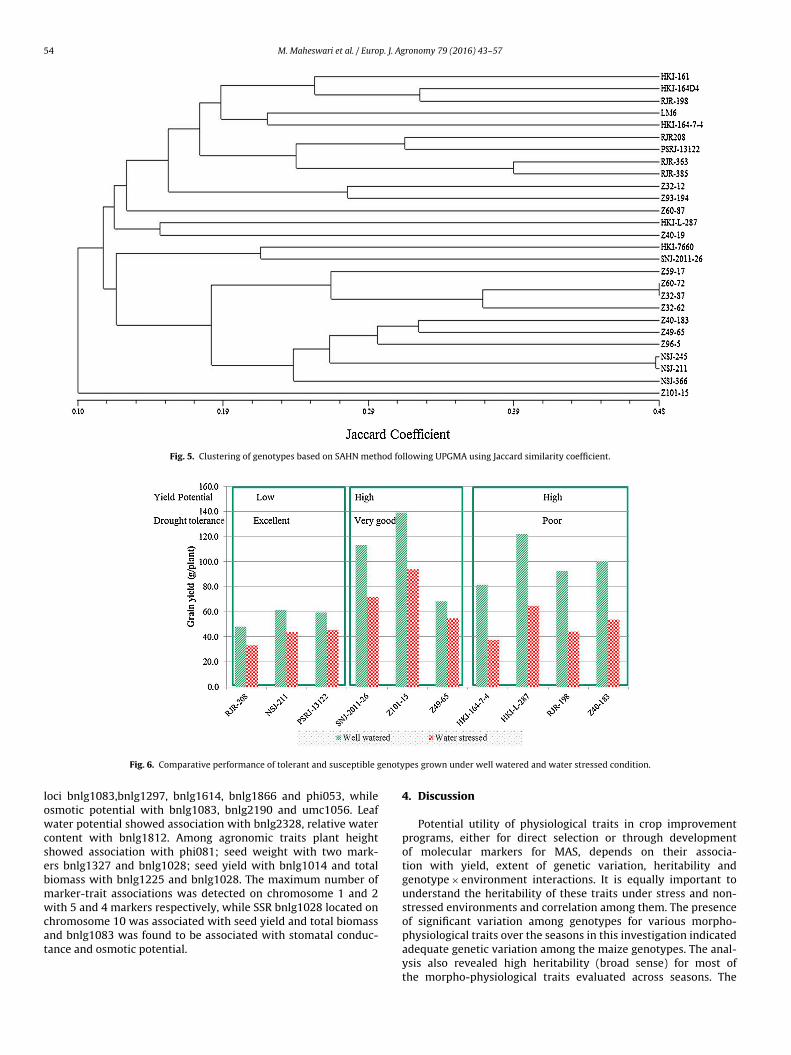
54 M. Maheswari et al. / Europ. J. Agronomy 79 (2016) 43–57
Fig. 5. Clustering of genotypes based on SAHN method following UPGMA using Jaccard similarity coefficient.
enoty
lowcsebmwcat
Fig. 6. Comparative performance of tolerant and susceptible g
oci bnlg1083,bnlg1297, bnlg1614, bnlg1866 and phi053, whilesmotic potential with bnlg1083, bnlg2190 and umc1056. Leafater potential showed association with bnlg2328, relative water
ontent with bnlg1812. Among agronomic traits plant heighthowed association with phi081; seed weight with two mark-rs bnlg1327 and bnlg1028; seed yield with bnlg1014 and totaliomass with bnlg1225 and bnlg1028. The maximum number ofarker-trait associations was detected on chromosome 1 and 2ith 5 and 4 markers respectively, while SSR bnlg1028 located on
hromosome 10 was associated with seed yield and total biomass
nd bnlg1083 was found to be associated with stomatal conduc-ance and osmotic potential.pes grown under well watered and water stressed condition.
4. Discussion
Potential utility of physiological traits in crop improvementprograms, either for direct selection or through developmentof molecular markers for MAS, depends on their associa-tion with yield, extent of genetic variation, heritability andgenotype × environment interactions. It is equally important tounderstand the heritability of these traits under stress and non-stressed environments and correlation among them. The presenceof significant variation among genotypes for various morpho-
physiological traits over the seasons in this investigation indicatedadequate genetic variation among the maize genotypes. The anal-ysis also revealed high heritability (broad sense) for most ofthe morpho-physiological traits evaluated across seasons. The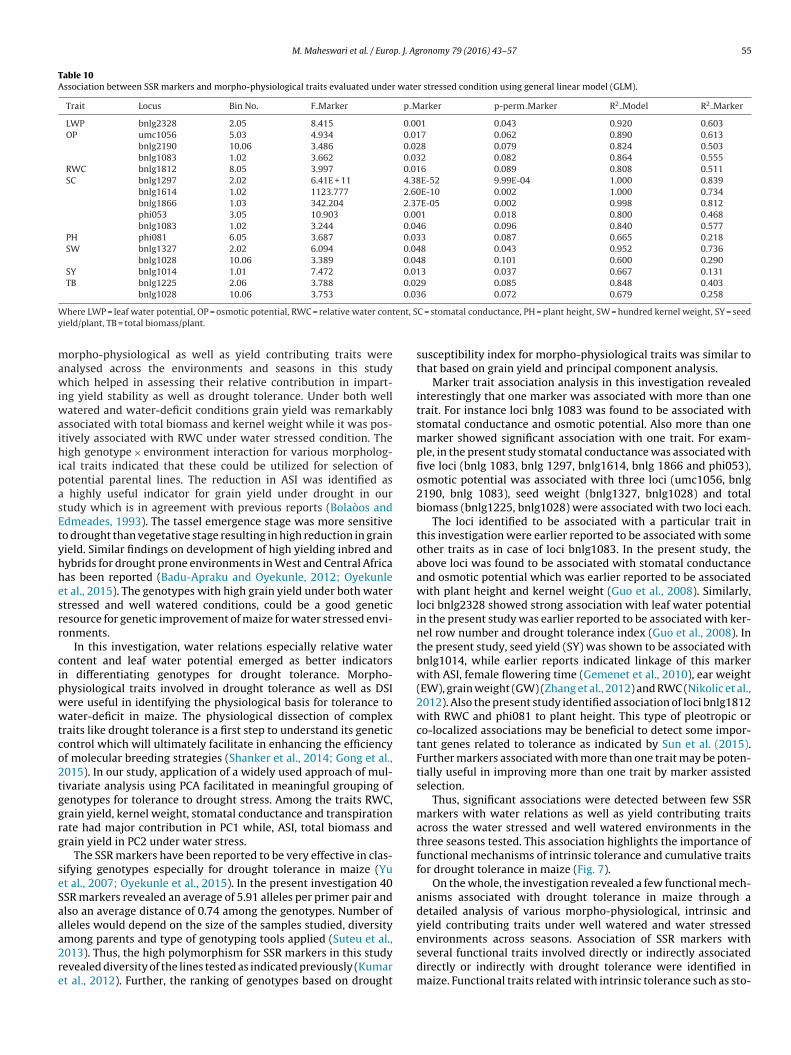
M. Maheswari et al. / Europ. J. Agronomy 79 (2016) 43–57 55
Table 10Association between SSR markers and morpho-physiological traits evaluated under water stressed condition using general linear model (GLM).
Trait Locus Bin No. F Marker p Marker p-perm Marker R2 Model R2 Marker
LWP bnlg2328 2.05 8.415 0.001 0.043 0.920 0.603OP umc1056 5.03 4.934 0.017 0.062 0.890 0.613
bnlg2190 10.06 3.486 0.028 0.079 0.824 0.503bnlg1083 1.02 3.662 0.032 0.082 0.864 0.555
RWC bnlg1812 8.05 3.997 0.016 0.089 0.808 0.511SC bnlg1297 2.02 6.41E + 11 4.38E-52 9.99E-04 1.000 0.839
bnlg1614 1.02 1123.777 2.60E-10 0.002 1.000 0.734bnlg1866 1.03 342.204 2.37E-05 0.002 0.998 0.812phi053 3.05 10.903 0.001 0.018 0.800 0.468bnlg1083 1.02 3.244 0.046 0.096 0.840 0.577
PH phi081 6.05 3.687 0.033 0.087 0.665 0.218SW bnlg1327 2.02 6.094 0.048 0.043 0.952 0.736
bnlg1028 10.06 3.389 0.048 0.101 0.600 0.290SY bnlg1014 1.01 7.472 0.013 0.037 0.667 0.131TB bnlg1225 2.06 3.788 0.029 0.085 0.848 0.403
bnlg1028 10.06 3.753 0.036 0.072 0.679 0.258
W ent, Sy
mawiwaihipasEtyhhesrr
cipwwtco2tggrg
seSaaa2re
here LWP = leaf water potential, OP = osmotic potential, RWC = relative water contield/plant, TB = total biomass/plant.
orpho-physiological as well as yield contributing traits werenalysed across the environments and seasons in this studyhich helped in assessing their relative contribution in impart-
ng yield stability as well as drought tolerance. Under both wellatered and water-deficit conditions grain yield was remarkably
ssociated with total biomass and kernel weight while it was pos-tively associated with RWC under water stressed condition. Theigh genotype × environment interaction for various morpholog-
cal traits indicated that these could be utilized for selection ofotential parental lines. The reduction in ASI was identified as
highly useful indicator for grain yield under drought in ourtudy which is in agreement with previous reports (Bolaòos anddmeades, 1993). The tassel emergence stage was more sensitiveo drought than vegetative stage resulting in high reduction in grainield. Similar findings on development of high yielding inbred andybrids for drought prone environments in West and Central Africaas been reported (Badu-Apraku and Oyekunle, 2012; Oyekunlet al., 2015). The genotypes with high grain yield under both watertressed and well watered conditions, could be a good geneticesource for genetic improvement of maize for water stressed envi-onments.
In this investigation, water relations especially relative waterontent and leaf water potential emerged as better indicatorsn differentiating genotypes for drought tolerance. Morpho-hysiological traits involved in drought tolerance as well as DSIere useful in identifying the physiological basis for tolerance toater-deficit in maize. The physiological dissection of complex
raits like drought tolerance is a first step to understand its geneticontrol which will ultimately facilitate in enhancing the efficiencyf molecular breeding strategies (Shanker et al., 2014; Gong et al.,015). In our study, application of a widely used approach of mul-ivariate analysis using PCA facilitated in meaningful grouping ofenotypes for tolerance to drought stress. Among the traits RWC,rain yield, kernel weight, stomatal conductance and transpirationate had major contribution in PC1 while, ASI, total biomass andrain yield in PC2 under water stress.
The SSR markers have been reported to be very effective in clas-ifying genotypes especially for drought tolerance in maize (Yut al., 2007; Oyekunle et al., 2015). In the present investigation 40SR markers revealed an average of 5.91 alleles per primer pair andlso an average distance of 0.74 among the genotypes. Number oflleles would depend on the size of the samples studied, diversity
mong parents and type of genotyping tools applied (Suteu et al.,013). Thus, the high polymorphism for SSR markers in this studyevealed diversity of the lines tested as indicated previously (Kumart al., 2012). Further, the ranking of genotypes based on droughtC = stomatal conductance, PH = plant height, SW = hundred kernel weight, SY = seed
susceptibility index for morpho-physiological traits was similar tothat based on grain yield and principal component analysis.
Marker trait association analysis in this investigation revealedinterestingly that one marker was associated with more than onetrait. For instance loci bnlg 1083 was found to be associated withstomatal conductance and osmotic potential. Also more than onemarker showed significant association with one trait. For exam-ple, in the present study stomatal conductance was associated withfive loci (bnlg 1083, bnlg 1297, bnlg1614, bnlg 1866 and phi053),osmotic potential was associated with three loci (umc1056, bnlg2190, bnlg 1083), seed weight (bnlg1327, bnlg1028) and totalbiomass (bnlg1225, bnlg1028) were associated with two loci each.
The loci identified to be associated with a particular trait inthis investigation were earlier reported to be associated with someother traits as in case of loci bnlg1083. In the present study, theabove loci was found to be associated with stomatal conductanceand osmotic potential which was earlier reported to be associatedwith plant height and kernel weight (Guo et al., 2008). Similarly,loci bnlg2328 showed strong association with leaf water potentialin the present study was earlier reported to be associated with ker-nel row number and drought tolerance index (Guo et al., 2008). Inthe present study, seed yield (SY) was shown to be associated withbnlg1014, while earlier reports indicated linkage of this markerwith ASI, female flowering time (Gemenet et al., 2010), ear weight(EW), grain weight (GW) (Zhang et al., 2012) and RWC (Nikolic et al.,2012). Also the present study identified association of loci bnlg1812with RWC and phi081 to plant height. This type of pleotropic orco-localized associations may be beneficial to detect some impor-tant genes related to tolerance as indicated by Sun et al. (2015).Further markers associated with more than one trait may be poten-tially useful in improving more than one trait by marker assistedselection.
Thus, significant associations were detected between few SSRmarkers with water relations as well as yield contributing traitsacross the water stressed and well watered environments in thethree seasons tested. This association highlights the importance offunctional mechanisms of intrinsic tolerance and cumulative traitsfor drought tolerance in maize (Fig. 7).
On the whole, the investigation revealed a few functional mech-anisms associated with drought tolerance in maize through adetailed analysis of various morpho-physiological, intrinsic andyield contributing traits under well watered and water stressed
environments across seasons. Association of SSR markers withseveral functional traits involved directly or indirectly associateddirectly or indirectly with drought tolerance were identified inmaize. Functional traits related with intrinsic tolerance such as sto-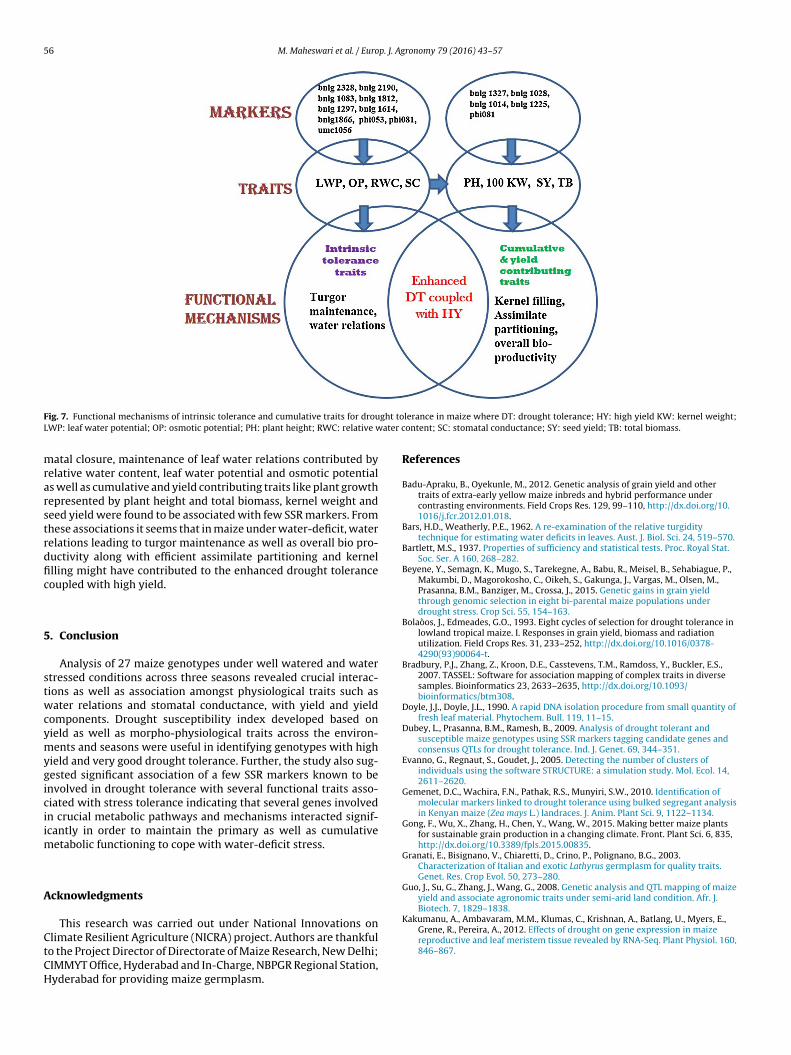
56 M. Maheswari et al. / Europ. J. Agronomy 79 (2016) 43–57
F ght toL ater c
mrarstrdfic
5
stwcymygiciim
A
CtCH
ig. 7. Functional mechanisms of intrinsic tolerance and cumulative traits for drouWP: leaf water potential; OP: osmotic potential; PH: plant height; RWC: relative w
atal closure, maintenance of leaf water relations contributed byelative water content, leaf water potential and osmotic potentials well as cumulative and yield contributing traits like plant growthepresented by plant height and total biomass, kernel weight andeed yield were found to be associated with few SSR markers. Fromhese associations it seems that in maize under water-deficit, waterelations leading to turgor maintenance as well as overall bio pro-uctivity along with efficient assimilate partitioning and kernellling might have contributed to the enhanced drought toleranceoupled with high yield.
. Conclusion
Analysis of 27 maize genotypes under well watered and watertressed conditions across three seasons revealed crucial interac-ions as well as association amongst physiological traits such asater relations and stomatal conductance, with yield and yield
omponents. Drought susceptibility index developed based onield as well as morpho-physiological traits across the environ-ents and seasons were useful in identifying genotypes with high
ield and very good drought tolerance. Further, the study also sug-ested significant association of a few SSR markers known to benvolved in drought tolerance with several functional traits asso-iated with stress tolerance indicating that several genes involvedn crucial metabolic pathways and mechanisms interacted signif-cantly in order to maintain the primary as well as cumulative
etabolic functioning to cope with water-deficit stress.
cknowledgments
This research was carried out under National Innovations on
limate Resilient Agriculture (NICRA) project. Authors are thankfulo the Project Director of Directorate of Maize Research, New Delhi;IMMYT Office, Hyderabad and In-Charge, NBPGR Regional Station,yderabad for providing maize germplasm.lerance in maize where DT: drought tolerance; HY: high yield KW: kernel weight;ontent; SC: stomatal conductance; SY: seed yield; TB: total biomass.
References
Badu-Apraku, B., Oyekunle, M., 2012. Genetic analysis of grain yield and othertraits of extra-early yellow maize inbreds and hybrid performance undercontrasting environments. Field Crops Res. 129, 99–110, http://dx.doi.org/10.1016/j.fcr.2012.01.018.
Bars, H.D., Weatherly, P.E., 1962. A re-examination of the relative turgiditytechnique for estimating water deficits in leaves. Aust. J. Biol. Sci. 24, 519–570.
Bartlett, M.S., 1937. Properties of sufficiency and statistical tests. Proc. Royal Stat.Soc. Ser. A 160, 268–282.
Beyene, Y., Semagn, K., Mugo, S., Tarekegne, A., Babu, R., Meisel, B., Sehabiague, P.,Makumbi, D., Magorokosho, C., Oikeh, S., Gakunga, J., Vargas, M., Olsen, M.,Prasanna, B.M., Banziger, M., Crossa, J., 2015. Genetic gains in grain yieldthrough genomic selection in eight bi-parental maize populations underdrought stress. Crop Sci. 55, 154–163.
Bolaòos, J., Edmeades, G.O., 1993. Eight cycles of selection for drought tolerance inlowland tropical maize. I. Responses in grain yield, biomass and radiationutilization. Field Crops Res. 31, 233–252, http://dx.doi.org/10.1016/0378-4290(93)90064-t.
Bradbury, P.J., Zhang, Z., Kroon, D.E., Casstevens, T.M., Ramdoss, Y., Buckler, E.S.,2007. TASSEL: Software for association mapping of complex traits in diversesamples. Bioinformatics 23, 2633–2635, http://dx.doi.org/10.1093/bioinformatics/btm308.
Doyle, J.J., Doyle, J.L., 1990. A rapid DNA isolation procedure from small quantity offresh leaf material. Phytochem. Bull. 119, 11–15.
Dubey, L., Prasanna, B.M., Ramesh, B., 2009. Analysis of drought tolerant andsusceptible maize genotypes using SSR markers tagging candidate genes andconsensus QTLs for drought tolerance. Ind. J. Genet. 69, 344–351.
Evanno, G., Regnaut, S., Goudet, J., 2005. Detecting the number of clusters ofindividuals using the software STRUCTURE: a simulation study. Mol. Ecol. 14,2611–2620.
Gemenet, D.C., Wachira, F.N., Pathak, R.S., Munyiri, S.W., 2010. Identification ofmolecular markers linked to drought tolerance using bulked segregant analysisin Kenyan maize (Zea mays L.) landraces. J. Anim. Plant Sci. 9, 1122–1134.
Gong, F., Wu, X., Zhang, H., Chen, Y., Wang, W., 2015. Making better maize plantsfor sustainable grain production in a changing climate. Front. Plant Sci. 6, 835,http://dx.doi.org/10.3389/fpls.2015.00835.
Granati, E., Bisignano, V., Chiaretti, D., Crino, P., Polignano, B.G., 2003.Characterization of Italian and exotic Lathyrus germplasm for quality traits.Genet. Res. Crop Evol. 50, 273–280.
Guo, J., Su, G., Zhang, J., Wang, G., 2008. Genetic analysis and QTL mapping of maizeyield and associate agronomic traits under semi-arid land condition. Afr. J.Biotech. 7, 1829–1838.
Kakumanu, A., Ambavaram, M.M., Klumas, C., Krishnan, A., Batlang, U., Myers, E.,Grene, R., Pereira, A., 2012. Effects of drought on gene expression in maize
reproductive and leaf meristem tissue revealed by RNA-Seq. Plant Physiol. 160,846–867.
p. J. Ag
K
K
L
L
M
M
M
M
N
N
O
P
P
P
M. Maheswari et al. / Euro
hanna Chopra, R., Maheswari, M., 1998. Effect of altering source availability onexpression of sink capacity in a maize hybrid and its parents. Eur. J. Agron. 9,101–107, http://dx.doi.org/10.1016/S1161-0301(98)00028-8.
umar, Ashish, Rakshit, A., Naresh Kumar, M., Varalaxmi, Y., Vijayalakshmi, T.,Vanaja, Jainender M., Yadav, S.K., Venkateswarlu, B., Maheswari, M., 2012.Genetic diversity of maize genotypes on the basis of morpho-physiological andSSR markers. Afr. J. Biotech. 11, 16468–16477, http://dx.doi.org/10.5897/AJB12.2367.
iu, K.J., Muse, S.V., 2005. PowerMarker: integrated analysis environment forgenetic marker data. Bioinformatics 21, 2128–2129.
u, J., 2004. PowerMarker V3.21 Manual, http://www.powermarker.net (verifiedon 23.11.04).
agorokosho, C., Pixley, K.V., Tongoona, P., 2003. Selection for drought tolerance intwo tropical maize populations. Afr. Crop Sci. J. 11, 151–161.
aheswari, M., Yadav, S.K., Shanker, A.K., Anil Kumar, M., Venkateswarlu, B., 2012.Overview of plant stresses: mechanisms, adaptations and research pursuit. In:Venkateswarlu, B., Shanker, Arun, Maheswari, M. (Eds.), Crop Stress and ItsManagement: Perspectives and Strategies. Springer, Dordrecht, Heidelberg,London, New York, pp. 1–18.
arino, R., Ponnaiah, M., Krajewski, P., Frova, C., Pè, M.E., 2009. Addressing droughttolerance in maize by transcriptional profiling and mapping. Mol. Genet.Genomics 281, 163–179.
ir, R.R., Zaman-Allah, M., Sreenivasulu, N., Trethowan, R., Varshney, R.K., 2012.Integrated genomics, physiology and breeding approaches for improvingdrought tolerance in crops. Theor. Appl. Genet. 125, 625–645, http://dx.doi.org/10.1007/s00122-012-1904-9.
guyen, T.V., Doan, T.T.B., Leo, A.E., Bui, C.M., Taylor, P.W.J., Ford, R., 2012.Application of microsatellite markers to fingerprint and determine therepresentational diversity within recently established elite maize inbred linebreeding program. J. Agri. Sci. 4, 258–266, http://dx.doi.org/10.5539/jas.v4n6p258.
ikolic, A., Ignjatovic-Micic, D., Dodig, D., Andelkovic, V., Lazic-Jancic, V., 2012.Identification of QTLs for yield and drought-related traits in maize: assessmentof their causal relationships. Biotechnol. Biotechnol. Equip. 26, 2952–2960.
yekunle, M., Badu-Apraku, B., Hearne, S., Franco, J., 2015. Genetic diversity oftropical early-maturing maize inbreds and their performance in hybridcombinations under drought and optimum growing conditions. Field CropsRes. 170, 55–65, http://dx.doi.org/10.1016/j.fcr.2014.10.005.
andey, N., Ranjan, A., Pant, P., Tripathi, R.K., Ateek, F., Pandey, H.P., Patre, U.V.,Sawant, S.V., 2013. CAMTA 1 regulates drought responses in Arabidopsisthaliana. BMC Genom. 14, 216–238.
rasanna, B.M., 2012. Diversity in global maize germplasm: characterization andutilization. J. Biosci. 37, 843–855, http://dx.doi.org/10.1016/j.wace.2014.04.004.
ritchard, J.K., Stephens, M., Donnelly, P., 2000. Inference of population structureusing multilocus genotype data. Genetics 155, 945–959.
ronomy 79 (2016) 43–57 57
Rohlf, F.J., 1998. NTSYS-pc Numerical Taxonomy and Multivariate Analysis System,Version 2.02i. Exeter Publications, New York.
Sabadin, P.K., Souza Jr., C.L., Souza, A.P., Garcia, A.A.F., 2008. QTL mapping for yieldcomponents in a tropical maize population using microsatellite markers.Hereditas 145, 194–203.
Scholander, P.F., Hammel, H.T., Bradstreet, E.D., Himminosen, E.A., 1966. Sappressure on vascular plants. Science 148, 339–346.
Setter, T.L., Yan, J., Warburton, M., Ribaut, J.M., Xu, Y., Sawkins, M., Buckler, E.S.,Zhang, Z., Gore, M.A., 2011. Genetic association mapping identifies singlenucleotide polymorphisms in genes that affect abscisic acid levels in maizefloral tissues during drought. J. Exp. Bot. 62, 701–716.
Shanker, A.K., Maheswari, M., Yadav, S.K., Bhanu, D., Attal, N.B., Venkateswarlu, B.,2014. Drought stress responses in crops. Funct. Integr. Genom. 14, 11–22.
Sibov, T.S., de Souza Jr., C.L., Rezendesilva, A., Garcia, A.F., Mangolin, C.A.,Benchimol, L.L., De Souza, A., 2003. Molecular mapping in tropical maize (Zeamays L.) using microsatellite markers. 2. Quantitative trait loci (QTL) for grainyield, plant height, ear height and grain moisture. Hereditas 139, 107–115.
Sinha, S.K., Aggarwal, P.K., Chaturvedi, G.S., Singh, A.K., Kailashnathan, K., 1986.Performance of wheat and triticale cultivars in a variable water environment:I. Grain yield stability. Field Crops Res. 13, 289–299.
Sun, X., Du, Z., Ren, J., Amombo, E., Hu, T., Fu, J., 2015. Association of SSR markerswith functional traits from heat stress and diverse tall fescue accessions. BMCPlant Bio. 15, 116–128, http://dx.doi.org/10.1186/s12870-015-0494-5.
Suteu, D., Bacilia, I., Has, V., Has, I., Miclaus, M., 2013. Romanian maize (Zea mays)inbred lines as a source of genetic diversity in SE Europe, and their potential infuture breeding efforts. PLoS One 8, 1–13, http://dx.doi.org/10.1371/journal.pone.0085501.
Thirunavukkarasu, N., Hossain, F., Arora, K., Sharma, R., Shiriga, K., Mittal, S.,Mohan, S., Namratha, P.M., Dogga, S., Shobha Rani, T., Katragadda, S., Rathore,A., Shah, T., Mohapatra, T., Gupta, H.S., 2014. Functional mechanisms ofdrought tolerance in subtropical maize (Zea mays L.) identified usinggenome-wide association mapping. BMC Genom. 15, 1182–1193.
White, P.J., Johnson, L.A., 2003. Corn: Chemistry and Technology. AACC AmericanAssociation of Cereal Chemists, USA.
Winter, S.R., Musick, J.T., Porter, K.B., 1988. Evaluation of screening techniques forbreeding drought-resistant winter wheat. Crop Sci. 28, 512–516 http://dx.doi.org/10.2135/cropsci1988.0011183x002800030018x.
Yu, Y., Wang, R., Shi, Y., Song, Y., Wang, T., Li, Y., 2007. Genetic diversity andstructure of the core collection for maize inbred lines in China. Maydica 52,181–194.
Yue, B., Xue, W., Xiong, L., Yu, X., Luo, L., Cui, K., Jin, D., Xing, Y., Zhang, Q., 2005.Genetic basis of drought resistance at reproductive stage in rice: separation of
drought tolerance from drought avoidance. Genetics 172, 1213–1228, http://dx.doi.org/10.1534/genetics.105.045062.Zhang, Q., Wu, C., Ren, F., Li, Y., Zhang, C., 2012. Association analysis of importantagronomical traits of maize inbred lines with SSRs. Aust. J. Crop. Sci. 6,1131–1138.