European Insurers Insurance The Magnificent Seven ... · The Magnificent Seven; Initiating on...
116
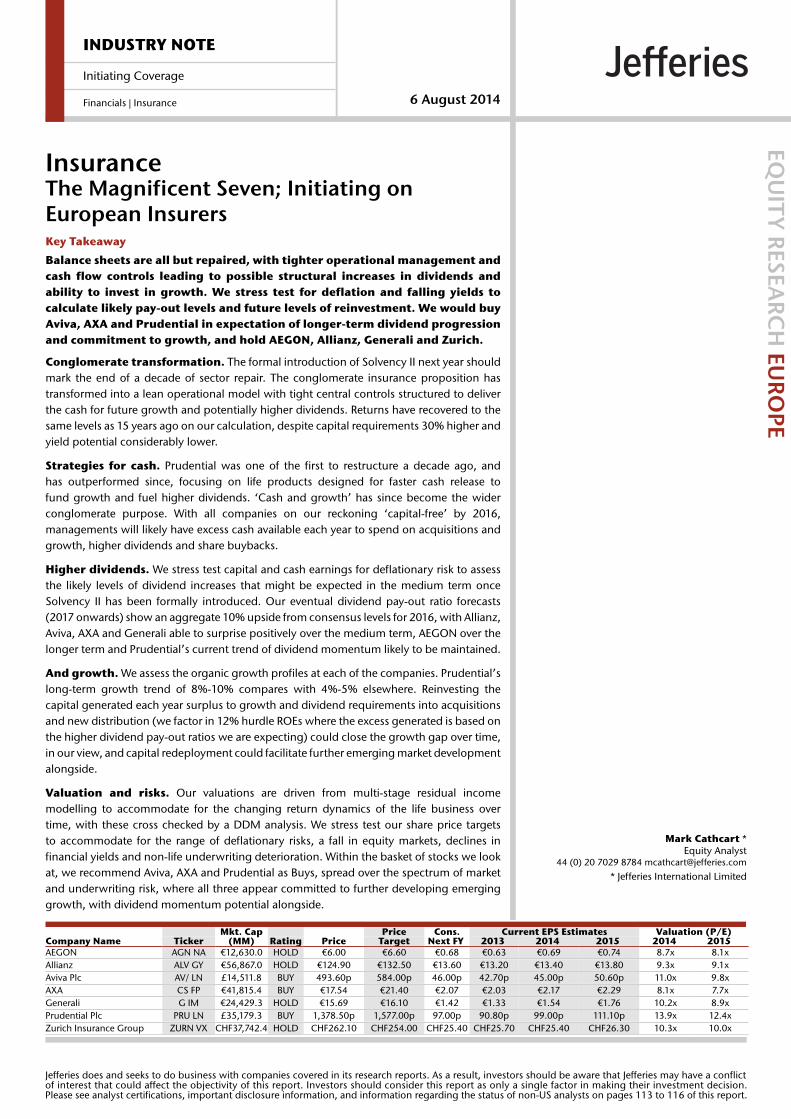
Mkt. Cap Price Cons. Current EPS Estimates Valuation (P/E) Company Name Ticker (MM) Rating Price Target Next FY 2013 2014 2015 2014 2015 AEGON AGN NA €12,630.0 HOLD €6.00 €6.60 €0.68 €0.63 €0.69 €0.74 8.7x 8.1x Allianz ALV GY €56,867.0 HOLD €124.90 €132.50 €13.60 €13.20 €13.40 €13.80 9.3x 9.1x Aviva Plc AV/ LN £14,511.8 BUY 493.60p 584.00p 46.00p 42.70p 45.00p 50.60p 11.0x 9.8x AXA CS FP €41,815.4 BUY €17.54 €21.40 €2.07 €2.03 €2.17 €2.29 8.1x 7.7x Generali G IM €24,429.3 HOLD €15.69 €16.10 €1.42 €1.33 €1.54 €1.76 10.2x 8.9x Prudential Plc PRU LN £35,179.3 BUY 1,378.50p 1,577.00p 97.00p 90.80p 99.00p 111.10p 13.9x 12.4x Zurich Insurance Group ZURN VX CHF37,742.4 HOLD CHF262.10 CHF254.00 CHF25.40 CHF25.70 CHF25.40 CHF26.30 10.3x 10.0x INDUSTRY NOTE Initiating Coverage Financials | Insurance 6 August 2014 Insurance The Magnificent Seven; Initiating on European Insurers EQUITY RESEARCH EUROPE Mark Cathcart * Equity Analyst 44 (0) 20 7029 8784 [email protected] * Jefferies International Limited Key Takeaway Balance sheets are all but repaired, with tighter operational management and cash flow controls leading to possible structural increases in dividends and ability to invest in growth. We stress test for deflation and falling yields to calculate likely pay-out levels and future levels of reinvestment. We would buy Aviva, AXA and Prudential in expectation of longer-term dividend progression and commitment to growth, and hold AEGON, Allianz, Generali and Zurich. Conglomerate transformation. The formal introduction of Solvency II next year should mark the end of a decade of sector repair. The conglomerate insurance proposition has transformed into a lean operational model with tight central controls structured to deliver the cash for future growth and potentially higher dividends. Returns have recovered to the same levels as 15 years ago on our calculation, despite capital requirements 30% higher and yield potential considerably lower. Strategies for cash. Prudential was one of the first to restructure a decade ago, and has outperformed since, focusing on life products designed for faster cash release to fund growth and fuel higher dividends. ‘Cash and growth’ has since become the wider conglomerate purpose. With all companies on our reckoning ‘capital-free’ by 2016, managements will likely have excess cash available each year to spend on acquisitions and growth, higher dividends and share buybacks. Higher dividends. We stress test capital and cash earnings for deflationary risk to assess the likely levels of dividend increases that might be expected in the medium term once Solvency II has been formally introduced. Our eventual dividend pay-out ratio forecasts (2017 onwards) show an aggregate 10% upside from consensus levels for 2016, with Allianz, Aviva, AXA and Generali able to surprise positively over the medium term, AEGON over the longer term and Prudential’s current trend of dividend momentum likely to be maintained. And growth. We assess the organic growth profiles at each of the companies. Prudential’s long-term growth trend of 8%-10% compares with 4%-5% elsewhere. Reinvesting the capital generated each year surplus to growth and dividend requirements into acquisitions and new distribution (we factor in 12% hurdle ROEs where the excess generated is based on the higher dividend pay-out ratios we are expecting) could close the growth gap over time, in our view, and capital redeployment could facilitate further emerging market development alongside. Valuation and risks. Our valuations are driven from multi-stage residual income modelling to accommodate for the changing return dynamics of the life business over time, with these cross checked by a DDM analysis. We stress test our share price targets to accommodate for the range of deflationary risks, a fall in equity markets, declines in financial yields and non-life underwriting deterioration. Within the basket of stocks we look at, we recommend Aviva, AXA and Prudential as Buys, spread over the spectrum of market and underwriting risk, where all three appear committed to further developing emerging growth, with dividend momentum potential alongside. Jefferies does and seeks to do business with companies covered in its research reports. As a result, investors should be aware that Jefferies may have a conflict of interest that could affect the objectivity of this report. Investors should consider this report as only a single factor in making their investment decision. Please see analyst certifications, important disclosure information, and information regarding the status of non-US analysts on pages 113 to 116 of this report.
Transcript of European Insurers Insurance The Magnificent Seven ... · The Magnificent Seven; Initiating on...
Mkt. Cap Price Cons. Current EPS Estimates Valuation (P/E)Company Name Ticker (MM) Rating Price Target Next FY 2013 2014 2015 2014 2015 AEGON AGN NA €12,630.0 HOLD €6.00 €6.60 €0.68 €0.63 €0.69 €0.74 8.7x 8.1xAllianz ALV GY €56,867.0 HOLD €124.90 €132.50 €13.60 €13.20 €13.40 €13.80 9.3x 9.1xAviva Plc AV/ LN £14,511.8 BUY 493.60p 584.00p 46.00p 42.70p 45.00p 50.60p 11.0x 9.8xAXA CS FP €41,815.4 BUY €17.54 €21.40 €2.07 €2.03 €2.17 €2.29 8.1x 7.7xGenerali G IM €24,429.3 HOLD €15.69 €16.10 €1.42 €1.33 €1.54 €1.76 10.2x 8.9xPrudential Plc PRU LN £35,179.3 BUY 1,378.50p 1,577.00p 97.00p 90.80p 99.00p 111.10p 13.9x 12.4xZurich Insurance Group ZURN VX CHF37,742.4 HOLD CHF262.10 CHF254.00 CHF25.40 CHF25.70 CHF25.40 CHF26.30 10.3x 10.0x
INDUSTRY NOTE
Initiating Coverage
Financials | Insurance 6 August 2014
InsuranceThe Magnificent Seven; Initiating onEuropean Insurers
EQU
ITY R
ESEARC
H EU
ROPE
Mark Cathcart *Equity Analyst
44 (0) 20 7029 8784 [email protected]
* Jefferies International Limited
Key Takeaway
Balance sheets are all but repaired, with tighter operational management andcash flow controls leading to possible structural increases in dividends andability to invest in growth. We stress test for deflation and falling yields tocalculate likely pay-out levels and future levels of reinvestment. We would buyAviva, AXA and Prudential in expectation of longer-term dividend progressionand commitment to growth, and hold AEGON, Allianz, Generali and Zurich.
Conglomerate transformation. The formal introduction of Solvency II next year shouldmark the end of a decade of sector repair. The conglomerate insurance proposition hastransformed into a lean operational model with tight central controls structured to deliverthe cash for future growth and potentially higher dividends. Returns have recovered to thesame levels as 15 years ago on our calculation, despite capital requirements 30% higher andyield potential considerably lower.
Strategies for cash. Prudential was one of the first to restructure a decade ago, andhas outperformed since, focusing on life products designed for faster cash release tofund growth and fuel higher dividends. ‘Cash and growth’ has since become the widerconglomerate purpose. With all companies on our reckoning ‘capital-free’ by 2016,managements will likely have excess cash available each year to spend on acquisitions andgrowth, higher dividends and share buybacks.
Higher dividends. We stress test capital and cash earnings for deflationary risk to assessthe likely levels of dividend increases that might be expected in the medium term onceSolvency II has been formally introduced. Our eventual dividend pay-out ratio forecasts(2017 onwards) show an aggregate 10% upside from consensus levels for 2016, with Allianz,Aviva, AXA and Generali able to surprise positively over the medium term, AEGON over thelonger term and Prudential’s current trend of dividend momentum likely to be maintained.
And growth. We assess the organic growth profiles at each of the companies. Prudential’slong-term growth trend of 8%-10% compares with 4%-5% elsewhere. Reinvesting thecapital generated each year surplus to growth and dividend requirements into acquisitionsand new distribution (we factor in 12% hurdle ROEs where the excess generated is based onthe higher dividend pay-out ratios we are expecting) could close the growth gap over time,in our view, and capital redeployment could facilitate further emerging market developmentalongside.
Valuation and risks. Our valuations are driven from multi-stage residual incomemodelling to accommodate for the changing return dynamics of the life business overtime, with these cross checked by a DDM analysis. We stress test our share price targetsto accommodate for the range of deflationary risks, a fall in equity markets, declines infinancial yields and non-life underwriting deterioration. Within the basket of stocks we lookat, we recommend Aviva, AXA and Prudential as Buys, spread over the spectrum of marketand underwriting risk, where all three appear committed to further developing emerginggrowth, with dividend momentum potential alongside.
Jefferies does and seeks to do business with companies covered in its research reports. As a result, investors should be aware that Jefferies may have a conflictof interest that could affect the objectivity of this report. Investors should consider this report as only a single factor in making their investment decision.Please see analyst certifications, important disclosure information, and information regarding the status of non-US analysts on pages 113 to 116 of this report.
Executive Summary The conglomerate proposition has vastly improved: corporate governance,
franchise focus, and an attractive cash and return profile despite the higher
capital demands from Solvency II. Prudential has demonstrated to the market
over the past decade the benefits of investing in growth with products
designed to quickly release the cash, and has been extensively re-rated
because of it. With the wider conglomerate insurance sector on the cusp of
capital recovery, we explore the prospects for growth and higher dividend
pay-out ratios at the other companies. We assess earnings growth potential,
both organic and acquired, and stress test for deflation to construct the likely
pay-out levels for each company. Our Buy-rated stocks – Aviva, AXA and
Prudential – are spread over the spectrum of market and underwriting risk,
where all three appear committed to emerging growth, with dividend
momentum potential alongside.
In this note, we initiate coverage on seven major European insurers, with Buy
ratings on Aviva, AXA and Prudential, and Hold ratings on AEGON, Allianz,
Generali and Zurich.
Sector repair. The formal introduction of Solvency II next year will mark the
denouement of a decade of sector repair for a group of companies that, after years of
mega acquiring, had found themselves woefully undercapitalised in the sequence of
financial collapses that followed. See Appendix, The Conglomer-creation.
Operational transformation. Today the conglomerate insurance proposition has
transformed, a lean operational model with tight central controls structured specifically to
deliver the cash in the form of dividends, with life products designed for faster cash
release to fund future growth. See later section, Corporate Assessment, for a full overview.
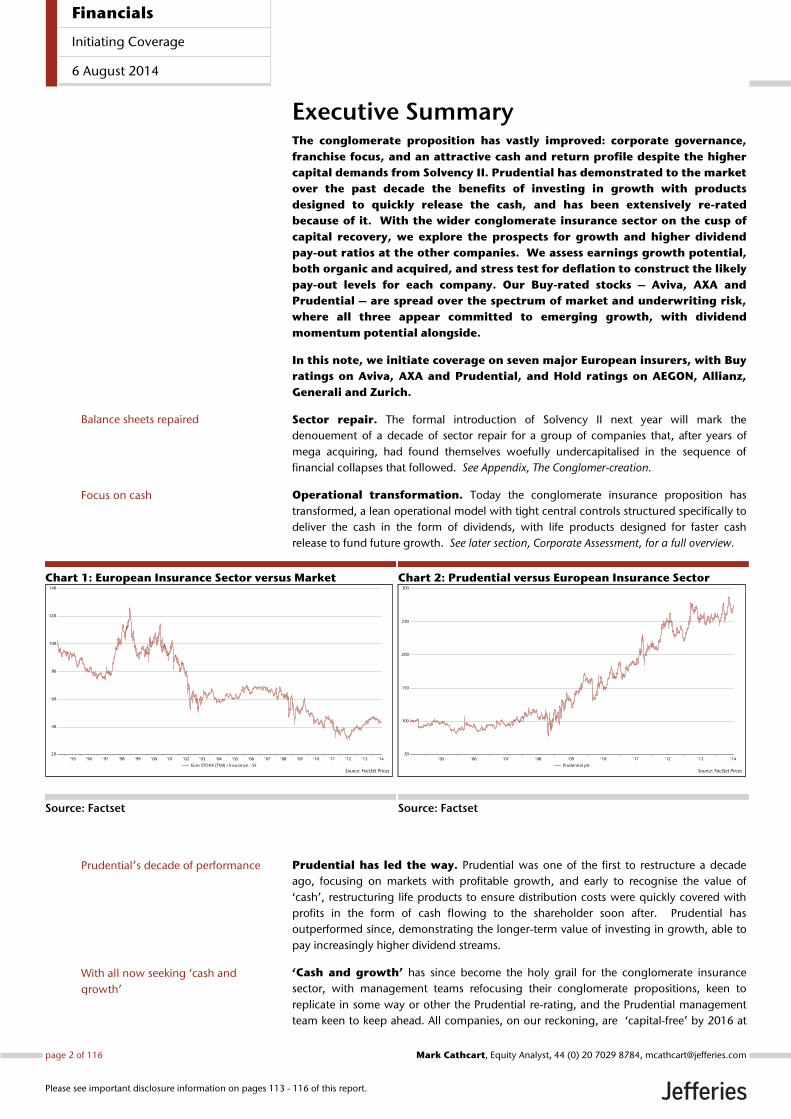
Chart 1: European Insurance Sector versus Market
Source: Factset
Chart 2: Prudential versus European Insurance Sector
Source: Factset
Prudential has led the way. Prudential was one of the first to restructure a decade
ago, focusing on markets with profitable growth, and early to recognise the value of
‘cash’, restructuring life products to ensure distribution costs were quickly covered with
profits in the form of cash flowing to the shareholder soon after. Prudential has
outperformed since, demonstrating the longer-term value of investing in growth, able to
pay increasingly higher dividend streams.
‘Cash and growth’ has since become the holy grail for the conglomerate insurance
sector, with management teams refocusing their conglomerate propositions, keen to
replicate in some way or other the Prudential re-rating, and the Prudential management
team keen to keep ahead. All companies, on our reckoning, are ‘capital-free’ by 2016 at
'95 '96 '97 '98 '99 '00 '01 '02 '03 '04 '05 '06 '07 '08 '09 '10 '11 '12 '13 '1420
40
60
80
100
120
140
Source: FactSet PricesEuro STOXX (TMI) / Insurance - SS
'05 '06 '07 '08 '09 '10 '11 '12 '13 '1450
100
150
200
250
300
Source: FactSet PricesPrudential plc
Balance sheets repaired
Focus on cash
Prudential’s decade of performance
With all now seeking ‘cash and
growth’
Financials
Initiating Coverage
6 August 2014
page 2 of 116 , Equity Analyst, 44 (0) 20 7029 8784, [email protected] Cathcart
Please see important disclosure information on pages 113 - 116 of this report.
the latest with free cash generated no longer required to shore up capital or pay down
debt, available instead for acquisitions and growth alongside dividends and share
buybacks. See later sections, Corporate Assessment: Growth, Cash, Dividend.
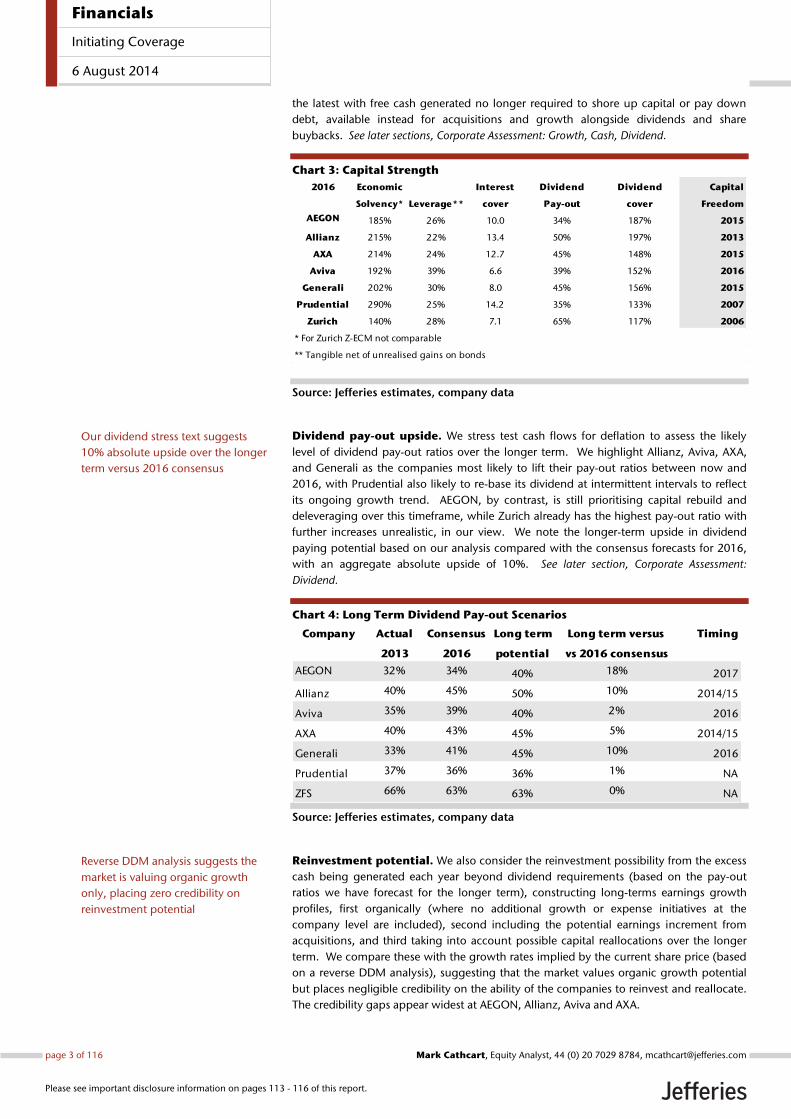
Chart 3: Capital Strength
Source: Jefferies estimates, company data
Dividend pay-out upside. We stress test cash flows for deflation to assess the likely
level of dividend pay-out ratios over the longer term. We highlight Allianz, Aviva, AXA,
and Generali as the companies most likely to lift their pay-out ratios between now and
2016, with Prudential also likely to re-base its dividend at intermittent intervals to reflect
its ongoing growth trend. AEGON, by contrast, is still prioritising capital rebuild and
deleveraging over this timeframe, while Zurich already has the highest pay-out ratio with
further increases unrealistic, in our view. We note the longer-term upside in dividend
paying potential based on our analysis compared with the consensus forecasts for 2016,
with an aggregate absolute upside of 10%. See later section, Corporate Assessment:
Dividend.
Chart 4: Long Term Dividend Pay-out Scenarios
Source: Jefferies estimates, company data
Reinvestment potential. We also consider the reinvestment possibility from the excess
cash being generated each year beyond dividend requirements (based on the pay-out
ratios we have forecast for the longer term), constructing long-terms earnings growth
profiles, first organically (where no additional growth or expense initiatives at the
company level are included), second including the potential earnings increment from
acquisitions, and third taking into account possible capital reallocations over the longer
term. We compare these with the growth rates implied by the current share price (based
on a reverse DDM analysis), suggesting that the market values organic growth potential
but places negligible credibility on the ability of the companies to reinvest and reallocate.
The credibility gaps appear widest at AEGON, Allianz, Aviva and AXA.
2016 Economic Interest Dividend Dividend Capital
Solvency* Leverage** cover Pay-out cover Freedom
AEGON 185% 26% 10.0 34% 187% 2015
Allianz 215% 22% 13.4 50% 197% 2013
AXA 214% 24% 12.7 45% 148% 2015
Aviva 192% 39% 6.6 39% 152% 2016
Generali 202% 30% 8.0 45% 156% 2015
Prudential 290% 25% 14.2 35% 133% 2007
Zurich 140% 28% 7.1 65% 117% 2006
* For Zurich Z-ECM not comparable
** Tangible net of unrealised gains on bonds
Company Actual Consensus Long term Long term versus Timing
2013 2016 potential vs 2016 consensus
AEGON 32% 34% 40% 18% 2017
Allianz 40% 45% 50% 10% 2014/15
Aviva 35% 39% 40% 2% 2016
AXA 40% 43% 45% 5% 2014/15
Generali 33% 41% 45% 10% 2016
Prudential 37% 36% 36% 1% NA
ZFS 66% 63% 63% 0% NA
Our dividend stress text suggests
10% absolute upside over the longer
term versus 2016 consensus
Reverse DDM analysis suggests the
market is valuing organic growth
only, placing zero credibility on
reinvestment potential
Financials
Initiating Coverage
6 August 2014
page 3 of 116 , Equity Analyst, 44 (0) 20 7029 8784, [email protected] Cathcart
Please see important disclosure information on pages 113 - 116 of this report.
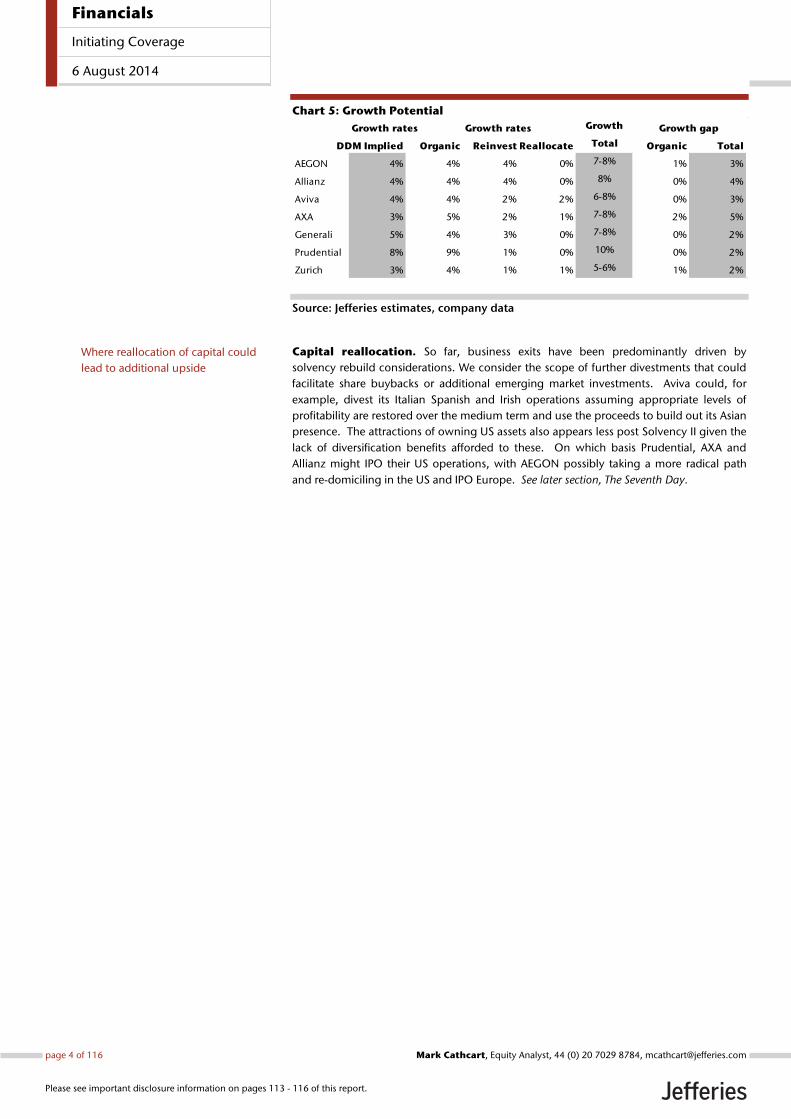
Chart 5: Growth Potential
Source: Jefferies estimates, company data
Capital reallocation. So far, business exits have been predominantly driven by
solvency rebuild considerations. We consider the scope of further divestments that could
facilitate share buybacks or additional emerging market investments. Aviva could, for
example, divest its Italian Spanish and Irish operations assuming appropriate levels of
profitability are restored over the medium term and use the proceeds to build out its Asian
presence. The attractions of owning US assets also appears less post Solvency II given the
lack of diversification benefits afforded to these. On which basis Prudential, AXA and
Allianz might IPO their US operations, with AEGON possibly taking a more radical path
and re-domiciling in the US and IPO Europe. See later section, The Seventh Day.
Growth rates Growth rates Growth Growth gap
DDM Implied Organic Reinvest Reallocate Total Organic Total
AEGON 4% 4% 4% 0% 7-8% 1% 3%
Allianz 4% 4% 4% 0% 8% 0% 4%
Aviva 4% 4% 2% 2% 6-8% 0% 3%
AXA 3% 5% 2% 1% 7-8% 2% 5%
Generali 5% 4% 3% 0% 7-8% 0% 2%
Prudential 8% 9% 1% 0% 10% 0% 2%
Zurich 3% 4% 1% 1% 5-6% 1% 2%
Where reallocation of capital could
lead to additional upside
Financials
Initiating Coverage
6 August 2014
page 4 of 116 , Equity Analyst, 44 (0) 20 7029 8784, [email protected] Cathcart
Please see important disclosure information on pages 113 - 116 of this report.
Recommendations To participate in the potential re-rating of the conglomerates in the run up to the
completion of Solvency II, we focus our conglomerate recommendations on companies
where dividend and growth strategies are likely to lead to longer-term re-ratings. To
reflect the uncertain economic outlook (deflation versus reflation), our recommendations
are spread across the spectrum of financial market risk.
Below we summarise our recommendations, with emphasis on the Buy-rated names:
Aviva, AXA and Prudential.
Aviva – Buy, Price Target 584p
We see dividend momentum shorter term driven by operational overhaul,
increasing cash remittance, and possible growth resurfacing in the core
business. Wider scale capital reallocation is likely over the longer term, in
our view, leading to an increasing emerging growth profile and longer-term
dividend momentum.
Aviva’s corporate culture has rapidly transformed following the arrival
of Mark Wilson as CEO (late 2012), former CEO and restorer of AIA ahead of its
IPO with a new management team appointed since. Initial focus has been on
cash generation and remittance to the group, simplification of the corporate
structure and tighter central management controls, where management’s target
of a group expense ratio of sub-50% for 2016 (53% 2013) suggests further
efficiency drives across the group.
The organic growth profile of the group is gaining momentum, with
management confident of a return to UK growth driven by their unique
composite leadership and IT edge (app and web facilitating sales), where cross-
sell stands at just 1.2, and asset management rebuild under Euan Munroe. The
distribution agreements across Europe have also been refocused and
strengthened.
CEO Mark Wilson underlined at the recent Investor Day that the £800m cash
earnings guidance for 2016 at the holding was for future dividends.
Our forecasts assume that 75% of this amount will eventually be set aside for
dividend (likely timeframe 2017), equating to a 40% pay-out ratio on operating
EPS, albeit with upside risk. This would leave £250-300m annual for investment
in growth, which if successfully reinvested on a 12% ROE would benefit
earnings growth by 2% annually on our calculation.
The key area of interest for us, however, is capital reallocation and the £2bn-
plus (10%-15% of group capital) that could be released from eventual sales of
Italy, Spain and Ireland (likely time horizon 2016-17). With the group CEO
formerly CEO at AIA, and the global life CEO formerly CEO of Great Eastern
Holdings, further investment in Asia (jvs and distribution deals) seems the
most likely home for this capital. Capital redeployment over the longer term
could see the group’s long-term earnings growth potential rising to 8% (versus
the 4% we calculate for the group as-is), where the dividend pay-out ratio will
likely sit in the 40%-45% range (versus 35% currently).
Factoring the current share price into our DDM, where we assume that the full
£800m will not be paid out until the dividend for 2018, suggests that the market
is valuing Aviva on a long-term growth rate of 4%, in line with its base-case
organic profile. Our price target of 584p is based on an eventual 40% pay-
out ratio and assumes long-term growth of 6% (rather than 8%), allowing for
risk to margins where we assume a 2 percentage point deterioration in the
combined ratio over time (see Aviva’s Long View at the end of this report for
more detail).
Buy recommendations spread across
the spectrum of economic risk
Tighter controls over expense and
cash generation driven by new CEO
UK growth potential
Dividend momentum
Longer-term capital reallocation
potential from Europe to Asia
Share price upside based on our
growth and dividend expectations
Financials
Initiating Coverage
6 August 2014
page 5 of 116 , Equity Analyst, 44 (0) 20 7029 8784, [email protected] Cathcart
Please see important disclosure information on pages 113 - 116 of this report.
Downside risks are continued underwriting downturn in UK non-life, limited
cross-sell progress within the UK, further weakening of European distribution,
and failure to deliver on the operational improvements with cash earnings
disappointing in the process.
AXA – Buy, Price Target €21.4
Ambition 2015 has steered the group back towards a level of acceptable
balance sheet strength, which can now afford to grow, with increased cash
flows at the holding reflecting the successful overhaul in life business mix.
The current valuation fails to accommodate for the longer-term growth
profile of the group, with commitment to the emerging market build likely to
continue, in our view.
AXA’s solid European base (top 3 in a number of markets) is supported by a
focused life presence in the US and Japan, with a broad spread of emerging
market presence, and a leading global brand that has enabled it to secure a
range of leadership distribution deals in recent years. The management team
under Henri de Castries have recently signed up for four more years having
successfully restructured the balance sheet since the financial crisis,
repositioning the life portfolio to lower capital intensive unit-linked and
protection lines.
Ambition 2015 targeted a 2.5x increase in the growth contribution to group
earnings from a 5% base. At 12% for full year 2013, AXA’s commitment to
emerging growth expansion continues, where management have recently
expressed interest in the corporate insurance assets of the Brazilian bank Itau
Unibanco. Later next year AXA’s objectives for Ambition 2020 will possibly be
set out, with a further doubling of growth contribution to earnings quite likely
to be included. Successful execution would see AXA more than halfway towards
Prudential’s emerging growth profile by 2020.
We expect the dividend level to rise by 30% over the next three years,
with an increase in the pay-out ratio from 40% to 45% by 2016. This would
still leave €1bn of excess cash at the holding each year for growth reinvestments
(on a 12% ROE equates to close to 3% of earnings on our calculation), where
there might also be scope for additional capital release from the life back books.
We also consider the possibility of an IPO of its US life and annuity division (see
later section, Seventh Day, for a more detailed rationale), which would free up
around 15% of group capital on our calculation.
Factoring the current share price into our DDM, where we assume an increase in
the dividend pay-out ratio to 45% for 2016, suggests that the market is valuing
AXA on a long-term growth rate of 4%, below our base-case organic profile at
5%. Our price target of €21.4 is based on an eventual 45% pay-out ratio and
assumes long-term growth of 5% allowing for risk to margins, where we assume
a 2 percentage point deterioration in the combined ratio over time (please see
AXA’s Long View at the end of this report for more details). AXA is on the lowest
PER of the conglomerates (2015F 7.6X vs 8.8X ex Prudential), and highest cash
earnings yield (2015F 10.4% vs 9.5% ex Prudential).
Downside risks are underwriting downturn in European non-life, life margin
compression from falling yields, thwarted progress in building up the emerging
market profile, further falls in European and US bond yields, and falling equity
markets.
Strong management, powerful
franchise, leading brand
Emerging market commitment likely
to grow
Medium-term dividend momentum
driven by likely higher pay-out ratio
Share price fails to accommodate for
growth potential in our view
Financials
Initiating Coverage
6 August 2014
page 6 of 116 , Equity Analyst, 44 (0) 20 7029 8784, [email protected] Cathcart
Please see important disclosure information on pages 113 - 116 of this report.
Prudential – Buy, Price Target 1577p
The insurance conglomeration that has set the pace in terms of cash
generation and capital navigation. The premium rating reflects the long-
term growth potential of Asia, where upside remains considerable, in our
view, and where dividend rebases are likely to continue as a result.
The cash and growth strategies pursued in the UK (repositioning towards
cash), Asia (growth focus on medical expenses to emerging middle class) and
US (counter-cyclical US VA growth driven by conservative pricing and hedging
strategy) have all conspired to produce double-digit growth and high
returns in recent years. Prudential now benefits from the leading Asian
franchise based on both distribution strength and geographic spread, leadership
in US variable annuities (market share and efficiency), and a UK franchise backed
by M&G, the leading UK asset manager.
Solvency II is the strongest in the sector at 253% (2013 FY), with ROCs the
highest of the conglomerates by some margin; we forecast 23% for 2015,
reflecting >20% IRRs in all life business (short paybacks, medical expense bias in
Asia, with-profit support in the UK).
The recent convergence of growth trends in the US and Asia has fuelled
momentum but where Jackson has recently increased its pricing to secure
margins. We expect the longer-term growth focus to be firmly on Asia,
where agency distribution continues to grow at double-digit rates, and where
Standard Chartered is also broadening (customer penetration still only 3%),
with new initiatives in Hong Kong and Singapore, India and China in the process
of opening, and with other markets to follow. Specifically, in Thailand
(undeveloped by Prudential’s standards but the second largest SE Asian
economy), distribution was secured last year via auto finance leader Thanachart.
Crucially, the growth trend in Prudential’s core health product shows no signs
of abating. Out-of-pocket medical expenses stand at 30%-60% across the
regions, according to management, versus 10% in the US/UK. Above all,
Prudential’s customer base, the middle class, is expected to grow to 135m by
2030 vs 45m 2012 (vs Prudential’s 2m customers). And beyond Asia, the
African continent now appears to be in Prudential’s sights.
Prudential’s clean corporate structure, with no internal debt, Asia with its own
holding structure, US life with no diversification benefits likely under Solvency II,
and management commentary on business optionality all point to at least the
possibility of a break-up of the group at some stage in the future, if
not a straight sale or IPO of Jackson. We note the successful IPO of Voya
(US life insurer) from ING last year. Asian investors are possibly less willing to
own Prudential given the difficulties in understanding the UK and US businesses.
With Jackson sold, the Asian business could then re-rate, possibly to a premium
to AIA based on a qualitative assessment between the two.
Factoring the current share price into our DDM, where we expect dividend
momentum to reflect earnings growth, but with no dividend pay-out increase,
suggests that the market is valuing Prudential on a long-term growth rate of
8.5% based on a CoC of 10%. Asian exposure arguably demands a higher risk
premium, but Prudential versus the conglomerate sector has limited exposure
to financial market risks, where roughly half of the Asian business is US$
denominated, and where the Asian premium mix should prove defensive
in any economic downturn (affordability of products to the bourgeoning middle
class). The PER for 2016F at 11.3x fails to accommodate for the group’s growth
profile and capital optionality, in our view. Our price target of 1577p
values the group on a PER 2016F of 12.7x, equating to a 10% long-term
growth rate on our DDM analysis. Please see Prudential’s Long View at the end
of this report for more detail.
Highest return and growth profile of
the conglomerates
The strongest on Solvency II
Asian upside remains considerable,
in our view
US IPO a possibility
Share price fails to accommodate for
the double-digit growth potential
Financials
Initiating Coverage
6 August 2014
page 7 of 116 , Equity Analyst, 44 (0) 20 7029 8784, [email protected] Cathcart
Please see important disclosure information on pages 113 - 116 of this report.
Downside risks are regulatory changes in Asia undermining Prudential’s
product offering, Asian downturn deflating growth expectations, unfavourable
policyholder behaviour decreasing the expected value of Jackson’s annuity
portfolio, and further changes to government regulation of life and pensions
sales in the UK impacting margins and volumes.
AEGON – Hold, Price Target €6.6
The improving return and growth profile of the group reflects extensive cost cutting and
portfolio repositioning in the core markets (US, Netherlands and UK), where successful
exit of non-core in France and Canada should secure an ROE of above 10% on our
calculation. ROCs still remain the lowest in the sector, however, reflecting the drag from
life back books with guarantees and extensive hedging costs, and continued sub
profitability in the UK, where critical mass has yet to be achieved in its new platform. The
indicative Solvency II range (150%-200%) is also at the low end for the sector, with the
mid-point of 175% comparing with typically 200% elsewhere. This reflects the US
overweight and absence of diversification benefits afforded to these assets under the new
capital regime, with dividend momentum likely to remain constrained longer than
elsewhere within the sector because of this, where the stock dividend yield at 4.4% for
2016 is at the low end for the sector. Risks to our Hold thesis are: a rise in US yields
leading to improving margins, an increased likelihood of selling the non-core run-off
books, faster capital replenishment, and dividend hikes earlier than expected; UK platform
momentum securing appropriate levels of returns; and (unlikely in our view), a re-
domiciling of the business to the US, and IPO of the European assets.
Allianz – Hold, Price Target €132.5
Strong cash flows relative to current growth and dividend requirements are likely to fuel
market expectation of pay-out increases over time (we expect a 50% pay-out ratio by
2016), where the market seems to be placing limited value on the group’s reinvestment
potential. Clarification of capital strategy is expected later this year. PIMCO outflows
have been weighing on the group’s rating in recent months following US tapering, a blip
in fund performance last year and the resignation of the CEO. We anticipate stabilisation
of outflows and a gradual return to a growth trend reflecting recent fund performance
recovery, and management rebuild (six new deputy CIOs appointed alongside CIO Bill
Gross, and a new CEO, former COO). Our €132.5 price target is based on a 50% pay-out
ratio and gives some benefit for reinvestment potential for the excess capital generation.
Risks to our thesis are continued outflows at PIMCO, underwriting downturn in European
non-life, and life margin compression from falling yields.
Generali – Hold, Price Target €16.1
Modernisation and de-politicisation under CEO Mario Greco and his new management
team are major positives for the group’s rating. Improving efficiency on the back of wide-
scale integration, higher domestic growth rates driven by the tied agents diversifying their
sales into non-traditional life products, and capital repair following the recent sale of BSI
have given management confidence to point to a higher dividend pay-out ratio in the
future (above 40% vs 36% 2013). Generali is the most exposed of the conglomerates to
falling yields in Italy and Germany, however, where falling domestic auto rates may begin
to affect profit momentum. Risks to our thesis are a sooner-than-expected move to 45%
pay-out ratio (our long-term forecast), additional expense cuts more than offsetting
margin pressures and reversal of the recent bond yield declines. The stock is underpinned
at current levels by its high free cash yield (9.6% 2016F vs 10.1% sector ex Pru).
Zurich – Hold, Price Target CHF254
Dividend upside is limited by an already high pay-out ratio (65%) and low earnings
growth profile (overweight non-life, where Farmers omni-channel approach has yet to
convince in the face of direct competition). Non-core sales are also expected to be small,
with guidance at 5% of total capital. The stock does, however, benefit from strong yield
underpin (2016F 6.7%) and is economically defensive. Risks to our thesis include a
convincing growth trend being established at Farmers, and additional capital release (life
back books for example) fuelling expectations of more emerging market roll-out.
Dividend upside considerable;
PIMCO trajectory less certain
Significant cost cutting under new
management team, but drag of
falling yields and lower domestic
auto rates
Dividend pay-out already high,
growth potential limited
Solvency II at the low end for the
sector constrains dividend
momentum for the medium term
Financials
Initiating Coverage
6 August 2014
page 8 of 116 , Equity Analyst, 44 (0) 20 7029 8784, [email protected] Cathcart
Please see important disclosure information on pages 113 - 116 of this report.

Valuation Our formal share price targets are driven from a traditional multi-period
residual return model. However, to reflect the increased emphasis on
dividends within the sector we use reverse dividend discount modelling to
assess the growth rates implied by the current share price and also by our
share price targets.
We flex our valuations for deflationary/reflationary scenarios. For reflation, we
assume a 10% increase in equity markets and a 50bps upward shift in bond yields; for
deflation, the opposite but also specifically take into account the likely deterioration in
non-life profitability. In a deflationary cycle, non-life earnings would possibly take a
double hit, from lower reinvestment rates (we have assumed 15bps for the 50bps decline
in bond yields to reflect the offset of asset diversification) and from likely falling prices
with customers more price conscious. We note the current combination in Italy of falling
bond yields and declining rates for auto insurance.
Chart 6 shows the share price (the line across the bars), the current share price target (the
division between red and grey), and the share price targets on deflationary and
reflationary scenarios. Those companies towards the left are the most at risk from
deflation, but those that would be most advantaged by a move to reflation. Those to the
right are the more economically defensive stocks. The additional downside in a
deflationary cycle from non-life, and the decline in traditional spreads as yield potential
gets closer to the long-term guarantees leads to asymmetric risk at both ends of the chart,
Zurich (non-life) and AXA (life).
For a full explanation of how our share price targets are derived, please see Appendices 2,
3 and 4: Valuation, Financial Market Influence and Recent Conglomerate Performance. The
last of these sections strips out financial market impact on share price moves since the
beginning of the year to assess the stock specific re-ratings/de-ratings.
Chart 6: Share Price Target Flex: Deflation/Reflation Scenarios
Source: Jefferies estimates, company data
The conglomerates are currently trading at a 17% discount to the small/mid -cap insurers
on a consensus PER basis (2016F) where a premium rating appears more appropriate
given their range of growth strategies in an uncertain regulatory world. Please see later
section, The Conglomerate Premium, for arguments as to why a premium rating might
become attached to these stocks over the longer-term horizon (post Solvency II and GSII)
not seen since the early part of 2001.
80
90
100
110
120
130
140
150
AXA Generali AEGON Allianz Aviva Prudential Zurich
Min PT : Base PT range Base PT : Max PT range Share price
We flex our share price targets for
deflation and reflation
With asymmetric risk to the
downside
The conglomerate discount at 17%
appears harsh given the uncertain
regulatory world for the mono-line
insurers
Financials
Initiating Coverage
6 August 2014
page 9 of 116 , Equity Analyst, 44 (0) 20 7029 8784, [email protected] Cathcart
Please see important disclosure information on pages 113 - 116 of this report.
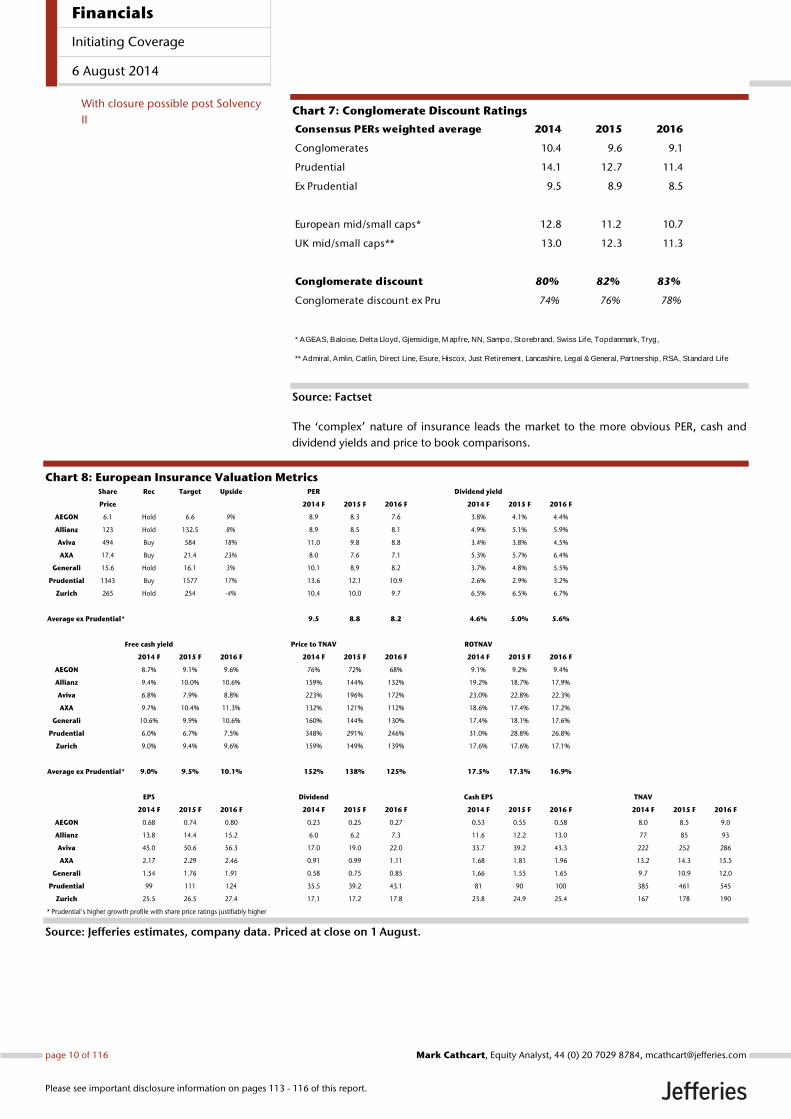
Chart 7: Conglomerate Discount Ratings
Source: Factset
The ‘complex’ nature of insurance leads the market to the more obvious PER, cash and
dividend yields and price to book comparisons.
Chart 8: European Insurance Valuation Metrics
Source: Jefferies estimates, company data. Priced at close on 1 August.
Consensus PERs weighted average 2014 2015 2016
Conglomerates 10.4 9.6 9.1
Prudential 14.1 12.7 11.4
Ex Prudential 9.5 8.9 8.5
European mid/small caps* 12.8 11.2 10.7
UK mid/small caps** 13.0 12.3 11.3
Conglomerate discount 80% 82% 83%
Conglomerate discount ex Pru 74% 76% 78%
* AGEAS, Baloise, Delta Lloyd, Gjensidige, M apfre, NN, Sampo, Storebrand, Swiss Life, Topdanmark, Tryg,
** Admiral, Amlin, Catlin, Direct Line, Esure, Hiscox, Just Retirement, Lancashire, Legal & General, Partnership, RSA, Standard Life
Share Rec Target Upside PER Dividend yield
Price 2014 F 2015 F 2016 F 2014 F 2015 F 2016 F
AEGON 6.1 Hold 6.6 9% 8.9 8.3 7.6 3.8% 4.1% 4.4%
Allianz 123 Hold 132.5 8% 8.9 8.5 8.1 4.9% 5.1% 5.9%
Aviva 494 Buy 584 18% 11.0 9.8 8.8 3.4% 3.8% 4.5%
AXA 17.4 Buy 21.4 23% 8.0 7.6 7.1 5.3% 5.7% 6.4%
Generali 15.6 Hold 16.1 3% 10.1 8.9 8.2 3.7% 4.8% 5.5%
Prudential 1343 Buy 1577 17% 13.6 12.1 10.9 2.6% 2.9% 3.2%
Zurich 265 Hold 254 -4% 10.4 10.0 9.7 6.5% 6.5% 6.7%
Average ex Prudential* 9.5 8.8 8.2 4.6% 5.0% 5.6%
Free cash yield Price to TNAV ROTNAV
2014 F 2015 F 2016 F 2014 F 2015 F 2016 F 2014 F 2015 F 2016 F
AEGON 8.7% 9.1% 9.6% 76% 72% 68% 9.1% 9.2% 9.4%
Allianz 9.4% 10.0% 10.6% 159% 144% 132% 19.2% 18.7% 17.9%
Aviva 6.8% 7.9% 8.8% 223% 196% 172% 23.0% 22.8% 22.3%
AXA 9.7% 10.4% 11.3% 132% 121% 112% 18.6% 17.4% 17.2%
Generali 10.6% 9.9% 10.6% 160% 144% 130% 17.4% 18.1% 17.6%
Prudential 6.0% 6.7% 7.5% 348% 291% 246% 31.0% 28.8% 26.8%
Zurich 9.0% 9.4% 9.6% 159% 149% 139% 17.6% 17.6% 17.1%
Average ex Prudential* 9.0% 9.5% 10.1% 152% 138% 125% 17.5% 17.3% 16.9%
EPS Dividend Cash EPS TNAV
2014 F 2015 F 2016 F 2014 F 2015 F 2016 F 2014 F 2015 F 2016 F 2014 F 2015 F 2016 F
AEGON 0.68 0.74 0.80 0.23 0.25 0.27 0.53 0.55 0.58 8.0 8.5 9.0
Allianz 13.8 14.4 15.2 6.0 6.2 7.3 11.6 12.2 13.0 77 85 93
Aviva 45.0 50.6 56.3 17.0 19.0 22.0 33.7 39.2 43.3 222 252 286
AXA 2.17 2.29 2.46 0.91 0.99 1.11 1.68 1.81 1.96 13.2 14.3 15.5
Generali 1.54 1.76 1.91 0.58 0.75 0.85 1.66 1.55 1.65 9.7 10.9 12.0
Prudential 99 111 124 35.5 39.2 43.1 81 90 100 385 461 545
Zurich 25.5 26.5 27.4 17.1 17.2 17.8 23.8 24.9 25.4 167 178 190
* Prudential's higher growth profile with share price ratings justifiably higher
With closure possible post Solvency
II
Financials
Initiating Coverage
6 August 2014
page 10 of 116 , Equity Analyst, 44 (0) 20 7029 8784, [email protected] Cathcart
Please see important disclosure information on pages 113 - 116 of this report.
Risks Aside from the economic risks outlined above (falling investment yields, equity market
decline, widening corporate bond spreads), and the specific workings of deflation and
reflation leading to decreased/increased demand for products and higher/lower claims,
there are the insurance risks. These include the rating cycle in non-life, where price
aggregators might force a secular decline in pricing power; a sudden and unexpected
escalation in non-life claims; longevity and mortality risks, where people live longer or
shorter than assumed in pricing assumptions; and distribution shifts, where cheaper forms
of customer access (Apps, internet) undermine the traditional agency structures. There
are also the regulatory risks to contend with, which might impact product relevance (tax
breaks removed, annuity rules changed) and distribution channels (UK RDR for example).
Financials
Initiating Coverage
6 August 2014
page 11 of 116 , Equity Analyst, 44 (0) 20 7029 8784, [email protected] Cathcart
Please see important disclosure information on pages 113 - 116 of this report.
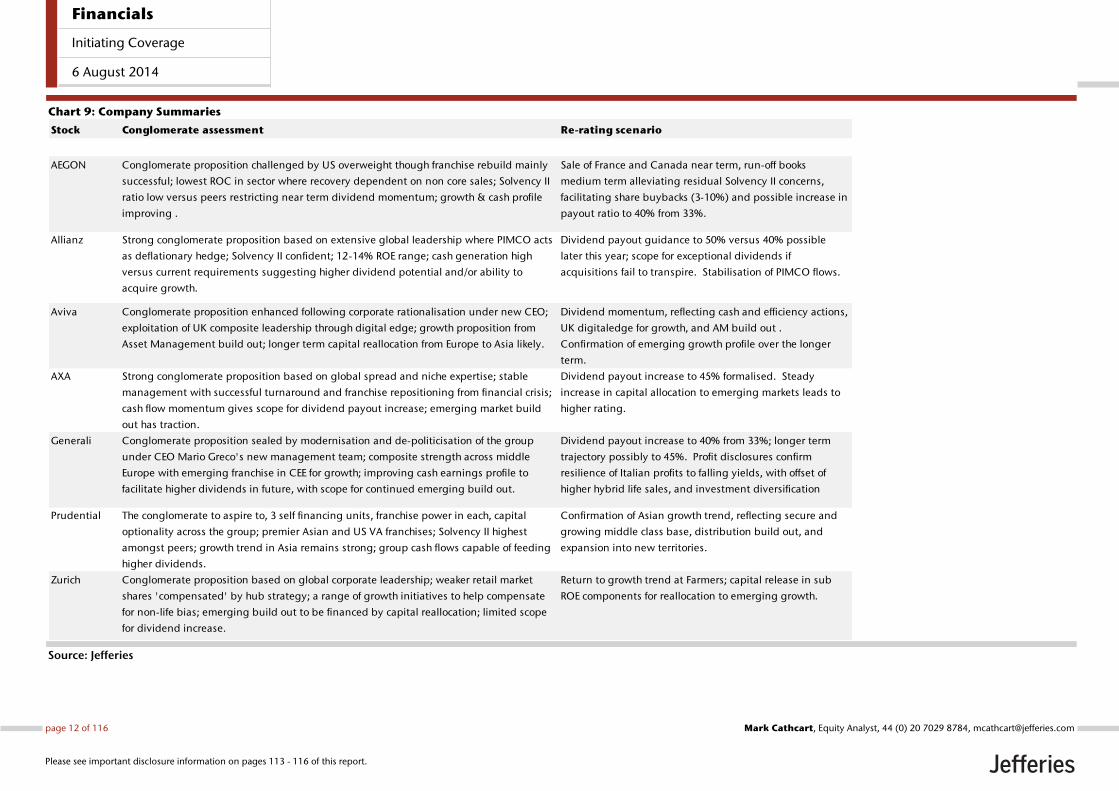
Chart 9: Company Summaries
Source: Jefferies
Stock Conglomerate assessment Re-rating scenario
AEGON Conglomerate proposition challenged by US overweight though franchise rebuild mainly
successful; lowest ROC in sector where recovery dependent on non core sales; Solvency II
ratio low versus peers restricting near term dividend momentum; growth & cash profile
improving .
Sale of France and Canada near term, run-off books
medium term alleviating residual Solvency II concerns,
facilitating share buybacks (3-10%) and possible increase in
payout ratio to 40% from 33%.
Allianz Strong conglomerate proposition based on extensive global leadership where PIMCO acts
as deflationary hedge; Solvency II confident; 12-14% ROE range; cash generation high
versus current requirements suggesting higher dividend potential and/or ability to
acquire growth.
Dividend payout guidance to 50% versus 40% possible
later this year; scope for exceptional dividends if
acquisitions fail to transpire. Stabilisation of PIMCO flows.
Aviva Conglomerate proposition enhanced following corporate rationalisation under new CEO;
exploitation of UK composite leadership through digital edge; growth proposition from
Asset Management build out; longer term capital reallocation from Europe to Asia likely.
Dividend momentum, reflecting cash and efficiency actions,
UK digitaledge for growth, and AM build out .
Confirmation of emerging growth profile over the longer
term.
AXA Strong conglomerate proposition based on global spread and niche expertise; stable
management with successful turnaround and franchise repositioning from financial crisis;
cash flow momentum gives scope for dividend payout increase; emerging market build
out has traction.
Dividend payout increase to 45% formalised. Steady
increase in capital allocation to emerging markets leads to
higher rating.
Generali Conglomerate proposition sealed by modernisation and de-politicisation of the group
under CEO Mario Greco's new management team; composite strength across middle
Europe with emerging franchise in CEE for growth; improving cash earnings profile to
facilitate higher dividends in future, with scope for continued emerging build out.
Dividend payout increase to 40% from 33%; longer term
trajectory possibly to 45%. Profit disclosures confirm
resilience of Italian profits to falling yields, with offset of
higher hybrid life sales, and investment diversification
Prudential The conglomerate to aspire to, 3 self financing units, franchise power in each, capital
optionality across the group; premier Asian and US VA franchises; Solvency II highest
amongst peers; growth trend in Asia remains strong; group cash flows capable of feeding
higher dividends.
Confirmation of Asian growth trend, reflecting secure and
growing middle class base, distribution build out, and
expansion into new territories.
Zurich Conglomerate proposition based on global corporate leadership; weaker retail market
shares 'compensated' by hub strategy; a range of growth initiatives to help compensate
for non-life bias; emerging build out to be financed by capital reallocation; limited scope
for dividend increase.
Return to growth trend at Farmers; capital release in sub
ROE components for reallocation to emerging growth.
Financials
Initiating Coverage
6 August 2014
page 12 of 116 , Equity Analyst, 44 (0) 20 7029 8784, [email protected] Cathcart
Please see important disclosure information on pages 113 - 116 of this report.
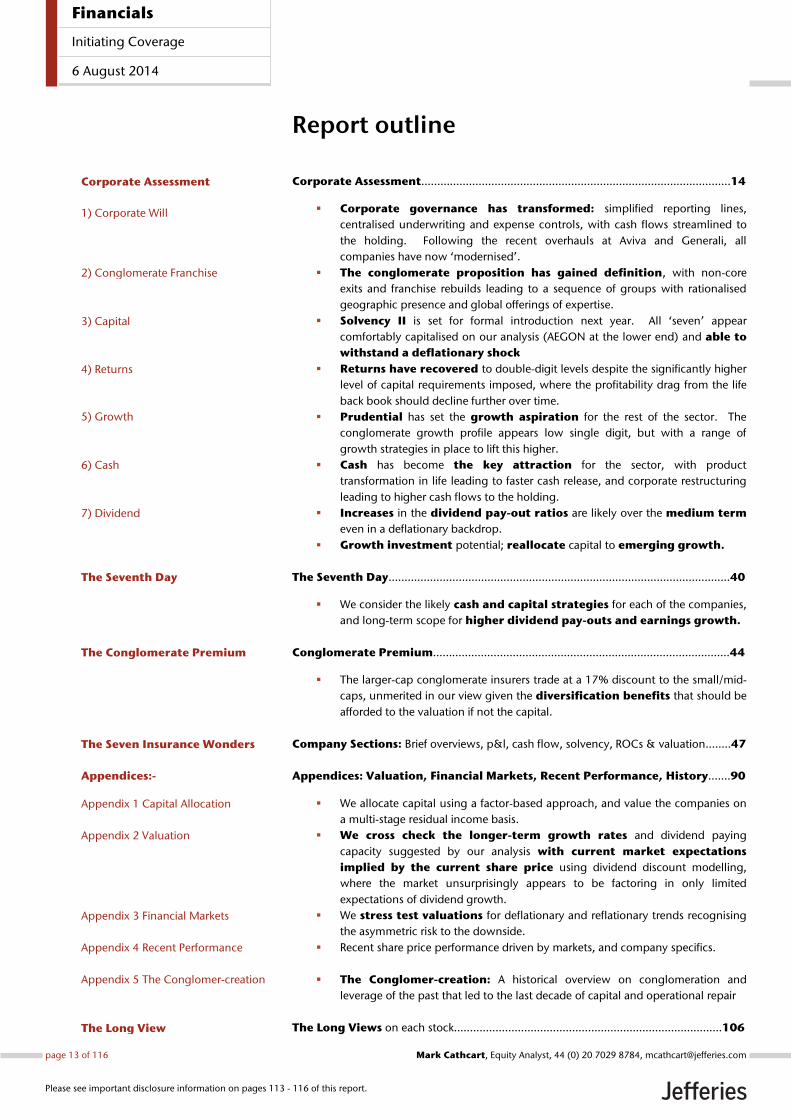
Report outline
Corporate Assessment…………………………………………………….………………………………14
Corporate governance has transformed: simplified reporting lines,
centralised underwriting and expense controls, with cash flows streamlined to
the holding. Following the recent overhauls at Aviva and Generali, all
companies have now ‘modernised’.
The conglomerate proposition has gained definition, with non-core
exits and franchise rebuilds leading to a sequence of groups with rationalised
geographic presence and global offerings of expertise.
Solvency II is set for formal introduction next year. All ‘seven’ appear
comfortably capitalised on our analysis (AEGON at the lower end) and able to
withstand a deflationary shock
Returns have recovered to double-digit levels despite the significantly higher
level of capital requirements imposed, where the profitability drag from the life
back book should decline further over time.
Prudential has set the growth aspiration for the rest of the sector. The
conglomerate growth profile appears low single digit, but with a range of
growth strategies in place to lift this higher.
Cash has become the key attraction for the sector, with product
transformation in life leading to faster cash release, and corporate restructuring
leading to higher cash flows to the holding.
Increases in the dividend pay-out ratios are likely over the medium term
even in a deflationary backdrop.
Growth investment potential; reallocate capital to emerging growth.
The Seventh Day……………………………………………………….…………………………………….40
We consider the likely cash and capital strategies for each of the companies,
and long-term scope for higher dividend pay-outs and earnings growth.
Conglomerate Premium………………………………………………………………………….…..…44
The larger-cap conglomerate insurers trade at a 17% discount to the small/mid-
caps, unmerited in our view given the diversification benefits that should be
afforded to the valuation if not the capital.
Company Sections: Brief overviews, p&l, cash flow, solvency, ROCs & valuation……..47
Appendices: Valuation, Financial Markets, Recent Performance, History…....90
We allocate capital using a factor-based approach, and value the companies on
a multi-stage residual income basis.
We cross check the longer-term growth rates and dividend paying
capacity suggested by our analysis with current market expectations
implied by the current share price using dividend discount modelling,
where the market unsurprisingly appears to be factoring in only limited
expectations of dividend growth.
We stress test valuations for deflationary and reflationary trends recognising
the asymmetric risk to the downside.
Recent share price performance driven by markets, and company specifics.
The Conglomer-creation: A historical overview on conglomeration and
leverage of the past that led to the last decade of capital and operational repair
The Long Views on each stock…………………………………………………………………..…….106
2) Conglomerate Franchise
3) Capital
4) Returns
5) Growth
6) Cash
7) Dividend
Corporate Assessment
The Seventh Day
The Conglomerate Premium
The Seven Insurance Wonders
Appendices:-
Appendix 1 Capital Allocation
Appendix 2 Valuation
The Long View
Appendix 4 Recent Performance
Appendix 3 Financial Markets
1) Corporate Will
Appendix 5 The Conglomer-creation
Financials
Initiating Coverage
6 August 2014
page 13 of 116 , Equity Analyst, 44 (0) 20 7029 8784, [email protected] Cathcart
Please see important disclosure information on pages 113 - 116 of this report.
Corporate Assessment: Ocean 7 The challenges that the insurance conglomerates have faced since the turn of
the millennium have been as tough as any 7 Ocean challenge, and not all
made it (Fortis and ING). Two equity market collapses, a seismic fall in bond
yields, the global financial crisis alongside, and a host of 1:200 year events
(natural and man-made) all took their toll. We highlight the main areas
where we believe the conglomerates disappointed in the past, where the
companies are today in relation to these issues, and structural changes that
might occur in the future.
Corporate will: corporate governance, management style and objectives.
Conglomerate franchise: market share, distribution power and the benefit of
the groupings to the shareholder.
Capital: tangible strength, and debt reliance.
Return: ROC’s by division with likely medium-term progression.
Growth: divisional and composite growth rates; strategies to increase market
share.
Cash: holding cash flows and dividend cover.
Dividend: strategic direction when cash and capital levels allow a ‘free’
corporate rein.
The Seventh Day: We explore the longer-term structure of the companies,
potential for capital reallocation, and likely mix of cash for dividend and cash for
growth. We are equally supportive of self-funded cash for acquisitions given the
ability management teams have displayed in recent years in corporate and IT
integration, where Solvency II facilitates a much tighter understanding of the
financial risks that are being acquired.
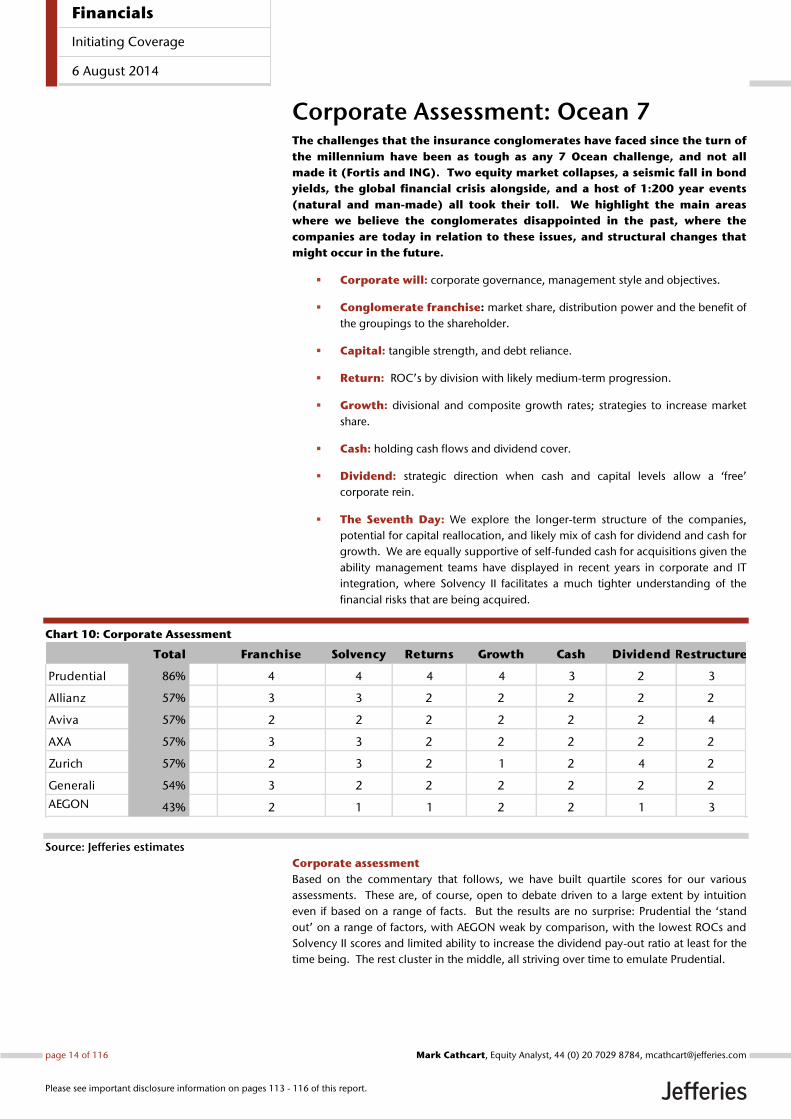
Chart 10: Corporate Assessment
Source: Jefferies estimates
Corporate assessment
Based on the commentary that follows, we have built quartile scores for our various
assessments. These are, of course, open to debate driven to a large extent by intuition
even if based on a range of facts. But the results are no surprise: Prudential the ‘stand
out’ on a range of factors, with AEGON weak by comparison, with the lowest ROCs and
Solvency II scores and limited ability to increase the dividend pay-out ratio at least for the
time being. The rest cluster in the middle, all striving over time to emulate Prudential.
Total Franchise Solvency Returns Growth Cash Dividend Restructure
Prudential 86% 4 4 4 4 3 2 3
Allianz 57% 3 3 2 2 2 2 2
Aviva 57% 2 2 2 2 2 2 4
AXA 57% 3 3 2 2 2 2 2
Zurich 57% 2 3 2 1 2 4 2
Generali 54% 3 2 2 2 2 2 2
AEGON 43% 2 1 1 2 2 1 3
Financials
Initiating Coverage
6 August 2014
page 14 of 116 , Equity Analyst, 44 (0) 20 7029 8784, [email protected] Cathcart
Please see important disclosure information on pages 113 - 116 of this report.
1) Corporate Will: ‘kill complexity’ The management teams of the ‘seven’ are all ‘proven’, with track records of
successful operational re-engineering and balance sheet repair, whether in
their existing roles, or previous positions of leadership. An overhaul of
internal corporate governance has been wide-scale yet crucial to secure risk
controls, best allocation of group capital, and ultimately flows of cash to the
holding, with Aviva and Generali the most recent to restructure.
Chart 12 (overleaf) highlights the corporate changes since the last CEO appointment,
both in terms of governance structures, and profitability targets/achievements:
Prudential has set the corporate aspiration with a management team that has
been repositioning the group towards cash and growth for the past decade with
growth and return objectives that have surpassed internally set expectations.
AEGON, Allianz and AXA management have proved remarkably stable given
the range of challenges to their business models since the financial crisis, with all
successfully changing operational and strategic tack during their tenure.
Aviva and Generali are late in the restructuring cycle and consequently have
the highest momentum of change; corporate reinvention at the former,
governance modernization at the latter.
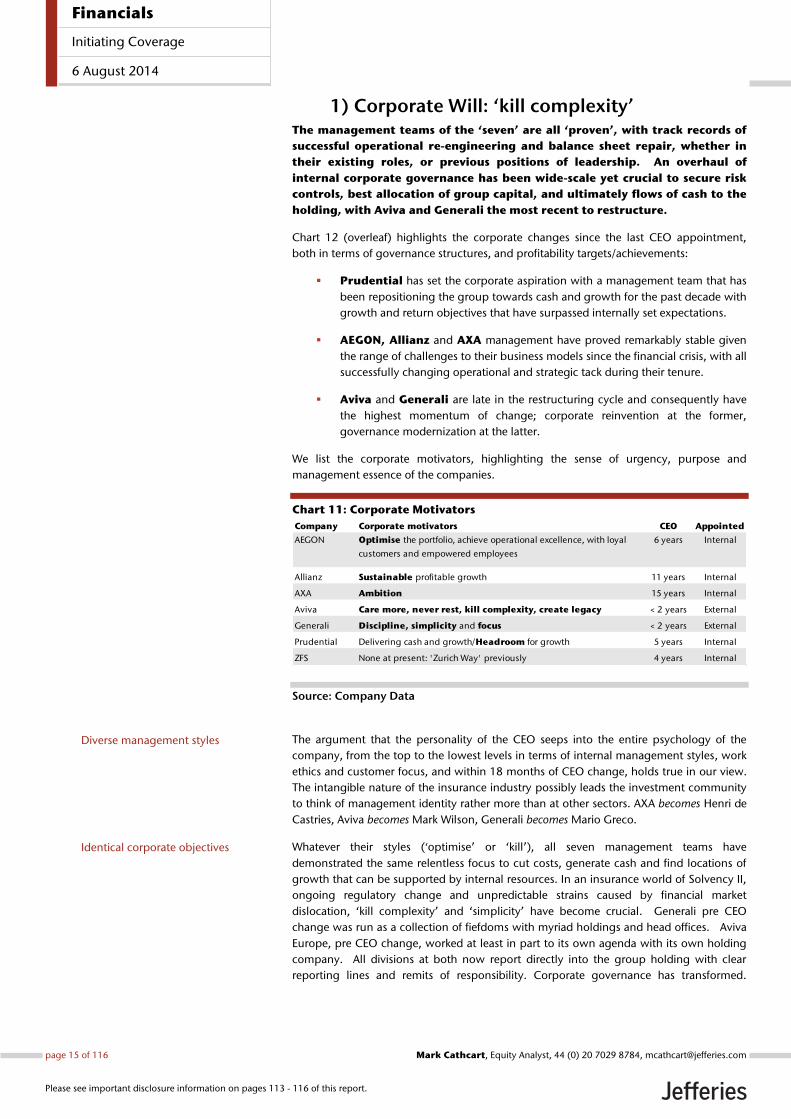
We list the corporate motivators, highlighting the sense of urgency, purpose and
management essence of the companies.
Chart 11: Corporate Motivators
Source: Company Data
The argument that the personality of the CEO seeps into the entire psychology of the
company, from the top to the lowest levels in terms of internal management styles, work
ethics and customer focus, and within 18 months of CEO change, holds true in our view.
The intangible nature of the insurance industry possibly leads the investment community
to think of management identity rather more than at other sectors. AXA becomes Henri de
Castries, Aviva becomes Mark Wilson, Generali becomes Mario Greco.
Whatever their styles (‘optimise’ or ‘kill’), all seven management teams have
demonstrated the same relentless focus to cut costs, generate cash and find locations of
growth that can be supported by internal resources. In an insurance world of Solvency II,
ongoing regulatory change and unpredictable strains caused by financial market
dislocation, ‘kill complexity’ and ‘simplicity’ have become crucial. Generali pre CEO
change was run as a collection of fiefdoms with myriad holdings and head offices. Aviva
Europe, pre CEO change, worked at least in part to its own agenda with its own holding
company. All divisions at both now report directly into the group holding with clear
reporting lines and remits of responsibility. Corporate governance has transformed.
Company Corporate motivators CEO Appointed
AEGON Optimise the portfolio, achieve operational excellence, with loyal
customers and empowered employees
6 years Internal
Allianz Sustainable profitable growth 11 years Internal
AXA Ambition 15 years Internal
Aviva Care more, never rest, kill complexity, create legacy < 2 years External
Generali Discipline, simplicity and focus < 2 years External
Prudential Delivering cash and growth/Headroom for growth 5 years Internal
ZFS None at present: 'Zurich Way' previously 4 years Internal
Diverse management styles
Identical corporate objectives
Financials
Initiating Coverage
6 August 2014
page 15 of 116 , Equity Analyst, 44 (0) 20 7029 8784, [email protected] Cathcart
Please see important disclosure information on pages 113 - 116 of this report.
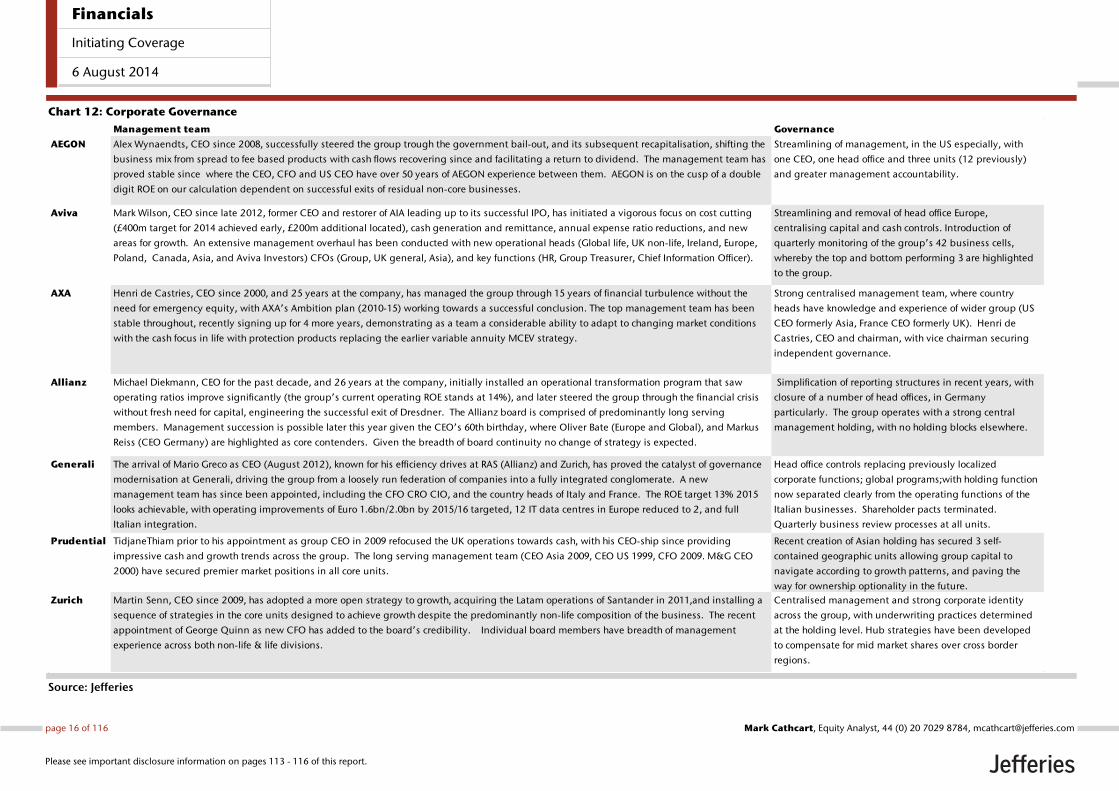
Chart 12: Corporate Governance
Source: Jefferies
Management team Governance
AEGON Alex Wynaendts, CEO since 2008, successfully steered the group trough the government bail-out, and its subsequent recapitalisation, shifting the
business mix from spread to fee based products with cash flows recovering since and facilitating a return to dividend. The management team has
proved stable since where the CEO, CFO and US CEO have over 50 years of AEGON experience between them. AEGON is on the cusp of a double
digit ROE on our calculation dependent on successful exits of residual non-core businesses.
Streamlining of management, in the US especially, with
one CEO, one head office and three units (12 previously)
and greater management accountability.
Aviva Mark Wilson, CEO since late 2012, former CEO and restorer of AIA leading up to its successful IPO, has initiated a vigorous focus on cost cutting
(£400m target for 2014 achieved early, £200m additional located), cash generation and remittance, annual expense ratio reductions, and new
areas for growth. An extensive management overhaul has been conducted with new operational heads (Global life, UK non-life, Ireland, Europe,
Poland, Canada, Asia, and Aviva Investors) CFOs (Group, UK general, Asia), and key functions (HR, Group Treasurer, Chief Information Officer).
Streamlining and removal of head office Europe,
centralising capital and cash controls. Introduction of
quarterly monitoring of the group’s 42 business cells,
whereby the top and bottom performing 3 are highlighted
to the group.
AXA Henri de Castries, CEO since 2000, and 25 years at the company, has managed the group through 15 years of financial turbulence without the
need for emergency equity, with AXA’s Ambition plan (2010-15) working towards a successful conclusion. The top management team has been
stable throughout, recently signing up for 4 more years, demonstrating as a team a considerable ability to adapt to changing market conditions
with the cash focus in life with protection products replacing the earlier variable annuity MCEV strategy.
Strong centralised management team, where country
heads have knowledge and experience of wider group (US
CEO formerly Asia, France CEO formerly UK). Henri de
Castries, CEO and chairman, with vice chairman securing
independent governance.
Allianz Michael Diekmann, CEO for the past decade, and 26 years at the company, initially installed an operational transformation program that saw
operating ratios improve significantly (the group’s current operating ROE stands at 14%), and later steered the group through the financial crisis
without fresh need for capital, engineering the successful exit of Dresdner. The Allianz board is comprised of predominantly long serving
members. Management succession is possible later this year given the CEO’s 60th birthday, where Oliver Bate (Europe and Global), and Markus
Reiss (CEO Germany) are highlighted as core contenders. Given the breadth of board continuity no change of strategy is expected.
Simplification of reporting structures in recent years, with
closure of a number of head offices, in Germany
particularly. The group operates with a strong central
management holding, with no holding blocks elsewhere.
Generali The arrival of Mario Greco as CEO (August 2012), known for his efficiency drives at RAS (Allianz) and Zurich, has proved the catalyst of governance
modernisation at Generali, driving the group from a loosely run federation of companies into a fully integrated conglomerate. A new
management team has since been appointed, including the CFO CRO CIO, and the country heads of Italy and France. The ROE target 13% 2015
looks achievable, with operating improvements of Euro 1.6bn/2.0bn by 2015/16 targeted, 12 IT data centres in Europe reduced to 2, and full
Italian integration.
Head office controls replacing previously localized
corporate functions; global programs;with holding function
now separated clearly from the operating functions of the
Italian businesses. Shareholder pacts terminated.
Quarterly business review processes at all units.
Prudential TidjaneThiam prior to his appointment as group CEO in 2009 refocused the UK operations towards cash, with his CEO-ship since providing
impressive cash and growth trends across the group. The long serving management team (CEO Asia 2009, CEO US 1999, CFO 2009. M&G CEO
2000) have secured premier market positions in all core units.
Recent creation of Asian holding has secured 3 self-
contained geographic units allowing group capital to
navigate according to growth patterns, and paving the
way for ownership optionality in the future.
Zurich Martin Senn, CEO since 2009, has adopted a more open strategy to growth, acquiring the Latam operations of Santander in 2011,and installing a
sequence of strategies in the core units designed to achieve growth despite the predominantly non-life composition of the business. The recent
appointment of George Quinn as new CFO has added to the board’s credibility. Individual board members have breadth of management
experience across both non-life & life divisions.
Centralised management and strong corporate identity
across the group, with underwriting practices determined
at the holding level. Hub strategies have been developed
to compensate for mid market shares over cross border
regions.
Financials
Initiating Coverage
6 August 2014
page 16 of 116 , Equity Analyst, 44 (0) 20 7029 8784, [email protected] Cathcart
Please see important disclosure information on pages 113 - 116 of this report.

2) Conglomerate franchise: ‘focus’ Insurance conglomerates have been gaining definition across the sector since
the financial crisis through non-core exits and focus on strengths. Prudential
is the corporate paradigm for now, though we note the ongoing
improvements elsewhere, where franchise rebuilds have been required in a
number of core markets.
The conglomerate proposition
Prudential the paradigm franchise: number one rankings (UK asset management,
US variable annuities, the market leading Asian franchise) with brand strengths that can
each generate their own momentum: ‘M&G’ and ‘Prudential’ in the UK, ‘Jackson’ in the
US, with the ‘Prudential’ brand on bill boards and neon lights across vast swathes of Asia
as visible as any Coca Cola. The UK has purposefully been pared back in product base to
form a cash generator for the group; Asia is building its own franchise power feeding
earnings growth to the group level, self-funding, and where success in Indonesia is
inspiring distribution partners to team up with Prudential elsewhere (most recently
Thanachart in Thailand); Jackson is an expert in drawdown annuity products, relevant to
the UK division post annuity budget changes, and arguably de-risks the group to any
negative economic development in Asia post tapering, with any rise in US interest rates
accompanying the tapering trend increasing Jackson’s economic value.
We assess the conglomerate proposition at the other six. Chart 12 sets out the
conglomerate propositions of the other companies aside from Prudential: global
leadership (Allianz non-life, AXA insurance, Zurich corporate), core strengths (AEGON
pensions and retirement savings for example), and cross-border efficiencies (Generali
most notably).
In the same chart, we address the conglomeration challenges, highlighting the two that
are most likely to impact share price ratings currently:
AEGON ‘US heavy’: Solvency II will most likely disallow diversification benefits
for US businesses (>50% of the total). Earlier attempts to grow Europe to
compensate stalled (UK RDR dislocation, CEE pension rule changes), but are
likely to be reinvigorated post capital repair.
Allianz’s PIMCO rationale: Profits from the global leader in bond asset
management have increased to close to 30% of group total in recent years.
Profit streams at PIMCO rise as interest rates fall with fees increasing on rising
bond values, a trend that neatly offsets the negative impact of falling yields on
life guarantees in the European portfolio. PIMCO outflows have proved
problematic over the past year, following US tapering and the bond markets
sell-off, exacerbated by a performance blip in Bill Gross’s core fund, and the
resignation of the group CEO earlier this year. Allianz remain committed to
PIMCO as its in-house asset manager, and has responded by significant fund
diversification over the past year, and management strengthening (the
appointment of six new deputy CIO’s alongside Bill Gross as CIO, with the new
CEO former COO).
The franchise collection
Market shares and rankings for each of the companies are listed on a by-country basis in
the later company sections, with customer segmentation and product focus highlighted
within countries where relevant. Non-core sales have been especially helpful in this
regard (AEGON US reinsurance, Allianz Dresdner, Aviva Amerus, AXA UK life, Generali US
reinsurance & Migdal Israel, Prudential Egg, Zurich Scudder & Converium).
Financial market moves (falling bond yields impacting spread-based products with
guarantees), regulatory changes (UK budget impact on UK annuities for example), and
distribution shifts (migration to direct and internet from traditional agency) can lead to
product lines becoming suddenly unprofitable and business models that risk redundancy.
Non-core exits
Franchise rebuilds
Financials
Initiating Coverage
6 August 2014
page 17 of 116 , Equity Analyst, 44 (0) 20 7029 8784, [email protected] Cathcart
Please see important disclosure information on pages 113 - 116 of this report.
We highlight the core threats that each company has faced under current management
teams and the effectiveness of the response. AEGON and AXA have been noteworthy in
this regard with wide-scale product overhaul successfully achieved post financial crisis.
Aviva is currently reinvigorating its business proposition across its core markets.
AEGON: The group has required a sequence of franchise rebuilds: in the US
from spread-based products (fixed annuities, GICs) to fee income (variable
annuity, pensions funds) to compensate for low interest rates; in the UK from
IFA to platform distribution post RDR dislocation; and in the Dutch market an
increased focus on corporate pensions where individual life is being eroded by
increased competition from the banks following regulatory change. The US
rebuild has proved remarkably successful with notable momentum in the fee-
driven components of VA and pensions; the Dutch group pension business has
further consolidated its market leadership, where AEGON Bank and Knab (on-
line banking) should help preserve individual life rankings; the UK has yet to
convince, however, where the platform strategy designed to offset IFA
dependency is in the final phase of build-out.
Allianz: Reliance on tied agency distribution in Germany, where Allianz is
market leader, has been a perennial concern, but where brand strength, a range
of innovative products in life (Perspective and Index) and modular packaging in
non-life has so far maintained if not enhanced market shares.
Aviva: Market shares in UK life and non-life have been steadily falling in recent
years from mid-teens to closer to 10%. The new management team are
confident of a return to growth over the next 12 months, with their
technological edge, market leading app, website that gives customer access to
all Aviva products, and purchase ability. The planned build-out of Aviva
Investors under new management, with Euan Munroe seeking to replicate his
success of GARs at Standard Life with AIMs, should also help the UK proposition.
AXA: The life offering has transformed across the group over the past five years,
from traditional savings to unit linked and protection, with the US VA offering
successfully overhauled in the process. The build-out of emerging growth has
also been notable (12% of group profits more than doubling since 2009).
Generali: The Italian life business is in the process of refocusing sales away
from traditional savings to hybrid products with unit-linked elements under the
new management team. Initial signs of momentum following this year’s
product launch bode well.
Prudential: Asian focus on unit-linked investment policies with health and
protection riders (CEO Asia Barry Stowe was head of health at AIA before his
arrival in 2006) has successfully located the core insurance need of the growing
middle classes, driving substantial growth in recent years. The US annuity
business in the mean-time has benefited from above-market growth in variable
annuities thanks to its conservative hedging programme ahead of the financial
crisis. The move towards cash focused life a decade ago in the UK, as well as
Asia and the US, has been inspirational to the rest of the sector.
Zurich: Farmers management in the US has recently adopted an ‘omni’ sales
approach (agencies and direct working in connection) to combat loss of market
share to the direct writers in their core auto business.
Financials
Initiating Coverage
6 August 2014
page 18 of 116 , Equity Analyst, 44 (0) 20 7029 8784, [email protected] Cathcart
Please see important disclosure information on pages 113 - 116 of this report.
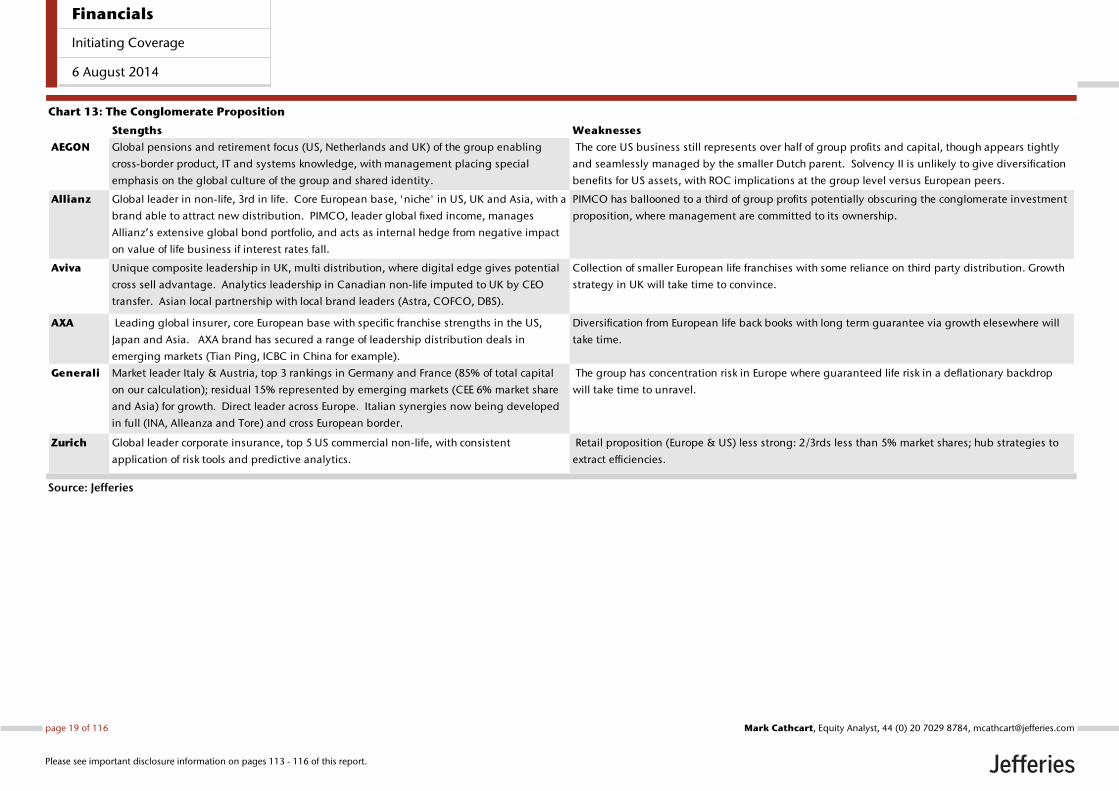
Chart 13: The Conglomerate Proposition
Source: Jefferies
Stengths Weaknesses
AEGON Global pensions and retirement focus (US, Netherlands and UK) of the group enabling
cross-border product, IT and systems knowledge, with management placing special
emphasis on the global culture of the group and shared identity.
The core US business still represents over half of group profits and capital, though appears tightly
and seamlessly managed by the smaller Dutch parent. Solvency II is unlikely to give diversification
benefits for US assets, with ROC implications at the group level versus European peers.
Allianz Global leader in non-life, 3rd in life. Core European base, 'niche' in US, UK and Asia, with a
brand able to attract new distribution. PIMCO, leader global fixed income, manages
Allianz’s extensive global bond portfolio, and acts as internal hedge from negative impact
on value of life business if interest rates fall.
PIMCO has ballooned to a third of group profits potentially obscuring the conglomerate investment
proposition, where management are committed to its ownership.
Aviva Unique composite leadership in UK, multi distribution, where digital edge gives potential
cross sell advantage. Analytics leadership in Canadian non-life imputed to UK by CEO
transfer. Asian local partnership with local brand leaders (Astra, COFCO, DBS).
Collection of smaller European life franchises with some reliance on third party distribution. Growth
strategy in UK will take time to convince.
AXA Leading global insurer, core European base with specific franchise strengths in the US,
Japan and Asia. AXA brand has secured a range of leadership distribution deals in
emerging markets (Tian Ping, ICBC in China for example).
Diversification from European life back books with long term guarantee via growth elesewhere will
take time.
Generali Market leader Italy & Austria, top 3 rankings in Germany and France (85% of total capital
on our calculation); residual 15% represented by emerging markets (CEE 6% market share
and Asia) for growth. Direct leader across Europe. Italian synergies now being developed
in full (INA, Alleanza and Tore) and cross European border.
The group has concentration risk in Europe where guaranteed life risk in a deflationary backdrop
will take time to unravel.
Zurich Global leader corporate insurance, top 5 US commercial non-life, with consistent
application of risk tools and predictive analytics.
Retail proposition (Europe & US) less strong: 2/3rds less than 5% market shares; hub strategies to
extract efficiencies.
Financials
Initiating Coverage
6 August 2014
page 19 of 116 , Equity Analyst, 44 (0) 20 7029 8784, [email protected] Cathcart
Please see important disclosure information on pages 113 - 116 of this report.
3) Capital: ‘sustainability’ With Economic Solvency ratios typically around 200%, any additional capital
demands ahead of final implementation of Solvency II (and any new layers
from G-SII) should be absorbed by existing buffers, in our view, with the ratio
improving sufficiently over time from future earnings to cover any potential
gaps. Leverage levels supporting the capital have also been steadily falling
and at all companies will have dropped to targeted levels by 2016 at the
latest on our calculation. Based on the sensitivities supplied by the
companies, the capital bases at current levels also appear strong enough to
absorb a deflationary shock. AEGON appears the least strong on Solvency II
reflecting, on our understanding, the more penal treatment of US assets
versus local regulation, an issue that brings into spotlight potential for future
changes to US ownership structures across the conglomerate insurers.
Economic Solvency
Solvency II is timetabled for full implementation by 2015. Assessing relative
capital strength of insurance companies is currently more difficult than usual
for a variety of reasons:
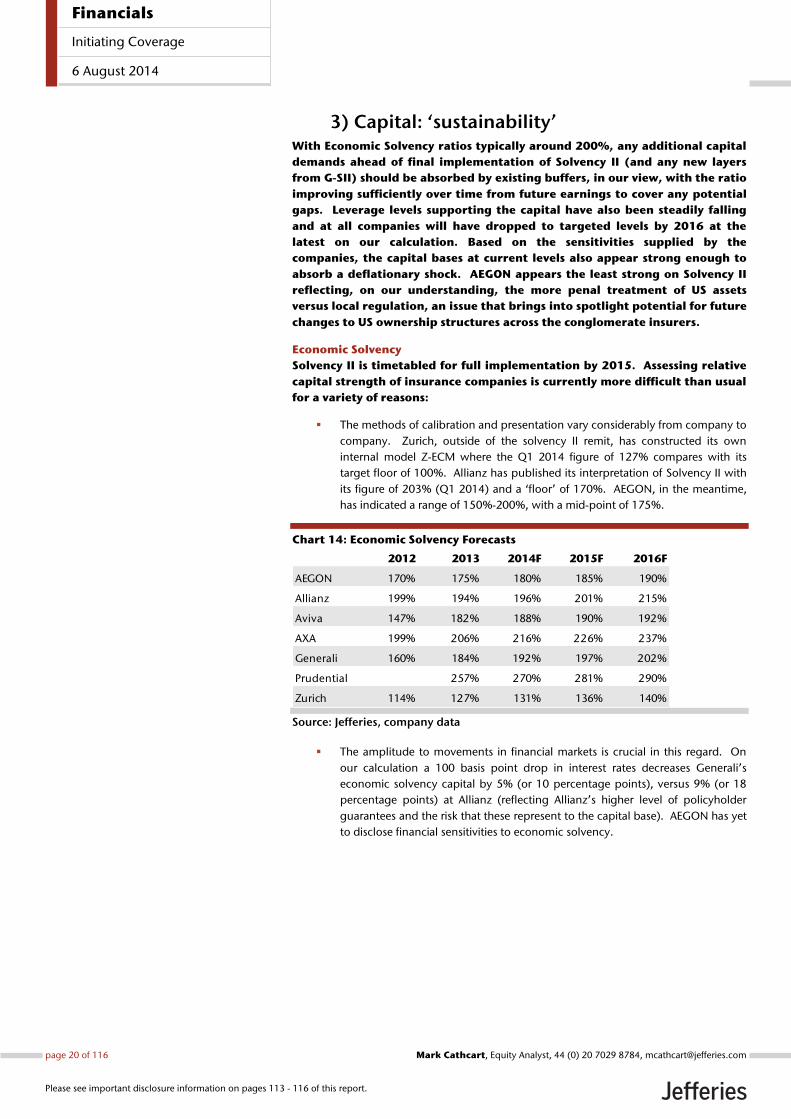
The methods of calibration and presentation vary considerably from company to
company. Zurich, outside of the solvency II remit, has constructed its own
internal model Z-ECM where the Q1 2014 figure of 127% compares with its
target floor of 100%. Allianz has published its interpretation of Solvency II with
its figure of 203% (Q1 2014) and a ‘floor’ of 170%. AEGON, in the meantime,
has indicated a range of 150%-200%, with a mid-point of 175%.
Chart 14: Economic Solvency Forecasts
Source: Jefferies, company data
The amplitude to movements in financial markets is crucial in this regard. On
our calculation a 100 basis point drop in interest rates decreases Generali’s
economic solvency capital by 5% (or 10 percentage points), versus 9% (or 18
percentage points) at Allianz (reflecting Allianz’s higher level of policyholder
guarantees and the risk that these represent to the capital base). AEGON has yet
to disclose financial sensitivities to economic solvency.
2012 2013 2014F 2015F 2016F
AEGON 170% 175% 180% 185% 190%
Allianz 199% 194% 196% 201% 215%
Aviva 147% 182% 188% 190% 192%
AXA 199% 206% 216% 226% 237%
Generali 160% 184% 192% 197% 202%
Prudential 257% 270% 281% 290%
Zurich 114% 127% 131% 136% 140%
Financials
Initiating Coverage
6 August 2014
page 20 of 116 , Equity Analyst, 44 (0) 20 7029 8784, [email protected] Cathcart
Please see important disclosure information on pages 113 - 116 of this report.
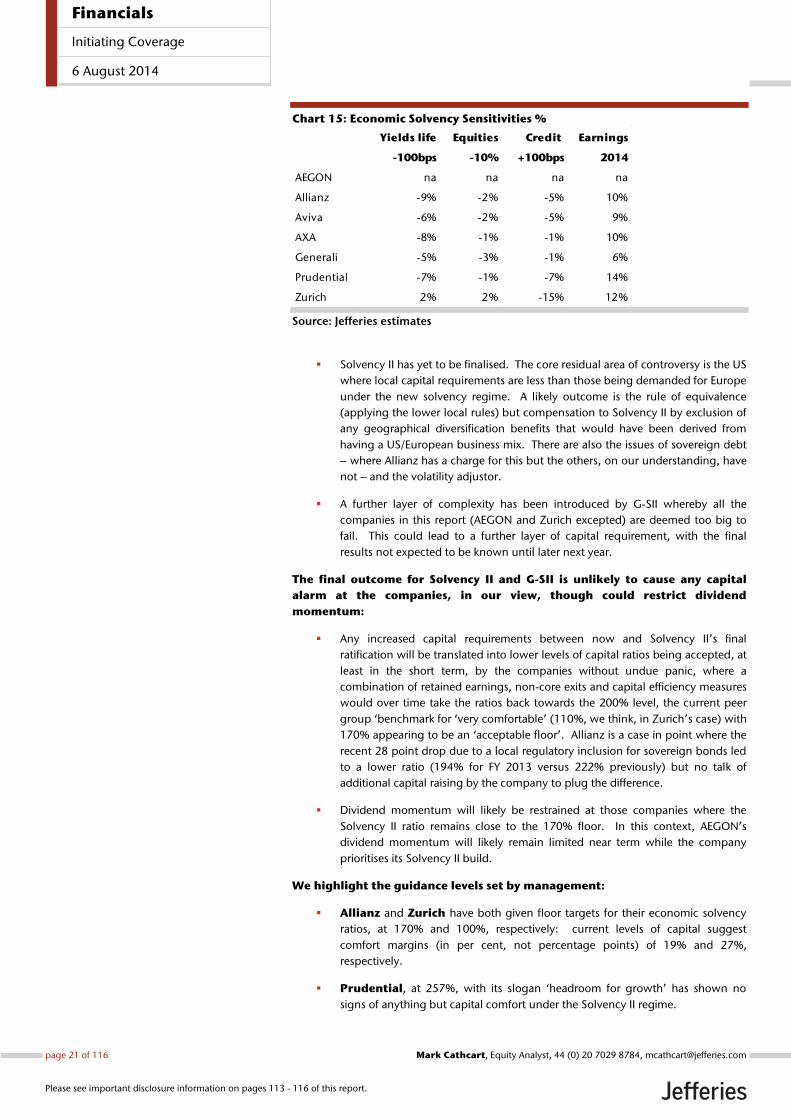
Chart 15: Economic Solvency Sensitivities %
Source: Jefferies estimates
Solvency II has yet to be finalised. The core residual area of controversy is the US
where local capital requirements are less than those being demanded for Europe
under the new solvency regime. A likely outcome is the rule of equivalence
(applying the lower local rules) but compensation to Solvency II by exclusion of
any geographical diversification benefits that would have been derived from
having a US/European business mix. There are also the issues of sovereign debt
– where Allianz has a charge for this but the others, on our understanding, have
not – and the volatility adjustor.
A further layer of complexity has been introduced by G-SII whereby all the
companies in this report (AEGON and Zurich excepted) are deemed too big to
fail. This could lead to a further layer of capital requirement, with the final
results not expected to be known until later next year.
The final outcome for Solvency II and G-SII is unlikely to cause any capital
alarm at the companies, in our view, though could restrict dividend
momentum:
Any increased capital requirements between now and Solvency II’s final
ratification will be translated into lower levels of capital ratios being accepted, at
least in the short term, by the companies without undue panic, where a
combination of retained earnings, non-core exits and capital efficiency measures
would over time take the ratios back towards the 200% level, the current peer
group ‘benchmark for ‘very comfortable’ (110%, we think, in Zurich’s case) with
170% appearing to be an ‘acceptable floor’. Allianz is a case in point where the
recent 28 point drop due to a local regulatory inclusion for sovereign bonds led
to a lower ratio (194% for FY 2013 versus 222% previously) but no talk of
additional capital raising by the company to plug the difference.
Dividend momentum will likely be restrained at those companies where the
Solvency II ratio remains close to the 170% floor. In this context, AEGON’s
dividend momentum will likely remain limited near term while the company
prioritises its Solvency II build.
We highlight the guidance levels set by management:
Allianz and Zurich have both given floor targets for their economic solvency
ratios, at 170% and 100%, respectively: current levels of capital suggest
comfort margins (in per cent, not percentage points) of 19% and 27%,
respectively.
Prudential, at 257%, with its slogan ‘headroom for growth’ has shown no
signs of anything but capital comfort under the Solvency II regime.
Yields life Equities Credit Earnings
-100bps -10% +100bps 2014
AEGON na na na na
Allianz -9% -2% -5% 10%
Aviva -6% -2% -5% 9%
AXA -8% -1% -1% 10%
Generali -5% -3% -1% 6%
Prudential -7% -1% -7% 14%
Zurich 2% 2% -15% 12%
Financials
Initiating Coverage
6 August 2014
page 21 of 116 , Equity Analyst, 44 (0) 20 7029 8784, [email protected] Cathcart
Please see important disclosure information on pages 113 - 116 of this report.
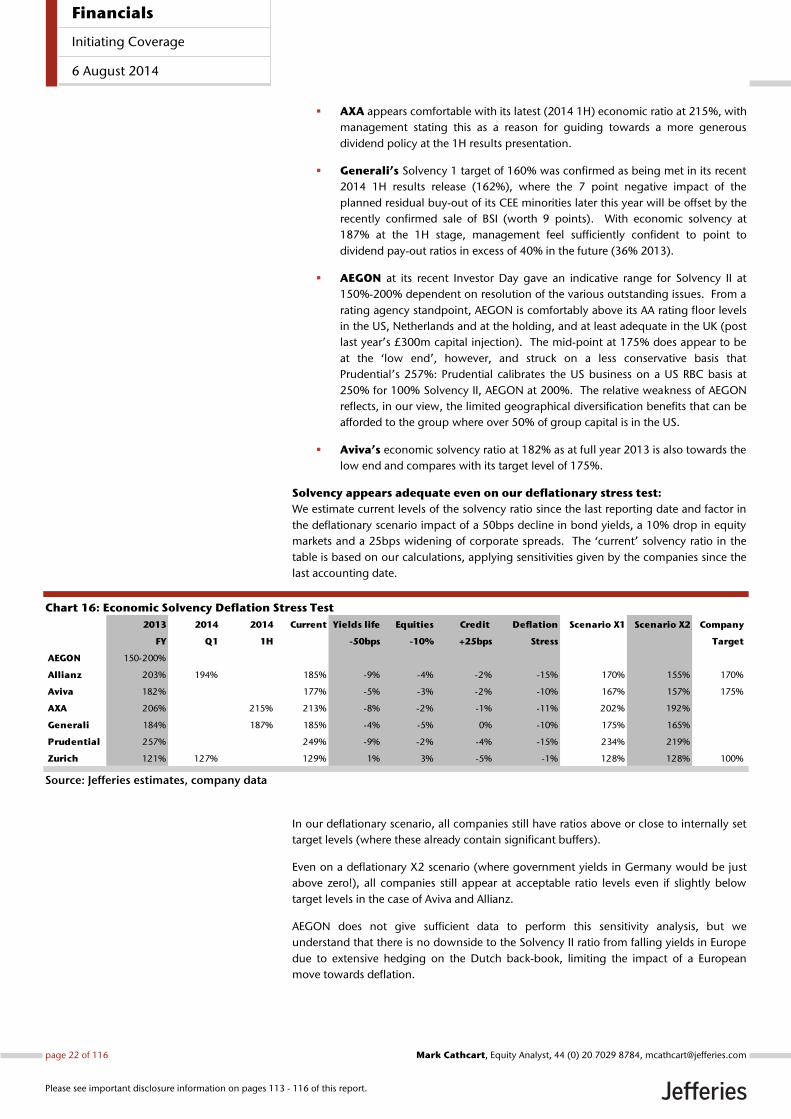
AXA appears comfortable with its latest (2014 1H) economic ratio at 215%, with
management stating this as a reason for guiding towards a more generous
dividend policy at the 1H results presentation.
Generali’s Solvency 1 target of 160% was confirmed as being met in its recent
2014 1H results release (162%), where the 7 point negative impact of the
planned residual buy-out of its CEE minorities later this year will be offset by the
recently confirmed sale of BSI (worth 9 points). With economic solvency at
187% at the 1H stage, management feel sufficiently confident to point to
dividend pay-out ratios in excess of 40% in the future (36% 2013).
AEGON at its recent Investor Day gave an indicative range for Solvency II at
150%-200% dependent on resolution of the various outstanding issues. From a
rating agency standpoint, AEGON is comfortably above its AA rating floor levels
in the US, Netherlands and at the holding, and at least adequate in the UK (post
last year’s £300m capital injection). The mid-point at 175% does appear to be
at the ‘low end’, however, and struck on a less conservative basis that
Prudential’s 257%: Prudential calibrates the US business on a US RBC basis at
250% for 100% Solvency II, AEGON at 200%. The relative weakness of AEGON
reflects, in our view, the limited geographical diversification benefits that can be
afforded to the group where over 50% of group capital is in the US.
Aviva’s economic solvency ratio at 182% as at full year 2013 is also towards the
low end and compares with its target level of 175%.
Solvency appears adequate even on our deflationary stress test:
We estimate current levels of the solvency ratio since the last reporting date and factor in
the deflationary scenario impact of a 50bps decline in bond yields, a 10% drop in equity
markets and a 25bps widening of corporate spreads. The ‘current’ solvency ratio in the
table is based on our calculations, applying sensitivities given by the companies since the
last accounting date.
Chart 16: Economic Solvency Deflation Stress Test
Source: Jefferies estimates, company data
In our deflationary scenario, all companies still have ratios above or close to internally set
target levels (where these already contain significant buffers).
Even on a deflationary X2 scenario (where government yields in Germany would be just
above zero!), all companies still appear at acceptable ratio levels even if slightly below
target levels in the case of Aviva and Allianz.
AEGON does not give sufficient data to perform this sensitivity analysis, but we
understand that there is no downside to the Solvency II ratio from falling yields in Europe
due to extensive hedging on the Dutch back-book, limiting the impact of a European
move towards deflation.
2013 2014 2014 Current Yields life Equities Credit Deflation Scenario X1 Scenario X2 Company
FY Q1 1H -50bps -10% +25bps Stress Target
AEGON 150-200%
Allianz 203% 194% 185% -9% -4% -2% -15% 170% 155% 170%
Aviva 182% 177% -5% -3% -2% -10% 167% 157% 175%
AXA 206% 215% 213% -8% -2% -1% -11% 202% 192%
Generali 184% 187% 185% -4% -5% 0% -10% 175% 165%
Prudential 257% 249% -9% -2% -4% -15% 234% 219%
Zurich 121% 127% 129% 1% 3% -5% -1% 128% 128% 100%
Financials
Initiating Coverage
6 August 2014
page 22 of 116 , Equity Analyst, 44 (0) 20 7029 8784, [email protected] Cathcart
Please see important disclosure information on pages 113 - 116 of this report.
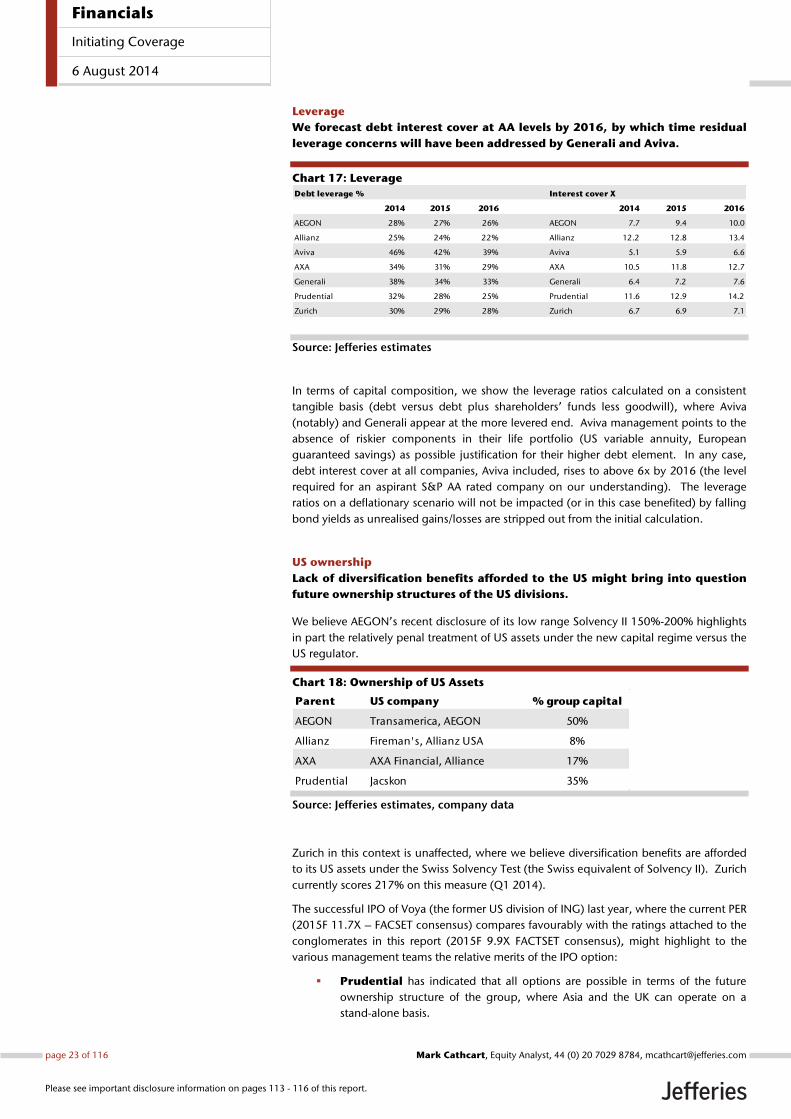
Leverage
We forecast debt interest cover at AA levels by 2016, by which time residual
leverage concerns will have been addressed by Generali and Aviva.
Chart 17: Leverage
Source: Jefferies estimates
In terms of capital composition, we show the leverage ratios calculated on a consistent
tangible basis (debt versus debt plus shareholders’ funds less goodwill), where Aviva
(notably) and Generali appear at the more levered end. Aviva management points to the
absence of riskier components in their life portfolio (US variable annuity, European
guaranteed savings) as possible justification for their higher debt element. In any case,
debt interest cover at all companies, Aviva included, rises to above 6x by 2016 (the level
required for an aspirant S&P AA rated company on our understanding). The leverage
ratios on a deflationary scenario will not be impacted (or in this case benefited) by falling
bond yields as unrealised gains/losses are stripped out from the initial calculation.
US ownership
Lack of diversification benefits afforded to the US might bring into question
future ownership structures of the US divisions.
We believe AEGON’s recent disclosure of its low range Solvency II 150%-200% highlights
in part the relatively penal treatment of US assets under the new capital regime versus the
US regulator.
Chart 18: Ownership of US Assets
Source: Jefferies estimates, company data
Zurich in this context is unaffected, where we believe diversification benefits are afforded
to its US assets under the Swiss Solvency Test (the Swiss equivalent of Solvency II). Zurich
currently scores 217% on this measure (Q1 2014).
The successful IPO of Voya (the former US division of ING) last year, where the current PER
(2015F 11.7X – FACSET consensus) compares favourably with the ratings attached to the
conglomerates in this report (2015F 9.9X FACTSET consensus), might highlight to the
various management teams the relative merits of the IPO option:
Prudential has indicated that all options are possible in terms of the future
ownership structure of the group, where Asia and the UK can operate on a
stand-alone basis.
Debt leverage % Interest cover X
2014 2015 2016 2014 2015 2016
AEGON 28% 27% 26% AEGON 7.7 9.4 10.0
Allianz 25% 24% 22% Allianz 12.2 12.8 13.4
Aviva 46% 42% 39% Aviva 5.1 5.9 6.6
AXA 34% 31% 29% AXA 10.5 11.8 12.7
Generali 38% 34% 33% Generali 6.4 7.2 7.6
Prudential 32% 28% 25% Prudential 11.6 12.9 14.2
Zurich 30% 29% 28% Zurich 6.7 6.9 7.1
Parent US company % group capital
AEGON Transamerica, AEGON 50%
Allianz Fireman's, Allianz USA 8%
AXA AXA Financial, Alliance 17%
Prudential Jacskon 35%
Financials
Initiating Coverage
6 August 2014
page 23 of 116 , Equity Analyst, 44 (0) 20 7029 8784, [email protected] Cathcart
Please see important disclosure information on pages 113 - 116 of this report.
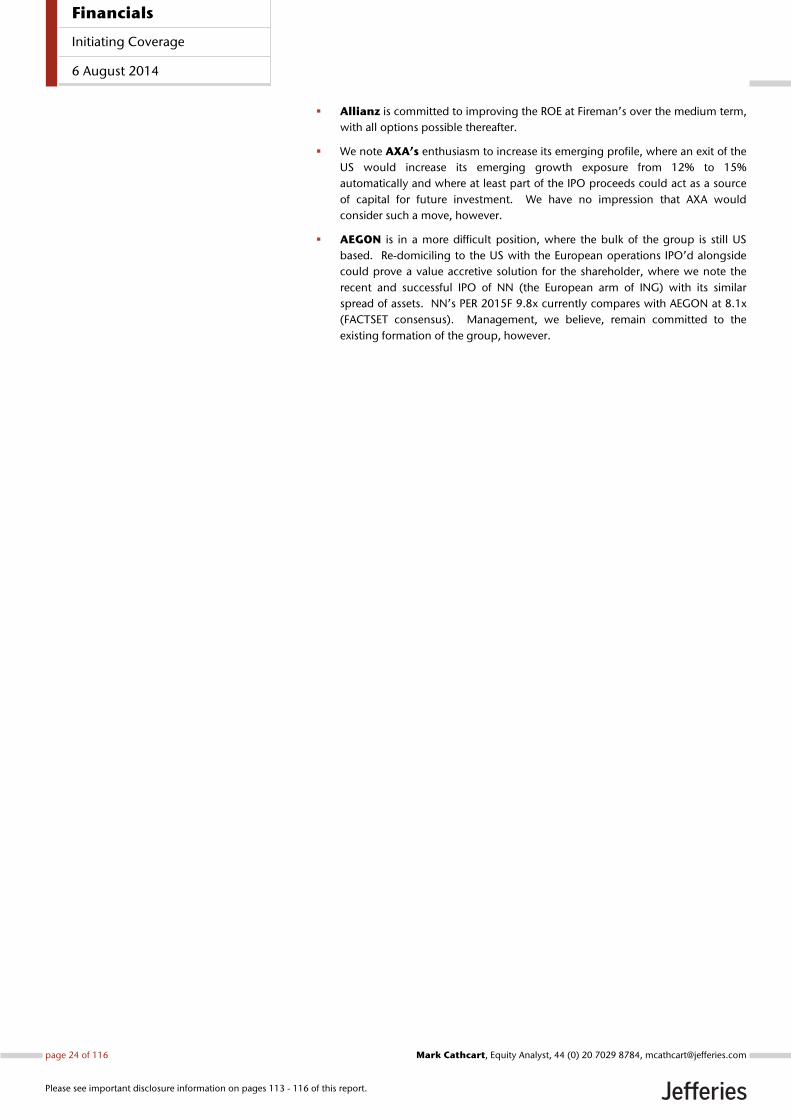
Allianz is committed to improving the ROE at Fireman’s over the medium term,
with all options possible thereafter.
We note AXA’s enthusiasm to increase its emerging profile, where an exit of the
US would increase its emerging growth exposure from 12% to 15%
automatically and where at least part of the IPO proceeds could act as a source
of capital for future investment. We have no impression that AXA would
consider such a move, however.
AEGON is in a more difficult position, where the bulk of the group is still US
based. Re-domiciling to the US with the European operations IPO’d alongside
could prove a value accretive solution for the shareholder, where we note the
recent and successful IPO of NN (the European arm of ING) with its similar
spread of assets. NN’s PER 2015F 9.8x currently compares with AEGON at 8.1x
(FACTSET consensus). Management, we believe, remain committed to the
existing formation of the group, however.
Financials
Initiating Coverage
6 August 2014
page 24 of 116 , Equity Analyst, 44 (0) 20 7029 8784, [email protected] Cathcart
Please see important disclosure information on pages 113 - 116 of this report.
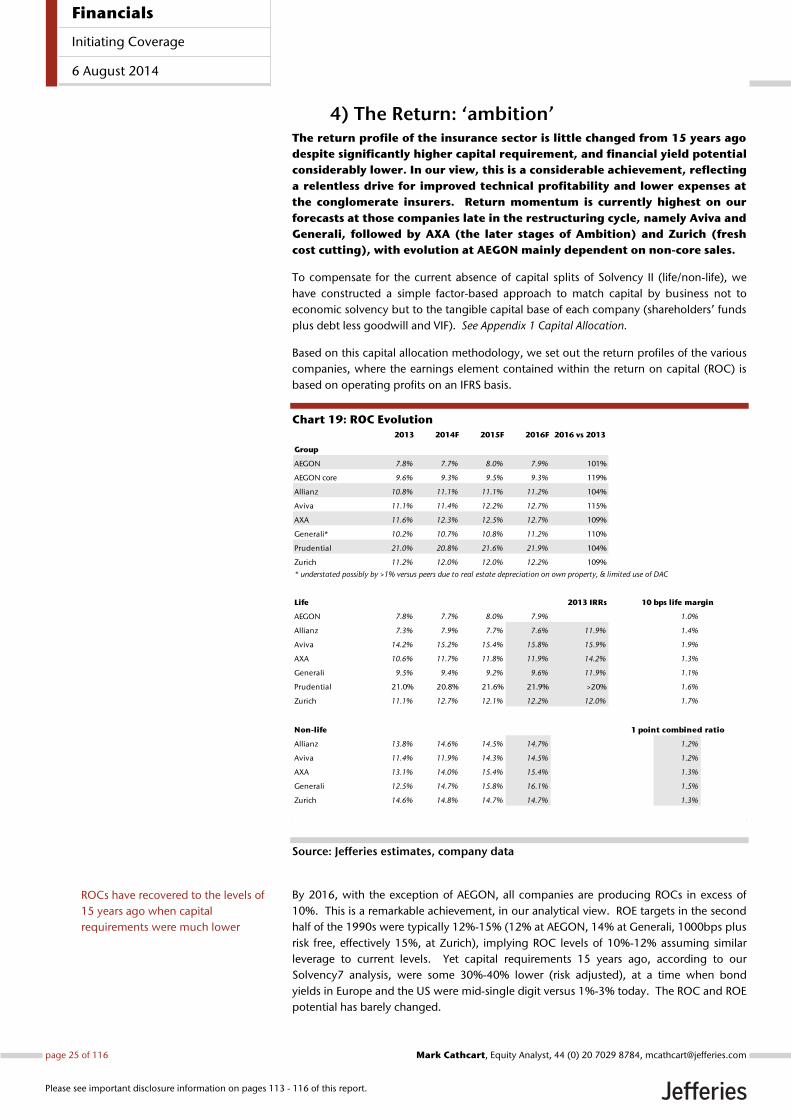
4) The Return: ‘ambition’ The return profile of the insurance sector is little changed from 15 years ago
despite significantly higher capital requirement, and financial yield potential
considerably lower. In our view, this is a considerable achievement, reflecting
a relentless drive for improved technical profitability and lower expenses at
the conglomerate insurers. Return momentum is currently highest on our
forecasts at those companies late in the restructuring cycle, namely Aviva and
Generali, followed by AXA (the later stages of Ambition) and Zurich (fresh
cost cutting), with evolution at AEGON mainly dependent on non-core sales.
To compensate for the current absence of capital splits of Solvency II (life/non-life), we
have constructed a simple factor-based approach to match capital by business not to
economic solvency but to the tangible capital base of each company (shareholders’ funds
plus debt less goodwill and VIF). See Appendix 1 Capital Allocation.
Based on this capital allocation methodology, we set out the return profiles of the various
companies, where the earnings element contained within the return on capital (ROC) is
based on operating profits on an IFRS basis.
Chart 19: ROC Evolution
Source: Jefferies estimates, company data
By 2016, with the exception of AEGON, all companies are producing ROCs in excess of
10%. This is a remarkable achievement, in our analytical view. ROE targets in the second
half of the 1990s were typically 12%-15% (12% at AEGON, 14% at Generali, 1000bps plus
risk free, effectively 15%, at Zurich), implying ROC levels of 10%-12% assuming similar
leverage to current levels. Yet capital requirements 15 years ago, according to our
Solvency7 analysis, were some 30%-40% lower (risk adjusted), at a time when bond
yields in Europe and the US were mid-single digit versus 1%-3% today. The ROC and ROE
potential has barely changed.
2013 2014F 2015F 2016F 2016 vs 2013
Group
AEGON 7.8% 7.7% 8.0% 7.9% 101%
AEGON core 9.6% 9.3% 9.5% 9.3% 119%
Allianz 10.8% 11.1% 11.1% 11.2% 104%
Aviva 11.1% 11.4% 12.2% 12.7% 115%
AXA 11.6% 12.3% 12.5% 12.7% 109%
Generali* 10.2% 10.7% 10.8% 11.2% 110%
Prudential 21.0% 20.8% 21.6% 21.9% 104%
Zurich 11.2% 12.0% 12.0% 12.2% 109%
* understated possibly by >1% versus peers due to real estate depreciation on own property, & limited use of DAC
Life 2013 IRRs 10 bps life margin
AEGON 7.8% 7.7% 8.0% 7.9% 1.0%
Allianz 7.3% 7.9% 7.7% 7.6% 11.9% 1.4%
Aviva 14.2% 15.2% 15.4% 15.8% 15.9% 1.9%
AXA 10.6% 11.7% 11.8% 11.9% 14.2% 1.3%
Generali 9.5% 9.4% 9.2% 9.6% 11.9% 1.1%
Prudential 21.0% 20.8% 21.6% 21.9% >20% 1.6%
Zurich 11.1% 12.7% 12.1% 12.2% 12.0% 1.7%
Non-life 1 point combined ratio
Allianz 13.8% 14.6% 14.5% 14.7% 1.2%
Aviva 11.4% 11.9% 14.3% 14.5% 1.2%
AXA 13.1% 14.0% 15.4% 15.4% 1.3%
Generali 12.5% 14.7% 15.8% 16.1% 1.5%
Zurich 14.6% 14.8% 14.7% 14.7% 1.3%
ROCs have recovered to the levels of
15 years ago when capital
requirements were much lower
Financials
Initiating Coverage
6 August 2014
page 25 of 116 , Equity Analyst, 44 (0) 20 7029 8784, [email protected] Cathcart
Please see important disclosure information on pages 113 - 116 of this report.
The relentless drive by management teams over the past 15 years to drive costs down,
improve underwriting and reinvent life margin dynamics at the same time (away from
traditional savings with guarantees to fee driven unit linked) to get to CoC returns and
higher has been remarkable. To do this against a back drop of equity market collapse and
recovery (twice), bond yield demise, the financial crisis, deflationary threats and Solvency
II has been nothing short of ‘magnificent’, in our view.
We highlight the following macro trends influencing non-life and life ROCs:
Non-life returns reflect the pricing cycle and investment yields. The
continental European cycle versus the UK (where auto prices have fallen sharply
in the past 18 months) has been relatively benign, with prices still rising in
Germany, although falling in Italy (compensating in turn for lower claims levels
and frequency), and with US commercial lines, of particular benefit to Zurich,
still firm. We calculate that one point on the combined ratio equates to an
average of 1.3% on the non-life ROE for these companies. The question now,
following several years of underwriting improvement in most markets, is
whether prices begin a cyclical decline. Bond markets are critical in this regard,
where a 100 bps shift in yields is roughly equivalent in profit terms to 2
percentage points on the combined ratio. The greatest risk, in our view, is
further falls in investment yields but the inability to pass the price increases onto
the customer in a deflationary cycle, rather than rising yields where the benefit
tends to be passed onto the customer in the form of lower pricing (and higher
combined ratios). Or a price war across continental Europe driven by sharper
use of telematics and/or internet pricing visibility, as with the price aggregators
in the UK.
Life returns vary substantially across the peer group. AEGON’s are at the
lowest end, reflecting a large book of spread business in both the Dutch market
and the US (including run-off), where margins have suffered severe compression
from the low yield environment in recent years. Prudential’s returns, by
contrast, are the highest in the sector, reflecting Asia’s unit-linked business with
health and protection riders (where roughly a third of the region’s premium
base is effectively non-life in profit profile) and also earlier moves by
management to focus on cash-generative rather than capital-consumptive
products in both Asia and the UK. Zurich’s return profile also appears relatively
high on our calculation, reflecting the group’s product switch focus towards
unit linked away from traditional under CEO Jim Schiro’s leadership a decade
ago.
Life IRRs on new business are higher than on the back book with the
rest of the sector since following Prudential’s and Zurich’s lead of a decade ago
towards cash, driven from products with less capital intensity. AXA’s new
business IRR at 14.5% in 2013, for example, compares with its overall life ROC of
11.9% on our calculation for 2016. As the more capital-consumptive back
books at AEGON, Allianz, Aviva, AXA and Generali mature, the rising trend in the
ROC towards new business IRRs should continue. This is a long-term trend,
however, where the average duration to maturity extends to well over 10 years
for some elements of these portfolios, although generally around eight overall.
All management teams are working towards better management of these
onerous back books, both in terms of efficiency gains but also more radical
solutions (reinsurance to release capital or straight exits). AXA, for example, has
a global in-force optimisation programme across Belgium, France, Germany,
Switzerland and the US, with all options explored for efficient back-book
management inclusive of exit sales (as with AXA UK’s disposal to Resolution).
We highlight the companies with the greatest ROC momentum:
The ROC rises the fastest at AXA, Aviva, Generali in percentage terms (2016
versus 2013), reflecting the later stage of their restructuring programmes, where
Reflecting the success of wide-scale
management actions and portfolio
repositioning
Non-life pricing cycle risk
Life returns reflect earlier portfolio
actions; Prudential & Zurich early in
cycle to cash
Life ROCs to move towards the
higher IRRs on new business over
time
ROC momentum reflects
restructuring phase
Financials
Initiating Coverage
6 August 2014
page 26 of 116 , Equity Analyst, 44 (0) 20 7029 8784, [email protected] Cathcart
Please see important disclosure information on pages 113 - 116 of this report.
Zurich also rises by 9% over the same timeframe with an additional US$ 250m
of expense reductions targeted for 2015.
Prudential’s rise, at 4%, is driven by growing economies of scale in Asia rather
than any specific restructuring.
AEGON and Allianz by contrast are relatively flat where earlier expense
programmes have already fed through (aside from the 95% combined ratio
target in Germany), and the step change in product mix at AEGON has already
happened.
AEGON’s ROC for 2016 could edge above 9% (versus 7.9% here) assuming the
UK platform delivers a level of inflows in line with management’s own
expectation (our forecasts assume a miss), with at least some progress on non-
core sales. Successful exit from the operations signposted as non-core by
AEGON – France and Canada (and possibly the US BOLI and VA run off books
though interest rates would need to rise from here to make valuations viable) –
increases the ROC on our calculation by more than a full percentage point to
over 9%.
We also point out the following company peculiarities that might lead to ROC
distortions:
Generali’s ROC is possibly understated relative to the peers for two reasons:
first, the high level of annual property depreciation (€230m pre-tax in 2013)
where Generali has above-average exposure to real estate; and second, limited
use of life DAC versus peers, which possibly understates life profits versus the
peer group by 10%-15%, albeit offset in the ROC by the lower DAC element
in shareholders’ funds. Increasing life profits by 10%, and adding back a third of
the real estate depreciation (where the policyholders in life might share some of
the cost), the 2016 ROC would climb by 70bps to 11.7%.
The life return at Allianz is distorted by elements of policyholder funds that
can count as capital. We have included only the free RfB in our calculations in
line with our understanding of rating agency practice. On a local regulatory
basis, the terminal bonus and ZZR segments can also be included, on which
basis the ROC for Allianz would rise to 10.5% (up 260bps).
Returns at Aviva and Prudential are supported to an extent by with profits
funds where the policyholder supplies the capital.
Financials
Initiating Coverage
6 August 2014
page 27 of 116 , Equity Analyst, 44 (0) 20 7029 8784, [email protected] Cathcart
Please see important disclosure information on pages 113 - 116 of this report.
5) Growth: ‘headroom’ Prudential broke the growth trend for the sector over the past decade with
its early focus on capital-light products and emerging market development.
Following significant product overhauls across the sector since towards
capital light, cash for growth (or additional dividend) should soon be in
plentiful supply at all the companies. Our analysis suggests that the growth
gap with Prudential clearly exists but is possibly not as wide many investors
might believe. In any case, with powerful global brands, continued purchase
of emerging distribution is as likely at, say, an AXA or Allianz as it is at
Prudential.
Growth trends for the insurance sector in the past tended to evaporate as quickly as they
appeared, with trends of growth of today unsurprisingly greeted by investors with an
element of cynicism and a low rating. If the growth trend was working, competitors
swamped the growth with capital and destroyed the margin, or the regulator stepped in
and dismantled the product premise, or the government arrived and demanded tax, or
both.
Prudential’s path to growth has broken the trend, both sustained and at times
stratospheric, a scalable business model in Asia selling to the burgeoning middle class
products that produce high margins and cash to spare, continuing to attract new
distribution (both agency and banks) and customers (in their droves), and rolling out into
new territories (Cambodia) and even a new continent (Africa).
Earlier growth propositions of the ‘six left behind’ all ended rather differently:
AEGON’s growth-proposition of the 1990s, the baby boom growth in the
Western hemisphere that inspired the sizable US acquisitions of Providian (1997)
and Transamerica (1999) broken by the US sub-prime crisis, with falling interest
rates compressing the product margins.
Allianz’s purchase of Dresdner (2000) for cross-sell growth and the €14bn
value collapse that followed as equity markets crashed around it.
AXA’s roll-out to the globe of its variable annuity offering that had sold so well
in the US until the financial crisis unravelled tail risk and demanded capital
injections.
Generali’s positioning for the pension boom in Italy with its purchase of INA
(2000), curtailed by Italian politics and regulatory intervention.
Zurich’s growth aspirations post its merger with BAT Eagle Star (1999) to grow
top and bottom line by 15% annually with a new IT system for cross sell, turned
victim to technology fall-out and a balance sheet that caved in under its own
financial leverage.
One Aviva Twice the Value, acquiring across Europe and the US, forced into
retrenchment by unsustainable leverage levels and lack of profitability.
The track record aside from Prudential does not look impressive. Yet CEO Tidjane Thiam
still talks of headroom for growth for a business that was in the cash remittance red in
2004, generated close to £600m of cash in 2013, with £1bn forecast for 2017. Could the
rest of the sector follow Prudential in its focus on capital-light products capitalising on
their franchises, locating growth opportunities inclusive of investing in emerging market
distribution?
Organic growth rates
Our starting point in assessing growth is the organic growth rates that can be expected in
the markets in which they operate. For this exercise, we look beyond short-term cycles of
any accelerated growth trends and specific growth initiatives in place. For example, at
Growth trends for the sector have
been traditionally fragile
Growth at Prudential by contrast has
been powerfully sustained
Compared with growth implosions
elsewhere
While Prudential still talks of
headroom
We assess growth prospects at all
‘seven’
Financials
Initiating Coverage
6 August 2014
page 28 of 116 , Equity Analyst, 44 (0) 20 7029 8784, [email protected] Cathcart
Please see important disclosure information on pages 113 - 116 of this report.
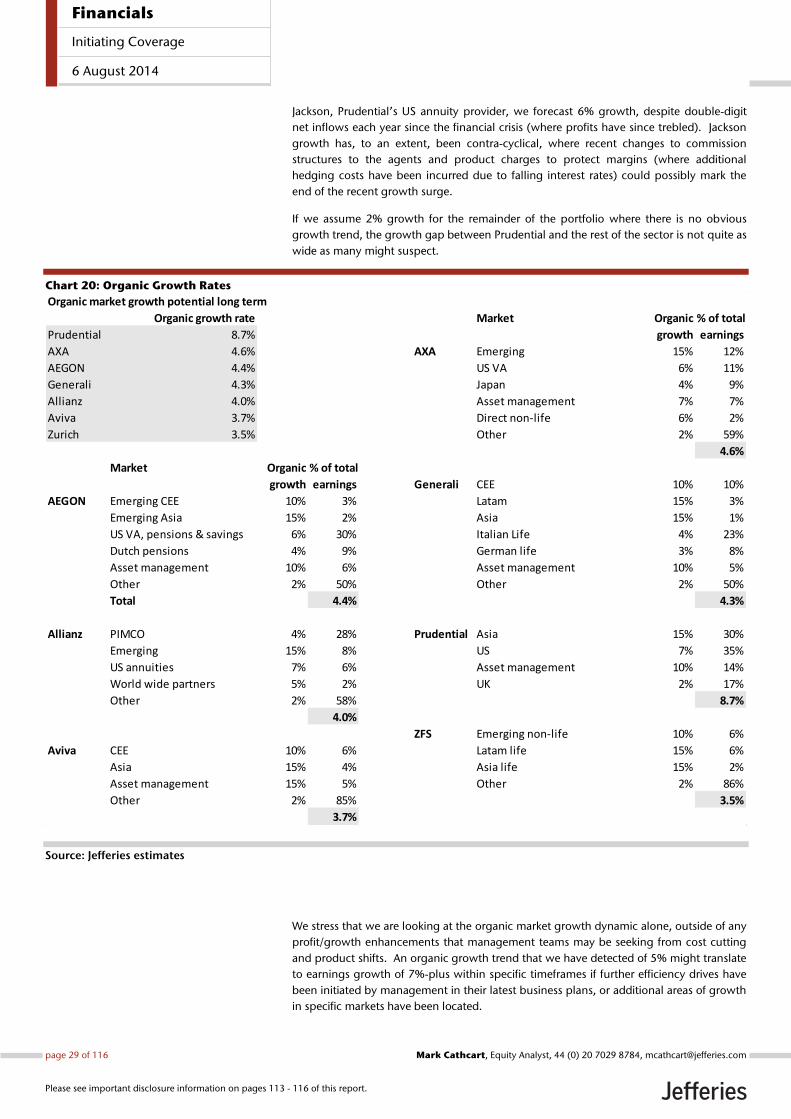
Jackson, Prudential’s US annuity provider, we forecast 6% growth, despite double-digit
net inflows each year since the financial crisis (where profits have since trebled). Jackson
growth has, to an extent, been contra-cyclical, where recent changes to commission
structures to the agents and product charges to protect margins (where additional
hedging costs have been incurred due to falling interest rates) could possibly mark the
end of the recent growth surge.
If we assume 2% growth for the remainder of the portfolio where there is no obvious
growth trend, the growth gap between Prudential and the rest of the sector is not quite as
wide as many might suspect.
Chart 20: Organic Growth Rates
Source: Jefferies estimates
We stress that we are looking at the organic market growth dynamic alone, outside of any
profit/growth enhancements that management teams may be seeking from cost cutting
and product shifts. An organic growth trend that we have detected of 5% might translate
to earnings growth of 7%-plus within specific timeframes if further efficiency drives have
been initiated by management in their latest business plans, or additional areas of growth
in specific markets have been located.
Organic market growth potential long term
Organic growth rate Market Organic % of total
Prudential 8.7% growth earnings
AXA 4.6% AXA Emerging 15% 12%
AEGON 4.4% US VA 6% 11%
Generali 4.3% Japan 4% 9%
Allianz 4.0% Asset management 7% 7%
Aviva 3.7% Direct non-life 6% 2%
Zurich 3.5% Other 2% 59%
4.6%
Market Organic % of total
growth earnings Generali CEE 10% 10%
AEGON Emerging CEE 10% 3% Latam 15% 3%
Emerging Asia 15% 2% Asia 15% 1%
US VA, pensions & savings 6% 30% Italian Life 4% 23%
Dutch pensions 4% 9% German life 3% 8%
Asset management 10% 6% Asset management 10% 5%
Other 2% 50% Other 2% 50%
Total 4.4% 4.3%
Allianz PIMCO 4% 28% Prudential Asia 15% 30%
Emerging 15% 8% US 7% 35%
US annuities 7% 6% Asset management 10% 14%
World wide partners 5% 2% UK 2% 17%
Other 2% 58% 8.7%
4.0%
ZFS Emerging non-life 10% 6%
Aviva CEE 10% 6% Latam life 15% 6%
Asia 15% 4% Asia life 15% 2%
Asset management 15% 5% Other 2% 86%
Other 2% 85% 3.5%
3.7%
Financials
Initiating Coverage
6 August 2014
page 29 of 116 , Equity Analyst, 44 (0) 20 7029 8784, [email protected] Cathcart
Please see important disclosure information on pages 113 - 116 of this report.
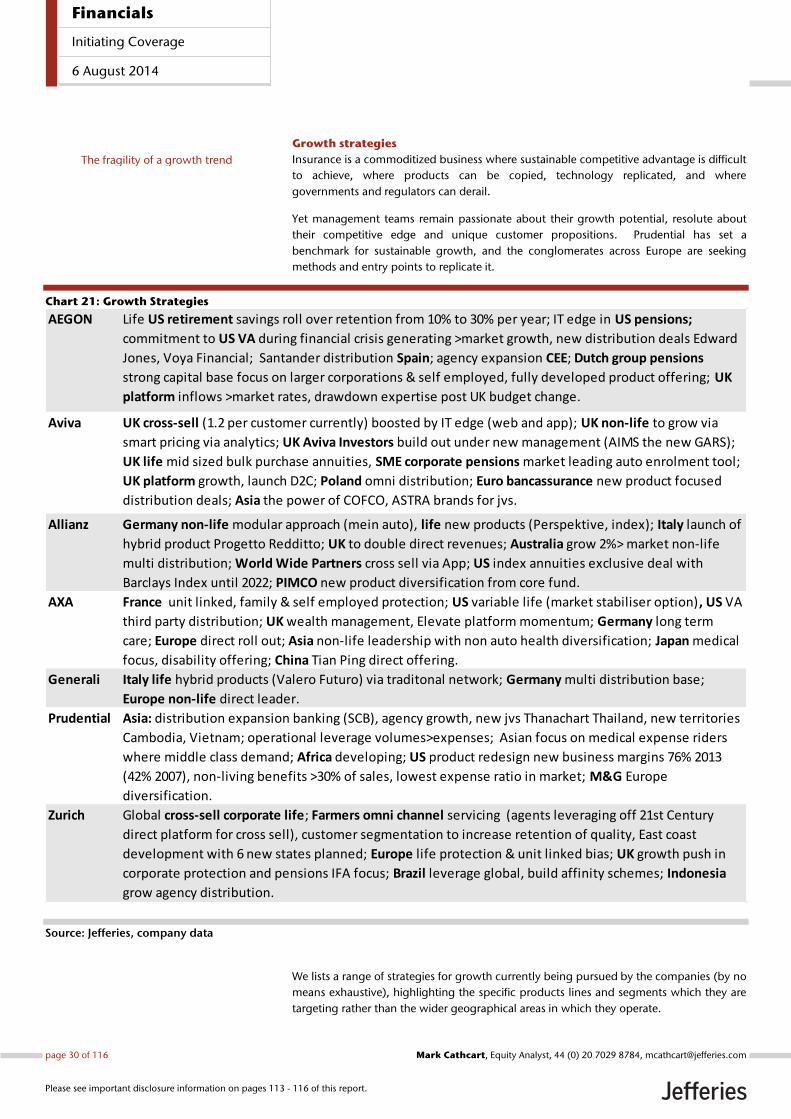
Growth strategies
Insurance is a commoditized business where sustainable competitive advantage is difficult
to achieve, where products can be copied, technology replicated, and where
governments and regulators can derail.
Yet management teams remain passionate about their growth potential, resolute about
their competitive edge and unique customer propositions. Prudential has set a
benchmark for sustainable growth, and the conglomerates across Europe are seeking
methods and entry points to replicate it.
Chart 21: Growth Strategies
Source: Jefferies, company data
We lists a range of strategies for growth currently being pursued by the companies (by no
means exhaustive), highlighting the specific products lines and segments which they are
targeting rather than the wider geographical areas in which they operate.
AEGON Life US retirement savings roll over retention from 10% to 30% per year; IT edge in US pensions;
commitment to US VA during financial crisis generating >market growth, new distribution deals Edward
Jones, Voya Financial; Santander distribution Spain; agency expansion CEE; Dutch group pensions
strong capital base focus on larger corporations & self employed, fully developed product offering; UK
platform inflows >market rates, drawdown expertise post UK budget change.
Aviva UK cross-sell (1.2 per customer currently) boosted by IT edge (web and app); UK non-life to grow via
smart pricing via analytics; UK Aviva Investors build out under new management (AIMS the new GARS);
UK life mid sized bulk purchase annuities, SME corporate pensions market leading auto enrolment tool;
UK platform growth, launch D2C; Poland omni distribution; Euro bancassurance new product focused
distribution deals; Asia the power of COFCO, ASTRA brands for jvs.
Allianz Germany non-life modular approach (mein auto), life new products (Perspektive, index); Italy launch of
hybrid product Progetto Redditto; UK to double direct revenues; Australia grow 2%> market non-life
multi distribution; World Wide Partners cross sell via App; US index annuities exclusive deal with
Barclays Index until 2022; PIMCO new product diversification from core fund.
AXA France unit linked, family & self employed protection; US variable life (market stabiliser option), US VA
third party distribution; UK wealth management, Elevate platform momentum; Germany long term
care; Europe direct roll out; Asia non-life leadership with non auto health diversification; Japan medical
focus, disability offering; China Tian Ping direct offering.
Generali Italy life hybrid products (Valero Futuro) via traditonal network; Germany multi distribution base;
Europe non-life direct leader.
Prudential Asia: distribution expansion banking (SCB), agency growth, new jvs Thanachart Thailand, new territories
Cambodia, Vietnam; operational leverage volumes>expenses; Asian focus on medical expense riders
where middle class demand; Africa developing; US product redesign new business margins 76% 2013
(42% 2007), non-living benefits >30% of sales, lowest expense ratio in market; M&G Europe
diversification.
Zurich Global cross-sell corporate life; Farmers omni channel servicing (agents leveraging off 21st Century
direct platform for cross sell), customer segmentation to increase retention of quality, East coast
development with 6 new states planned; Europe life protection & unit linked bias; UK growth push in
corporate protection and pensions IFA focus; Brazil leverage global, build affinity schemes; Indonesia
grow agency distribution.
The fragility of a growth trend
Financials
Initiating Coverage
6 August 2014
page 30 of 116 , Equity Analyst, 44 (0) 20 7029 8784, [email protected] Cathcart
Please see important disclosure information on pages 113 - 116 of this report.
To give insight into the profit enhancement that such strategies can bring,
we highlight two examples:
AEGON’s plan to increase retention roll-over of US retirement savings would
increase net deposits annually by US$2bn versus US$128bn of US pension
assets, where margins would be higher than those on the overall book. The
potential long-term boost to US earnings if achieved would be 0.6% per annum
on our calculation, and 0.4% at the group level.
Successful build-out of Aviva Investors under the new management team could
double existing asset management profits, assuming inflows of £10-15bn into
new funds where the infrastructure is already in place. The positive uplift to
group profits would be 3% on our calculation.
The market is likely to take a wait-and-see approach, and factor in growth
boosters only when the track record suggests sustainability:
Cross-sell in Europe has often been highlighted in the past as a growth strategy
but has rarely been demonstrated as a success. Yet improved IT and customer
web pages might be the required catalyst that actually makes this work for the
composite insurers. Aviva is promoting this in the UK with its customer app,
Zurich in the US with Farmers and its omni-channel approach for home and auto
cross-sell.
Growth objectives can fall flat as quickly as they are created. As a recent specific
example, the UK insurers in varying degrees had to accept loss of future revenue
streams due to UK budget changes to annuities. AXA’s Q1 stall in new business
trends is also interesting in this regard. The decision to de-emphasise certain
product lines (Swiss group bundled health products, Japan long-term life
protection, US indexed universal life) affirms management focus on hurdle rates
and returns, but also highlights the ongoing competitive pressures that can
frequently eliminate growth in the markets in which insurers operate.
Diversification strategies for growth are effectively a requirement if companies
are to have confidence of achieving in-line growth rates overall. The companies
are all spinning growth plates, replacing those that topple with fresh growth
initiatives that at some stage in the future will likely topple in turn.
Growth capacity
The capital required to back chosen areas of growth is considerably less than for the back
books of business. Take AEGON as an example, effectively running off its fixed annuity
business in the US and increasing its exposure to fee-driven business that requires less
than half of the capital. All ‘seven’ have been moving away from traditional capital-
consumptive savings towards products with lower capital requirements, protection and
unit linked in Europe; unit linked with health riders in Asia; fee driven versus fixed annuity
in the US. Traditional savings products that are still being sold are in any case being
written with significantly lower guarantees, and again less capital. At Allianz, for example,
the new and popular German Perspektive product only guarantees the paid-in capital,
with the duration shortened until the end of the savings phase when any guarantees are
then reset for the annuity. Growth elements within the mature economies (German
annuities being one) can be internally financed (as with Prudential in Asia) from higher
levels of capital being released from the older traditional portfolio.
IT facilitates growth via cross sell
Margin versus growth
Growth displacement
Growth internally financed by lower
capital consumptive products
Financials
Initiating Coverage
6 August 2014
page 31 of 116 , Equity Analyst, 44 (0) 20 7029 8784, [email protected] Cathcart
Please see important disclosure information on pages 113 - 116 of this report.
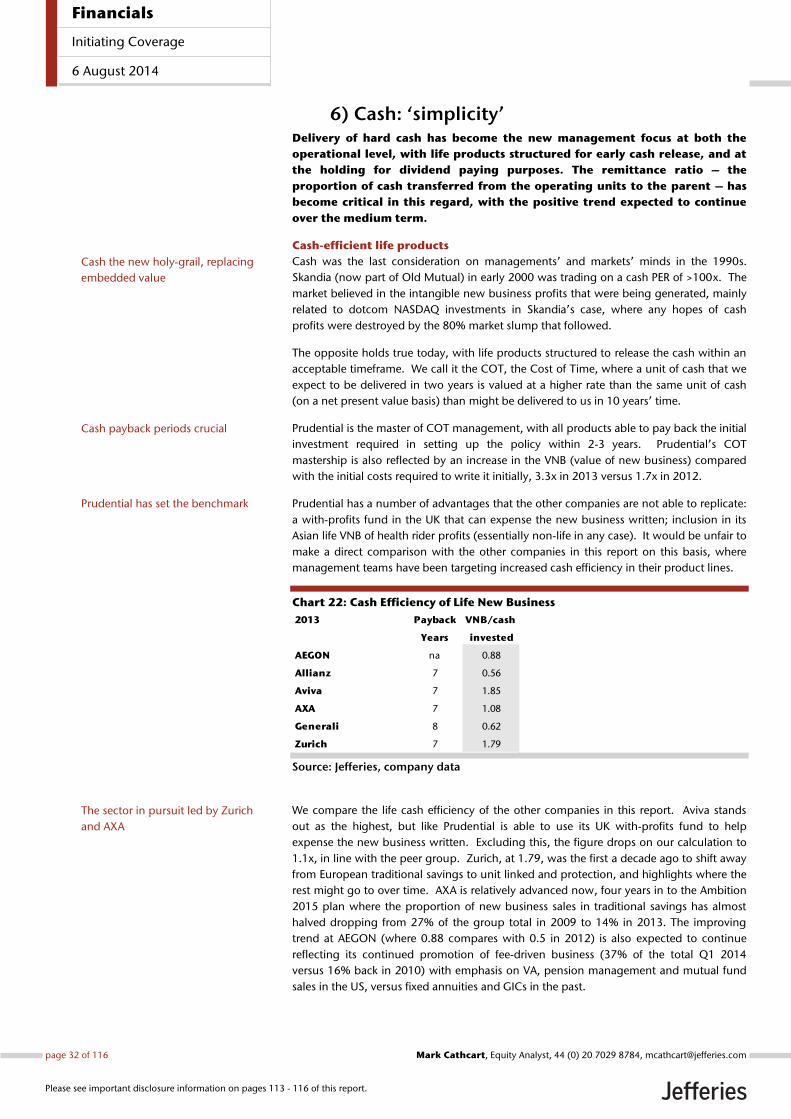
6) Cash: ‘simplicity’ Delivery of hard cash has become the new management focus at both the
operational level, with life products structured for early cash release, and at
the holding for dividend paying purposes. The remittance ratio – the
proportion of cash transferred from the operating units to the parent – has
become critical in this regard, with the positive trend expected to continue
over the medium term.
Cash-efficient life products
Cash was the last consideration on managements’ and markets’ minds in the 1990s.
Skandia (now part of Old Mutual) in early 2000 was trading on a cash PER of >100x. The
market believed in the intangible new business profits that were being generated, mainly
related to dotcom NASDAQ investments in Skandia’s case, where any hopes of cash
profits were destroyed by the 80% market slump that followed.
The opposite holds true today, with life products structured to release the cash within an
acceptable timeframe. We call it the COT, the Cost of Time, where a unit of cash that we
expect to be delivered in two years is valued at a higher rate than the same unit of cash
(on a net present value basis) than might be delivered to us in 10 years’ time.
Prudential is the master of COT management, with all products able to pay back the initial
investment required in setting up the policy within 2-3 years. Prudential’s COT
mastership is also reflected by an increase in the VNB (value of new business) compared
with the initial costs required to write it initially, 3.3x in 2013 versus 1.7x in 2012.
Prudential has a number of advantages that the other companies are not able to replicate:
a with-profits fund in the UK that can expense the new business written; inclusion in its
Asian life VNB of health rider profits (essentially non-life in any case). It would be unfair to
make a direct comparison with the other companies in this report on this basis, where
management teams have been targeting increased cash efficiency in their product lines.
Chart 22: Cash Efficiency of Life New Business
Source: Jefferies, company data
We compare the life cash efficiency of the other companies in this report. Aviva stands
out as the highest, but like Prudential is able to use its UK with-profits fund to help
expense the new business written. Excluding this, the figure drops on our calculation to
1.1x, in line with the peer group. Zurich, at 1.79, was the first a decade ago to shift away
from European traditional savings to unit linked and protection, and highlights where the
rest might go to over time. AXA is relatively advanced now, four years in to the Ambition
2015 plan where the proportion of new business sales in traditional savings has almost
halved dropping from 27% of the group total in 2009 to 14% in 2013. The improving
trend at AEGON (where 0.88 compares with 0.5 in 2012) is also expected to continue
reflecting its continued promotion of fee-driven business (37% of the total Q1 2014
versus 16% back in 2010) with emphasis on VA, pension management and mutual fund
sales in the US, versus fixed annuities and GICs in the past.
2013 Payback VNB/cash
Years invested
AEGON na 0.88
Allianz 7 0.56
Aviva 7 1.85
AXA 7 1.08
Generali 8 0.62
Zurich 7 1.79
Cash the new holy-grail, replacing
embedded value
Cash payback periods crucial
Prudential has set the benchmark
The sector in pursuit led by Zurich
and AXA
Financials
Initiating Coverage
6 August 2014
page 32 of 116 , Equity Analyst, 44 (0) 20 7029 8784, [email protected] Cathcart
Please see important disclosure information on pages 113 - 116 of this report.
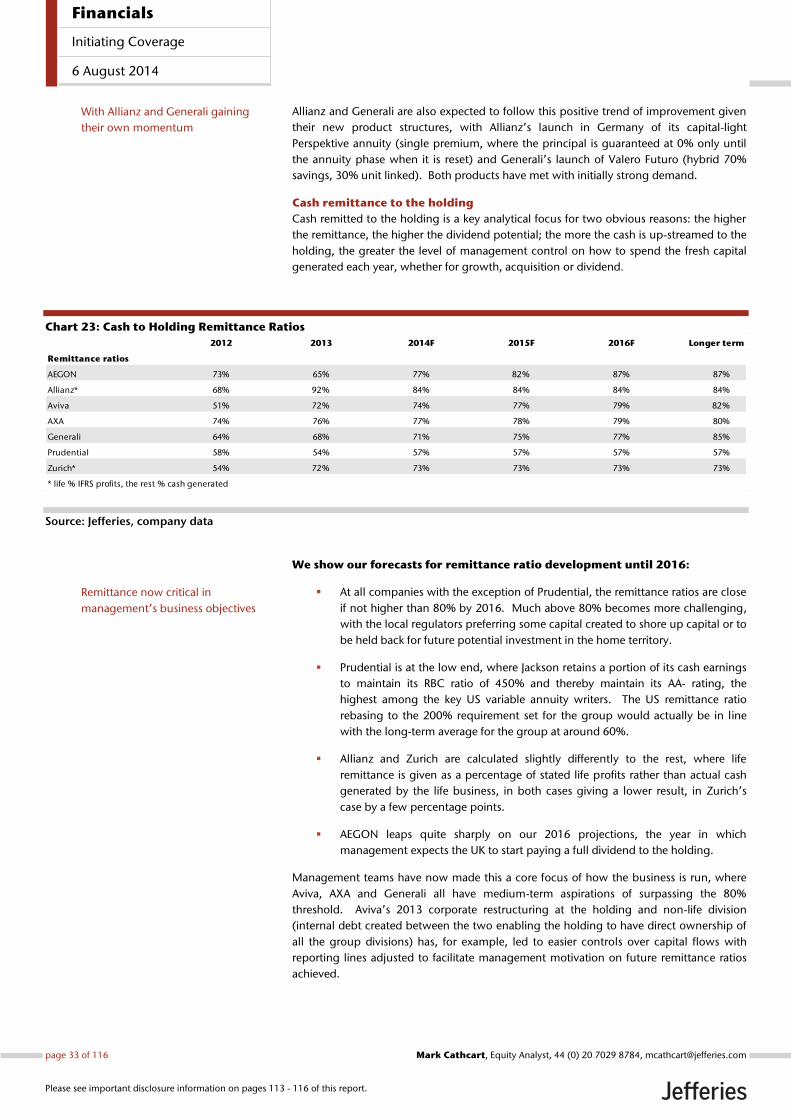
Allianz and Generali are also expected to follow this positive trend of improvement given
their new product structures, with Allianz’s launch in Germany of its capital-light
Perspektive annuity (single premium, where the principal is guaranteed at 0% only until
the annuity phase when it is reset) and Generali’s launch of Valero Futuro (hybrid 70%
savings, 30% unit linked). Both products have met with initially strong demand.
Cash remittance to the holding
Cash remitted to the holding is a key analytical focus for two obvious reasons: the higher
the remittance, the higher the dividend potential; the more the cash is up-streamed to the
holding, the greater the level of management control on how to spend the fresh capital
generated each year, whether for growth, acquisition or dividend.
Chart 23: Cash to Holding Remittance Ratios
Source: Jefferies, company data
We show our forecasts for remittance ratio development until 2016:
At all companies with the exception of Prudential, the remittance ratios are close
if not higher than 80% by 2016. Much above 80% becomes more challenging,
with the local regulators preferring some capital created to shore up capital or to
be held back for future potential investment in the home territory.
Prudential is at the low end, where Jackson retains a portion of its cash earnings
to maintain its RBC ratio of 450% and thereby maintain its AA- rating, the
highest among the key US variable annuity writers. The US remittance ratio
rebasing to the 200% requirement set for the group would actually be in line
with the long-term average for the group at around 60%.
Allianz and Zurich are calculated slightly differently to the rest, where life
remittance is given as a percentage of stated life profits rather than actual cash
generated by the life business, in both cases giving a lower result, in Zurich’s
case by a few percentage points.
AEGON leaps quite sharply on our 2016 projections, the year in which
management expects the UK to start paying a full dividend to the holding.
Management teams have now made this a core focus of how the business is run, where
Aviva, AXA and Generali all have medium-term aspirations of surpassing the 80%
threshold. Aviva’s 2013 corporate restructuring at the holding and non-life division
(internal debt created between the two enabling the holding to have direct ownership of
all the group divisions) has, for example, led to easier controls over capital flows with
reporting lines adjusted to facilitate management motivation on future remittance ratios
achieved.
2012 2013 2014F 2015F 2016F Longer term
Remittance ratios
AEGON 73% 65% 77% 82% 87% 87%
Allianz* 68% 92% 84% 84% 84% 84%
Aviva 51% 72% 74% 77% 79% 82%
AXA 74% 76% 77% 78% 79% 80%
Generali 64% 68% 71% 75% 77% 85%
Prudential 58% 54% 57% 57% 57% 57%
Zurich* 54% 72% 73% 73% 73% 73%
* life % IFRS profits, the rest % cash generated
With Allianz and Generali gaining
their own momentum
Remittance now critical in
management’s business objectives
Financials
Initiating Coverage
6 August 2014
page 33 of 116 , Equity Analyst, 44 (0) 20 7029 8784, [email protected] Cathcart
Please see important disclosure information on pages 113 - 116 of this report.
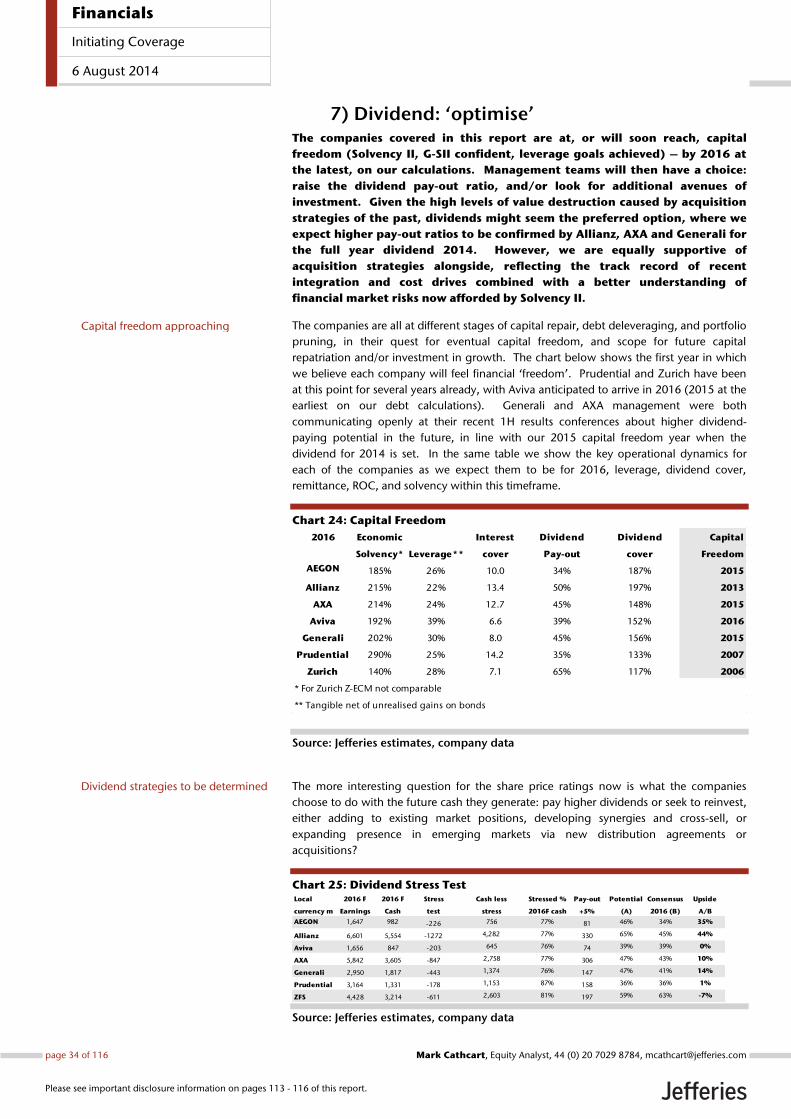
7) Dividend: ‘optimise’ The companies covered in this report are at, or will soon reach, capital
freedom (Solvency II, G-SII confident, leverage goals achieved) – by 2016 at
the latest, on our calculations. Management teams will then have a choice:
raise the dividend pay-out ratio, and/or look for additional avenues of
investment. Given the high levels of value destruction caused by acquisition
strategies of the past, dividends might seem the preferred option, where we
expect higher pay-out ratios to be confirmed by Allianz, AXA and Generali for
the full year dividend 2014. However, we are equally supportive of
acquisition strategies alongside, reflecting the track record of recent
integration and cost drives combined with a better understanding of
financial market risks now afforded by Solvency II.
The companies are all at different stages of capital repair, debt deleveraging, and portfolio
pruning, in their quest for eventual capital freedom, and scope for future capital
repatriation and/or investment in growth. The chart below shows the first year in which
we believe each company will feel financial ‘freedom’. Prudential and Zurich have been
at this point for several years already, with Aviva anticipated to arrive in 2016 (2015 at the
earliest on our debt calculations). Generali and AXA management were both
communicating openly at their recent 1H results conferences about higher dividend-
paying potential in the future, in line with our 2015 capital freedom year when the
dividend for 2014 is set. In the same table we show the key operational dynamics for
each of the companies as we expect them to be for 2016, leverage, dividend cover,
remittance, ROC, and solvency within this timeframe.
Chart 24: Capital Freedom
Source: Jefferies estimates, company data
The more interesting question for the share price ratings now is what the companies
choose to do with the future cash they generate: pay higher dividends or seek to reinvest,
either adding to existing market positions, developing synergies and cross-sell, or
expanding presence in emerging markets via new distribution agreements or
acquisitions?
Chart 25: Dividend Stress Test
Source: Jefferies estimates, company data
2016 Economic Interest Dividend Dividend Capital
Solvency* Leverage** cover Pay-out cover Freedom
AEGON 185% 26% 10.0 34% 187% 2015
Allianz 215% 22% 13.4 50% 197% 2013
AXA 214% 24% 12.7 45% 148% 2015
Aviva 192% 39% 6.6 39% 152% 2016
Generali 202% 30% 8.0 45% 156% 2015
Prudential 290% 25% 14.2 35% 133% 2007
Zurich 140% 28% 7.1 65% 117% 2006
* For Zurich Z-ECM not comparable
** Tangible net of unrealised gains on bonds
Local 2016 F 2016 F Stress Cash less Stressed % Pay-out Potential Consensus Upside
currency m Earnings Cash test stress 2016F cash +5% (A) 2016 (B) A/B
AEGON 1,647 982 -226 756 77% 81 46% 34% 35%
Allianz 6,601 5,554 -1272 4,282 77% 330 65% 45% 44%
Aviva 1,656 847 -203 645 76% 74 39% 39% 0%
AXA 5,842 3,605 -847 2,758 77% 306 47% 43% 10%
Generali 2,950 1,817 -443 1,374 76% 147 47% 41% 14%
Prudential 3,164 1,331 -178 1,153 87% 158 36% 36% 1%
ZFS 4,428 3,214 -611 2,603 81% 197 59% 63% -7%
Dividend strategies to be determined
Capital freedom approaching
Financials
Initiating Coverage
6 August 2014
page 34 of 116 , Equity Analyst, 44 (0) 20 7029 8784, [email protected] Cathcart
Please see important disclosure information on pages 113 - 116 of this report.
Dividend Stress Test
We stress test cash earnings to gauge the likely range of dividend pay-out ratios for the
future. Our cash earnings stress test assumes a 2 percentage point deterioration in the
non-life combined ratio, non-life investment returns -50bps, a 10% decline in unit-linked
fees, a 10bps decline in the life traditional savings margin and a 20% decline in asset
management earnings. We deduct the total of these from the cash remittances we are
forecasting for 2016. These are compared with our 2016 earnings forecasts (not stressed)
to demonstrate maximum pay-out ratios in a deflationary scenario, and also to the cash
earnings themselves.
The dividend upside (the difference between the full potential pay-out on the
deflationary stress test to 2016 consensus) varies considerably, with most upside
at AEGON, followed by Allianz, Generali and AXA.
The stress test, by contrast, suggests minimal upside potential in the dividend
pay-outs at Aviva and Prudential versus 2016 consensus.
Zurich is cash deficient on our stress test based on current dividend pay-out
levels. Management would possibly source the dividend shortfall from capital
release elsewhere (as in 2012).
The 20-year history of the sector has demonstrated the risks of not being sufficiently
cautious in setting dividend policies for the long term. All ‘seven’ at some stage in recent
years have had to cut their dividend levels due to external financial market disturbance;
Prudential in 2003 (albeit the first since 1914), Aviva more recently in 2013.
We make the following initial observations on potential pay-out outcomes at each of the
companies:
AEGON will likely increase the dividend pay-out ratio from 2017, in our view,
where a 40% pay-out ratio level, for example, equates to 67% of cash earnings.
In the meantime, management are prioritising a 3% share buyback for 2015/16
to compensate for the 2013 capital restructuring that led to the cancellation of
the preference stock.
Similar cash pay-out ratios (ie 67%) would translate to dividend pay-out ratios of
55% at Allianz, 42% at AXA, and 44% at Generali. Given their recent
commentaries of dividend and capital optimism to the market, we anticipate
higher dividend pay-out ratios to be confirmed at all three for the full-year
dividend 2014.
Aviva appears to have minimal scope to increase the pay-out ratio beyond
market expectations for 2016, at least according to our stress test. Higher pay-
out levels could, however, be supported by cash buffers created by capital
release and sales elsewhere.
Prudential has minimal upside in the pay-out ratio where absolute dividend
rebases are likely to continue in line with the continued growth trend in
earnings we are anticipating.
Zurich has no pay-out upside, in our view, arguably being left stranded with
the high dividend level that was struck ahead of the financial crisis.
The current cash-conspiracy between insurance management and the analyst community
(increased pay-out ratio leads to higher stock currency) is perfectly understandable,
following a decade-plus of value-destructive growth by acquisition. Allianz, at its recent
Investor Day, highlighted an acceleration of cash release of some €3bn over the next three
years, leading to analyst calls for exceptional dividends to help it celebrate its 125th
anniversary next year.
Stress tested for deflation
We assess scope for pay-out ratio
increases
With analysts as keen for higher
dividend now…
AEGON shows most upside
Zurich the least
Financials
Initiating Coverage
6 August 2014
page 35 of 116 , Equity Analyst, 44 (0) 20 7029 8784, [email protected] Cathcart
Please see important disclosure information on pages 113 - 116 of this report.
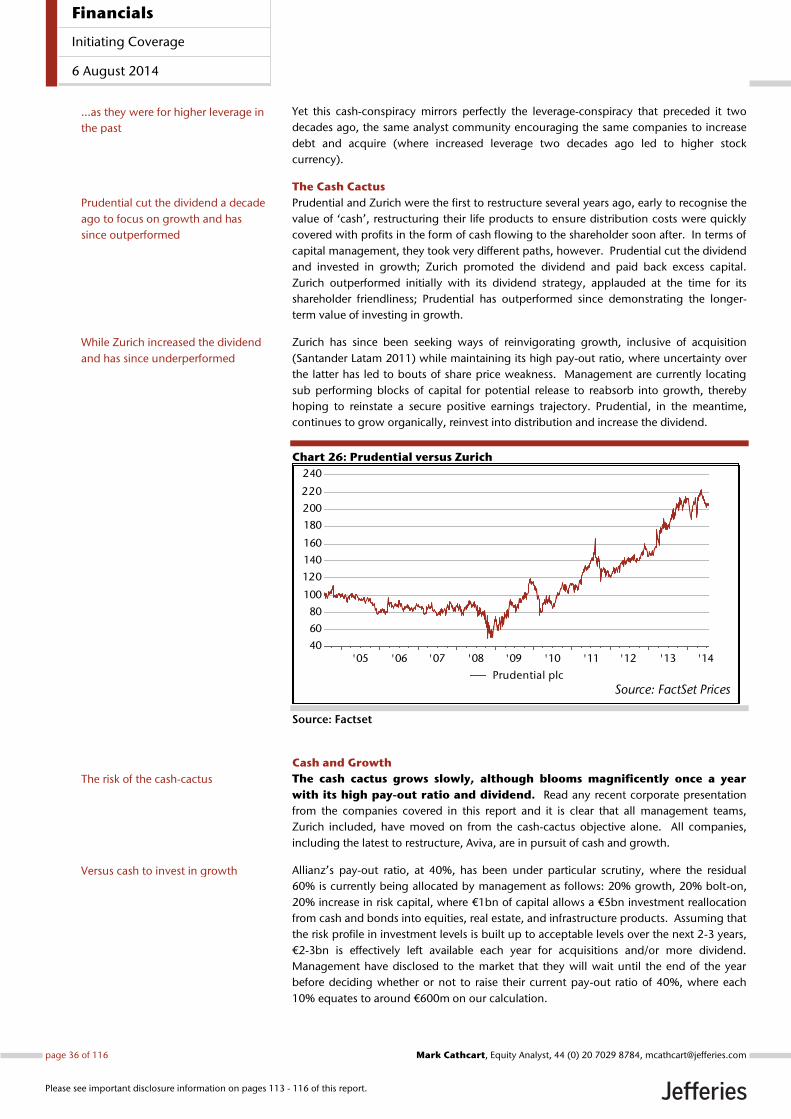
Yet this cash-conspiracy mirrors perfectly the leverage-conspiracy that preceded it two
decades ago, the same analyst community encouraging the same companies to increase
debt and acquire (where increased leverage two decades ago led to higher stock
currency).
The Cash Cactus
Prudential and Zurich were the first to restructure several years ago, early to recognise the
value of ‘cash’, restructuring their life products to ensure distribution costs were quickly
covered with profits in the form of cash flowing to the shareholder soon after. In terms of
capital management, they took very different paths, however. Prudential cut the dividend
and invested in growth; Zurich promoted the dividend and paid back excess capital.
Zurich outperformed initially with its dividend strategy, applauded at the time for its
shareholder friendliness; Prudential has outperformed since demonstrating the longer-
term value of investing in growth.
Zurich has since been seeking ways of reinvigorating growth, inclusive of acquisition
(Santander Latam 2011) while maintaining its high pay-out ratio, where uncertainty over
the latter has led to bouts of share price weakness. Management are currently locating
sub performing blocks of capital for potential release to reabsorb into growth, thereby
hoping to reinstate a secure positive earnings trajectory. Prudential, in the meantime,
continues to grow organically, reinvest into distribution and increase the dividend.
Chart 26: Prudential versus Zurich
Source: Factset
Cash and Growth
The cash cactus grows slowly, although blooms magnificently once a year
with its high pay-out ratio and dividend. Read any recent corporate presentation
from the companies covered in this report and it is clear that all management teams,
Zurich included, have moved on from the cash-cactus objective alone. All companies,
including the latest to restructure, Aviva, are in pursuit of cash and growth.
Allianz’s pay-out ratio, at 40%, has been under particular scrutiny, where the residual
60% is currently being allocated by management as follows: 20% growth, 20% bolt-on,
20% increase in risk capital, where €1bn of capital allows a €5bn investment reallocation
from cash and bonds into equities, real estate, and infrastructure products. Assuming that
the risk profile in investment levels is built up to acceptable levels over the next 2-3 years,
€2-3bn is effectively left available each year for acquisitions and/or more dividend.
Management have disclosed to the market that they will wait until the end of the year
before deciding whether or not to raise their current pay-out ratio of 40%, where each
10% equates to around €600m on our calculation.
'05 '06 '07 '08 '09 '10 '11 '12 '13 '1440
60
80
100
120
140
160
180
200
220
240
Source: FactSet PricesPrudential plc
…as they were for higher leverage in
the past
While Zurich increased the dividend
and has since underperformed
The risk of the cash-cactus
Versus cash to invest in growth
Prudential cut the dividend a decade
ago to focus on growth and has
since outperformed
Financials
Initiating Coverage
6 August 2014
page 36 of 116 , Equity Analyst, 44 (0) 20 7029 8784, [email protected] Cathcart
Please see important disclosure information on pages 113 - 116 of this report.
Recent acquisitions at Allianz have been small and bolt-on in size, in line with
management’s stated intention of seeking strategic additions for scale and integration
where there is existing presence already: for example, the recently announced purchase of
Unipol from FonSai, paying €440m for the renewal rights on the €1.1bn premium base;
and last year’s purchase of Yapi Kredi Insurance in Turkey, an exclusive 15-year banking
agreement. The PER of 8x on our calculation for Unipol seems conservative enough even
with the Italian non-life pricing cycle arguably at peak. The €650m paid for Yapi Kredi is
more dependent on future growth rates, so less easy to assess at the current time, but
management can point to the market share gains achieved since the acquisition date.
AXA, in the meantime, has been reallocating capital away from developed markets
(€8.5bn on our understanding since 2010) to emerging markets since investing in jvs
(Tian Ping) and emerging distribution (HSBC). The earnings profile of the group has
already started to transform; 12% of 2013 earnings is ‘growth’ versus mid-single digit in
2009.
We would make the following observations to support a return to strategic
acquisitions on an internally financed basis at least:
The management teams have all been in intensive training in recent years for
their ‘Masters in Integration’. AXA’s €1.7bn of targeted cost saves equates to
almost 10% of group acquisition and administrative costs; Generali’s €1bn is
even higher at 14% on our calculations. Allianz went through a similar process
in Germany with its earlier TOM program (Target Operating Model), as did
Zurich with the Zurich Way and hub strategy. These are and have been huge
projects, with management teams not disappointing in the process, rather lifting
the targets as progress is made (AXA’s initial €1.5bn was raised to €1.7bn,
Aviva’s detection of further scope for at least another £200m of cost cuts, with
the initial £400m plan ahead of schedule). Surely the market can trust the same
management teams to integrate add-on acquisitions the size of Unipol and
create a modicum of value in the process!
The due diligence process has improved. The move towards economic
solvency and the framework of Solvency II has enabled much better
understanding of the financial risks involved when purchasing a set of insurance
assets.
The strength of global brand demands it. As G-SII companies (where AEGON
and Zurich have specific global strengths) by definition all represent a powerful
option for partnership and distribution. We note the recent partnerships
secured between Prudential and Thanachart, the leading auto finance business
in Thailand, Aviva and Astra Group, the leading industrial conglomerate in
Indonesia, and AXA and Tian Ping, the leading auto insurer operating inside the
Great Wall of China. The recent move towards platforms for distribution
increases the importance of brand recognition even further in this regard.
With fully integrated IT systems (where scale increasingly matters) at the
group level it suddenly becomes much easier to integrate smaller units
acquired.
Stronger group identities also help, with product designs that can be
shared, alongside technical expertise (telematics, analytics, pricing systems, risk
selection processes, client multi access, digitalisation), and where best
underwriting practice and technical excellence can be promoted across the
group, transported from one unit to another.
The composite advantage (life and non-life combined) where the single view
of the customer in the digital world lends itself to easily resourced growth.
There is also the economic hedge where inflation tends to benefit life over non-
life, deflation non-life over life (see later section: Financial Markets).
As currently pursued by Allianz
And AXA
We support internally financed
acquisitions
Financials
Initiating Coverage
6 August 2014
page 37 of 116 , Equity Analyst, 44 (0) 20 7029 8784, [email protected] Cathcart
Please see important disclosure information on pages 113 - 116 of this report.
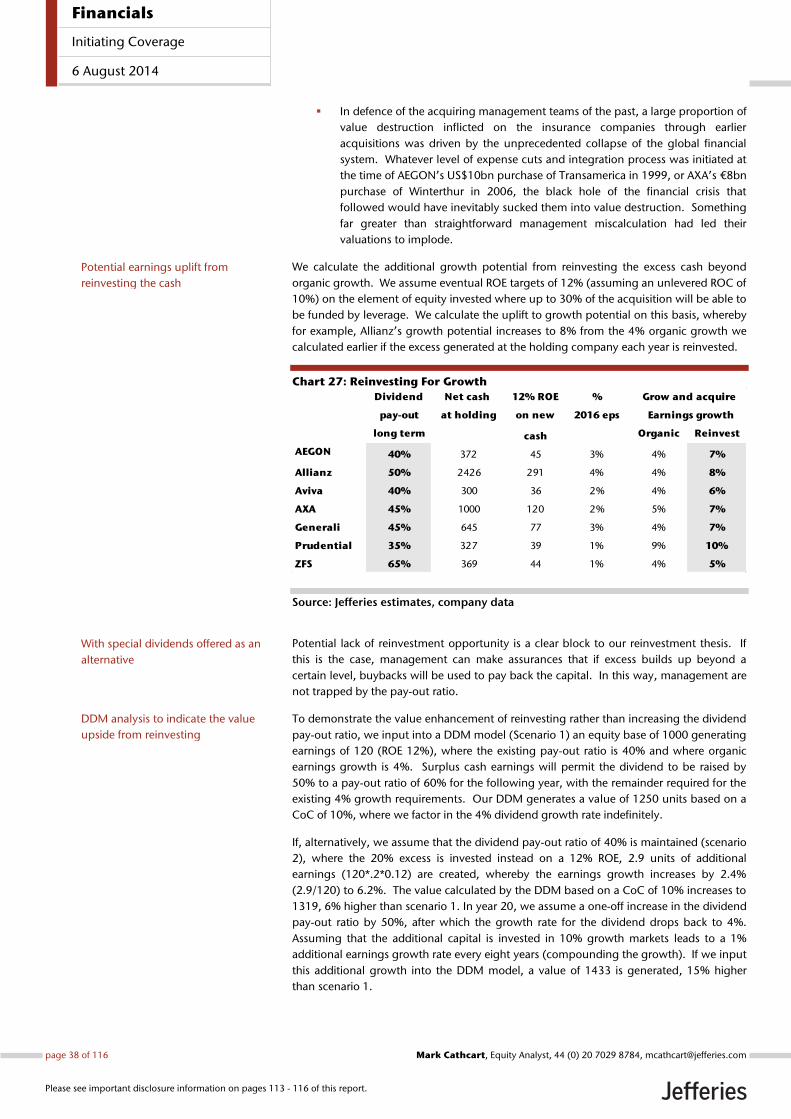
In defence of the acquiring management teams of the past, a large proportion of
value destruction inflicted on the insurance companies through earlier
acquisitions was driven by the unprecedented collapse of the global financial
system. Whatever level of expense cuts and integration process was initiated at
the time of AEGON’s US$10bn purchase of Transamerica in 1999, or AXA’s €8bn
purchase of Winterthur in 2006, the black hole of the financial crisis that
followed would have inevitably sucked them into value destruction. Something
far greater than straightforward management miscalculation had led their
valuations to implode.
We calculate the additional growth potential from reinvesting the excess cash beyond
organic growth. We assume eventual ROE targets of 12% (assuming an unlevered ROC of
10%) on the element of equity invested where up to 30% of the acquisition will be able to
be funded by leverage. We calculate the uplift to growth potential on this basis, whereby
for example, Allianz’s growth potential increases to 8% from the 4% organic growth we
calculated earlier if the excess generated at the holding company each year is reinvested.
Chart 27: Reinvesting For Growth
Source: Jefferies estimates, company data
Potential lack of reinvestment opportunity is a clear block to our reinvestment thesis. If
this is the case, management can make assurances that if excess builds up beyond a
certain level, buybacks will be used to pay back the capital. In this way, management are
not trapped by the pay-out ratio.
To demonstrate the value enhancement of reinvesting rather than increasing the dividend
pay-out ratio, we input into a DDM model (Scenario 1) an equity base of 1000 generating
earnings of 120 (ROE 12%), where the existing pay-out ratio is 40% and where organic
earnings growth is 4%. Surplus cash earnings will permit the dividend to be raised by
50% to a pay-out ratio of 60% for the following year, with the remainder required for the
existing 4% growth requirements. Our DDM generates a value of 1250 units based on a
CoC of 10%, where we factor in the 4% dividend growth rate indefinitely.
If, alternatively, we assume that the dividend pay-out ratio of 40% is maintained (scenario
2), where the 20% excess is invested instead on a 12% ROE, 2.9 units of additional
earnings (120*.2*0.12) are created, whereby the earnings growth increases by 2.4%
(2.9/120) to 6.2%. The value calculated by the DDM based on a CoC of 10% increases to
1319, 6% higher than scenario 1. In year 20, we assume a one-off increase in the dividend
pay-out ratio by 50%, after which the growth rate for the dividend drops back to 4%.
Assuming that the additional capital is invested in 10% growth markets leads to a 1%
additional earnings growth rate every eight years (compounding the growth). If we input
this additional growth into the DDM model, a value of 1433 is generated, 15% higher
than scenario 1.
Dividend Net cash 12% ROE % Grow and acquire
pay-out at holding on new 2016 eps Earnings growth
long term cash Organic Reinvest
AEGON 40% 372 45 3% 4% 7%
Allianz 50% 2426 291 4% 4% 8%
Aviva 40% 300 36 2% 4% 6%
AXA 45% 1000 120 2% 5% 7%
Generali 45% 645 77 3% 4% 7%
Prudential 35% 327 39 1% 9% 10%
ZFS 65% 369 44 1% 4% 5%
Potential earnings uplift from
reinvesting the cash
With special dividends offered as an
alternative
DDM analysis to indicate the value
upside from reinvesting
Financials
Initiating Coverage
6 August 2014
page 38 of 116 , Equity Analyst, 44 (0) 20 7029 8784, [email protected] Cathcart
Please see important disclosure information on pages 113 - 116 of this report.
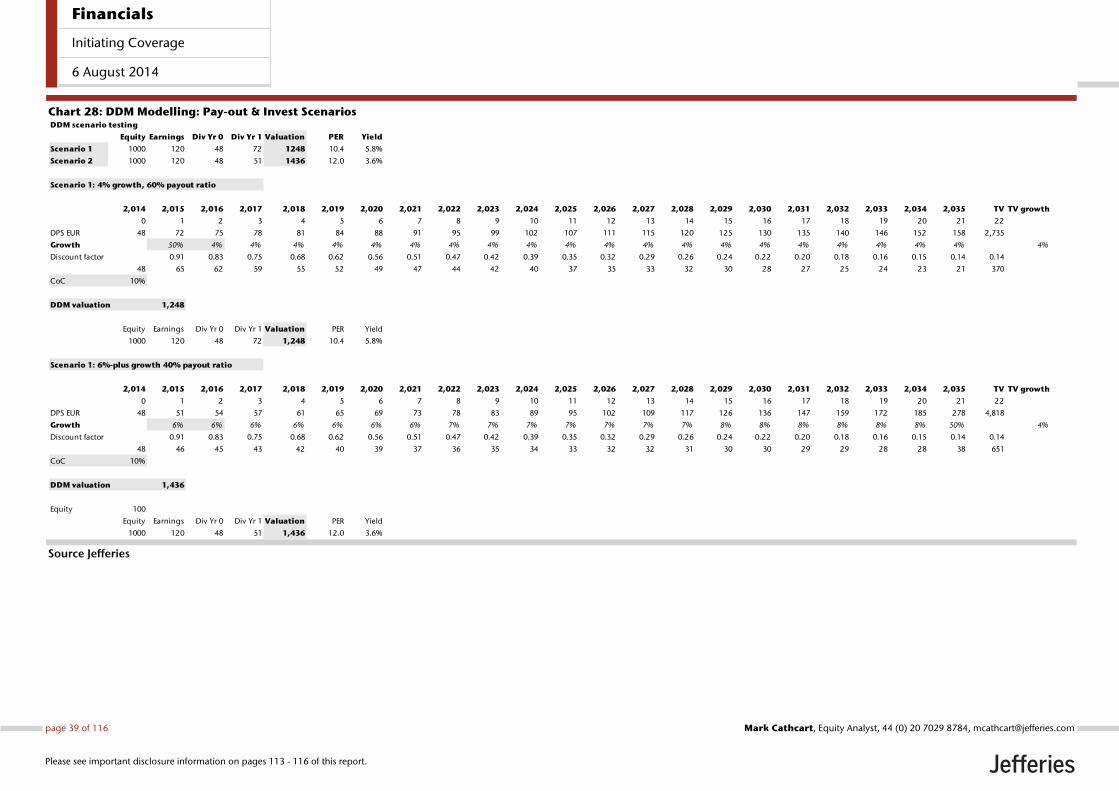
Chart 28: DDM Modelling: Pay-out & Invest Scenarios
Source Jefferies
DDM scenario testing
Equity Earnings Div Yr 0 Div Yr 1 Valuation PER Yield
Scenario 1 1000 120 48 72 1248 10.4 5.8%
Scenario 2 1000 120 48 51 1436 12.0 3.6%
Scenario 1: 4% growth, 60% payout ratio
2,014 2,015 2,016 2,017 2,018 2,019 2,020 2,021 2,022 2,023 2,024 2,025 2,026 2,027 2,028 2,029 2,030 2,031 2,032 2,033 2,034 2,035 TV TV growth
0 1 2 3 4 5 6 7 8 9 10 11 12 13 14 15 16 17 18 19 20 21 22
DPS EUR 48 72 75 78 81 84 88 91 95 99 102 107 111 115 120 125 130 135 140 146 152 158 2,735
Growth 50% 4% 4% 4% 4% 4% 4% 4% 4% 4% 4% 4% 4% 4% 4% 4% 4% 4% 4% 4% 4% 4%
Discount factor 0.91 0.83 0.75 0.68 0.62 0.56 0.51 0.47 0.42 0.39 0.35 0.32 0.29 0.26 0.24 0.22 0.20 0.18 0.16 0.15 0.14 0.14
48 65 62 59 55 52 49 47 44 42 40 37 35 33 32 30 28 27 25 24 23 21 370
CoC 10%
DDM valuation 1,248
Equity Earnings Div Yr 0 Div Yr 1 Valuation PER Yield
1000 120 48 72 1,248 10.4 5.8%
Scenario 1: 6%-plus growth 40% payout ratio
2,014 2,015 2,016 2,017 2,018 2,019 2,020 2,021 2,022 2,023 2,024 2,025 2,026 2,027 2,028 2,029 2,030 2,031 2,032 2,033 2,034 2,035 TV TV growth
0 1 2 3 4 5 6 7 8 9 10 11 12 13 14 15 16 17 18 19 20 21 22
DPS EUR 48 51 54 57 61 65 69 73 78 83 89 95 102 109 117 126 136 147 159 172 185 278 4,818
Growth 6% 6% 6% 6% 6% 6% 6% 7% 7% 7% 7% 7% 7% 7% 8% 8% 8% 8% 8% 8% 50% 4%
Discount factor 0.91 0.83 0.75 0.68 0.62 0.56 0.51 0.47 0.42 0.39 0.35 0.32 0.29 0.26 0.24 0.22 0.20 0.18 0.16 0.15 0.14 0.14
48 46 45 43 42 40 39 37 36 35 34 33 32 32 31 30 30 29 29 28 28 38 651
CoC 10%
DDM valuation 1,436
Equity 100
Equity Earnings Div Yr 0 Div Yr 1 Valuation PER Yield
1000 120 48 51 1,436 12.0 3.6%
Financials
Initiating Coverage
6 August 2014
page 39 of 116 , Equity Analyst, 44 (0) 20 7029 8784, [email protected] Cathcart
Please see important disclosure information on pages 113 - 116 of this report.
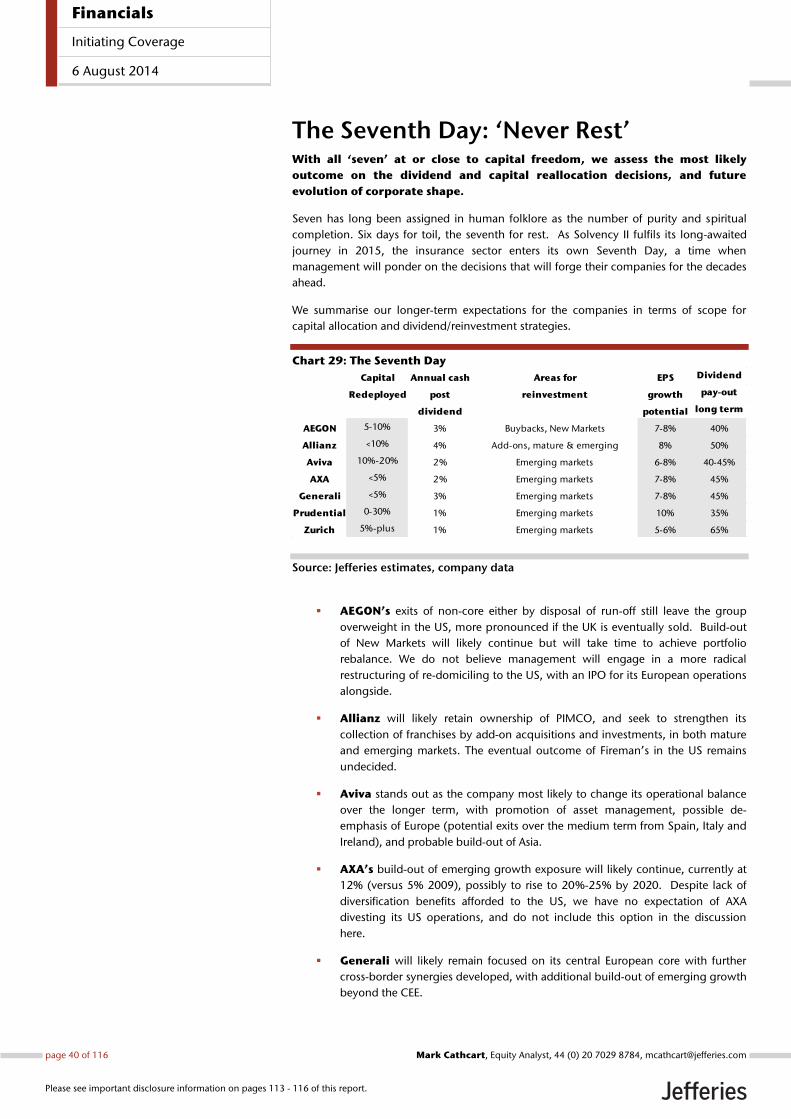
The Seventh Day: ‘Never Rest’ With all ‘seven’ at or close to capital freedom, we assess the most likely
outcome on the dividend and capital reallocation decisions, and future
evolution of corporate shape.
Seven has long been assigned in human folklore as the number of purity and spiritual
completion. Six days for toil, the seventh for rest. As Solvency II fulfils its long-awaited
journey in 2015, the insurance sector enters its own Seventh Day, a time when
management will ponder on the decisions that will forge their companies for the decades
ahead.
We summarise our longer-term expectations for the companies in terms of scope for
capital allocation and dividend/reinvestment strategies.
Chart 29: The Seventh Day
Source: Jefferies estimates, company data
AEGON’s exits of non-core either by disposal of run-off still leave the group
overweight in the US, more pronounced if the UK is eventually sold. Build-out
of New Markets will likely continue but will take time to achieve portfolio
rebalance. We do not believe management will engage in a more radical
restructuring of re-domiciling to the US, with an IPO for its European operations
alongside.
Allianz will likely retain ownership of PIMCO, and seek to strengthen its
collection of franchises by add-on acquisitions and investments, in both mature
and emerging markets. The eventual outcome of Fireman’s in the US remains
undecided.
Aviva stands out as the company most likely to change its operational balance
over the longer term, with promotion of asset management, possible de-
emphasis of Europe (potential exits over the medium term from Spain, Italy and
Ireland), and probable build-out of Asia.
AXA’s build-out of emerging growth exposure will likely continue, currently at
12% (versus 5% 2009), possibly to rise to 20%-25% by 2020. Despite lack of
diversification benefits afforded to the US, we have no expectation of AXA
divesting its US operations, and do not include this option in the discussion
here.
Generali will likely remain focused on its central European core with further
cross-border synergies developed, with additional build-out of emerging growth
beyond the CEE.
Capital Annual cash Areas for EPS Dividend
Redeployed post reinvestment growth pay-out
dividend potential long term
AEGON 5-10% 3% Buybacks, New Markets 7-8% 40%
Allianz <10% 4% Add-ons, mature & emerging 8% 50%
Aviva 10%-20% 2% Emerging markets 6-8% 40-45%
AXA <5% 2% Emerging markets 7-8% 45%
Generali <5% 3% Emerging markets 7-8% 45%
Prudential 0-30% 1% Emerging markets 10% 35%
Zurich 5%-plus 1% Emerging markets 5-6% 65%
Financials
Initiating Coverage
6 August 2014
page 40 of 116 , Equity Analyst, 44 (0) 20 7029 8784, [email protected] Cathcart
Please see important disclosure information on pages 113 - 116 of this report.
Prudential’s move towards Asian growth will continue with the outside
possibility of a disposal of Jackson.
Zurich’s strategies for growth in non-life Farmers and global corporate cross-
sell will continue, with further push into the emerging markets from capital
released from non-core.
AEGON: The Seventh Day
Management faces the perennial conundrum: justification of a large US asset controlled
by a Dutch holding. Solvency II has not been helpful in this regard with the likely absence
of diversification benefits under US equivalence. Faced with the decision of exiting the UK
(13% of group capital) or making it work, management have opted for the latter, driven
in their decision making in part perhaps by the need to counterweight the US.
At the same time, NN has been recently floated from its parent ING, and is currently
commanding a higher PER rating than AEGON (a Dutch insurer with CEE and run-off
exposure), where the US insurance operations of ING were spun-off separately last year,
again commanding a higher rating on PER than AEGON. This might lead AEGON
management to consider a double-dutch alternative: re-domicile to the US, sell the UK,
and use part of the proceeds to participate in the Dutch government’s sale of REAAL
and/or ASR. AEGON would then have a similar international profile to NN with CEE assets
and, based on ING’s experience, where both AEGON USA and AEGON Europe (to be
IPO’d would benefit from higher share price ratings.
There is no sign that the tradition of AEGON is about to change, not least with the US and
holding management thoroughly integrated (CFO Daryl Button formerly US CFO), One
AEGON, integrated IT and the global pension strategy. On which basis AEGON will sweat
out the UK, sell non-core in Canada and France (the run-off books of VA GMIB, and Boli
too if US interest rates rise and make the exit valuations work) and possibly buy back
shares from the proceeds (3%-7%) to help lift the rating. In addition to the 3% share
buyback already prioritised for 2015/16 as the offset to the earlier preference capital
dilution, this could lead to the share count falling 6%-10% from current levels. We can
also expect the dividend to be raised over time (likely timeframe 2017 onwards), the most
likely scenario in our view to 40% of earnings or 67% of cash (where the timing of the
increase will be dependent on the speed of the non-core sales and outcome on the final
parameters of Solvency II), with the residual capital of €300m generated each year set
aside for emerging investment. Successful reinvest on a 12% ROE would add 2% to group
earnings growth annually to give a total growth profile of 7%.
Allianz: The Seventh Day
Management remain committed to PIMCO (close to 30% of group profits) where
significant fund diversification over the past year, and the appointment of six deputy
CIO’s to alleviate key man risk and a replacement CEO (former COO) should help offset
shareholder concerns on recent performance concerns and the recent loss of CEO.
Ownership not only gives diversification benefits under Solvency II but an offset to falling
yield risk impacting future life returns, where rising bond assets at PIMCO as yield falls
generate higher fees. Fireman’s, the US non-life asset (2% of group capital), is expected
to achieve CoC over the medium term, according to management recovery plans, with all
options open thereafter. We expect the dividend pay-out ratio to be raised above the
current 40% level, possibly to as high as 50% over the medium term, with more
communication on this towards the end of the year, by which time internal CEO
succession, if one is required, may well have been announced. The main challenge for
management is finding a home for the €2.5bn excess capital generated annually. If
successfully reinvested in growth markets and/or add-ons earnings on a 12% ROE,
earnings would benefit by an additional 4% annually on our calculation.
Aviva: The Seventh Day
Management’s current priority is cost cutting, technical excellence, IT edge and cash
remittance. Double-digit increases in the dividend are likely, in our view, reflecting the
earnings trend, with an increasing pay-out ratio alongside. CEO Mark Wilson underlined
Question marks over future
ownership structure post Solvency II
Exit of non-core to facilitate a move
to higher pay-out ratios; we project
40% over the medium term.
Management committed to PIMCO.
Higher dividend pay-out ratio likely
to be announced later this year; we
project 50%, with scope for
acquisitive investment alongside.
Dividend increases to be driven by
earnings momentum.
Financials
Initiating Coverage
6 August 2014
page 41 of 116 , Equity Analyst, 44 (0) 20 7029 8784, [email protected] Cathcart
Please see important disclosure information on pages 113 - 116 of this report.

that the £800m cash earnings guidance for 2016 at the holding available was for future
dividends. We suspect that 75%-80% of this amount will eventually be set aside for
dividend (likely timeframe 2017), equating to a 40% pay-out ratio on operating EPS. This
would leave £250-300m annual for investment in growth, which if successfully reinvested
would benefit a 12% ROE by approaching 2% annually on our calculation. The key area
of interest for us, however, is the £2bn-plus that could be released from eventual sales of
Italy, Spain and Ireland (likely time horizon 2016-17). With the group CEO formerly CEO
at AIA, and the global life CEO formerly CEO of Great Eastern Holdings, further investment
in Asian jvs and distribution deals seems the most likely home for this capital. Successful
reinvestment of 10%-15% of group capital in Asia would be the final stage of a significant
transformation for the group.
AXA: The Seventh Day
Management indicated strongly at the recent 1H analyst conference an imminent move to
a more generous dividend pay-out ratio. We project 45% versus the 40% that has usually
been paid out in recent years. In terms of growth, Ambition 2015 targeted back in 2009 a
2.5x increase in the growth contribution to group earnings from a 5% base. At 12% for
full year 2013, the target has been reached two years early. AXA’s commitment to
growth expansion continues, however, where management have recently expressed
interest in the corporate insurance assets of the Brazilian bank Itau Unibanco. Later next
year AXA objectives for Ambition 2020 will possibly be set out, with a further doubling of
growth contribution to earnings quite likely included. Aside from the reinvestment
potential on the €1bn of excess cash the group will be generating annually on 45%
dividend pay-out assumption (reinvestment on a 12% ROE equates to close to 3% of
earnings on our calculation), there might also be scope for additional capital release from
the life back books. These have played an important role in AXA’s capital management
programme, with exits from the UK (to Resolution) and US (Mony), reinsurance of €7bn
of French life reserves, and most recently buyouts in the US of policyholder benefits
(earnings neutral but reducing tail risk). Successful execution would see AXA more than
half way towards Prudential’s emerging growth profile by 2020.
Generali: The Seventh Day
Disposal of non-core has now been completed with the recently announced disposal of
BSI. Based on management’s recent commentary at the 1H analyst conference that the
pay-out ratio would be higher than 40% going forwards we project the dividend pay-out
ratio to rise in steps towards 45%, equivalent to 67% of cash earnings. We forecast
€650m of annual free cash post dividend from 2016, by which time the bulk of group
integration will have been achieved. Successful reinvestment on a 12% ROE of the excess
would add 3% to group earnings growth annually, to give a total growth profile of 7%.
The current buyout of the CEE minorities at €2.5bn, 10% of group capital (versus the
€4bn non-core exits disposal programme), highlights Generali’s high level commitment
to emerging market growth.
Prudential: The Seventh Day
Prudential’s clean corporate structure, with no internal debt, Asia with its own holding
structure, US life with no diversification benefits likely under Solvency II, and management
commentary on business optionality all point to at least the possibility of a break-up of the
group at some stage in the future, if not a straight sale or IPO of Jackson. Asian investors
are possibly less willing to own Prudential given the difficulties in understanding the UK
and US businesses. With Jackson sold, the Asian business could then re-rate possibly to a
premium to AIA based on a qualitative assessment between the two. In Prudential’s
current corporate state, we expect the growth focus to be firmly on Asia, with the US
growth likely to fall back to a normalised growth trend over the coming quarters. Asian
agency distribution continues to grow at double-digit rates with graduate recruitment
fuelling the tripling of agents over the past six years. Standard Chartered is also
broadening (customer penetration still only 3%), with new initiatives in Hong Kong and
Singapore, India and China in the process of opening, and with other markets to follow.
Specifically in Thailand (undeveloped by Prudential’s standards but the second largest SE
Asian economy), distribution was secured last year via auto finance leader Thanachart.
Dividend pay-out increases possible
medium term, alongside capital
reallocation from Europe to Asia
Likely move to structurally higher
dividend pay-out ratio for 2014
Growth aspirations to continue with
a possible further doubling in
emerging growth by 2020
Dividend pay-out ratio set to rise, to
45% on our estimates, with
continued investment in emerging
markets over the longer term
Group optionality to IPO the US, and
achieve a higher rating on the Asian
core
Double digit Asian growth likely to
continue driven by customer and
distribution expansion
Financials
Initiating Coverage
6 August 2014
page 42 of 116 , Equity Analyst, 44 (0) 20 7029 8784, [email protected] Cathcart
Please see important disclosure information on pages 113 - 116 of this report.
Crucially, the growth trend in Prudential’s core health product shows no signs of abating.
Out-of-pocket medical expenses stand at 30%-60% across the regions, according to
management, versus 10% in the US/UK. Above all, Prudential’s customer base, the
middle class, is expected to grow to 135m vs 45m 2012 (versus Prudential’s 2m
customers). And beyond Asia, the African continent now appears to be in Prudential
sights.
Zurich: The Seventh Day
Management remain committed to the high dividend pay-out ratio (65% for 2013),
despite limited excess cash each year (US$470m on our calculation) available for
investment elsewhere (reinvestment on a 12% ROE equates to 1% of earnings on our
calculation). Existing excess capital is currently set aside for additional investments in
corporate bonds and equities to help offset falling yields.
Management are also seeking ways of increasing the growth profile of the business. To
this end, a more active capital management programme is being developed at the group,
to highlight sub cost of capital units. The majority of this, according to management, is
backing the back books of life where methods of capital release and improved efficiency
are being explored. Nine operations have, however, been signposted for sale. No
indication has been given on the size of capital allocated to these exit markets but we
suspect quite small, with 5% of group capital regarded by management as non-strategic.
We note that recent exits have all been tiny in the context of the group: Russia, Taiwan
Life, Australian group risk, and the Hong Kong tied agency business. We believe that any
additional capital extracted from non-core sales and capital released from the life back
books will most likely be set aside for emerging market acquisitions, where Mexico,
Indonesia and Malaysia have been highlighted as targeted areas for expansion (following
the 2011 Santander acquisition in Brazil). Management have committed to updating on
the strategic objectives set out last December at the 1H results presentation in early
August.
High pay-out ratio at 65% prevents
further increases from here
Growth initiatives across the group,
though with limited scope for capital
reallocation
Financials
Initiating Coverage
6 August 2014
page 43 of 116 , Equity Analyst, 44 (0) 20 7029 8784, [email protected] Cathcart
Please see important disclosure information on pages 113 - 116 of this report.
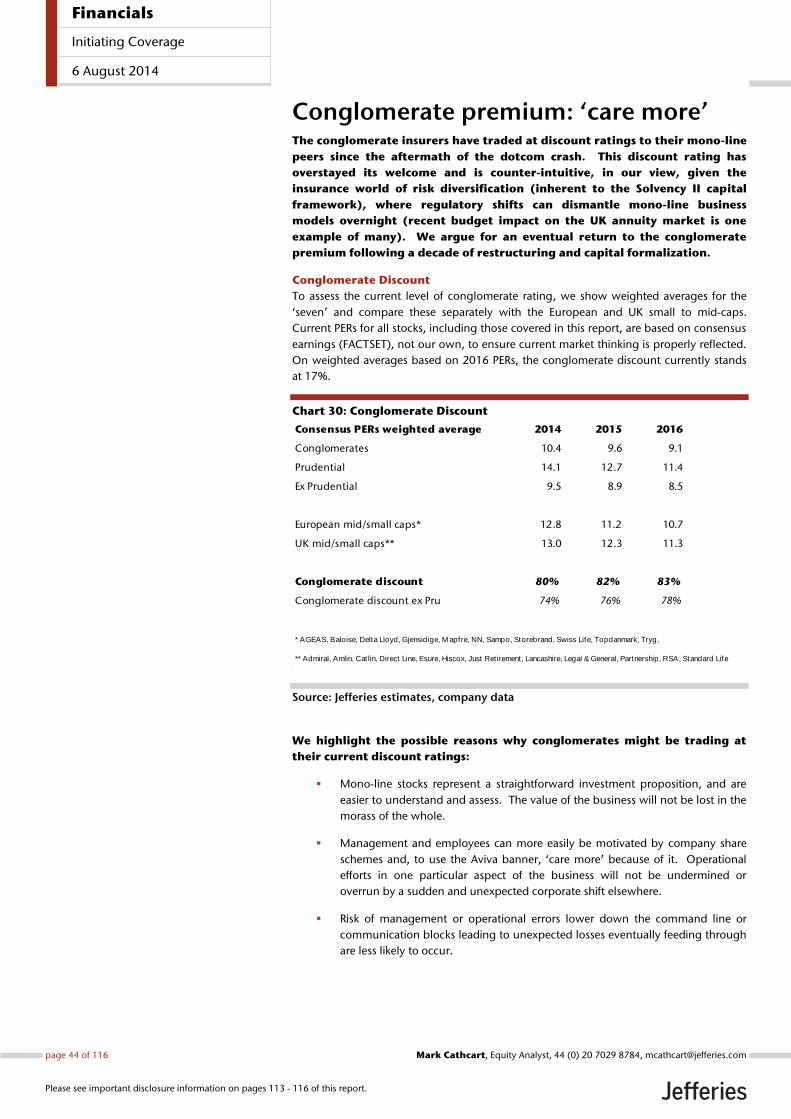
Conglomerate premium: ‘care more’ The conglomerate insurers have traded at discount ratings to their mono-line
peers since the aftermath of the dotcom crash. This discount rating has
overstayed its welcome and is counter-intuitive, in our view, given the
insurance world of risk diversification (inherent to the Solvency II capital
framework), where regulatory shifts can dismantle mono-line business
models overnight (recent budget impact on the UK annuity market is one
example of many). We argue for an eventual return to the conglomerate
premium following a decade of restructuring and capital formalization.
Conglomerate Discount
To assess the current level of conglomerate rating, we show weighted averages for the
‘seven’ and compare these separately with the European and UK small to mid-caps.
Current PERs for all stocks, including those covered in this report, are based on consensus
earnings (FACTSET), not our own, to ensure current market thinking is properly reflected.
On weighted averages based on 2016 PERs, the conglomerate discount currently stands
at 17%.
Chart 30: Conglomerate Discount
Source: Jefferies estimates, company data
We highlight the possible reasons why conglomerates might be trading at
their current discount ratings:
Mono-line stocks represent a straightforward investment proposition, and are
easier to understand and assess. The value of the business will not be lost in the
morass of the whole.
Management and employees can more easily be motivated by company share
schemes and, to use the Aviva banner, ‘care more’ because of it. Operational
efforts in one particular aspect of the business will not be undermined or
overrun by a sudden and unexpected corporate shift elsewhere.
Risk of management or operational errors lower down the command line or
communication blocks leading to unexpected losses eventually feeding through
are less likely to occur.
Consensus PERs weighted average 2014 2015 2016
Conglomerates 10.4 9.6 9.1
Prudential 14.1 12.7 11.4
Ex Prudential 9.5 8.9 8.5
European mid/small caps* 12.8 11.2 10.7
UK mid/small caps** 13.0 12.3 11.3
Conglomerate discount 80% 82% 83%
Conglomerate discount ex Pru 74% 76% 78%
* AGEAS, Baloise, Delta Lloyd, Gjensidige, M apfre, NN, Sampo, Storebrand, Swiss Life, Topdanmark, Tryg,
** Admiral, Amlin, Catlin, Direct Line, Esure, Hiscox, Just Retirement, Lancashire, Legal & General, Partnership, RSA, Standard Life
Financials
Initiating Coverage
6 August 2014
page 44 of 116 , Equity Analyst, 44 (0) 20 7029 8784, [email protected] Cathcart
Please see important disclosure information on pages 113 - 116 of this report.
Diversification of Risk…
One core consideration, however, crucial to the very essence of insurance, does appear to
be being overlooked: the diversification of risk, not least given the backdrop of ongoing
regulatory change.
The formation of ING in 1991 was justified by its CEO Aad Jacobs at the time by this very
premise, diversification of risk, a collection of economic cycles across the globe that would
permit an uninterrupted growth trend in earnings. In theory this made sense, in practice
the opposite occurred, with ING somehow attracting concentration of risk: at the
epicenter of the 1997 Asian Crisis, suffering huge losses from WTC reinsurance, and the
overwhelming level of MBS sub-prime losses that required government bail-out.
Wherever it rained in the world, there seemed to be a torrential downpour on ING. So
what makes us confident that risk concentration will not undermine the conglomerate at
some stage again in the future?
ING’s concentration woes would have been mitigated since by the improvement of
corporate governance now being employed across the insurance conglomerates, along
with better reporting lines, and also stronger understanding of financial market risk under
the precepts of Solvency II.
…. and the CORCers
The risk dynamics for the insurance sector appear to have shifted in any case, away from
financial markets more towards specific underwriting and regulatory risks. The CORC, the
Cost of Regulatory Change, has proved especially damaging to the mono-line insurers
recently, with Partnership and Just Retirement suffering substantial share price declines
(share price underperformance versus the sector of over 55% and 35%, respectively, since
the beginning of the year) following the UK budget’s dismantling of the individual
annuity market, essential to their business. The recent introduction of simpler individual
life savings products in Holland that can now be sold just as easily via the banks could
have been equally derailing to any mono-line Dutch life stock given the potential for loss
of market share (where NN has put its individual Dutch life business into run-off). AEGON
the conglomerate is involved in both of these markets, with exposure to both of these
risks, but the risk has been diversified away by its conglomerate status and spread of
global businesses.
There have been plenty of ‘CORCers’ in the past: the UK alone has a long list of them:
pensions auto enrollment (2006), RDR (end 2012), DWP caps (April 2015) to name but
three. All countries have them, even those in emerging Asia. ING was forced by the
regulator to halve its South Korean life pricing a decade ago due to excessive margins
being made (in the regulator’s view).
Whether the final introduction of Solvency II means that the geographical and business
line diversification benefits afforded to insurance conglomerates are negated at least in
part by the level of capital required by additional G-SII requirements or US equivalence
(no diversification benefit because of it) is irrelevant in this regard. The arbitrary move of
one regulator or one pricing cycle will not dismantle the investment premise and earnings
potential of a diversified conglomerate overnight. The PER rating attached to the earnings
streams should be higher on this consideration alone regardless of any actual capital
benefit.
Financials
Initiating Coverage
6 August 2014
page 45 of 116 , Equity Analyst, 44 (0) 20 7029 8784, [email protected] Cathcart
Please see important disclosure information on pages 113 - 116 of this report.
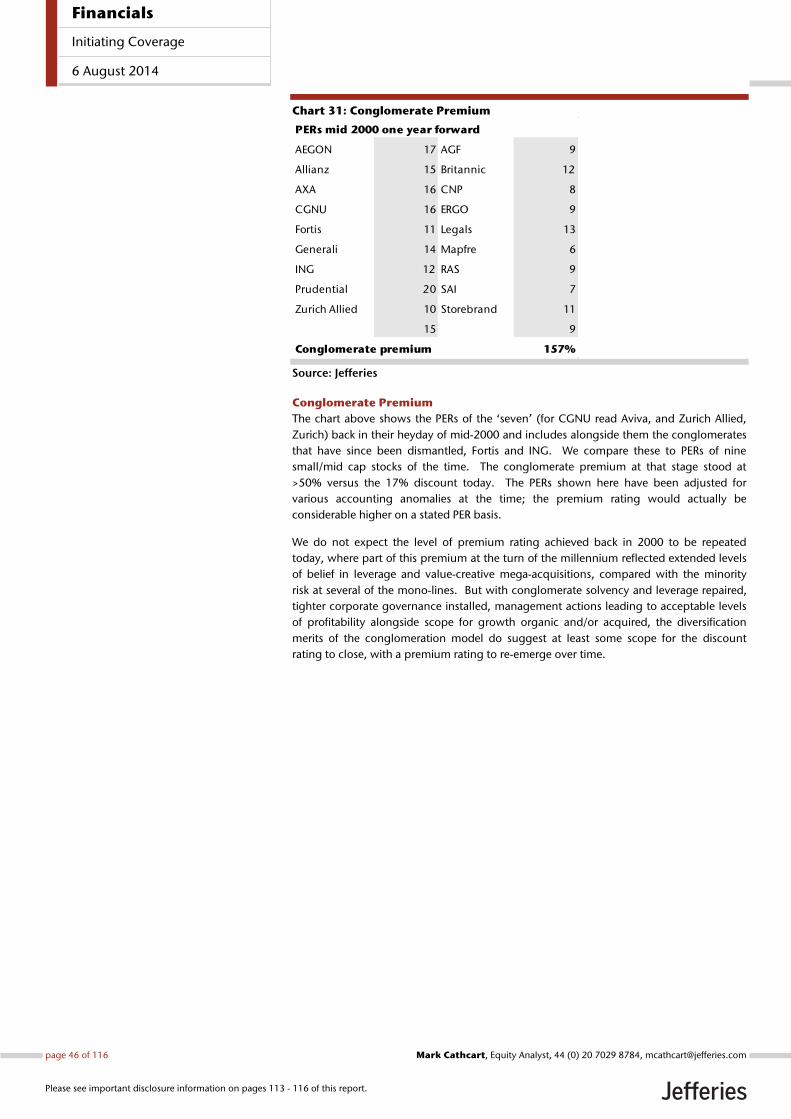
Chart 31: Conglomerate Premium
Source: Jefferies
Conglomerate Premium
The chart above shows the PERs of the ‘seven’ (for CGNU read Aviva, and Zurich Allied,
Zurich) back in their heyday of mid-2000 and includes alongside them the conglomerates
that have since been dismantled, Fortis and ING. We compare these to PERs of nine
small/mid cap stocks of the time. The conglomerate premium at that stage stood at
>50% versus the 17% discount today. The PERs shown here have been adjusted for
various accounting anomalies at the time; the premium rating would actually be
considerable higher on a stated PER basis.
We do not expect the level of premium rating achieved back in 2000 to be repeated
today, where part of this premium at the turn of the millennium reflected extended levels
of belief in leverage and value-creative mega-acquisitions, compared with the minority
risk at several of the mono-lines. But with conglomerate solvency and leverage repaired,
tighter corporate governance installed, management actions leading to acceptable levels
of profitability alongside scope for growth organic and/or acquired, the diversification
merits of the conglomeration model do suggest at least some scope for the discount
rating to close, with a premium rating to re-emerge over time.
PERs mid 2000 one year forward
AEGON 17 AGF 9
Allianz 15 Britannic 12
AXA 16 CNP 8
CGNU 16 ERGO 9
Fortis 11 Legals 13
Generali 14 Mapfre 6
ING 12 RAS 9
Prudential 20 SAI 7
Zurich Allied 10 Storebrand 11
15 9
Conglomerate premium 157%
Financials
Initiating Coverage
6 August 2014
page 46 of 116 , Equity Analyst, 44 (0) 20 7029 8784, [email protected] Cathcart
Please see important disclosure information on pages 113 - 116 of this report.

The Seven Insurance Wonders:
Company Sections
Financials
Initiating Coverage
6 August 2014
page 47 of 116 , Equity Analyst, 44 (0) 20 7029 8784, [email protected] Cathcart
Please see important disclosure information on pages 113 - 116 of this report.
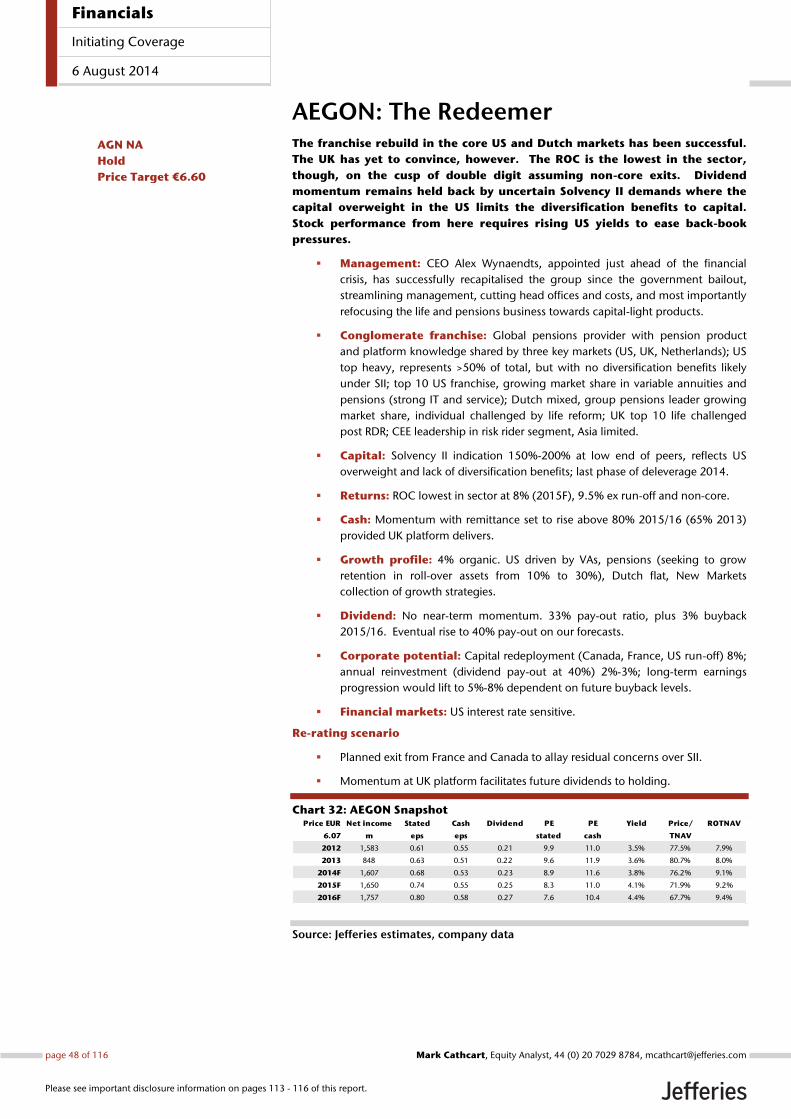
AEGON: The Redeemer The franchise rebuild in the core US and Dutch markets has been successful.
The UK has yet to convince, however. The ROC is the lowest in the sector,
though, on the cusp of double digit assuming non-core exits. Dividend
momentum remains held back by uncertain Solvency II demands where the
capital overweight in the US limits the diversification benefits to capital.
Stock performance from here requires rising US yields to ease back-book
pressures.
Management: CEO Alex Wynaendts, appointed just ahead of the financial
crisis, has successfully recapitalised the group since the government bailout,
streamlining management, cutting head offices and costs, and most importantly
refocusing the life and pensions business towards capital-light products.
Conglomerate franchise: Global pensions provider with pension product
and platform knowledge shared by three key markets (US, UK, Netherlands); US
top heavy, represents >50% of total, but with no diversification benefits likely
under SII; top 10 US franchise, growing market share in variable annuities and
pensions (strong IT and service); Dutch mixed, group pensions leader growing
market share, individual challenged by life reform; UK top 10 life challenged
post RDR; CEE leadership in risk rider segment, Asia limited.
Capital: Solvency II indication 150%-200% at low end of peers, reflects US
overweight and lack of diversification benefits; last phase of deleverage 2014.
Returns: ROC lowest in sector at 8% (2015F), 9.5% ex run-off and non-core.
Cash: Momentum with remittance set to rise above 80% 2015/16 (65% 2013)
provided UK platform delivers.
Growth profile: 4% organic. US driven by VAs, pensions (seeking to grow
retention in roll-over assets from 10% to 30%), Dutch flat, New Markets
collection of growth strategies.
Dividend: No near-term momentum. 33% pay-out ratio, plus 3% buyback
2015/16. Eventual rise to 40% pay-out on our forecasts.
Corporate potential: Capital redeployment (Canada, France, US run-off) 8%;
annual reinvestment (dividend pay-out at 40%) 2%-3%; long-term earnings
progression would lift to 5%-8% dependent on future buyback levels.
Financial markets: US interest rate sensitive.
Re-rating scenario
Planned exit from France and Canada to allay residual concerns over SII.
Momentum at UK platform facilitates future dividends to holding.
Chart 32: AEGON Snapshot
Source: Jefferies estimates, company data
Price EUR Net income Stated Cash Dividend PE PE Yield Price/ ROTNAV
6.07 m eps eps stated cash TNAV
2012 1,583 0.61 0.55 0.21 9.9 11.0 3.5% 77.5% 7.9%
2013 848 0.63 0.51 0.22 9.6 11.9 3.6% 80.7% 8.0%
2014F 1,607 0.68 0.53 0.23 8.9 11.6 3.8% 76.2% 9.1%
2015F 1,650 0.74 0.55 0.25 8.3 11.0 4.1% 71.9% 9.2%
2016F 1,757 0.80 0.58 0.27 7.6 10.4 4.4% 67.7% 9.4%
AGN NA
Hold
Price Target €6.60
Financials
Initiating Coverage
6 August 2014
page 48 of 116 , Equity Analyst, 44 (0) 20 7029 8784, [email protected] Cathcart
Please see important disclosure information on pages 113 - 116 of this report.
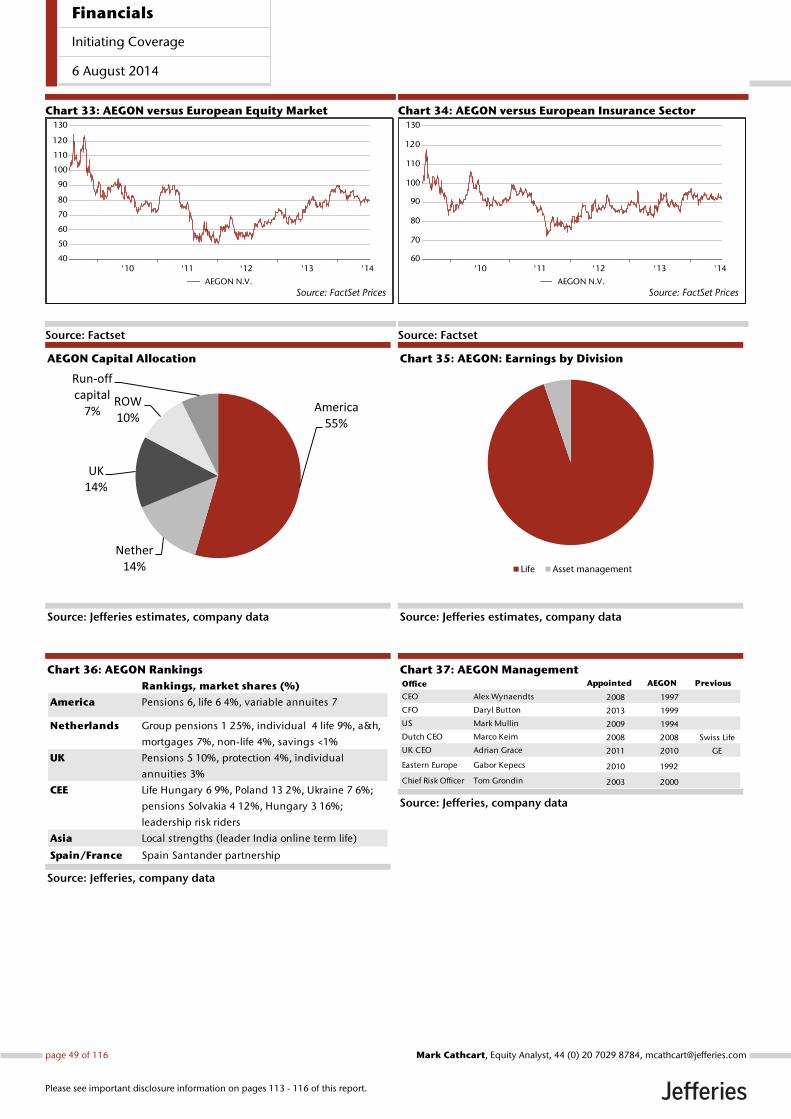
Chart 33: AEGON versus European Equity Market
Source: Factset
Chart 34: AEGON versus European Insurance Sector
Source: Factset
AEGON Capital Allocation
Source: Jefferies estimates, company data
Chart 35: AEGON: Earnings by Division
Source: Jefferies estimates, company data
Chart 36: AEGON Rankings
Source: Jefferies, company data
Chart 37: AEGON Management
Source: Jefferies, company data
'10 '11 '12 '13 '1440
50
60
70
80
90
100
110
120
130
Source: FactSet PricesAEGON N.V.
'10 '11 '12 '13 '1460
70
80
90
100
110
120
130
Source: FactSet PricesAEGON N.V.
America55%
Nether14%
UK14%
ROW10%
Run-off capital
7%
Life Asset management
Rankings, market shares (%)
America Pensions 6, life 6 4%, variable annuites 7
Netherlands Group pensions 1 25%, individual 4 life 9%, a&h,
mortgages 7%, non-life 4%, savings <1%
UK Pensions 5 10%, protection 4%, individual
annuities 3%
CEE Life Hungary 6 9%, Poland 13 2%, Ukraine 7 6%;
pensions Solvakia 4 12%, Hungary 3 16%;
leadership risk riders
Asia Local strengths (leader India online term life)
Spain/France Spain Santander partnership
Office Appointed AEGON Previous
CEO Alex Wynaendts 2008 1997
CFO Daryl Button 2013 1999
US Mark Mullin 2009 1994
Dutch CEO Marco Keim 2008 2008 Swiss Life
UK CEO Adrian Grace 2011 2010 GE
Eastern Europe Gabor Kepecs 2010 1992
Chief Risk Officer Tom Grondin 2003 2000
Financials
Initiating Coverage
6 August 2014
page 49 of 116 , Equity Analyst, 44 (0) 20 7029 8784, [email protected] Cathcart
Please see important disclosure information on pages 113 - 116 of this report.
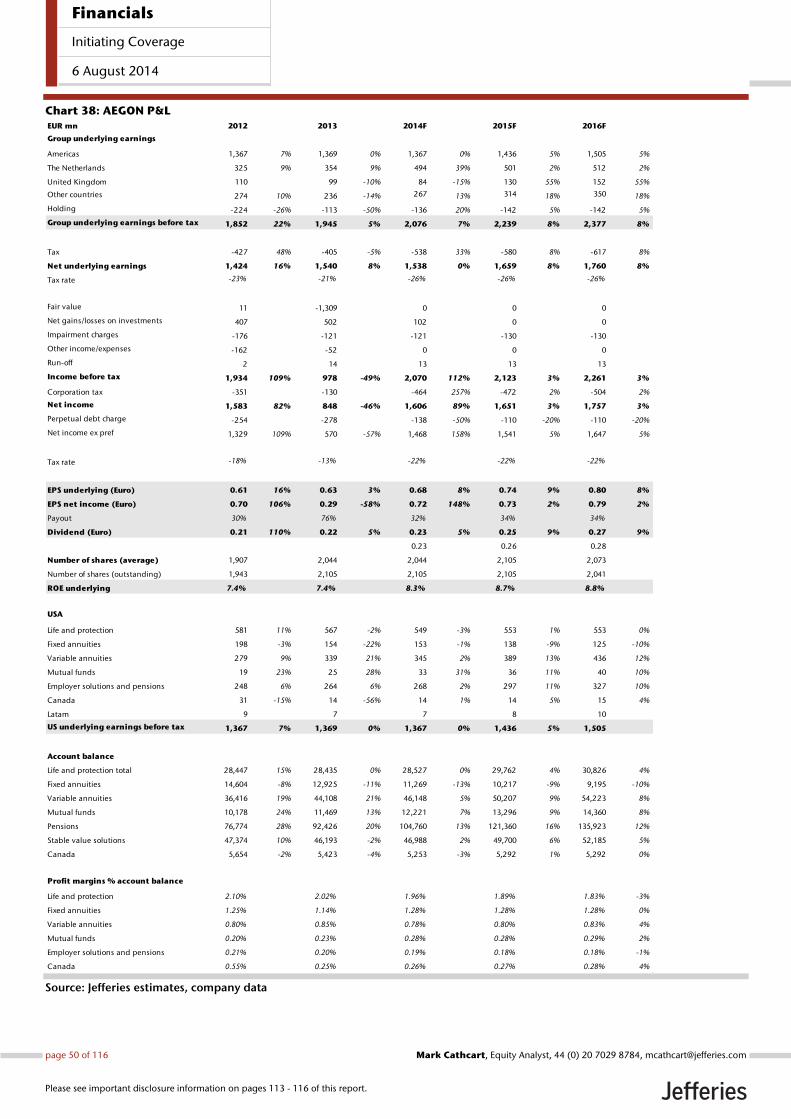
Chart 38: AEGON P&L
Source: Jefferies estimates, company data
EUR mn 2012 2013 2014F 2015F 2016F
Group underlying earnings
Americas 1,367 7% 1,369 0% 1,367 0% 1,436 5% 1,505 5%
The Netherlands 325 9% 354 9% 494 39% 501 2% 512 2%
United Kingdom 110 99 -10% 84 -15% 130 55% 152 55%
Other countries 274 10% 236 -14% 267 13% 314 18% 350 18%
Holding -224 -26% -113 -50% -136 20% -142 5% -142 5%
Group underlying earnings before tax 1,852 22% 1,945 5% 2,076 7% 2,239 8% 2,377 8%
Tax -427 48% -405 -5% -538 33% -580 8% -617 8%
Net underlying earnings 1,424 16% 1,540 8% 1,538 0% 1,659 8% 1,760 8%
Tax rate -23% -21% -26% -26% -26%
Fair value 11 -1,309 0 0 0
Net gains/losses on investments 407 502 102 0 0
Impairment charges -176 -121 -121 -130 -130
Other income/expenses -162 -52 0 0 0
Run-off 2 14 13 13 13
Income before tax 1,934 109% 978 -49% 2,070 112% 2,123 3% 2,261 3%
Corporation tax -351 -130 -464 257% -472 2% -504 2%
Net income 1,583 82% 848 -46% 1,606 89% 1,651 3% 1,757 3%
Perpetual debt charge -254 -278 -138 -50% -110 -20% -110 -20%
Net income ex pref 1,329 109% 570 -57% 1,468 158% 1,541 5% 1,647 5%
Tax rate -18% -13% -22% -22% -22%
EPS underlying (Euro) 0.61 16% 0.63 3% 0.68 8% 0.74 9% 0.80 8%
EPS net income (Euro) 0.70 106% 0.29 -58% 0.72 148% 0.73 2% 0.79 2%
Payout 30% 76% 32% 34% 34%
Dividend (Euro) 0.21 110% 0.22 5% 0.23 5% 0.25 9% 0.27 9%
0.23 0.26 0.28
Number of shares (average) 1,907 2,044 2,044 2,105 2,073
Number of shares (outstanding) 1,943 2,105 2,105 2,105 2,041
ROE underlying 7.4% 7.4% 8.3% 8.7% 8.8%
USA
Life and protection 581 11% 567 -2% 549 -3% 553 1% 553 0%
Fixed annuities 198 -3% 154 -22% 153 -1% 138 -9% 125 -10%
Variable annuities 279 9% 339 21% 345 2% 389 13% 436 12%
Mutual funds 19 23% 25 28% 33 31% 36 11% 40 10%
Employer solutions and pensions 248 6% 264 6% 268 2% 297 11% 327 10%
Canada 31 -15% 14 -56% 14 1% 14 5% 15 4%
Latam 9 7 7 8 10
US underlying earnings before tax 1,367 7% 1,369 0% 1,367 0% 1,436 5% 1,505
Account balance
Life and protection total 28,447 15% 28,435 0% 28,527 0% 29,762 4% 30,826 4%
Fixed annuities 14,604 -8% 12,925 -11% 11,269 -13% 10,217 -9% 9,195 -10%
Variable annuities 36,416 19% 44,108 21% 46,148 5% 50,207 9% 54,223 8%
Mutual funds 10,178 24% 11,469 13% 12,221 7% 13,296 9% 14,360 8%
Pensions 76,774 28% 92,426 20% 104,760 13% 121,360 16% 135,923 12%
Stable value solutions 47,374 10% 46,193 -2% 46,988 2% 49,700 6% 52,185 5%
Canada 5,654 -2% 5,423 -4% 5,253 -3% 5,292 1% 5,292 0%
Profit margins % account balance
Life and protection 2.10% 2.02% 1.96% 1.89% 1.83% -3%
Fixed annuities 1.25% 1.14% 1.28% 1.28% 1.28% 0%
Variable annuities 0.80% 0.85% 0.78% 0.80% 0.83% 4%
Mutual funds 0.20% 0.23% 0.28% 0.28% 0.29% 2%
Employer solutions and pensions 0.21% 0.20% 0.19% 0.18% 0.18% -1%
Canada 0.55% 0.25% 0.26% 0.27% 0.28% 4%
Financials
Initiating Coverage
6 August 2014
page 50 of 116 , Equity Analyst, 44 (0) 20 7029 8784, [email protected] Cathcart
Please see important disclosure information on pages 113 - 116 of this report.
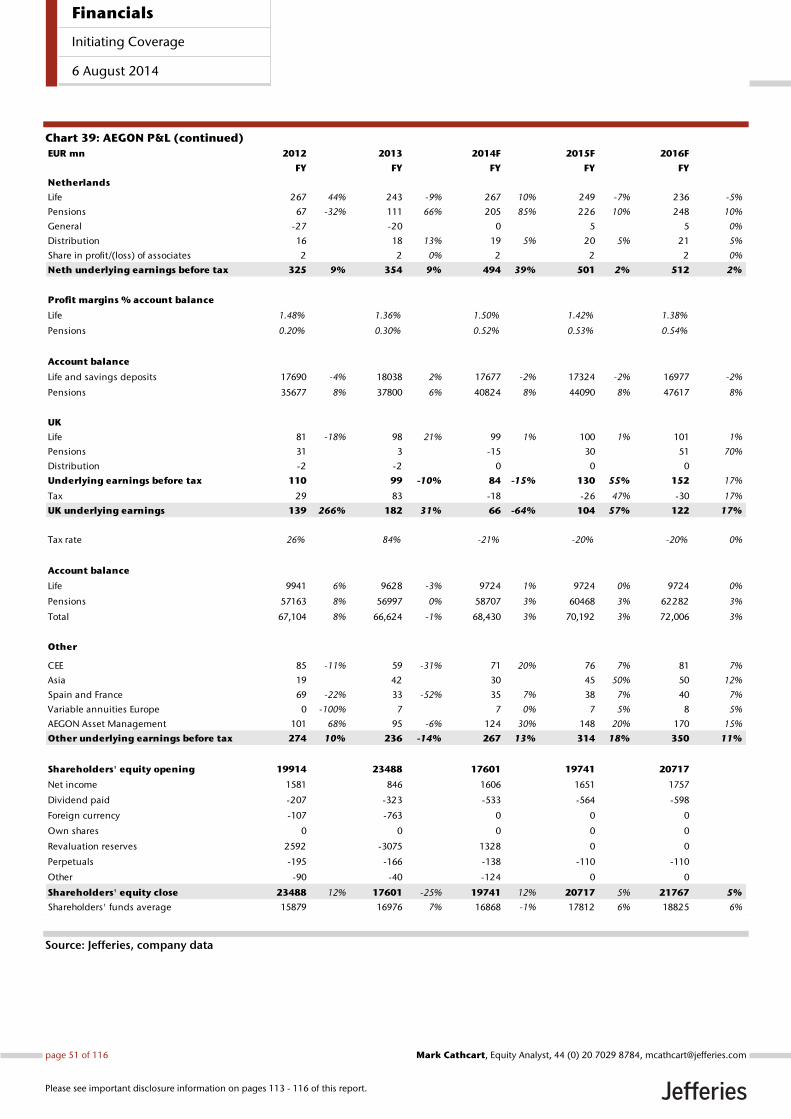
Chart 39: AEGON P&L (continued)
Source: Jefferies, company data
EUR mn 2012 2013 2014F 2015F 2016F
FY FY FY FY FY
Netherlands
Life 267 44% 243 -9% 267 10% 249 -7% 236 -5%
Pensions 67 -32% 111 66% 205 85% 226 10% 248 10%
General -27 -20 0 5 5 0%
Distribution 16 18 13% 19 5% 20 5% 21 5%
Share in profit/(loss) of associates 2 2 0% 2 2 2 0%
Neth underlying earnings before tax 325 9% 354 9% 494 39% 501 2% 512 2%
Profit margins % account balance
Life 1.48% 1.36% 1.50% 1.42% 1.38%
Pensions 0.20% 0.30% 0.52% 0.53% 0.54%
Account balance
Life and savings deposits 17690 -4% 18038 2% 17677 -2% 17324 -2% 16977 -2%
Pensions 35677 8% 37800 6% 40824 8% 44090 8% 47617 8%
UK
Life 81 -18% 98 21% 99 1% 100 1% 101 1%
Pensions 31 3 -15 30 51 70%
Distribution -2 -2 0 0 0
Underlying earnings before tax 110 99 -10% 84 -15% 130 55% 152 17%
Tax 29 83 -18 -26 47% -30 17%
UK underlying earnings 139 266% 182 31% 66 -64% 104 57% 122 17%
Tax rate 26% 84% -21% -20% -20% 0%
Account balance
Life 9941 6% 9628 -3% 9724 1% 9724 0% 9724 0%
Pensions 57163 8% 56997 0% 58707 3% 60468 3% 62282 3%
Total 67,104 8% 66,624 -1% 68,430 3% 70,192 3% 72,006 3%
Other
CEE 85 -11% 59 -31% 71 20% 76 7% 81 7%
Asia 19 42 30 45 50% 50 12%
Spain and France 69 -22% 33 -52% 35 7% 38 7% 40 7%
Variable annuities Europe 0 -100% 7 7 0% 7 5% 8 5%
AEGON Asset Management 101 68% 95 -6% 124 30% 148 20% 170 15%
Other underlying earnings before tax 274 10% 236 -14% 267 13% 314 18% 350 11%
Shareholders' equity opening 19914 23488 17601 19741 20717
Net income 1581 846 1606 1651 1757
Dividend paid -207 -323 -533 -564 -598
Foreign currency -107 -763 0 0 0
Own shares 0 0 0 0 0
Revaluation reserves 2592 -3075 1328 0 0
Perpetuals -195 -166 -138 -110 -110
Other -90 -40 -124 0 0
Shareholders' equity close 23488 12% 17601 -25% 19741 12% 20717 5% 21767 5%
Shareholders' funds average 15879 16976 7% 16868 -1% 17812 6% 18825 6%
Financials
Initiating Coverage
6 August 2014
page 51 of 116 , Equity Analyst, 44 (0) 20 7029 8784, [email protected] Cathcart
Please see important disclosure information on pages 113 - 116 of this report.
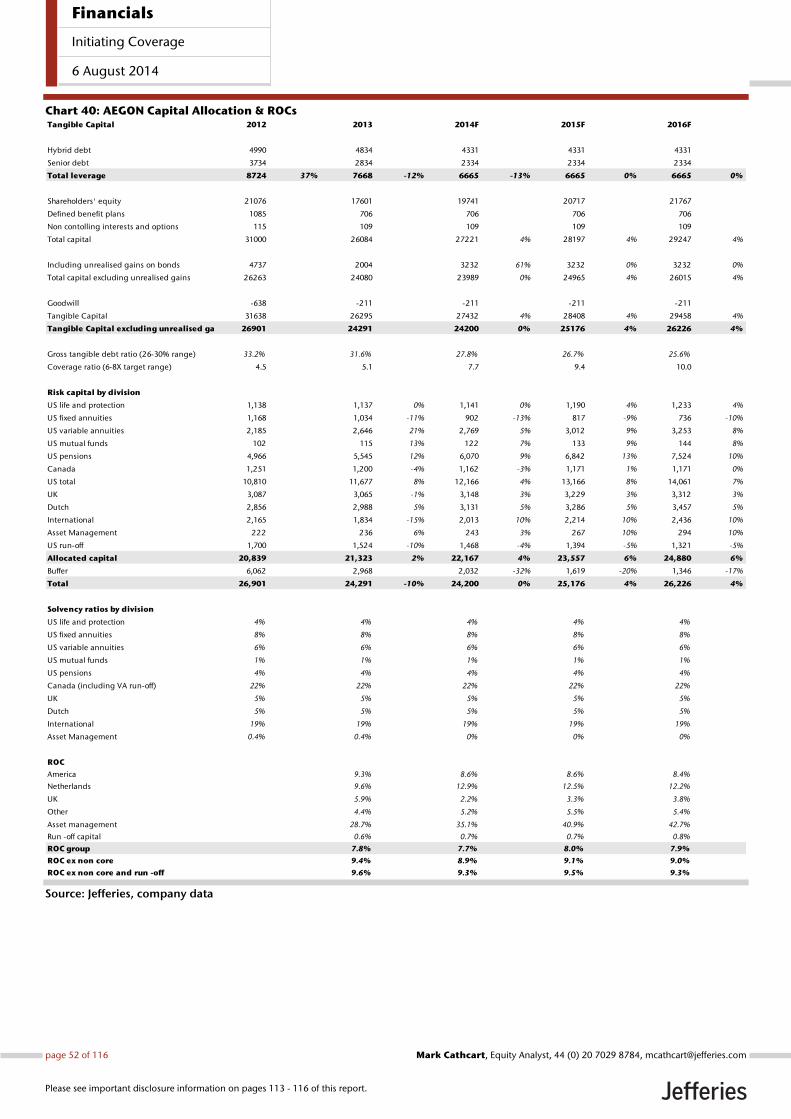
Chart 40: AEGON Capital Allocation & ROCs
Source: Jefferies, company data
Tangible Capital 2012 2013 2014F 2015F 2016F
Hybrid debt 4990 4834 4331 4331 4331
Senior debt 3734 2834 2334 2334 2334
Total leverage 8724 37% 7668 -12% 6665 -13% 6665 0% 6665 0%
Shareholders' equity 21076 17601 19741 20717 21767
Defined benefit plans 1085 706 706 706 706
Non contolling interests and options 115 109 109 109 109
Total capital 31000 26084 27221 4% 28197 4% 29247 4%
Including unrealised gains on bonds 4737 2004 3232 61% 3232 0% 3232 0%
Total capital excluding unrealised gains 26263 24080 23989 0% 24965 4% 26015 4%
Goodwill -638 -211 -211 -211 -211
Tangible Capital 31638 26295 27432 4% 28408 4% 29458 4%
Tangible Capital excluding unrealised gains 26901 24291 24200 0% 25176 4% 26226 4%
Gross tangible debt ratio (26-30% range) 33.2% 31.6% 27.8% 26.7% 25.6%
Coverage ratio (6-8X target range) 4.5 5.1 7.7 9.4 10.0
Risk capital by division
US life and protection 1,138 1,137 0% 1,141 0% 1,190 4% 1,233 4%
US fixed annuities 1,168 1,034 -11% 902 -13% 817 -9% 736 -10%
US variable annuities 2,185 2,646 21% 2,769 5% 3,012 9% 3,253 8%
US mutual funds 102 115 13% 122 7% 133 9% 144 8%
US pensions 4,966 5,545 12% 6,070 9% 6,842 13% 7,524 10%
Canada 1,251 1,200 -4% 1,162 -3% 1,171 1% 1,171 0%
US total 10,810 11,677 8% 12,166 4% 13,166 8% 14,061 7%
UK 3,087 3,065 -1% 3,148 3% 3,229 3% 3,312 3%
Dutch 2,856 2,988 5% 3,131 5% 3,286 5% 3,457 5%
International 2,165 1,834 -15% 2,013 10% 2,214 10% 2,436 10%
Asset Management 222 236 6% 243 3% 267 10% 294 10%
US run-off 1,700 1,524 -10% 1,468 -4% 1,394 -5% 1,321 -5%
Allocated capital 20,839 21,323 2% 22,167 4% 23,557 6% 24,880 6%
Buffer 6,062 2,968 2,032 -32% 1,619 -20% 1,346 -17%
Total 26,901 24,291 -10% 24,200 0% 25,176 4% 26,226 4%
Solvency ratios by division
US life and protection 4% 4% 4% 4% 4%
US fixed annuities 8% 8% 8% 8% 8%
US variable annuities 6% 6% 6% 6% 6%
US mutual funds 1% 1% 1% 1% 1%
US pensions 4% 4% 4% 4% 4%
Canada (including VA run-off) 22% 22% 22% 22% 22%
UK 5% 5% 5% 5% 5%
Dutch 5% 5% 5% 5% 5%
International 19% 19% 19% 19% 19%
Asset Management 0.4% 0.4% 0% 0% 0%
ROC
America 9.3% 8.6% 8.6% 8.4%
Netherlands 9.6% 12.9% 12.5% 12.2%
UK 5.9% 2.2% 3.3% 3.8%
Other 4.4% 5.2% 5.5% 5.4%
Asset management 28.7% 35.1% 40.9% 42.7%
Run -off capital 0.6% 0.7% 0.7% 0.8%
ROC group 7.8% 7.7% 8.0% 7.9%
ROC ex non core 9.4% 8.9% 9.1% 9.0%
ROC ex non core and run -off 9.6% 9.3% 9.5% 9.3%
Financials
Initiating Coverage
6 August 2014
page 52 of 116 , Equity Analyst, 44 (0) 20 7029 8784, [email protected] Cathcart
Please see important disclosure information on pages 113 - 116 of this report.
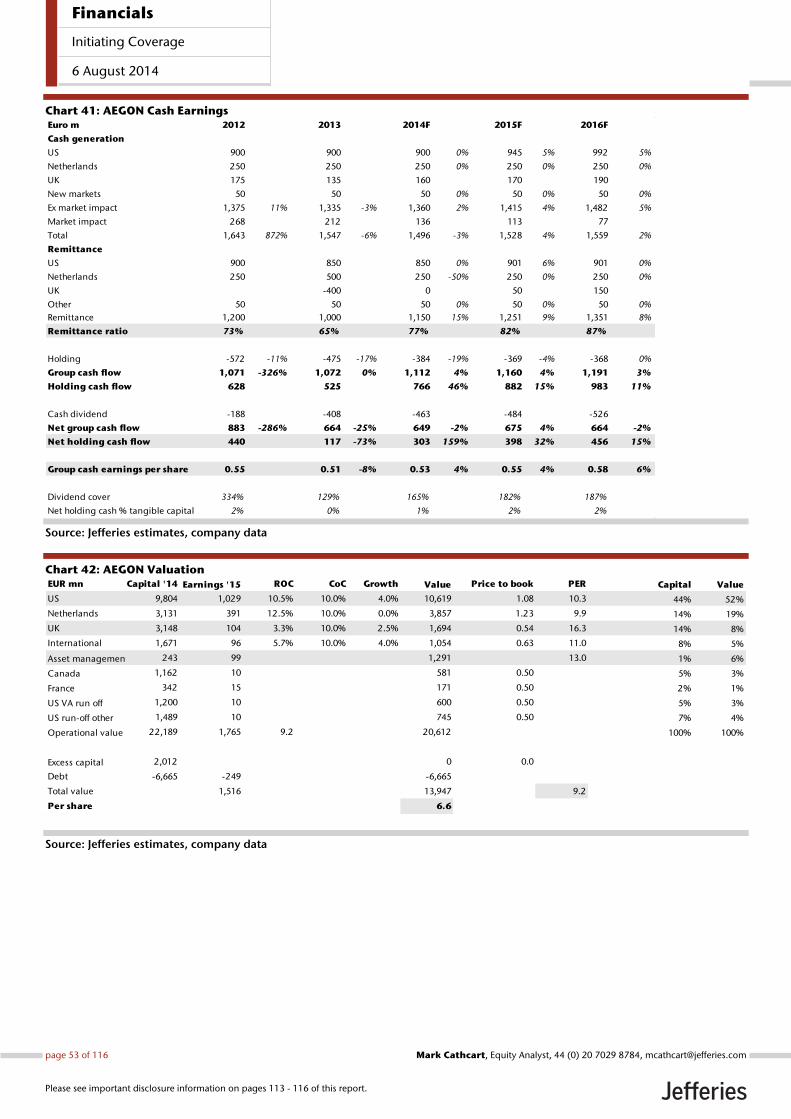
Chart 41: AEGON Cash Earnings
Source: Jefferies estimates, company data
Chart 42: AEGON Valuation
Source: Jefferies estimates, company data
Euro m 2012 2013 2014F 2015F 2016F
Cash generation
US 900 900 900 0% 945 5% 992 5%
Netherlands 250 250 250 0% 250 0% 250 0%
UK 175 135 160 170 190
New markets 50 50 50 0% 50 0% 50 0%
Ex market impact 1,375 11% 1,335 -3% 1,360 2% 1,415 4% 1,482 5%
Market impact 268 212 136 113 77
Total 1,643 872% 1,547 -6% 1,496 -3% 1,528 4% 1,559 2%
Remittance
US 900 850 850 0% 901 6% 901 0%
Netherlands 250 500 250 -50% 250 0% 250 0%
UK -400 0 50 150
Other 50 50 50 0% 50 0% 50 0%
Remittance 1,200 1,000 1,150 15% 1,251 9% 1,351 8%
Remittance ratio 73% 65% 77% 82% 87%
Holding -572 -11% -475 -17% -384 -19% -369 -4% -368 0%
Group cash flow 1,071 -326% 1,072 0% 1,112 4% 1,160 4% 1,191 3%
Holding cash flow 628 525 766 46% 882 15% 983 11%
Cash dividend -188 -408 -463 -484 -526
Net group cash flow 883 -286% 664 -25% 649 -2% 675 4% 664 -2%
Net holding cash flow 440 117 -73% 303 159% 398 32% 456 15%
Group cash earnings per share 0.55 0.51 -8% 0.53 4% 0.55 4% 0.58 6%
Dividend cover 334% 129% 165% 182% 187%
Net holding cash % tangible capital 2% 0% 1% 2% 2%
EUR mn Capital '14 Earnings '15 ROC CoC Growth Value Price to book PER Capital Value
US 9,804 1,029 10.5% 10.0% 4.0% 10,619 1.08 10.3 44% 52%
Netherlands 3,131 391 12.5% 10.0% 0.0% 3,857 1.23 9.9 14% 19%
UK 3,148 104 3.3% 10.0% 2.5% 1,694 0.54 16.3 14% 8%
International 1,671 96 5.7% 10.0% 4.0% 1,054 0.63 11.0 8% 5%
Asset management 243 99 1,291 13.0 1% 6%
Canada 1,162 10 581 0.50 5% 3%
France 342 15 171 0.50 2% 1%
US VA run off 1,200 10 600 0.50 5% 3%
US run-off other 1,489 10 745 0.50 7% 4%
Operational value 22,189 1,765 9.2 20,612 100% 100%
Excess capital 2,012 0 0.0
Debt -6,665 -249 -6,665
Total value 1,516 13,947 9.2
Per share 6.6
Financials
Initiating Coverage
6 August 2014
page 53 of 116 , Equity Analyst, 44 (0) 20 7029 8784, [email protected] Cathcart
Please see important disclosure information on pages 113 - 116 of this report.
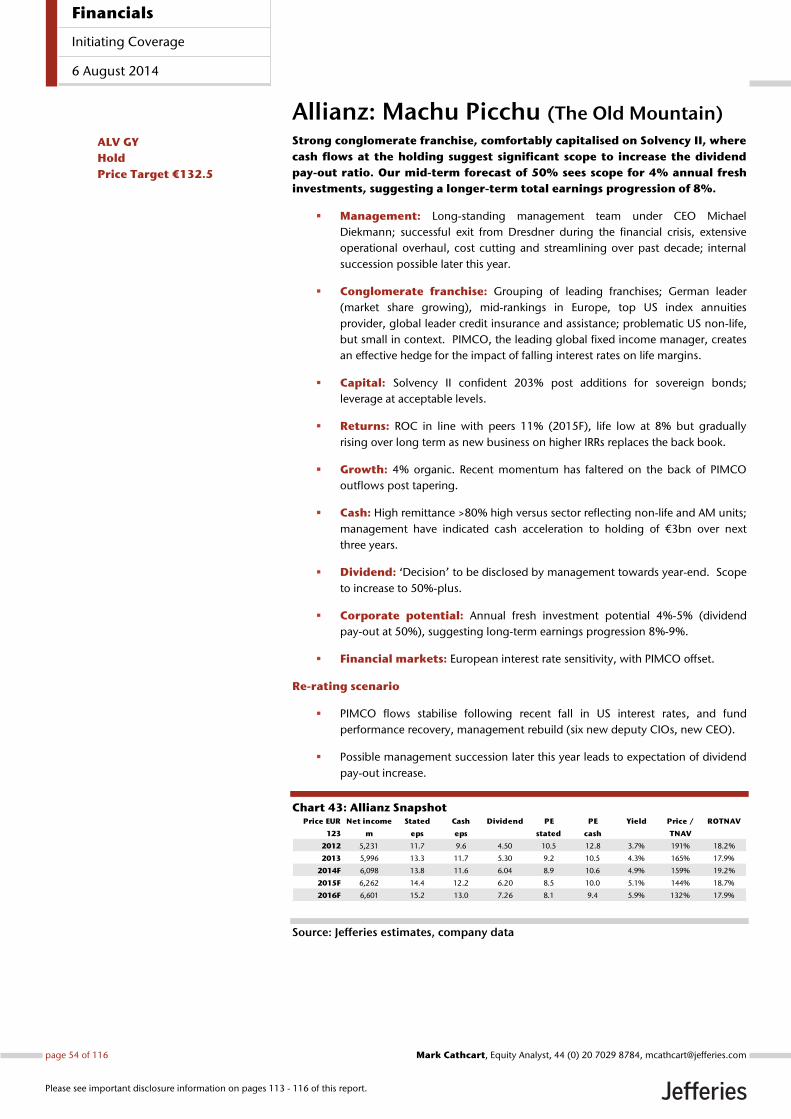
Allianz: Machu Picchu (The Old Mountain) Strong conglomerate franchise, comfortably capitalised on Solvency II, where
cash flows at the holding suggest significant scope to increase the dividend
pay-out ratio. Our mid-term forecast of 50% sees scope for 4% annual fresh
investments, suggesting a longer-term total earnings progression of 8%.
Management: Long-standing management team under CEO Michael
Diekmann; successful exit from Dresdner during the financial crisis, extensive
operational overhaul, cost cutting and streamlining over past decade; internal
succession possible later this year.
Conglomerate franchise: Grouping of leading franchises; German leader
(market share growing), mid-rankings in Europe, top US index annuities
provider, global leader credit insurance and assistance; problematic US non-life,
but small in context. PIMCO, the leading global fixed income manager, creates
an effective hedge for the impact of falling interest rates on life margins.
Capital: Solvency II confident 203% post additions for sovereign bonds;
leverage at acceptable levels.
Returns: ROC in line with peers 11% (2015F), life low at 8% but gradually
rising over long term as new business on higher IRRs replaces the back book.
Growth: 4% organic. Recent momentum has faltered on the back of PIMCO
outflows post tapering.
Cash: High remittance >80% high versus sector reflecting non-life and AM units;
management have indicated cash acceleration to holding of €3bn over next
three years.
Dividend: ‘Decision’ to be disclosed by management towards year-end. Scope
to increase to 50%-plus.
Corporate potential: Annual fresh investment potential 4%-5% (dividend
pay-out at 50%), suggesting long-term earnings progression 8%-9%.
Financial markets: European interest rate sensitivity, with PIMCO offset.
Re-rating scenario
PIMCO flows stabilise following recent fall in US interest rates, and fund
performance recovery, management rebuild (six new deputy CIOs, new CEO).
Possible management succession later this year leads to expectation of dividend
pay-out increase.
Chart 43: Allianz Snapshot
Source: Jefferies estimates, company data
Price EUR Net income Stated Cash Dividend PE PE Yield Price / ROTNAV
123 m eps eps stated cash TNAV
2012 5,231 11.7 9.6 4.50 10.5 12.8 3.7% 191% 18.2%
2013 5,996 13.3 11.7 5.30 9.2 10.5 4.3% 165% 17.9%
2014F 6,098 13.8 11.6 6.04 8.9 10.6 4.9% 159% 19.2%
2015F 6,262 14.4 12.2 6.20 8.5 10.0 5.1% 144% 18.7%
2016F 6,601 15.2 13.0 7.26 8.1 9.4 5.9% 132% 17.9%
ALV GY
Hold
Price Target €132.5
Financials
Initiating Coverage
6 August 2014
page 54 of 116 , Equity Analyst, 44 (0) 20 7029 8784, [email protected] Cathcart
Please see important disclosure information on pages 113 - 116 of this report.
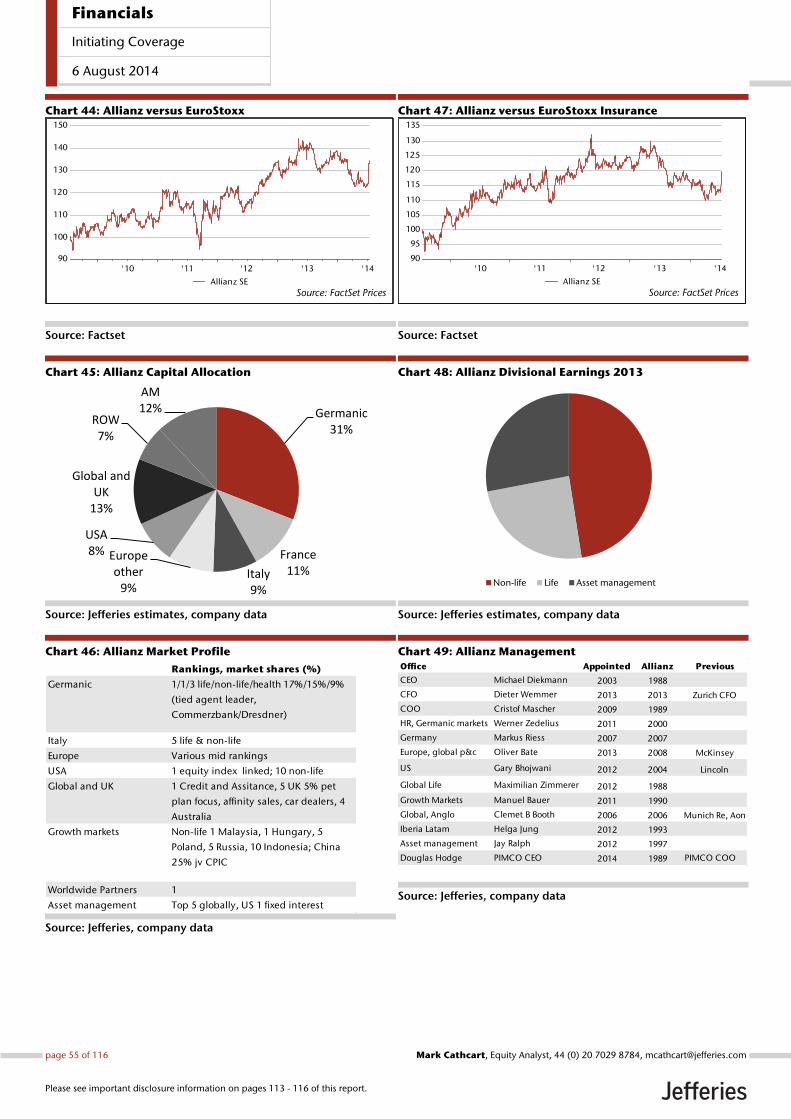
Chart 44: Allianz versus EuroStoxx
Source: Factset
Chart 45: Allianz Capital Allocation
Source: Jefferies estimates, company data
Chart 46: Allianz Market Profile
Source: Jefferies, company data
Chart 47: Allianz versus EuroStoxx Insurance
Source: Factset
Chart 48: Allianz Divisional Earnings 2013
Source: Jefferies estimates, company data
Chart 49: Allianz Management
Source: Jefferies, company data
'10 '11 '12 '13 '1490
100
110
120
130
140
150
Source: FactSet PricesAllianz SE
Germanic31%
France11%Italy
9%
Europe other
9%
USA8%
Global and UK
13%
ROW7%
AM12%
Rankings, market shares (%)
Germanic 1/1/3 life/non-life/health 17%/15%/9%
(tied agent leader,
Commerzbank/Dresdner)
Italy 5 life & non-life
Europe Various mid rankings
USA 1 equity index linked; 10 non-life
Global and UK 1 Credit and Assitance, 5 UK 5% pet
plan focus, affinity sales, car dealers, 4
Australia
Growth markets Non-life 1 Malaysia, 1 Hungary, 5
Poland, 5 Russia, 10 Indonesia; China
25% jv CPIC
Worldwide Partners 1
Asset management Top 5 globally, US 1 fixed interest
'10 '11 '12 '13 '1490
95
100
105
110
115
120
125
130
135
Source: FactSet PricesAllianz SE
Non-life Life Asset management
Office Appointed Allianz Previous
CEO Michael Diekmann 2003 1988
CFO Dieter Wemmer 2013 2013 Zurich CFO
COO Cristof Mascher 2009 1989
HR, Germanic markets Werner Zedelius 2011 2000
Germany Markus Riess 2007 2007
Europe, global p&c Oliver Bate 2013 2008 McKinsey
US Gary Bhojwani 2012 2004 Lincoln
Global Life Maximilian Zimmerer 2012 1988
Growth Markets Manuel Bauer 2011 1990
Global, Anglo Clemet B Booth 2006 2006 Munich Re, Aon
Iberia Latam Helga Jung 2012 1993
Asset management Jay Ralph 2012 1997
Douglas Hodge PIMCO CEO 2014 1989 PIMCO COO
Financials
Initiating Coverage
6 August 2014
page 55 of 116 , Equity Analyst, 44 (0) 20 7029 8784, [email protected] Cathcart
Please see important disclosure information on pages 113 - 116 of this report.
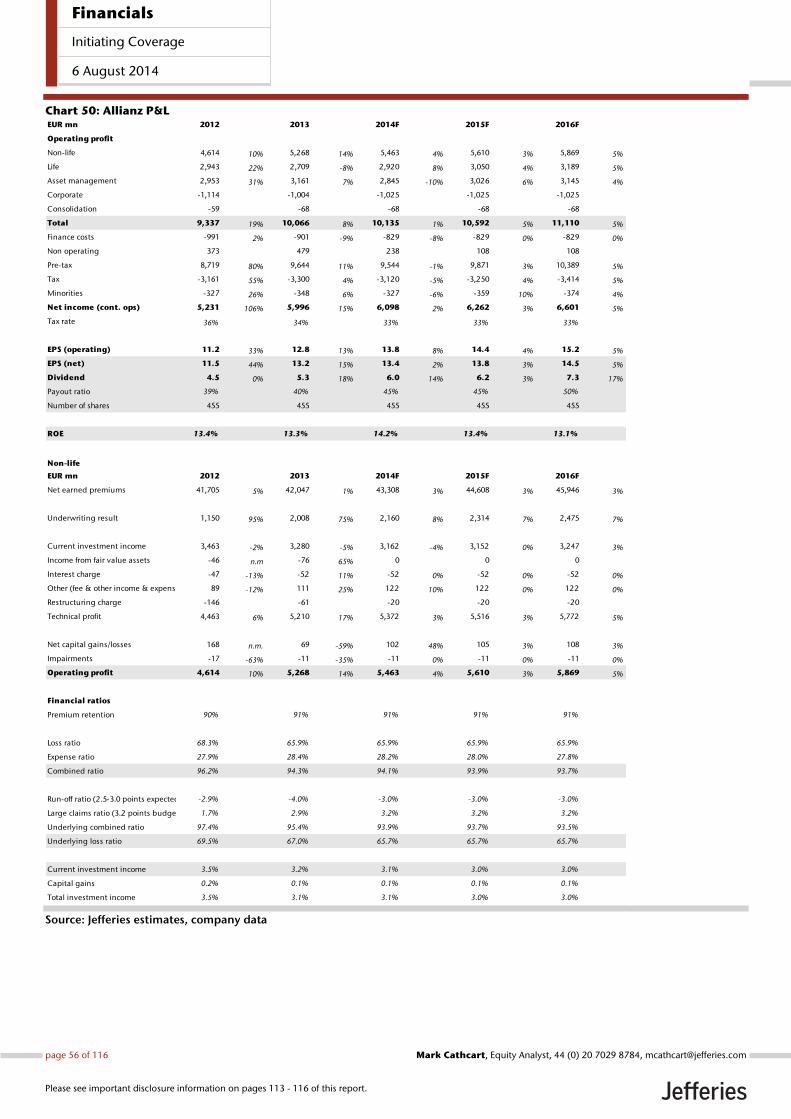
Chart 50: Allianz P&L
Source: Jefferies estimates, company data
EUR mn 2012 2013 2014F 2015F 2016F
Operating profit
Non-life 4,614 10% 5,268 14% 5,463 4% 5,610 3% 5,869 5%
Life 2,943 22% 2,709 -8% 2,920 8% 3,050 4% 3,189 5%
Asset management 2,953 31% 3,161 7% 2,845 -10% 3,026 6% 3,145 4%
Corporate -1,114 -1,004 -1,025 -1,025 -1,025
Consolidation -59 -68 -68 -68 -68
Total 9,337 19% 10,066 8% 10,135 1% 10,592 5% 11,110 5%
Finance costs -991 2% -901 -9% -829 -8% -829 0% -829 0%
Non operating 373 479 238 108 108
Pre-tax 8,719 80% 9,644 11% 9,544 -1% 9,871 3% 10,389 5%
Tax -3,161 55% -3,300 4% -3,120 -5% -3,250 4% -3,414 5%
Minorities -327 26% -348 6% -327 -6% -359 10% -374 4%
Net income (cont. ops) 5,231 106% 5,996 15% 6,098 2% 6,262 3% 6,601 5%
Tax rate 36% 34% 33% 33% 33%
EPS (operating) 11.2 33% 12.8 13% 13.8 8% 14.4 4% 15.2 5%
EPS (net) 11.5 44% 13.2 15% 13.4 2% 13.8 3% 14.5 5%
Dividend 4.5 0% 5.3 18% 6.0 14% 6.2 3% 7.3 17%
Payout ratio 39% 40% 45% 45% 50%
Number of shares 455 455 455 455 455
ROE 13.4% 13.3% 14.2% 13.4% 13.1%
Non-life
EUR mn 2012 2013 2014F 2015F 2016F
Net earned premiums 41,705 5% 42,047 1% 43,308 3% 44,608 3% 45,946 3%
Underwriting result 1,150 95% 2,008 75% 2,160 8% 2,314 7% 2,475 7%
Current investment income 3,463 -2% 3,280 -5% 3,162 -4% 3,152 0% 3,247 3%
Income from fair value assets -46 n.m -76 65% 0 0 0
Interest charge -47 -13% -52 11% -52 0% -52 0% -52 0%
Other (fee & other income & expenses) 89 -12% 111 25% 122 10% 122 0% 122 0%
Restructuring charge -146 -61 -20 -20 -20
Technical profit 4,463 6% 5,210 17% 5,372 3% 5,516 3% 5,772 5%
Net capital gains/losses 168 n.m. 69 -59% 102 48% 105 3% 108 3%
Impairments -17 -63% -11 -35% -11 0% -11 0% -11 0%
Operating profit 4,614 10% 5,268 14% 5,463 4% 5,610 3% 5,869 5%
Financial ratios
Premium retention 90% 91% 91% 91% 91%
Loss ratio 68.3% 65.9% 65.9% 65.9% 65.9%
Expense ratio 27.9% 28.4% 28.2% 28.0% 27.8%
Combined ratio 96.2% 94.3% 94.1% 93.9% 93.7%
Run-off ratio (2.5-3.0 points expected) -2.9% -4.0% -3.0% -3.0% -3.0%
Large claims ratio (3.2 points budget) 1.7% 2.9% 3.2% 3.2% 3.2%
Underlying combined ratio 97.4% 95.4% 93.9% 93.7% 93.5%
Underlying loss ratio 69.5% 67.0% 65.7% 65.7% 65.7%
Current investment income 3.5% 3.2% 3.1% 3.0% 3.0%
Capital gains 0.2% 0.1% 0.1% 0.1% 0.1%
Total investment income 3.5% 3.1% 3.1% 3.0% 3.0%
Financials
Initiating Coverage
6 August 2014
page 56 of 116 , Equity Analyst, 44 (0) 20 7029 8784, [email protected] Cathcart
Please see important disclosure information on pages 113 - 116 of this report.
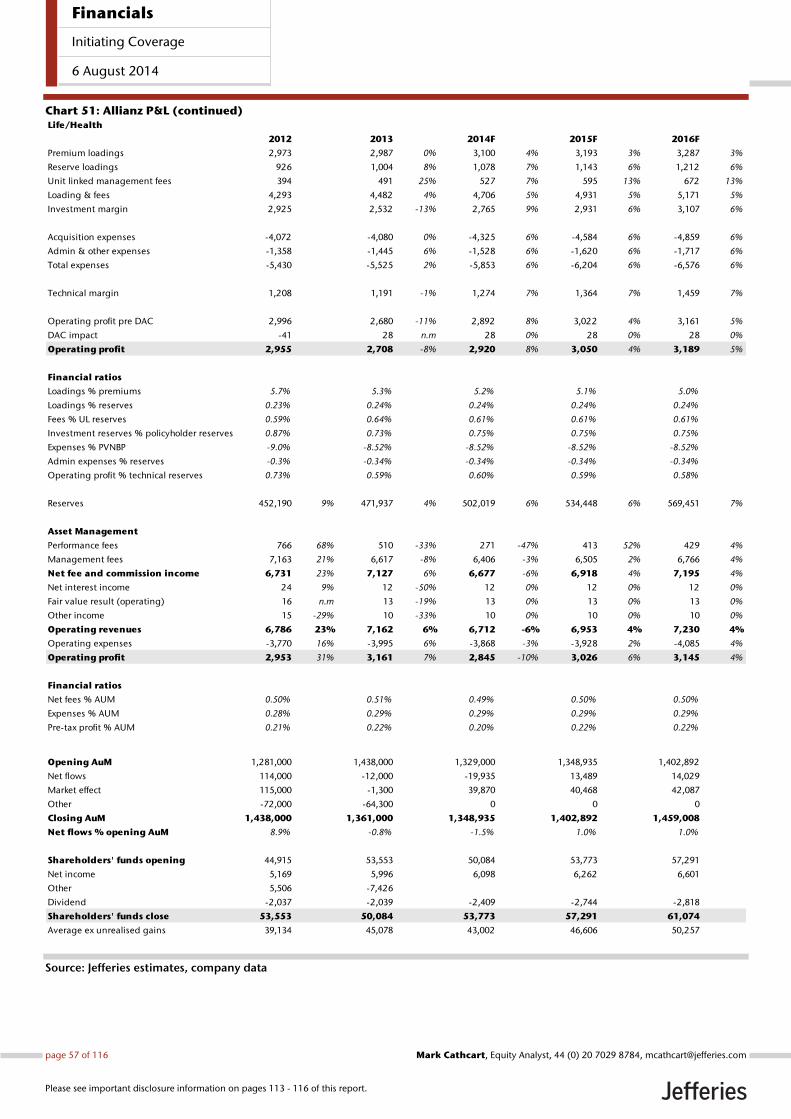
Chart 51: Allianz P&L (continued)
Source: Jefferies estimates, company data
Life/Health
2012 2013 2014F 2015F 2016F
Premium loadings 2,973 2,987 0% 3,100 4% 3,193 3% 3,287 3%
Reserve loadings 926 1,004 8% 1,078 7% 1,143 6% 1,212 6%
Unit linked management fees 394 491 25% 527 7% 595 13% 672 13%
Loading & fees 4,293 4,482 4% 4,706 5% 4,931 5% 5,171 5%
Investment margin 2,925 2,532 -13% 2,765 9% 2,931 6% 3,107 6%
Acquisition expenses -4,072 -4,080 0% -4,325 6% -4,584 6% -4,859 6%
Admin & other expenses -1,358 -1,445 6% -1,528 6% -1,620 6% -1,717 6%
Total expenses -5,430 -5,525 2% -5,853 6% -6,204 6% -6,576 6%
Technical margin 1,208 1,191 -1% 1,274 7% 1,364 7% 1,459 7%
Operating profit pre DAC 2,996 2,680 -11% 2,892 8% 3,022 4% 3,161 5%
DAC impact -41 28 n.m 28 0% 28 0% 28 0%
Operating profit 2,955 2,708 -8% 2,920 8% 3,050 4% 3,189 5%
Financial ratios
Loadings % premiums 5.7% 5.3% 5.2% 5.1% 5.0%
Loadings % reserves 0.23% 0.24% 0.24% 0.24% 0.24%
Fees % UL reserves 0.59% 0.64% 0.61% 0.61% 0.61%
Investment reserves % policyholder reserves 0.87% 0.73% 0.75% 0.75% 0.75%
Expenses % PVNBP -9.0% -8.52% -8.52% -8.52% -8.52%
Admin expenses % reserves -0.3% -0.34% -0.34% -0.34% -0.34%
Operating profit % technical reserves 0.73% 0.59% 0.60% 0.59% 0.58%
Reserves 452,190 9% 471,937 4% 502,019 6% 534,448 6% 569,451 7%
Asset Management
Performance fees 766 68% 510 -33% 271 -47% 413 52% 429 4%
Management fees 7,163 21% 6,617 -8% 6,406 -3% 6,505 2% 6,766 4%
Net fee and commission income 6,731 23% 7,127 6% 6,677 -6% 6,918 4% 7,195 4%
Net interest income 24 9% 12 -50% 12 0% 12 0% 12 0%
Fair value result (operating) 16 n.m 13 -19% 13 0% 13 0% 13 0%
Other income 15 -29% 10 -33% 10 0% 10 0% 10 0%
Operating revenues 6,786 23% 7,162 6% 6,712 -6% 6,953 4% 7,230 4%
Operating expenses -3,770 16% -3,995 6% -3,868 -3% -3,928 2% -4,085 4%
Operating profit 2,953 31% 3,161 7% 2,845 -10% 3,026 6% 3,145 4%
Financial ratios
Net fees % AUM 0.50% 0.51% 0.49% 0.50% 0.50%
Expenses % AUM 0.28% 0.29% 0.29% 0.29% 0.29%
Pre-tax profit % AUM 0.21% 0.22% 0.20% 0.22% 0.22%
Opening AuM 1,281,000 1,438,000 1,329,000 1,348,935 1,402,892
Net flows 114,000 -12,000 -19,935 13,489 14,029
Market effect 115,000 -1,300 39,870 40,468 42,087
Other -72,000 -64,300 0 0 0
Closing AuM 1,438,000 1,361,000 1,348,935 1,402,892 1,459,008
Net flows % opening AuM 8.9% -0.8% -1.5% 1.0% 1.0%
Shareholders' funds opening 44,915 53,553 50,084 53,773 57,291
Net income 5,169 5,996 6,098 6,262 6,601
Other 5,506 -7,426
Dividend -2,037 -2,039 -2,409 -2,744 -2,818
Shareholders' funds close 53,553 50,084 53,773 57,291 61,074
Average ex unrealised gains 39,134 45,078 43,002 46,606 50,257
Financials
Initiating Coverage
6 August 2014
page 57 of 116 , Equity Analyst, 44 (0) 20 7029 8784, [email protected] Cathcart
Please see important disclosure information on pages 113 - 116 of this report.
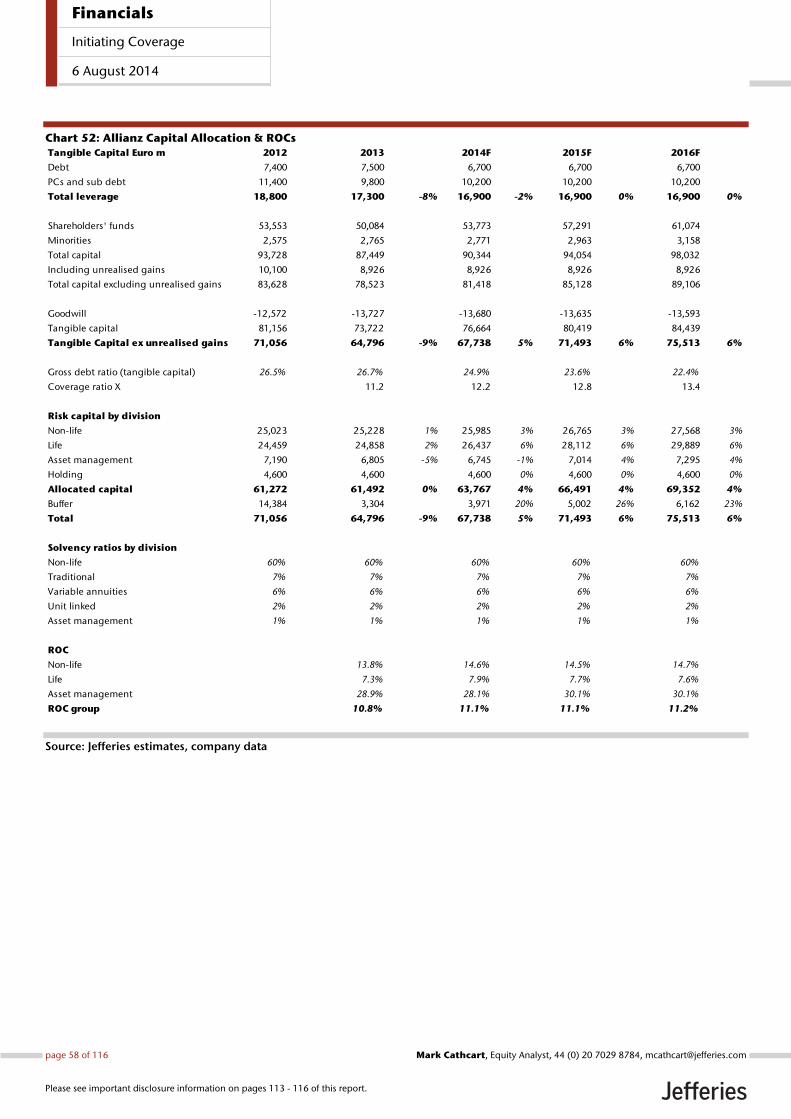
Chart 52: Allianz Capital Allocation & ROCs
Source: Jefferies estimates, company data
Tangible Capital Euro m 2012 2013 2014F 2015F 2016F
Debt 7,400 7,500 6,700 6,700 6,700
PCs and sub debt 11,400 9,800 10,200 10,200 10,200
Total leverage 18,800 17,300 -8% 16,900 -2% 16,900 0% 16,900 0%
Shareholders' funds 53,553 50,084 53,773 57,291 61,074
Minorities 2,575 2,765 2,771 2,963 3,158
Total capital 93,728 87,449 90,344 94,054 98,032
Including unrealised gains 10,100 8,926 8,926 8,926 8,926
Total capital excluding unrealised gains 83,628 78,523 81,418 85,128 89,106
Goodwill -12,572 -13,727 -13,680 -13,635 -13,593
Tangible capital 81,156 73,722 76,664 80,419 84,439
Tangible Capital ex unrealised gains 71,056 64,796 -9% 67,738 5% 71,493 6% 75,513 6%
Gross debt ratio (tangible capital) 26.5% 26.7% 24.9% 23.6% 22.4%
Coverage ratio X 11.2 12.2 12.8 13.4
Risk capital by division
Non-life 25,023 25,228 1% 25,985 3% 26,765 3% 27,568 3%
Life 24,459 24,858 2% 26,437 6% 28,112 6% 29,889 6%
Asset management 7,190 6,805 -5% 6,745 -1% 7,014 4% 7,295 4%
Holding 4,600 4,600 4,600 0% 4,600 0% 4,600 0%
Allocated capital 61,272 61,492 0% 63,767 4% 66,491 4% 69,352 4%
Buffer 14,384 3,304 3,971 20% 5,002 26% 6,162 23%
Total 71,056 64,796 -9% 67,738 5% 71,493 6% 75,513 6%
Solvency ratios by division
Non-life 60% 60% 60% 60% 60%
Traditional 7% 7% 7% 7% 7%
Variable annuities 6% 6% 6% 6% 6%
Unit linked 2% 2% 2% 2% 2%
Asset management 1% 1% 1% 1% 1%
ROC
Non-life 13.8% 14.6% 14.5% 14.7%
Life 7.3% 7.9% 7.7% 7.6%
Asset management 28.9% 28.1% 30.1% 30.1%
ROC group 10.8% 11.1% 11.1% 11.2%
Financials
Initiating Coverage
6 August 2014
page 58 of 116 , Equity Analyst, 44 (0) 20 7029 8784, [email protected] Cathcart
Please see important disclosure information on pages 113 - 116 of this report.
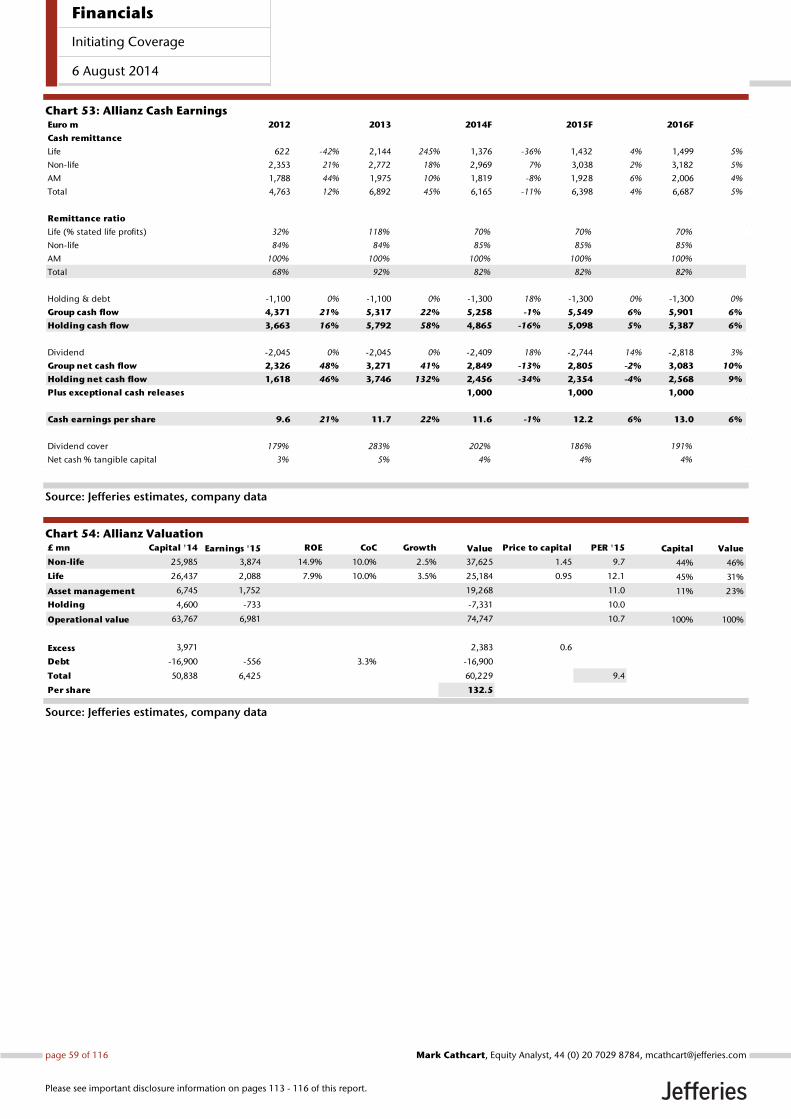
Chart 53: Allianz Cash Earnings
Source: Jefferies estimates, company data
Chart 54: Allianz Valuation
Source: Jefferies estimates, company data
Euro m 2012 2013 2014F 2015F 2016F
Cash remittance
Life 622 -42% 2,144 245% 1,376 -36% 1,432 4% 1,499 5%
Non-life 2,353 21% 2,772 18% 2,969 7% 3,038 2% 3,182 5%
AM 1,788 44% 1,975 10% 1,819 -8% 1,928 6% 2,006 4%
Total 4,763 12% 6,892 45% 6,165 -11% 6,398 4% 6,687 5%
Remittance ratio
Life (% stated life profits) 32% 118% 70% 70% 70%
Non-life 84% 84% 85% 85% 85%
AM 100% 100% 100% 100% 100%
Total 68% 92% 82% 82% 82%
Holding & debt -1,100 0% -1,100 0% -1,300 18% -1,300 0% -1,300 0%
Group cash flow 4,371 21% 5,317 22% 5,258 -1% 5,549 6% 5,901 6%
Holding cash flow 3,663 16% 5,792 58% 4,865 -16% 5,098 5% 5,387 6%
Dividend -2,045 0% -2,045 0% -2,409 18% -2,744 14% -2,818 3%
Group net cash flow 2,326 48% 3,271 41% 2,849 -13% 2,805 -2% 3,083 10%
Holding net cash flow 1,618 46% 3,746 132% 2,456 -34% 2,354 -4% 2,568 9%
Plus exceptional cash releases 1,000 1,000 1,000
Cash earnings per share 9.6 21% 11.7 22% 11.6 -1% 12.2 6% 13.0 6%
Dividend cover 179% 283% 202% 186% 191%
Net cash % tangible capital 3% 5% 4% 4% 4%
£ mn Capital '14 Earnings '15 ROE CoC Growth Value Price to capital PER '15 Capital Value
Non-life 25,985 3,874 14.9% 10.0% 2.5% 37,625 1.45 9.7 44% 46%
Life 26,437 2,088 7.9% 10.0% 3.5% 25,184 0.95 12.1 45% 31%
Asset management 6,745 1,752 19,268 11.0 11% 23%
Holding 4,600 -733 -7,331 10.0
Operational value 63,767 6,981 74,747 10.7 100% 100%
Excess 3,971 2,383 0.6
Debt -16,900 -556 3.3% -16,900
Total 50,838 6,425 60,229 9.4
Per share 132.5
Financials
Initiating Coverage
6 August 2014
page 59 of 116 , Equity Analyst, 44 (0) 20 7029 8784, [email protected] Cathcart
Please see important disclosure information on pages 113 - 116 of this report.
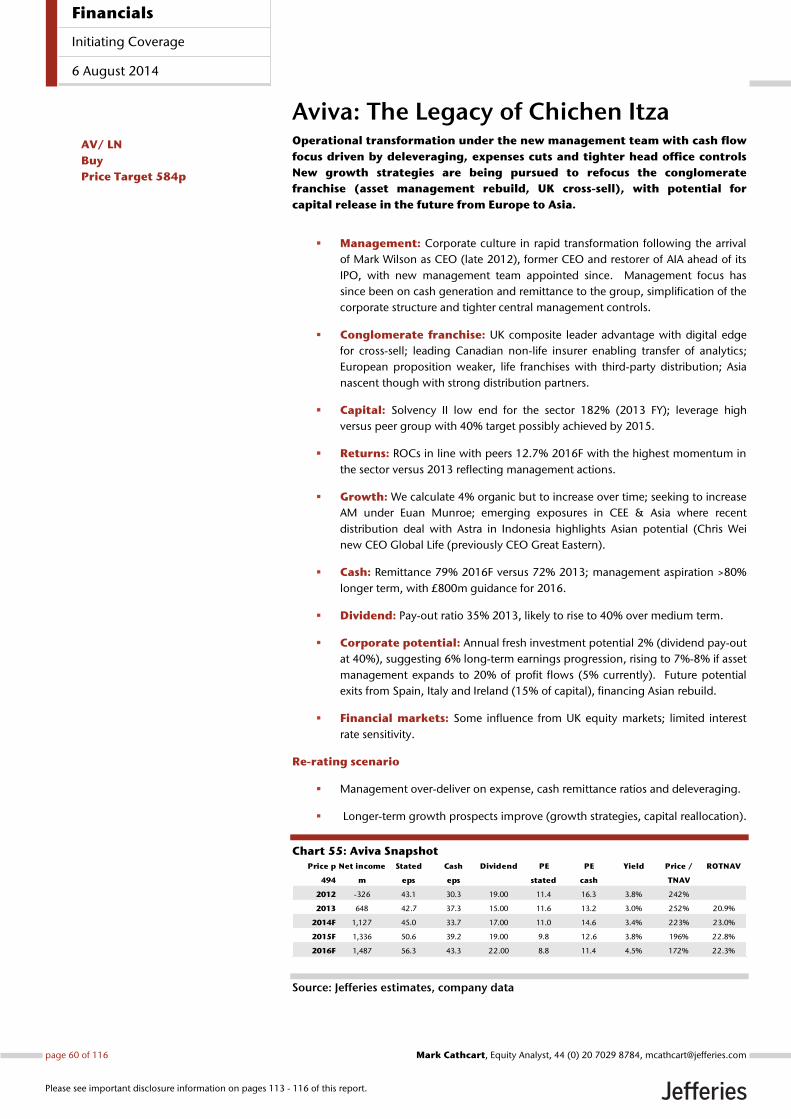
Aviva: The Legacy of Chichen Itza Operational transformation under the new management team with cash flow
focus driven by deleveraging, expenses cuts and tighter head office controls
New growth strategies are being pursued to refocus the conglomerate
franchise (asset management rebuild, UK cross-sell), with potential for
capital release in the future from Europe to Asia.
Management: Corporate culture in rapid transformation following the arrival
of Mark Wilson as CEO (late 2012), former CEO and restorer of AIA ahead of its
IPO, with new management team appointed since. Management focus has
since been on cash generation and remittance to the group, simplification of the
corporate structure and tighter central management controls.
Conglomerate franchise: UK composite leader advantage with digital edge
for cross-sell; leading Canadian non-life insurer enabling transfer of analytics;
European proposition weaker, life franchises with third-party distribution; Asia
nascent though with strong distribution partners.
Capital: Solvency II low end for the sector 182% (2013 FY); leverage high
versus peer group with 40% target possibly achieved by 2015.
Returns: ROCs in line with peers 12.7% 2016F with the highest momentum in
the sector versus 2013 reflecting management actions.
Growth: We calculate 4% organic but to increase over time; seeking to increase
AM under Euan Munroe; emerging exposures in CEE & Asia where recent
distribution deal with Astra in Indonesia highlights Asian potential (Chris Wei
new CEO Global Life (previously CEO Great Eastern).
Cash: Remittance 79% 2016F versus 72% 2013; management aspiration >80%
longer term, with £800m guidance for 2016.
Dividend: Pay-out ratio 35% 2013, likely to rise to 40% over medium term.
Corporate potential: Annual fresh investment potential 2% (dividend pay-out
at 40%), suggesting 6% long-term earnings progression, rising to 7%-8% if asset
management expands to 20% of profit flows (5% currently). Future potential
exits from Spain, Italy and Ireland (15% of capital), financing Asian rebuild.
Financial markets: Some influence from UK equity markets; limited interest
rate sensitivity.
Re-rating scenario
Management over-deliver on expense, cash remittance ratios and deleveraging.
Longer-term growth prospects improve (growth strategies, capital reallocation).
Chart 55: Aviva Snapshot
Source: Jefferies estimates, company data
Price p Net income Stated Cash Dividend PE PE Yield Price / ROTNAV
494 m eps eps stated cash TNAV
2012 -326 43.1 30.3 19.00 11.4 16.3 3.8% 242%
2013 648 42.7 37.3 15.00 11.6 13.2 3.0% 252% 20.9%
2014F 1,127 45.0 33.7 17.00 11.0 14.6 3.4% 223% 23.0%
2015F 1,336 50.6 39.2 19.00 9.8 12.6 3.8% 196% 22.8%
2016F 1,487 56.3 43.3 22.00 8.8 11.4 4.5% 172% 22.3%
AV/ LN
Buy
Price Target 584p
Financials
Initiating Coverage
6 August 2014
page 60 of 116 , Equity Analyst, 44 (0) 20 7029 8784, [email protected] Cathcart
Please see important disclosure information on pages 113 - 116 of this report.
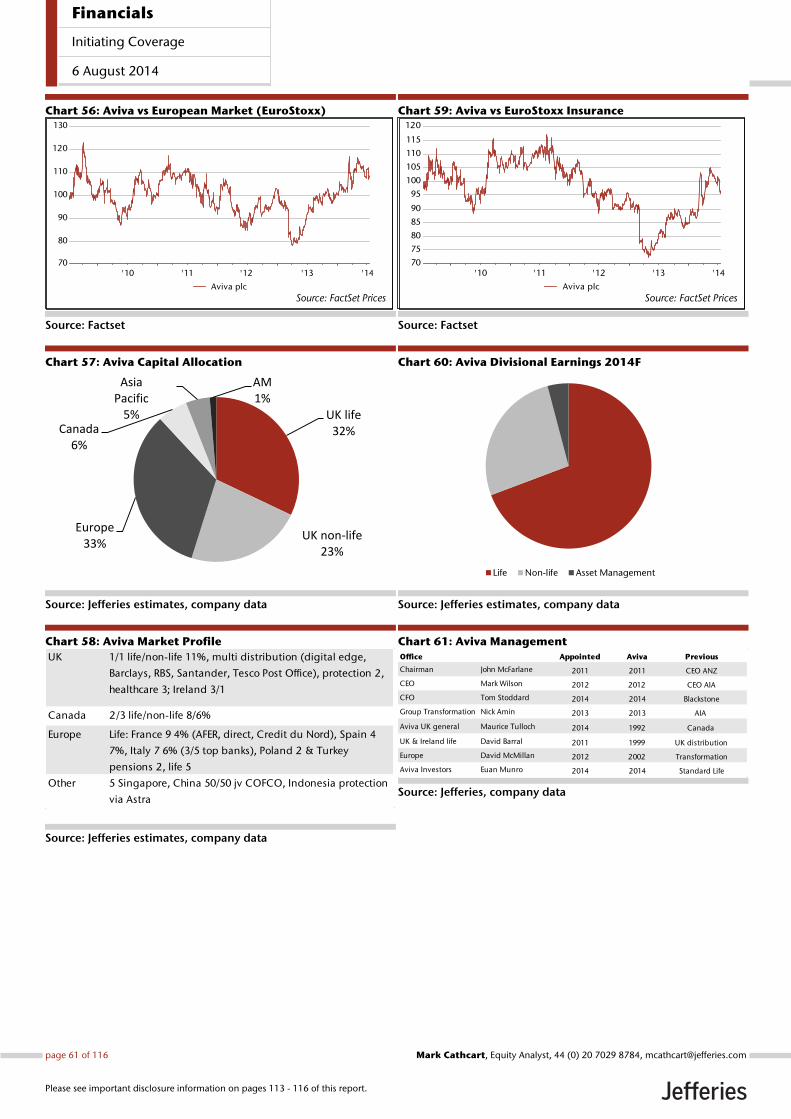
Chart 56: Aviva vs European Market (EuroStoxx)
Source: Factset
Chart 57: Aviva Capital Allocation
Source: Jefferies estimates, company data
Chart 58: Aviva Market Profile
Source: Jefferies estimates, company data
Chart 59: Aviva vs EuroStoxx Insurance
Source: Factset
Chart 60: Aviva Divisional Earnings 2014F
Source: Jefferies estimates, company data
Chart 61: Aviva Management
Source: Jefferies, company data
'10 '11 '12 '13 '1470
80
90
100
110
120
130
Source: FactSet PricesAviva plc
UK life32%
UK non-life23%
Europe33%
Canada6%
Asia Pacific
5%
AM1%
UK 1/1 life/non-life 11%, multi distribution (digital edge,
Barclays, RBS, Santander, Tesco Post Office), protection 2,
healthcare 3; Ireland 3/1
Canada 2/3 life/non-life 8/6%
Europe Life: France 9 4% (AFER, direct, Credit du Nord), Spain 4
7%, Italy 7 6% (3/5 top banks), Poland 2 & Turkey
pensions 2, life 5
Other 5 Singapore, China 50/50 jv COFCO, Indonesia protection
via Astra
'10 '11 '12 '13 '1470
75
80
85
90
95
100
105
110
115
120
Source: FactSet PricesAviva plc
Life Non-life Asset Management
Office Appointed Aviva Previous
Chairman John McFarlane 2011 2011 CEO ANZ
CEO Mark Wilson 2012 2012 CEO AIA
CFO Tom Stoddard 2014 2014 Blackstone
Group Transformation Nick Amin 2013 2013 AIA
Aviva UK general Maurice Tulloch 2014 1992 Canada
UK & Ireland life David Barral 2011 1999 UK distribution
Europe David McMillan 2012 2002 Transformation
Aviva Investors Euan Munro 2014 2014 Standard Life
Financials
Initiating Coverage
6 August 2014
page 61 of 116 , Equity Analyst, 44 (0) 20 7029 8784, [email protected] Cathcart
Please see important disclosure information on pages 113 - 116 of this report.
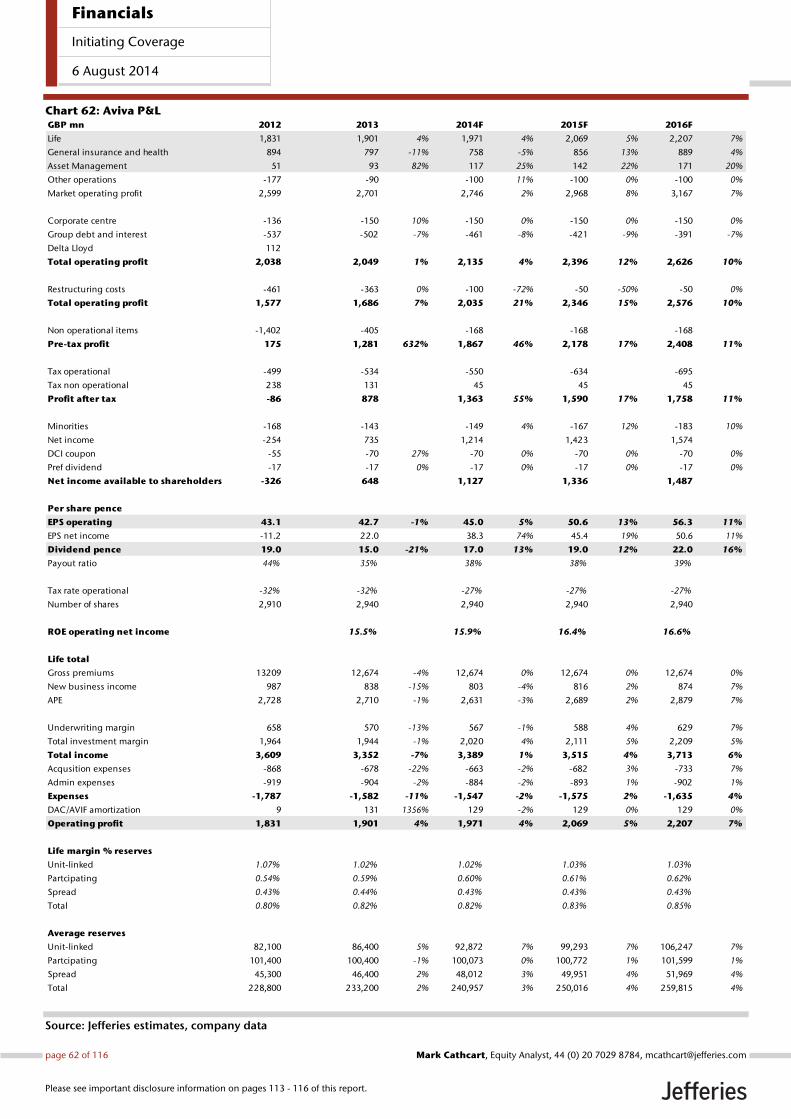
Chart 62: Aviva P&L
Source: Jefferies estimates, company data
GBP mn 2012 2013 2014F 2015F 2016F
Life 1,831 1,901 4% 1,971 4% 2,069 5% 2,207 7%
General insurance and health 894 797 -11% 758 -5% 856 13% 889 4%
Asset Management 51 93 82% 117 25% 142 22% 171 20%
Other operations -177 -90 -100 11% -100 0% -100 0%
Market operating profit 2,599 2,701 2,746 2% 2,968 8% 3,167 7%
Corporate centre -136 -150 10% -150 0% -150 0% -150 0%
Group debt and interest -537 -502 -7% -461 -8% -421 -9% -391 -7%
Delta Lloyd 112
Total operating profit 2,038 2,049 1% 2,135 4% 2,396 12% 2,626 10%
Restructuring costs -461 -363 0% -100 -72% -50 -50% -50 0%
Total operating profit 1,577 1,686 7% 2,035 21% 2,346 15% 2,576 10%
Non operational items -1,402 -405 -168 -168 -168
Pre-tax profit 175 1,281 632% 1,867 46% 2,178 17% 2,408 11%
Tax operational -499 -534 -550 -634 -695
Tax non operational 238 131 45 45 45
Profit after tax -86 878 1,363 55% 1,590 17% 1,758 11%
Minorities -168 -143 -149 4% -167 12% -183 10%
Net income -254 735 1,214 1,423 1,574
DCI coupon -55 -70 27% -70 0% -70 0% -70 0%
Pref dividend -17 -17 0% -17 0% -17 0% -17 0%
Net income available to shareholders -326 648 1,127 1,336 1,487
Per share pence
EPS operating 43.1 42.7 -1% 45.0 5% 50.6 13% 56.3 11%
EPS net income -11.2 22.0 38.3 74% 45.4 19% 50.6 11%
Dividend pence 19.0 15.0 -21% 17.0 13% 19.0 12% 22.0 16%
Payout ratio 44% 35% 38% 38% 39%
Tax rate operational -32% -32% -27% -27% -27%
Number of shares 2,910 2,940 2,940 2,940 2,940
ROE operating net income 15.5% 15.9% 16.4% 16.6%
Life total
Gross premiums 13209 12,674 -4% 12,674 0% 12,674 0% 12,674 0%
New business income 987 838 -15% 803 -4% 816 2% 874 7%
APE 2,728 2,710 -1% 2,631 -3% 2,689 2% 2,879 7%
Underwriting margin 658 570 -13% 567 -1% 588 4% 629 7%
Total investment margin 1,964 1,944 -1% 2,020 4% 2,111 5% 2,209 5%
Total income 3,609 3,352 -7% 3,389 1% 3,515 4% 3,713 6%
Acqusition expenses -868 -678 -22% -663 -2% -682 3% -733 7%
Admin expenses -919 -904 -2% -884 -2% -893 1% -902 1%
Expenses -1,787 -1,582 -11% -1,547 -2% -1,575 2% -1,635 4%
DAC/AVIF amortization 9 131 1356% 129 -2% 129 0% 129 0%
Operating profit 1,831 1,901 4% 1,971 4% 2,069 5% 2,207 7%
Life margin % reserves
Unit-linked 1.07% 1.02% 1.02% 1.03% 1.03%
Partcipating 0.54% 0.59% 0.60% 0.61% 0.62%
Spread 0.43% 0.44% 0.43% 0.43% 0.43%
Total 0.80% 0.82% 0.82% 0.83% 0.85%
Average reserves
Unit-linked 82,100 86,400 5% 92,872 7% 99,293 7% 106,247 7%
Partcipating 101,400 100,400 -1% 100,073 0% 100,772 1% 101,599 1%
Spread 45,300 46,400 2% 48,012 3% 49,951 4% 51,969 4%
Total 228,800 233,200 2% 240,957 3% 250,016 4% 259,815 4%
Financials
Initiating Coverage
6 August 2014
page 62 of 116 , Equity Analyst, 44 (0) 20 7029 8784, [email protected] Cathcart
Please see important disclosure information on pages 113 - 116 of this report.
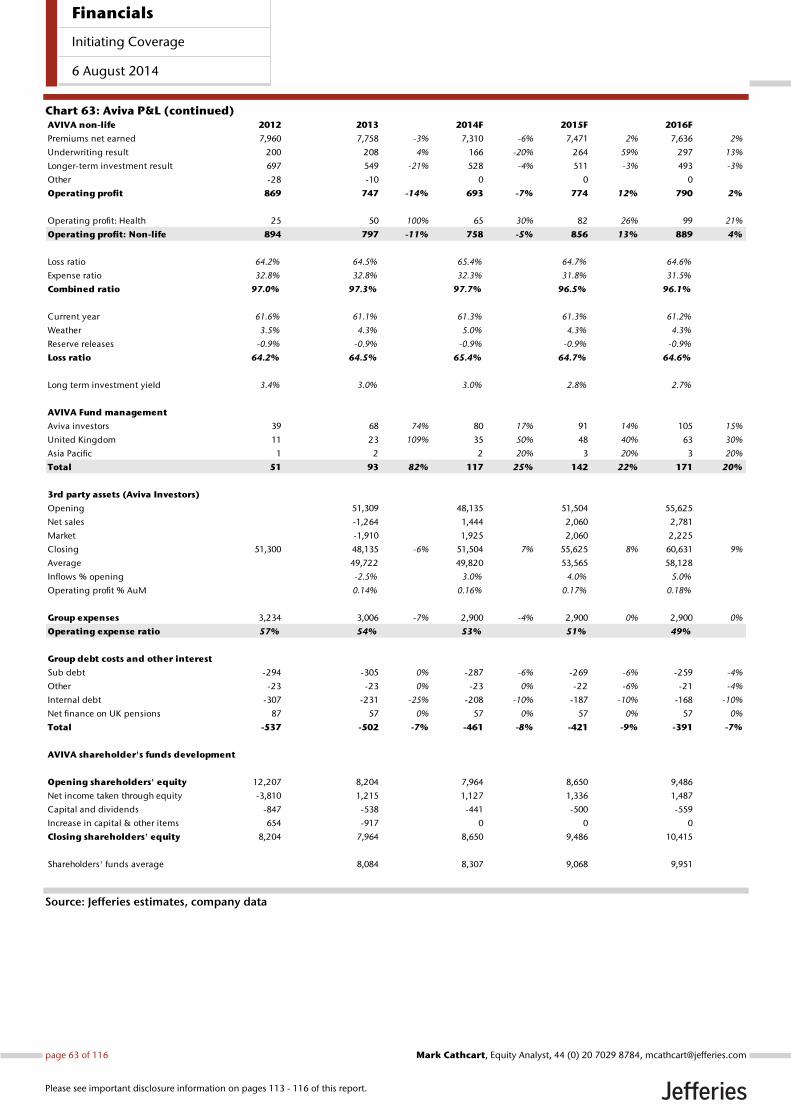
Chart 63: Aviva P&L (continued)
Source: Jefferies estimates, company data
AVIVA non-life 2012 2013 2014F 2015F 2016F
Premiums net earned 7,960 7,758 -3% 7,310 -6% 7,471 2% 7,636 2%
Underwriting result 200 208 4% 166 -20% 264 59% 297 13%
Longer-term investment result 697 549 -21% 528 -4% 511 -3% 493 -3%
Other -28 -10 0 0 0
Operating profit 869 747 -14% 693 -7% 774 12% 790 2%
Operating profit: Health 25 50 100% 65 30% 82 26% 99 21%
Operating profit: Non-life 894 797 -11% 758 -5% 856 13% 889 4%
Loss ratio 64.2% 64.5% 65.4% 64.7% 64.6%
Expense ratio 32.8% 32.8% 32.3% 31.8% 31.5%
Combined ratio 97.0% 97.3% 97.7% 96.5% 96.1%
Current year 61.6% 61.1% 61.3% 61.3% 61.2%
Weather 3.5% 4.3% 5.0% 4.3% 4.3%
Reserve releases -0.9% -0.9% -0.9% -0.9% -0.9%
Loss ratio 64.2% 64.5% 65.4% 64.7% 64.6%
Long term investment yield 3.4% 3.0% 3.0% 2.8% 2.7%
AVIVA Fund management
Aviva investors 39 68 74% 80 17% 91 14% 105 15%
United Kingdom 11 23 109% 35 50% 48 40% 63 30%
Asia Pacific 1 2 2 20% 3 20% 3 20%
Total 51 93 82% 117 25% 142 22% 171 20%
3rd party assets (Aviva Investors)
Opening 51,309 48,135 51,504 55,625
Net sales -1,264 1,444 2,060 2,781
Market -1,910 1,925 2,060 2,225
Closing 51,300 48,135 -6% 51,504 7% 55,625 8% 60,631 9%
Average 49,722 49,820 53,565 58,128
Inflows % opening -2.5% 3.0% 4.0% 5.0%
Operating profit % AuM 0.14% 0.16% 0.17% 0.18%
Group expenses 3,234 3,006 -7% 2,900 -4% 2,900 0% 2,900 0%
Operating expense ratio 57% 54% 53% 51% 49%
Group debt costs and other interest
Sub debt -294 -305 0% -287 -6% -269 -6% -259 -4%
Other -23 -23 0% -23 0% -22 -6% -21 -4%
Internal debt -307 -231 -25% -208 -10% -187 -10% -168 -10%
Net finance on UK pensions 87 57 0% 57 0% 57 0% 57 0%
Total -537 -502 -7% -461 -8% -421 -9% -391 -7%
AVIVA shareholder's funds development
Opening shareholders' equity 12,207 8,204 7,964 8,650 9,486
Net income taken through equity -3,810 1,215 1,127 1,336 1,487
Capital and dividends -847 -538 -441 -500 -559
Increase in capital & other items 654 -917 0 0 0
Closing shareholders' equity 8,204 7,964 8,650 9,486 10,415
Shareholders' funds average 8,084 8,307 9,068 9,951
Financials
Initiating Coverage
6 August 2014
page 63 of 116 , Equity Analyst, 44 (0) 20 7029 8784, [email protected] Cathcart
Please see important disclosure information on pages 113 - 116 of this report.
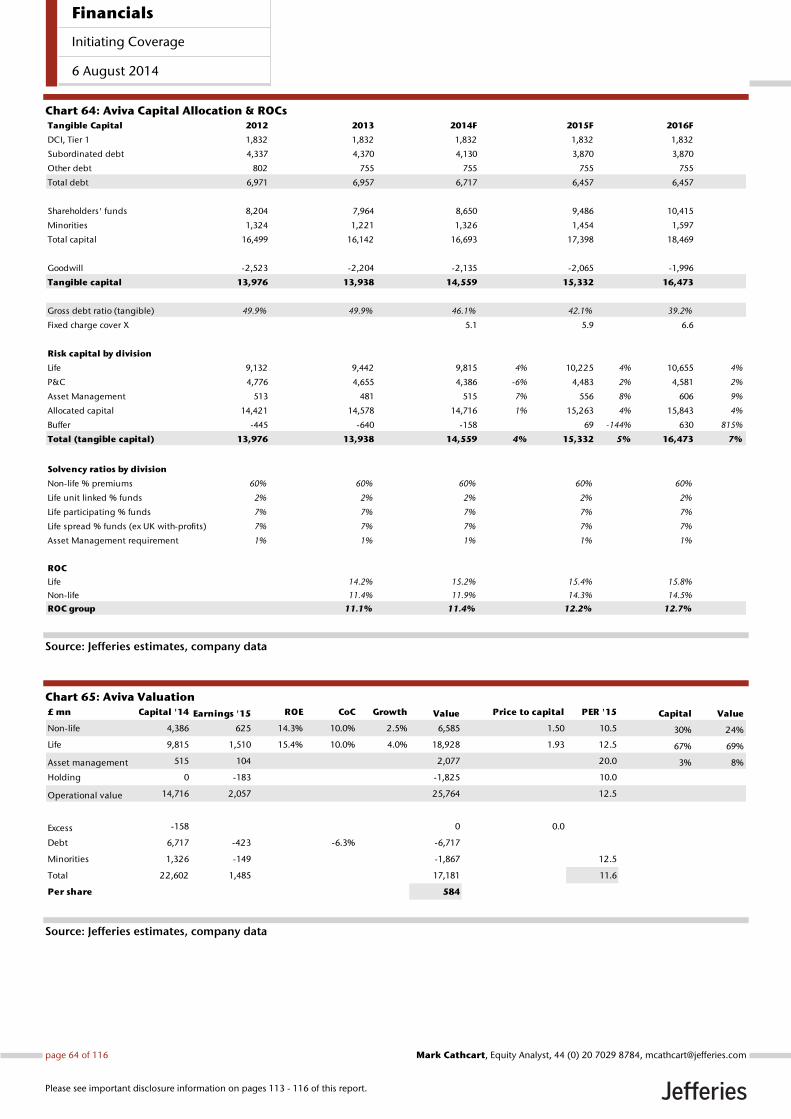
Chart 64: Aviva Capital Allocation & ROCs
Source: Jefferies estimates, company data
Chart 65: Aviva Valuation
Source: Jefferies estimates, company data
Tangible Capital 2012 2013 2014F 2015F 2016F
DCI, Tier 1 1,832 1,832 1,832 1,832 1,832
Subordinated debt 4,337 4,370 4,130 3,870 3,870
Other debt 802 755 755 755 755
Total debt 6,971 6,957 6,717 6,457 6,457
Shareholders' funds 8,204 7,964 8,650 9,486 10,415
Minorities 1,324 1,221 1,326 1,454 1,597
Total capital 16,499 16,142 16,693 17,398 18,469
Goodwill -2,523 -2,204 -2,135 -2,065 -1,996
Tangible capital 13,976 13,938 14,559 15,332 16,473
Gross debt ratio (tangible) 49.9% 49.9% 46.1% 42.1% 39.2%
Fixed charge cover X 5.1 5.9 6.6
Risk capital by division
Life 9,132 9,442 9,815 4% 10,225 4% 10,655 4%
P&C 4,776 4,655 4,386 -6% 4,483 2% 4,581 2%
Asset Management 513 481 515 7% 556 8% 606 9%
Allocated capital 14,421 14,578 14,716 1% 15,263 4% 15,843 4%
Buffer -445 -640 -158 69 -144% 630 815%
Total (tangible capital) 13,976 13,938 14,559 4% 15,332 5% 16,473 7%
Solvency ratios by division
Non-life % premiums 60% 60% 60% 60% 60%
Life unit linked % funds 2% 2% 2% 2% 2%
Life participating % funds 7% 7% 7% 7% 7%
Life spread % funds (ex UK with-profits) 7% 7% 7% 7% 7%
Asset Management requirement 1% 1% 1% 1% 1%
ROC
Life 14.2% 15.2% 15.4% 15.8%
Non-life 11.4% 11.9% 14.3% 14.5%
ROC group 11.1% 11.4% 12.2% 12.7%
£ mn Capital '14 Earnings '15 ROE CoC Growth Value Price to capital PER '15 Capital Value
Non-life 4,386 625 14.3% 10.0% 2.5% 6,585 1.50 10.5 30% 24%
Life 9,815 1,510 15.4% 10.0% 4.0% 18,928 1.93 12.5 67% 69%
Asset management 515 104 2,077 20.0 3% 8%
Holding 0 -183 -1,825 10.0
Operational value 14,716 2,057 25,764 12.5
Excess -158 0 0.0
Debt 6,717 -423 -6.3% -6,717
Minorities 1,326 -149 -1,867 12.5
Total 22,602 1,485 17,181 11.6
Per share 584
Financials
Initiating Coverage
6 August 2014
page 64 of 116 , Equity Analyst, 44 (0) 20 7029 8784, [email protected] Cathcart
Please see important disclosure information on pages 113 - 116 of this report.
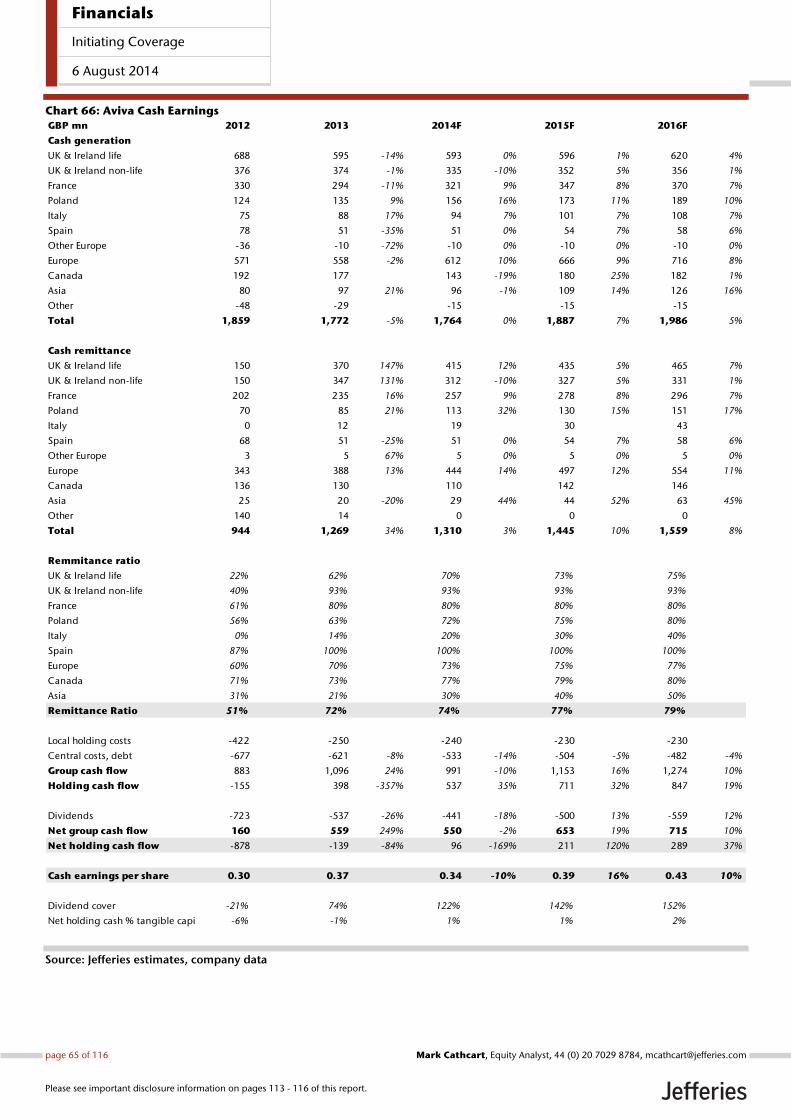
Chart 66: Aviva Cash Earnings
Source: Jefferies estimates, company data
GBP mn 2012 2013 2014F 2015F 2016F
Cash generation
UK & Ireland life 688 595 -14% 593 0% 596 1% 620 4%
UK & Ireland non-life 376 374 -1% 335 -10% 352 5% 356 1%
France 330 294 -11% 321 9% 347 8% 370 7%
Poland 124 135 9% 156 16% 173 11% 189 10%
Italy 75 88 17% 94 7% 101 7% 108 7%
Spain 78 51 -35% 51 0% 54 7% 58 6%
Other Europe -36 -10 -72% -10 0% -10 0% -10 0%
Europe 571 558 -2% 612 10% 666 9% 716 8%
Canada 192 177 143 -19% 180 25% 182 1%
Asia 80 97 21% 96 -1% 109 14% 126 16%
Other -48 -29 -15 -15 -15
Total 1,859 1,772 -5% 1,764 0% 1,887 7% 1,986 5%
Cash remittance
UK & Ireland life 150 370 147% 415 12% 435 5% 465 7%
UK & Ireland non-life 150 347 131% 312 -10% 327 5% 331 1%
France 202 235 16% 257 9% 278 8% 296 7%
Poland 70 85 21% 113 32% 130 15% 151 17%
Italy 0 12 19 30 43
Spain 68 51 -25% 51 0% 54 7% 58 6%
Other Europe 3 5 67% 5 0% 5 0% 5 0%
Europe 343 388 13% 444 14% 497 12% 554 11%
Canada 136 130 110 142 146
Asia 25 20 -20% 29 44% 44 52% 63 45%
Other 140 14 0 0 0
Total 944 1,269 34% 1,310 3% 1,445 10% 1,559 8%
Remmitance ratio
UK & Ireland life 22% 62% 70% 73% 75%
UK & Ireland non-life 40% 93% 93% 93% 93%
France 61% 80% 80% 80% 80%
Poland 56% 63% 72% 75% 80%
Italy 0% 14% 20% 30% 40%
Spain 87% 100% 100% 100% 100%
Europe 60% 70% 73% 75% 77%
Canada 71% 73% 77% 79% 80%
Asia 31% 21% 30% 40% 50%
Remittance Ratio 51% 72% 74% 77% 79%
Local holding costs -422 -250 -240 -230 -230
Central costs, debt -677 -621 -8% -533 -14% -504 -5% -482 -4%
Group cash flow 883 1,096 24% 991 -10% 1,153 16% 1,274 10%
Holding cash flow -155 398 -357% 537 35% 711 32% 847 19%
Dividends -723 -537 -26% -441 -18% -500 13% -559 12%
Net group cash flow 160 559 249% 550 -2% 653 19% 715 10%
Net holding cash flow -878 -139 -84% 96 -169% 211 120% 289 37%
Cash earnings per share 0.30 0.37 0.34 -10% 0.39 16% 0.43 10%
Dividend cover -21% 74% 122% 142% 152%
Net holding cash % tangible capital -6% -1% 1% 1% 2%
Financials
Initiating Coverage
6 August 2014
page 65 of 116 , Equity Analyst, 44 (0) 20 7029 8784, [email protected] Cathcart
Please see important disclosure information on pages 113 - 116 of this report.
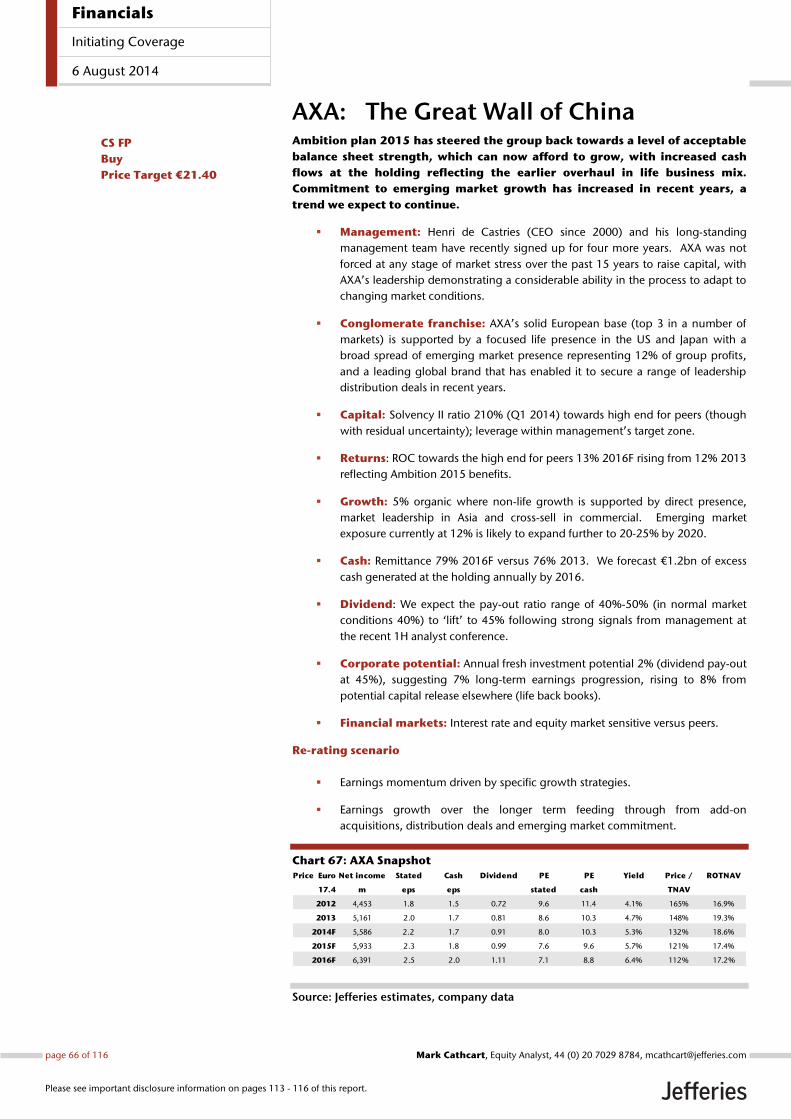
AXA: The Great Wall of China Ambition plan 2015 has steered the group back towards a level of acceptable
balance sheet strength, which can now afford to grow, with increased cash
flows at the holding reflecting the earlier overhaul in life business mix.
Commitment to emerging market growth has increased in recent years, a
trend we expect to continue.
Management: Henri de Castries (CEO since 2000) and his long-standing
management team have recently signed up for four more years. AXA was not
forced at any stage of market stress over the past 15 years to raise capital, with
AXA’s leadership demonstrating a considerable ability in the process to adapt to
changing market conditions.
Conglomerate franchise: AXA’s solid European base (top 3 in a number of
markets) is supported by a focused life presence in the US and Japan with a
broad spread of emerging market presence representing 12% of group profits,
and a leading global brand that has enabled it to secure a range of leadership
distribution deals in recent years.
Capital: Solvency II ratio 210% (Q1 2014) towards high end for peers (though
with residual uncertainty); leverage within management’s target zone.
Returns: ROC towards the high end for peers 13% 2016F rising from 12% 2013
reflecting Ambition 2015 benefits.
Growth: 5% organic where non-life growth is supported by direct presence,
market leadership in Asia and cross-sell in commercial. Emerging market
exposure currently at 12% is likely to expand further to 20-25% by 2020.
Cash: Remittance 79% 2016F versus 76% 2013. We forecast €1.2bn of excess
cash generated at the holding annually by 2016.
Dividend: We expect the pay-out ratio range of 40%-50% (in normal market
conditions 40%) to ‘lift’ to 45% following strong signals from management at
the recent 1H analyst conference.
Corporate potential: Annual fresh investment potential 2% (dividend pay-out
at 45%), suggesting 7% long-term earnings progression, rising to 8% from
potential capital release elsewhere (life back books).
Financial markets: Interest rate and equity market sensitive versus peers.
Re-rating scenario
Earnings momentum driven by specific growth strategies.
Earnings growth over the longer term feeding through from add-on
acquisitions, distribution deals and emerging market commitment.
Chart 67: AXA Snapshot
Source: Jefferies estimates, company data
Price Euro Net income Stated Cash Dividend PE PE Yield Price / ROTNAV
17.4 m eps eps stated cash TNAV
2012 4,453 1.8 1.5 0.72 9.6 11.4 4.1% 165% 16.9%
2013 5,161 2.0 1.7 0.81 8.6 10.3 4.7% 148% 19.3%
2014F 5,586 2.2 1.7 0.91 8.0 10.3 5.3% 132% 18.6%
2015F 5,933 2.3 1.8 0.99 7.6 9.6 5.7% 121% 17.4%
2016F 6,391 2.5 2.0 1.11 7.1 8.8 6.4% 112% 17.2%
CS FP
Buy
Price Target €21.40
Financials
Initiating Coverage
6 August 2014
page 66 of 116 , Equity Analyst, 44 (0) 20 7029 8784, [email protected] Cathcart
Please see important disclosure information on pages 113 - 116 of this report.
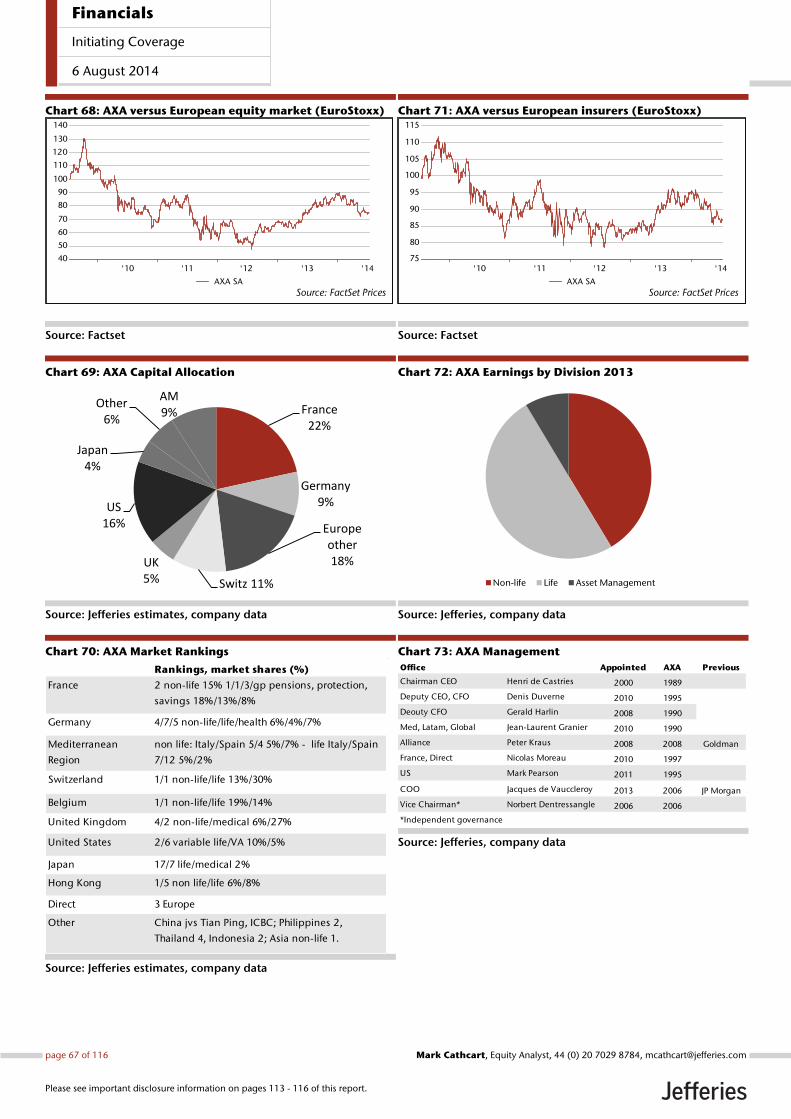
Chart 68: AXA versus European equity market (EuroStoxx)
Source: Factset
Chart 69: AXA Capital Allocation
Source: Jefferies estimates, company data
Chart 70: AXA Market Rankings
Source: Jefferies estimates, company data
Chart 71: AXA versus European insurers (EuroStoxx)
Source: Factset
Chart 72: AXA Earnings by Division 2013
Source: Jefferies, company data
Chart 73: AXA Management
Source: Jefferies, company data
'10 '11 '12 '13 '1440
50
60
70
80
90
100
110
120
130
140
Source: FactSet PricesAXA SA
France22%
Germany9%
Europe other18%
Switz 11%
UK5%
US16%
Japan4%
Other6%
AM9%
Rankings, market shares (%)
France 2 non-life 15% 1/1/3/gp pensions, protection,
savings 18%/13%/8%
Germany 4/7/5 non-life/life/health 6%/4%/7%
Mediterranean
Region
non life: Italy/Spain 5/4 5%/7% - life Italy/Spain
7/12 5%/2%
Switzerland 1/1 non-life/life 13%/30%
Belgium 1/1 non-life/life 19%/14%
United Kingdom 4/2 non-life/medical 6%/27%
United States 2/6 variable life/VA 10%/5%
Japan 17/7 life/medical 2%
Hong Kong 1/5 non life/life 6%/8%
Direct 3 Europe
Other China jvs Tian Ping, ICBC; Philippines 2,
Thailand 4, Indonesia 2; Asia non-life 1.
'10 '11 '12 '13 '1475
80
85
90
95
100
105
110
115
Source: FactSet PricesAXA SA
Non-life Life Asset Management
Office Appointed AXA Previous
Chairman CEO Henri de Castries 2000 1989
Deputy CEO, CFO Denis Duverne 2010 1995
Deouty CFO Gerald Harlin 2008 1990
Med, Latam, Global Jean-Laurent Granier 2010 1990
Alliance Peter Kraus 2008 2008 Goldman
France, Direct Nicolas Moreau 2010 1997
US Mark Pearson 2011 1995
COO Jacques de Vauccleroy 2013 2006 JP Morgan
Vice Chairman* Norbert Dentressangle 2006 2006
*Independent governance
Financials
Initiating Coverage
6 August 2014
page 67 of 116 , Equity Analyst, 44 (0) 20 7029 8784, [email protected] Cathcart
Please see important disclosure information on pages 113 - 116 of this report.
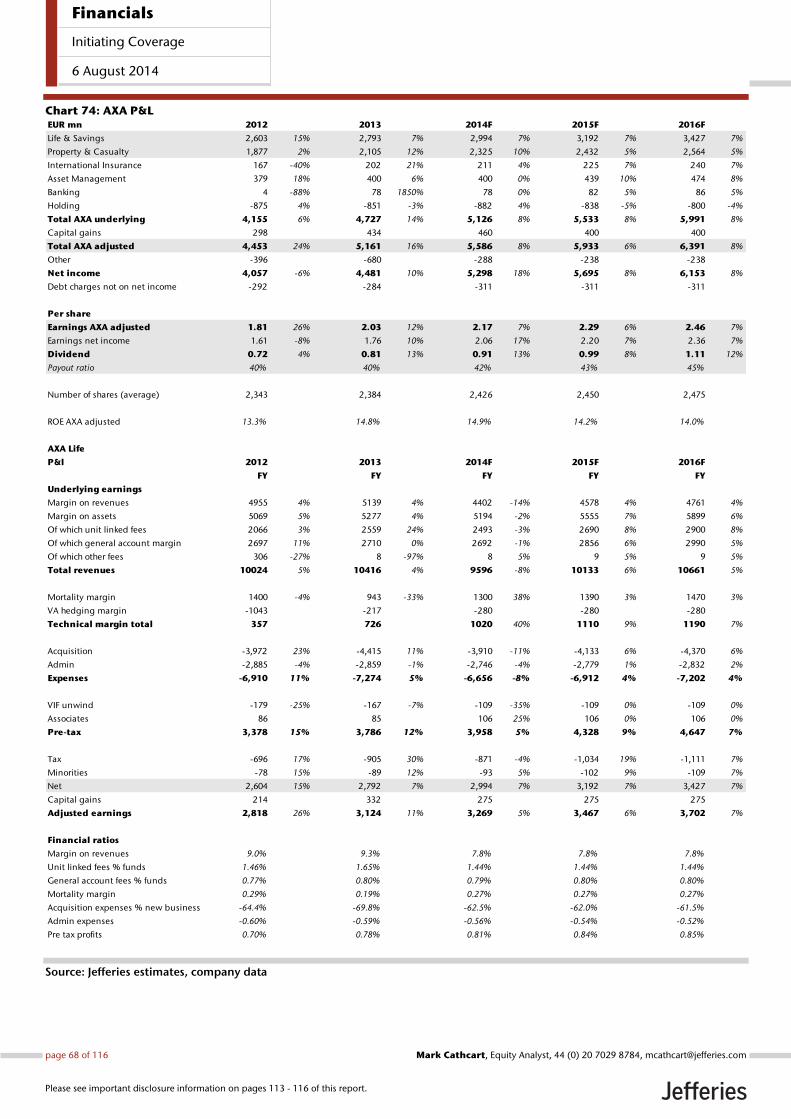
Chart 74: AXA P&L
Source: Jefferies estimates, company data
EUR mn 2012 2013 2014F 2015F 2016F
Life & Savings 2,603 15% 2,793 7% 2,994 7% 3,192 7% 3,427 7%
Property & Casualty 1,877 2% 2,105 12% 2,325 10% 2,432 5% 2,564 5%
International Insurance 167 -40% 202 21% 211 4% 225 7% 240 7%
Asset Management 379 18% 400 6% 400 0% 439 10% 474 8%
Banking 4 -88% 78 1850% 78 0% 82 5% 86 5%
Holding -875 4% -851 -3% -882 4% -838 -5% -800 -4%
Total AXA underlying 4,155 6% 4,727 14% 5,126 8% 5,533 8% 5,991 8%
Capital gains 298 434 460 400 400
Total AXA adjusted 4,453 24% 5,161 16% 5,586 8% 5,933 6% 6,391 8%
Other -396 -680 -288 -238 -238
Net income 4,057 -6% 4,481 10% 5,298 18% 5,695 8% 6,153 8%
Debt charges not on net income -292 -284 -311 -311 -311
Per share
Earnings AXA adjusted 1.81 26% 2.03 12% 2.17 7% 2.29 6% 2.46 7%
Earnings net income 1.61 -8% 1.76 10% 2.06 17% 2.20 7% 2.36 7%
Dividend 0.72 4% 0.81 13% 0.91 13% 0.99 8% 1.11 12%
Payout ratio 40% 40% 42% 43% 45%
Number of shares (average) 2,343 2,384 2,426 2,450 2,475
ROE AXA adjusted 13.3% 14.8% 14.9% 14.2% 14.0%
AXA Life
P&l 2012 2013 2014F 2015F 2016F
FY FY FY FY FY
Underlying earnings
Margin on revenues 4955 4% 5139 4% 4402 -14% 4578 4% 4761 4%
Margin on assets 5069 5% 5277 4% 5194 -2% 5555 7% 5899 6%
Of which unit linked fees 2066 3% 2559 24% 2493 -3% 2690 8% 2900 8%
Of which general account margin 2697 11% 2710 0% 2692 -1% 2856 6% 2990 5%
Of which other fees 306 -27% 8 -97% 8 5% 9 5% 9 5%
Total revenues 10024 5% 10416 4% 9596 -8% 10133 6% 10661 5%
Mortality margin 1400 -4% 943 -33% 1300 38% 1390 3% 1470 3%
VA hedging margin -1043 -217 -280 -280 -280
Technical margin total 357 726 1020 40% 1110 9% 1190 7%
Acquisition -3,972 23% -4,415 11% -3,910 -11% -4,133 6% -4,370 6%
Admin -2,885 -4% -2,859 -1% -2,746 -4% -2,779 1% -2,832 2%
Expenses -6,910 11% -7,274 5% -6,656 -8% -6,912 4% -7,202 4%
VIF unwind -179 -25% -167 -7% -109 -35% -109 0% -109 0%
Associates 86 85 106 25% 106 0% 106 0%
Pre-tax 3,378 15% 3,786 12% 3,958 5% 4,328 9% 4,647 7%
Tax -696 17% -905 30% -871 -4% -1,034 19% -1,111 7%
Minorities -78 15% -89 12% -93 5% -102 9% -109 7%
Net 2,604 15% 2,792 7% 2,994 7% 3,192 7% 3,427 7%
Capital gains 214 332 275 275 275
Adjusted earnings 2,818 26% 3,124 11% 3,269 5% 3,467 6% 3,702 7%
Financial ratios
Margin on revenues 9.0% 9.3% 7.8% 7.8% 7.8%
Unit linked fees % funds 1.46% 1.65% 1.44% 1.44% 1.44%
General account fees % funds 0.77% 0.80% 0.79% 0.80% 0.80%
Mortality margin 0.29% 0.19% 0.27% 0.27% 0.27%
Acquisition expenses % new business APE -64.4% -69.8% -62.5% -62.0% -61.5%
Admin expenses -0.60% -0.59% -0.56% -0.54% -0.52%
Pre tax profits 0.70% 0.78% 0.81% 0.84% 0.85%
Financials
Initiating Coverage
6 August 2014
page 68 of 116 , Equity Analyst, 44 (0) 20 7029 8784, [email protected] Cathcart
Please see important disclosure information on pages 113 - 116 of this report.
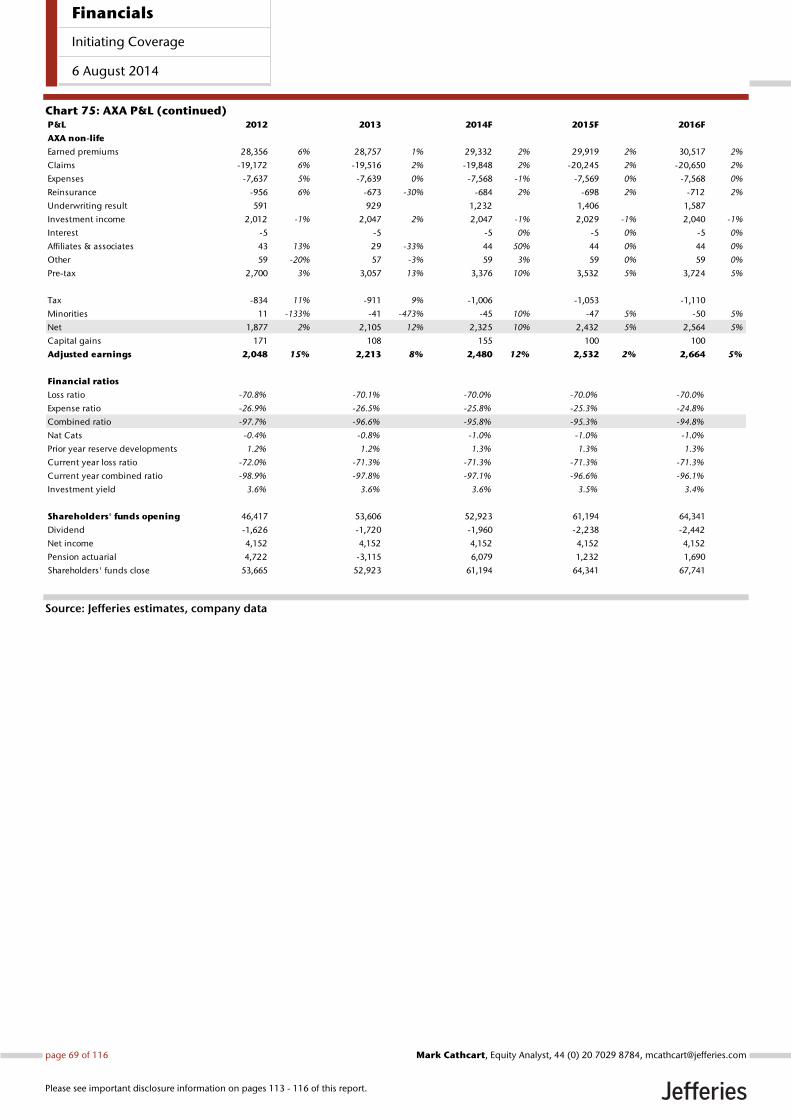
Chart 75: AXA P&L (continued)
Source: Jefferies estimates, company data
P&L 2012 2013 2014F 2015F 2016F
AXA non-life
Earned premiums 28,356 6% 28,757 1% 29,332 2% 29,919 2% 30,517 2%
Claims -19,172 6% -19,516 2% -19,848 2% -20,245 2% -20,650 2%
Expenses -7,637 5% -7,639 0% -7,568 -1% -7,569 0% -7,568 0%
Reinsurance -956 6% -673 -30% -684 2% -698 2% -712 2%
Underwriting result 591 929 1,232 1,406 1,587
Investment income 2,012 -1% 2,047 2% 2,047 -1% 2,029 -1% 2,040 -1%
Interest -5 -5 -5 0% -5 0% -5 0%
Affiliates & associates 43 13% 29 -33% 44 50% 44 0% 44 0%
Other 59 -20% 57 -3% 59 3% 59 0% 59 0%
Pre-tax 2,700 3% 3,057 13% 3,376 10% 3,532 5% 3,724 5%
Tax -834 11% -911 9% -1,006 -1,053 -1,110
Minorities 11 -133% -41 -473% -45 10% -47 5% -50 5%
Net 1,877 2% 2,105 12% 2,325 10% 2,432 5% 2,564 5%
Capital gains 171 108 155 100 100
Adjusted earnings 2,048 15% 2,213 8% 2,480 12% 2,532 2% 2,664 5%
Financial ratios
Loss ratio -70.8% -70.1% -70.0% -70.0% -70.0%
Expense ratio -26.9% -26.5% -25.8% -25.3% -24.8%
Combined ratio -97.7% -96.6% -95.8% -95.3% -94.8%
Nat Cats -0.4% -0.8% -1.0% -1.0% -1.0%
Prior year reserve developments 1.2% 1.2% 1.3% 1.3% 1.3%
Current year loss ratio -72.0% -71.3% -71.3% -71.3% -71.3%
Current year combined ratio -98.9% -97.8% -97.1% -96.6% -96.1%
Investment yield 3.6% 3.6% 3.6% 3.5% 3.4%
Shareholders' funds opening 46,417 53,606 52,923 61,194 64,341
Dividend -1,626 -1,720 -1,960 -2,238 -2,442
Net income 4,152 4,152 4,152 4,152 4,152
Pension actuarial 4,722 -3,115 6,079 1,232 1,690
Shareholders' funds close 53,665 52,923 61,194 64,341 67,741
Financials
Initiating Coverage
6 August 2014
page 69 of 116 , Equity Analyst, 44 (0) 20 7029 8784, [email protected] Cathcart
Please see important disclosure information on pages 113 - 116 of this report.
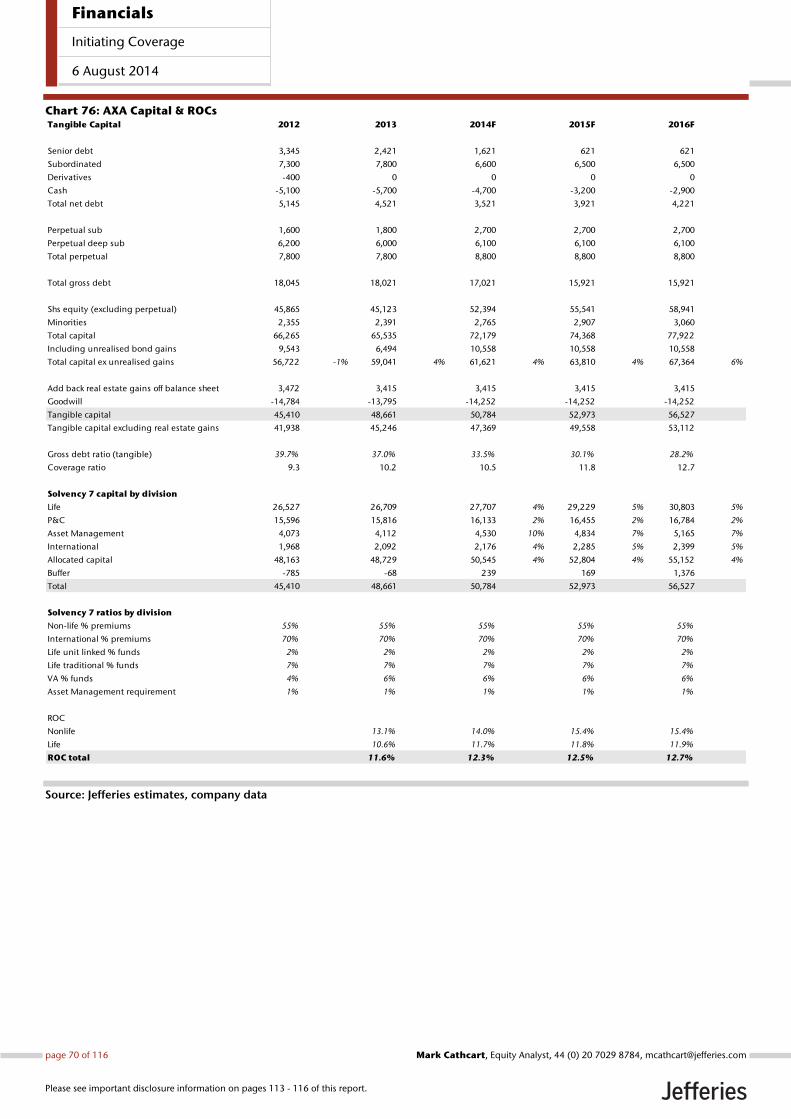
Chart 76: AXA Capital & ROCs
Source: Jefferies estimates, company data
Tangible Capital 2012 2013 2014F 2015F 2016F
Senior debt 3,345 2,421 1,621 621 621
Subordinated 7,300 7,800 6,600 6,500 6,500
Derivatives -400 0 0 0 0
Cash -5,100 -5,700 -4,700 -3,200 -2,900
Total net debt 5,145 4,521 3,521 3,921 4,221
Perpetual sub 1,600 1,800 2,700 2,700 2,700
Perpetual deep sub 6,200 6,000 6,100 6,100 6,100
Total perpetual 7,800 7,800 8,800 8,800 8,800
Total gross debt 18,045 18,021 17,021 15,921 15,921
Shs equity (excluding perpetual) 45,865 45,123 52,394 55,541 58,941
Minorities 2,355 2,391 2,765 2,907 3,060
Total capital 66,265 65,535 72,179 74,368 77,922
Including unrealised bond gains 9,543 6,494 10,558 10,558 10,558
Total capital ex unrealised gains 56,722 -1% 59,041 4% 61,621 4% 63,810 4% 67,364 6%
Add back real estate gains off balance sheet 3,472 3,415 3,415 3,415 3,415
Goodwill -14,784 -13,795 -14,252 -14,252 -14,252
Tangible capital 45,410 48,661 50,784 52,973 56,527
Tangible capital excluding real estate gains 41,938 45,246 47,369 49,558 53,112
Gross debt ratio (tangible) 39.7% 37.0% 33.5% 30.1% 28.2%
Coverage ratio 9.3 10.2 10.5 11.8 12.7
Solvency 7 capital by division
Life 26,527 26,709 27,707 4% 29,229 5% 30,803 5%
P&C 15,596 15,816 16,133 2% 16,455 2% 16,784 2%
Asset Management 4,073 4,112 4,530 10% 4,834 7% 5,165 7%
International 1,968 2,092 2,176 4% 2,285 5% 2,399 5%
Allocated capital 48,163 48,729 50,545 4% 52,804 4% 55,152 4%
Buffer -785 -68 239 169 1,376
Total 45,410 48,661 50,784 52,973 56,527
Solvency 7 ratios by division
Non-life % premiums 55% 55% 55% 55% 55%
International % premiums 70% 70% 70% 70% 70%
Life unit linked % funds 2% 2% 2% 2% 2%
Life traditional % funds 7% 7% 7% 7% 7%
VA % funds 4% 6% 6% 6% 6%
Asset Management requirement 1% 1% 1% 1% 1%
ROC
Nonlife 13.1% 14.0% 15.4% 15.4%
Life 10.6% 11.7% 11.8% 11.9%
ROC total 11.6% 12.3% 12.5% 12.7%
Financials
Initiating Coverage
6 August 2014
page 70 of 116 , Equity Analyst, 44 (0) 20 7029 8784, [email protected] Cathcart
Please see important disclosure information on pages 113 - 116 of this report.
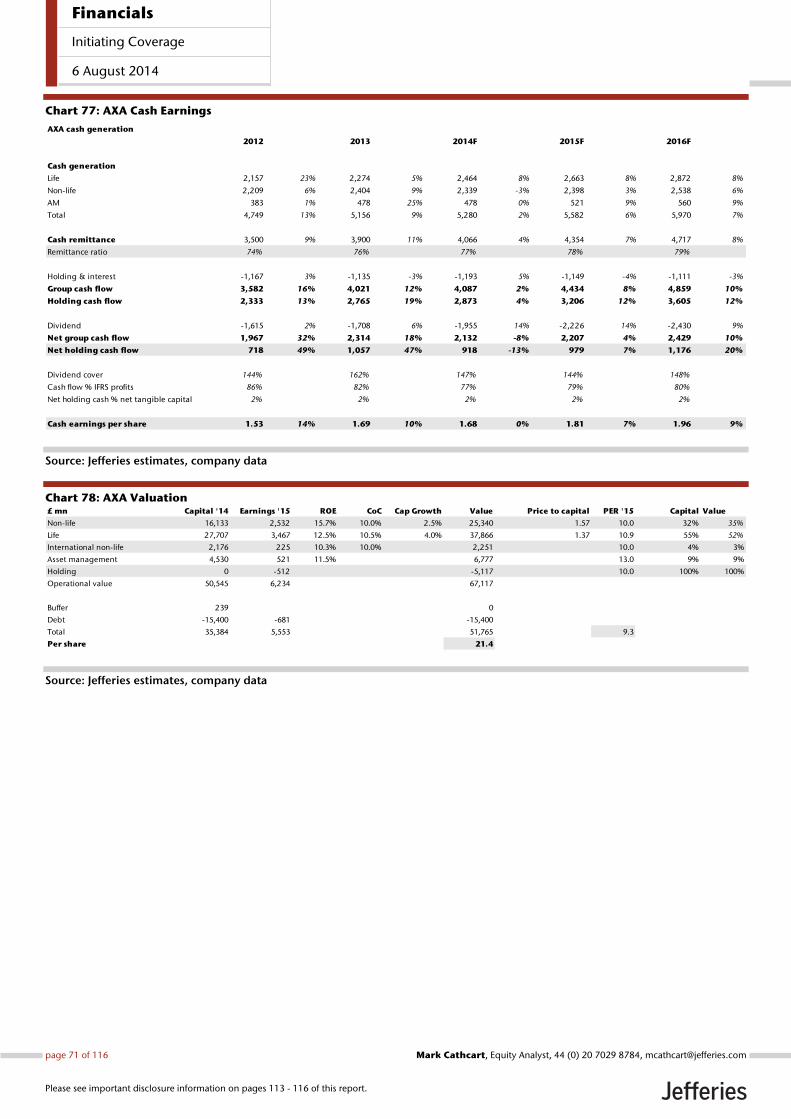
Chart 77: AXA Cash Earnings
Source: Jefferies estimates, company data
Chart 78: AXA Valuation
Source: Jefferies estimates, company data
AXA cash generation
2012 2013 2014F 2015F 2016F
Cash generation
Life 2,157 23% 2,274 5% 2,464 8% 2,663 8% 2,872 8%
Non-life 2,209 6% 2,404 9% 2,339 -3% 2,398 3% 2,538 6%
AM 383 1% 478 25% 478 0% 521 9% 560 9%
Total 4,749 13% 5,156 9% 5,280 2% 5,582 6% 5,970 7%
Cash remittance 3,500 9% 3,900 11% 4,066 4% 4,354 7% 4,717 8%
Remittance ratio 74% 76% 77% 78% 79%
Holding & interest -1,167 3% -1,135 -3% -1,193 5% -1,149 -4% -1,111 -3%
Group cash flow 3,582 16% 4,021 12% 4,087 2% 4,434 8% 4,859 10%
Holding cash flow 2,333 13% 2,765 19% 2,873 4% 3,206 12% 3,605 12%
Dividend -1,615 2% -1,708 6% -1,955 14% -2,226 14% -2,430 9%
Net group cash flow 1,967 32% 2,314 18% 2,132 -8% 2,207 4% 2,429 10%
Net holding cash flow 718 49% 1,057 47% 918 -13% 979 7% 1,176 20%
Dividend cover 144% 162% 147% 144% 148%
Cash flow % IFRS profits 86% 82% 77% 79% 80%
Net holding cash % net tangible capital 2% 2% 2% 2% 2%
Cash earnings per share 1.53 14% 1.69 10% 1.68 0% 1.81 7% 1.96 9%
£ mn Capital '14 Earnings '15 ROE CoC Cap Growth Value Price to capital PER '15 Capital Value
Non-life 16,133 2,532 15.7% 10.0% 2.5% 25,340 1.57 10.0 32% 35%
Life 27,707 3,467 12.5% 10.5% 4.0% 37,866 1.37 10.9 55% 52%
International non-life 2,176 225 10.3% 10.0% 2,251 10.0 4% 3%
Asset management 4,530 521 11.5% 6,777 13.0 9% 9%
Holding 0 -512 -5,117 10.0 100% 100%
Operational value 50,545 6,234 67,117
Buffer 239 0
Debt -15,400 -681 -15,400
Total 35,384 5,553 51,765 9.3
Per share 21.4
Financials
Initiating Coverage
6 August 2014
page 71 of 116 , Equity Analyst, 44 (0) 20 7029 8784, [email protected] Cathcart
Please see important disclosure information on pages 113 - 116 of this report.
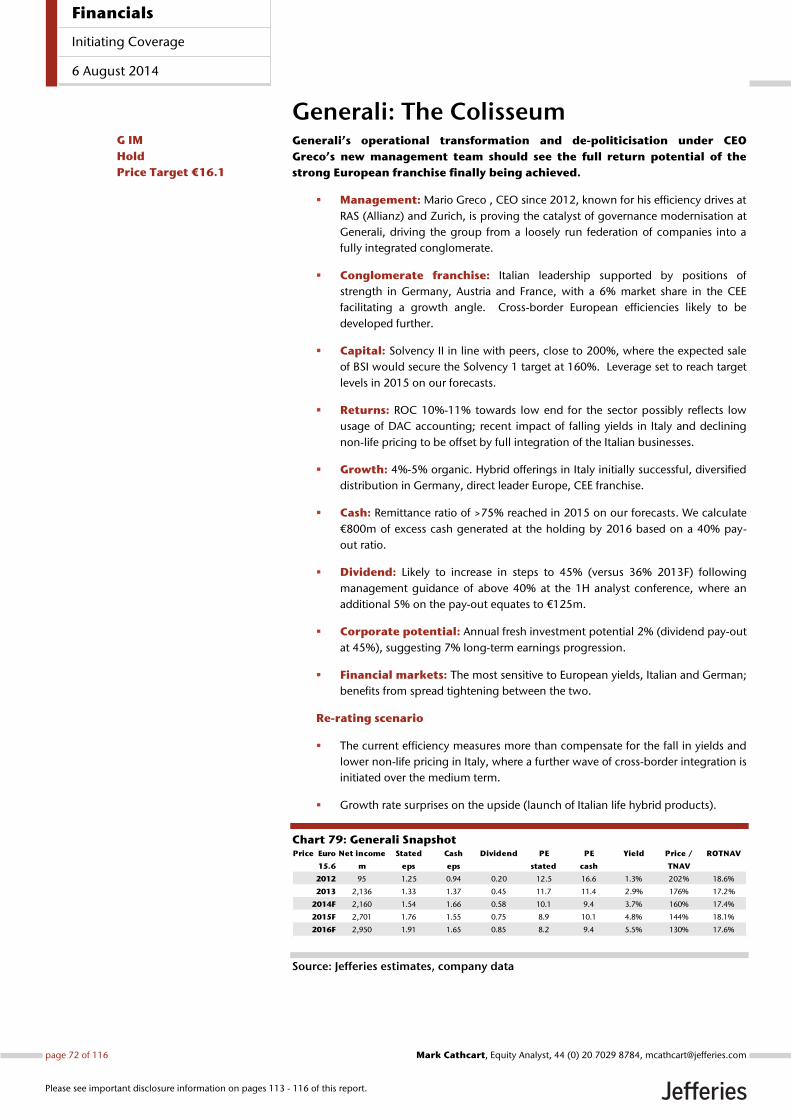
Generali: The Colisseum Generali’s operational transformation and de-politicisation under CEO
Greco’s new management team should see the full return potential of the
strong European franchise finally being achieved.
Management: Mario Greco , CEO since 2012, known for his efficiency drives at
RAS (Allianz) and Zurich, is proving the catalyst of governance modernisation at
Generali, driving the group from a loosely run federation of companies into a
fully integrated conglomerate.
Conglomerate franchise: Italian leadership supported by positions of
strength in Germany, Austria and France, with a 6% market share in the CEE
facilitating a growth angle. Cross-border European efficiencies likely to be
developed further.
Capital: Solvency II in line with peers, close to 200%, where the expected sale
of BSI would secure the Solvency 1 target at 160%. Leverage set to reach target
levels in 2015 on our forecasts.
Returns: ROC 10%-11% towards low end for the sector possibly reflects low
usage of DAC accounting; recent impact of falling yields in Italy and declining
non-life pricing to be offset by full integration of the Italian businesses.
Growth: 4%-5% organic. Hybrid offerings in Italy initially successful, diversified
distribution in Germany, direct leader Europe, CEE franchise.
Cash: Remittance ratio of >75% reached in 2015 on our forecasts. We calculate
€800m of excess cash generated at the holding by 2016 based on a 40% pay-
out ratio.
Dividend: Likely to increase in steps to 45% (versus 36% 2013F) following
management guidance of above 40% at the 1H analyst conference, where an
additional 5% on the pay-out equates to €125m.
Corporate potential: Annual fresh investment potential 2% (dividend pay-out
at 45%), suggesting 7% long-term earnings progression.
Financial markets: The most sensitive to European yields, Italian and German;
benefits from spread tightening between the two.
Re-rating scenario
The current efficiency measures more than compensate for the fall in yields and
lower non-life pricing in Italy, where a further wave of cross-border integration is
initiated over the medium term.
Growth rate surprises on the upside (launch of Italian life hybrid products).
Chart 79: Generali Snapshot
Source: Jefferies estimates, company data
Price Euro Net income Stated Cash Dividend PE PE Yield Price / ROTNAV
15.6 m eps eps stated cash TNAV
2012 95 1.25 0.94 0.20 12.5 16.6 1.3% 202% 18.6%
2013 2,136 1.33 1.37 0.45 11.7 11.4 2.9% 176% 17.2%
2014F 2,160 1.54 1.66 0.58 10.1 9.4 3.7% 160% 17.4%
2015F 2,701 1.76 1.55 0.75 8.9 10.1 4.8% 144% 18.1%
2016F 2,950 1.91 1.65 0.85 8.2 9.4 5.5% 130% 17.6%
G IM
Hold
Price Target €16.1
Financials
Initiating Coverage
6 August 2014
page 72 of 116 , Equity Analyst, 44 (0) 20 7029 8784, [email protected] Cathcart
Please see important disclosure information on pages 113 - 116 of this report.
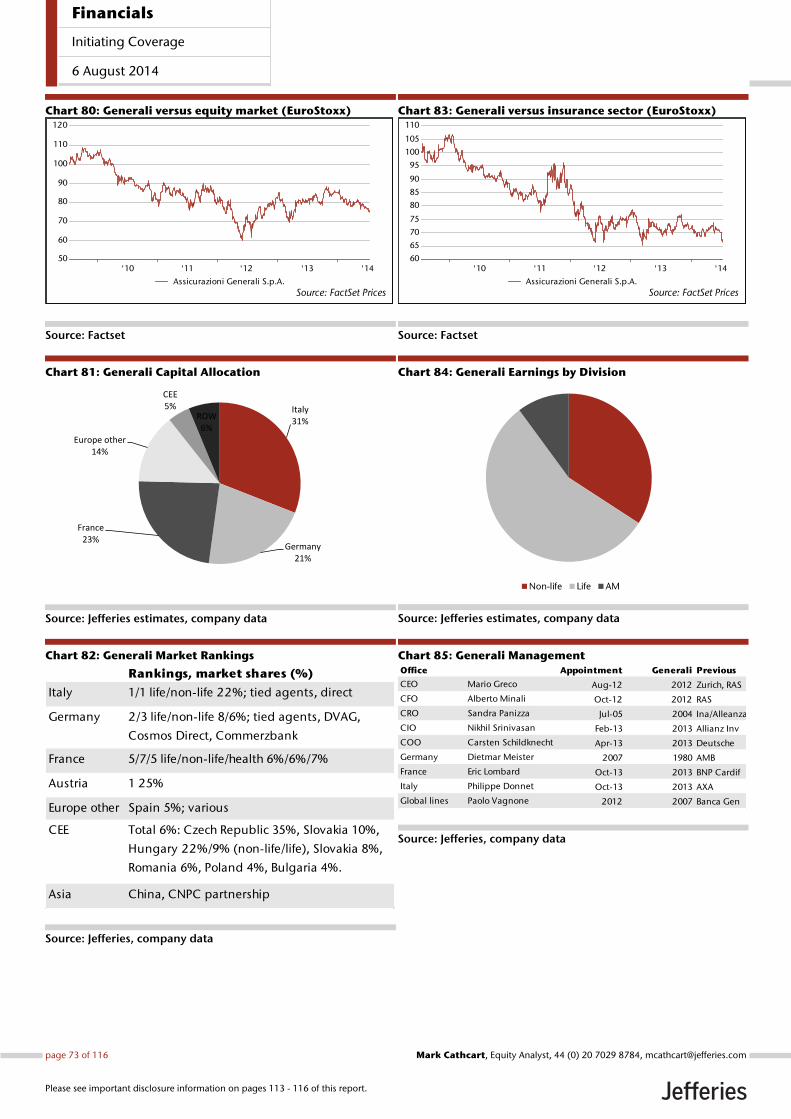
Chart 80: Generali versus equity market (EuroStoxx)
Source: Factset
Chart 81: Generali Capital Allocation
Source: Jefferies estimates, company data
Chart 82: Generali Market Rankings
Source: Jefferies, company data
Chart 83: Generali versus insurance sector (EuroStoxx)
Source: Factset
Chart 84: Generali Earnings by Division
Source: Jefferies estimates, company data
Chart 85: Generali Management
Source: Jefferies, company data
'10 '11 '12 '13 '1450
60
70
80
90
100
110
120
Source: FactSet PricesAssicurazioni Generali S.p.A.
Italy31%
Germany21%
France23%
Europe other14%
CEE5%
ROW6%
Rankings, market shares (%)
Italy 1/1 life/non-life 22%; tied agents, direct
Germany 2/3 life/non-life 8/6%; tied agents, DVAG,
Cosmos Direct, Commerzbank
France 5/7/5 life/non-life/health 6%/6%/7%
Austria 1 25%
Europe other Spain 5%; various
CEE Total 6%: Czech Republic 35%, Slovakia 10%,
Hungary 22%/9% (non-life/life), Slovakia 8%,
Romania 6%, Poland 4%, Bulgaria 4%.
Asia China, CNPC partnership
'10 '11 '12 '13 '1460
65
70
75
80
85
90
95
100
105
110
Source: FactSet PricesAssicurazioni Generali S.p.A.
Non-life Life AM
Office Appointment Generali Previous
CEO Mario Greco Aug-12 2012 Zurich, RAS
CFO Alberto Minali Oct-12 2012 RAS
CRO Sandra Panizza Jul-05 2004 Ina/Alleanza
CIO Nikhil Srinivasan Feb-13 2013 Allianz Inv
COO Carsten Schildknecht Apr-13 2013 Deutsche
Germany Dietmar Meister 2007 1980 AMB
France Eric Lombard Oct-13 2013 BNP Cardif
Italy Philippe Donnet Oct-13 2013 AXA
Global lines Paolo Vagnone 2012 2007 Banca Gen
Financials
Initiating Coverage
6 August 2014
page 73 of 116 , Equity Analyst, 44 (0) 20 7029 8784, [email protected] Cathcart
Please see important disclosure information on pages 113 - 116 of this report.
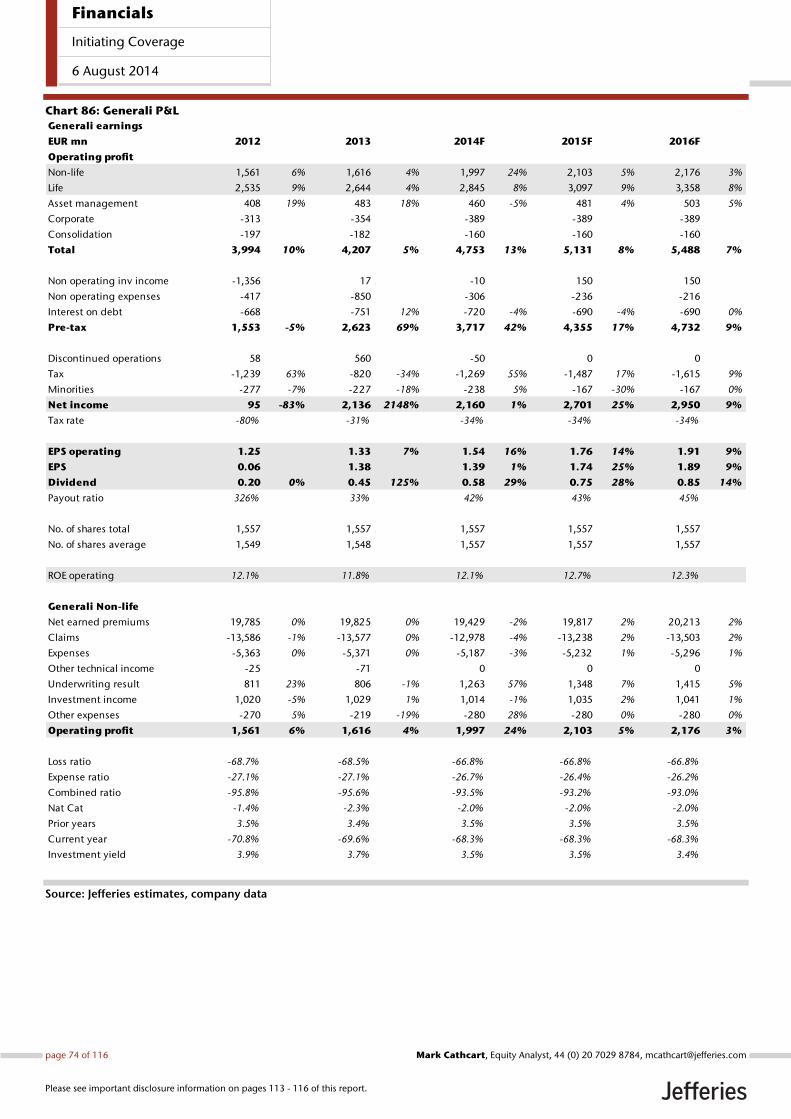
Chart 86: Generali P&L
Source: Jefferies estimates, company data
Generali earnings
EUR mn 2012 2013 2014F 2015F 2016F
Operating profit
Non-life 1,561 6% 1,616 4% 1,997 24% 2,103 5% 2,176 3%
Life 2,535 9% 2,644 4% 2,845 8% 3,097 9% 3,358 8%
Asset management 408 19% 483 18% 460 -5% 481 4% 503 5%
Corporate -313 -354 -389 -389 -389
Consolidation -197 -182 -160 -160 -160
Total 3,994 10% 4,207 5% 4,753 13% 5,131 8% 5,488 7%
Non operating inv income -1,356 17 -10 150 150
Non operating expenses -417 -850 -306 -236 -216
Interest on debt -668 -751 12% -720 -4% -690 -4% -690 0%
Pre-tax 1,553 -5% 2,623 69% 3,717 42% 4,355 17% 4,732 9%
Discontinued operations 58 560 -50 0 0
Tax -1,239 63% -820 -34% -1,269 55% -1,487 17% -1,615 9%
Minorities -277 -7% -227 -18% -238 5% -167 -30% -167 0%
Net income 95 -83% 2,136 2148% 2,160 1% 2,701 25% 2,950 9%
Tax rate -80% -31% -34% -34% -34%
EPS operating 1.25 1.33 7% 1.54 16% 1.76 14% 1.91 9%
EPS 0.06 1.38 1.39 1% 1.74 25% 1.89 9%
Dividend 0.20 0% 0.45 125% 0.58 29% 0.75 28% 0.85 14%
Payout ratio 326% 33% 42% 43% 45%
No. of shares total 1,557 1,557 1,557 1,557 1,557
No. of shares average 1,549 1,548 1,557 1,557 1,557
ROE operating 12.1% 11.8% 12.1% 12.7% 12.3%
Generali Non-life
Net earned premiums 19,785 0% 19,825 0% 19,429 -2% 19,817 2% 20,213 2%
Claims -13,586 -1% -13,577 0% -12,978 -4% -13,238 2% -13,503 2%
Expenses -5,363 0% -5,371 0% -5,187 -3% -5,232 1% -5,296 1%
Other technical income -25 -71 0 0 0
Underwriting result 811 23% 806 -1% 1,263 57% 1,348 7% 1,415 5%
Investment income 1,020 -5% 1,029 1% 1,014 -1% 1,035 2% 1,041 1%
Other expenses -270 5% -219 -19% -280 28% -280 0% -280 0%
Operating profit 1,561 6% 1,616 4% 1,997 24% 2,103 5% 2,176 3%
Loss ratio -68.7% -68.5% -66.8% -66.8% -66.8%
Expense ratio -27.1% -27.1% -26.7% -26.4% -26.2%
Combined ratio -95.8% -95.6% -93.5% -93.2% -93.0%
Nat Cat -1.4% -2.3% -2.0% -2.0% -2.0%
Prior years 3.5% 3.4% 3.5% 3.5% 3.5%
Current year -70.8% -69.6% -68.3% -68.3% -68.3%
Investment yield 3.9% 3.7% 3.5% 3.5% 3.4%
Financials
Initiating Coverage
6 August 2014
page 74 of 116 , Equity Analyst, 44 (0) 20 7029 8784, [email protected] Cathcart
Please see important disclosure information on pages 113 - 116 of this report.
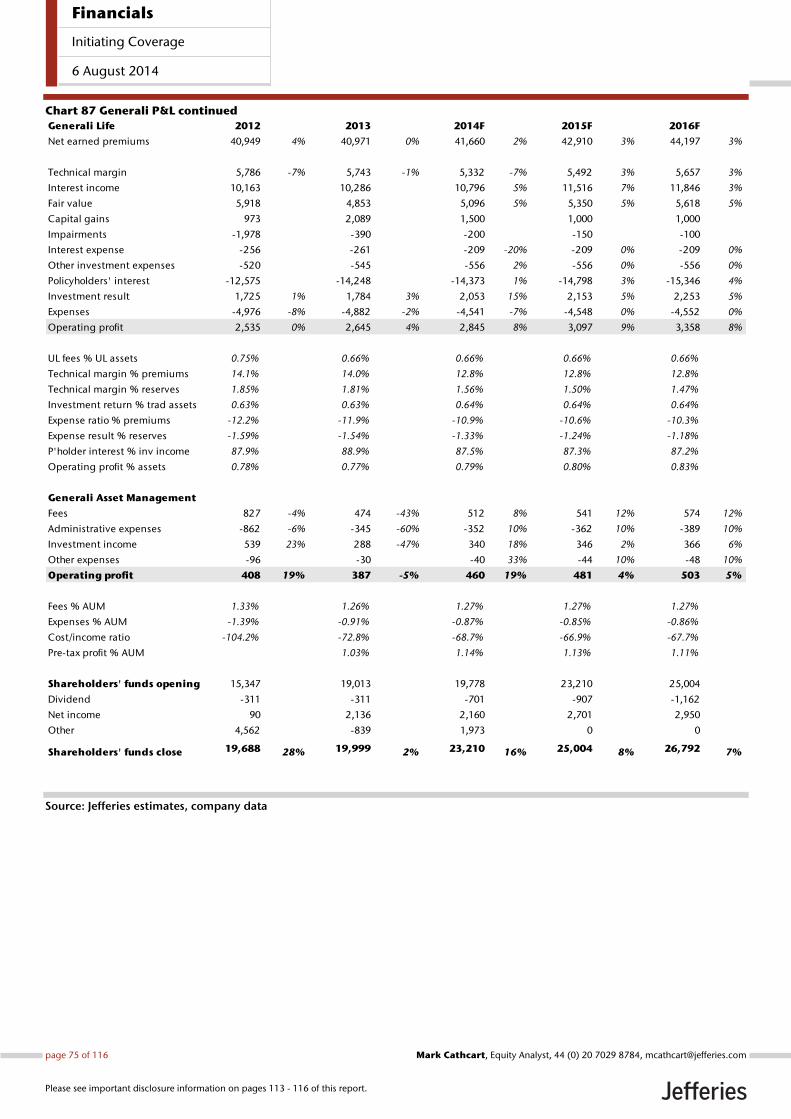
Chart 87 Generali P&L continued
Source: Jefferies estimates, company data
Generali Life 2012 2013 2014F 2015F 2016F
Net earned premiums 40,949 4% 40,971 0% 41,660 2% 42,910 3% 44,197 3%
Technical margin 5,786 -7% 5,743 -1% 5,332 -7% 5,492 3% 5,657 3%
Interest income 10,163 10,286 10,796 5% 11,516 7% 11,846 3%
Fair value 5,918 4,853 5,096 5% 5,350 5% 5,618 5%
Capital gains 973 2,089 1,500 1,000 1,000
Impairments -1,978 -390 -200 -150 -100
Interest expense -256 -261 -209 -20% -209 0% -209 0%
Other investment expenses -520 -545 -556 2% -556 0% -556 0%
Policyholders' interest -12,575 -14,248 -14,373 1% -14,798 3% -15,346 4%
Investment result 1,725 1% 1,784 3% 2,053 15% 2,153 5% 2,253 5%
Expenses -4,976 -8% -4,882 -2% -4,541 -7% -4,548 0% -4,552 0%
Operating profit 2,535 0% 2,645 4% 2,845 8% 3,097 9% 3,358 8%
UL fees % UL assets 0.75% 0.66% 0.66% 0.66% 0.66%
Technical margin % premiums 14.1% 14.0% 12.8% 12.8% 12.8%
Technical margin % reserves 1.85% 1.81% 1.56% 1.50% 1.47%
Investment return % trad assets 0.63% 0.63% 0.64% 0.64% 0.64%
Expense ratio % premiums -12.2% -11.9% -10.9% -10.6% -10.3%
Expense result % reserves -1.59% -1.54% -1.33% -1.24% -1.18%
P'holder interest % inv income 87.9% 88.9% 87.5% 87.3% 87.2%
Operating profit % assets 0.78% 0.77% 0.79% 0.80% 0.83%
Generali Asset Management
Fees 827 -4% 474 -43% 512 8% 541 12% 574 12%
Administrative expenses -862 -6% -345 -60% -352 10% -362 10% -389 10%
Investment income 539 23% 288 -47% 340 18% 346 2% 366 6%
Other expenses -96 -30 -40 33% -44 10% -48 10%
Operating profit 408 19% 387 -5% 460 19% 481 4% 503 5%
Fees % AUM 1.33% 1.26% 1.27% 1.27% 1.27%
Expenses % AUM -1.39% -0.91% -0.87% -0.85% -0.86%
Cost/income ratio -104.2% -72.8% -68.7% -66.9% -67.7%
Pre-tax profit % AUM 1.03% 1.14% 1.13% 1.11%
Shareholders' funds opening 15,347 19,013 19,778 23,210 25,004
Dividend -311 -311 -701 -907 -1,162
Net income 90 2,136 2,160 2,701 2,950
Other 4,562 -839 1,973 0 0
Shareholders' funds close 19,688 28% 19,999 2% 23,210 16% 25,004 8% 26,792 7%
Financials
Initiating Coverage
6 August 2014
page 75 of 116 , Equity Analyst, 44 (0) 20 7029 8784, [email protected] Cathcart
Please see important disclosure information on pages 113 - 116 of this report.
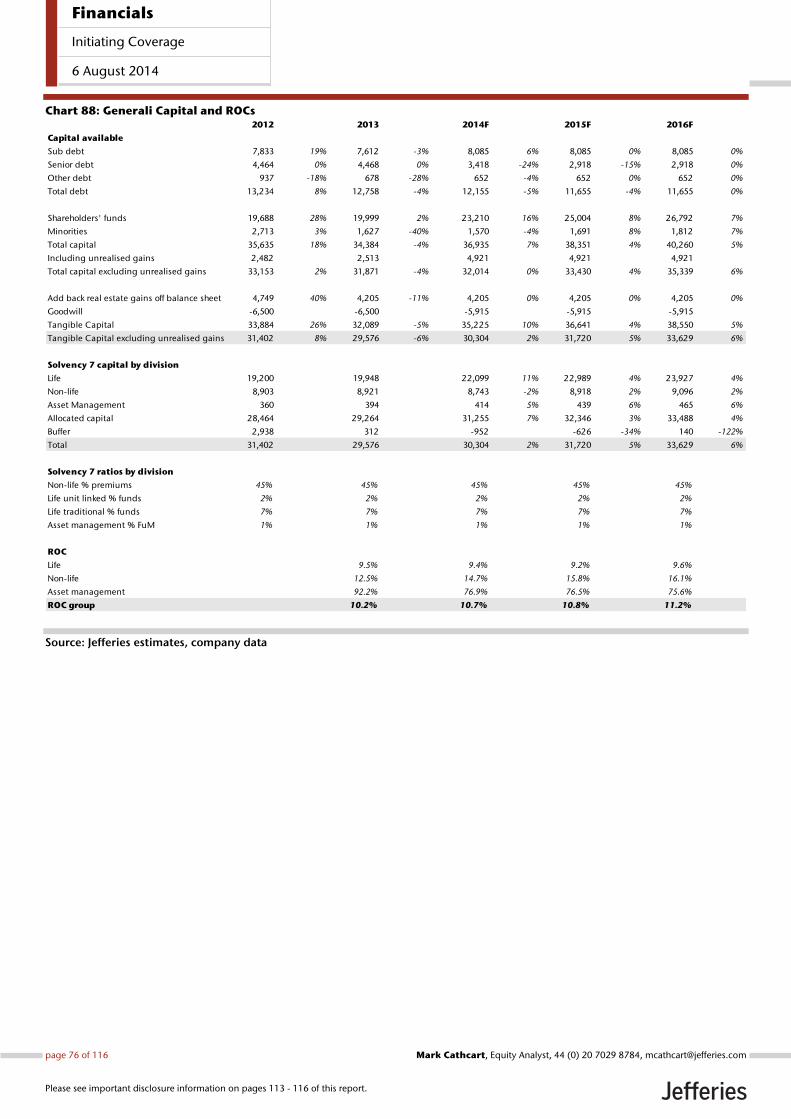
Chart 88: Generali Capital and ROCs
Source: Jefferies estimates, company data
2012 2013 2014F 2015F 2016F
Capital available
Sub debt 7,833 19% 7,612 -3% 8,085 6% 8,085 0% 8,085 0%
Senior debt 4,464 0% 4,468 0% 3,418 -24% 2,918 -15% 2,918 0%
Other debt 937 -18% 678 -28% 652 -4% 652 0% 652 0%
Total debt 13,234 8% 12,758 -4% 12,155 -5% 11,655 -4% 11,655 0%
Shareholders' funds 19,688 28% 19,999 2% 23,210 16% 25,004 8% 26,792 7%
Minorities 2,713 3% 1,627 -40% 1,570 -4% 1,691 8% 1,812 7%
Total capital 35,635 18% 34,384 -4% 36,935 7% 38,351 4% 40,260 5%
Including unrealised gains 2,482 2,513 4,921 4,921 4,921
Total capital excluding unrealised gains 33,153 2% 31,871 -4% 32,014 0% 33,430 4% 35,339 6%
Add back real estate gains off balance sheet 4,749 40% 4,205 -11% 4,205 0% 4,205 0% 4,205 0%
Goodwill -6,500 -6,500 -5,915 -5,915 -5,915
Tangible Capital 33,884 26% 32,089 -5% 35,225 10% 36,641 4% 38,550 5%
Tangible Capital excluding unrealised gains 31,402 8% 29,576 -6% 30,304 2% 31,720 5% 33,629 6%
Solvency 7 capital by division
Life 19,200 19,948 22,099 11% 22,989 4% 23,927 4%
Non-life 8,903 8,921 8,743 -2% 8,918 2% 9,096 2%
Asset Management 360 394 414 5% 439 6% 465 6%
Allocated capital 28,464 29,264 31,255 7% 32,346 3% 33,488 4%
Buffer 2,938 312 -952 -626 -34% 140 -122%
Total 31,402 29,576 30,304 2% 31,720 5% 33,629 6%
Solvency 7 ratios by division
Non-life % premiums 45% 45% 45% 45% 45%
Life unit linked % funds 2% 2% 2% 2% 2%
Life traditional % funds 7% 7% 7% 7% 7%
Asset management % FuM 1% 1% 1% 1% 1%
ROC
Life 9.5% 9.4% 9.2% 9.6%
Non-life 12.5% 14.7% 15.8% 16.1%
Asset management 92.2% 76.9% 76.5% 75.6%
ROC group 10.2% 10.7% 10.8% 11.2%
Financials
Initiating Coverage
6 August 2014
page 76 of 116 , Equity Analyst, 44 (0) 20 7029 8784, [email protected] Cathcart
Please see important disclosure information on pages 113 - 116 of this report.
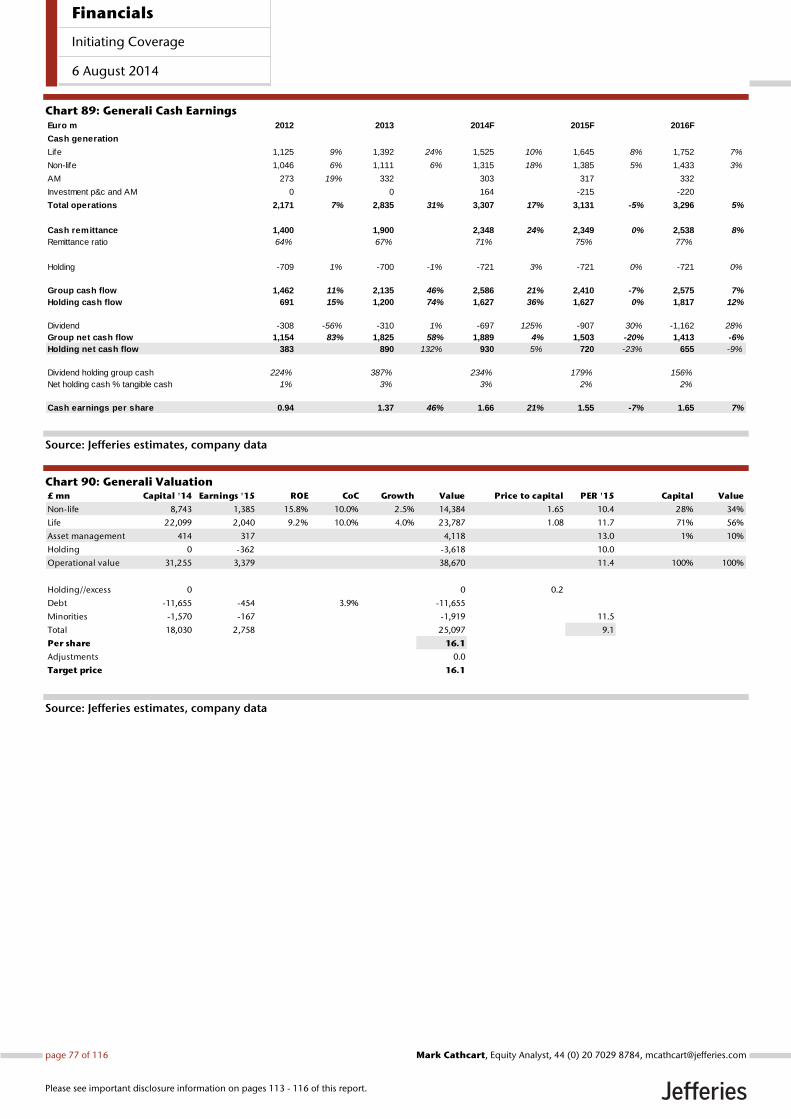
Chart 89: Generali Cash Earnings
Source: Jefferies estimates, company data
Chart 90: Generali Valuation
Source: Jefferies estimates, company data
Euro m 2012 2013 2014F 2015F 2016F
Cash generation
Life 1,125 9% 1,392 24% 1,525 10% 1,645 8% 1,752 7%
Non-life 1,046 6% 1,111 6% 1,315 18% 1,385 5% 1,433 3%
AM 273 19% 332 303 317 332
Investment p&c and AM 0 0 164 -215 -220
Total operations 2,171 7% 2,835 31% 3,307 17% 3,131 -5% 3,296 5%
Cash remittance 1,400 1,900 2,348 24% 2,349 0% 2,538 8%
Remittance ratio 64% 67% 71% 75% 77%
Holding -709 1% -700 -1% -721 3% -721 0% -721 0%
Group cash flow 1,462 11% 2,135 46% 2,586 21% 2,410 -7% 2,575 7%
Holding cash flow 691 15% 1,200 74% 1,627 36% 1,627 0% 1,817 12%
Dividend -308 -56% -310 1% -697 125% -907 30% -1,162 28%
Group net cash flow 1,154 83% 1,825 58% 1,889 4% 1,503 -20% 1,413 -6%
Holding net cash flow 383 890 132% 930 5% 720 -23% 655 -9%
Dividend holding group cash 224% 387% 234% 179% 156%
Net holding cash % tangible cash 1% 3% 3% 2% 2%
Cash earnings per share 0.94 1.37 46% 1.66 21% 1.55 -7% 1.65 7%
£ mn Capital '14 Earnings '15 ROE CoC Growth Value Price to capital PER '15 Capital Value
Non-life 8,743 1,385 15.8% 10.0% 2.5% 14,384 1.65 10.4 28% 34%
Life 22,099 2,040 9.2% 10.0% 4.0% 23,787 1.08 11.7 71% 56%
Asset management 414 317 4,118 13.0 1% 10%
Holding 0 -362 -3,618 10.0
Operational value 31,255 3,379 38,670 11.4 100% 100%
Holding//excess 0 0 0.2
Debt -11,655 -454 3.9% -11,655
Minorities -1,570 -167 -1,919 11.5
Total 18,030 2,758 25,097 9.1
Per share 16.1
Adjustments 0.0
Target price 16.1
Financials
Initiating Coverage
6 August 2014
page 77 of 116 , Equity Analyst, 44 (0) 20 7029 8784, [email protected] Cathcart
Please see important disclosure information on pages 113 - 116 of this report.
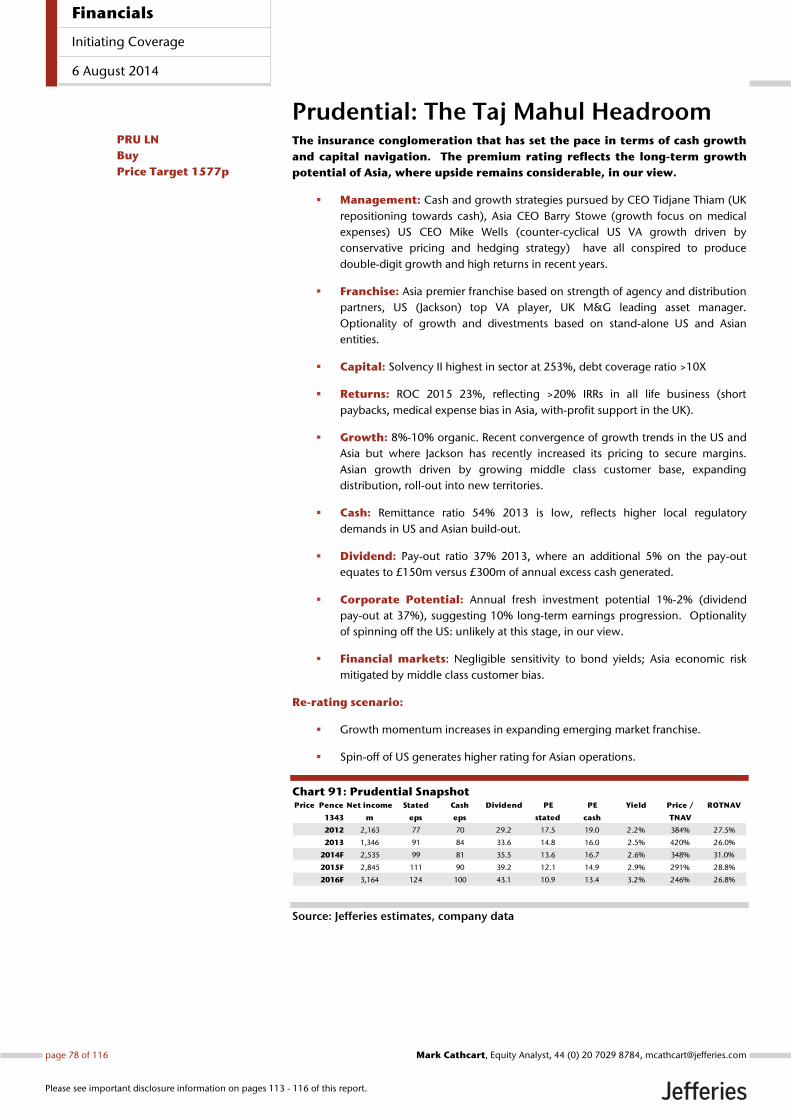
Prudential: The Taj Mahul Headroom The insurance conglomeration that has set the pace in terms of cash growth
and capital navigation. The premium rating reflects the long-term growth
potential of Asia, where upside remains considerable, in our view.
Management: Cash and growth strategies pursued by CEO Tidjane Thiam (UK
repositioning towards cash), Asia CEO Barry Stowe (growth focus on medical
expenses) US CEO Mike Wells (counter-cyclical US VA growth driven by
conservative pricing and hedging strategy) have all conspired to produce
double-digit growth and high returns in recent years.
Franchise: Asia premier franchise based on strength of agency and distribution
partners, US (Jackson) top VA player, UK M&G leading asset manager.
Optionality of growth and divestments based on stand-alone US and Asian
entities.
Capital: Solvency II highest in sector at 253%, debt coverage ratio >10X
Returns: ROC 2015 23%, reflecting >20% IRRs in all life business (short
paybacks, medical expense bias in Asia, with-profit support in the UK).
Growth: 8%-10% organic. Recent convergence of growth trends in the US and
Asia but where Jackson has recently increased its pricing to secure margins.
Asian growth driven by growing middle class customer base, expanding
distribution, roll-out into new territories.
Cash: Remittance ratio 54% 2013 is low, reflects higher local regulatory
demands in US and Asian build-out.
Dividend: Pay-out ratio 37% 2013, where an additional 5% on the pay-out
equates to £150m versus £300m of annual excess cash generated.
Corporate Potential: Annual fresh investment potential 1%-2% (dividend
pay-out at 37%), suggesting 10% long-term earnings progression. Optionality
of spinning off the US: unlikely at this stage, in our view.
Financial markets: Negligible sensitivity to bond yields; Asia economic risk
mitigated by middle class customer bias.
Re-rating scenario:
Growth momentum increases in expanding emerging market franchise.
Spin-off of US generates higher rating for Asian operations.
Chart 91: Prudential Snapshot
Source: Jefferies estimates, company data
Price Pence Net income Stated Cash Dividend PE PE Yield Price / ROTNAV
1343 m eps eps stated cash TNAV
2012 2,163 77 70 29.2 17.5 19.0 2.2% 384% 27.5%
2013 1,346 91 84 33.6 14.8 16.0 2.5% 420% 26.0%
2014F 2,535 99 81 35.5 13.6 16.7 2.6% 348% 31.0%
2015F 2,845 111 90 39.2 12.1 14.9 2.9% 291% 28.8%
2016F 3,164 124 100 43.1 10.9 13.4 3.2% 246% 26.8%
PRU LN
Buy
Price Target 1577p
Financials
Initiating Coverage
6 August 2014
page 78 of 116 , Equity Analyst, 44 (0) 20 7029 8784, [email protected] Cathcart
Please see important disclosure information on pages 113 - 116 of this report.
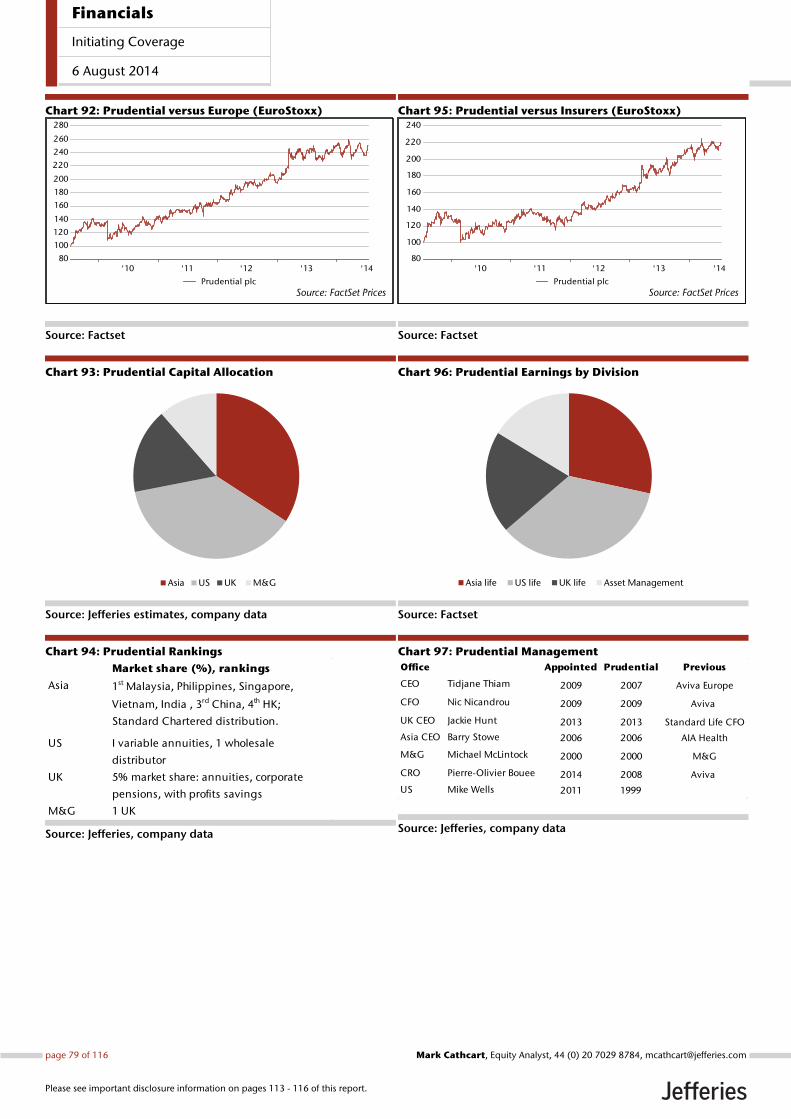
Chart 92: Prudential versus Europe (EuroStoxx)
Source: Factset
Chart 93: Prudential Capital Allocation
Source: Jefferies estimates, company data
Chart 94: Prudential Rankings
Source: Jefferies, company data
Chart 95: Prudential versus Insurers (EuroStoxx)
Source: Factset
Chart 96: Prudential Earnings by Division
Source: Factset
Chart 97: Prudential Management
Source: Jefferies, company data
'10 '11 '12 '13 '1480
100
120
140
160
180
200
220
240
260
280
Source: FactSet PricesPrudential plc
Asia US UK M&G
Market share (%), rankings
Asia 1st Malaysia, Philippines, Singapore,
Vietnam, India , 3rd China, 4th HK;
Standard Chartered distribution.
US I variable annuities, 1 wholesale
distributor
UK 5% market share: annuities, corporate
pensions, with profits savings
M&G 1 UK
'10 '11 '12 '13 '1480
100
120
140
160
180
200
220
240
Source: FactSet PricesPrudential plc
Asia life US life UK life Asset Management
Office Appointed Prudential Previous
CEO Tidjane Thiam 2009 2007 Aviva Europe
CFO Nic Nicandrou 2009 2009 Aviva
UK CEO Jackie Hunt 2013 2013 Standard Life CFO
Asia CEO Barry Stowe 2006 2006 AIA Health
M&G Michael McLintock 2000 2000 M&G
CRO Pierre-Olivier Bouee 2014 2008 Aviva
US Mike Wells 2011 1999
Financials
Initiating Coverage
6 August 2014
page 79 of 116 , Equity Analyst, 44 (0) 20 7029 8784, [email protected] Cathcart
Please see important disclosure information on pages 113 - 116 of this report.
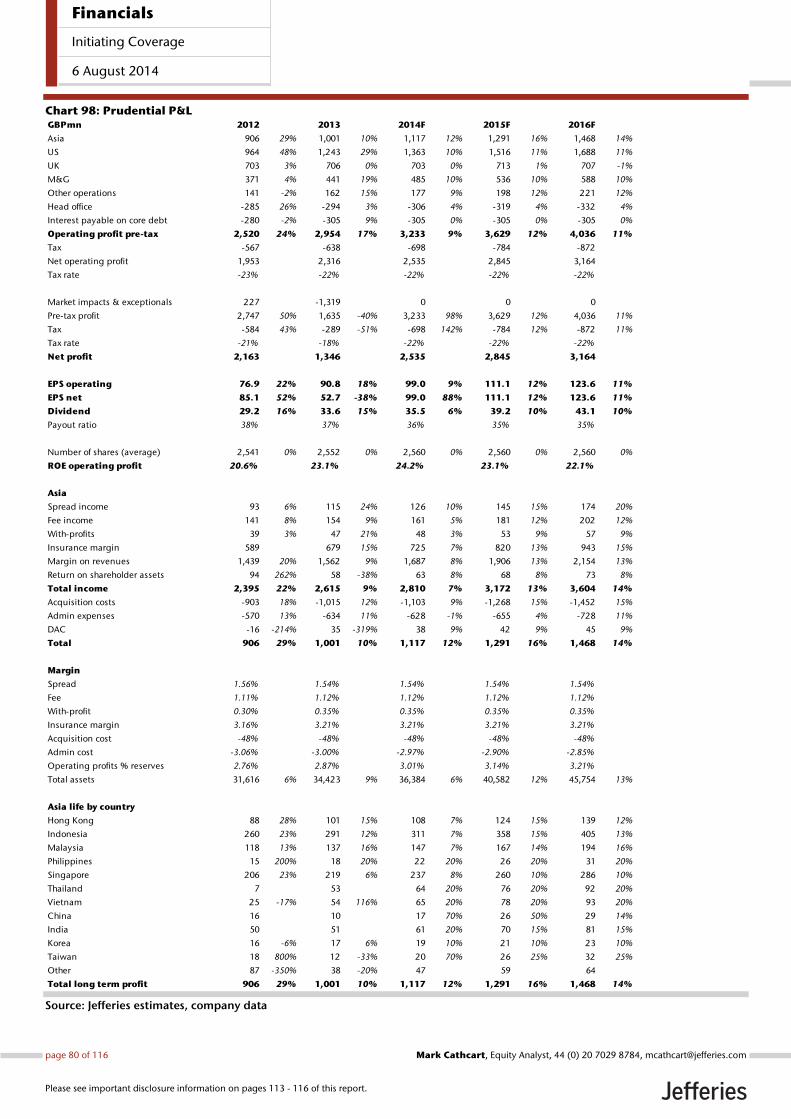
Chart 98: Prudential P&L
Source: Jefferies estimates, company data
GBPmn 2012 2013 2014F 2015F 2016F
Asia 906 29% 1,001 10% 1,117 12% 1,291 16% 1,468 14%
US 964 48% 1,243 29% 1,363 10% 1,516 11% 1,688 11%
UK 703 3% 706 0% 703 0% 713 1% 707 -1%
M&G 371 4% 441 19% 485 10% 536 10% 588 10%
Other operations 141 -2% 162 15% 177 9% 198 12% 221 12%
Head office -285 26% -294 3% -306 4% -319 4% -332 4%
Interest payable on core debt -280 -2% -305 9% -305 0% -305 0% -305 0%
Operating profit pre-tax 2,520 24% 2,954 17% 3,233 9% 3,629 12% 4,036 11%
Tax -567 -638 -698 -784 -872
Net operating profit 1,953 2,316 2,535 2,845 3,164
Tax rate -23% -22% -22% -22% -22%
Market impacts & exceptionals 227 -1,319 0 0 0
Pre-tax profit 2,747 50% 1,635 -40% 3,233 98% 3,629 12% 4,036 11%
Tax -584 43% -289 -51% -698 142% -784 12% -872 11%
Tax rate -21% -18% -22% -22% -22%
Net profit 2,163 1,346 2,535 2,845 3,164
EPS operating 76.9 22% 90.8 18% 99.0 9% 111.1 12% 123.6 11%
EPS net 85.1 52% 52.7 -38% 99.0 88% 111.1 12% 123.6 11%
Dividend 29.2 16% 33.6 15% 35.5 6% 39.2 10% 43.1 10%
Payout ratio 38% 37% 36% 35% 35%
Number of shares (average) 2,541 0% 2,552 0% 2,560 0% 2,560 0% 2,560 0%
ROE operating profit 20.6% 23.1% 24.2% 23.1% 22.1%
Asia
Spread income 93 6% 115 24% 126 10% 145 15% 174 20%
Fee income 141 8% 154 9% 161 5% 181 12% 202 12%
With-profits 39 3% 47 21% 48 3% 53 9% 57 9%
Insurance margin 589 679 15% 725 7% 820 13% 943 15%
Margin on revenues 1,439 20% 1,562 9% 1,687 8% 1,906 13% 2,154 13%
Return on shareholder assets 94 262% 58 -38% 63 8% 68 8% 73 8%
Total income 2,395 22% 2,615 9% 2,810 7% 3,172 13% 3,604 14%
Acquisition costs -903 18% -1,015 12% -1,103 9% -1,268 15% -1,452 15%
Admin expenses -570 13% -634 11% -628 -1% -655 4% -728 11%
DAC -16 -214% 35 -319% 38 9% 42 9% 45 9%
Total 906 29% 1,001 10% 1,117 12% 1,291 16% 1,468 14%
Margin
Spread 1.56% 1.54% 1.54% 1.54% 1.54%
Fee 1.11% 1.12% 1.12% 1.12% 1.12%
With-profit 0.30% 0.35% 0.35% 0.35% 0.35%
Insurance margin 3.16% 3.21% 3.21% 3.21% 3.21%
Acquisition cost -48% -48% -48% -48% -48%
Admin cost -3.06% -3.00% -2.97% -2.90% -2.85%
Operating profits % reserves 2.76% 2.87% 3.01% 3.14% 3.21%
Total assets 31,616 6% 34,423 9% 36,384 6% 40,582 12% 45,754 13%
Asia life by country
Hong Kong 88 28% 101 15% 108 7% 124 15% 139 12%
Indonesia 260 23% 291 12% 311 7% 358 15% 405 13%
Malaysia 118 13% 137 16% 147 7% 167 14% 194 16%
Philippines 15 200% 18 20% 22 20% 26 20% 31 20%
Singapore 206 23% 219 6% 237 8% 260 10% 286 10%
Thailand 7 53 64 20% 76 20% 92 20%
Vietnam 25 -17% 54 116% 65 20% 78 20% 93 20%
China 16 10 17 70% 26 50% 29 14%
India 50 51 61 20% 70 15% 81 15%
Korea 16 -6% 17 6% 19 10% 21 10% 23 10%
Taiwan 18 800% 12 -33% 20 70% 26 25% 32 25%
Other 87 -350% 38 -20% 47 59 64
Total long term profit 906 29% 1,001 10% 1,117 12% 1,291 16% 1,468 14%
Financials
Initiating Coverage
6 August 2014
page 80 of 116 , Equity Analyst, 44 (0) 20 7029 8784, [email protected] Cathcart
Please see important disclosure information on pages 113 - 116 of this report.
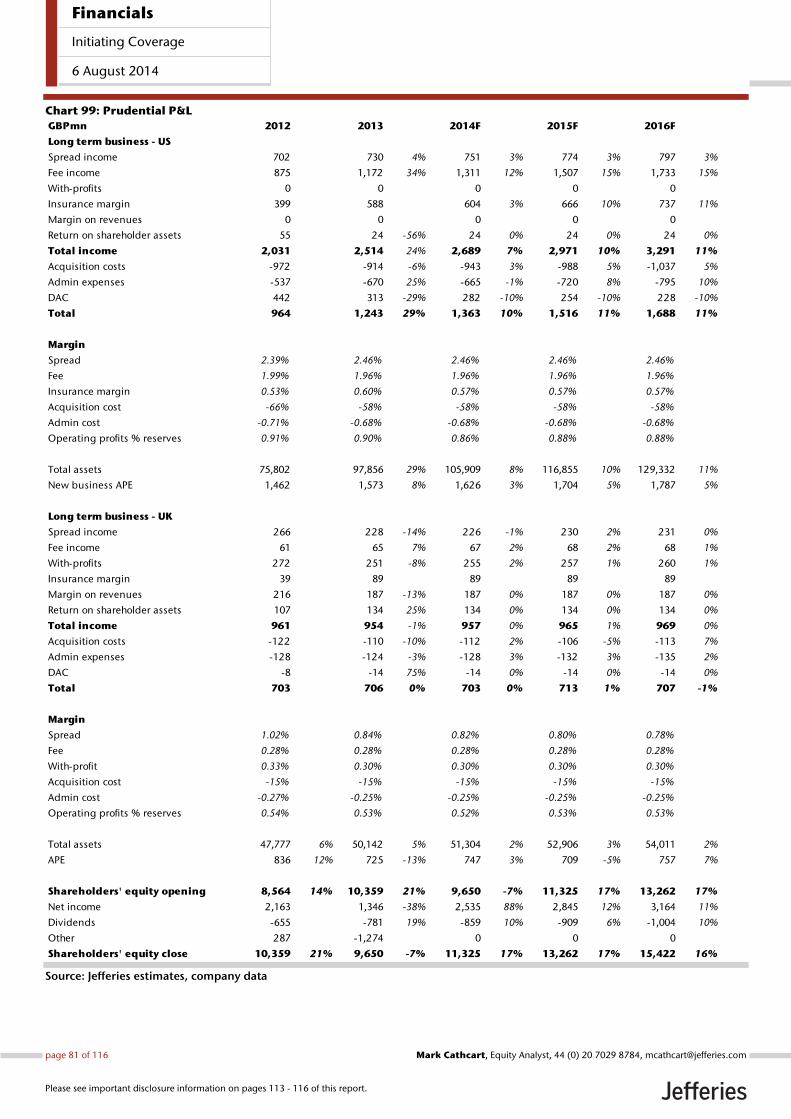
Chart 99: Prudential P&L
Source: Jefferies estimates, company data
GBPmn 2012 2013 2014F 2015F 2016F
Long term business - US
Spread income 702 730 4% 751 3% 774 3% 797 3%
Fee income 875 1,172 34% 1,311 12% 1,507 15% 1,733 15%
With-profits 0 0 0 0 0
Insurance margin 399 588 604 3% 666 10% 737 11%
Margin on revenues 0 0 0 0 0
Return on shareholder assets 55 24 -56% 24 0% 24 0% 24 0%
Total income 2,031 2,514 24% 2,689 7% 2,971 10% 3,291 11%
Acquisition costs -972 -914 -6% -943 3% -988 5% -1,037 5%
Admin expenses -537 -670 25% -665 -1% -720 8% -795 10%
DAC 442 313 -29% 282 -10% 254 -10% 228 -10%
Total 964 1,243 29% 1,363 10% 1,516 11% 1,688 11%
Margin
Spread 2.39% 2.46% 2.46% 2.46% 2.46%
Fee 1.99% 1.96% 1.96% 1.96% 1.96%
Insurance margin 0.53% 0.60% 0.57% 0.57% 0.57%
Acquisition cost -66% -58% -58% -58% -58%
Admin cost -0.71% -0.68% -0.68% -0.68% -0.68%
Operating profits % reserves 0.91% 0.90% 0.86% 0.88% 0.88%
Total assets 75,802 97,856 29% 105,909 8% 116,855 10% 129,332 11%
New business APE 1,462 1,573 8% 1,626 3% 1,704 5% 1,787 5%
Long term business - UK
Spread income 266 228 -14% 226 -1% 230 2% 231 0%
Fee income 61 65 7% 67 2% 68 2% 68 1%
With-profits 272 251 -8% 255 2% 257 1% 260 1%
Insurance margin 39 89 89 89 89
Margin on revenues 216 187 -13% 187 0% 187 0% 187 0%
Return on shareholder assets 107 134 25% 134 0% 134 0% 134 0%
Total income 961 954 -1% 957 0% 965 1% 969 0%
Acquisition costs -122 -110 -10% -112 2% -106 -5% -113 7%
Admin expenses -128 -124 -3% -128 3% -132 3% -135 2%
DAC -8 -14 75% -14 0% -14 0% -14 0%
Total 703 706 0% 703 0% 713 1% 707 -1%
Margin
Spread 1.02% 0.84% 0.82% 0.80% 0.78%
Fee 0.28% 0.28% 0.28% 0.28% 0.28%
With-profit 0.33% 0.30% 0.30% 0.30% 0.30%
Acquisition cost -15% -15% -15% -15% -15%
Admin cost -0.27% -0.25% -0.25% -0.25% -0.25%
Operating profits % reserves 0.54% 0.53% 0.52% 0.53% 0.53%
Total assets 47,777 6% 50,142 5% 51,304 2% 52,906 3% 54,011 2%
APE 836 12% 725 -13% 747 3% 709 -5% 757 7%
Shareholders' equity opening 8,564 14% 10,359 21% 9,650 -7% 11,325 17% 13,262 17%
Net income 2,163 1,346 -38% 2,535 88% 2,845 12% 3,164 11%
Dividends -655 -781 19% -859 10% -909 6% -1,004 10%
Other 287 -1,274 0 0 0
Shareholders' equity close 10,359 21% 9,650 -7% 11,325 17% 13,262 17% 15,422 16%
Financials
Initiating Coverage
6 August 2014
page 81 of 116 , Equity Analyst, 44 (0) 20 7029 8784, [email protected] Cathcart
Please see important disclosure information on pages 113 - 116 of this report.
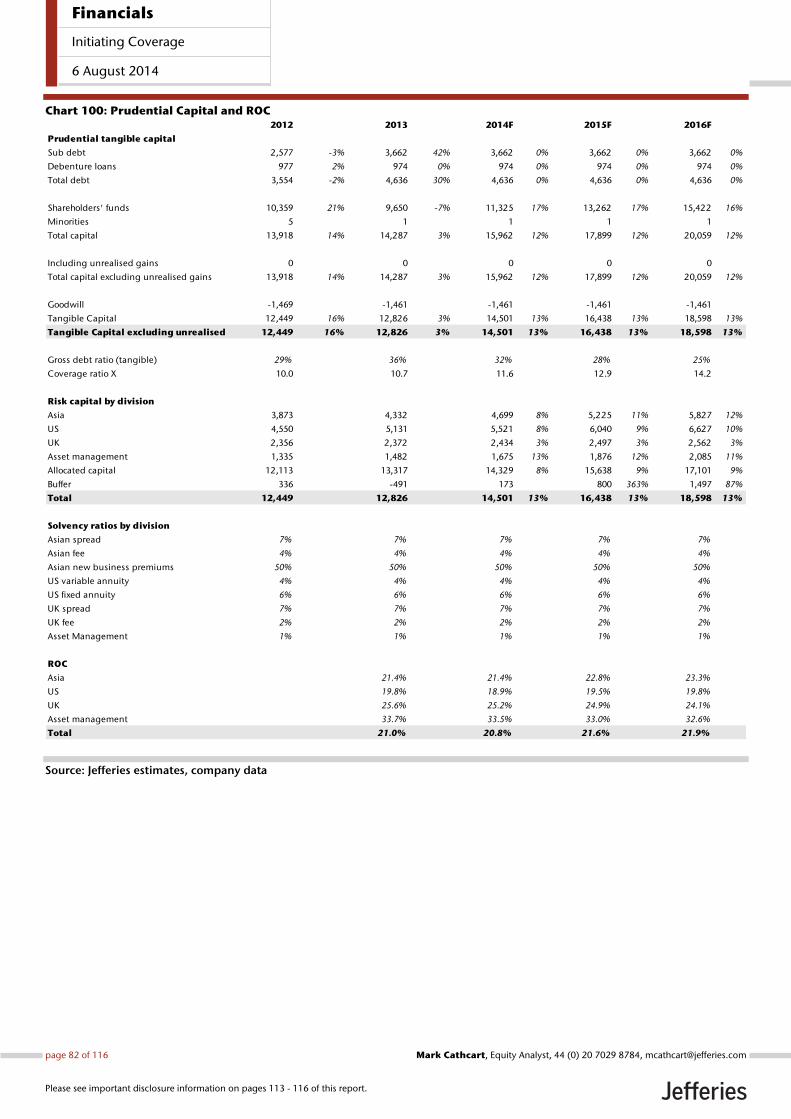
Chart 100: Prudential Capital and ROC
Source: Jefferies estimates, company data
2012 2013 2014F 2015F 2016F
Prudential tangible capital
Sub debt 2,577 -3% 3,662 42% 3,662 0% 3,662 0% 3,662 0%
Debenture loans 977 2% 974 0% 974 0% 974 0% 974 0%
Total debt 3,554 -2% 4,636 30% 4,636 0% 4,636 0% 4,636 0%
Shareholders' funds 10,359 21% 9,650 -7% 11,325 17% 13,262 17% 15,422 16%
Minorities 5 1 1 1 1
Total capital 13,918 14% 14,287 3% 15,962 12% 17,899 12% 20,059 12%
Including unrealised gains 0 0 0 0 0
Total capital excluding unrealised gains 13,918 14% 14,287 3% 15,962 12% 17,899 12% 20,059 12%
Goodwill -1,469 -1,461 -1,461 -1,461 -1,461
Tangible Capital 12,449 16% 12,826 3% 14,501 13% 16,438 13% 18,598 13%
Tangible Capital excluding unrealised 12,449 16% 12,826 3% 14,501 13% 16,438 13% 18,598 13%
Gross debt ratio (tangible) 29% 36% 32% 28% 25%
Coverage ratio X 10.0 10.7 11.6 12.9 14.2
Risk capital by division
Asia 3,873 4,332 4,699 8% 5,225 11% 5,827 12%
US 4,550 5,131 5,521 8% 6,040 9% 6,627 10%
UK 2,356 2,372 2,434 3% 2,497 3% 2,562 3%
Asset management 1,335 1,482 1,675 13% 1,876 12% 2,085 11%
Allocated capital 12,113 13,317 14,329 8% 15,638 9% 17,101 9%
Buffer 336 -491 173 800 363% 1,497 87%
Total 12,449 12,826 14,501 13% 16,438 13% 18,598 13%
Solvency ratios by division
Asian spread 7% 7% 7% 7% 7%
Asian fee 4% 4% 4% 4% 4%
Asian new business premiums 50% 50% 50% 50% 50%
US variable annuity 4% 4% 4% 4% 4%
US fixed annuity 6% 6% 6% 6% 6%
UK spread 7% 7% 7% 7% 7%
UK fee 2% 2% 2% 2% 2%
Asset Management 1% 1% 1% 1% 1%
ROC
Asia 21.4% 21.4% 22.8% 23.3%
US 19.8% 18.9% 19.5% 19.8%
UK 25.6% 25.2% 24.9% 24.1%
Asset management 33.7% 33.5% 33.0% 32.6%
Total 21.0% 20.8% 21.6% 21.9%
Financials
Initiating Coverage
6 August 2014
page 82 of 116 , Equity Analyst, 44 (0) 20 7029 8784, [email protected] Cathcart
Please see important disclosure information on pages 113 - 116 of this report.
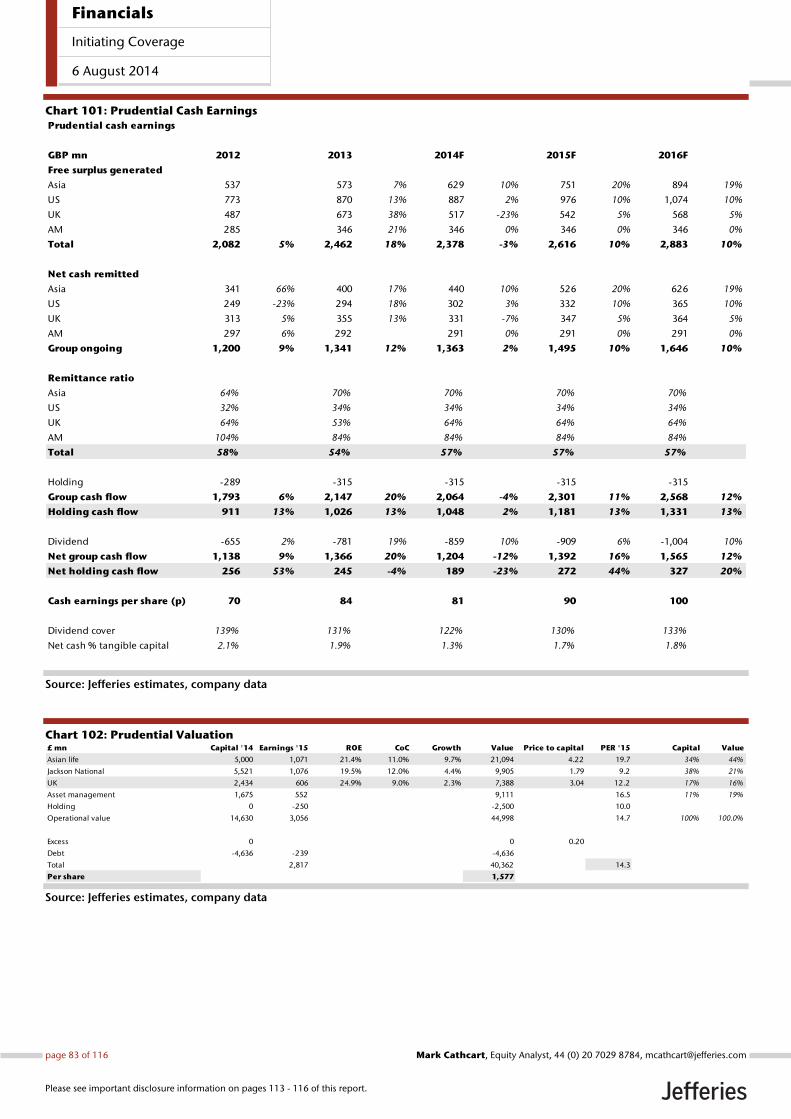
Chart 101: Prudential Cash Earnings
Source: Jefferies estimates, company data
Chart 102: Prudential Valuation
Source: Jefferies estimates, company data
Prudential cash earnings
GBP mn 2012 2013 2014F 2015F 2016F
Free surplus generated
Asia 537 573 7% 629 10% 751 20% 894 19%
US 773 870 13% 887 2% 976 10% 1,074 10%
UK 487 673 38% 517 -23% 542 5% 568 5%
AM 285 346 21% 346 0% 346 0% 346 0%
Total 2,082 5% 2,462 18% 2,378 -3% 2,616 10% 2,883 10%
Net cash remitted
Asia 341 66% 400 17% 440 10% 526 20% 626 19%
US 249 -23% 294 18% 302 3% 332 10% 365 10%
UK 313 5% 355 13% 331 -7% 347 5% 364 5%
AM 297 6% 292 291 0% 291 0% 291 0%
Group ongoing 1,200 9% 1,341 12% 1,363 2% 1,495 10% 1,646 10%
Remittance ratio
Asia 64% 70% 70% 70% 70%
US 32% 34% 34% 34% 34%
UK 64% 53% 64% 64% 64%
AM 104% 84% 84% 84% 84%
Total 58% 54% 57% 57% 57%
Holding -289 -315 -315 -315 -315
Group cash flow 1,793 6% 2,147 20% 2,064 -4% 2,301 11% 2,568 12%
Holding cash flow 911 13% 1,026 13% 1,048 2% 1,181 13% 1,331 13%
Dividend -655 2% -781 19% -859 10% -909 6% -1,004 10%
Net group cash flow 1,138 9% 1,366 20% 1,204 -12% 1,392 16% 1,565 12%
Net holding cash flow 256 53% 245 -4% 189 -23% 272 44% 327 20%
Cash earnings per share (p) 70 84 81 90 100
Dividend cover 139% 131% 122% 130% 133%
Net cash % tangible capital 2.1% 1.9% 1.3% 1.7% 1.8%
£ mn Capital '14 Earnings '15 ROE CoC Growth Value Price to capital PER '15 Capital Value
Asian life 5,000 1,071 21.4% 11.0% 9.7% 21,094 4.22 19.7 34% 44%
Jackson National 5,521 1,076 19.5% 12.0% 4.4% 9,905 1.79 9.2 38% 21%
UK 2,434 606 24.9% 9.0% 2.3% 7,388 3.04 12.2 17% 16%
Asset management 1,675 552 9,111 16.5 11% 19%
Holding 0 -250 -2,500 10.0
Operational value 14,630 3,056 44,998 14.7 100% 100.0%
Excess 0 0 0.20
Debt -4,636 -239 -4,636
Total 2,817 40,362 14.3
Per share 1,577
Financials
Initiating Coverage
6 August 2014
page 83 of 116 , Equity Analyst, 44 (0) 20 7029 8784, [email protected] Cathcart
Please see important disclosure information on pages 113 - 116 of this report.
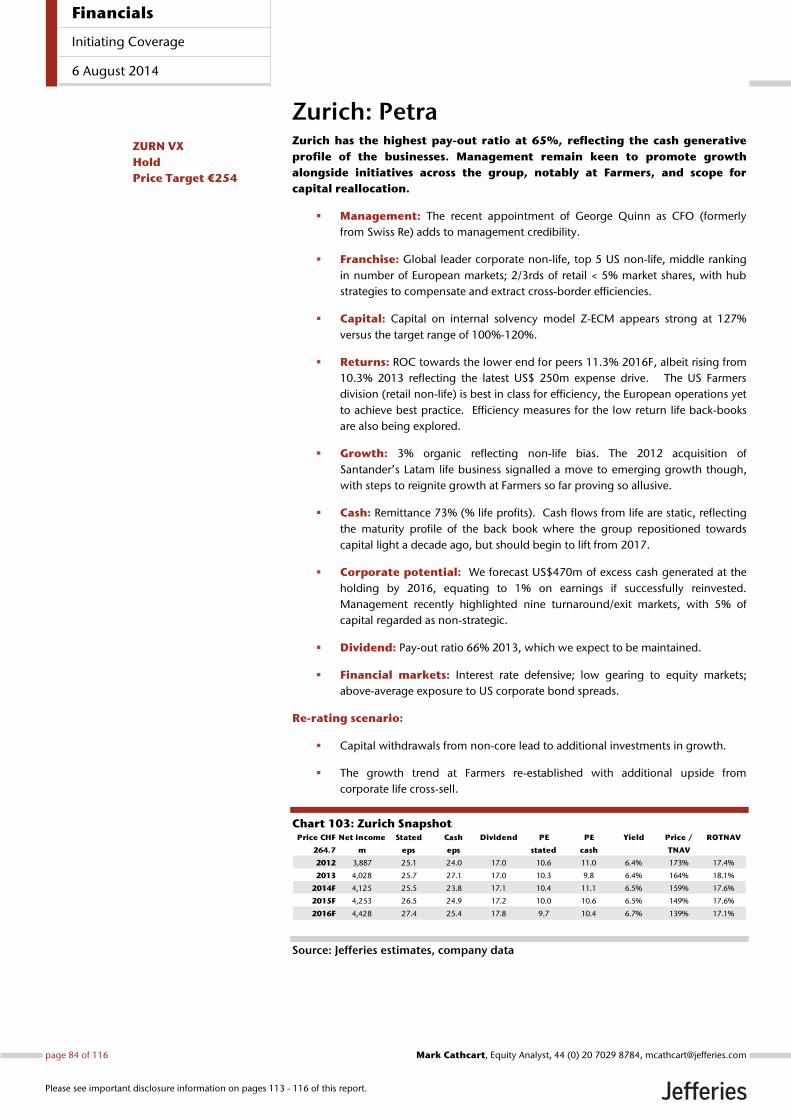
Zurich: Petra Zurich has the highest pay-out ratio at 65%, reflecting the cash generative
profile of the businesses. Management remain keen to promote growth
alongside initiatives across the group, notably at Farmers, and scope for
capital reallocation.
Management: The recent appointment of George Quinn as CFO (formerly
from Swiss Re) adds to management credibility.
Franchise: Global leader corporate non-life, top 5 US non-life, middle ranking
in number of European markets; 2/3rds of retail < 5% market shares, with hub
strategies to compensate and extract cross-border efficiencies.
Capital: Capital on internal solvency model Z-ECM appears strong at 127%
versus the target range of 100%-120%.
Returns: ROC towards the lower end for peers 11.3% 2016F, albeit rising from
10.3% 2013 reflecting the latest US$ 250m expense drive. The US Farmers
division (retail non-life) is best in class for efficiency, the European operations yet
to achieve best practice. Efficiency measures for the low return life back-books
are also being explored.
Growth: 3% organic reflecting non-life bias. The 2012 acquisition of
Santander’s Latam life business signalled a move to emerging growth though,
with steps to reignite growth at Farmers so far proving so allusive.
Cash: Remittance 73% (% life profits). Cash flows from life are static, reflecting
the maturity profile of the back book where the group repositioned towards
capital light a decade ago, but should begin to lift from 2017.
Corporate potential: We forecast US$470m of excess cash generated at the
holding by 2016, equating to 1% on earnings if successfully reinvested.
Management recently highlighted nine turnaround/exit markets, with 5% of
capital regarded as non-strategic.
Dividend: Pay-out ratio 66% 2013, which we expect to be maintained.
Financial markets: Interest rate defensive; low gearing to equity markets;
above-average exposure to US corporate bond spreads.
Re-rating scenario:
Capital withdrawals from non-core lead to additional investments in growth.
The growth trend at Farmers re-established with additional upside from
corporate life cross-sell.
Chart 103: Zurich Snapshot
Source: Jefferies estimates, company data
Price CHF Net income Stated Cash Dividend PE PE Yield Price / ROTNAV
264.7 m eps eps stated cash TNAV
2012 3,887 25.1 24.0 17.0 10.6 11.0 6.4% 173% 17.4%
2013 4,028 25.7 27.1 17.0 10.3 9.8 6.4% 164% 18.1%
2014F 4,125 25.5 23.8 17.1 10.4 11.1 6.5% 159% 17.6%
2015F 4,253 26.5 24.9 17.2 10.0 10.6 6.5% 149% 17.6%
2016F 4,428 27.4 25.4 17.8 9.7 10.4 6.7% 139% 17.1%
ZURN VX
Hold
Price Target €254
Financials
Initiating Coverage
6 August 2014
page 84 of 116 , Equity Analyst, 44 (0) 20 7029 8784, [email protected] Cathcart
Please see important disclosure information on pages 113 - 116 of this report.
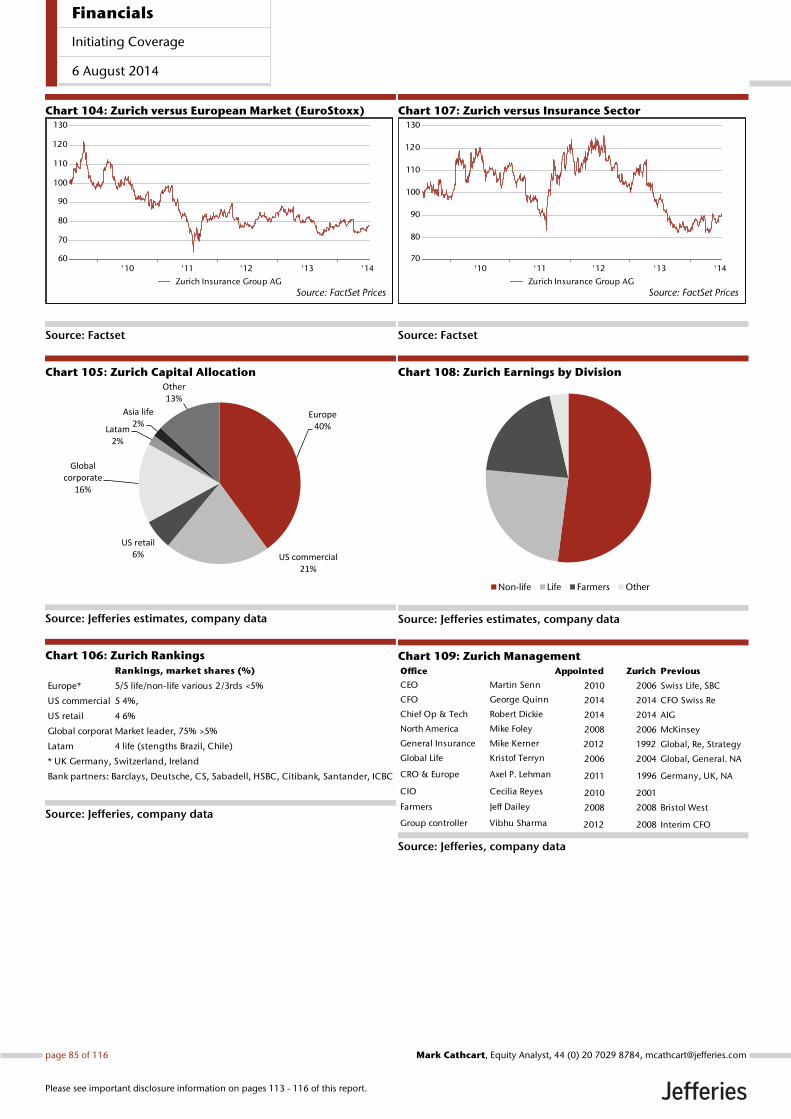
Chart 104: Zurich versus European Market (EuroStoxx)
Source: Factset
Chart 105: Zurich Capital Allocation
Source: Jefferies estimates, company data
Chart 106: Zurich Rankings
Source: Jefferies, company data
Chart 107: Zurich versus Insurance Sector
Source: Factset
Chart 108: Zurich Earnings by Division
Source: Jefferies estimates, company data
Chart 109: Zurich Management
Source: Jefferies, company data
'10 '11 '12 '13 '1460
70
80
90
100
110
120
130
Source: FactSet PricesZurich Insurance Group AG
Europe40%
US commercial 21%
US retail6%
Global corporate
16%
Latam 2%
Asia life2%
Other13%
Rankings, market shares (%)
Europe* 5/5 life/non-life various 2/3rds <5%
US commercial 5 4%,
US retail 4 6%
Global corporateMarket leader, 75% >5%
Latam 4 life (stengths Brazil, Chile)
* UK Germany, Switzerland, Ireland
Bank partners: Barclays, Deutsche, CS, Sabadell, HSBC, Citibank, Santander, ICBC
'10 '11 '12 '13 '1470
80
90
100
110
120
130
Source: FactSet PricesZurich Insurance Group AG
Non-life Life Farmers Other
Office Appointed Zurich Previous
CEO Martin Senn 2010 2006 Swiss Life, SBC
CFO George Quinn 2014 2014 CFO Swiss Re
Chief Op & Tech Robert Dickie 2014 2014 AIG
North America Mike Foley 2008 2006 McKinsey
General Insurance Mike Kerner 2012 1992 Global, Re, Strategy
Global Life Kristof Terryn 2006 2004 Global, General. NA
CRO & Europe Axel P. Lehman 2011 1996 Germany, UK, NA
CIO Cecilia Reyes 2010 2001
Farmers Jeff Dailey 2008 2008 Bristol West
Group controller Vibhu Sharma 2012 2008 Interim CFO
Financials
Initiating Coverage
6 August 2014
page 85 of 116 , Equity Analyst, 44 (0) 20 7029 8784, [email protected] Cathcart
Please see important disclosure information on pages 113 - 116 of this report.
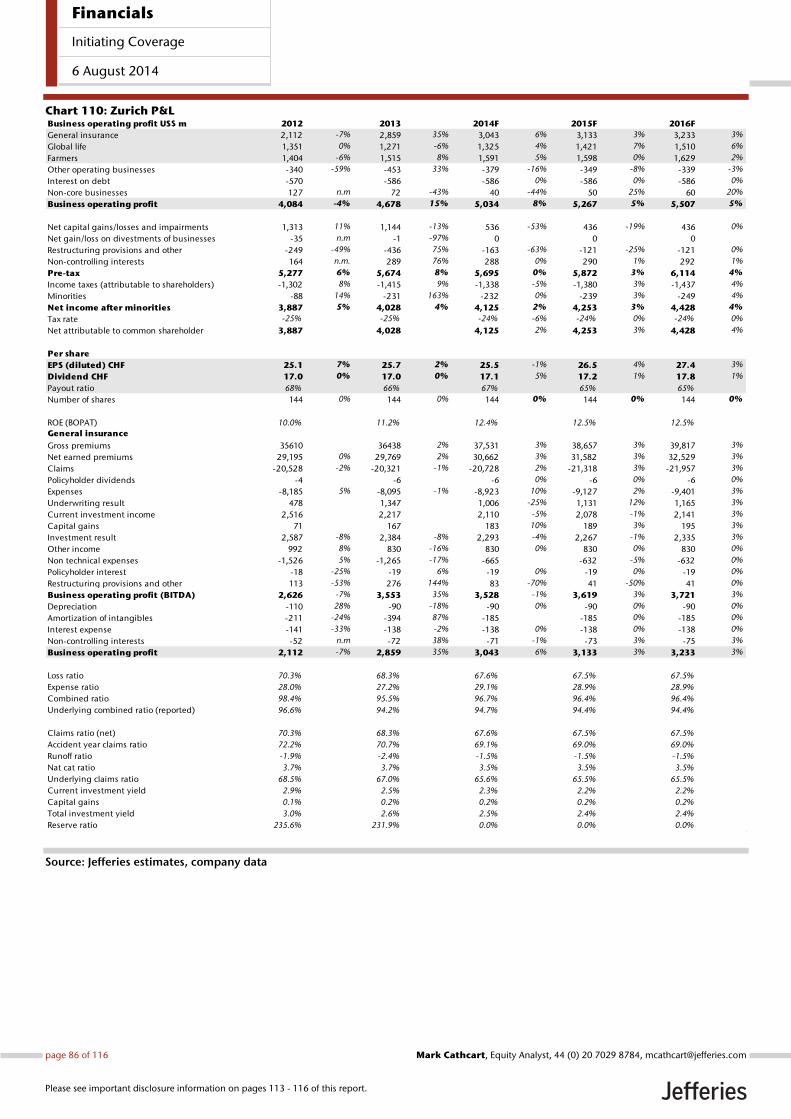
Chart 110: Zurich P&L
Source: Jefferies estimates, company data
Business operating profit US$ m 2012 2013 2014F 2015F 2016F
General insurance 2,112 -7% 2,859 35% 3,043 6% 3,133 3% 3,233 3%
Global life 1,351 0% 1,271 -6% 1,325 4% 1,421 7% 1,510 6%
Farmers 1,404 -6% 1,515 8% 1,591 5% 1,598 0% 1,629 2%
Other operating businesses -340 -59% -453 33% -379 -16% -349 -8% -339 -3%
Interest on debt -570 -586 -586 0% -586 0% -586 0%
Non-core businesses 127 n.m 72 -43% 40 -44% 50 25% 60 20%
Business operating profit 4,084 -4% 4,678 15% 5,034 8% 5,267 5% 5,507 5%
Net capital gains/losses and impairments 1,313 11% 1,144 -13% 536 -53% 436 -19% 436 0%
Net gain/loss on divestments of businesses -35 n.m -1 -97% 0 0 0
Restructuring provisions and other -249 -49% -436 75% -163 -63% -121 -25% -121 0%
Non-controlling interests 164 n.m. 289 76% 288 0% 290 1% 292 1%
Pre-tax 5,277 6% 5,674 8% 5,695 0% 5,872 3% 6,114 4%
Income taxes (attributable to shareholders) -1,302 8% -1,415 9% -1,338 -5% -1,380 3% -1,437 4%
Minorities -88 14% -231 163% -232 0% -239 3% -249 4%
Net income after minorities 3,887 5% 4,028 4% 4,125 2% 4,253 3% 4,428 4%
Tax rate -25% -25% -24% -6% -24% 0% -24% 0%
Net attributable to common shareholder 3,887 4,028 4,125 2% 4,253 3% 4,428 4%
Per share
EPS (diluted) CHF 25.1 7% 25.7 2% 25.5 -1% 26.5 4% 27.4 3%
Dividend CHF 17.0 0% 17.0 0% 17.1 5% 17.2 1% 17.8 1%
Payout ratio 68% 66% 67% 65% 65%
Number of shares 144 0% 144 0% 144 0% 144 0% 144 0%
ROE (BOPAT) 10.0% 11.2% 12.4% 12.5% 12.5%
General insurance
Gross premiums 35610 36438 2% 37,531 3% 38,657 3% 39,817 3%
Net earned premiums 29,195 0% 29,769 2% 30,662 3% 31,582 3% 32,529 3%
Claims -20,528 -2% -20,321 -1% -20,728 2% -21,318 3% -21,957 3%
Policyholder dividends -4 -6 -6 0% -6 0% -6 0%
Expenses -8,185 5% -8,095 -1% -8,923 10% -9,127 2% -9,401 3%
Underwriting result 478 1,347 1,006 -25% 1,131 12% 1,165 3%
Current investment income 2,516 2,217 2,110 -5% 2,078 -1% 2,141 3%
Capital gains 71 167 183 10% 189 3% 195 3%
Investment result 2,587 -8% 2,384 -8% 2,293 -4% 2,267 -1% 2,335 3%
Other income 992 8% 830 -16% 830 0% 830 0% 830 0%
Non technical expenses -1,526 5% -1,265 -17% -665 -632 -5% -632 0%
Policyholder interest -18 -25% -19 6% -19 0% -19 0% -19 0%
Restructuring provisions and other 113 -53% 276 144% 83 -70% 41 -50% 41 0%
Business operating profit (BITDA) 2,626 -7% 3,553 35% 3,528 -1% 3,619 3% 3,721 3%
Depreciation -110 28% -90 -18% -90 0% -90 0% -90 0%
Amortization of intangibles -211 -24% -394 87% -185 -185 0% -185 0%
Interest expense -141 -33% -138 -2% -138 0% -138 0% -138 0%
Non-controlling interests -52 n.m -72 38% -71 -1% -73 3% -75 3%
Business operating profit 2,112 -7% 2,859 35% 3,043 6% 3,133 3% 3,233 3%
Loss ratio 70.3% 68.3% 67.6% 67.5% 67.5%
Expense ratio 28.0% 27.2% 29.1% 28.9% 28.9%
Combined ratio 98.4% 95.5% 96.7% 96.4% 96.4%
Underlying combined ratio (reported) 96.6% 94.2% 94.7% 94.4% 94.4%
Claims ratio (net) 70.3% 68.3% 67.6% 67.5% 67.5%
Accident year claims ratio 72.2% 70.7% 69.1% 69.0% 69.0%
Runoff ratio -1.9% -2.4% -1.5% -1.5% -1.5%
Nat cat ratio 3.7% 3.7% 3.5% 3.5% 3.5%
Underlying claims ratio 68.5% 67.0% 65.6% 65.5% 65.5%
Current investment yield 2.9% 2.5% 2.3% 2.2% 2.2%
Capital gains 0.1% 0.2% 0.2% 0.2% 0.2%
Total investment yield 3.0% 2.6% 2.5% 2.4% 2.4%
Reserve ratio 235.6% 231.9% 0.0% 0.0% 0.0%
Financials
Initiating Coverage
6 August 2014
page 86 of 116 , Equity Analyst, 44 (0) 20 7029 8784, [email protected] Cathcart
Please see important disclosure information on pages 113 - 116 of this report.
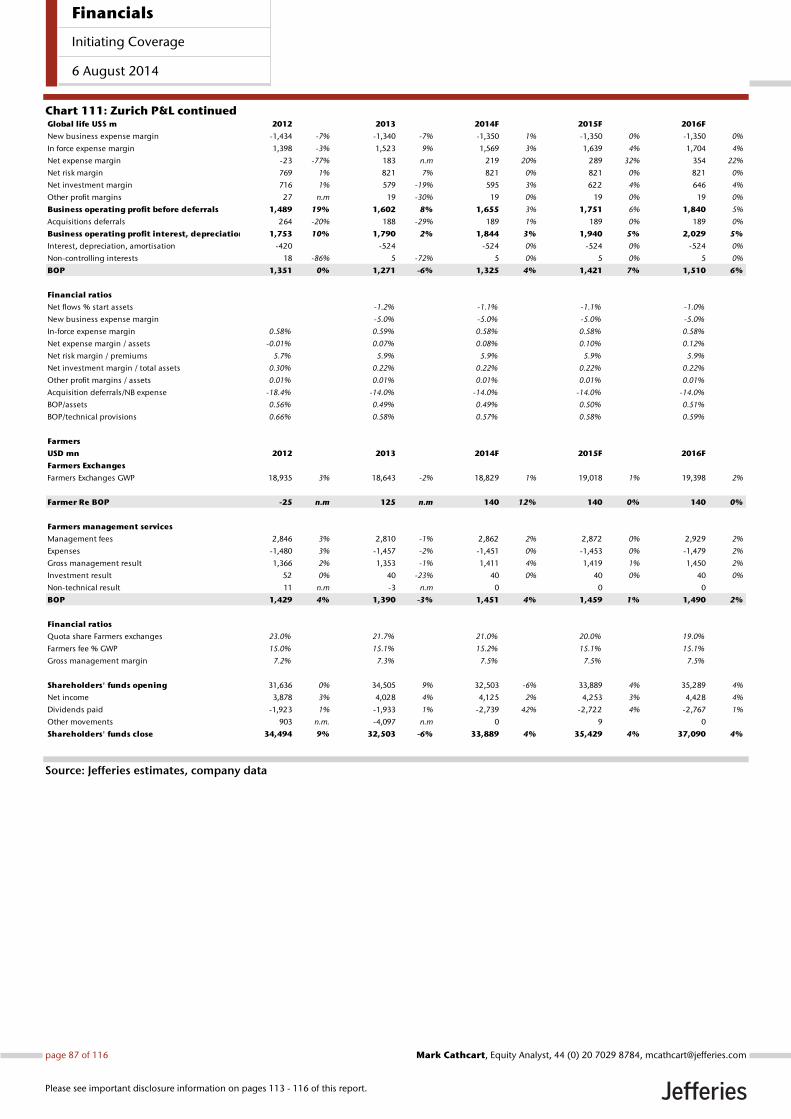
Chart 111: Zurich P&L continued
Source: Jefferies estimates, company data
Global life US$ m 2012 2013 2014F 2015F 2016F
New business expense margin -1,434 -7% -1,340 -7% -1,350 1% -1,350 0% -1,350 0%
In force expense margin 1,398 -3% 1,523 9% 1,569 3% 1,639 4% 1,704 4%
Net expense margin -23 -77% 183 n.m 219 20% 289 32% 354 22%
Net risk margin 769 1% 821 7% 821 0% 821 0% 821 0%
Net investment margin 716 1% 579 -19% 595 3% 622 4% 646 4%
Other profit margins 27 n.m 19 -30% 19 0% 19 0% 19 0%
Business operating profit before deferrals 1,489 19% 1,602 8% 1,655 3% 1,751 6% 1,840 5%
Acquisitions deferrals 264 -20% 188 -29% 189 1% 189 0% 189 0%
Business operating profit interest, depreciation 1,753 10% 1,790 2% 1,844 3% 1,940 5% 2,029 5%
Interest, depreciation, amortisation -420 -524 -524 0% -524 0% -524 0%
Non-controlling interests 18 -86% 5 -72% 5 0% 5 0% 5 0%
BOP 1,351 0% 1,271 -6% 1,325 4% 1,421 7% 1,510 6%
Financial ratios
Net flows % start assets -1.2% -1.1% -1.1% -1.0%
New business expense margin -5.0% -5.0% -5.0% -5.0%
In-force expense margin 0.58% 0.59% 0.58% 0.58% 0.58%
Net expense margin / assets -0.01% 0.07% 0.08% 0.10% 0.12%
Net risk margin / premiums 5.7% 5.9% 5.9% 5.9% 5.9%
Net investment margin / total assets 0.30% 0.22% 0.22% 0.22% 0.22%
Other profit margins / assets 0.01% 0.01% 0.01% 0.01% 0.01%
Acquisition deferrals/NB expense -18.4% -14.0% -14.0% -14.0% -14.0%
BOP/assets 0.56% 0.49% 0.49% 0.50% 0.51%
BOP/technical provisions 0.66% 0.58% 0.57% 0.58% 0.59%
Farmers
USD mn 2012 2013 2014F 2015F 2016F
Farmers Exchanges
Farmers Exchanges GWP 18,935 3% 18,643 -2% 18,829 1% 19,018 1% 19,398 2%
Farmer Re BOP -25 n.m 125 n.m 140 12% 140 0% 140 0%
Farmers management services
Management fees 2,846 3% 2,810 -1% 2,862 2% 2,872 0% 2,929 2%
Expenses -1,480 3% -1,457 -2% -1,451 0% -1,453 0% -1,479 2%
Gross management result 1,366 2% 1,353 -1% 1,411 4% 1,419 1% 1,450 2%
Investment result 52 0% 40 -23% 40 0% 40 0% 40 0%
Non-technical result 11 n.m -3 n.m 0 0 0
BOP 1,429 4% 1,390 -3% 1,451 4% 1,459 1% 1,490 2%
Financial ratios
Quota share Farmers exchanges 23.0% 21.7% 21.0% 20.0% 19.0%
Farmers fee % GWP 15.0% 15.1% 15.2% 15.1% 15.1%
Gross management margin 7.2% 7.3% 7.5% 7.5% 7.5%
Shareholders' funds opening 31,636 0% 34,505 9% 32,503 -6% 33,889 4% 35,289 4%
Net income 3,878 3% 4,028 4% 4,125 2% 4,253 3% 4,428 4%
Dividends paid -1,923 1% -1,933 1% -2,739 42% -2,722 4% -2,767 1%
Other movements 903 n.m. -4,097 n.m 0 9 0
Shareholders' funds close 34,494 9% 32,503 -6% 33,889 4% 35,429 4% 37,090 4%
Financials
Initiating Coverage
6 August 2014
page 87 of 116 , Equity Analyst, 44 (0) 20 7029 8784, [email protected] Cathcart
Please see important disclosure information on pages 113 - 116 of this report.
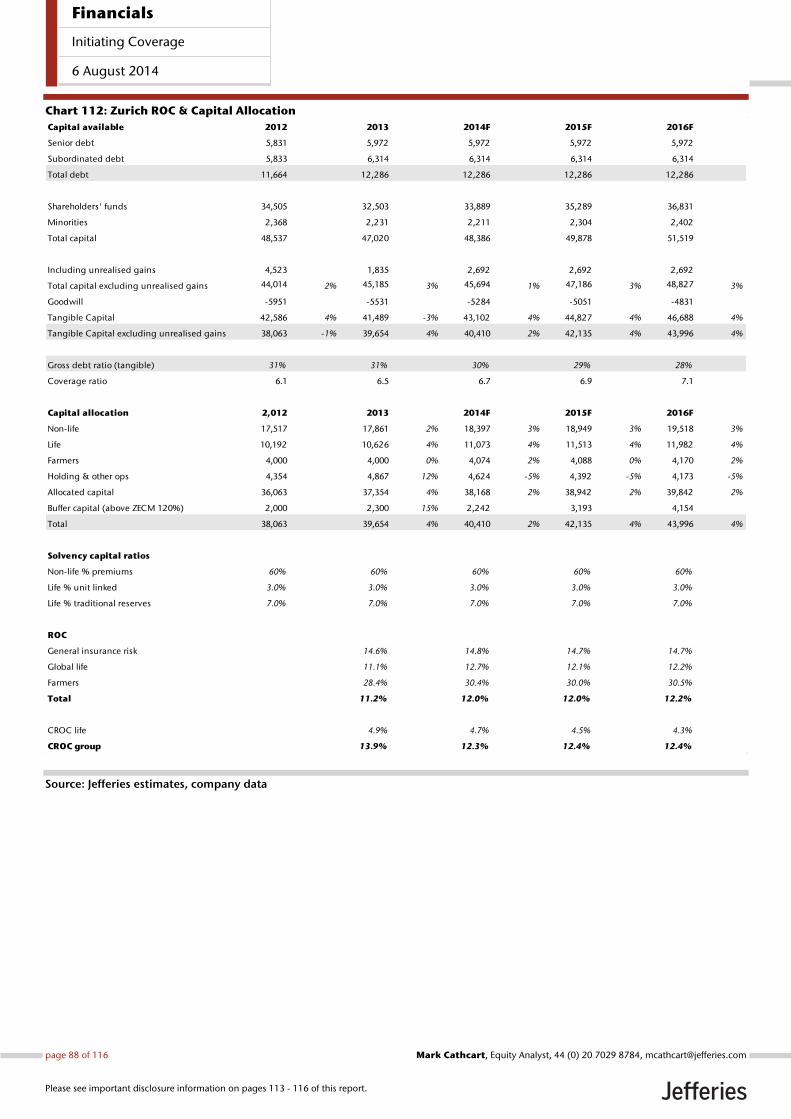
Chart 112: Zurich ROC & Capital Allocation
Source: Jefferies estimates, company data
Capital available 2012 2013 2014F 2015F 2016F
Senior debt 5,831 5,972 5,972 5,972 5,972
Subordinated debt 5,833 6,314 6,314 6,314 6,314
Total debt 11,664 12,286 12,286 12,286 12,286
Shareholders' funds 34,505 32,503 33,889 35,289 36,831
Minorities 2,368 2,231 2,211 2,304 2,402
Total capital 48,537 47,020 48,386 49,878 51,519
Including unrealised gains 4,523 1,835 2,692 2,692 2,692
Total capital excluding unrealised gains 44,014 2% 45,185 3% 45,694 1% 47,186 3% 48,827 3%
Goodwill -5951 -5531 -5284 -5051 -4831
Tangible Capital 42,586 4% 41,489 -3% 43,102 4% 44,827 4% 46,688 4%
Tangible Capital excluding unrealised gains 38,063 -1% 39,654 4% 40,410 2% 42,135 4% 43,996 4%
Gross debt ratio (tangible) 31% 31% 30% 29% 28%
Coverage ratio 6.1 6.5 6.7 6.9 7.1
Capital allocation 2,012 2013 2014F 2015F 2016F
Non-life 17,517 17,861 2% 18,397 3% 18,949 3% 19,518 3%
Life 10,192 10,626 4% 11,073 4% 11,513 4% 11,982 4%
Farmers 4,000 4,000 0% 4,074 2% 4,088 0% 4,170 2%
Holding & other ops 4,354 4,867 12% 4,624 -5% 4,392 -5% 4,173 -5%
Allocated capital 36,063 37,354 4% 38,168 2% 38,942 2% 39,842 2%
Buffer capital (above ZECM 120%) 2,000 2,300 15% 2,242 3,193 4,154
Total 38,063 39,654 4% 40,410 2% 42,135 4% 43,996 4%
Solvency capital ratios
Non-life % premiums 60% 60% 60% 60% 60%
Life % unit linked 3.0% 3.0% 3.0% 3.0% 3.0%
Life % traditional reserves 7.0% 7.0% 7.0% 7.0% 7.0%
ROC
General insurance risk 14.6% 14.8% 14.7% 14.7%
Global life 11.1% 12.7% 12.1% 12.2%
Farmers 28.4% 30.4% 30.0% 30.5%
Total 11.2% 12.0% 12.0% 12.2%
CROC life 4.9% 4.7% 4.5% 4.3%
CROC group 13.9% 12.3% 12.4% 12.4%
Financials
Initiating Coverage
6 August 2014
page 88 of 116 , Equity Analyst, 44 (0) 20 7029 8784, [email protected] Cathcart
Please see important disclosure information on pages 113 - 116 of this report.
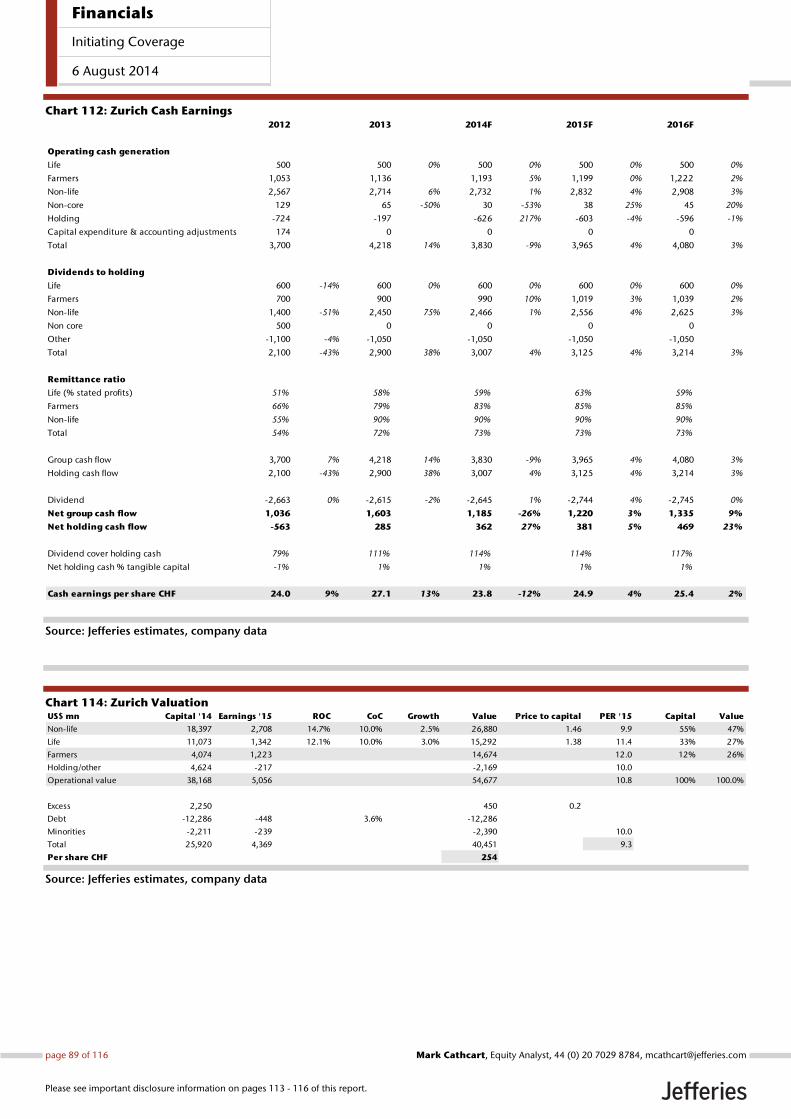
Chart 112: Zurich Cash Earnings
Source: Jefferies estimates, company data
Chart 114: Zurich Valuation
Source: Jefferies estimates, company data
2012 2013 2014F 2015F 2016F
Operating cash generation
Life 500 500 0% 500 0% 500 0% 500 0%
Farmers 1,053 1,136 1,193 5% 1,199 0% 1,222 2%
Non-life 2,567 2,714 6% 2,732 1% 2,832 4% 2,908 3%
Non-core 129 65 -50% 30 -53% 38 25% 45 20%
Holding -724 -197 -626 217% -603 -4% -596 -1%
Capital expenditure & accounting adjustments 174 0 0 0 0
Total 3,700 4,218 14% 3,830 -9% 3,965 4% 4,080 3%
Dividends to holding
Life 600 -14% 600 0% 600 0% 600 0% 600 0%
Farmers 700 900 990 10% 1,019 3% 1,039 2%
Non-life 1,400 -51% 2,450 75% 2,466 1% 2,556 4% 2,625 3%
Non core 500 0 0 0 0
Other -1,100 -4% -1,050 -1,050 -1,050 -1,050
Total 2,100 -43% 2,900 38% 3,007 4% 3,125 4% 3,214 3%
Remittance ratio
Life (% stated profits) 51% 58% 59% 63% 59%
Farmers 66% 79% 83% 85% 85%
Non-life 55% 90% 90% 90% 90%
Total 54% 72% 73% 73% 73%
Group cash flow 3,700 7% 4,218 14% 3,830 -9% 3,965 4% 4,080 3%
Holding cash flow 2,100 -43% 2,900 38% 3,007 4% 3,125 4% 3,214 3%
Dividend -2,663 0% -2,615 -2% -2,645 1% -2,744 4% -2,745 0%
Net group cash flow 1,036 1,603 1,185 -26% 1,220 3% 1,335 9%
Net holding cash flow -563 285 362 27% 381 5% 469 23%
Dividend cover holding cash 79% 111% 114% 114% 117%
Net holding cash % tangible capital -1% 1% 1% 1% 1%
Cash earnings per share CHF 24.0 9% 27.1 13% 23.8 -12% 24.9 4% 25.4 2%
US$ mn Capital '14 Earnings '15 ROC CoC Growth Value Price to capital PER '15 Capital Value
Non-life 18,397 2,708 14.7% 10.0% 2.5% 26,880 1.46 9.9 55% 47%
Life 11,073 1,342 12.1% 10.0% 3.0% 15,292 1.38 11.4 33% 27%
Farmers 4,074 1,223 14,674 12.0 12% 26%
Holding/other 4,624 -217 -2,169 10.0
Operational value 38,168 5,056 54,677 10.8 100% 100.0%
Excess 2,250 450 0.2
Debt -12,286 -448 3.6% -12,286
Minorities -2,211 -239 -2,390 10.0
Total 25,920 4,369 40,451 9.3
Per share CHF 254
Financials
Initiating Coverage
6 August 2014
page 89 of 116 , Equity Analyst, 44 (0) 20 7029 8784, [email protected] Cathcart
Please see important disclosure information on pages 113 - 116 of this report.
Appendix 1: Capital Allocation
‘Solvency 7’ To compensate for the current absence of capital splits of Solvency II
(life/non-life), we have constructed a simple factor-based approach to match
capital by business not to economic solvency but to the tangible capital base
of each company (shareholders’ funds plus debt less goodwill and VIF).
Solvency II disclosures give limited information of capital splits between the operating
units. The difficulty for the analyst is how to allocate the capital where economic solvency
splits given by the companies do not always match the life/non-life split. To
circumnavigate the hugely complex solvency modelling required by economic solvency,
we construct Solvency7. The homogenous nature of the insurance sector in terms of
asset risk (driven by the more stringent demands of Solvency II where the investment
composition of portfolios at all the companies is now broadly similar) and product design
(where the guarantee profile of the life business has been substantially reduced at all of
the companies) actually lends itself back to the old factor method of Solvency 1, applying
a straight percentage to liabilities.
Solvency 1 demanded a minimum capital base of 4%/0.5% of traditional/unit-linked life
reserves, plus a pre-determined percentage of the non-life premium base dependent on
lines of business. Analyst and company reports in the 1990s pre economic solvency
typically applied a comfort margin to these levels with the capital base constructed at
6%/1% of traditional/unit linked life reserves capital and 40%-70% of the non-life
premium base.
Based on this factor approach for each company, and for the more stringent demands
from Solvency II, we have applied higher factors: 7%/2% of traditional/unit linked reserves
(4%-6%/7%-8% for US variable/fixed annuities), 50%-80% of non-life premiums (lower
for retail non-auto, higher for long tail commercial), and 0.5%-1% for third-party assets.
Specifically, at Zurich for Farmers we have used the US$2bn as deducted from Z-ECM
(Zurich’s internal model); at Prudential we have taken into account the non-life element
of the health riders attached to the life policies and the extra capital set aside for ongoing
investment in the region; at Allianz, AXA and Generali we have incorporated into the
capital base the free RfB component of policyholder funds, which on our understanding
can count as local and rating agency capital.
Using this method, we are more or less able to match the derived capital base in each case
with the tangible capital base of the companies, or with a slight comfort margin (the
earlier individual company sections show greater detail on the breakdown and
progression of the capital allocated). We show Generali as an example here. This seems
to tie in with the guidance given to us by the various management teams, where Solvency
II ratios (calculated completely differently) are mainly sitting within 10%-20% (per cent
not points) comfort margins above targeted levels. AEGON is the exception, appearing
comfortably capitalised on this simple factor-based approach. The difference is explained
by AEGON’s US overweight denying the group the level of diversification benefits that can
be afforded to the peer group.
The purpose of Solvency7 is to facilitate a capital split for return assessment and valuation
purposes in this report, not per se to assess capital strength of the companies, where any
conclusions are bound to be at best suspect given the array of complications within any
valuation of risk evolution (life guarantees are just one obscure hurdle). We show
Generali as an example, with Solvency 7 splits given in the same detail in the earlier
company sections.
Limited economic solvency
disclosure on divisional capital
We allocate capital on a simple
factor-based approach
Matching this to the tangible equity
base of the group
Financials
Initiating Coverage
6 August 2014
page 90 of 116 , Equity Analyst, 44 (0) 20 7029 8784, [email protected] Cathcart
Please see important disclosure information on pages 113 - 116 of this report.
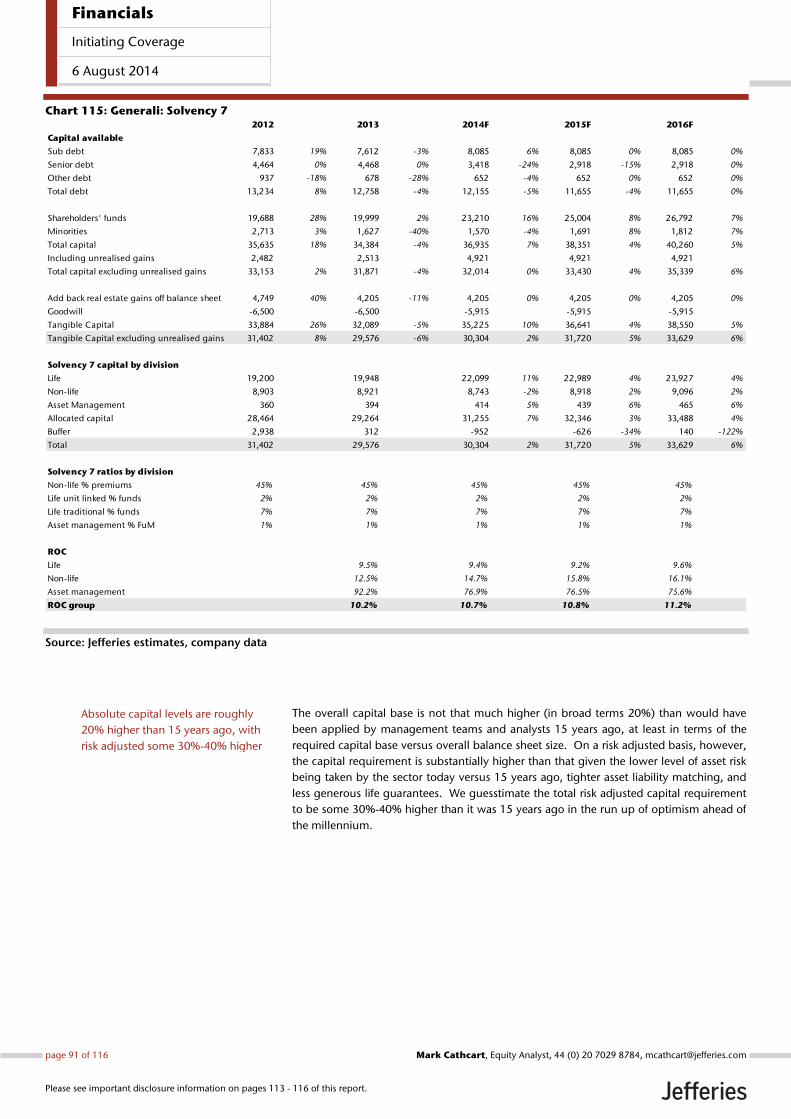
Chart 115: Generali: Solvency 7
Source: Jefferies estimates, company data
The overall capital base is not that much higher (in broad terms 20%) than would have
been applied by management teams and analysts 15 years ago, at least in terms of the
required capital base versus overall balance sheet size. On a risk adjusted basis, however,
the capital requirement is substantially higher than that given the lower level of asset risk
being taken by the sector today versus 15 years ago, tighter asset liability matching, and
less generous life guarantees. We guesstimate the total risk adjusted capital requirement
to be some 30%-40% higher than it was 15 years ago in the run up of optimism ahead of
the millennium.
2012 2013 2014F 2015F 2016F
Capital available
Sub debt 7,833 19% 7,612 -3% 8,085 6% 8,085 0% 8,085 0%
Senior debt 4,464 0% 4,468 0% 3,418 -24% 2,918 -15% 2,918 0%
Other debt 937 -18% 678 -28% 652 -4% 652 0% 652 0%
Total debt 13,234 8% 12,758 -4% 12,155 -5% 11,655 -4% 11,655 0%
Shareholders' funds 19,688 28% 19,999 2% 23,210 16% 25,004 8% 26,792 7%
Minorities 2,713 3% 1,627 -40% 1,570 -4% 1,691 8% 1,812 7%
Total capital 35,635 18% 34,384 -4% 36,935 7% 38,351 4% 40,260 5%
Including unrealised gains 2,482 2,513 4,921 4,921 4,921
Total capital excluding unrealised gains 33,153 2% 31,871 -4% 32,014 0% 33,430 4% 35,339 6%
Add back real estate gains off balance sheet 4,749 40% 4,205 -11% 4,205 0% 4,205 0% 4,205 0%
Goodwill -6,500 -6,500 -5,915 -5,915 -5,915
Tangible Capital 33,884 26% 32,089 -5% 35,225 10% 36,641 4% 38,550 5%
Tangible Capital excluding unrealised gains 31,402 8% 29,576 -6% 30,304 2% 31,720 5% 33,629 6%
Solvency 7 capital by division
Life 19,200 19,948 22,099 11% 22,989 4% 23,927 4%
Non-life 8,903 8,921 8,743 -2% 8,918 2% 9,096 2%
Asset Management 360 394 414 5% 439 6% 465 6%
Allocated capital 28,464 29,264 31,255 7% 32,346 3% 33,488 4%
Buffer 2,938 312 -952 -626 -34% 140 -122%
Total 31,402 29,576 30,304 2% 31,720 5% 33,629 6%
Solvency 7 ratios by division
Non-life % premiums 45% 45% 45% 45% 45%
Life unit linked % funds 2% 2% 2% 2% 2%
Life traditional % funds 7% 7% 7% 7% 7%
Asset management % FuM 1% 1% 1% 1% 1%
ROC
Life 9.5% 9.4% 9.2% 9.6%
Non-life 12.5% 14.7% 15.8% 16.1%
Asset management 92.2% 76.9% 76.5% 75.6%
ROC group 10.2% 10.7% 10.8% 11.2%
Absolute capital levels are roughly
20% higher than 15 years ago, with
risk adjusted some 30%-40% higher
Financials
Initiating Coverage
6 August 2014
page 91 of 116 , Equity Analyst, 44 (0) 20 7029 8784, [email protected] Cathcart
Please see important disclosure information on pages 113 - 116 of this report.
Appendix 2: Valuation
Given the increased emphasis on dividends within the sector, we use dividend
discount modelling to assess the growth rates implied by the current share
prices. Our share price targets are driven from a multi-period residual return
model, useful for valuing the life business where capital levels are projected
to grow less quickly than profits (capital-light products gradually replacing
the older block of lower returning capital-heavy business).
Multi-Stage Income
Given the changing shape of the return profiles in the life business, we have adopted a
multi-stage residual income approach. Based on our allocation of tangible capital
(shareholders’ funds plus debt less goodwill), we calculate the difference between the
Return on Capital (ROC) and the Cost of Capital (CoC) until 2025, with a terminal value
for the years that follow. We add these results to the existing capital base, and deduct the
debt at face to generate our valuation of the business for the shareholder.
With limited exception, we apply a universal cost of capital (CoC) of 10% where,
excluding periods of financial market stress, the sector has generally traded on forward
PERs of 10-12x (a range that allows for token expectations of growth). To discriminate
between the various risks adds little value. What appears to be safe, at the sudden shake
of a regulator’s or politician’s hand can become suddenly less value productive, if not
redundant. 1/200-year events have been a frequent feature in recent years, challenging
the predictability of non-life risk. Financial market volatility has been an additional core
feature for the sector over the past 15 years, where inflationary and deflationary pressures
act in their different ways on life and non-life risks. Operationally, changes in distribution
and customer access on the back of big data and digitalisation are a considerable threat
and opportunity. All lines in all economies have risks that lack predictability.
The ROCs are initially based on our earnings forecasts until 2016. For the 10 years that
follow, for non-life we flex the ROC based on our combined ratio sensitivities, to allow for
medium-term competitive pressures. For life, we assume limited growth (in some cases
zero) in the projected capital base (where the older run-off books of traditional business
with higher guarantees require more capital than the newer fee-based products replacing
them) with earnings, however, that are generally rising faster. To facilitate this approach,
we use the IRRs on new business as published by the companies as guidance for the
future returns on the entire capital base. The IRR at Allianz, for example, at 11.9% (2013)
is higher than the 7.9% ROC we have for the existing business. Over time, assuming no
future margin deterioration, the ROC should theoretically rise to the IRR level. This is, of
course, a long-term evolution; in Allianz’s case a number of years given the eight-year
average duration of the portfolio. Our life ROCs projected until 2025 capture this rising
trend. We assume IRRs are calculated on similar capital requirement levels to our ROCs.
We factor in long-term growth rates according to business and geography. Possible
expense benefits from any future Ambition, Sustainability or Optimsation programmes
(which the various management teams tend to initiate every 3-5 years) are not taken into
consideration. Nor are specific attempts to beat market growth with product design or
distribution channel. In a commoditised business, such initiatives can be quickly copied
and are essential for the insurance ‘dog’ to catch its tail. The terminal growth in most
cases drops to 2%.
As an example, we show Generali, with separate sections for life and non-life detailing our
expectations for ROC development, and showing the multi stage additions to generate a
valuation for the whole. In line with our explanations above, the non-life ROE drops over
time by the equivalent of a 2 percentage point deterioration in the non-life combined
ratio (the sensitivity is given on the right hand side of the table), whereas the life ROE
gradually climbs over time towards the IRR’s currently being achieved on new business.
The climb in life ROE plus the 6% assumed annual increase in capital equates to a total
growth in profits of 7.5% per annum.
ROC versus CoC projected until
2025, plus terminal value, plus
capital less debt
CoC set at 10% for the majority of
insurance lines
ROCs based on forecasts until 2016,
with further adjustments made until
2025
IRRs used as guidance for eventual
ROCs for life
Growth rates based on market levels,
with terminal typically at 2%
We show our full valuation model for
Generali
Financials
Initiating Coverage
6 August 2014
page 92 of 116 , Equity Analyst, 44 (0) 20 7029 8784, [email protected] Cathcart
Please see important disclosure information on pages 113 - 116 of this report.
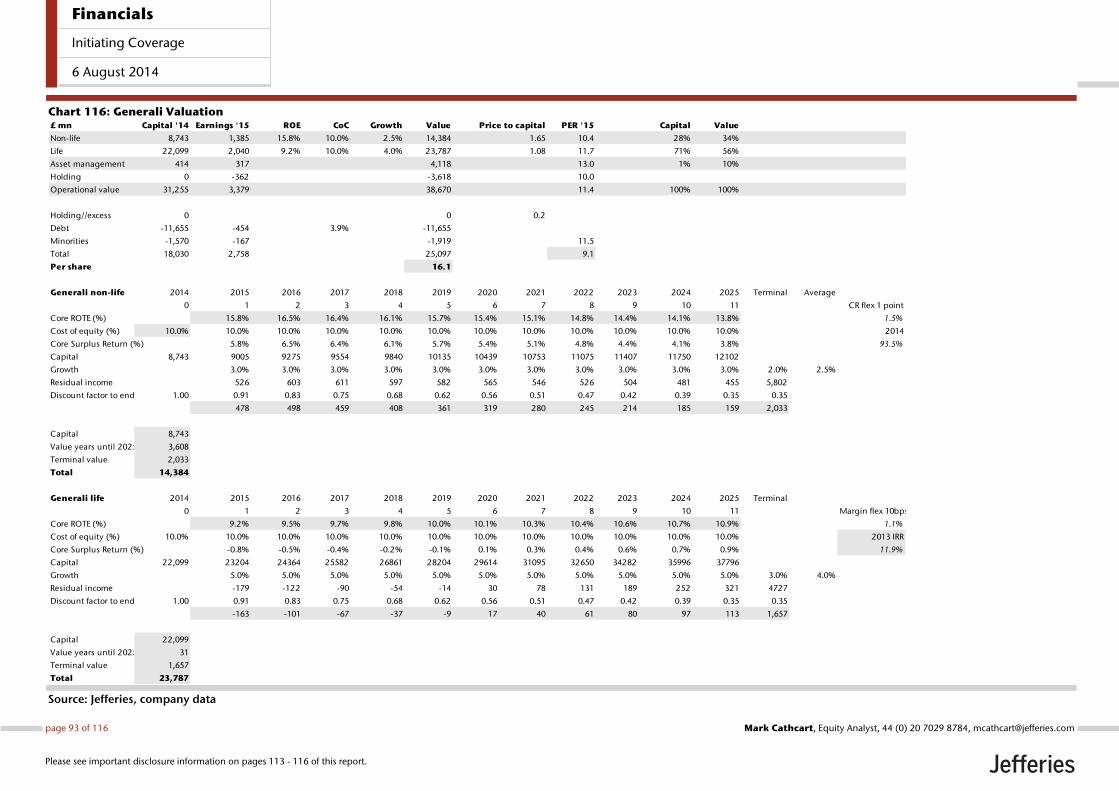
Chart 116: Generali Valuation
Source: Jefferies, company data
£ mn Capital '14 Earnings '15 ROE CoC Growth Value Price to capital PER '15 Capital Value
Non-life 8,743 1,385 15.8% 10.0% 2.5% 14,384 1.65 10.4 28% 34%
Life 22,099 2,040 9.2% 10.0% 4.0% 23,787 1.08 11.7 71% 56%
Asset management 414 317 4,118 13.0 1% 10%
Holding 0 -362 -3,618 10.0
Operational value 31,255 3,379 38,670 11.4 100% 100%
Holding//excess 0 0 0.2
Debt -11,655 -454 3.9% -11,655
Minorities -1,570 -167 -1,919 11.5
Total 18,030 2,758 25,097 9.1
Per share 16.1
Generali non-life 2014 2015 2016 2017 2018 2019 2020 2021 2022 2023 2024 2025 Terminal Average
0 1 2 3 4 5 6 7 8 9 10 11 CR flex 1 point
Core ROTE (%) 15.8% 16.5% 16.4% 16.1% 15.7% 15.4% 15.1% 14.8% 14.4% 14.1% 13.8% 1.5%
Cost of equity (%) 10.0% 10.0% 10.0% 10.0% 10.0% 10.0% 10.0% 10.0% 10.0% 10.0% 10.0% 10.0% 2014
Core Surplus Return (%) 5.8% 6.5% 6.4% 6.1% 5.7% 5.4% 5.1% 4.8% 4.4% 4.1% 3.8% 93.5%
Capital 8,743 9005 9275 9554 9840 10135 10439 10753 11075 11407 11750 12102
Growth 3.0% 3.0% 3.0% 3.0% 3.0% 3.0% 3.0% 3.0% 3.0% 3.0% 3.0% 2.0% 2.5%
Residual income 526 603 611 597 582 565 546 526 504 481 455 5,802
Discount factor to end 2012 1.00 0.91 0.83 0.75 0.68 0.62 0.56 0.51 0.47 0.42 0.39 0.35 0.35
478 498 459 408 361 319 280 245 214 185 159 2,033
Capital 8,743
Value years until 2025 3,608
Terminal value 2,033
Total 14,384
Generali life 2014 2015 2016 2017 2018 2019 2020 2021 2022 2023 2024 2025 Terminal
0 1 2 3 4 5 6 7 8 9 10 11 Margin flex 10bps
Core ROTE (%) 9.2% 9.5% 9.7% 9.8% 10.0% 10.1% 10.3% 10.4% 10.6% 10.7% 10.9% 1.1%
Cost of equity (%) 10.0% 10.0% 10.0% 10.0% 10.0% 10.0% 10.0% 10.0% 10.0% 10.0% 10.0% 10.0% 2013 IRR
Core Surplus Return (%) -0.8% -0.5% -0.4% -0.2% -0.1% 0.1% 0.3% 0.4% 0.6% 0.7% 0.9% 11.9%
Capital 22,099 23204 24364 25582 26861 28204 29614 31095 32650 34282 35996 37796
Growth 5.0% 5.0% 5.0% 5.0% 5.0% 5.0% 5.0% 5.0% 5.0% 5.0% 5.0% 3.0% 4.0%
Residual income -179 -122 -90 -54 -14 30 78 131 189 252 321 4727
Discount factor to end 2012 1.00 0.91 0.83 0.75 0.68 0.62 0.56 0.51 0.47 0.42 0.39 0.35 0.35
-163 -101 -67 -37 -9 17 40 61 80 97 113 1,657
Capital 22,099
Value years until 2025 31
Terminal value 1,657
Total 23,787
Financials
Initiating Coverage
6 August 2014
page 93 of 116 , Equity Analyst, 44 (0) 20 7029 8784, [email protected] Cathcart
Please see important disclosure information on pages 113 - 116 of this report.
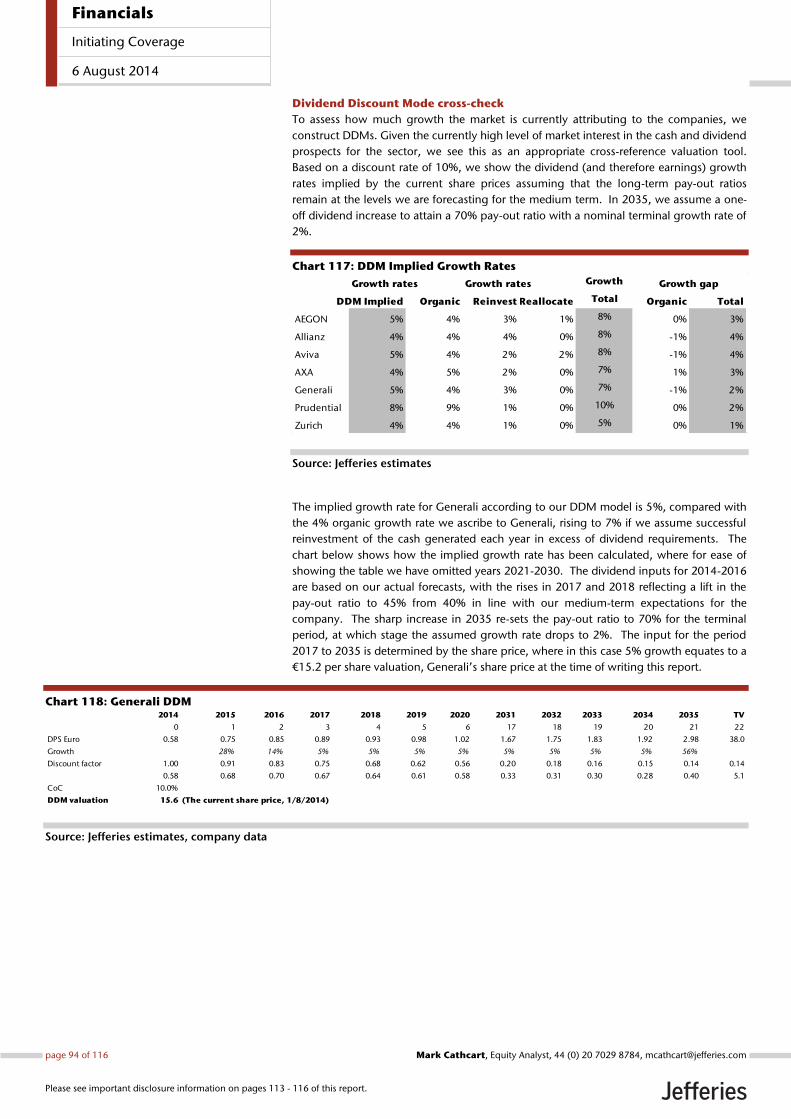
Dividend Discount Mode cross-check
To assess how much growth the market is currently attributing to the companies, we
construct DDMs. Given the currently high level of market interest in the cash and dividend
prospects for the sector, we see this as an appropriate cross-reference valuation tool.
Based on a discount rate of 10%, we show the dividend (and therefore earnings) growth
rates implied by the current share prices assuming that the long-term pay-out ratios
remain at the levels we are forecasting for the medium term. In 2035, we assume a one-
off dividend increase to attain a 70% pay-out ratio with a nominal terminal growth rate of
2%.
Chart 117: DDM Implied Growth Rates
Source: Jefferies estimates
The implied growth rate for Generali according to our DDM model is 5%, compared with
the 4% organic growth rate we ascribe to Generali, rising to 7% if we assume successful
reinvestment of the cash generated each year in excess of dividend requirements. The
chart below shows how the implied growth rate has been calculated, where for ease of
showing the table we have omitted years 2021-2030. The dividend inputs for 2014-2016
are based on our actual forecasts, with the rises in 2017 and 2018 reflecting a lift in the
pay-out ratio to 45% from 40% in line with our medium-term expectations for the
company. The sharp increase in 2035 re-sets the pay-out ratio to 70% for the terminal
period, at which stage the assumed growth rate drops to 2%. The input for the period
2017 to 2035 is determined by the share price, where in this case 5% growth equates to a
€15.2 per share valuation, Generali’s share price at the time of writing this report.
Chart 118: Generali DDM
Source: Jefferies estimates, company data
Growth rates Growth rates Growth Growth gap
DDM Implied Organic Reinvest Reallocate Total Organic Total
AEGON 5% 4% 3% 1% 8% 0% 3%
Allianz 4% 4% 4% 0% 8% -1% 4%
Aviva 5% 4% 2% 2% 8% -1% 4%
AXA 4% 5% 2% 0% 7% 1% 3%
Generali 5% 4% 3% 0% 7% -1% 2%
Prudential 8% 9% 1% 0% 10% 0% 2%
Zurich 4% 4% 1% 0% 5% 0% 1%
2014 2015 2016 2017 2018 2019 2020 2031 2032 2033 2034 2035 TV
0 1 2 3 4 5 6 17 18 19 20 21 22
DPS Euro 0.58 0.75 0.85 0.89 0.93 0.98 1.02 1.67 1.75 1.83 1.92 2.98 38.0
Growth 28% 14% 5% 5% 5% 5% 5% 5% 5% 5% 56%
Discount factor 1.00 0.91 0.83 0.75 0.68 0.62 0.56 0.20 0.18 0.16 0.15 0.14 0.14
0.58 0.68 0.70 0.67 0.64 0.61 0.58 0.33 0.31 0.30 0.28 0.40 5.1
CoC 10.0%
DDM valuation 15.6 (The current share price, 1/8/2014)
Financials
Initiating Coverage
6 August 2014
page 94 of 116 , Equity Analyst, 44 (0) 20 7029 8784, [email protected] Cathcart
Please see important disclosure information on pages 113 - 116 of this report.
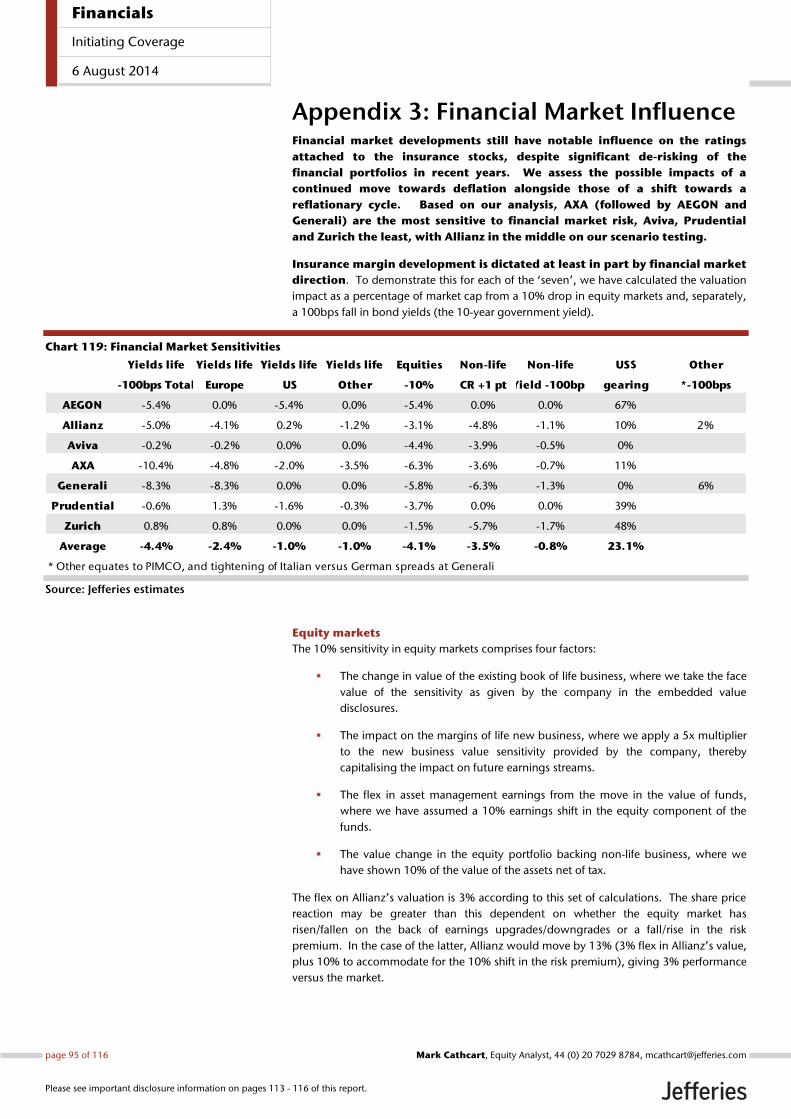
Appendix 3: Financial Market Influence Financial market developments still have notable influence on the ratings
attached to the insurance stocks, despite significant de-risking of the
financial portfolios in recent years. We assess the possible impacts of a
continued move towards deflation alongside those of a shift towards a
reflationary cycle. Based on our analysis, AXA (followed by AEGON and
Generali) are the most sensitive to financial market risk, Aviva, Prudential
and Zurich the least, with Allianz in the middle on our scenario testing.
Insurance margin development is dictated at least in part by financial market
direction. To demonstrate this for each of the ‘seven’, we have calculated the valuation
impact as a percentage of market cap from a 10% drop in equity markets and, separately,
a 100bps fall in bond yields (the 10-year government yield).
Chart 119: Financial Market Sensitivities
Source: Jefferies estimates
Equity markets
The 10% sensitivity in equity markets comprises four factors:
The change in value of the existing book of life business, where we take the face
value of the sensitivity as given by the company in the embedded value
disclosures.
The impact on the margins of life new business, where we apply a 5x multiplier
to the new business value sensitivity provided by the company, thereby
capitalising the impact on future earnings streams.
The flex in asset management earnings from the move in the value of funds,
where we have assumed a 10% earnings shift in the equity component of the
funds.
The value change in the equity portfolio backing non-life business, where we
have shown 10% of the value of the assets net of tax.
The flex on Allianz’s valuation is 3% according to this set of calculations. The share price
reaction may be greater than this dependent on whether the equity market has
risen/fallen on the back of earnings upgrades/downgrades or a fall/rise in the risk
premium. In the case of the latter, Allianz would move by 13% (3% flex in Allianz’s value,
plus 10% to accommodate for the 10% shift in the risk premium), giving 3% performance
versus the market.
Yields life Yields life Yields life Yields life Equities Non-life Non-life US$ Other
-100bps Total Europe US Other -10% CR +1 pt Yield -100bps gearing *-100bps
AEGON -5.4% 0.0% -5.4% 0.0% -5.4% 0.0% 0.0% 67%
Allianz -5.0% -4.1% 0.2% -1.2% -3.1% -4.8% -1.1% 10% 2%
Aviva -0.2% -0.2% 0.0% 0.0% -4.4% -3.9% -0.5% 0%
AXA -10.4% -4.8% -2.0% -3.5% -6.3% -3.6% -0.7% 11%
Generali -8.3% -8.3% 0.0% 0.0% -5.8% -6.3% -1.3% 0% 6%
Prudential -0.6% 1.3% -1.6% -0.3% -3.7% 0.0% 0.0% 39%
Zurich 0.8% 0.8% 0.0% 0.0% -1.5% -5.7% -1.7% 48%
Average -4.4% -2.4% -1.0% -1.0% -4.1% -3.5% -0.8% 23.1%
* Other equates to PIMCO, and tightening of Italian versus German spreads at Generali
Financials
Initiating Coverage
6 August 2014
page 95 of 116 , Equity Analyst, 44 (0) 20 7029 8784, [email protected] Cathcart
Please see important disclosure information on pages 113 - 116 of this report.
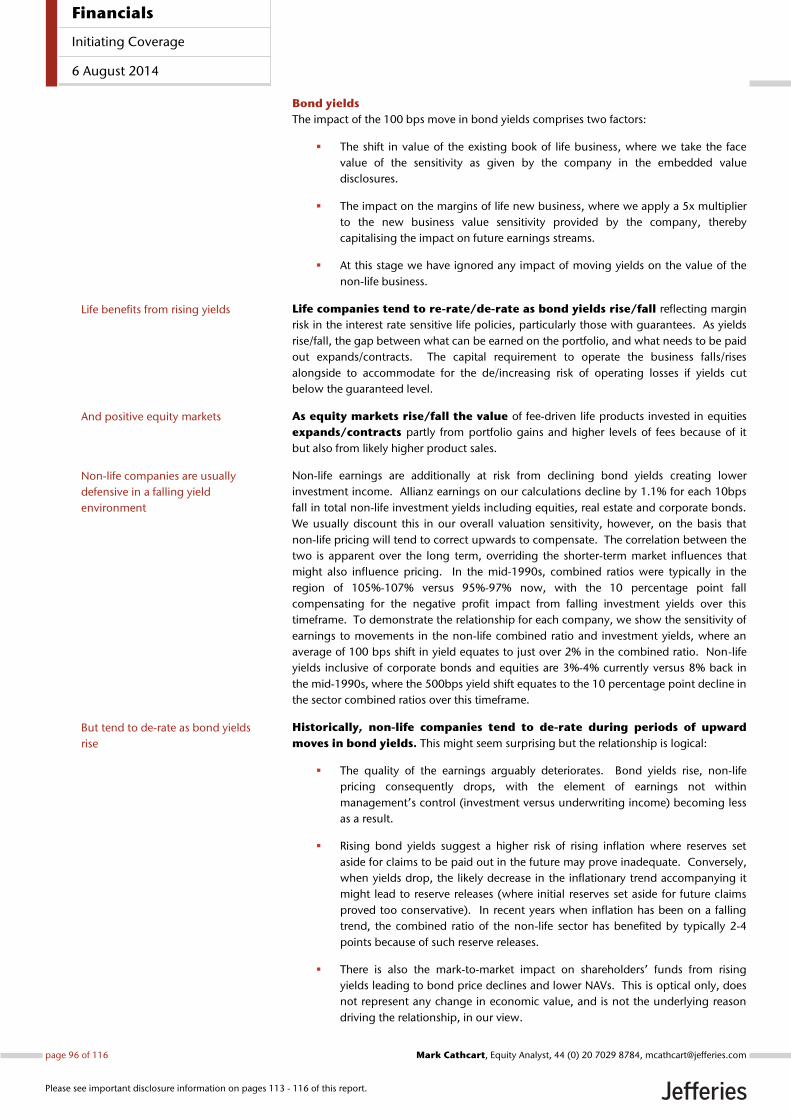
Bond yields
The impact of the 100 bps move in bond yields comprises two factors:
The shift in value of the existing book of life business, where we take the face
value of the sensitivity as given by the company in the embedded value
disclosures.
The impact on the margins of life new business, where we apply a 5x multiplier
to the new business value sensitivity provided by the company, thereby
capitalising the impact on future earnings streams.
At this stage we have ignored any impact of moving yields on the value of the
non-life business.
Life companies tend to re-rate/de-rate as bond yields rise/fall reflecting margin
risk in the interest rate sensitive life policies, particularly those with guarantees. As yields
rise/fall, the gap between what can be earned on the portfolio, and what needs to be paid
out expands/contracts. The capital requirement to operate the business falls/rises
alongside to accommodate for the de/increasing risk of operating losses if yields cut
below the guaranteed level.
As equity markets rise/fall the value of fee-driven life products invested in equities
expands/contracts partly from portfolio gains and higher levels of fees because of it
but also from likely higher product sales.
Non-life earnings are additionally at risk from declining bond yields creating lower
investment income. Allianz earnings on our calculations decline by 1.1% for each 10bps
fall in total non-life investment yields including equities, real estate and corporate bonds.
We usually discount this in our overall valuation sensitivity, however, on the basis that
non-life pricing will tend to correct upwards to compensate. The correlation between the
two is apparent over the long term, overriding the shorter-term market influences that
might also influence pricing. In the mid-1990s, combined ratios were typically in the
region of 105%-107% versus 95%-97% now, with the 10 percentage point fall
compensating for the negative profit impact from falling investment yields over this
timeframe. To demonstrate the relationship for each company, we show the sensitivity of
earnings to movements in the non-life combined ratio and investment yields, where an
average of 100 bps shift in yield equates to just over 2% in the combined ratio. Non-life
yields inclusive of corporate bonds and equities are 3%-4% currently versus 8% back in
the mid-1990s, where the 500bps yield shift equates to the 10 percentage point decline in
the sector combined ratios over this timeframe.
Historically, non-life companies tend to de-rate during periods of upward
moves in bond yields. This might seem surprising but the relationship is logical:
The quality of the earnings arguably deteriorates. Bond yields rise, non-life
pricing consequently drops, with the element of earnings not within
management’s control (investment versus underwriting income) becoming less
as a result.
Rising bond yields suggest a higher risk of rising inflation where reserves set
aside for claims to be paid out in the future may prove inadequate. Conversely,
when yields drop, the likely decrease in the inflationary trend accompanying it
might lead to reserve releases (where initial reserves set aside for future claims
proved too conservative). In recent years when inflation has been on a falling
trend, the combined ratio of the non-life sector has benefited by typically 2-4
points because of such reserve releases.
There is also the mark-to-market impact on shareholders’ funds from rising
yields leading to bond price declines and lower NAVs. This is optical only, does
not represent any change in economic value, and is not the underlying reason
driving the relationship, in our view.
Life benefits from rising yields
And positive equity markets
Non-life companies are usually
defensive in a falling yield
environment
But tend to de-rate as bond yields
rise
Financials
Initiating Coverage
6 August 2014
page 96 of 116 , Equity Analyst, 44 (0) 20 7029 8784, [email protected] Cathcart
Please see important disclosure information on pages 113 - 116 of this report.
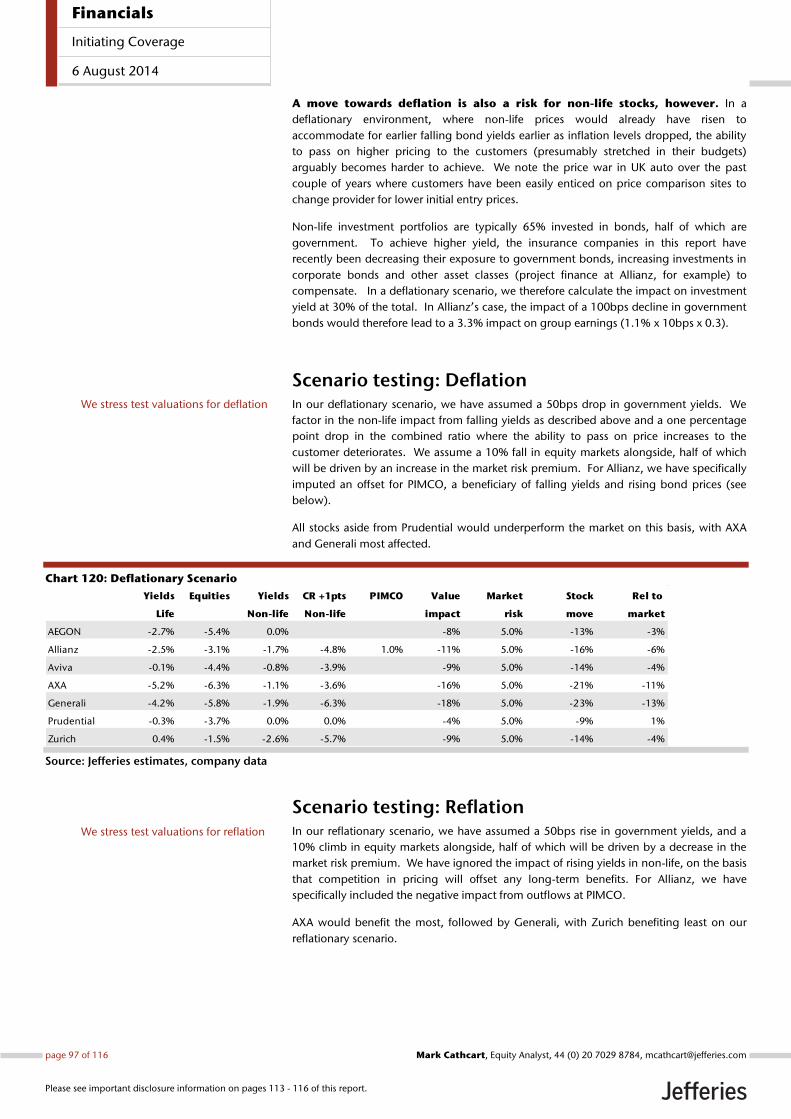
A move towards deflation is also a risk for non-life stocks, however. In a
deflationary environment, where non-life prices would already have risen to
accommodate for earlier falling bond yields earlier as inflation levels dropped, the ability
to pass on higher pricing to the customers (presumably stretched in their budgets)
arguably becomes harder to achieve. We note the price war in UK auto over the past
couple of years where customers have been easily enticed on price comparison sites to
change provider for lower initial entry prices.
Non-life investment portfolios are typically 65% invested in bonds, half of which are
government. To achieve higher yield, the insurance companies in this report have
recently been decreasing their exposure to government bonds, increasing investments in
corporate bonds and other asset classes (project finance at Allianz, for example) to
compensate. In a deflationary scenario, we therefore calculate the impact on investment
yield at 30% of the total. In Allianz’s case, the impact of a 100bps decline in government
bonds would therefore lead to a 3.3% impact on group earnings (1.1% x 10bps x 0.3).
Scenario testing: Deflation In our deflationary scenario, we have assumed a 50bps drop in government yields. We
factor in the non-life impact from falling yields as described above and a one percentage
point drop in the combined ratio where the ability to pass on price increases to the
customer deteriorates. We assume a 10% fall in equity markets alongside, half of which
will be driven by an increase in the market risk premium. For Allianz, we have specifically
imputed an offset for PIMCO, a beneficiary of falling yields and rising bond prices (see
below).
All stocks aside from Prudential would underperform the market on this basis, with AXA
and Generali most affected.
Chart 120: Deflationary Scenario
Source: Jefferies estimates, company data
Scenario testing: Reflation In our reflationary scenario, we have assumed a 50bps rise in government yields, and a
10% climb in equity markets alongside, half of which will be driven by a decrease in the
market risk premium. We have ignored the impact of rising yields in non-life, on the basis
that competition in pricing will offset any long-term benefits. For Allianz, we have
specifically included the negative impact from outflows at PIMCO.
AXA would benefit the most, followed by Generali, with Zurich benefiting least on our
reflationary scenario.
Yields Equities Yields CR +1pts PIMCO Value Market Stock Rel to
Life Non-life Non-life impact risk move market
AEGON -2.7% -5.4% 0.0% -8% 5.0% -13% -3%
Allianz -2.5% -3.1% -1.7% -4.8% 1.0% -11% 5.0% -16% -6%
Aviva -0.1% -4.4% -0.8% -3.9% -9% 5.0% -14% -4%
AXA -5.2% -6.3% -1.1% -3.6% -16% 5.0% -21% -11%
Generali -4.2% -5.8% -1.9% -6.3% -18% 5.0% -23% -13%
Prudential -0.3% -3.7% 0.0% 0.0% -4% 5.0% -9% 1%
Zurich 0.4% -1.5% -2.6% -5.7% -9% 5.0% -14% -4%
We stress test valuations for deflation
We stress test valuations for reflation
Financials
Initiating Coverage
6 August 2014
page 97 of 116 , Equity Analyst, 44 (0) 20 7029 8784, [email protected] Cathcart
Please see important disclosure information on pages 113 - 116 of this report.
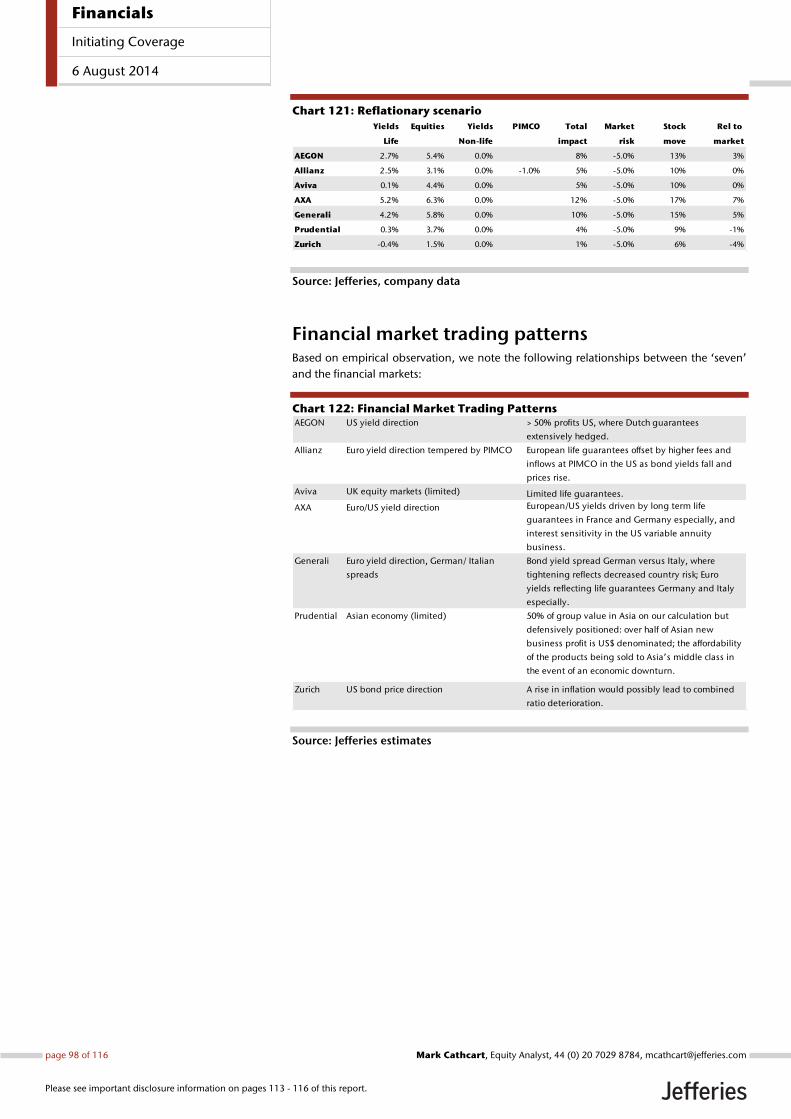
Chart 121: Reflationary scenario
Source: Jefferies, company data
Financial market trading patterns Based on empirical observation, we note the following relationships between the ‘seven’
and the financial markets:
Chart 122: Financial Market Trading Patterns
Source: Jefferies estimates
Yields Equities Yields PIMCO Total Market Stock Rel to
Life Non-life impact risk move market
AEGON 2.7% 5.4% 0.0% 8% -5.0% 13% 3%
Allianz 2.5% 3.1% 0.0% -1.0% 5% -5.0% 10% 0%
Aviva 0.1% 4.4% 0.0% 5% -5.0% 10% 0%
AXA 5.2% 6.3% 0.0% 12% -5.0% 17% 7%
Generali 4.2% 5.8% 0.0% 10% -5.0% 15% 5%
Prudential 0.3% 3.7% 0.0% 4% -5.0% 9% -1%
Zurich -0.4% 1.5% 0.0% 1% -5.0% 6% -4%
AEGON US yield direction > 50% profits US, where Dutch guarantees
extensively hedged.
Allianz Euro yield direction tempered by PIMCO European life guarantees offset by higher fees and
inflows at PIMCO in the US as bond yields fall and
prices rise.
Aviva UK equity markets (limited) Limited life guarantees.
AXA Euro/US yield direction European/US yields driven by long term life
guarantees in France and Germany especially, and
interest sensitivity in the US variable annuity
business.
Generali Euro yield direction, German/ Italian
spreads
Bond yield spread German versus Italy, where
tightening reflects decreased country risk; Euro
yields reflecting life guarantees Germany and Italy
especially.
Prudential Asian economy (limited) 50% of group value in Asia on our calculation but
defensively positioned: over half of Asian new
business profit is US$ denominated; the affordability
of the products being sold to Asia’s middle class in
the event of an economic downturn.
Zurich US bond price direction A rise in inflation would possibly lead to combined
ratio deterioration.
Financials
Initiating Coverage
6 August 2014
page 98 of 116 , Equity Analyst, 44 (0) 20 7029 8784, [email protected] Cathcart
Please see important disclosure information on pages 113 - 116 of this report.
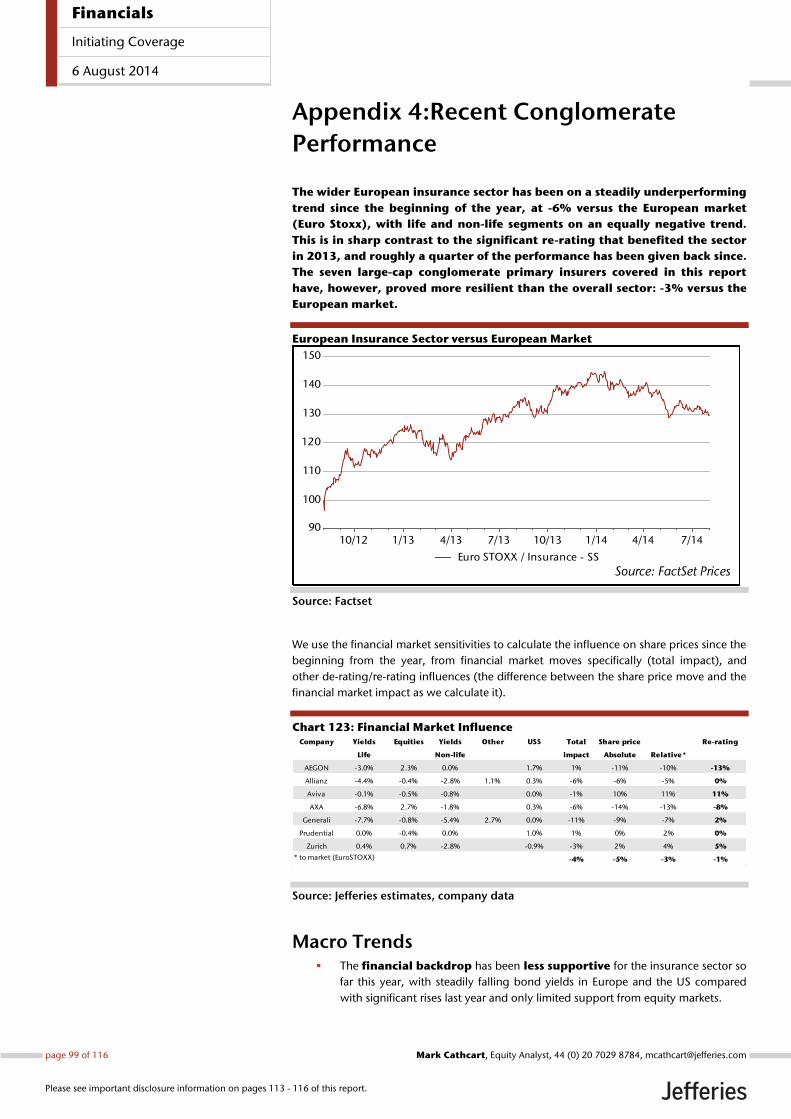
Appendix 4:Recent Conglomerate
Performance The wider European insurance sector has been on a steadily underperforming
trend since the beginning of the year, at -6% versus the European market
(Euro Stoxx), with life and non-life segments on an equally negative trend.
This is in sharp contrast to the significant re-rating that benefited the sector
in 2013, and roughly a quarter of the performance has been given back since.
The seven large-cap conglomerate primary insurers covered in this report
have, however, proved more resilient than the overall sector: -3% versus the
European market.
European Insurance Sector versus European Market
Source: Factset
We use the financial market sensitivities to calculate the influence on share prices since the
beginning from the year, from financial market moves specifically (total impact), and
other de-rating/re-rating influences (the difference between the share price move and the
financial market impact as we calculate it).
Chart 123: Financial Market Influence
Source: Jefferies estimates, company data
Macro Trends The financial backdrop has been less supportive for the insurance sector so
far this year, with steadily falling bond yields in Europe and the US compared
with significant rises last year and only limited support from equity markets.
10/12 1/13 4/13 7/13 10/13 1/14 4/14 7/1490
100
110
120
130
140
150
Source: FactSet PricesEuro STOXX / Insurance - SS
Company Yields Equities Yields Other US$ Total Share price Re-rating
Life Non-life impact Absolute Relative*
AEGON -3.0% 2.3% 0.0% 1.7% 1% -11% -10% -13%
Allianz -4.4% -0.4% -2.8% 1.1% 0.3% -6% -6% -5% 0%
Aviva -0.1% -0.5% -0.8% 0.0% -1% 10% 11% 11%
AXA -6.8% 2.7% -1.8% 0.3% -6% -14% -13% -8%
Generali -7.7% -0.8% -5.4% 2.7% 0.0% -11% -9% -7% 2%
Prudential 0.0% -0.4% 0.0% 1.0% 1% 0% 2% 0%
Zurich 0.4% 0.7% -2.8% -0.9% -3% 2% 4% 5%
* to market (EuroSTOXX) -4% -5% -3% -1%
Financials
Initiating Coverage
6 August 2014
page 99 of 116 , Equity Analyst, 44 (0) 20 7029 8784, [email protected] Cathcart
Please see important disclosure information on pages 113 - 116 of this report.
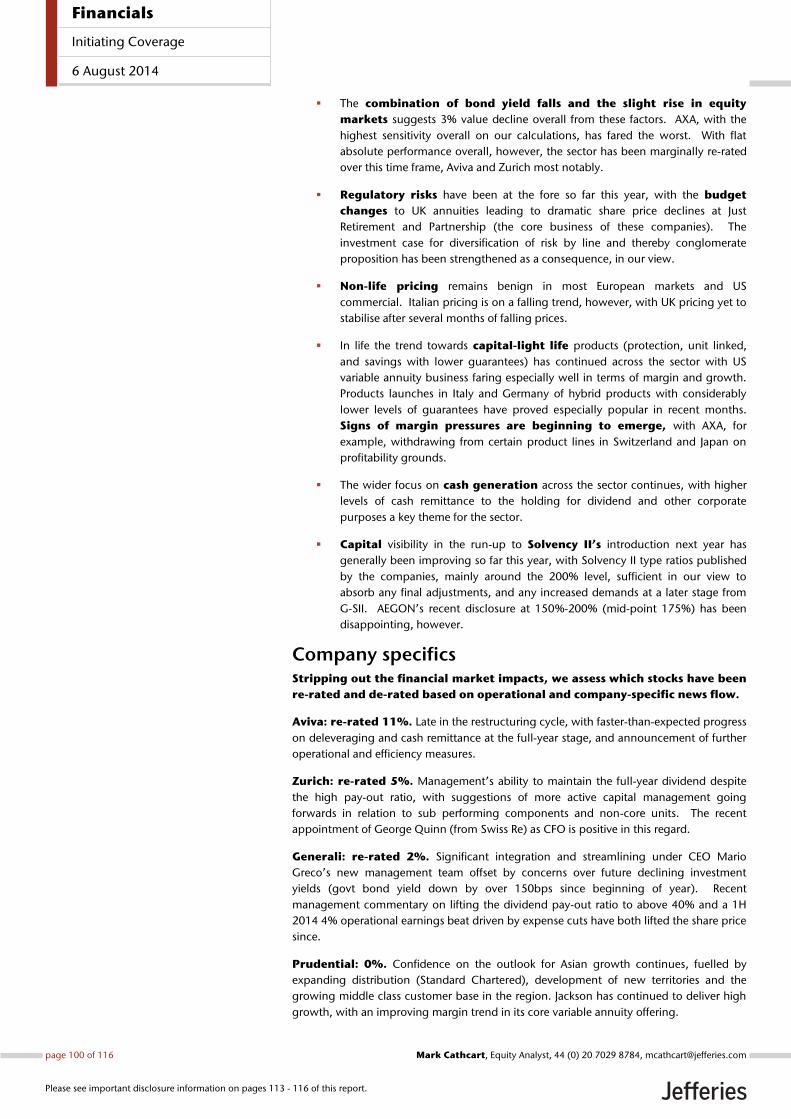
The combination of bond yield falls and the slight rise in equity
markets suggests 3% value decline overall from these factors. AXA, with the
highest sensitivity overall on our calculations, has fared the worst. With flat
absolute performance overall, however, the sector has been marginally re-rated
over this time frame, Aviva and Zurich most notably.
Regulatory risks have been at the fore so far this year, with the budget
changes to UK annuities leading to dramatic share price declines at Just
Retirement and Partnership (the core business of these companies). The
investment case for diversification of risk by line and thereby conglomerate
proposition has been strengthened as a consequence, in our view.
Non-life pricing remains benign in most European markets and US
commercial. Italian pricing is on a falling trend, however, with UK pricing yet to
stabilise after several months of falling prices.
In life the trend towards capital-light life products (protection, unit linked,
and savings with lower guarantees) has continued across the sector with US
variable annuity business faring especially well in terms of margin and growth.
Products launches in Italy and Germany of hybrid products with considerably
lower levels of guarantees have proved especially popular in recent months.
Signs of margin pressures are beginning to emerge, with AXA, for
example, withdrawing from certain product lines in Switzerland and Japan on
profitability grounds.
The wider focus on cash generation across the sector continues, with higher
levels of cash remittance to the holding for dividend and other corporate
purposes a key theme for the sector.
Capital visibility in the run-up to Solvency II’s introduction next year has
generally been improving so far this year, with Solvency II type ratios published
by the companies, mainly around the 200% level, sufficient in our view to
absorb any final adjustments, and any increased demands at a later stage from
G-SII. AEGON’s recent disclosure at 150%-200% (mid-point 175%) has been
disappointing, however.
Company specifics Stripping out the financial market impacts, we assess which stocks have been
re-rated and de-rated based on operational and company-specific news flow.
Aviva: re-rated 11%. Late in the restructuring cycle, with faster-than-expected progress
on deleveraging and cash remittance at the full-year stage, and announcement of further
operational and efficiency measures.
Zurich: re-rated 5%. Management’s ability to maintain the full-year dividend despite
the high pay-out ratio, with suggestions of more active capital management going
forwards in relation to sub performing components and non-core units. The recent
appointment of George Quinn (from Swiss Re) as CFO is positive in this regard.
Generali: re-rated 2%. Significant integration and streamlining under CEO Mario
Greco’s new management team offset by concerns over future declining investment
yields (govt bond yield down by over 150bps since beginning of year). Recent
management commentary on lifting the dividend pay-out ratio to above 40% and a 1H
2014 4% operational earnings beat driven by expense cuts have both lifted the share price
since.
Prudential: 0%. Confidence on the outlook for Asian growth continues, fuelled by
expanding distribution (Standard Chartered), development of new territories and the
growing middle class customer base in the region. Jackson has continued to deliver high
growth, with an improving margin trend in its core variable annuity offering.
Financials
Initiating Coverage
6 August 2014
page 100 of 116 , Equity Analyst, 44 (0) 20 7029 8784, [email protected] Cathcart
Please see important disclosure information on pages 113 - 116 of this report.
Allianz: 0%. The recent Investor Day disclosed higher-than-expected free cash flows,
and €3bn of cash which is to be accelerated to the holding over the next three years. This
has led to increased market optimism on higher dividend pay-out ratios in the future.
Since the beginning of the year, PIMCO has been a destabilising influence, following the
resignation of group CEO in January, and continued outflows. Fund performance has
recovered this year in the core fund, and appointment of six deputy CIO’s alongside a
new CEO (former COO) to alleviate key man risk should lead to some stabilisation during
the rest of the year.
AXA: de-rated 8%. Growth momentum stalled at the Q1 stage in terms of life value of
new business (VNB) following management’s decision to de-emphasise certain
components of group health business in Switzerland, and long-term protection in Japan
due to inadequate margins. The 1H half results announced last week were considerably
more supportive, however, with a growth trend re-established in life new business (Q2 vs
Q2 2013 +5%), a return to positive inflows at Alliance Bernstein, and an underlying
earnings beat reflecting positive operational momentum driven by expense cuts. The
strong signal of an increase in the dividend pay-out ratio has also helped lift the shares.
AEGON: de-rated 13%. Recent Solvency II disclosure suggested a range of 150%-
200%, where the mid-point at 175% is lower than the conglomerate peers typically
around 200%. The planned sale of the non-core operations in France and Canada should
help in this regard (adding 5-7 points to the ratio on our guesstimates). Cash flow levels
have also been guided to increase to comfortable levels for dividend and future growth
requirements on our calculations.
Financials
Initiating Coverage
6 August 2014
page 101 of 116 , Equity Analyst, 44 (0) 20 7029 8784, [email protected] Cathcart
Please see important disclosure information on pages 113 - 116 of this report.
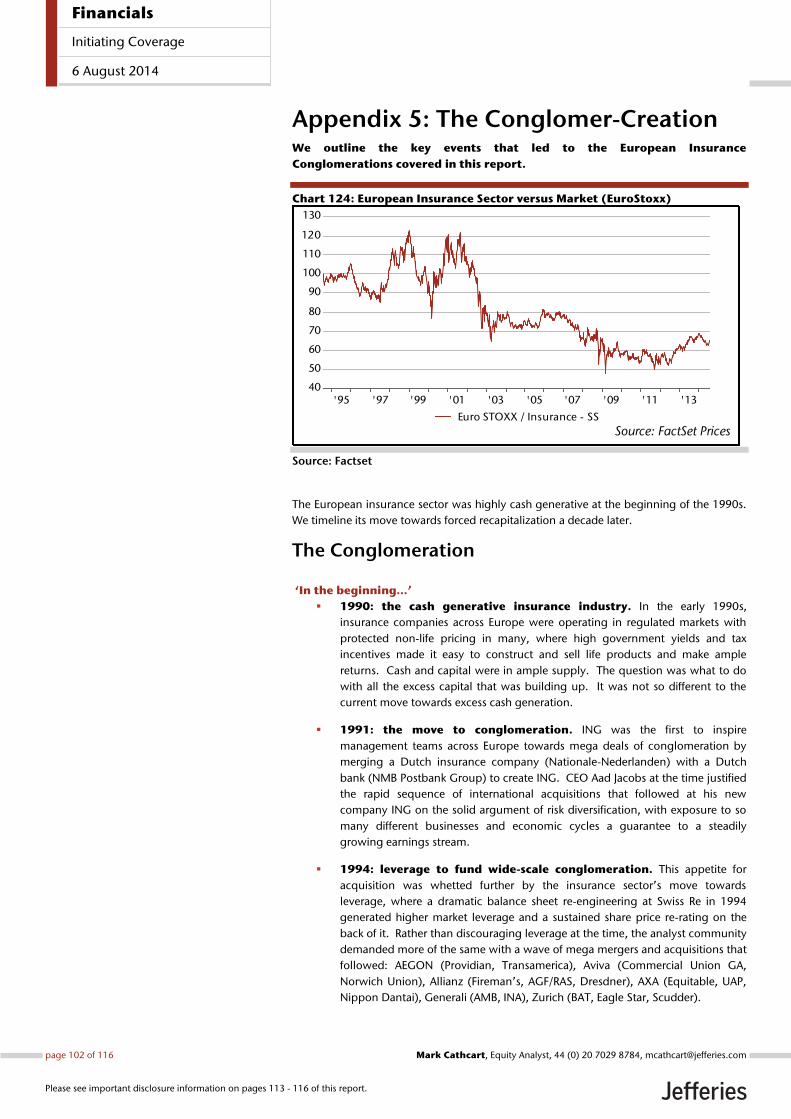
Appendix 5: The Conglomer-Creation We outline the key events that led to the European Insurance
Conglomerations covered in this report.
Chart 124: European Insurance Sector versus Market (EuroStoxx)
Source: Factset
The European insurance sector was highly cash generative at the beginning of the 1990s.
We timeline its move towards forced recapitalization a decade later.
The Conglomeration
‘In the beginning…’
1990: the cash generative insurance industry. In the early 1990s,
insurance companies across Europe were operating in regulated markets with
protected non-life pricing in many, where high government yields and tax
incentives made it easy to construct and sell life products and make ample
returns. Cash and capital were in ample supply. The question was what to do
with all the excess capital that was building up. It was not so different to the
current move towards excess cash generation.
1991: the move to conglomeration. ING was the first to inspire
management teams across Europe towards mega deals of conglomeration by
merging a Dutch insurance company (Nationale-Nederlanden) with a Dutch
bank (NMB Postbank Group) to create ING. CEO Aad Jacobs at the time justified
the rapid sequence of international acquisitions that followed at his new
company ING on the solid argument of risk diversification, with exposure to so
many different businesses and economic cycles a guarantee to a steadily
growing earnings stream.
1994: leverage to fund wide-scale conglomeration. This appetite for
acquisition was whetted further by the insurance sector’s move towards
leverage, where a dramatic balance sheet re-engineering at Swiss Re in 1994
generated higher market leverage and a sustained share price re-rating on the
back of it. Rather than discouraging leverage at the time, the analyst community
demanded more of the same with a wave of mega mergers and acquisitions that
followed: AEGON (Providian, Transamerica), Aviva (Commercial Union GA,
Norwich Union), Allianz (Fireman’s, AGF/RAS, Dresdner), AXA (Equitable, UAP,
Nippon Dantai), Generali (AMB, INA), Zurich (BAT, Eagle Star, Scudder).
'95 '97 '99 '01 '03 '05 '07 '09 '11 '1340
50
60
70
80
90
100
110
120
130
Source: FactSet PricesEuro STOXX / Insurance - SS
Financials
Initiating Coverage
6 August 2014
page 102 of 116 , Equity Analyst, 44 (0) 20 7029 8784, [email protected] Cathcart
Please see important disclosure information on pages 113 - 116 of this report.
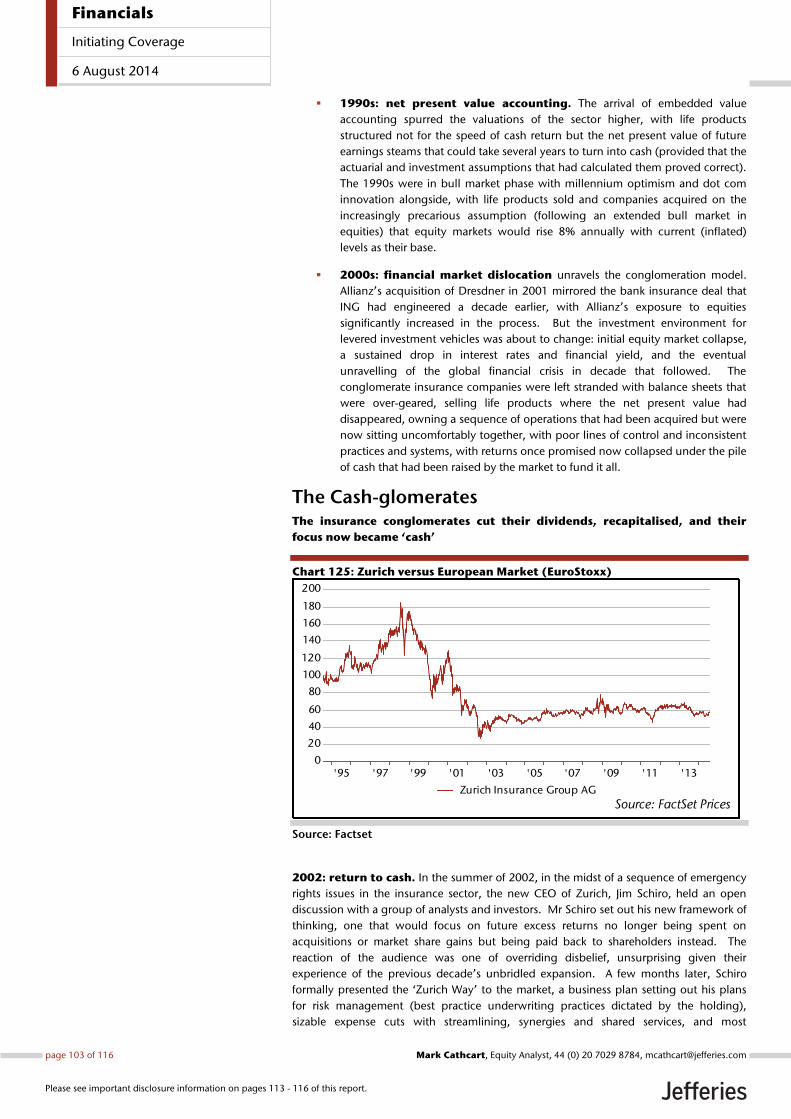
1990s: net present value accounting. The arrival of embedded value
accounting spurred the valuations of the sector higher, with life products
structured not for the speed of cash return but the net present value of future
earnings steams that could take several years to turn into cash (provided that the
actuarial and investment assumptions that had calculated them proved correct).
The 1990s were in bull market phase with millennium optimism and dot com
innovation alongside, with life products sold and companies acquired on the
increasingly precarious assumption (following an extended bull market in
equities) that equity markets would rise 8% annually with current (inflated)
levels as their base.
2000s: financial market dislocation unravels the conglomeration model.
Allianz’s acquisition of Dresdner in 2001 mirrored the bank insurance deal that
ING had engineered a decade earlier, with Allianz’s exposure to equities
significantly increased in the process. But the investment environment for
levered investment vehicles was about to change: initial equity market collapse,
a sustained drop in interest rates and financial yield, and the eventual
unravelling of the global financial crisis in decade that followed. The
conglomerate insurance companies were left stranded with balance sheets that
were over-geared, selling life products where the net present value had
disappeared, owning a sequence of operations that had been acquired but were
now sitting uncomfortably together, with poor lines of control and inconsistent
practices and systems, with returns once promised now collapsed under the pile
of cash that had been raised by the market to fund it all.
The Cash-glomerates The insurance conglomerates cut their dividends, recapitalised, and their
focus now became ‘cash’
Chart 125: Zurich versus European Market (EuroStoxx)
Source: Factset
2002: return to cash. In the summer of 2002, in the midst of a sequence of emergency
rights issues in the insurance sector, the new CEO of Zurich, Jim Schiro, held an open
discussion with a group of analysts and investors. Mr Schiro set out his new framework of
thinking, one that would focus on future excess returns no longer being spent on
acquisitions or market share gains but being paid back to shareholders instead. The
reaction of the audience was one of overriding disbelief, unsurprising given their
experience of the previous decade’s unbridled expansion. A few months later, Schiro
formally presented the ‘Zurich Way’ to the market, a business plan setting out his plans
for risk management (best practice underwriting practices dictated by the holding),
sizable expense cuts with streamlining, synergies and shared services, and most
'95 '97 '99 '01 '03 '05 '07 '09 '11 '130
20
40
60
80
100
120
140
160
180
200
Source: FactSet PricesZurich Insurance Group AG
Financials
Initiating Coverage
6 August 2014
page 103 of 116 , Equity Analyst, 44 (0) 20 7029 8784, [email protected] Cathcart
Please see important disclosure information on pages 113 - 116 of this report.
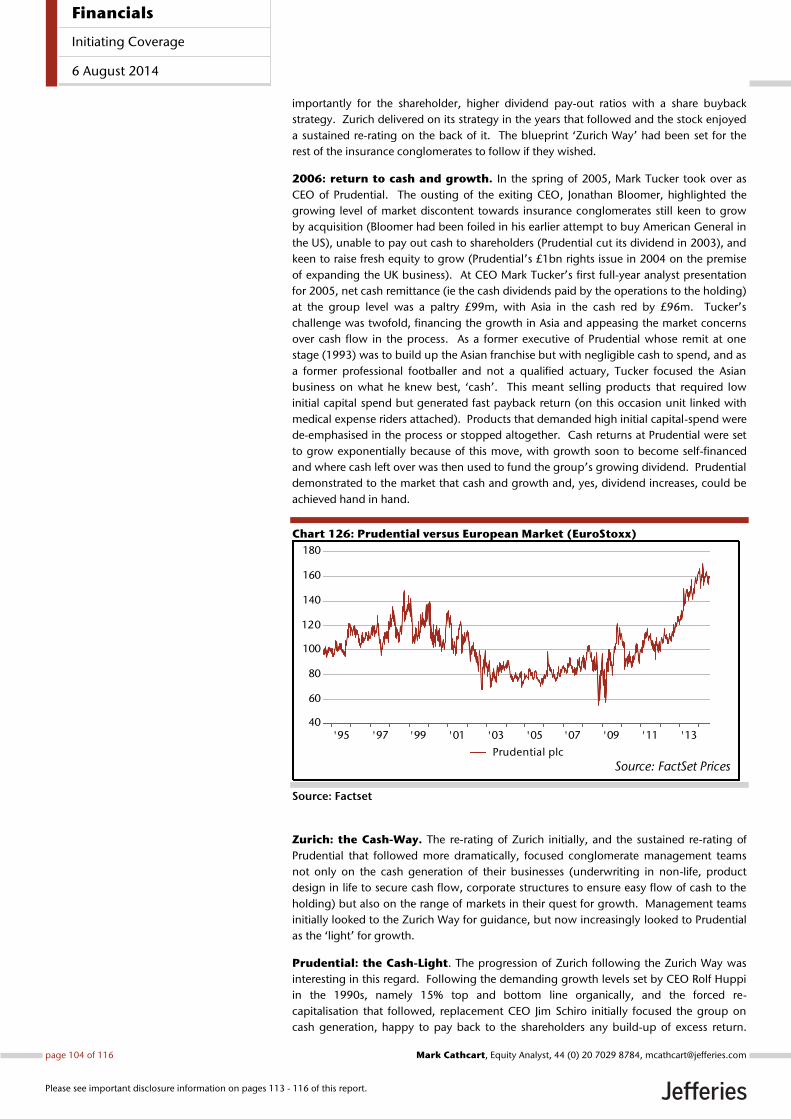
importantly for the shareholder, higher dividend pay-out ratios with a share buyback
strategy. Zurich delivered on its strategy in the years that followed and the stock enjoyed
a sustained re-rating on the back of it. The blueprint ‘Zurich Way’ had been set for the
rest of the insurance conglomerates to follow if they wished.
2006: return to cash and growth. In the spring of 2005, Mark Tucker took over as
CEO of Prudential. The ousting of the exiting CEO, Jonathan Bloomer, highlighted the
growing level of market discontent towards insurance conglomerates still keen to grow
by acquisition (Bloomer had been foiled in his earlier attempt to buy American General in
the US), unable to pay out cash to shareholders (Prudential cut its dividend in 2003), and
keen to raise fresh equity to grow (Prudential’s £1bn rights issue in 2004 on the premise
of expanding the UK business). At CEO Mark Tucker’s first full-year analyst presentation
for 2005, net cash remittance (ie the cash dividends paid by the operations to the holding)
at the group level was a paltry £99m, with Asia in the cash red by £96m. Tucker’s
challenge was twofold, financing the growth in Asia and appeasing the market concerns
over cash flow in the process. As a former executive of Prudential whose remit at one
stage (1993) was to build up the Asian franchise but with negligible cash to spend, and as
a former professional footballer and not a qualified actuary, Tucker focused the Asian
business on what he knew best, ‘cash’. This meant selling products that required low
initial capital spend but generated fast payback return (on this occasion unit linked with
medical expense riders attached). Products that demanded high initial capital-spend were
de-emphasised in the process or stopped altogether. Cash returns at Prudential were set
to grow exponentially because of this move, with growth soon to become self-financed
and where cash left over was then used to fund the group’s growing dividend. Prudential
demonstrated to the market that cash and growth and, yes, dividend increases, could be
achieved hand in hand.
Chart 126: Prudential versus European Market (EuroStoxx)
Source: Factset
Zurich: the Cash-Way. The re-rating of Zurich initially, and the sustained re-rating of
Prudential that followed more dramatically, focused conglomerate management teams
not only on the cash generation of their businesses (underwriting in non-life, product
design in life to secure cash flow, corporate structures to ensure easy flow of cash to the
holding) but also on the range of markets in their quest for growth. Management teams
initially looked to the Zurich Way for guidance, but now increasingly looked to Prudential
as the ‘light’ for growth.
Prudential: the Cash-Light. The progression of Zurich following the Zurich Way was
interesting in this regard. Following the demanding growth levels set by CEO Rolf Huppi
in the 1990s, namely 15% top and bottom line organically, and the forced re-
capitalisation that followed, replacement CEO Jim Schiro initially focused the group on
cash generation, happy to pay back to the shareholders any build-up of excess return.
'95 '97 '99 '01 '03 '05 '07 '09 '11 '1340
60
80
100
120
140
160
180
Source: FactSet PricesPrudential plc
Financials
Initiating Coverage
6 August 2014
page 104 of 116 , Equity Analyst, 44 (0) 20 7029 8784, [email protected] Cathcart
Please see important disclosure information on pages 113 - 116 of this report.
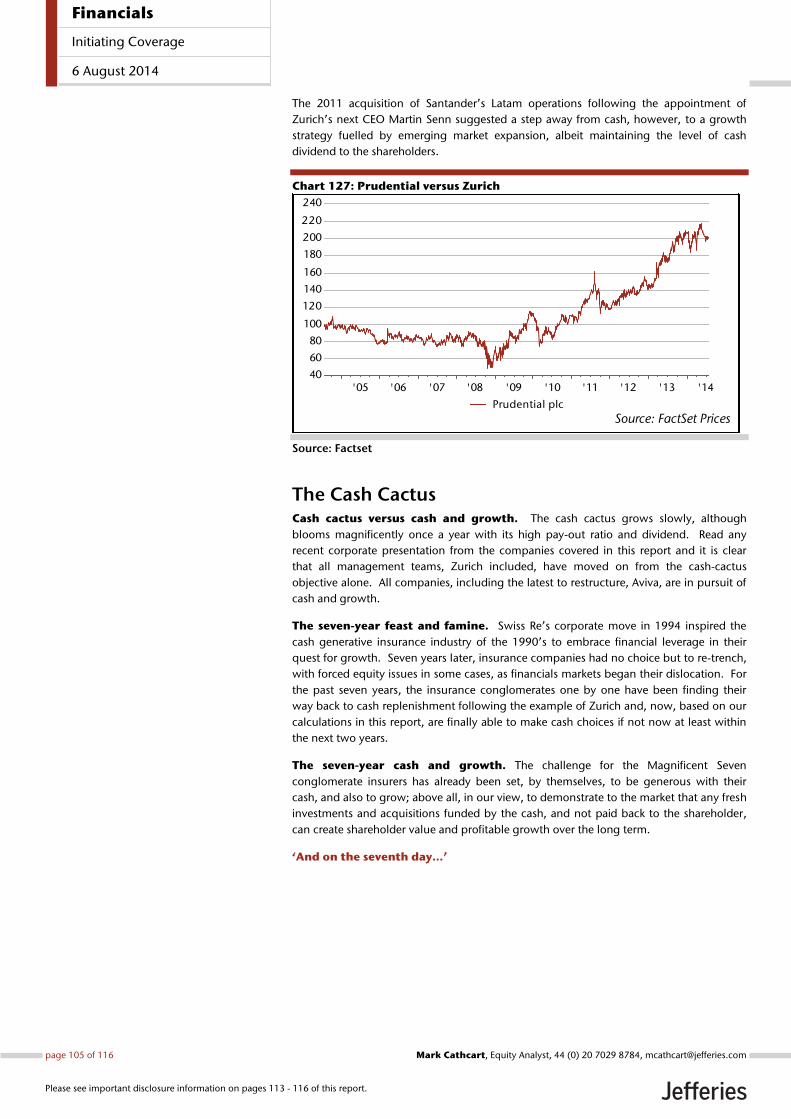
The 2011 acquisition of Santander’s Latam operations following the appointment of
Zurich’s next CEO Martin Senn suggested a step away from cash, however, to a growth
strategy fuelled by emerging market expansion, albeit maintaining the level of cash
dividend to the shareholders.
Chart 127: Prudential versus Zurich
Source: Factset
The Cash Cactus Cash cactus versus cash and growth. The cash cactus grows slowly, although
blooms magnificently once a year with its high pay-out ratio and dividend. Read any
recent corporate presentation from the companies covered in this report and it is clear
that all management teams, Zurich included, have moved on from the cash-cactus
objective alone. All companies, including the latest to restructure, Aviva, are in pursuit of
cash and growth.
The seven-year feast and famine. Swiss Re’s corporate move in 1994 inspired the
cash generative insurance industry of the 1990’s to embrace financial leverage in their
quest for growth. Seven years later, insurance companies had no choice but to re-trench,
with forced equity issues in some cases, as financials markets began their dislocation. For
the past seven years, the insurance conglomerates one by one have been finding their
way back to cash replenishment following the example of Zurich and, now, based on our
calculations in this report, are finally able to make cash choices if not now at least within
the next two years.
The seven-year cash and growth. The challenge for the Magnificent Seven
conglomerate insurers has already been set, by themselves, to be generous with their
cash, and also to grow; above all, in our view, to demonstrate to the market that any fresh
investments and acquisitions funded by the cash, and not paid back to the shareholder,
can create shareholder value and profitable growth over the long term.
‘And on the seventh day…’
'05 '06 '07 '08 '09 '10 '11 '12 '13 '1440
60
80
100
120
140
160
180
200
220
240
Source: FactSet PricesPrudential plc
Financials
Initiating Coverage
6 August 2014
page 105 of 116 , Equity Analyst, 44 (0) 20 7029 8784, [email protected] Cathcart
Please see important disclosure information on pages 113 - 116 of this report.
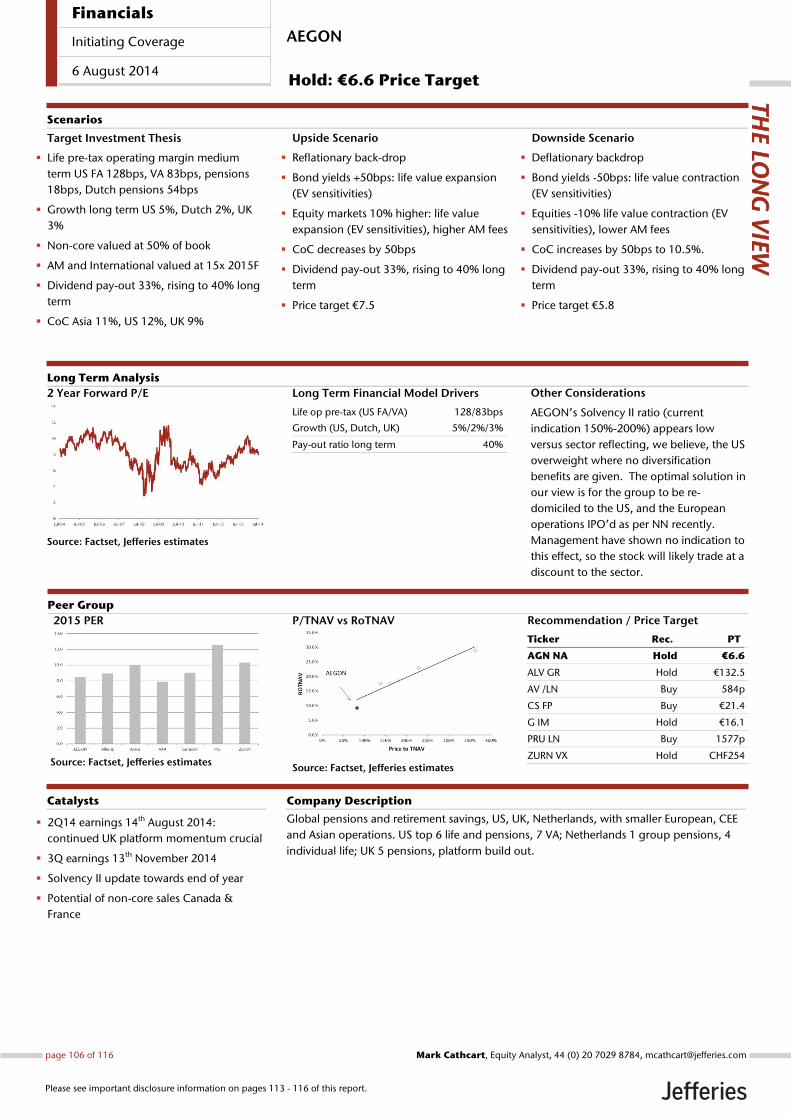
Long Term Financial Model Drivers
Life op pre-tax (US FA/VA) 128/83bps
Growth (US, Dutch, UK) 5%/2%/3%
Pay-out ratio long term 40%
Other Considerations
AEGON’s Solvency II ratio (current
indication 150%-200%) appears low
versus sector reflecting, we believe, the US
overweight where no diversification
benefits are given. The optimal solution in
our view is for the group to be re-
domiciled to the US, and the European
operations IPO’d as per NN recently.
Management have shown no indication to
this effect, so the stock will likely trade at a
discount to the sector.
2 Year Forward P/E
Source: Factset, Jefferies estimates
Global pensions and retirement savings, US, UK, Netherlands, with smaller European, CEE
and Asian operations. US top 6 life and pensions, 7 VA; Netherlands 1 group pensions, 4
individual life; UK 5 pensions, platform build out.
2Q14 earnings 14th August 2014:
continued UK platform momentum crucial
3Q earnings 13th November 2014
Solvency II update towards end of year
Potential of non-core sales Canada &
France
Catalysts
Target Investment Thesis
Life pre-tax operating margin medium
term US FA 128bps, VA 83bps, pensions
18bps, Dutch pensions 54bps
Growth long term US 5%, Dutch 2%, UK
3%
Non-core valued at 50% of book
AM and International valued at 15x 2015F
Dividend pay-out 33%, rising to 40% long
term
CoC Asia 11%, US 12%, UK 9%
Upside Scenario
Reflationary back-drop
Bond yields +50bps: life value expansion
(EV sensitivities)
Equity markets 10% higher: life value
expansion (EV sensitivities), higher AM fees
CoC decreases by 50bps
Dividend pay-out 33%, rising to 40% long
term
Price target €7.5
Downside Scenario
Deflationary backdrop
Bond yields -50bps: life value contraction
(EV sensitivities)
Equities -10% life value contraction (EV
sensitivities), lower AM fees
CoC increases by 50bps to 10.5%.
Dividend pay-out 33%, rising to 40% long
term
Price target €5.8
Long Term Analysis
Scenarios
2015 PER
Source: Factset, Jefferies estimates
P/TNAV vs RoTNAV
Source: Factset, Jefferies estimates
Recommendation / Price Target
Ticker Rec. PT
AGN NA Hold €6.6
ALV GR Hold €132.5
AV /LN Buy 584p
CS FP Buy €21.4
G IM Hold €16.1
PRU LN Buy 1577p
ZURN VX Hold CHF254
Company Description
THE LO
NG
VIE
W
Peer Group
AEGON
Hold: €6.6 Price Target
Financials
Initiating Coverage
6 August 2014
page 106 of 116 , Equity Analyst, 44 (0) 20 7029 8784, [email protected] Cathcart
Please see important disclosure information on pages 113 - 116 of this report.
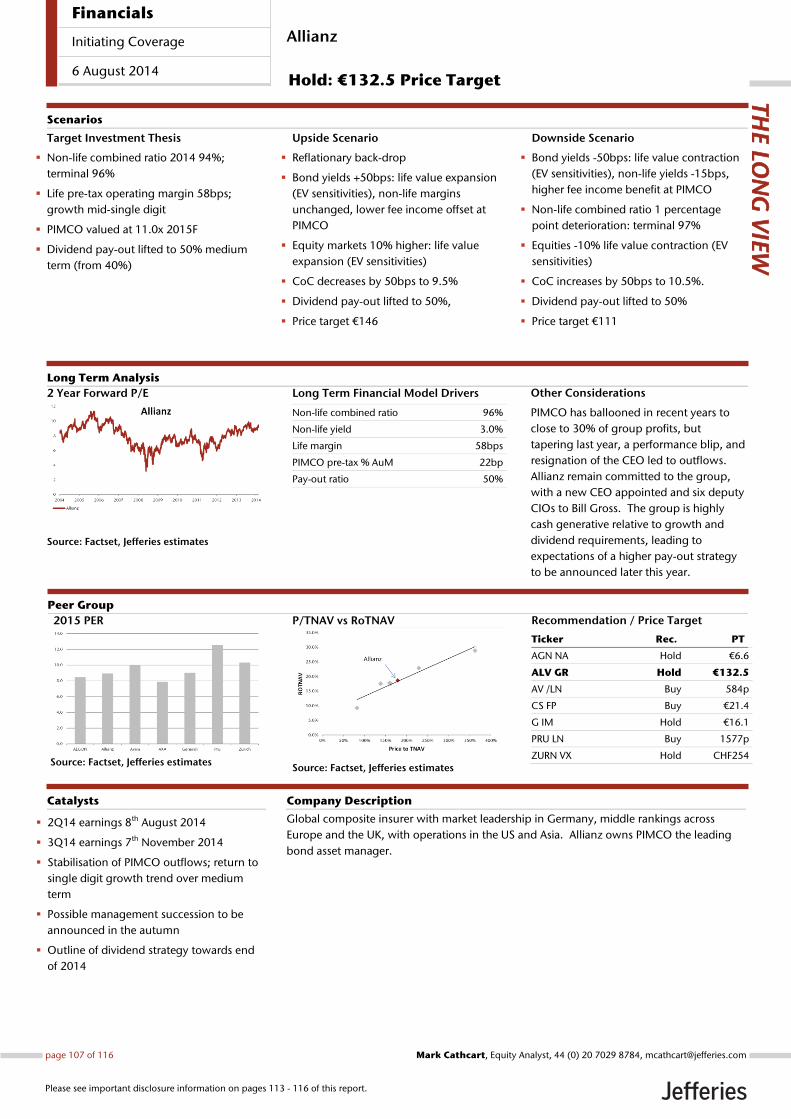
Long Term Financial Model Drivers
Non-life combined ratio 96%
Non-life yield 3.0%
Life margin 58bps
PIMCO pre-tax % AuM 22bp
Pay-out ratio 50%
Other Considerations
PIMCO has ballooned in recent years to
close to 30% of group profits, but
tapering last year, a performance blip, and
resignation of the CEO led to outflows.
Allianz remain committed to the group,
with a new CEO appointed and six deputy
CIOs to Bill Gross. The group is highly
cash generative relative to growth and
dividend requirements, leading to
expectations of a higher pay-out strategy
to be announced later this year.
2 Year Forward P/E
Source: Factset, Jefferies estimates
Global composite insurer with market leadership in Germany, middle rankings across
Europe and the UK, with operations in the US and Asia. Allianz owns PIMCO the leading
bond asset manager.
2Q14 earnings 8th August 2014
3Q14 earnings 7th November 2014
Stabilisation of PIMCO outflows; return to
single digit growth trend over medium
term
Possible management succession to be
announced in the autumn
Outline of dividend strategy towards end
of 2014
Catalysts
Target Investment Thesis
Non-life combined ratio 2014 94%;
terminal 96%
Life pre-tax operating margin 58bps;
growth mid-single digit
PIMCO valued at 11.0x 2015F
Dividend pay-out lifted to 50% medium
term (from 40%)
Upside Scenario
Reflationary back-drop
Bond yields +50bps: life value expansion
(EV sensitivities), non-life margins
unchanged, lower fee income offset at
PIMCO
Equity markets 10% higher: life value
expansion (EV sensitivities)
CoC decreases by 50bps to 9.5%
Dividend pay-out lifted to 50%,
Price target €146
Downside Scenario
Bond yields -50bps: life value contraction
(EV sensitivities), non-life yields -15bps,
higher fee income benefit at PIMCO
Non-life combined ratio 1 percentage
point deterioration: terminal 97%
Equities -10% life value contraction (EV
sensitivities)
CoC increases by 50bps to 10.5%.
Dividend pay-out lifted to 50%
Price target €111
Long Term Analysis
Scenarios
2015 PER
Source: Factset, Jefferies estimates
P/TNAV vs RoTNAV
Source: Factset, Jefferies estimates
Recommendation / Price Target
Ticker Rec. PT
AGN NA Hold €6.6
ALV GR Hold €132.5
AV /LN Buy 584p
CS FP Buy €21.4
G IM Hold €16.1
PRU LN Buy 1577p
ZURN VX Hold CHF254
Company Description
THE LO
NG
VIE
W
Peer Group
Allianz
Hold: €132.5 Price Target
Financials
Initiating Coverage
6 August 2014
page 107 of 116 , Equity Analyst, 44 (0) 20 7029 8784, [email protected] Cathcart
Please see important disclosure information on pages 113 - 116 of this report.
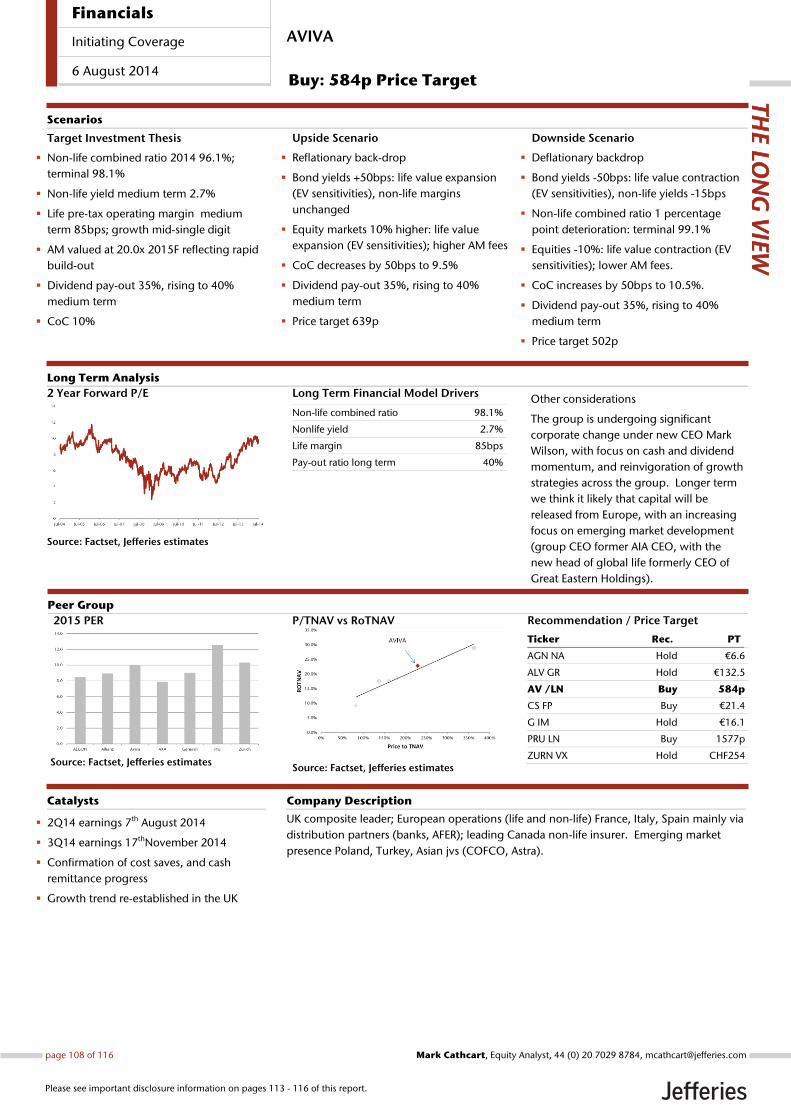
Long Term Financial Model Drivers
Non-life combined ratio 98.1%
Nonlife yield 2.7%
Life margin 85bps
Pay-out ratio long term 40%
Other considerations
The group is undergoing significant
corporate change under new CEO Mark
Wilson, with focus on cash and dividend
momentum, and reinvigoration of growth
strategies across the group. Longer term
we think it likely that capital will be
released from Europe, with an increasing
focus on emerging market development
(group CEO former AIA CEO, with the
new head of global life formerly CEO of
Great Eastern Holdings).
2 Year Forward P/E
Source: Factset, Jefferies estimates
UK composite leader; European operations (life and non-life) France, Italy, Spain mainly via
distribution partners (banks, AFER); leading Canada non-life insurer. Emerging market
presence Poland, Turkey, Asian jvs (COFCO, Astra).
2Q14 earnings 7th August 2014
3Q14 earnings 17thNovember 2014
Confirmation of cost saves, and cash
remittance progress
Growth trend re-established in the UK
Catalysts
Target Investment Thesis
Non-life combined ratio 2014 96.1%;
terminal 98.1%
Non-life yield medium term 2.7%
Life pre-tax operating margin medium
term 85bps; growth mid-single digit
AM valued at 20.0x 2015F reflecting rapid
build-out
Dividend pay-out 35%, rising to 40%
medium term
CoC 10%
Upside Scenario
Reflationary back-drop
Bond yields +50bps: life value expansion
(EV sensitivities), non-life margins
unchanged
Equity markets 10% higher: life value
expansion (EV sensitivities); higher AM fees
CoC decreases by 50bps to 9.5%
Dividend pay-out 35%, rising to 40%
medium term
Price target 639p
Downside Scenario
Deflationary backdrop
Bond yields -50bps: life value contraction
(EV sensitivities), non-life yields -15bps
Non-life combined ratio 1 percentage
point deterioration: terminal 99.1%
Equities -10%: life value contraction (EV
sensitivities); lower AM fees.
CoC increases by 50bps to 10.5%.
Dividend pay-out 35%, rising to 40%
medium term
Price target 502p
Long Term Analysis
Scenarios
2015 PER
Source: Factset, Jefferies estimates
P/TNAV vs RoTNAV
Source: Factset, Jefferies estimates
Recommendation / Price Target
Ticker Rec. PT
AGN NA Hold €6.6
ALV GR Hold €132.5
AV /LN Buy 584p
CS FP Buy €21.4
G IM Hold €16.1
PRU LN Buy 1577p
ZURN VX Hold CHF254
Company Description
THE LO
NG
VIE
W
Peer Group
AVIVA
Buy: 584p Price Target
Financials
Initiating Coverage
6 August 2014
page 108 of 116 , Equity Analyst, 44 (0) 20 7029 8784, [email protected] Cathcart
Please see important disclosure information on pages 113 - 116 of this report.
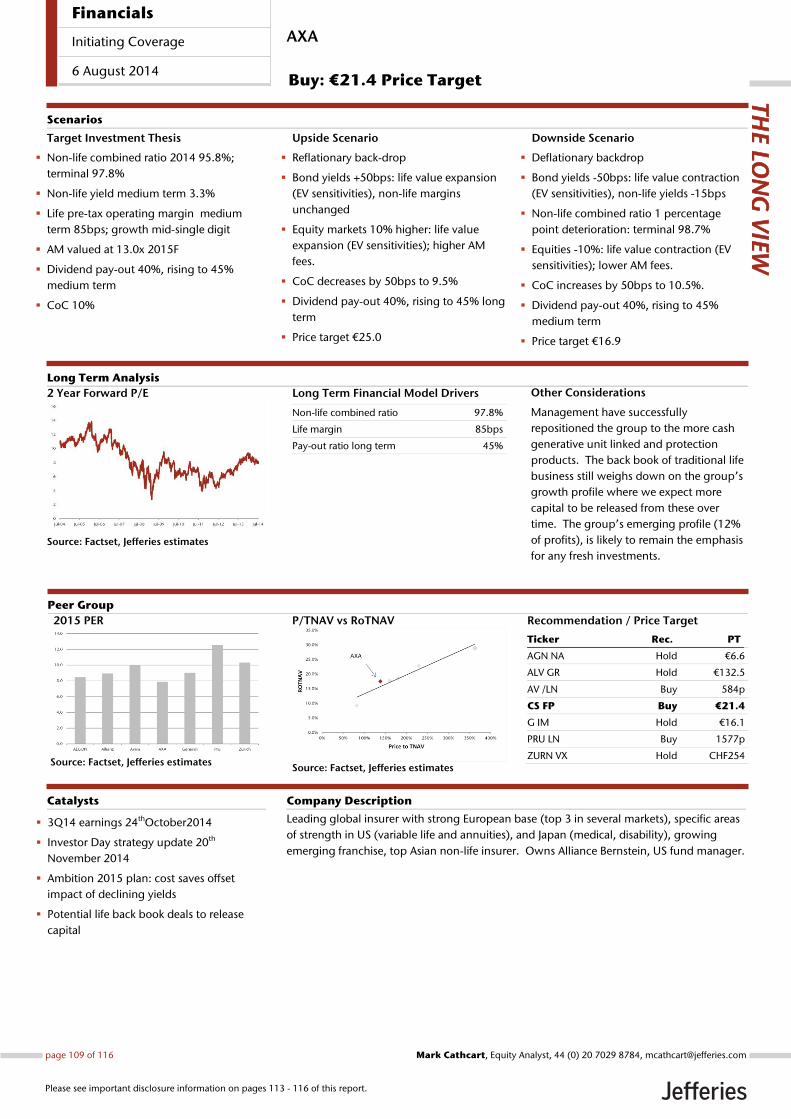
Long Term Financial Model Drivers
Non-life combined ratio 97.8%
Life margin 85bps
Pay-out ratio long term 45%
Other Considerations
Management have successfully
repositioned the group to the more cash
generative unit linked and protection
products. The back book of traditional life
business still weighs down on the group’s
growth profile where we expect more
capital to be released from these over
time. The group’s emerging profile (12%
of profits), is likely to remain the emphasis
for any fresh investments.
2 Year Forward P/E
Source: Factset, Jefferies estimates
Leading global insurer with strong European base (top 3 in several markets), specific areas
of strength in US (variable life and annuities), and Japan (medical, disability), growing
emerging franchise, top Asian non-life insurer. Owns Alliance Bernstein, US fund manager.
3Q14 earnings 24thOctober2014
Investor Day strategy update 20th
November 2014
Ambition 2015 plan: cost saves offset
impact of declining yields
Potential life back book deals to release
capital
Catalysts
Target Investment Thesis
Non-life combined ratio 2014 95.8%;
terminal 97.8%
Non-life yield medium term 3.3%
Life pre-tax operating margin medium
term 85bps; growth mid-single digit
AM valued at 13.0x 2015F
Dividend pay-out 40%, rising to 45%
medium term
CoC 10%
Upside Scenario
Reflationary back-drop
Bond yields +50bps: life value expansion
(EV sensitivities), non-life margins
unchanged
Equity markets 10% higher: life value
expansion (EV sensitivities); higher AM
fees.
CoC decreases by 50bps to 9.5%
Dividend pay-out 40%, rising to 45% long
term
Price target €25.0
Downside Scenario
Deflationary backdrop
Bond yields -50bps: life value contraction
(EV sensitivities), non-life yields -15bps
Non-life combined ratio 1 percentage
point deterioration: terminal 98.7%
Equities -10%: life value contraction (EV
sensitivities); lower AM fees.
CoC increases by 50bps to 10.5%.
Dividend pay-out 40%, rising to 45%
medium term
Price target €16.9
Long Term Analysis
Scenarios
2015 PER
Source: Factset, Jefferies estimates
P/TNAV vs RoTNAV
Source: Factset, Jefferies estimates
Recommendation / Price Target
Ticker Rec. PT
AGN NA Hold €6.6
ALV GR Hold €132.5
AV /LN Buy 584p
CS FP Buy €21.4
G IM Hold €16.1
PRU LN Buy 1577p
ZURN VX Hold CHF254
Company Description
THE LO
NG
VIE
W
Peer Group
AXA
Buy: €21.4 Price Target
Financials
Initiating Coverage
6 August 2014
page 109 of 116 , Equity Analyst, 44 (0) 20 7029 8784, [email protected] Cathcart
Please see important disclosure information on pages 113 - 116 of this report.
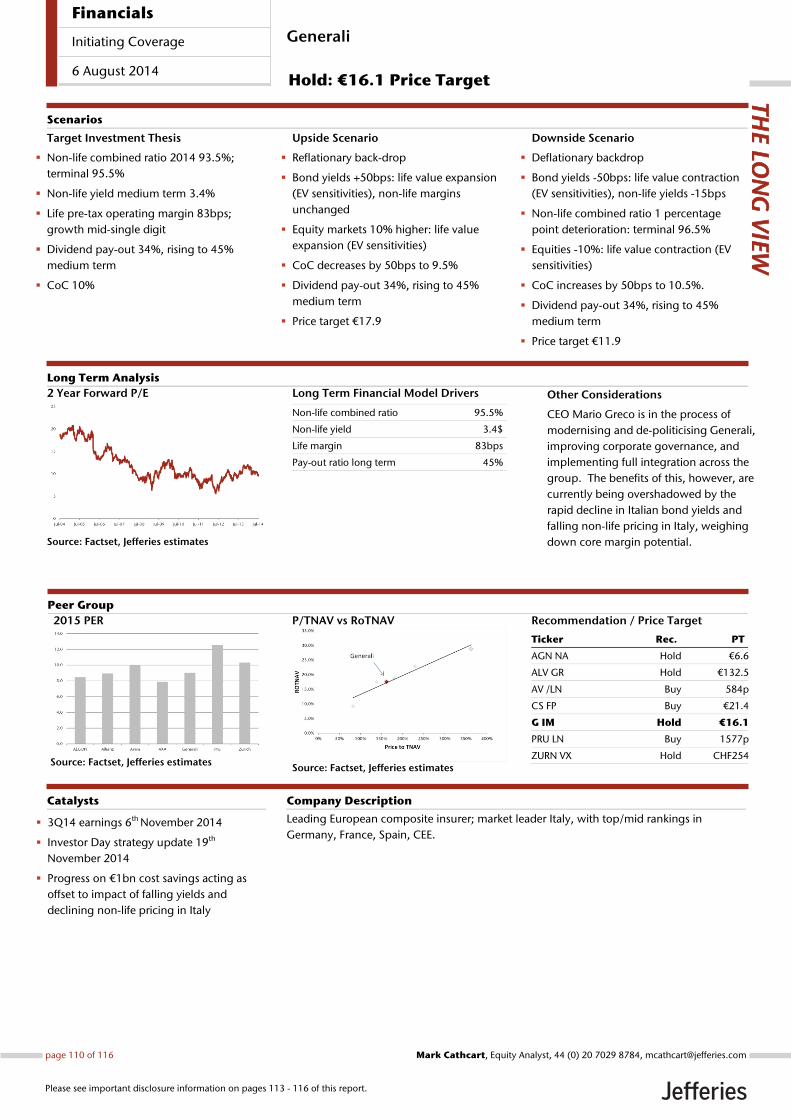
Long Term Financial Model Drivers
Non-life combined ratio 95.5%
Non-life yield 3.4$
Life margin 83bps
Pay-out ratio long term 45%
2 Year Forward P/E
Source: Factset, Jefferies estimates
Leading European composite insurer; market leader Italy, with top/mid rankings in
Germany, France, Spain, CEE. 3Q14 earnings 6th November 2014
Investor Day strategy update 19th
November 2014
Progress on €1bn cost savings acting as
offset to impact of falling yields and
declining non-life pricing in Italy
Catalysts
Target Investment Thesis
Non-life combined ratio 2014 93.5%;
terminal 95.5%
Non-life yield medium term 3.4%
Life pre-tax operating margin 83bps;
growth mid-single digit
Dividend pay-out 34%, rising to 45%
medium term
CoC 10%
Upside Scenario
Reflationary back-drop
Bond yields +50bps: life value expansion
(EV sensitivities), non-life margins
unchanged
Equity markets 10% higher: life value
expansion (EV sensitivities)
CoC decreases by 50bps to 9.5%
Dividend pay-out 34%, rising to 45%
medium term
Price target €17.9
Downside Scenario
Deflationary backdrop
Bond yields -50bps: life value contraction
(EV sensitivities), non-life yields -15bps
Non-life combined ratio 1 percentage
point deterioration: terminal 96.5%
Equities -10%: life value contraction (EV
sensitivities)
CoC increases by 50bps to 10.5%.
Dividend pay-out 34%, rising to 45%
medium term
Price target €11.9
Long Term Analysis
Scenarios
2015 PER
Source: Factset, Jefferies estimates
P/TNAV vs RoTNAV
Source: Factset, Jefferies estimates
Recommendation / Price Target
Ticker Rec. PT
AGN NA Hold €6.6
ALV GR Hold €132.5
AV /LN Buy 584p
CS FP Buy €21.4
G IM Hold €16.1
PRU LN Buy 1577p
ZURN VX Hold CHF254
Company Description
THE LO
NG
VIE
W
Peer Group
Generali
Hold: €16.1 Price Target
Other Considerations
CEO Mario Greco is in the process of
modernising and de-politicising Generali,
improving corporate governance, and
implementing full integration across the
group. The benefits of this, however, are
currently being overshadowed by the
rapid decline in Italian bond yields and
falling non-life pricing in Italy, weighing
down core margin potential.
Financials
Initiating Coverage
6 August 2014
page 110 of 116 , Equity Analyst, 44 (0) 20 7029 8784, [email protected] Cathcart
Please see important disclosure information on pages 113 - 116 of this report.
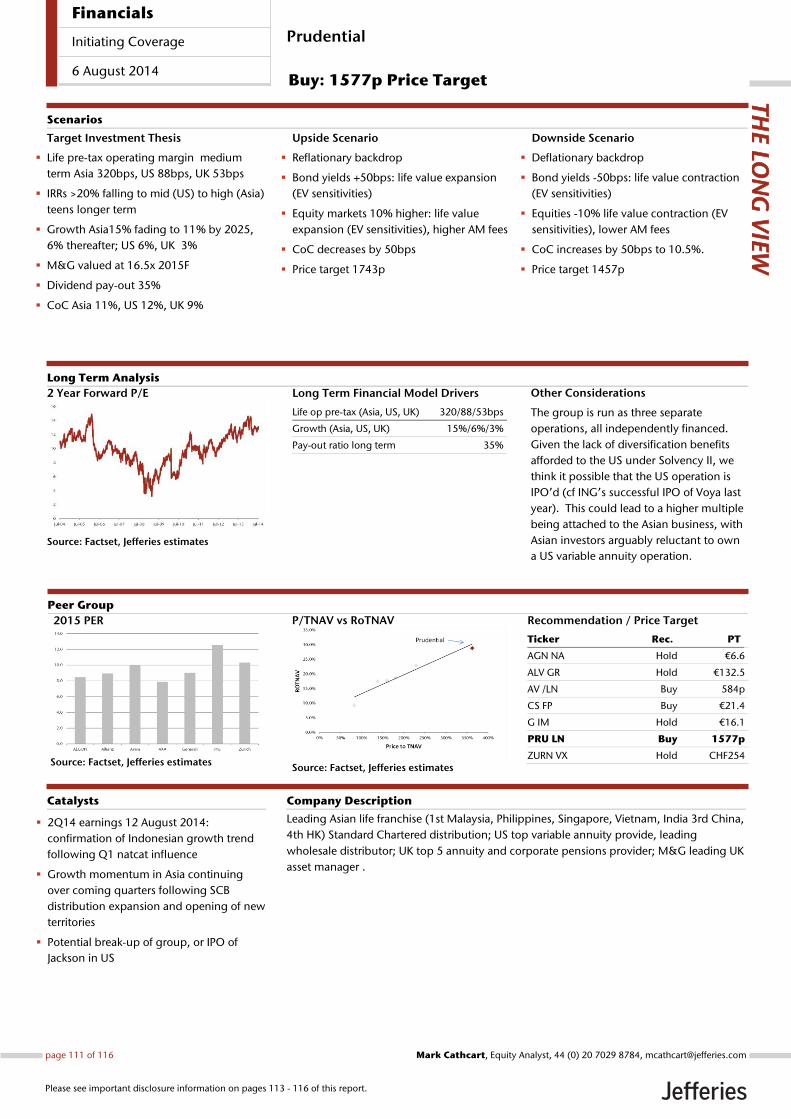
Long Term Financial Model Drivers
Life op pre-tax (Asia, US, UK) 320/88/53bps
Growth (Asia, US, UK) 15%/6%/3%
Pay-out ratio long term 35%
Other Considerations
The group is run as three separate
operations, all independently financed.
Given the lack of diversification benefits
afforded to the US under Solvency II, we
think it possible that the US operation is
IPO’d (cf ING’s successful IPO of Voya last
year). This could lead to a higher multiple
being attached to the Asian business, with
Asian investors arguably reluctant to own
a US variable annuity operation.
2 Year Forward P/E
Source: Factset, Jefferies estimates
Leading Asian life franchise (1st Malaysia, Philippines, Singapore, Vietnam, India 3rd China,
4th HK) Standard Chartered distribution; US top variable annuity provide, leading
wholesale distributor; UK top 5 annuity and corporate pensions provider; M&G leading UK
asset manager .
2Q14 earnings 12 August 2014:
confirmation of Indonesian growth trend
following Q1 natcat influence
Growth momentum in Asia continuing
over coming quarters following SCB
distribution expansion and opening of new
territories
Potential break-up of group, or IPO of
Jackson in US
Catalysts
Target Investment Thesis
Life pre-tax operating margin medium
term Asia 320bps, US 88bps, UK 53bps
IRRs >20% falling to mid (US) to high (Asia)
teens longer term
Growth Asia15% fading to 11% by 2025,
6% thereafter; US 6%, UK 3%
M&G valued at 16.5x 2015F
Dividend pay-out 35%
CoC Asia 11%, US 12%, UK 9%
Upside Scenario
Reflationary backdrop
Bond yields +50bps: life value expansion
(EV sensitivities)
Equity markets 10% higher: life value
expansion (EV sensitivities), higher AM fees
CoC decreases by 50bps
Price target 1743p
Downside Scenario
Deflationary backdrop
Bond yields -50bps: life value contraction
(EV sensitivities)
Equities -10% life value contraction (EV
sensitivities), lower AM fees
CoC increases by 50bps to 10.5%.
Price target 1457p
Long Term Analysis
Scenarios
2015 PER
Source: Factset, Jefferies estimates
P/TNAV vs RoTNAV
Source: Factset, Jefferies estimates
Recommendation / Price Target
Ticker Rec. PT
AGN NA Hold €6.6
ALV GR Hold €132.5
AV /LN Buy 584p
CS FP Buy €21.4
G IM Hold €16.1
PRU LN Buy 1577p
ZURN VX Hold CHF254
Company Description
THE LO
NG
VIE
W
Peer Group
Prudential
Buy: 1577p Price Target
Financials
Initiating Coverage
6 August 2014
page 111 of 116 , Equity Analyst, 44 (0) 20 7029 8784, [email protected] Cathcart
Please see important disclosure information on pages 113 - 116 of this report.
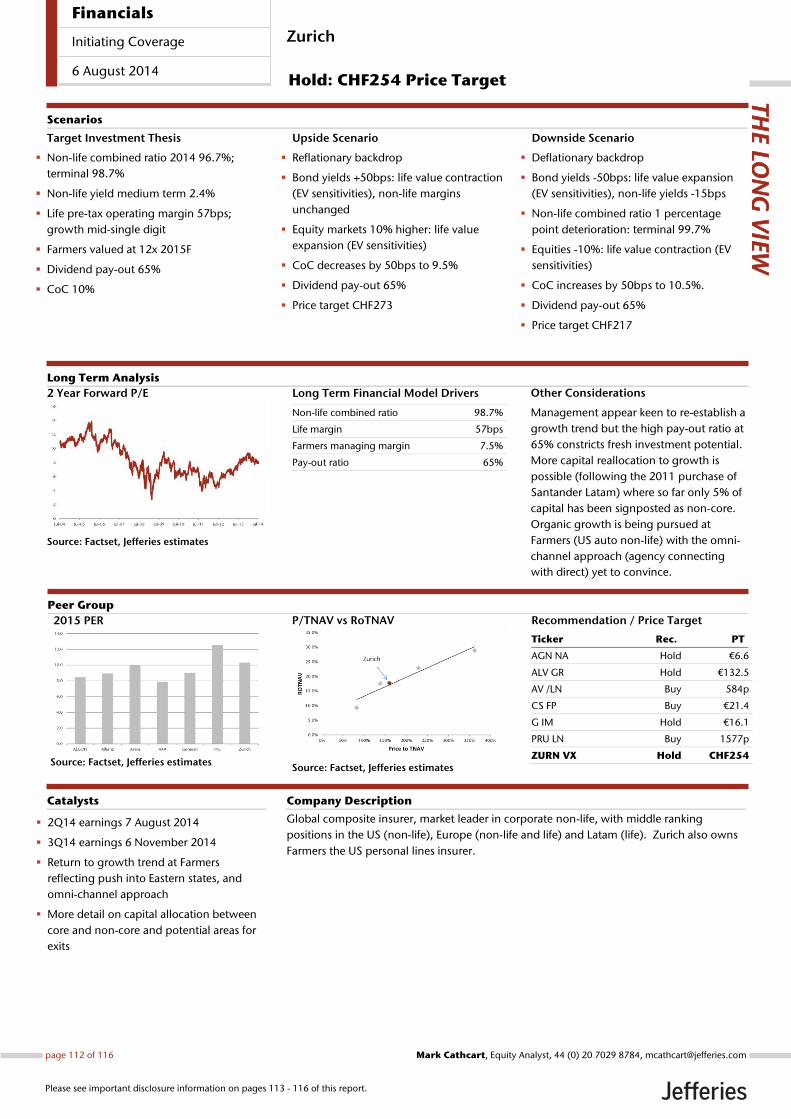
Long Term Financial Model Drivers
Non-life combined ratio 98.7%
Life margin 57bps
Farmers managing margin 7.5%
Pay-out ratio 65%
Other Considerations
Management appear keen to re-establish a
growth trend but the high pay-out ratio at
65% constricts fresh investment potential.
More capital reallocation to growth is
possible (following the 2011 purchase of
Santander Latam) where so far only 5% of
capital has been signposted as non-core.
Organic growth is being pursued at
Farmers (US auto non-life) with the omni-
channel approach (agency connecting
with direct) yet to convince.
2 Year Forward P/E
Source: Factset, Jefferies estimates
Global composite insurer, market leader in corporate non-life, with middle ranking
positions in the US (non-life), Europe (non-life and life) and Latam (life). Zurich also owns
Farmers the US personal lines insurer.
2Q14 earnings 7 August 2014
3Q14 earnings 6 November 2014
Return to growth trend at Farmers
reflecting push into Eastern states, and
omni-channel approach
More detail on capital allocation between
core and non-core and potential areas for
exits
Catalysts
Target Investment Thesis
Non-life combined ratio 2014 96.7%;
terminal 98.7%
Non-life yield medium term 2.4%
Life pre-tax operating margin 57bps;
growth mid-single digit
Farmers valued at 12x 2015F
Dividend pay-out 65%
CoC 10%
Upside Scenario
Reflationary backdrop
Bond yields +50bps: life value contraction
(EV sensitivities), non-life margins
unchanged
Equity markets 10% higher: life value
expansion (EV sensitivities)
CoC decreases by 50bps to 9.5%
Dividend pay-out 65%
Price target CHF273
Downside Scenario
Deflationary backdrop
Bond yields -50bps: life value expansion
(EV sensitivities), non-life yields -15bps
Non-life combined ratio 1 percentage
point deterioration: terminal 99.7%
Equities -10%: life value contraction (EV
sensitivities)
CoC increases by 50bps to 10.5%.
Dividend pay-out 65%
Price target CHF217
Long Term Analysis
Scenarios
2015 PER
Source: Factset, Jefferies estimates
P/TNAV vs RoTNAV
Source: Factset, Jefferies estimates
Recommendation / Price Target
Ticker Rec. PT
AGN NA Hold €6.6
ALV GR Hold €132.5
AV /LN Buy 584p
CS FP Buy €21.4
G IM Hold €16.1
PRU LN Buy 1577p
ZURN VX Hold CHF254
Company Description
THE LO
NG
VIE
W
Peer Group
Zurich
Hold: CHF254 Price Target
Financials
Initiating Coverage
6 August 2014
page 112 of 116 , Equity Analyst, 44 (0) 20 7029 8784, [email protected] Cathcart
Please see important disclosure information on pages 113 - 116 of this report.
Company DescriptionGlobal pensions, long term savings, life and health insurance provider predominantly in the US, Netherlands, the UK and CEE, with non-lifeoperations in the Netherlands, Spain and Hungary.
Aviva is the UK's leading life and non-life insurer focused on the mass-market segment and employing a multi-distribution approach acrossa range of products. It has also gained leading positions in Canadian non-life and US indexed annuities that add to a growing Europeanbancassurance network. The group is differentiated versus peers through distributing via banks versus traditional agents. More recently,strategic focus has sharpened towards the life and savings opportunity in Europe as opposed to Asia.
Generali is a European composite insurer, offering the full range of non-life, life and insurance products with market leading positions in Italy,Austria, Germany, France and the CEE.
Axa is a leading global multi-line insurer, enjoying uniquely diversified geographical insurance operations. It is underweight Asia ex-Japan,but no other insurance company offers the same breadth of life, non-life and asset management businesses. Axa has historically traded on asector premium partly reflecting above-growth prospects. This has been supported by geographical mix and the potential to leverage market-leading US product capability into a broad European distribution platform.
Allianz is a one of the world''s largest insurers. It is biased to personal non-life insurance in Continental Europe and the US but also hassignificant life and asset management operations (including Pimco in the US). Allianz sells mainly via proprietary distribution channels (tiedagents) differentiating it versus other insurers and supporting various cross-selling/ best practice initiatives. The life business has significantguarantees on its mainly traditional, spread-based reserves.
Prudential is a leading life and asset management company based in the UK. It has strong positions in the relatively mature and competitivemarkets of the UK and the US, and a large Asian franchise that is very well placed for long-term growth opportunities. Risky asset exposureis above average but partly balanced by relatively strong capitalisation.
Zurich Financial Services (ZFS) is one of the world's largest non-life insurers. It also has significant life insurance operations and a managementcompany known as Farmers. Zurich is based in Switzerland, reports in US$ and quoted in Swiss Francs.
Analyst CertificationI, Mark Cathcart, certify that all of the views expressed in this research report accurately reflect my personal views about the subject security(ies) andsubject company(ies). I also certify that no part of my compensation was, is, or will be, directly or indirectly, related to the specific recommendationsor views expressed in this research report.Registration of non-US analysts: Mark Cathcart is employed by Jefferies International Limited, a non-US affiliate of Jefferies LLC and is notregistered/qualified as a research analyst with FINRA. This analyst(s) may not be an associated person of Jefferies LLC, a FINRA member firm, andtherefore may not be subject to the NASD Rule 2711 and Incorporated NYSE Rule 472 restrictions on communications with a subject company, publicappearances and trading securities held by a research analyst.
As is the case with all Jefferies employees, the analyst(s) responsible for the coverage of the financial instruments discussed in this report receivescompensation based in part on the overall performance of the firm, including investment banking income. We seek to update our research asappropriate, but various regulations may prevent us from doing so. Aside from certain industry reports published on a periodic basis, the large majorityof reports are published at irregular intervals as appropriate in the analyst's judgement.Mark Cathcart holds a long equity position in AVIVA PLC.Mark Cathcart holds a long equity position in AXA SA.
Company Specific DisclosuresFor Important Disclosure information on companies recommended in this report, please visit our website at https://javatar.bluematrix.com/sellside/Disclosures.action or call 212.284.2300.
Meanings of Jefferies RatingsBuy - Describes stocks that we expect to provide a total return (price appreciation plus yield) of 15% or more within a 12-month period.Hold - Describes stocks that we expect to provide a total return (price appreciation plus yield) of plus 15% or minus 10% within a 12-month period.Underperform - Describes stocks that we expect to provide a total negative return (price appreciation plus yield) of 10% or more within a 12-monthperiod.The expected total return (price appreciation plus yield) for Buy rated stocks with an average stock price consistently below $10 is 20% or more withina 12-month period as these companies are typically more volatile than the overall stock market. For Hold rated stocks with an average stock priceconsistently below $10, the expected total return (price appreciation plus yield) is plus or minus 20% within a 12-month period. For Underperformrated stocks with an average stock price consistently below $10, the expected total return (price appreciation plus yield) is minus 20% within a 12-month period.NR - The investment rating and price target have been temporarily suspended. Such suspensions are in compliance with applicable regulations and/or Jefferies policies.CS - Coverage Suspended. Jefferies has suspended coverage of this company.NC - Not covered. Jefferies does not cover this company.
Financials
Initiating Coverage
6 August 2014
page 113 of 116 , Equity Analyst, 44 (0) 20 7029 8784, [email protected] Cathcart
Please see important disclosure information on pages 113 - 116 of this report.
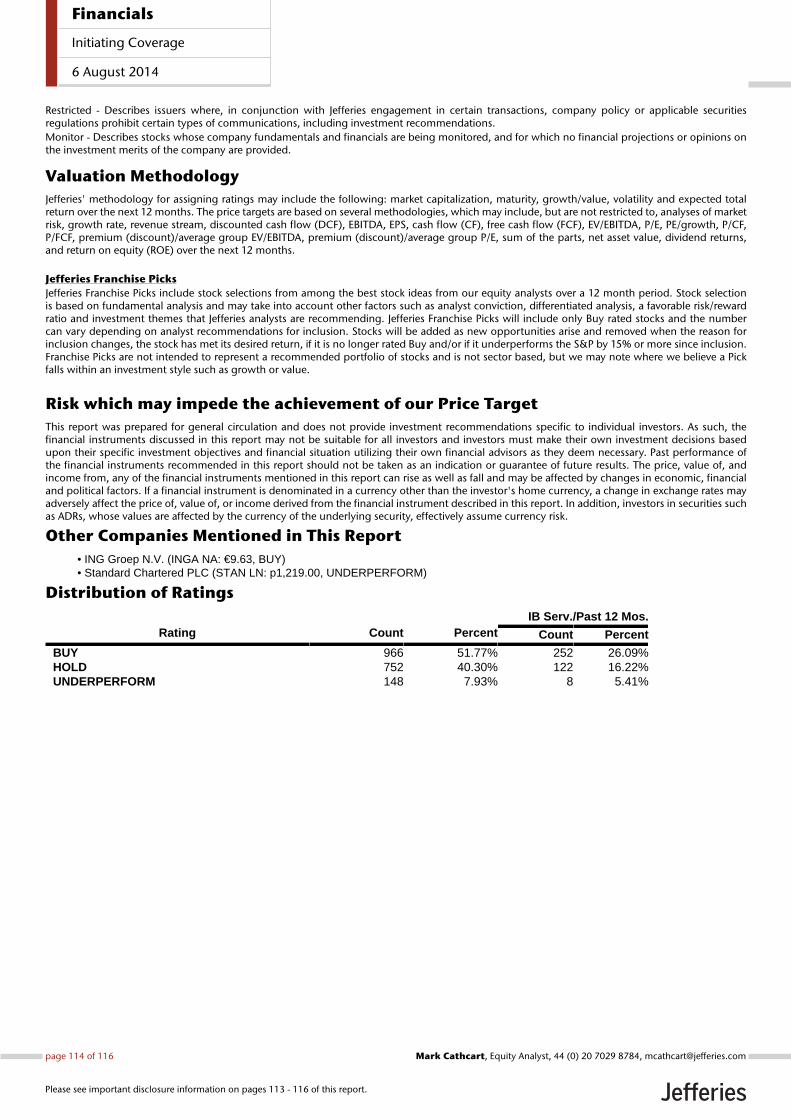
Restricted - Describes issuers where, in conjunction with Jefferies engagement in certain transactions, company policy or applicable securitiesregulations prohibit certain types of communications, including investment recommendations.Monitor - Describes stocks whose company fundamentals and financials are being monitored, and for which no financial projections or opinions onthe investment merits of the company are provided.
Valuation MethodologyJefferies' methodology for assigning ratings may include the following: market capitalization, maturity, growth/value, volatility and expected totalreturn over the next 12 months. The price targets are based on several methodologies, which may include, but are not restricted to, analyses of marketrisk, growth rate, revenue stream, discounted cash flow (DCF), EBITDA, EPS, cash flow (CF), free cash flow (FCF), EV/EBITDA, P/E, PE/growth, P/CF,P/FCF, premium (discount)/average group EV/EBITDA, premium (discount)/average group P/E, sum of the parts, net asset value, dividend returns,and return on equity (ROE) over the next 12 months.
Jefferies Franchise PicksJefferies Franchise Picks include stock selections from among the best stock ideas from our equity analysts over a 12 month period. Stock selectionis based on fundamental analysis and may take into account other factors such as analyst conviction, differentiated analysis, a favorable risk/rewardratio and investment themes that Jefferies analysts are recommending. Jefferies Franchise Picks will include only Buy rated stocks and the numbercan vary depending on analyst recommendations for inclusion. Stocks will be added as new opportunities arise and removed when the reason forinclusion changes, the stock has met its desired return, if it is no longer rated Buy and/or if it underperforms the S&P by 15% or more since inclusion.Franchise Picks are not intended to represent a recommended portfolio of stocks and is not sector based, but we may note where we believe a Pickfalls within an investment style such as growth or value.
Risk which may impede the achievement of our Price TargetThis report was prepared for general circulation and does not provide investment recommendations specific to individual investors. As such, thefinancial instruments discussed in this report may not be suitable for all investors and investors must make their own investment decisions basedupon their specific investment objectives and financial situation utilizing their own financial advisors as they deem necessary. Past performance ofthe financial instruments recommended in this report should not be taken as an indication or guarantee of future results. The price, value of, andincome from, any of the financial instruments mentioned in this report can rise as well as fall and may be affected by changes in economic, financialand political factors. If a financial instrument is denominated in a currency other than the investor's home currency, a change in exchange rates mayadversely affect the price of, value of, or income derived from the financial instrument described in this report. In addition, investors in securities suchas ADRs, whose values are affected by the currency of the underlying security, effectively assume currency risk.
Other Companies Mentioned in This Report• ING Groep N.V. (INGA NA: €9.63, BUY)• Standard Chartered PLC (STAN LN: p1,219.00, UNDERPERFORM)
Distribution of RatingsIB Serv./Past 12 Mos.
Rating Count Percent Count Percent
BUY 966 51.77% 252 26.09%HOLD 752 40.30% 122 16.22%UNDERPERFORM 148 7.93% 8 5.41%
Financials
Initiating Coverage
6 August 2014
page 114 of 116 , Equity Analyst, 44 (0) 20 7029 8784, [email protected] Cathcart
Please see important disclosure information on pages 113 - 116 of this report.
Other Important Disclosures
Jefferies Equity Research refers to research reports produced by analysts employed by one of the following Jefferies Group LLC (“Jefferies”) groupcompanies:
United States: Jefferies LLC which is an SEC registered firm and a member of FINRA.
United Kingdom: Jefferies International Limited, which is authorized and regulated by the Financial Conduct Authority; registered in England andWales No. 1978621; registered office: Vintners Place, 68 Upper Thames Street, London EC4V 3BJ; telephone +44 (0)20 7029 8000; facsimile +44 (0)207029 8010.
Hong Kong: Jefferies Hong Kong Limited, which is licensed by the Securities and Futures Commission of Hong Kong with CE number ATS546; locatedat Suite 2201, 22nd Floor, Cheung Kong Center, 2 Queen’s Road Central, Hong Kong.
Singapore: Jefferies Singapore Limited, which is licensed by the Monetary Authority of Singapore; located at 80 Raffles Place #15-20, UOB Plaza 2,Singapore 048624, telephone: +65 6551 3950.
Japan: Jefferies (Japan) Limited, Tokyo Branch, which is a securities company registered by the Financial Services Agency of Japan and is a memberof the Japan Securities Dealers Association; located at Hibiya Marine Bldg, 3F, 1-5-1 Yuraku-cho, Chiyoda-ku, Tokyo 100-0006; telephone +813 52516100; facsimile +813 5251 6101.
India: Jefferies India Private Limited (CIN - U74140MH2007PTC200509), which is licensed by the Securities and Exchange Board of India as a MerchantBanker (INM000011443) and a Stock Broker with Bombay Stock Exchange Limited (INB011491033) and National Stock Exchange of India Limited(INB231491037) in the Capital Market Segment; located at 42/43, 2 North Avenue, Maker Maxity, Bandra-Kurla Complex, Bandra (East) Mumbai 400051, India; Tel +91 22 4356 6000.
This material has been prepared by Jefferies employing appropriate expertise, and in the belief that it is fair and not misleading. The information setforth herein was obtained from sources believed to be reliable, but has not been independently verified by Jefferies. Therefore, except for any obligationunder applicable rules we do not guarantee its accuracy. Additional and supporting information is available upon request. Unless prohibited by theprovisions of Regulation S of the U.S. Securities Act of 1933, this material is distributed in the United States ("US"), by Jefferies LLC, a US-registeredbroker-dealer, which accepts responsibility for its contents in accordance with the provisions of Rule 15a-6, under the US Securities Exchange Act of1934. Transactions by or on behalf of any US person may only be effected through Jefferies LLC. In the United Kingdom and European EconomicArea this report is issued and/or approved for distribution by Jefferies International Limited and is intended for use only by persons who have, or havebeen assessed as having, suitable professional experience and expertise, or by persons to whom it can be otherwise lawfully distributed. JefferiesInternational Limited has adopted a conflicts management policy in connection with the preparation and publication of research, the details of whichare available upon request in writing to the Compliance Officer. Jefferies International Limited may allow its analysts to undertake private consultancywork. Jefferies International Limited’s conflicts management policy sets out the arrangements Jefferies International Limited employs to manage anypotential conflicts of interest that may arise as a result of such consultancy work. For Canadian investors, this material is intended for use only byprofessional or institutional investors. None of the investments or investment services mentioned or described herein is available to other personsor to anyone in Canada who is not a "Designated Institution" as defined by the Securities Act (Ontario). In Singapore, Jefferies Singapore Limited isregulated by the Monetary Authority of Singapore. For investors in the Republic of Singapore, this material is provided by Jefferies Singapore Limitedpursuant to Regulation 32C of the Financial Advisers Regulations. The material contained in this document is intended solely for accredited, expert orinstitutional investors, as defined under the Securities and Futures Act (Cap. 289 of Singapore). If there are any matters arising from, or in connectionwith this material, please contact Jefferies Singapore Limited, located at 80 Raffles Place #15-20, UOB Plaza 2, Singapore 048624, telephone: +656551 3950. In Japan this material is issued and distributed by Jefferies (Japan) Limited to institutional investors only. In Hong Kong, this report isissued and approved by Jefferies Hong Kong Limited and is intended for use only by professional investors as defined in the Hong Kong Securities andFutures Ordinance and its subsidiary legislation. In the Republic of China (Taiwan), this report should not be distributed. The research in relation tothis report is conducted outside the PRC. This report does not constitute an offer to sell or the solicitation of an offer to buy any securities in the PRC.PRC investors shall have the relevant qualifications to invest in such securities and shall be responsible for obtaining all relevant approvals, licenses,verifications and/or registrations from the relevant governmental authorities themselves. In India this report is made available by Jefferies India PrivateLimited. In Australia this information is issued solely by Jefferies International Limited and is directed solely at wholesale clients within the meaning ofthe Corporations Act 2001 of Australia (the "Act") in connection with their consideration of any investment or investment service that is the subject ofthis document. Any offer or issue that is the subject of this document does not require, and this document is not, a disclosure document or productdisclosure statement within the meaning of the Act. Jefferies International Limited is authorised and regulated by the Financial Conduct Authorityunder the laws of the United Kingdom, which differ from Australian laws. Jefferies International Limited has obtained relief under Australian Securitiesand Investments Commission Class Order 03/1099, which conditionally exempts it from holding an Australian financial services licence under theAct in respect of the provision of certain financial services to wholesale clients. Recipients of this document in any other jurisdictions should informthemselves about and observe any applicable legal requirements in relation to the receipt of this document.
This report is not an offer or solicitation of an offer to buy or sell any security or derivative instrument, or to make any investment. Any opinion orestimate constitutes the preparer's best judgment as of the date of preparation, and is subject to change without notice. Jefferies assumes no obligationto maintain or update this report based on subsequent information and events. Jefferies, its associates or affiliates, and its respective officers, directors,and employees may have long or short positions in, or may buy or sell any of the securities, derivative instruments or other investments mentioned ordescribed herein, either as agent or as principal for their own account. Upon request Jefferies may provide specialized research products or servicesto certain customers focusing on the prospects for individual covered stocks as compared to other covered stocks over varying time horizons orunder differing market conditions. While the views expressed in these situations may not always be directionally consistent with the long-term viewsexpressed in the analyst's published research, the analyst has a reasonable basis and any inconsistencies can be reasonably explained. This materialdoes not constitute a personal recommendation or take into account the particular investment objectives, financial situations, or needs of individualclients. Clients should consider whether any advice or recommendation in this report is suitable for their particular circumstances and, if appropriate,seek professional advice, including tax advice. The price and value of the investments referred to herein and the income from them may fluctuate. Pastperformance is not a guide to future performance, future returns are not guaranteed, and a loss of original capital may occur. Fluctuations in exchangerates could have adverse effects on the value or price of, or income derived from, certain investments. This report has been prepared independently ofany issuer of securities mentioned herein and not in connection with any proposed offering of securities or as agent of any issuer of securities. Noneof Jefferies, any of its affiliates or its research analysts has any authority whatsoever to make any representations or warranty on behalf of the issuer(s).Jefferies policy prohibits research personnel from disclosing a recommendation, investment rating, or investment thesis for review by an issuer prior
Financials
Initiating Coverage
6 August 2014
page 115 of 116 , Equity Analyst, 44 (0) 20 7029 8784, [email protected] Cathcart
Please see important disclosure information on pages 113 - 116 of this report.
to the publication of a research report containing such rating, recommendation or investment thesis. Any comments or statements made herein arethose of the author(s) and may differ from the views of Jefferies.
This report may contain information obtained from third parties, including ratings from credit ratings agencies such as Standard & Poor’s. Reproductionand distribution of third party content in any form is prohibited except with the prior written permission of the related third party. Third party contentproviders do not guarantee the accuracy, completeness, timeliness or availability of any information, including ratings, and are not responsible forany errors or omissions (negligent or otherwise), regardless of the cause, or for the results obtained from the use of such content. Third party contentproviders give no express or implied warranties, including, but not limited to, any warranties of merchantability or fitness for a particular purpose oruse. Third party content providers shall not be liable for any direct, indirect, incidental, exemplary, compensatory, punitive, special or consequentialdamages, costs, expenses, legal fees, or losses (including lost income or profits and opportunity costs) in connection with any use of their content,including ratings. Credit ratings are statements of opinions and are not statements of fact or recommendations to purchase, hold or sell securities. Theydo not address the suitability of securities or the suitability of securities for investment purposes, and should not be relied on as investment advice.
Jefferies research reports are disseminated and available primarily electronically, and, in some cases, in printed form. Electronic research issimultaneously available to all clients. This report or any portion hereof may not be reprinted, sold or redistributed without the written consent ofJefferies. Neither Jefferies nor any officer nor employee of Jefferies accepts any liability whatsoever for any direct, indirect or consequential damagesor losses arising from any use of this report or its contents.
For Important Disclosure information, please visit our website at https://javatar.bluematrix.com/sellside/Disclosures.action or call 1.888.JEFFERIES
© 2014 Jefferies Group LLC
Financials
Initiating Coverage
6 August 2014
page 116 of 116 , Equity Analyst, 44 (0) 20 7029 8784, [email protected] Cathcart
Please see important disclosure information on pages 113 - 116 of this report.