
EUROPEAN INFRASTRUCTURE STRATEGIC OUTLOOK JANUARY 2019€¦ · European Infrastructure Strategic...
45
January 2019 / Research Report EUROPEAN INFRASTRUCTURE STRATEGIC OUTLOOK JANUARY 2019 The brand DWS represents DWS Group GmbH & Co. KGaA and any of its subsidiaries, such as DWS Distributors, Inc., which offers investment products, or DWS Investment Management Americas Inc. and RREEF America L.L.C., which offer advisory services. There may be references in this document which do not yet reflect the DWS Brand. Please note certain information in this presentation constitutes forward-looking statements. Due to various risks, uncertainties and assumptions made in our analysis, actual events or results or the actual performance of the markets covered by this presentation report may differ materially from those described. The information herein reflects our current views only, is subject to change, and is not intended to be promissory or relied upon by the reader. There can be no certainty that events will turn out as we have opined herein. For Professional Clients (MiFID Directive 2014/65/EU Annex II) only. For Qualified Investors (Art. 10 Para. 3 of the Swiss Federal Collective Investment Schemes Act (CISA)). For Qualified Clients (Israeli Regulation of Investment Advice, Investment Marketing and Portfolio Management Law 5755-1995). Outside the U.S. for Institutional investors only. In the United States and Canada, for institutional client and registered representative use only. Not for retail distribution. Further distribution of this material is strictly prohibited. In Australia, for professional investors only. Marketing Material
Transcript of EUROPEAN INFRASTRUCTURE STRATEGIC OUTLOOK JANUARY 2019€¦ · European Infrastructure Strategic...
January 2019 / Research Report
EUROPEAN INFRASTRUCTURE
STRATEGIC OUTLOOK JANUARY 2019
The brand DWS represents DWS Group GmbH & Co. KGaA and any of its subsidiaries, such as DWS Distributors, Inc., which offers investment products, or DWS Investment Management Americas Inc. and RREEF America L.L.C., which offer advisory services. There may be references in this document which do not yet reflect the DWS Brand. Please note certain information in this presentation constitutes forward-looking statements. Due to various risks, uncertainties and assumptions made in our analysis, actual events or results or the actual performance of the markets covered by this presentation report may differ materially from those described. The information herein reflects our current views only, is subject to change, and is not intended to be promissory or relied upon by the reader. There can be no certainty that events will turn out as we have opined herein. For Professional Clients (MiFID Directive 2014/65/EU Annex II) only. For Qualified Investors (Art. 10 Para. 3 of the Swiss Federal Collective Investment Schemes Act (CISA)). For Qualified Clients (Israeli Regulation of Investment Advice, Investment Marketing and Portfolio Management Law 5755-1995). Outside the U.S. for Institutional investors only. In the United States and Canada, for institutional client and registered representative use only. Not for retail distribution. Further distribution of this material is strictly prohibited. In Australia, for professional investors only.
Marketing Material


``
Table of Contents
1 / Executive Summary ........................................................................................2
2 / Strategic Themes ............................................................................................4
3 / Macroeconomic Outlook ................................................................................6
4 / Infrastructure Outlook ....................................................................................9
4.1 Industry Update .............................................................................................. 9
4.2 Equity Market Update ................................................................................... 11
4.3 Debt Market Update ..................................................................................... 17
5 / Key Sectors ................................................................................................... 21
5.1 Transportation .............................................................................................. 21
5.2 Energy, Utilities & Networks ......................................................................... 26
5.3 Telecommunications Infrastructure ............................................................... 32
Important Information ............................................................................................. 37
Research & Strategy—Alternatives ........................................................................ 41
The opinions and forecasts expressed are those of European Infrastructure Strategic Outlook and not necessarily those of DWS. All opinions and claims are based upon data at the time of publication of this article (January 2019) and may not come to pass. This information is subject to change at any time, based upon economic, market and other conditions and should not be construed as a recommendation.

European Infrastructure Strategic Outlook January 2019
2
1 / Executive Summary1
— The European economy probably peaked in 2018, but prospects for 2019 appear solid, implying a period of continued
growth ahead of us and supporting infrastructure investment fundamentals. We believe that it would take a big shock to
derail the economy from its prospects of firm medium-term expansion. Nevertheless, risks remain on the horizon, including
a potential escalation of trade barriers and faster monetary policy normalization. We continue to see some short-term
political uncertainty in Europe, with European parliament elections scheduled for May 2019 and Brexit uncertainty.2
— The pipeline of European infrastructure opportunities remains solid3. Europe represents globally the key market for core
and core plus infrastructure investment strategies, offering diversification opportunities across countries and sectors.4
For 2019, we believe that the most relevant European markets for infrastructure investment remain core markets like the
United Kingdom, Germany, the Netherlands, the Nordics and France, as well as Italy, Spain, and Portugal, which combine
slightly higher risk/return potential with relatively strong market fundamentals.5
The aforementioned European markets offer a mature investment environment, a transparent institutional framework, and
a long history of private infrastructure ownership. These factors are important for core/core plus investment strategies
targeting inflation-hedged, long-term income return stability, relatively low cash-flow volatility, and some capital growth
potential.6 Today, U.S. infrastructure may offer the opportunity for long-term investors to diversify European portfolios
globally, particularly across the contracted energy space, where opportunities in Europe are somewhat more limited.7
— For 2019, we are forecasting levered, entry returns for core assets8 in mature European markets to be in the range of
7.5% to 10% (IRR9).10 Eurozone bond yields are set to gradually increase, but to remain below their long-term historical
average11. This will drive entry IRRs marginally higher compared with 2018. We continue to see a sound premium over
government bond yields, but in the core space12 we see this premium remaining tight. In the core plus space, particularly
the middle market13, we continue to see the opportunity to acquire assets at a risk-adjusted premium over core strategies.
Levered, entry return assumptions are in the range of 9.5% to 12.5% (IRR), reflecting an expected gradual rise in bond
1 Any forecasts provided herein are based on DWS’s opinion at time of publication and are subject to change. 2 Oxford Economics, 23 November 2018. 3 Infrastructure Journal database, 17 November 2018. 4 Preqin, “Q3 2018 Fundraising Update”, October 2018. 5 Based on DWS proprietary methodology for ranking unlisted infrastructure markets as at 25.11.2018, 30 November 2018. 6 Preqin, January 2018. 7 Based on DWS proprietary methodology for ranking unlisted infrastructure markets as at 25.11.2018, 30 November 2018. 8 Core infrastructure includes brownfield assets in geographically mature markets, with returns predominantly based on income return. Income return is predictable
in the long term, based on regulation or contractual structure, while capital appreciation potential is more limited. Core assets provide essential services in
economically and demographically mature areas, are often fully regulated, and technological obsolescence risk is minimal, contributing to low return volatility. 9 IRR = Internal Rate of Return. 10 Based on DWS proprietary methodology for ranking unlisted infrastructure sectors as at 25.11.2018. Valuations for 2019 are based on a ten year dividend
discount model and a terminal value calculated as a ten year annuity. Dividend yields, leverage, growth, exit assumptions and discount rate vary by country and
sector, 30 November 2018. 11 Oxford Economics, 23 November 2018. 12 Core plus infrastructure includes brownfield assets in geographically mature markets, often with some development risk. Income return visibility is supported by
regulation or contractual structure, providing long-term income return visibility, but capital return contributes to return expectations more than for core assets, and
total return volatility is potentially higher than for core assets. 13 The middle market includes assets requiring equity checks in the range of EUR 250 million to EUR 500 million, offering a value proposition that is less competitive
than the market for large-scale core assets. Opportunities in the middle market often enable acquirers to compete on factors other than price, including, such as
business plan strength and asset management/ industry expertise.

European Infrastructure Strategic Outlook January 2019
3
yields in 2019, and earnings growth assumptions reflecting a moderation in medium-term economic growth. Inflation
should slightly pick-up, but slowly,14 supporting the performance of assets with inflation-linked tariffs.15
— From a portfolio perspective, core regulated infrastructure is beneficial to balance systemic risk in a portfolio. However,
returns remain capped by material dry powder targeting core strategies, especially for larger deals. Assets in the core
plus space with resilient infrastructure profiles – which support income return, but with flexibility to manage revenues,
costs and capex, providing a platform for active asset management – may mitigate the effect of potentially rising interest
rates on valuations and drive long-term value generation.
— European transportation is set to continue to benefit from the favourable medium-term economic outlook,16 but traffic
growth may moderate from the peak levels observed in 2018, with airports continuing to outperform toll roads on the back
of solid global industry dynamics. In the medium term, we expect further rolling stock investment opportunities across a
number of national and local transport markets, driven by a gradual process of liberalization of European transportation.17
— For 2019, power demand will remain sluggish in most European countries due to energy efficiency, while forward energy
prices point downwards after the increase of 2018.18 Mid-merit thermal generation continues to be challenged by rising
renewables. In the medium term, thermal baseload gas power plants may benefit from additional capacity reductions
reducing excess supply, rising intermittency driven by renewables backing capacity markets, and an increase in the share
of liquefied natural gas (LNG) supporting prices in several European markets.19
— From a long-term investor perspective, we recognise that in Europe fading subsidies for brownfield renewables can
expose investors to tail risks, while subsidy regimes for new projects, based on auction mechanisms or contract for
difference (CFD), may cap profitability.20 Our view remains favourable for Energy from Waste (EfW) projects in certain
European countries, including for example the United Kingdom, on the back of growing barriers to landfills, a shortage of
EfW capacity, rising waste volumes, and limits to recycling targets.21
— European utilities have now largely completed their multi-year asset disposal programs, and refocused their business
profiles on networks and renewables. In 2019, a number of European utilities will publish new strategic plans that will
provide an important indication on their long-term investment strategies and how they will respond to the growing trends
of digitalization and transport electrification.22 We expect utilities, particularly at municipal level, to target industrial and
financial partnerships to redefine their business models, and do not exclude a renewed wave on M&A activity, unlocking
potential investment opportunities.
Looking at networks, a number of regulatory determinations will take place during 2019, with frameworks fundamentally
expected to remain unchanged. However, allowed returns should continue to decline, further compressing the spread
over long-term government bond yield.23
— We view the telecom infrastructure space favourably, as digitalisation continues to generate strong data demand growth,
supporting fundamentals for fibre networks and telecom towers.24 Technological change represents an accelerating and
highly disruptive driver for the infrastructure industry, with 5G, battery storage, smart grids and electric mobility potentially
offering more opportunities for long-term investors as they mature in coming years.
14 Oxford Economics, 23 November 2018. 15 Based on DWS proprietary methodology for ranking unlisted infrastructure sectors as at 25.11.2018. 16 Oxford Economics, 23 November 2018. 17 Based on DWS proprietary methodology for ranking unlisted infrastructure sectors as at 25.11.2018. 18 Bloomberg, 11 November 2018. 19 S&P Global, Platts, November 2018. 20 S&P Global, Platts, November 2018. 21 Based on DWS proprietary methodology for ranking unlisted infrastructure sectors as at 25.11.2018. 22 S&P Global, Platts, November 2018. 23 Moody’s Investors Service, “Regulated electric and gas networks”, 21 November 2018. 24 Based on Bloomberg data, as at 30 November 2018.
European Infrastructure Strategic Outlook January 2019
4
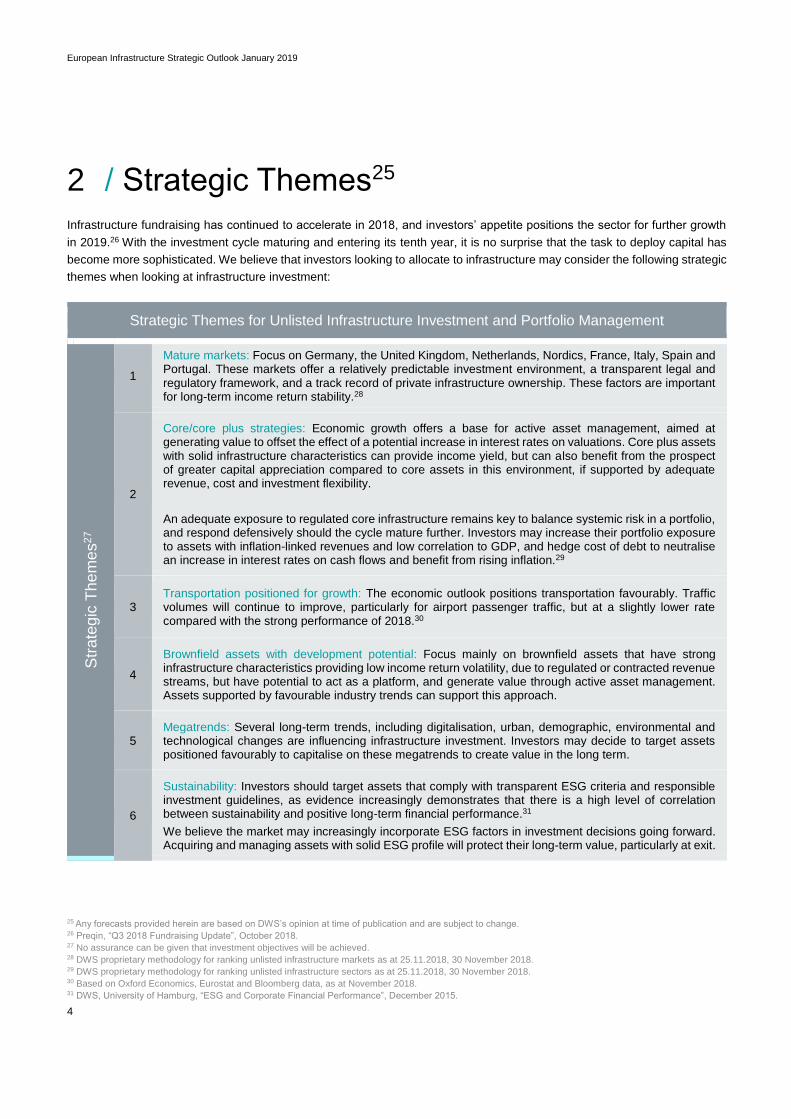
2 / Strategic Themes25
Infrastructure fundraising has continued to accelerate in 2018, and investors’ appetite positions the sector for further growth
in 2019.26 With the investment cycle maturing and entering its tenth year, it is no surprise that the task to deploy capital has
become more sophisticated. We believe that investors looking to allocate to infrastructure may consider the following strategic
themes when looking at infrastructure investment:
Strategic Themes for Unlisted Infrastructure Investment and Portfolio Management
Str
ate
gic
Th
em
es
27
1
Mature markets: Focus on Germany, the United Kingdom, Netherlands, Nordics, France, Italy, Spain and Portugal. These markets offer a relatively predictable investment environment, a transparent legal and regulatory framework, and a track record of private infrastructure ownership. These factors are important for long-term income return stability.28
2
Core/core plus strategies: Economic growth offers a base for active asset management, aimed at generating value to offset the effect of a potential increase in interest rates on valuations. Core plus assets with solid infrastructure characteristics can provide income yield, but can also benefit from the prospect of greater capital appreciation compared to core assets in this environment, if supported by adequate revenue, cost and investment flexibility.
An adequate exposure to regulated core infrastructure remains key to balance systemic risk in a portfolio, and respond defensively should the cycle mature further. Investors may increase their portfolio exposure to assets with inflation-linked revenues and low correlation to GDP, and hedge cost of debt to neutralise an increase in interest rates on cash flows and benefit from rising inflation.29
3 Transportation positioned for growth: The economic outlook positions transportation favourably. Traffic volumes will continue to improve, particularly for airport passenger traffic, but at a slightly lower rate compared with the strong performance of 2018.30
4
Brownfield assets with development potential: Focus mainly on brownfield assets that have strong infrastructure characteristics providing low income return volatility, due to regulated or contracted revenue streams, but have potential to act as a platform, and generate value through active asset management. Assets supported by favourable industry trends can support this approach.
5 Megatrends: Several long-term trends, including digitalisation, urban, demographic, environmental and technological changes are influencing infrastructure investment. Investors may decide to target assets positioned favourably to capitalise on these megatrends to create value in the long term.
6
Sustainability: Investors should target assets that comply with transparent ESG criteria and responsible investment guidelines, as evidence increasingly demonstrates that there is a high level of correlation between sustainability and positive long-term financial performance.31
We believe the market may increasingly incorporate ESG factors in investment decisions going forward. Acquiring and managing assets with solid ESG profile will protect their long-term value, particularly at exit.
25 Any forecasts provided herein are based on DWS’s opinion at time of publication and are subject to change. 26 Preqin, “Q3 2018 Fundraising Update”, October 2018. 27 No assurance can be given that investment objectives will be achieved. 28 DWS proprietary methodology for ranking unlisted infrastructure markets as at 25.11.2018, 30 November 2018. 29 DWS proprietary methodology for ranking unlisted infrastructure sectors as at 25.11.2018, 30 November 2018. 30 Based on Oxford Economics, Eurostat and Bloomberg data, as at November 2018. 31 DWS, University of Hamburg, “ESG and Corporate Financial Performance”, December 2015.
European Infrastructure Strategic Outlook January 2019
5
Ris
k
Aw
are
ne
ss
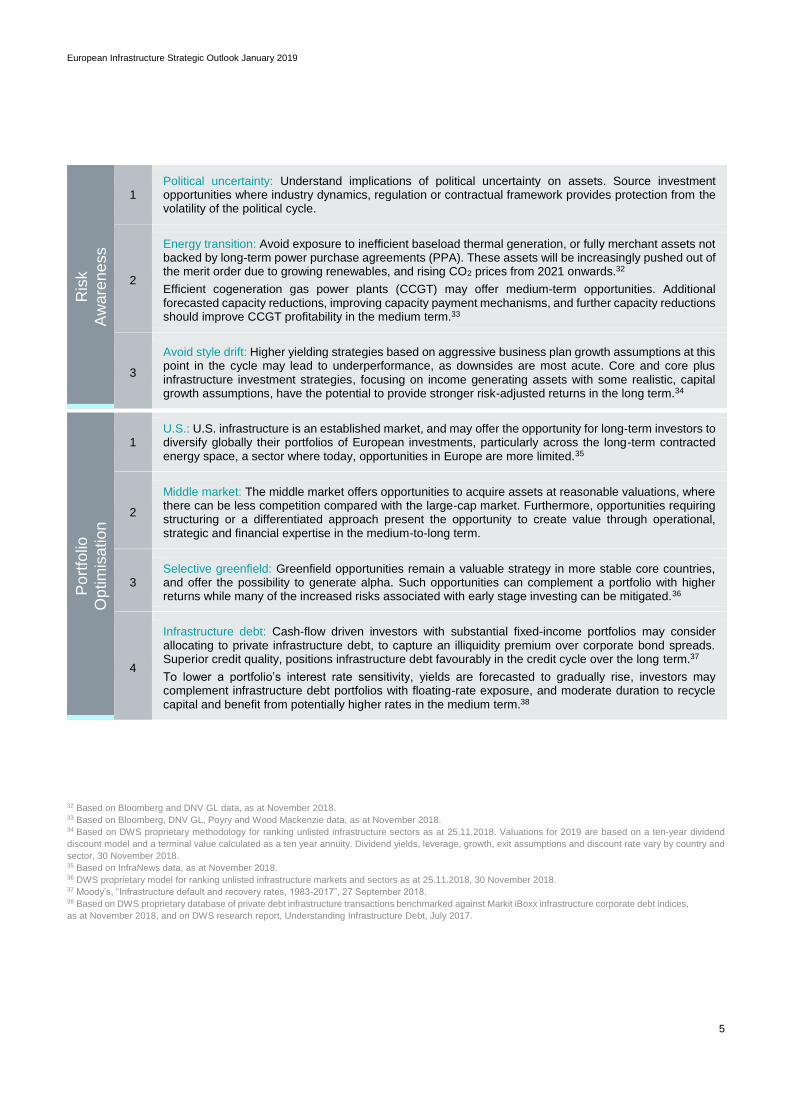
1 Political uncertainty: Understand implications of political uncertainty on assets. Source investment opportunities where industry dynamics, regulation or contractual framework provides protection from the volatility of the political cycle.
2
Energy transition: Avoid exposure to inefficient baseload thermal generation, or fully merchant assets not backed by long-term power purchase agreements (PPA). These assets will be increasingly pushed out of the merit order due to growing renewables, and rising CO2 prices from 2021 onwards.32
Efficient cogeneration gas power plants (CCGT) may offer medium-term opportunities. Additional forecasted capacity reductions, improving capacity payment mechanisms, and further capacity reductions should improve CCGT profitability in the medium term.33
3
Avoid style drift: Higher yielding strategies based on aggressive business plan growth assumptions at this point in the cycle may lead to underperformance, as downsides are most acute. Core and core plus infrastructure investment strategies, focusing on income generating assets with some realistic, capital growth assumptions, have the potential to provide stronger risk-adjusted returns in the long term.34
Po
rtfo
lio
Op
tim
isation
1 U.S.: U.S. infrastructure is an established market, and may offer the opportunity for long-term investors to diversify globally their portfolios of European investments, particularly across the long-term contracted energy space, a sector where today, opportunities in Europe are more limited.35
2
Middle market: The middle market offers opportunities to acquire assets at reasonable valuations, where there can be less competition compared with the large-cap market. Furthermore, opportunities requiring structuring or a differentiated approach present the opportunity to create value through operational, strategic and financial expertise in the medium-to-long term.
3 Selective greenfield: Greenfield opportunities remain a valuable strategy in more stable core countries, and offer the possibility to generate alpha. Such opportunities can complement a portfolio with higher returns while many of the increased risks associated with early stage investing can be mitigated.36
4
Infrastructure debt: Cash-flow driven investors with substantial fixed-income portfolios may consider allocating to private infrastructure debt, to capture an illiquidity premium over corporate bond spreads. Superior credit quality, positions infrastructure debt favourably in the credit cycle over the long term.37
To lower a portfolio’s interest rate sensitivity, yields are forecasted to gradually rise, investors may complement infrastructure debt portfolios with floating-rate exposure, and moderate duration to recycle capital and benefit from potentially higher rates in the medium term.38
32 Based on Bloomberg and DNV GL data, as at November 2018. 33 Based on Bloomberg, DNV GL, Poyry and Wood Mackenzie data, as at November 2018. 34 Based on DWS proprietary methodology for ranking unlisted infrastructure sectors as at 25.11.2018. Valuations for 2019 are based on a ten-year dividend
discount model and a terminal value calculated as a ten year annuity. Dividend yields, leverage, growth, exit assumptions and discount rate vary by country and
sector, 30 November 2018. 35 Based on InfraNews data, as at November 2018. 36 DWS proprietary model for ranking unlisted infrastructure markets and sectors as at 25.11.2018, 30 November 2018. 37 Moody’s, “Infrastructure default and recovery rates, 1983-2017”, 27 September 2018. 38 Based on DWS proprietary database of private debt infrastructure transactions benchmarked against Markit iBoxx infrastructure corporate debt indices,
as at November 2018, and on DWS research report, Understanding Infrastructure Debt, July 2017.
European Infrastructure Strategic Outlook January 2019
6
3 / Macroeconomic Outlook
Global Growth Supportive: In late 2017, when we undertook our previous outlook, the forecast for Eurozone GDP growth in
2018 and 2019 was 2.0% per annum. While the global expansion appears to have peaked, leading indicators continue to
point to healthy growth across most economies.39 In 2019, economic growth will probably decelerate across advanced and
emerging markets. We might observe some cyclical moderation to trend growth, but the economy should be supportive in
advanced markets throughout 2019.
Today, although global growth might have peaked, the economy appears more balanced than it was ten years ago, and we
observe fewer external imbalances; labour markets appear resilient in developed economies, and profits remain solid, despite
the prospects of gradually raising interest expenses and rising wages. Global growth may be weaker than what we observed
before 2008, but growth has appeared steady and resilient in the last decade. We see this scenario continuing in the medium
term, and believe that only a bigger shock would have the potential to derail the global economy.40
U.S. growth is supported by fiscal stimulus, tax cuts and higher public spending, boosting GDP and job growth in 2019. In the
medium term U.S. economic growth may decelerate, as interest rates continue to rise gradually, wage growth picks up, and
the effects of fiscal stimulus fade. While China’s growth, alongside exports have held up well so far, Chinese authorities have
already taken several measures to support growth, in the context of rising trade tariffs. For 2019, we forecast policy easing
keeping GDP growth at 6%, after reaching 6.5% in 2018.41
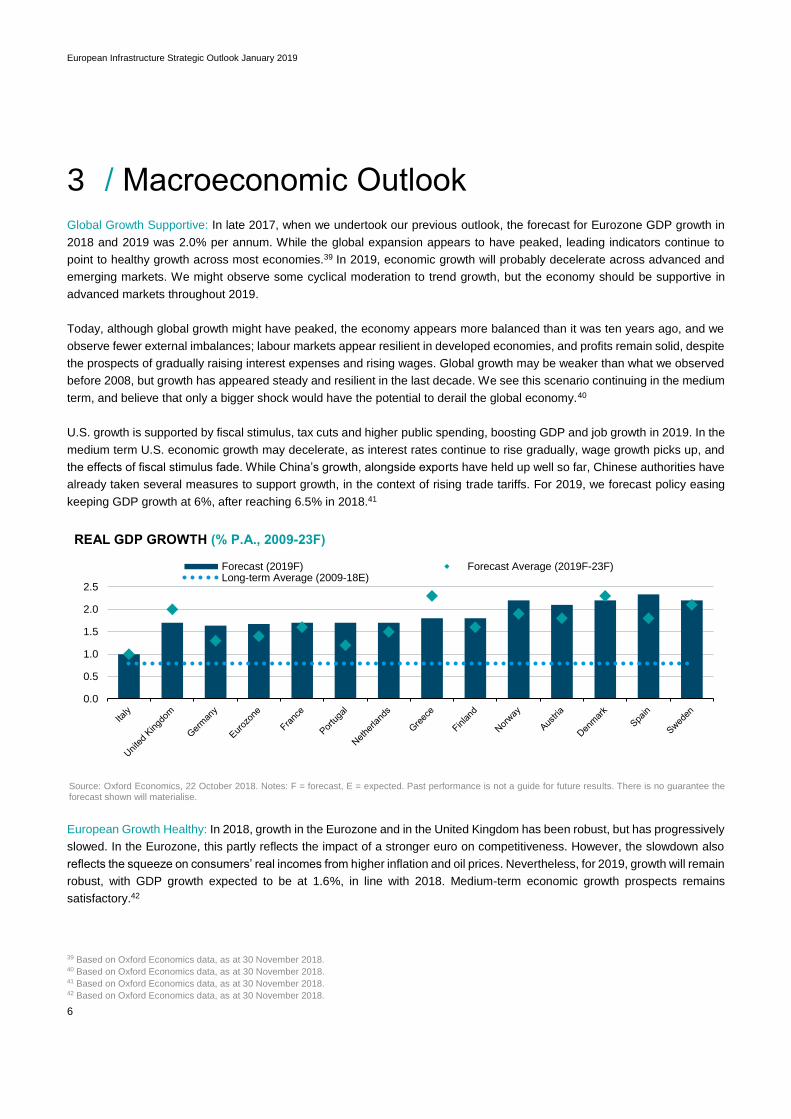
REAL GDP GROWTH (% P.A., 2009-23F)
Source: Oxford Economics, 22 October 2018. Notes: F = forecast, E = expected. Past performance is not a guide for future results. There is no guarantee the forecast shown will materialise.
European Growth Healthy: In 2018, growth in the Eurozone and in the United Kingdom has been robust, but has progressively
slowed. In the Eurozone, this partly reflects the impact of a stronger euro on competitiveness. However, the slowdown also
reflects the squeeze on consumers’ real incomes from higher inflation and oil prices. Nevertheless, for 2019, growth will remain
robust, with GDP growth expected to be at 1.6%, in line with 2018. Medium-term economic growth prospects remains
satisfactory.42
39 Based on Oxford Economics data, as at 30 November 2018. 40 Based on Oxford Economics data, as at 30 November 2018. 41 Based on Oxford Economics data, as at 30 November 2018. 42 Based on Oxford Economics data, as at 30 November 2018.
0.0
0.5
1.0
1.5
2.0
2.5
Forecast (2019F) Forecast Average (2019F-23F)Long-term Average (2009-18E)
European Infrastructure Strategic Outlook January 2019
7
In 2018, German economic growth remained strong, but eased in the second part of the year due to domestic capacity
constraints and slower external demand. For 2019, we expect GDP growth to reach 1.6%, in line with the 2018 average. Italy
and France will benefit from supportive fiscal policy, helping to lift growth in line with the 2018 average, at 1.1% and 1.6%
respectively. Looking to our five year forecast period, economic growth in Europe should remain above the long-term historical
average, with Spain, Sweden, and the United Kingdom continuing to be the top performers in Western Europe.43 Current
forecasts suggest U.K economic growth to accelerate in 2019, with GDP growth reaching 1.7% from 1.3% in 2018.44 At the
time of writing, the outlook remains uncertain, and subject to ongoing Brexit negotiations. 45
Risks: Beyond Brexit, and related political uncertainty in the United Kingdom, there are other risks to the macroeconomic
outlook. The external environment for emerging markets will continue to weigh on growth, while an escalation of geopolitical
tensions may drive up oil prices. A prolonged U.S. - China trade dispute could impact the global economy, moderating trade
flows and leading to uncertainty around company investment. Moreover, rising populism could increasingly influence political
debates and policymaking in Europe, with European parliament elections scheduled for May 2019. Global financial conditions
will continue to tighten gradually, amid monetary policy normalization in developed economies, particularly in the United
States.46 There is scope for further monetary easing in China and emerging markets.
A risk to the macroeconomic outlook would stem from substantially tighter monetary policies, which may cause a short-term
rates rise relative to longer-term rates, and driving an adjustment in financial markets. In our base case the credit cycle remains
healthy amid historically low default rates. However, a scenario of tighter financial conditions driven by rising inflation might
affect corporate funding cost, weakening the credit cycle.
European Infrastructure: The current macroeconomic outlook in Europe, supported by favourable medium-term economic
growth, suggests that infrastructure performance should remain robust over the coming years across various sectors. In
particular, economic growth represents a good opportunity for GDP-linked infrastructure – including airports – to gain from
improving economic fundamentals and sustained demand. Resilient economic growth in China and firming emerging market
growth is supportive for global port operations. 47
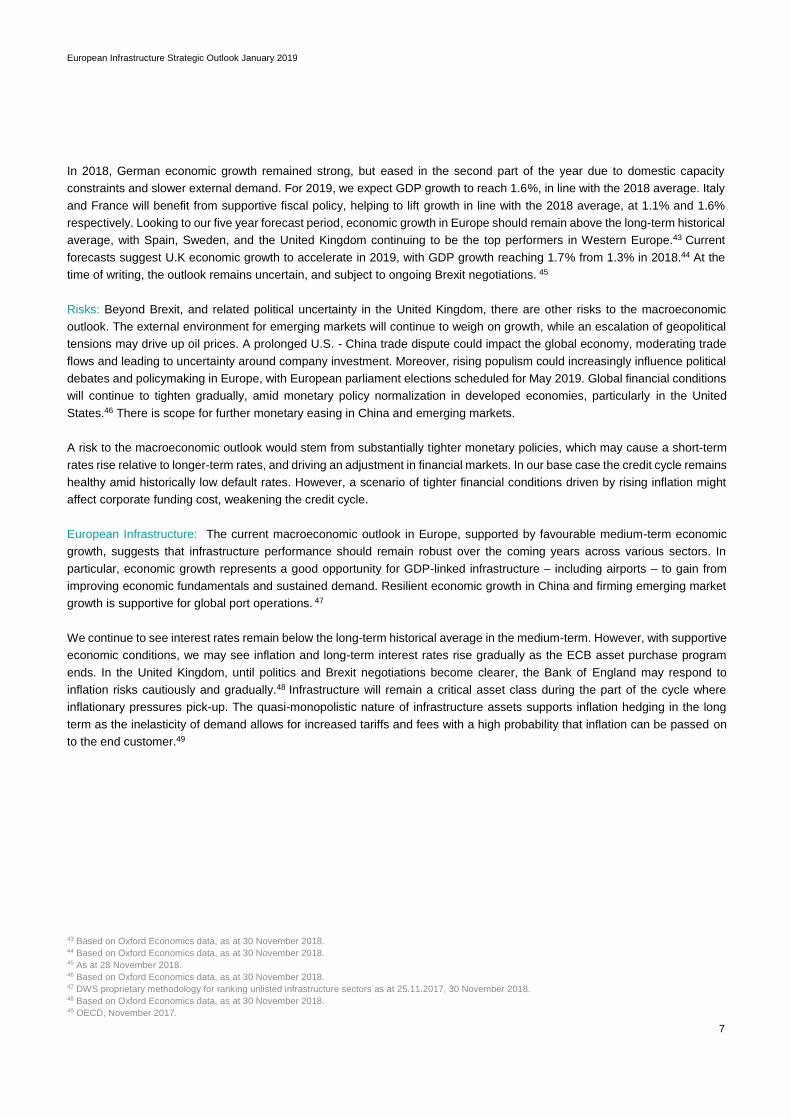
We continue to see interest rates remain below the long-term historical average in the medium-term. However, with supportive
economic conditions, we may see inflation and long-term interest rates rise gradually as the ECB asset purchase program
ends. In the United Kingdom, until politics and Brexit negotiations become clearer, the Bank of England may respond to
inflation risks cautiously and gradually.48 Infrastructure will remain a critical asset class during the part of the cycle where
inflationary pressures pick-up. The quasi-monopolistic nature of infrastructure assets supports inflation hedging in the long
term as the inelasticity of demand allows for increased tariffs and fees with a high probability that inflation can be passed on
to the end customer.49
43 Based on Oxford Economics data, as at 30 November 2018. 44 Based on Oxford Economics data, as at 30 November 2018. 45 As at 28 November 2018. 46 Based on Oxford Economics data, as at 30 November 2018. 47 DWS proprietary methodology for ranking unlisted infrastructure sectors as at 25.11.2017, 30 November 2018. 48 Based on Oxford Economics data, as at 30 November 2018. 49 OECD, November 2017.
European Infrastructure Strategic Outlook January 2019
8
SOVEREIGN LONG-TERM BOND YIELDS (10 YEARS, %, 2018E-23F)
Source: Oxford Economics, 22 October 2018. Notes: F = forecast, E = expected. There is no guarantee the forecast shown will materialise.
0.0
1.0
2.0
3.0
4.0
5.0
2018E Forecast Average (2019F-23F)
European Infrastructure Strategic Outlook January 2019
9
4 / Infrastructure Outlook50
4.1 Industry Update
Transportation: European transportation should continue to benefit from the favourable medium-term economic outlook, but
traffic growth is set to moderate from the peak levels observed in 2018, with airports continuing to outperform toll roads
supported by favourable global industry dynamics.51 We forecast average traffic growth to be above GDP growth for airports
and toll roads.52 In 2019, oil prices should average USD 65 per barrel,53 remaining supportive for traffic performance, but
somewhat capping growth compared with the strong performance observed in 2017 and 2018.
The outlook for European ports remains largely stable on the back of firm global trade, but we see ports in strategic locations
proving more resilient to medium-term risks, including a potential slowdown in global trade driven by a further deceleration of
Chinese GDP growth, or rising trade barriers.54 In 2019, rail will remain on its long-term growth path, supported by capacity
increases, while rail freight seems to be benefitting from ongoing Eurozone economic growth. In the medium term, we expect
more rolling stock investment opportunities across a number of national and local transport markets, as the process of
liberalization of European transportation continues.55
The traffic 2019 performance outlook remains favourable also in the United Kingdom. However, at the time of writing, our
outlook for transportation performance in the United Kingdom prudently remains stable/negative, to reflect Brexit related
uncertainty. Notwithstanding the possible agreement reached between the United Kingdom and the European Union on a
transition period and on principles of future trade relationship, the agreement is subject to the approval of respective
parliaments, and the risk of a hard, unordered Brexit cannot be excluded at this point. A hard, unordered Brexit would have
negative short-term consequences on economic growth and on traffic volumes in the United Kingdom, particularly for regional
airports and ports.56
Energy Generation: In 2018, the European energy sector benefited from an increase in power prices, and stabilising electricity
demand.57 For 2019, demand should remain sluggish in most markets, on the back of rising energy efficiency, while forward
energy prices point downwards, with mid-merit thermal generation continuing to be challenged by renewables.58 In the medium
term, market fundamentals point to a more volatile energy price environment. Market conditions, falling equipment costs for
renewables, as well as incentive mechanisms increasingly based on auctions and contract for difference mechanisms (CfD)
will continue to drive renewables capacity increases.
In the medium term, in certain markets, including for example Germany and the United Kingdom, we see improving
fundamentals for efficient CCGTs. CCGTs may benefit from additional thermal capacity reductions, improving capacity markets
supporting profitability due to rising power intermittence driven by renewables. Gas prices point upwards due to a progressive
50 Any forecasts provided herein are based on DWS’s opinion at time of publication and are subject to change. 51 Based on Bloomberg and Eurostat data, as at 25 November 2018. 52 Based on Bloomberg, Eurostat and Moody’s Investors Service data, as at November 2018. 53 Oxford Economics, 02 January 2019. 54 Based on Bloomberg, Eurostat and Moody’s Investors Service data, as at November 2018. 55 Railway Gazette "European Parliament approves Fourth Railway Package technical pillar”, 28 Apr 2016. 56 Oxford Economics, 25 November 2018. 57 Based on Bloomberg, as at 21 November 2018. 58 Based on Bloomberg and Eurostat data, as at November 2018.
European Infrastructure Strategic Outlook January 2019
10
increase in liquid natural gas (LNG) in the European market, and this should feed through to power prices.59 Our view remains
favourable for Energy from Waste (EfW) projects in certain European countries, including for example the United Kingdom, on
the back of growing barriers to landfills, a shortage of EfW capacity, rising waste volumes and limits to recycling targets. In the
short term, we expect markets with an excess capacity of EfW, including the Netherlands and Germany, to continue benefit
from supportive gate fees, and waste import flows from other European markets with EfW capacity constraints, particularly in
Southern Europe.60
Renewables: From a long-term investor perspective, we recognise that in Europe, fading subsidies for renewables may
expose investors to tail risks for brownfield projects, while subsidy regimes for greenfield projects based on auction
mechanisms or contract for difference (CFD) cap profitability somewhat, but stabilise cash flow. We continue to see
renewables as a potential target in Europe, particularly with strategies aiming at consolidating existing brownfield projects to
increase efficiency levels, and in the United States, where a market for power purchase agreements (PPA) is developing
quickly, supporting long-term return visibility.61
Utilities & Networks: European utilities have now largely completed their multi-year asset disposal programs, and refocused
their business profiles mainly on networks and renewables. In 2019, a number of European utilities are expected to publish
new strategic plans, which will provide an important indication on their long-term investment strategies and how they will
respond to the growing trends of digitalization and transport electrification. 62 Supported by new strategies and renewed
investment capacity, we expect larger utilities to remain acquisitive, targeting smaller players in the energy efficiency, demand-
response, smart grid and electric vehicle recharging technologies sectors, to acquire innovative technology, as they expand
their operations across new businesses and new markets. In the long term, we expect new winners and losers to emerge in
the utilities space, and do not exclude a renewed wave of M&A activity.
In this context, we continue to expect municipal utilities with more limited contractual power and investment capacity to
increasingly target industrial and financial partnerships to redefine their business models, unlocking potential investment
opportunities. Looking at networks, a number of regulatory determinations are expected to take place during 2019, with
frameworks expected to remain fundamentally unchanged. However, regulatory allowed returns are expected to continue to
decline, compressing the spread with long-term government bond yield further, in line with what observed historically. 63
Telecom Infrastructure: We view the telecom networks space favourably, as digitalisation continues to generate
unprecedented data demand growth,64 supporting fundamentals for fibre networks and telecom towers. For 2019, we expect
industry growth rates to remain strong in comparison to other sectors, but to reduce slightly, on the back of a moderation in
economic growth.
The expected gradual increase in inflation should prove supportive for revenues, but also increase price competition across
operators in the medium term. This is why medium term contract visibility and diversification is an important mitigating factor
in this space to support potential investment opportunities, particularly where competition or technological risk are high. Capital
spending is expected to remain high in the industry, while consolidation and M&A activity should continue, particularly as
mobile operators seek to integrate with fixed-line operators or cable companies. 65 In our view, technological change
represents an accelerating and highly disruptive driver for the infrastructure industry, with 5G, battery storage, smart grids and
electric mobility triggering new synergies among utilities, telecoms and networks, but today also somewhat reducing long-
term visibility. We believe that as these technologies mature in the coming years, investment opportunities for long-term
investors may emerge in this space. 59 S&P Global, Platts, November 2018. 60 Roland Berger, July 2018. 61 FT, “Alphabet becomes biggest corporate renewable energy buyer in US”, 4 April 2018. 62 Bloomberg, Quarterly reports for various European utilities as at 30 June 2018. 63 Moody’s Investors Service, “Regulated electric and gas networks”, 21 November 2018. 64 Bloomberg, 17 November 2018. 65 Based on Oxford Economics, Bloomberg and Moody’s Investors Service data, as at November 2018.
European Infrastructure Strategic Outlook January 2019
11
4.2 Equity Market Update66
In the current financial environment, dominated by comparatively lower returns from traditional investments and growing
uncertainty around the length of the current investment cycle, long-term investors continue to look at unlisted infrastructure
as an asset class that can match their long duration needs and one that has historically produced strong risk-adjusted
returns.67 We expect investor interest in unlisted infrastructure to continue in 2019.
Fundraising Trends: In 2018, unlisted infrastructure investment enjoyed another strong year. Following a slow start, 54 funds
had reached financial close as at the end of November 2018, raising a total of USD 79.5 billion. This marks the largest amount
of capital raised historically by the asset class. In comparison to 2018, the number of funds reaching financial close has
reduced to 54 from 88. The trend towards fundraising concentration continues to be more pronounced, with investors
continuing to commit larger sums of capital to a smaller number of funds.68
The five largest funds in market in 2018 are all successor funds; this indicates that investors have a growing appetite for
infrastructure funds managed by established managers. Unlisted infrastructure funds that closed in 2018 achieved an average
of 122% of their target size, compared for example with 101% in 2017, marking the strong level of interest that investors
continue to grant to private infrastructure.69
In line with the previous years, Europe and North America continued to lead the global fundraising market. Europe led in the
number of funds closed, while North America made up the largest proportion of infrastructure fundraising. Looking at funds in
the market, Europe-focused funds account for 44% of all funds in market, while North America- and Rest of World-focused
funds each make up 24%. However, North America-focused funds are targeting USD 10 billion more than Europe-focused
funds.70
A significant proportion of Europe-based investors (82%) plan to commit capital to their home region in the next 12 months,
while this proportion is lower (66%) for North-America based investors. Europe continues to represent the key investment
region for core/ core-plus investment strategies, offering strong diversification opportunities by country and sector. However,
European investors increasingly look at North America as a region that can offer diversification opportunities to their global
infrastructure portfolios, particularly in the energy sector, but where private infrastructure investment has been historically
more skewed towards core plus/ value add strategies, and therefore also proved more volatile.71
The proportion of investors active in infrastructure that are planning to deploy capital in 2019 remains strong. About 72% of
infrastructure investors plan to commit less than USD 100 million to the asset class in the next 12 months, 23% plan to invest
between USD 100 and USD 499 million, while 5% of investors plan to invest USD 500 million or more.72
Transaction Trends: Europe continues to represent the leading market globally for core/core plus unlisted infrastructure
investment strategies in terms of market size, portfolio diversification opportunities, market longevity, track record and
secondary market liquidity.73
66 Any forecasts provided herein are based on DWS’s opinion at the time of publication and are subject to change. 67 MSCI Global Quarterly Infrastructure Asset Index, “Summary - Period ending June 2018”, October 2018. 68 Preqin, “Q3 2018 Preqin Infrastructure Report”, November 2018. 69 Preqin, “Q3 2018 Preqin Infrastructure Report”, November 2018. 70 Preqin, “Q3 2018 Preqin Infrastructure Report”, November 2018. 71 Preqin, “Q3 2018 Preqin Infrastructure Report”, November 2018. 72 Preqin, “Q3 2018 Preqin Infrastructure Report”, November 2018. 73 Based on Infrastructure Journal database as at 25.11.2018, 30 November 2018. Figures include all European projects in the database that have been listed
with the status “Financial Close”. This figure reflects both infrastructure project financing and non-project financing deals.
European Infrastructure Strategic Outlook January 2019
12
— Europe: European infrastructure has the potential to match well with infrastructure investment strategies focusing on long-
term income yield stability with some capital growth potential.74 For example, Europe provides access to numerous
investment opportunities in transportation, such as airports, governed by mature and tested concessions, which have
historically provided long-term income return visibility as well as potential for long-term business expansion.75
European infrastructure regulation is relatively transparent when compared to other markets around the globe. Mature
European countries can offer an established investment environment, a transparent legal and regulatory framework, and
a history of private infrastructure ownership.76 In our view, the most relevant markets in Europe include the United
Kingdom, Germany, France, the Netherlands, the Nordics, as well as Italy and Spain, both of which combine slightly
higher risk/return potential with relatively strong market fundamentals.77 Our model for ranking infrastructure markets
indicates that Portugal has now joined Italy and Spain as a relevant infrastructure market, supported by stronger economic
and institutional fundamentals and lower country risk, compared with the years following the global financial crisis.78
As at the end of November 2018, 311 private infrastructure equity transactions closed in Europe for a total of EUR 117.3
billion. In Europe, the United Kingdom maintained its position as the leading infrastructure investment market, accounting
for 33% of closed transactions. Southern Europe accounted for 24.4% of the total, ahead of Germany (12.8%), the Nordics
(10.7%), France (9%) and the Netherlands (4.5%). Brownfield transactions accounted for 73% of the total volume, while
greenfield projects remained strong at 27%. Most greenfield transactions were in the renewables sector, particularly off-
shore wind.79
Looking at transactions by sector, energy-related deals formed the most active segment of the infrastructure market
during 2018, accounting for 46% of closed deals by volume, although this share was split between oil & gas (6%),
renewables (23%), and power (17%). Transportation accounted for 32% of the total volume, with 14% in
telecommunications infrastructure, 5% in social infrastructure and 3% in water networks80.
— North America: The U.S. private infrastructure market is mature, representing one of the largest globally in terms of
transaction volumes and offering the opportunity for long-term investors to diversify their European portfolios globally
across the core plus/value-add energy sector.81 Country risk is low, and regulation is transparent and predictable, but
does not always have the same track record of mature European markets82 and tends to vary by state.83
As discussed, the United States does not provide the diversification opportunities that the European infrastructure market
allows. In the United States, historically over two thirds of transactions have been in the power and renewables space.
The transportation sector, which today represents the majority of the U.S. infrastructure investment requirements, has
traditionally been largely state owned. Municipal finance has represented the main funding source, and the sector has
therefore seen limited private sector involvement.84
74 MSCI Global Quarterly Infrastructure Asset Index, “Summary - Period ending June 2018”, October 2018. 75 Based on Infrastructure Journal database as at 25.11.2018, 30 November 2018. Figures include all European projects in the database that have been listed
with the status “Financial Close”. This figure reflects both infrastructure project financing and non-project financing deals. 76 Based on DWS proprietary methodology for ranking unlisted infrastructure markets as at 25.11.2018, 30 November 2018. 77 Based on DWS proprietary methodology for ranking unlisted infrastructure markets as at 25.11.2018, 30 November 2018. 78 Based on DWS proprietary methodology for ranking unlisted infrastructure markets as at 25.11.2018, 30 November 2018. 79 Based on Infrastructure Journal database as at 25.11.2018, 30 November 2018. Figures include all European projects in the database that have been listed
with the status “Financial Close”. This figure reflects both infrastructure project financing and non-project financing deals. 80 Based on Infrastructure Journal database as at 25.11.2018, 30 November 2018. Figures include all European projects in the database that have been listed
with the status “Financial Close”. This figure reflects both infrastructure project financing and non-project financing deals. 81 Preqin, January 2018. 82 Based on InfraNews, and DWS proprietary methodology for ranking unlisted infrastructure markets as at 25.11.2018, 30 November 2018. 83 Preqin, January 2018. 84 Based on Infrastructure Journal database as at 25.11.2018, 30 November 2018.Figures include all North American projects in the database that have been
listed with the status “Financial Close”. This figure reflects both infrastructure project financing and non-project financing deals.
European Infrastructure Strategic Outlook January 2019
13
The penetration of PPPs in the United States as an alternative to government finances, has also been relatively limited.
Social infrastructure and PPPs account historically for just 4% of the closed transaction volume.85 To date, about two
thirds of U.S. States have a PPP framework, but the legislative and regulatory regime varies by state, PPP contracts lack
standardization, and historically the lack of a unified procurement body has slowed the procurement process. While some
difficulties are going to persist, the market for PPPs in the United States is gradually gaining ground, and an increasing
number of state legislatures have begun using PPPs to develop infrastructure projects.86
Going forward, infrastructure investment represents one of the key policy areas of the new administration to perform
stimulus spending and boost economic growth.87 The United State could have to spend roughly USD 4.6 trillion by 2025
to maintain its existing infrastructure, according to conservative estimates.88 Looking ahead, we expect an increase in
private sector involvement in U.S. infrastructure projects, and believe that the renewed policy focus on infrastructure will
gradually offer more opportunities for investors to build diversified infrastructure portfolios beyond the energy sector.89
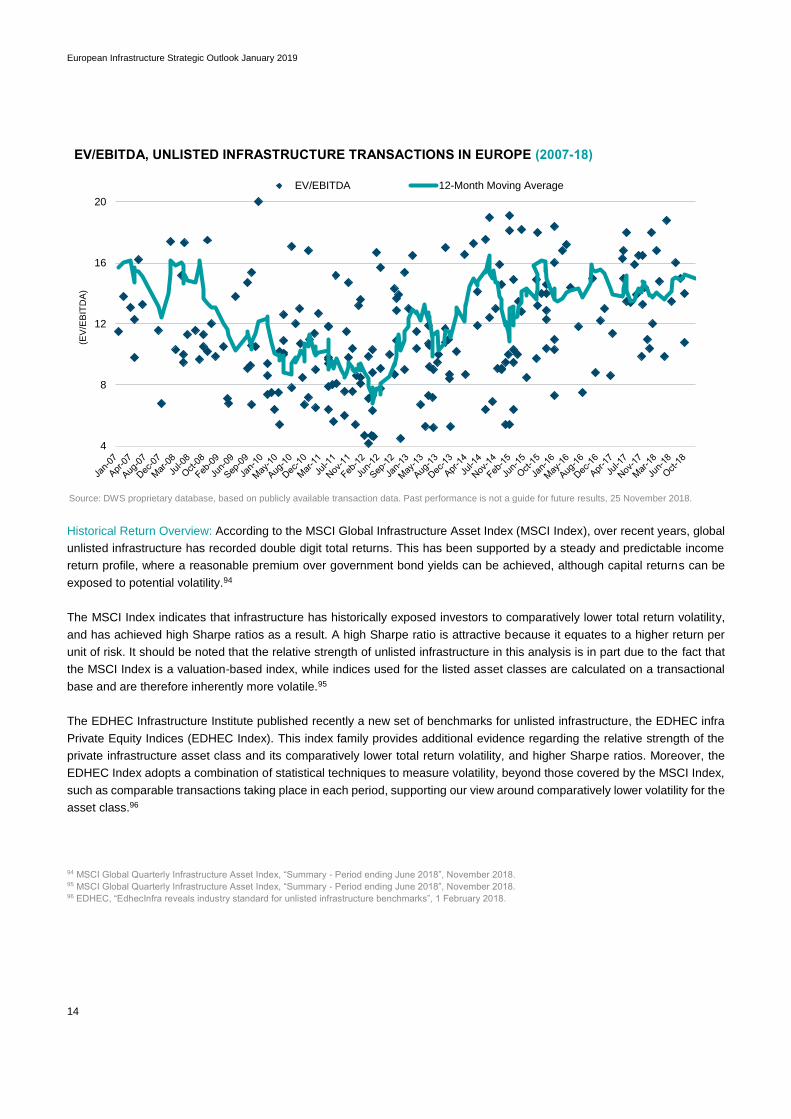
Valuations: In 2018, unlisted infrastructure transaction multiples were at 14.5x on average, broadly in line with the levels of
2017.90 At this point in the cycle it is important to have a fundamental view on valuations throughout a cycle, taking a realistic
mid-cycle approach and applying alpha to discount rates, to keep a fairly consistent and stable view of value across a portfolio
over the long term.
In the core infrastructure space, competition continues to be high, particularly across auctions processes, and at the direct
end of the market, where transaction multiples were supported by a limited deal pipeline and high levels of dry powder.91 At
the same time, we continue to note that valuations in the core plus space and in the mid-market remained comparatively
lower, particularly for more complex situations, offering investors access to a comparatively less competitive landscape.92
We expect several drivers to provide some support to valuations for European unlisted infrastructure, including dry powder
levels, the availability of debt financing at historically low interest rates, and a large number of investors looking to invest in
the asset class.
In 2019, we believe that the infrastructure investment cycle may mature further, particularly for core infrastructure. The
expected gradual increase in yields may progressively have an impact on discount rates and hence on valuations, particularly
for regulated, core infrastructure. We believe that regulated infrastructure remains important to balance systemic risk in a
portfolio. However, in our view, regulated infrastructure continues to remain exposed to tighter regulated returns across Europe
reducing the spread over long-term government bonds, an element that we do not necessarily always see fully factored into
valuations for recent transactions.93
From a strategic point of view we believe that assets in the core plus space driven by solid infrastructure characteristics
providing long-term cash flow visibility, displaying supportive industry trends fundamentals, and offering some flexibility to
support earning growth and manage costs, might be better placed to offset a potential increase in bond yields on discount
rates over time, supporting valuations.
85 Based on Infrastructure Journal database as at 25.11.2018, 30 November 2018. Figures include all U.S. projects in the database that have been listed with the
status “Financial Close”. This figure reflects both infrastructure project financing and non-project financing deals. 86 The White House, ‘Legislative Outline for Rebuilding Infrastructure in America’, February 2018. 87 Whitehouse.gov, ‘Building a Stronger America’, 12 February 2018. 88 ASCE, ‘2017 Infrastructure Report Card’, 2017. 89 PwC, “Trump’s USD 1 trillion infrastructure plan: finding the right funding for the right projects”, as at January 2018. 90 DWS proprietary database of European unlisted infrastructure transactions, based on publicly available transaction information from various sources,
including Infrastructure Journal, InfraNews, Reuters, 25 November 2018. 91 Based on Infrastructure Journal database as at 25.11.2018, 30 November 2018. Figures include all European projects in the database that have been listed
with the status “Financial Close”. This figure reflects both infrastructure project financing and non-project financing deals. 92 DWS proprietary database of European unlisted infrastructure transactions, based on publicly available transaction information from various sources, including
Infrastructure Journal, InfraNews, Reuters, 25 November 2018. 93 DWS proprietary database of European unlisted infrastructure transactions, based on publicly available transaction information from various sources, including
Infrastructure Journal, InfraNews, Reuters, 25 November 2018.
European Infrastructure Strategic Outlook January 2019
14
Historical Return Overview: According to the MSCI Global Infrastructure Asset Index (MSCI Index), over recent years, global
unlisted infrastructure has recorded double digit total returns. This has been supported by a steady and predictable income
return profile, where a reasonable premium over government bond yields can be achieved, although capital returns can be
exposed to potential volatility.94
The MSCI Index indicates that infrastructure has historically exposed investors to comparatively lower total return volatility,
and has achieved high Sharpe ratios as a result. A high Sharpe ratio is attractive because it equates to a higher return per
unit of risk. It should be noted that the relative strength of unlisted infrastructure in this analysis is in part due to the fact that
the MSCI Index is a valuation-based index, while indices used for the listed asset classes are calculated on a transactional
base and are therefore inherently more volatile.95
The EDHEC Infrastructure Institute published recently a new set of benchmarks for unlisted infrastructure, the EDHEC infra
Private Equity Indices (EDHEC Index). This index family provides additional evidence regarding the relative strength of the
private infrastructure asset class and its comparatively lower total return volatility, and higher Sharpe ratios. Moreover, the
EDHEC Index adopts a combination of statistical techniques to measure volatility, beyond those covered by the MSCI Index,
such as comparable transactions taking place in each period, supporting our view around comparatively lower volatility for the
asset class.96
94 MSCI Global Quarterly Infrastructure Asset Index, “Summary - Period ending June 2018”, November 2018. 95 MSCI Global Quarterly Infrastructure Asset Index, “Summary - Period ending June 2018”, November 2018. 96 EDHEC, “EdhecInfra reveals industry standard for unlisted infrastructure benchmarks”, 1 February 2018.
EV/EBITDA, UNLISTED INFRASTRUCTURE TRANSACTIONS IN EUROPE (2007-18)
Source: DWS proprietary database, based on publicly available transaction data. Past performance is not a guide for future results, 25 November 2018.
4
8
12
16
20
(EV
/EB
ITD
A)
EV/EBITDA 12-Month Moving Average
European Infrastructure Strategic Outlook January 2019
15
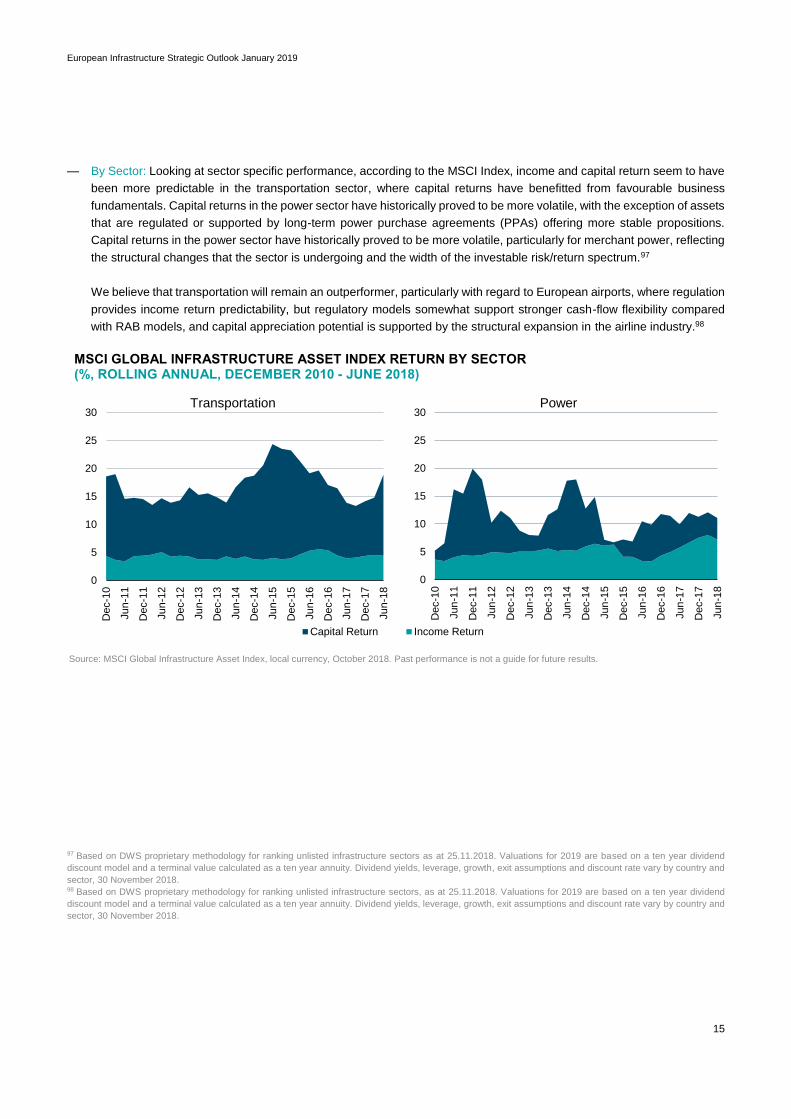
— By Sector: Looking at sector specific performance, according to the MSCI Index, income and capital return seem to have
been more predictable in the transportation sector, where capital returns have benefitted from favourable business
fundamentals. Capital returns in the power sector have historically proved to be more volatile, with the exception of assets
that are regulated or supported by long-term power purchase agreements (PPAs) offering more stable propositions.
Capital returns in the power sector have historically proved to be more volatile, particularly for merchant power, reflecting
the structural changes that the sector is undergoing and the width of the investable risk/return spectrum.97
We believe that transportation will remain an outperformer, particularly with regard to European airports, where regulation
provides income return predictability, but regulatory models somewhat support stronger cash-flow flexibility compared
with RAB models, and capital appreciation potential is supported by the structural expansion in the airline industry.98
MSCI GLOBAL INFRASTRUCTURE ASSET INDEX RETURN BY SECTOR (%, ROLLING ANNUAL, DECEMBER 2010 - JUNE 2018)(%, ROLLING ANNUAL, DECEMBER 2010 - JUNE 2017)
Source: MSCI Global Infrastructure Asset Index, local currency, October 2018. Past performance is not a guide for future results.
97 Based on DWS proprietary methodology for ranking unlisted infrastructure sectors as at 25.11.2018. Valuations for 2019 are based on a ten year dividend
discount model and a terminal value calculated as a ten year annuity. Dividend yields, leverage, growth, exit assumptions and discount rate vary by country and
sector, 30 November 2018. 98 Based on DWS proprietary methodology for ranking unlisted infrastructure sectors, as at 25.11.2018. Valuations for 2019 are based on a ten year dividend
discount model and a terminal value calculated as a ten year annuity. Dividend yields, leverage, growth, exit assumptions and discount rate vary by country and
sector, 30 November 2018.
0
5
10
15
20
25
30
Dec-1
0
Jun
-11
Dec-1
1
Jun
-12
Dec-1
2
Jun
-13
Dec-1
3
Jun
-14
Dec-1
4
Jun
-15
Dec-1
5
Jun
-16
Dec-1
6
Jun
-17
Dec-1
7
Jun
-18
Capital Return
Transportation
0
5
10
15
20
25
30
Dec-1
0
Jun
-11
Dec-1
1
Jun
-12
Dec-1
2
Jun
-13
Dec-1
3
Jun
-14
Dec-1
4
Jun
-15
Dec-1
5
Jun
-16
Dec-1
6
Jun
-17
Dec-1
7
Jun
-18
Income Return
Power
European Infrastructure Strategic Outlook January 2019
16
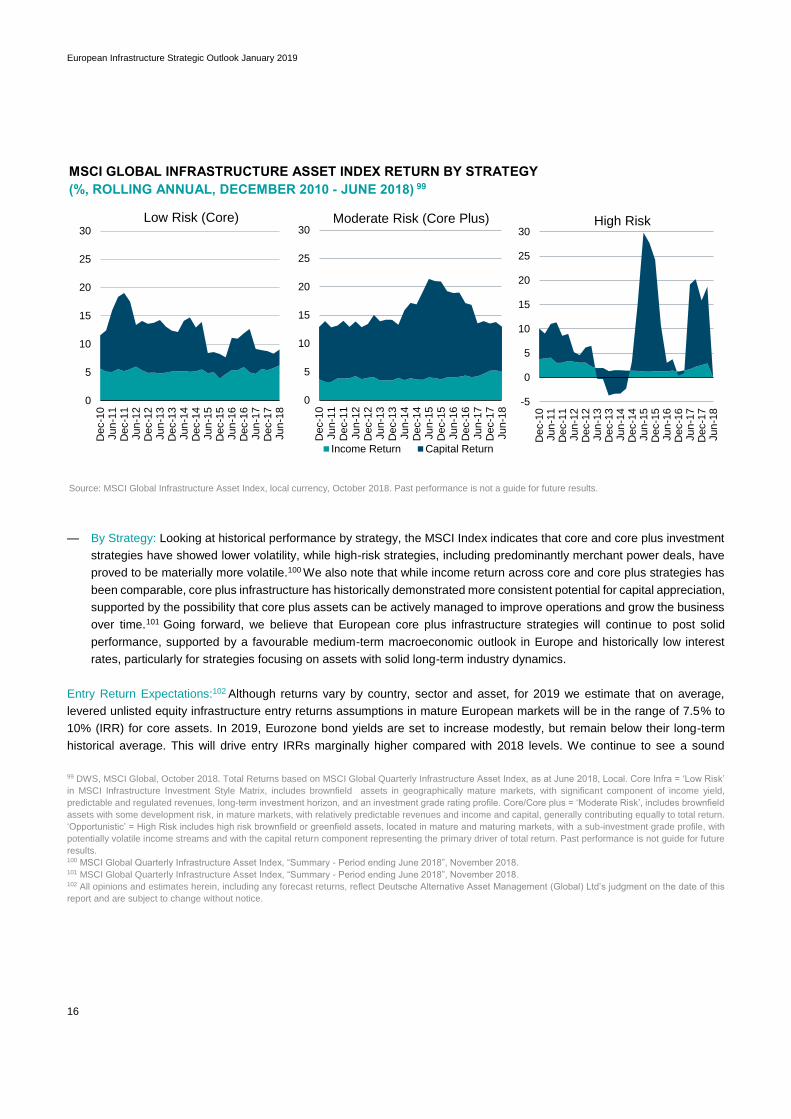
MSCI GLOBAL INFRASTRUCTURE ASSET INDEX RETURN BY STRATEGY
(%, ROLLING ANNUAL, DECEMBER 2010 - JUNE 2018) 99
Source: MSCI Global Infrastructure Asset Index, local currency, October 2018. Past performance is not a guide for future results.
— By Strategy: Looking at historical performance by strategy, the MSCI Index indicates that core and core plus investment
strategies have showed lower volatility, while high-risk strategies, including predominantly merchant power deals, have
proved to be materially more volatile.100 We also note that while income return across core and core plus strategies has
been comparable, core plus infrastructure has historically demonstrated more consistent potential for capital appreciation,
supported by the possibility that core plus assets can be actively managed to improve operations and grow the business
over time.101 Going forward, we believe that European core plus infrastructure strategies will continue to post solid
performance, supported by a favourable medium-term macroeconomic outlook in Europe and historically low interest
rates, particularly for strategies focusing on assets with solid long-term industry dynamics.
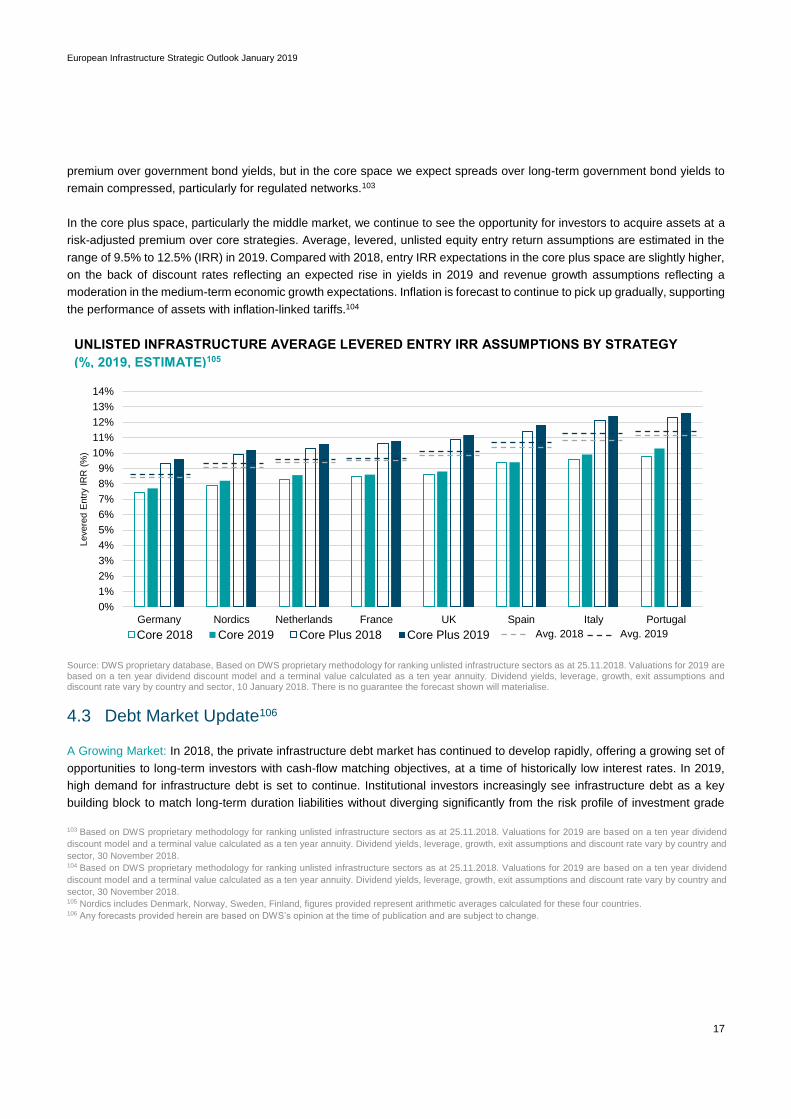
Entry Return Expectations:102 Although returns vary by country, sector and asset, for 2019 we estimate that on average,
levered unlisted equity infrastructure entry returns assumptions in mature European markets will be in the range of 7.5% to
10% (IRR) for core assets. In 2019, Eurozone bond yields are set to increase modestly, but remain below their long-term
historical average. This will drive entry IRRs marginally higher compared with 2018 levels. We continue to see a sound
99 DWS, MSCI Global, October 2018. Total Returns based on MSCI Global Quarterly Infrastructure Asset Index, as at June 2018, Local. Core Infra = ‘Low Risk’
in MSCI Infrastructure Investment Style Matrix, includes brownfield assets in geographically mature markets, with significant component of income yield,
predictable and regulated revenues, long-term investment horizon, and an investment grade rating profile. Core/Core plus = ‘Moderate Risk’, includes brownfield
assets with some development risk, in mature markets, with relatively predictable revenues and income and capital, generally contributing equally to total return.
‘Opportunistic’ = High Risk includes high risk brownfield or greenfield assets, located in mature and maturing markets, with a sub-investment grade profile, with
potentially volatile income streams and with the capital return component representing the primary driver of total return. Past performance is not guide for future
results. 100 MSCI Global Quarterly Infrastructure Asset Index, “Summary - Period ending June 2018”, November 2018. 101 MSCI Global Quarterly Infrastructure Asset Index, “Summary - Period ending June 2018”, November 2018. 102 All opinions and estimates herein, including any forecast returns, reflect Deutsche Alternative Asset Management (Global) Ltd’s judgment on the date of this
report and are subject to change without notice.
0
5
10
15
20
25
30
Dec-1
0Jun
-11
Dec-1
1Jun
-12
Dec-1
2Jun
-13
Dec-1
3Jun
-14
Dec-1
4Jun
-15
Dec-1
5Jun
-16
Dec-1
6Jun
-17
Dec-1
7Jun
-18
Low Risk (Core)
0
5
10
15
20
25
30
Dec-1
0Jun
-11
Dec-1
1Jun
-12
Dec-1
2Jun
-13
Dec-1
3Jun
-14
Dec-1
4Jun
-15
Dec-1
5Jun
-16
Dec-1
6Jun
-17
Dec-1
7Jun
-18
Income Return Capital Return
Moderate Risk (Core Plus)
-5
0
5
10
15
20
25
30
Dec-1
0Jun
-11
Dec-1
1Jun
-12
Dec-1
2Jun
-13
Dec-1
3Jun
-14
Dec-1
4Jun
-15
Dec-1
5Jun
-16
Dec-1
6Jun
-17
Dec-1
7Jun
-18
High Risk
European Infrastructure Strategic Outlook January 2019
17
premium over government bond yields, but in the core space we expect spreads over long-term government bond yields to
remain compressed, particularly for regulated networks.103
In the core plus space, particularly the middle market, we continue to see the opportunity for investors to acquire assets at a
risk-adjusted premium over core strategies. Average, levered, unlisted equity entry return assumptions are estimated in the
range of 9.5% to 12.5% (IRR) in 2019. Compared with 2018, entry IRR expectations in the core plus space are slightly higher,
on the back of discount rates reflecting an expected rise in yields in 2019 and revenue growth assumptions reflecting a
moderation in the medium-term economic growth expectations. Inflation is forecast to continue to pick up gradually, supporting
the performance of assets with inflation-linked tariffs.104
UNLISTED INFRASTRUCTURE AVERAGE LEVERED ENTRY IRR ASSUMPTIONS BY STRATEGY
(%, 2019, ESTIMATE)105
Source: DWS proprietary database, Based on DWS proprietary methodology for ranking unlisted infrastructure sectors as at 25.11.2018. Valuations for 2019 are based on a ten year dividend discount model and a terminal value calculated as a ten year annuity. Dividend yields, leverage, growth, exit assumptions and discount rate vary by country and sector, 10 January 2018. There is no guarantee the forecast shown will materialise.
4.3 Debt Market Update106
A Growing Market: In 2018, the private infrastructure debt market has continued to develop rapidly, offering a growing set of
opportunities to long-term investors with cash-flow matching objectives, at a time of historically low interest rates. In 2019,
high demand for infrastructure debt is set to continue. Institutional investors increasingly see infrastructure debt as a key
building block to match long-term duration liabilities without diverging significantly from the risk profile of investment grade
103 Based on DWS proprietary methodology for ranking unlisted infrastructure sectors as at 25.11.2018. Valuations for 2019 are based on a ten year dividend
discount model and a terminal value calculated as a ten year annuity. Dividend yields, leverage, growth, exit assumptions and discount rate vary by country and
sector, 30 November 2018. 104 Based on DWS proprietary methodology for ranking unlisted infrastructure sectors as at 25.11.2018. Valuations for 2019 are based on a ten year dividend
discount model and a terminal value calculated as a ten year annuity. Dividend yields, leverage, growth, exit assumptions and discount rate vary by country and
sector, 30 November 2018. 105 Nordics includes Denmark, Norway, Sweden, Finland, figures provided represent arithmetic averages calculated for these four countries. 106 Any forecasts provided herein are based on DWS’s opinion at the time of publication and are subject to change.
0%
1%
2%
3%
4%
5%
6%
7%
8%
9%
10%
11%
12%
13%
14%
Germany Nordics Netherlands France UK Spain Italy Portugal
Levere
d E
ntr
y IR
R (
%)
Core 2018 Core 2019 Core Plus 2018 Core Plus 2019 Avg. 2018 Avg. 2019
European Infrastructure Strategic Outlook January 2019
18
sovereign bonds.107 Moreover, private infrastructure debt has historically offered the opportunity to diversify a portfolio,
investing in real assets with comparatively strong credit quality and a default-adjusted yield premium over fixed income.108
Supportive Regulation: The comparatively strong credit profile of infrastructure debt 109 has been acknowledged by the
European insurance regulator under the new Solvency II framework, leading to a reduction in capital charges for insurance
companies investing in qualifying infrastructure debt.110 This is having a major impact on the way in which European life
insurance companies consider infrastructure debt as an asset class, and further increasing demand. 111 Qualifying
infrastructure debt now benefits from a risk calibration lower than that of generic corporate debt, resulting in a lower capital
charge for insurance companies investing in infrastructure debt.112 Moreover, as banks continue to retrench from lending for
regulatory reasons, private infrastructure debt should increasingly establish itself as a capital efficient building block to long-
term investors’ portfolios, both for infrastructure corporate lending and project finance.113
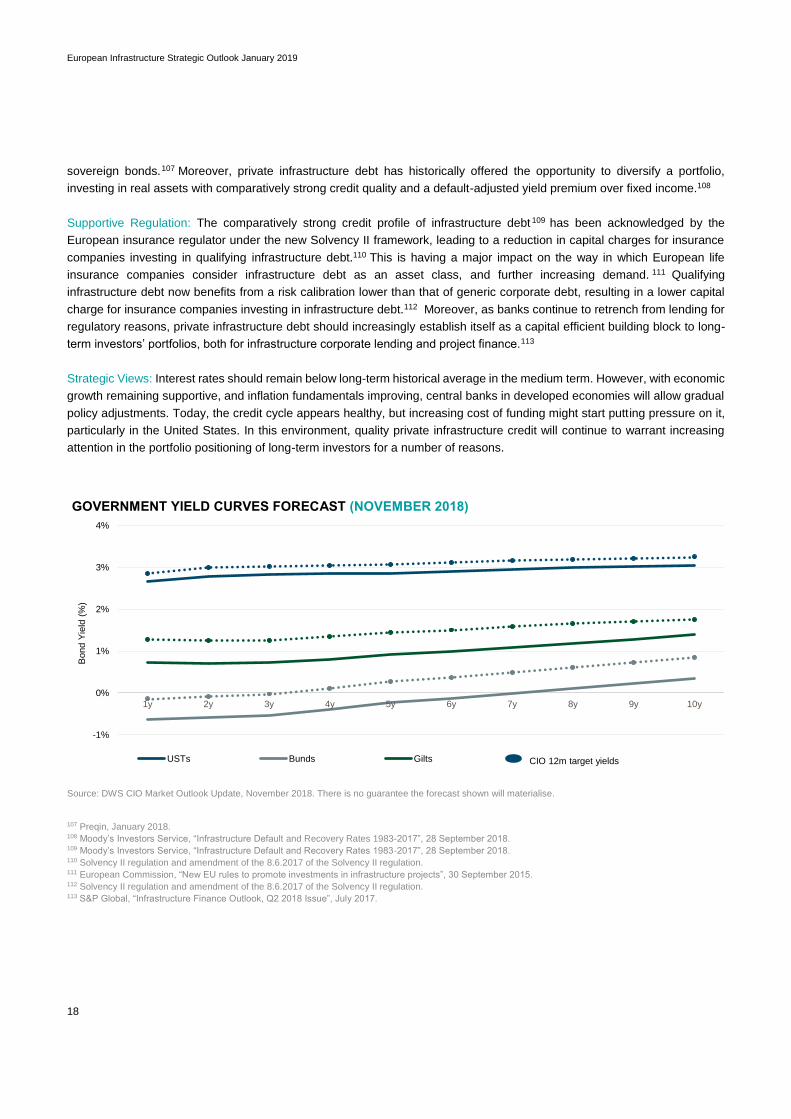
Strategic Views: Interest rates should remain below long-term historical average in the medium term. However, with economic
growth remaining supportive, and inflation fundamentals improving, central banks in developed economies will allow gradual
policy adjustments. Today, the credit cycle appears healthy, but increasing cost of funding might start putting pressure on it,
particularly in the United States. In this environment, quality private infrastructure credit will continue to warrant increasing
attention in the portfolio positioning of long-term investors for a number of reasons.
Source: DWS CIO Market Outlook Update, November 2018. There is no guarantee the forecast shown will materialise.
107 Preqin, January 2018. 108 Moody’s Investors Service, “Infrastructure Default and Recovery Rates 1983-2017”, 28 September 2018. 109 Moody’s Investors Service, “Infrastructure Default and Recovery Rates 1983-2017”, 28 September 2018. 110 Solvency II regulation and amendment of the 8.6.2017 of the Solvency II regulation. 111 European Commission, “New EU rules to promote investments in infrastructure projects”, 30 September 2015. 112 Solvency II regulation and amendment of the 8.6.2017 of the Solvency II regulation. 113 S&P Global, “Infrastructure Finance Outlook, Q2 2018 Issue”, July 2017.
GOVERNMENT YIELD CURVES FORECAST (NOVEMBER 2018)
-1%
0%
1%
2%
3%
4%
1y 2y 3y 4y 5y 6y 7y 8y 9y 10y
Bond Y
ield
(%
)
USTs Bunds Gilts CIO 12m target yields
European Infrastructure Strategic Outlook January 2019
19
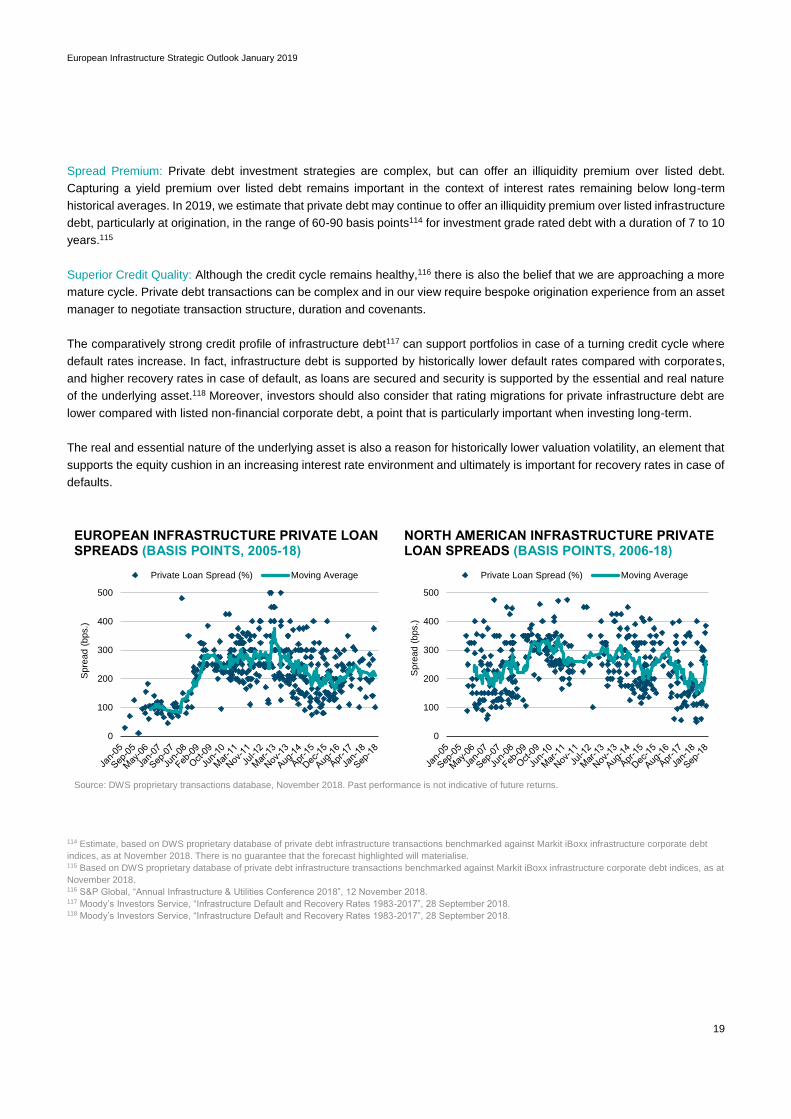
Spread Premium: Private debt investment strategies are complex, but can offer an illiquidity premium over listed debt.
Capturing a yield premium over listed debt remains important in the context of interest rates remaining below long-term
historical averages. In 2019, we estimate that private debt may continue to offer an illiquidity premium over listed infrastructure
debt, particularly at origination, in the range of 60-90 basis points114 for investment grade rated debt with a duration of 7 to 10
years.115
Superior Credit Quality: Although the credit cycle remains healthy,116 there is also the belief that we are approaching a more
mature cycle. Private debt transactions can be complex and in our view require bespoke origination experience from an asset
manager to negotiate transaction structure, duration and covenants.
The comparatively strong credit profile of infrastructure debt117 can support portfolios in case of a turning credit cycle where
default rates increase. In fact, infrastructure debt is supported by historically lower default rates compared with corporates,
and higher recovery rates in case of default, as loans are secured and security is supported by the essential and real nature
of the underlying asset.118 Moreover, investors should also consider that rating migrations for private infrastructure debt are
lower compared with listed non-financial corporate debt, a point that is particularly important when investing long-term.
The real and essential nature of the underlying asset is also a reason for historically lower valuation volatility, an element that
supports the equity cushion in an increasing interest rate environment and ultimately is important for recovery rates in case of
defaults.
EUROPEAN INFRASTRUCTURE PRIVATE LOAN SPREADS (BASIS POINTS, 2005-18)
NORTH AMERICAN INFRASTRUCTURE PRIVATE LOAN SPREADS (BASIS POINTS, 2006-18)
Source: DWS proprietary transactions database, November 2018. Past performance is not indicative of future returns.
114 Estimate, based on DWS proprietary database of private debt infrastructure transactions benchmarked against Markit iBoxx infrastructure corporate debt
indices, as at November 2018. There is no guarantee that the forecast highlighted will materialise. 115 Based on DWS proprietary database of private debt infrastructure transactions benchmarked against Markit iBoxx infrastructure corporate debt indices, as at
November 2018. 116 S&P Global, “Annual Infrastructure & Utilities Conference 2018”, 12 November 2018. 117 Moody’s Investors Service, “Infrastructure Default and Recovery Rates 1983-2017”, 28 September 2018. 118 Moody’s Investors Service, “Infrastructure Default and Recovery Rates 1983-2017”, 28 September 2018.
0
100
200
300
400
500
Spre
ad (
bps.)
Private Loan Spread (%) Moving Average
0
100
200
300
400
500
Spre
ad (
bps.)
Private Loan Spread (%) Moving Average
European Infrastructure Strategic Outlook January 2019
20
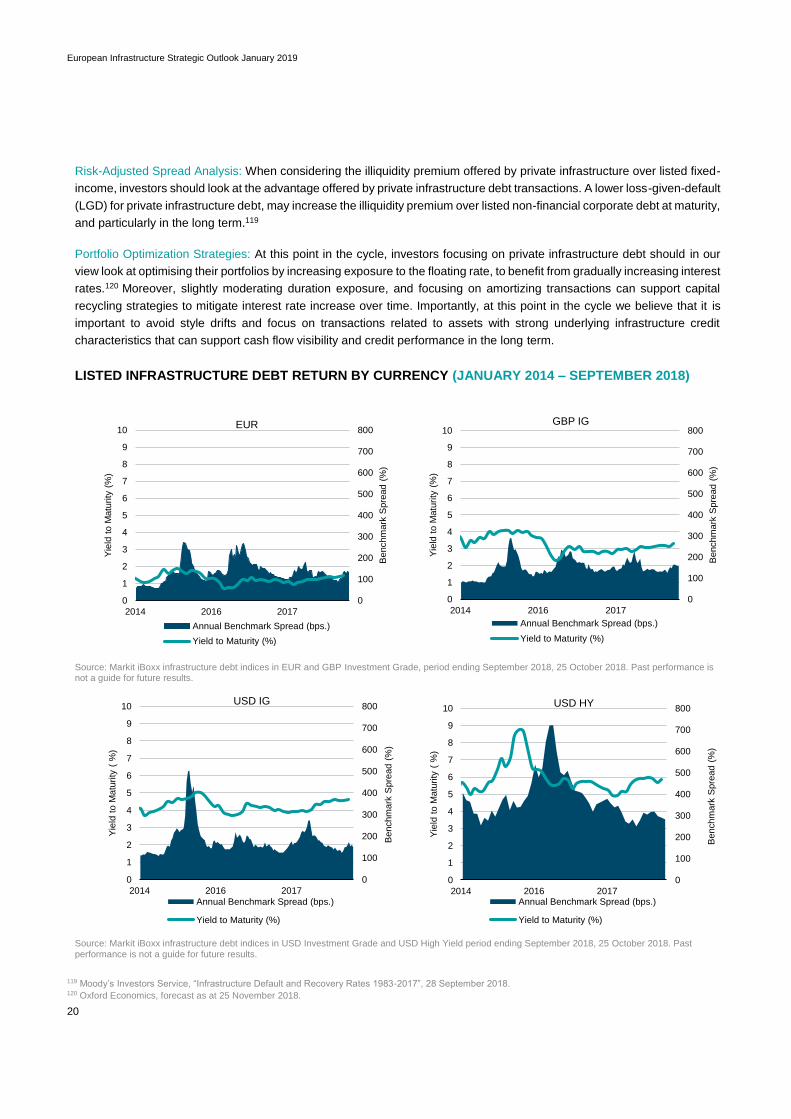
Risk-Adjusted Spread Analysis: When considering the illiquidity premium offered by private infrastructure over listed fixed-
income, investors should look at the advantage offered by private infrastructure debt transactions. A lower loss-given-default
(LGD) for private infrastructure debt, may increase the illiquidity premium over listed non-financial corporate debt at maturity,
and particularly in the long term.119
Portfolio Optimization Strategies: At this point in the cycle, investors focusing on private infrastructure debt should in our
view look at optimising their portfolios by increasing exposure to the floating rate, to benefit from gradually increasing interest
rates.120 Moreover, slightly moderating duration exposure, and focusing on amortizing transactions can support capital
recycling strategies to mitigate interest rate increase over time. Importantly, at this point in the cycle we believe that it is
important to avoid style drifts and focus on transactions related to assets with strong underlying infrastructure credit
characteristics that can support cash flow visibility and credit performance in the long term.
LISTED INFRASTRUCTURE DEBT RETURN BY CURRENCY (JANUARY 2014 – SEPTEMBER 2018)
Source: Markit iBoxx infrastructure debt indices in EUR and GBP Investment Grade, period ending September 2018, 25 October 2018. Past performance is not a guide for future results.
Source: Markit iBoxx infrastructure debt indices in USD Investment Grade and USD High Yield period ending September 2018, 25 October 2018. Past performance is not a guide for future results.
119 Moody’s Investors Service, “Infrastructure Default and Recovery Rates 1983-2017”, 28 September 2018. 120 Oxford Economics, forecast as at 25 November 2018.
0
100
200
300
400
500
600
700
800
0
1
2
3
4
5
6
7
8
9
10
2014 2016 2017
Benchm
ark
Spre
ad (
%)
Yie
ld t
o M
atu
rity
( %
)
Annual Benchmark Spread (bps.)
Yield to Maturity (%)
USD IG
0
100
200
300
400
500
600
700
800
0
1
2
3
4
5
6
7
8
9
10
2014 2016 2017
Benchm
ark
Spre
ad (
%)
Yie
ld t
o M
atu
rity
( %
)
Annual Benchmark Spread (bps.)
Yield to Maturity (%)
USD HY
0
100
200
300
400
500
600
700
800
0
1
2
3
4
5
6
7
8
9
10
2014 2016 2017
Benchm
ark
Spre
ad (
%)
Yie
ld t
o M
atu
rity
(%
)
Annual Benchmark Spread (bps.)
Yield to Maturity (%)
EUR
0
100
200
300
400
500
600
700
800
0
1
2
3
4
5
6
7
8
9
10
2014 2016 2017
Benchm
ark
Spre
ad (
%)
Yie
ld t
o M
atu
rity
(%
)
Annual Benchmark Spread (bps.)
Yield to Maturity (%)
GBP IG
European Infrastructure Strategic Outlook January 2019
21
5 / Key Sectors 5.1 Transportation
Operating Performance: In 2018, European transportation continued to beat expectations, driven by supportive
macroeconomic fundamentals. We expect this trend to continue in 2019. Transportation is a complex industry and includes,
among others, air, marine, road and rail services for both passengers and freight. Although there are differences across
industry sub-sectors and regions, traffic volumes have a strong correlation with GDP growth and in particular with private
consumption. This impacts passenger volumes and industrial production, which in turn drive freight transportation volumes.121
— Airports: 2019 Outlook: Stable/Positive – Long-Term Industry Trend: Stable/Positive122
In 2019, the European airport sector is expected to benefit from strong traffic growth, while regulation will support inflation
recovery in revenues. On average, we are forecasting passenger growth to moderate compared with the strong levels
observed in 2017 and 2018, in line with the moderation in the macroeconomic outlook.123 We are forecasting growth to
average 4% in continental Europe, while we anticipate that U.K. airports will experience traffic growth of below 3% on
average. Growth will be stronger for passenger traffic, while growth in the cargo traffic space will be less strong. Solid
passenger growth and operating margins is driving investment and capacity expansions across a number of airports in
Europe.124
European airport hubs will benefit from supportive domestic and regional growth, but are expected to capitalize on the
long-term air travel industry growth in Asian markets, supporting long-haul passenger traffic and commercial revenues.
Asian markets will benefit from buoyant passenger growth, driven by market liberalization and economic growth.
Emerging markets airports continue to experience traffic growth at twice the rate of GDP growth.
In 2018, European regional airports have benefited from supportive commercial revenues, and European travel
destinations continue to be preferred to international travel destinations due to relatively high levels of geopolitical
tensions. We expect this trend to gradually moderate in the medium term, and hence expect European regional airports
growth to remain more moderate compared with international hubs. On the supply side, increased airline capacity
continues to remain a supportive factor for the industry.125
Risks: Oil prices should average around USD 65 per barrel in 2019,126 a level materially below the price of USD 110 per
barrel of 2013. We have observed a correlation between the increase in oil prices in 2018 and a moderation in passenger
growth in European airports.127 Increases in oil prices could cap passenger growth further. Moreover, rising oil prices may
likely put pressure on airlines. In the long term, a continued consolidation of the airline industry cannot be excluded.
121 Based on a number of sources, including Bloomberg, Eurostat and Moody’s Investors Service data, as at November 2018. 122 Based on DWS proprietary methodology for ranking unlisted infrastructure sectors as at 25.11.2018, 30 November 2018. 123 Based on a number of sources, including Bloomberg, Eurostat and Moody’s Investors Service data, as at November 2018. 124 Based on DWS proprietary methodology for ranking unlisted infrastructure markets as at 25.11.2018, 30 November 2018. 125 Based on a number of sources, including Bloomberg, Eurostat and Moody’s Investors Service data, as at November 2018. 126 Oxford Economics, 25 November 2018. 127 Based on a number of sources, including Bloomberg and Eurostat, as at November 2018.
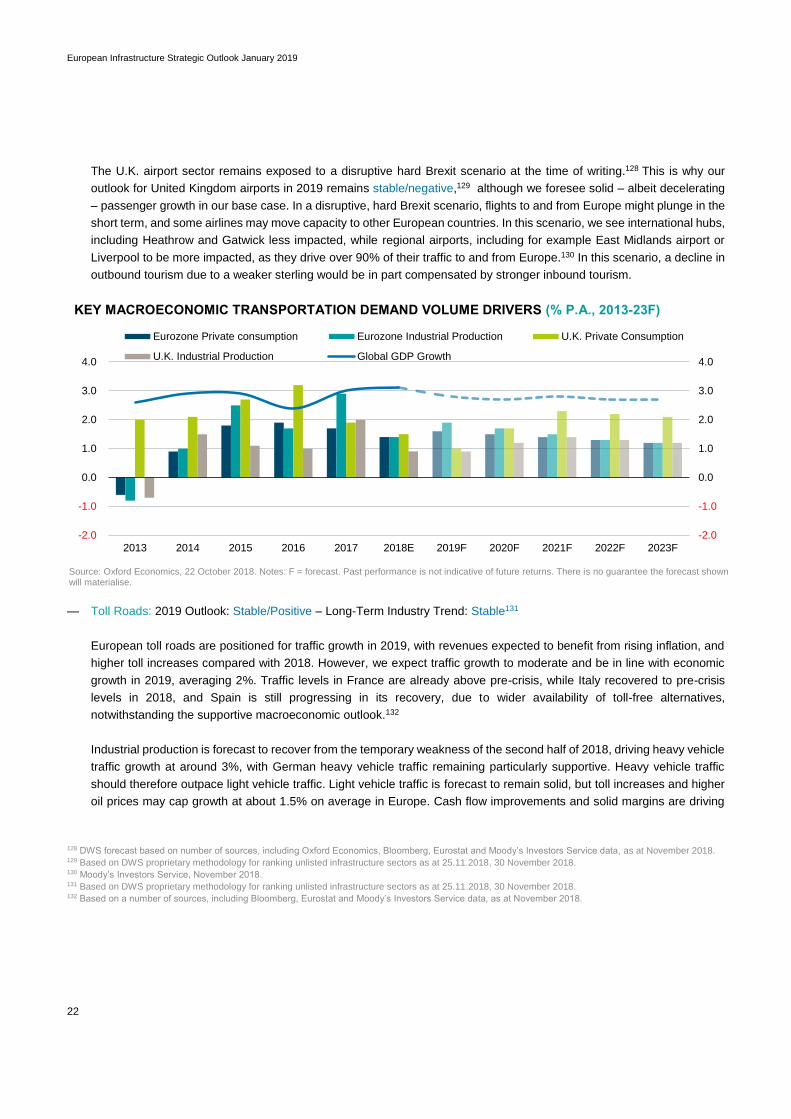
European Infrastructure Strategic Outlook January 2019
22
The U.K. airport sector remains exposed to a disruptive hard Brexit scenario at the time of writing.128 This is why our
outlook for United Kingdom airports in 2019 remains stable/negative,129 although we foresee solid – albeit decelerating
– passenger growth in our base case. In a disruptive, hard Brexit scenario, flights to and from Europe might plunge in the
short term, and some airlines may move capacity to other European countries. In this scenario, we see international hubs,
including Heathrow and Gatwick less impacted, while regional airports, including for example East Midlands airport or
Liverpool to be more impacted, as they drive over 90% of their traffic to and from Europe.130 In this scenario, a decline in
outbound tourism due to a weaker sterling would be in part compensated by stronger inbound tourism.
KEY MACROECONOMIC TRANSPORTATION DEMAND VOLUME DRIVERS (% P.A., 2013-23F)
Source: Oxford Economics, 22 October 2018. Notes: F = forecast. Past performance is not indicative of future returns. There is no guarantee the forecast shown will materialise.
— Toll Roads: 2019 Outlook: Stable/Positive – Long-Term Industry Trend: Stable131
European toll roads are positioned for traffic growth in 2019, with revenues expected to benefit from rising inflation, and
higher toll increases compared with 2018. However, we expect traffic growth to moderate and be in line with economic
growth in 2019, averaging 2%. Traffic levels in France are already above pre-crisis, while Italy recovered to pre-crisis
levels in 2018, and Spain is still progressing in its recovery, due to wider availability of toll-free alternatives,
notwithstanding the supportive macroeconomic outlook.132
Industrial production is forecast to recover from the temporary weakness of the second half of 2018, driving heavy vehicle
traffic growth at around 3%, with German heavy vehicle traffic remaining particularly supportive. Heavy vehicle traffic
should therefore outpace light vehicle traffic. Light vehicle traffic is forecast to remain solid, but toll increases and higher
oil prices may cap growth at about 1.5% on average in Europe. Cash flow improvements and solid margins are driving
128 DWS forecast based on number of sources, including Oxford Economics, Bloomberg, Eurostat and Moody’s Investors Service data, as at November 2018. 129 Based on DWS proprietary methodology for ranking unlisted infrastructure sectors as at 25.11.2018, 30 November 2018. 130 Moody’s Investors Service, November 2018. 131 Based on DWS proprietary methodology for ranking unlisted infrastructure sectors as at 25.11.2018, 30 November 2018. 132 Based on a number of sources, including Bloomberg, Eurostat and Moody’s Investors Service data, as at November 2018.
-2.0
-1.0
0.0
1.0
2.0
3.0
4.0
-2.0
-1.0
0.0
1.0
2.0
3.0
4.0
2013 2014 2015 2016 2017 2018E 2019F 2020F 2021F 2022F 2023F
Eurozone Private consumption Eurozone Industrial Production U.K. Private Consumption
U.K. Industrial Production Global GDP Growth
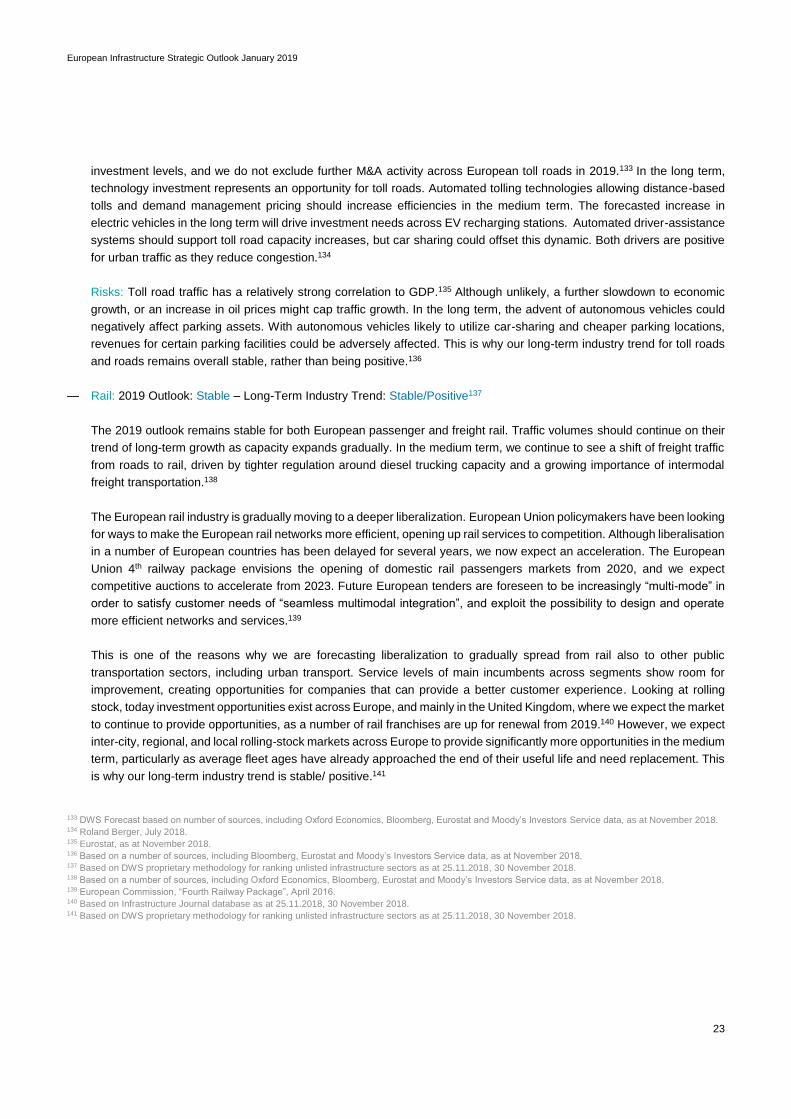
European Infrastructure Strategic Outlook January 2019
23
investment levels, and we do not exclude further M&A activity across European toll roads in 2019.133 In the long term,
technology investment represents an opportunity for toll roads. Automated tolling technologies allowing distance-based
tolls and demand management pricing should increase efficiencies in the medium term. The forecasted increase in
electric vehicles in the long term will drive investment needs across EV recharging stations. Automated driver-assistance
systems should support toll road capacity increases, but car sharing could offset this dynamic. Both drivers are positive
for urban traffic as they reduce congestion.134
Risks: Toll road traffic has a relatively strong correlation to GDP.135 Although unlikely, a further slowdown to economic
growth, or an increase in oil prices might cap traffic growth. In the long term, the advent of autonomous vehicles could
negatively affect parking assets. With autonomous vehicles likely to utilize car-sharing and cheaper parking locations,
revenues for certain parking facilities could be adversely affected. This is why our long-term industry trend for toll roads
and roads remains overall stable, rather than being positive.136
— Rail: 2019 Outlook: Stable – Long-Term Industry Trend: Stable/Positive137
The 2019 outlook remains stable for both European passenger and freight rail. Traffic volumes should continue on their
trend of long-term growth as capacity expands gradually. In the medium term, we continue to see a shift of freight traffic
from roads to rail, driven by tighter regulation around diesel trucking capacity and a growing importance of intermodal
freight transportation.138
The European rail industry is gradually moving to a deeper liberalization. European Union policymakers have been looking
for ways to make the European rail networks more efficient, opening up rail services to competition. Although liberalisation
in a number of European countries has been delayed for several years, we now expect an acceleration. The European
Union 4th railway package envisions the opening of domestic rail passengers markets from 2020, and we expect
competitive auctions to accelerate from 2023. Future European tenders are foreseen to be increasingly “multi-mode” in
order to satisfy customer needs of “seamless multimodal integration”, and exploit the possibility to design and operate
more efficient networks and services.139
This is one of the reasons why we are forecasting liberalization to gradually spread from rail also to other public
transportation sectors, including urban transport. Service levels of main incumbents across segments show room for
improvement, creating opportunities for companies that can provide a better customer experience. Looking at rolling
stock, today investment opportunities exist across Europe, and mainly in the United Kingdom, where we expect the market
to continue to provide opportunities, as a number of rail franchises are up for renewal from 2019.140 However, we expect
inter-city, regional, and local rolling-stock markets across Europe to provide significantly more opportunities in the medium
term, particularly as average fleet ages have already approached the end of their useful life and need replacement. This
is why our long-term industry trend is stable/ positive.141
133 DWS Forecast based on number of sources, including Oxford Economics, Bloomberg, Eurostat and Moody’s Investors Service data, as at November 2018. 134 Roland Berger, July 2018. 135 Eurostat, as at November 2018. 136 Based on a number of sources, including Bloomberg, Eurostat and Moody’s Investors Service data, as at November 2018. 137 Based on DWS proprietary methodology for ranking unlisted infrastructure sectors as at 25.11.2018, 30 November 2018. 138 Based on a number of sources, including Oxford Economics, Bloomberg, Eurostat and Moody’s Investors Service data, as at November 2018. 139 European Commission, “Fourth Railway Package”, April 2016. 140 Based on Infrastructure Journal database as at 25.11.2018, 30 November 2018. 141 Based on DWS proprietary methodology for ranking unlisted infrastructure sectors as at 25.11.2018, 30 November 2018.
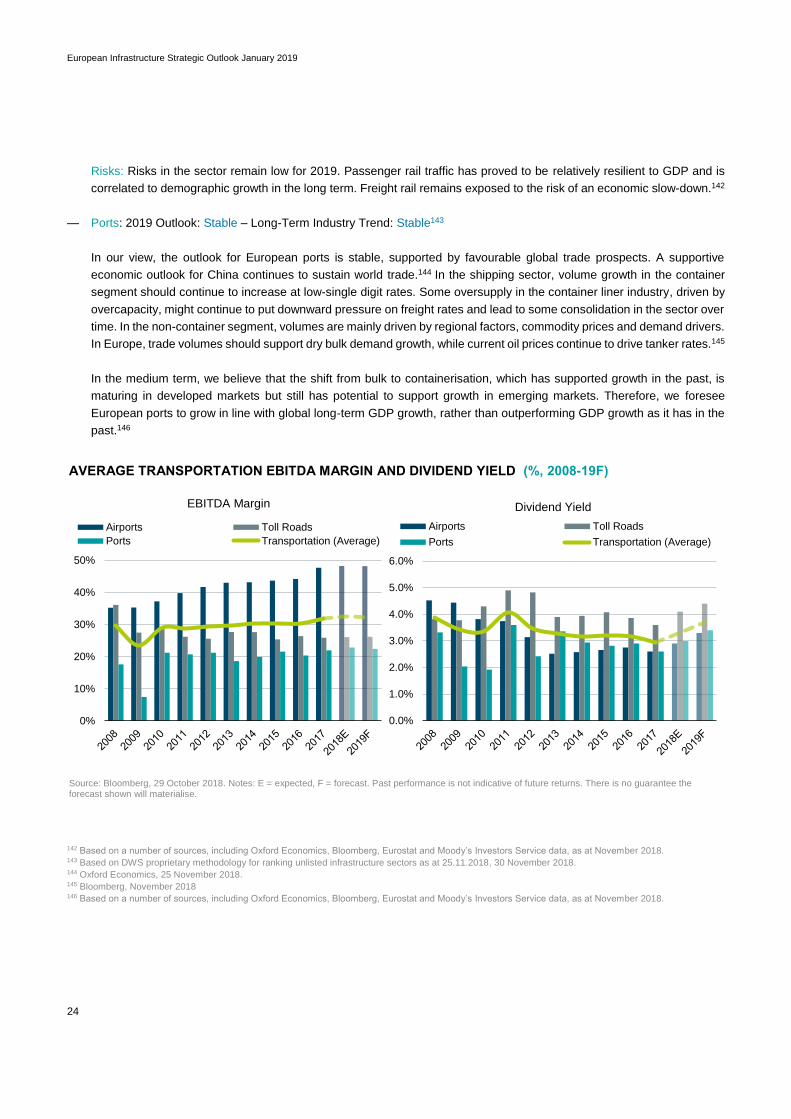
European Infrastructure Strategic Outlook January 2019
24
Risks: Risks in the sector remain low for 2019. Passenger rail traffic has proved to be relatively resilient to GDP and is
correlated to demographic growth in the long term. Freight rail remains exposed to the risk of an economic slow-down.142
— Ports: 2019 Outlook: Stable – Long-Term Industry Trend: Stable143
In our view, the outlook for European ports is stable, supported by favourable global trade prospects. A supportive
economic outlook for China continues to sustain world trade.144 In the shipping sector, volume growth in the container
segment should continue to increase at low-single digit rates. Some oversupply in the container liner industry, driven by
overcapacity, might continue to put downward pressure on freight rates and lead to some consolidation in the sector over
time. In the non-container segment, volumes are mainly driven by regional factors, commodity prices and demand drivers.
In Europe, trade volumes should support dry bulk demand growth, while current oil prices continue to drive tanker rates.145
In the medium term, we believe that the shift from bulk to containerisation, which has supported growth in the past, is
maturing in developed markets but still has potential to support growth in emerging markets. Therefore, we foresee
European ports to grow in line with global long-term GDP growth, rather than outperforming GDP growth as it has in the
past.146
AVERAGE TRANSPORTATION EBITDA MARGIN AND DIVIDEND YIELD (%, 2008-19F)
Source: Bloomberg, 29 October 2018. Notes: E = expected, F = forecast. Past performance is not indicative of future returns. There is no guarantee the forecast shown will materialise.
142 Based on a number of sources, including Oxford Economics, Bloomberg, Eurostat and Moody’s Investors Service data, as at November 2018. 143 Based on DWS proprietary methodology for ranking unlisted infrastructure sectors as at 25.11.2018, 30 November 2018. 144 Oxford Economics, 25 November 2018. 145 Bloomberg, November 2018 146 Based on a number of sources, including Oxford Economics, Bloomberg, Eurostat and Moody’s Investors Service data, as at November 2018.
0%
10%
20%
30%
40%
50%
EBITDA Margin
Airports Toll Roads
Ports Transportation (Average)
0.0%
1.0%
2.0%
3.0%
4.0%
5.0%
6.0%
Dividend Yield
Airports Toll Roads
Ports Transportation (Average)
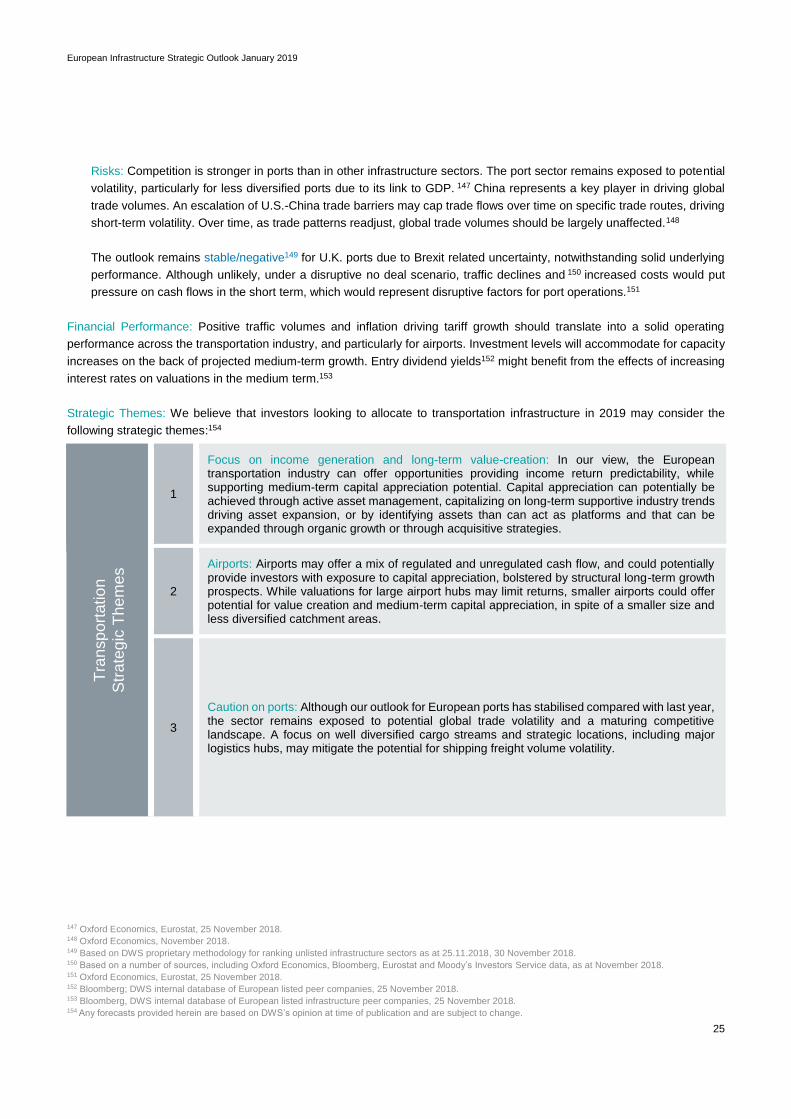
European Infrastructure Strategic Outlook January 2019
25
Risks: Competition is stronger in ports than in other infrastructure sectors. The port sector remains exposed to potential
volatility, particularly for less diversified ports due to its link to GDP. 147 China represents a key player in driving global
trade volumes. An escalation of U.S.-China trade barriers may cap trade flows over time on specific trade routes, driving
short-term volatility. Over time, as trade patterns readjust, global trade volumes should be largely unaffected.148
The outlook remains stable/negative149 for U.K. ports due to Brexit related uncertainty, notwithstanding solid underlying
performance. Although unlikely, under a disruptive no deal scenario, traffic declines and 150 increased costs would put
pressure on cash flows in the short term, which would represent disruptive factors for port operations.151
Financial Performance: Positive traffic volumes and inflation driving tariff growth should translate into a solid operating
performance across the transportation industry, and particularly for airports. Investment levels will accommodate for capacity
increases on the back of projected medium-term growth. Entry dividend yields152 might benefit from the effects of increasing
interest rates on valuations in the medium term.153
Strategic Themes: We believe that investors looking to allocate to transportation infrastructure in 2019 may consider the
following strategic themes:154
Tra
nsp
ort
atio
n
Str
ate
gic
Th
em
es
1
Focus on income generation and long-term value-creation: In our view, the European transportation industry can offer opportunities providing income return predictability, while supporting medium-term capital appreciation potential. Capital appreciation can potentially be achieved through active asset management, capitalizing on long-term supportive industry trends driving asset expansion, or by identifying assets than can act as platforms and that can be expanded through organic growth or through acquisitive strategies.
2
Airports: Airports may offer a mix of regulated and unregulated cash flow, and could potentially provide investors with exposure to capital appreciation, bolstered by structural long-term growth prospects. While valuations for large airport hubs may limit returns, smaller airports could offer potential for value creation and medium-term capital appreciation, in spite of a smaller size and less diversified catchment areas.
3
Caution on ports: Although our outlook for European ports has stabilised compared with last year, the sector remains exposed to potential global trade volatility and a maturing competitive landscape. A focus on well diversified cargo streams and strategic locations, including major logistics hubs, may mitigate the potential for shipping freight volume volatility.
147 Oxford Economics, Eurostat, 25 November 2018. 148 Oxford Economics, November 2018. 149 Based on DWS proprietary methodology for ranking unlisted infrastructure sectors as at 25.11.2018, 30 November 2018. 150 Based on a number of sources, including Oxford Economics, Bloomberg, Eurostat and Moody’s Investors Service data, as at November 2018. 151 Oxford Economics, Eurostat, 25 November 2018. 152 Bloomberg; DWS internal database of European listed peer companies, 25 November 2018. 153 Bloomberg, DWS internal database of European listed infrastructure peer companies, 25 November 2018. 154 Any forecasts provided herein are based on DWS’s opinion at time of publication and are subject to change.
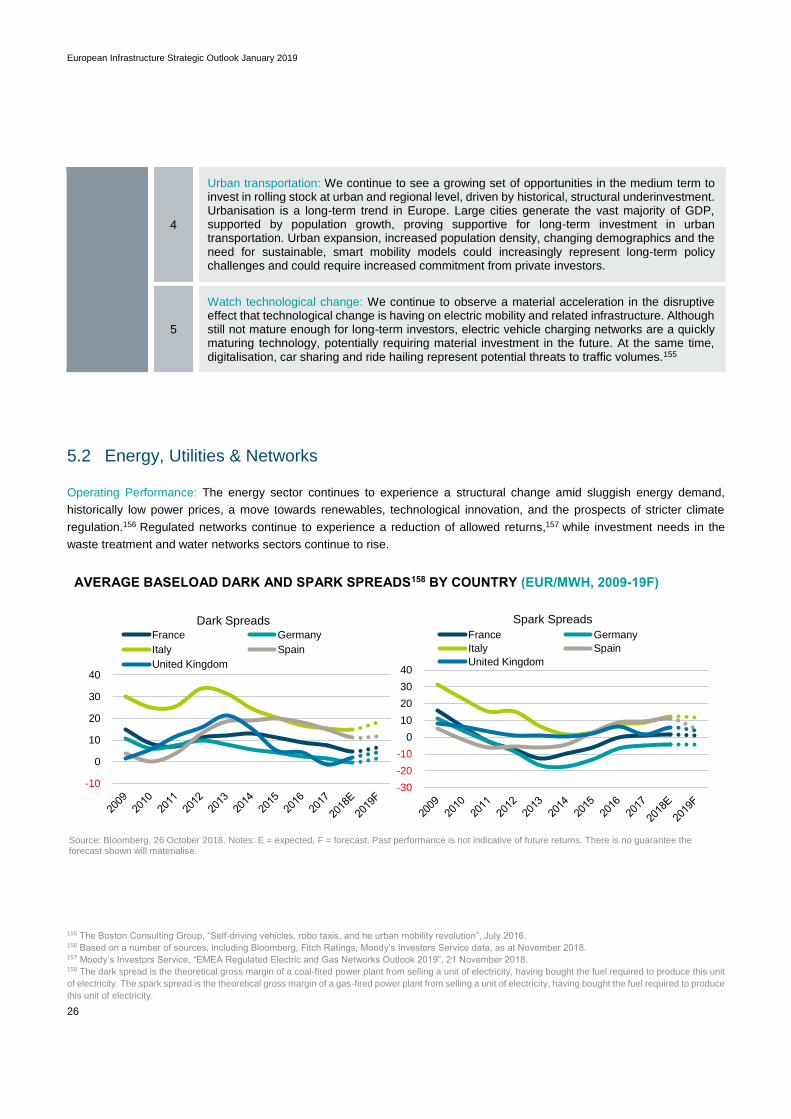
European Infrastructure Strategic Outlook January 2019
26
4
Urban transportation: We continue to see a growing set of opportunities in the medium term to invest in rolling stock at urban and regional level, driven by historical, structural underinvestment. Urbanisation is a long-term trend in Europe. Large cities generate the vast majority of GDP, supported by population growth, proving supportive for long-term investment in urban transportation. Urban expansion, increased population density, changing demographics and the need for sustainable, smart mobility models could increasingly represent long-term policy challenges and could require increased commitment from private investors.
5
Watch technological change: We continue to observe a material acceleration in the disruptive effect that technological change is having on electric mobility and related infrastructure. Although still not mature enough for long-term investors, electric vehicle charging networks are a quickly maturing technology, potentially requiring material investment in the future. At the same time, digitalisation, car sharing and ride hailing represent potential threats to traffic volumes.155
5.2 Energy, Utilities & Networks
Operating Performance: The energy sector continues to experience a structural change amid sluggish energy demand,
historically low power prices, a move towards renewables, technological innovation, and the prospects of stricter climate
regulation.156 Regulated networks continue to experience a reduction of allowed returns,157 while investment needs in the
waste treatment and water networks sectors continue to rise.
AVERAGE BASELOAD DARK AND SPARK SPREADS158 BY COUNTRY (EUR/MWH, 2009-19F)
Source: Bloomberg, 26 October 2018. Notes: E = expected, F = forecast. Past performance is not indicative of future returns. There is no guarantee the forecast shown will materialise.
155 The Boston Consulting Group, “Self-driving vehicles, robo taxis, and he urban mobility revolution”, July 2016. 156 Based on a number of sources, including Bloomberg, Fitch Ratings, Moody’s Investors Service data, as at November 2018. 157 Moody’s Investors Service, “EMEA Regulated Electric and Gas Networks Outlook 2019”, 21 November 2018. 158 The dark spread is the theoretical gross margin of a coal-fired power plant from selling a unit of electricity, having bought the fuel required to produce this unit
of electricity. The spark spread is the theoretical gross margin of a gas-fired power plant from selling a unit of electricity, having bought the fuel required to produce
this unit of electricity.
-10
0
10
20
30
40
Dark Spreads France Germany
Italy Spain
United Kingdom
-30
-20
-10
0
10
20
30
40
Spark Spreads
France Germany
Italy Spain
United Kingdom
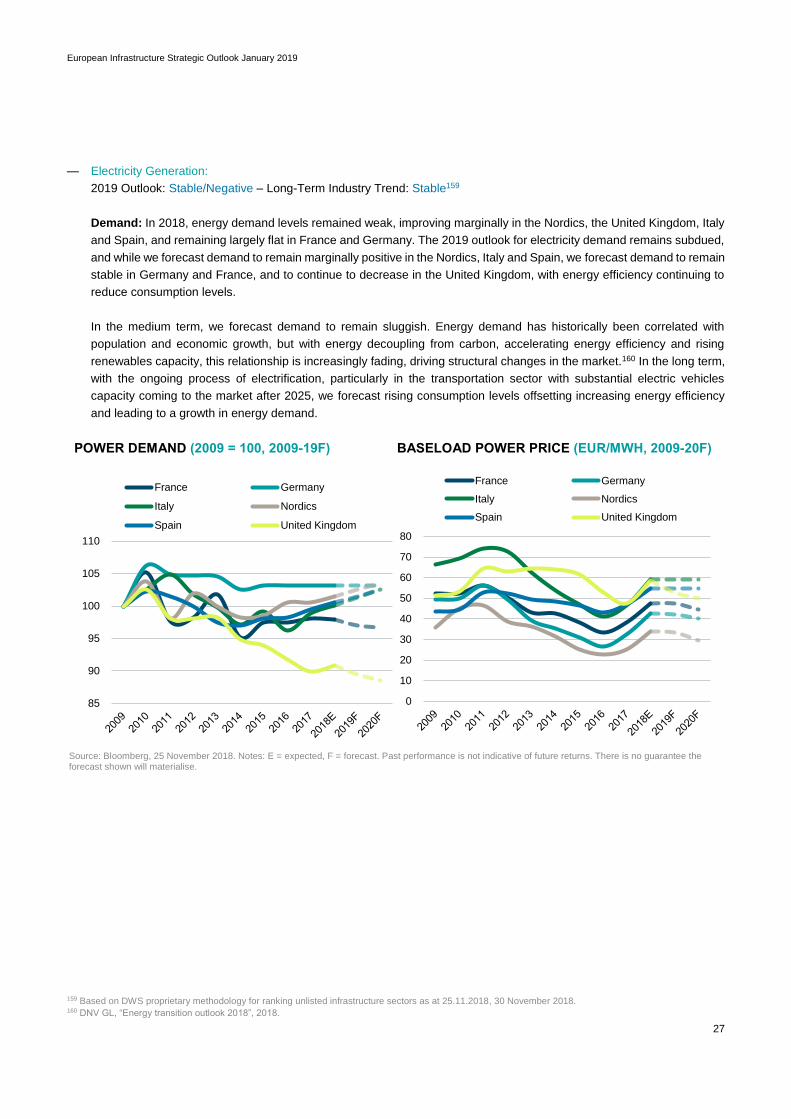
European Infrastructure Strategic Outlook January 2019
27
— Electricity Generation:
2019 Outlook: Stable/Negative – Long-Term Industry Trend: Stable159
Demand: In 2018, energy demand levels remained weak, improving marginally in the Nordics, the United Kingdom, Italy
and Spain, and remaining largely flat in France and Germany. The 2019 outlook for electricity demand remains subdued,
and while we forecast demand to remain marginally positive in the Nordics, Italy and Spain, we forecast demand to remain
stable in Germany and France, and to continue to decrease in the United Kingdom, with energy efficiency continuing to
reduce consumption levels.
In the medium term, we forecast demand to remain sluggish. Energy demand has historically been correlated with
population and economic growth, but with energy decoupling from carbon, accelerating energy efficiency and rising
renewables capacity, this relationship is increasingly fading, driving structural changes in the market.160 In the long term,
with the ongoing process of electrification, particularly in the transportation sector with substantial electric vehicles
capacity coming to the market after 2025, we forecast rising consumption levels offsetting increasing energy efficiency
and leading to a growth in energy demand.
POWER DEMAND (2009 = 100, 2009-19F) BASELOAD POWER PRICE (EUR/MWH, 2009-20F)
Source: Bloomberg, 25 November 2018. Notes: E = expected, F = forecast. Past performance is not indicative of future returns. There is no guarantee the forecast shown will materialise.
159 Based on DWS proprietary methodology for ranking unlisted infrastructure sectors as at 25.11.2018, 30 November 2018. 160 DNV GL, “Energy transition outlook 2018”, 2018.
85
90
95
100
105
110
France Germany
Italy Nordics
Spain United Kingdom
0
10
20
30
40
50
60
70
80
France Germany
Italy Nordics
Spain United Kingdom

European Infrastructure Strategic Outlook January 2019
28
Prices & Supply: In 2018, European power generation benefited from a moderate increase in power prices. For 2019,
forward power prices are mostly in backwardation, pointing to a potential reduction, particularly in the United Kingdom.
Across Europe, market fundamentals for mid-merit thermal generation should continue to remain challenging and point
to a more volatile energy price environment. Rising renewables will continue to push more expensive thermal capacity
out of merit order, reduce load factors and put pressure on power prices.161
In the medium term, the climate for EU generators should stabilize, as more coal and nuclear generation capacity is
mothballed and the commodity market recovery puts some upward pressure on power prices and dark and spark spreads.
We expect market fundamentals to improve, particularly across certain markets, including Germany and the United
Kingdom where we expect additional thermal capacity reductions. We also expect that gas prices might point upwards
due to an expected increase in the share of liquid natural gas (LNG) in the European market.162
Capacity markets are being implemented at national level across Europe to incentivise thermal generation and ensure
power supply safety. We foresee existing frameworks, largely based on auctions to gradually improve, to prove more
supportive for strategic thermal generation capacity.163
Risks: Thermal generation will increasingly be pushed out of the merit order due to growing renewables and rising CO2
prices from 2021 onwards.164
— Renewables:
2019 Outlook: Stable/Positive – Long-Term Industry Trend: Stable/Positive165
In 2018 renewable capacity in Europe continued to grow, in particular by off-shore wind in Northern Europe and
photovoltaic capacity (PV).166 In 2019, we foresee installation of renewables to continue. European regulatory frameworks
for renewable power generation are increasingly moving from feed-in-tariff mechanisms to more competitive auction
mechanisms or contract for difference frameworks, providing a floor to power prices, but somewhat capping profitability
and reducing long-term cash flow visibility.
In 2018, we observed some subsidy-free greenfield PV projects in Southern Europe being developed under the
assumption of grid-parity, a trend that should accelerate in coming years, particularly if higher carbon prices lift electricity
prices.167 In the medium term, market conditions, decarbonisation policies and falling equipment costs for renewables
and energy storage, should continue to drive renewables capacity, particularly across PV.
Risks: Fading subsidies expose new projects to weaker profitability or power price volatility in the long term in the absence
of power purchase agreements (PPA), while existing brownfield projects are generally exposed to tail risk due to expiring
subsidies. Equipment cost for renewables should continue to reduce. As technology evolves, these might be exposed to
untested operational assumptions, a risk that we observe particularly across the off-shore wind sector.
161 S&P Global Platts, 22 November 2018. 162 Bloomberg, 20 November 2018. 163 S&P Global, “Annual Infrastructure & Utilities Conference 2018”, 15 November 2018. 164 Based on Bloomberg and DNV GL data, as at November 2018. 165 Based on DWS proprietary methodology for ranking unlisted infrastructure sectors as at 25.11.2018, 30 November 2018. 166 Infrastructure Journal database, 17 November 2018. 167 PV Magazine, 8 march 2018.
European Infrastructure Strategic Outlook January 2019
29
— Utilities & Networks:
2019 Outlook: Stable – Long-Term Industry Trend: Stable/Positive (Electricity), Stable/ Negative (Gas), Stable/Positive
(Water) 168
Regulatory frameworks are generally strong and predictable in Europe, supporting long-term revenue visibility. Network
utilities have seen a gradual reduction in regulated returns since 2010, due to a steady decrease in allowed cost of debt.169
With inflation forecast to pick up gradually, networks will enjoy some earnings growth potential, while the negative impact
of lower allowed return will be partially mitigated by the possibility to refinance maturing debt at historically low rates.
In 2019 we see a number of regulatory determinations, but fundamentally we are not anticipating substantial changes to
regulatory frameworks. More specifically, we see a compression in regulated returns for transmission and distribution
networks in Germany. The regulated return of U.K. energy grids is expected to reduce in the next regulatory cycle, in line
with what we are observing for U.K. water.170 Other regulatory determinations on regulatory cycles for electric and gas
networks that are due to expire in 2019-2021 are in Norway, Finland, Sweden, Austria, Italy, Spain and Portugal. 171
In the long term we see electricity networks, particularly distribution grids, benefitting from supportive regulation and
increased investment needs to accommodate the increase in distributed renewable energy capacity. At the same time,
we see the growth of gas networks remaining below GDP growth due to a progressively maturing industry and the
prospects of electrification substituting gas in most markets.
Risks: We see allowed returns to continue declining in the medium term, although at a slightly more moderate pace
compared with recent years, reducing the spread offered by regulated networks over bond yields further. In the context
of lower interest rates, networks have been able to outperform allowed cost of debt. The impact of rising interest rates
will be mitigated by regulatory mechanisms over time. However, networks might remain exposed to a mismatch between
the rise in cost of debt and regulatory allowances of financing costs in the short term.
— Energy from Waste:
2019 Outlook: Stable – Long-Term Industry Trend: Stable172
In 2019, we foresee the market fundamentals for European EfW operations to remain solid, with industrial waste volumes
supported by adequate GDP growth, and domestic waste underpinned by economic growth and demographics. The
recent ban in China on importing waste from Europe is forecast to support domestic waste volumes to EfW in the short
term. Gate fees vary substantially by location and country. On average, we foresee gate fees to remain supportive but
relatively stable through 2020, due to competition from the import/ export market, undersupply of EfW, and landfill tax/
moratoria in some European markets, particularly in the United Kingdom.
Our view remains favourable for Energy from Waste (EfW) projects in certain European countries, including for example
the United Kingdom in the medium term, on the back of growing barriers to landfills, a shortage of EfW capacity, and
rising waste volumes amid limits to achievable recycling targets. In the short term, we foresee markets with an excess
capacity of EfW, including the Netherlands and Germany, to continue benefit from supportive gate fees, and solid waste
import flows from other European markets, with EfW capacity constraints, particularly in Southern Europe.
In the medium term policies discouraging landfill in favour of recovery or recycling should continue to drive market
fundamentals in the medium term. The gradual closing down of landfill sites should provide sustainable waste flows
168 Based on DWS proprietary methodology for ranking unlisted infrastructure sectors as at 25.11.2018, 30 November 2018. 169 Moody’s Investors Service, “EMEA Regulated Electric and Gas Networks Outlook 2019”, 21 November 2018. 170 Moody’s Investors Service, “EMEA Regulated Electric and Gas Networks Outlook 2019”, 21 November 2018. 171 Moody’s Investors Service, November 2018. 172 Based on DWS proprietary methodology for ranking unlisted infrastructure sectors as at 25.11.2018, 30 November 2018.
European Infrastructure Strategic Outlook January 2019
30
towards EfW projects in the future. In the United Kingdom, the landfill tax mechanism should represent a more effective
market stabilisation mechanism limiting EfW overcapacity, compared to landfill moratoria in other European markets.
In the medium term, recycling is forecast to grow driven by European Union policies, partially offsetting favourable
conditions for EfW. For example, there is a target for the United Kingdom to recycle at least 50% of household waste by
2020, while the rate was about 45.2% in 2016.173 However, historical evidence demonstrates that recycling rates can
reach a cap that becomes progressively more difficult to overcome.174
Risks: Waste volumes tend to be correlated to GDP growth. Municipal waste contracts with local authorities and private
counterparties support long-term revenue visibility over merchant waste. For EfW investments, we believe that a
diversified profile of waste supply contracts, alongside strategic plant location to benefit from a competitive advantage in
waste imports represent can support long-term cash-flow visibility and investment value preservation.
— Utilities Adjust Long-Term Strategy: European utilities have now largely completed their multi-year asset disposal
programs, reducing materially their exposure to merchant power generation, resulting in the mothballing of thermal base-
load generators and refocusing of their European business profiles, mainly on networks and renewables. On average,
profitability levels have improved following a few challenging years, supported by material cost optimization efforts.175
In 2019, a number of European utilities are expected to publish new strategic plans, which will provide an important
indication on their long-term investment strategies and how they will respond to the growing trends of digitalization and
transport electrification.176 We foresee this to result in utilities potentially refocusing their business models on new
geographies and new services, and stronger investment, supported by renewed investment capacity.
In our view, utilities will gradually focus on new, digital technologies and act as virtual aggregators for increasingly
distributed energy generation. We would foresee expansion into demand response services and engagement with active
customers through the provision of smart metering and other services, potentially including telecommunications.
In the medium term we foresee larger utilities to remain acquisitive, targeting smaller players in the energy efficiency,
demand-response, smart grid and electric vehicle recharging technologies sectors to acquire innovative technology, as
they expand their operations across new businesses and new markets. In the long term, we foresee new winners and
losers to emerge in the utilities space, and do not exclude a renewed wave on M&A activity. This dynamic will unlock
investment opportunities. We believe that utilities will increasingly require industrial and financial partnerships to
restructure their operations, particularly at municipal level, where contractual power tends to be lower due to more limited
business size.
Energy Transition: The shift towards renewables and battery storage is catalysing a structural change across the energy
sector, with capacity markets177 and frequency response services forecast to expand gradually across Europe and to
stabilise the grid. We see the electric vehicles industry accelerating in the medium term, requiring investment in energy
distribution grids.178 As these technologies mature, we continue to follow their evolution closely.
173 Department for Environment Food & Rural Affairs, “UK Statistics on Waste”, 9 October 2018. 174 McKinsey, June 2015. 175 Bloomberg; DWS internal database of European listed peer companies, 23 November 2018. 176 Bloomberg; DWS internal database of European listed peer companies, 23 November 2018. 177 Capacity markets ensure adequate balancing of an electrical system by remunerating baseload generators for the capacity they make available, rather than
for the electricity generated. 178 BMI, “The road to unlocking EV potential”, December 2016.
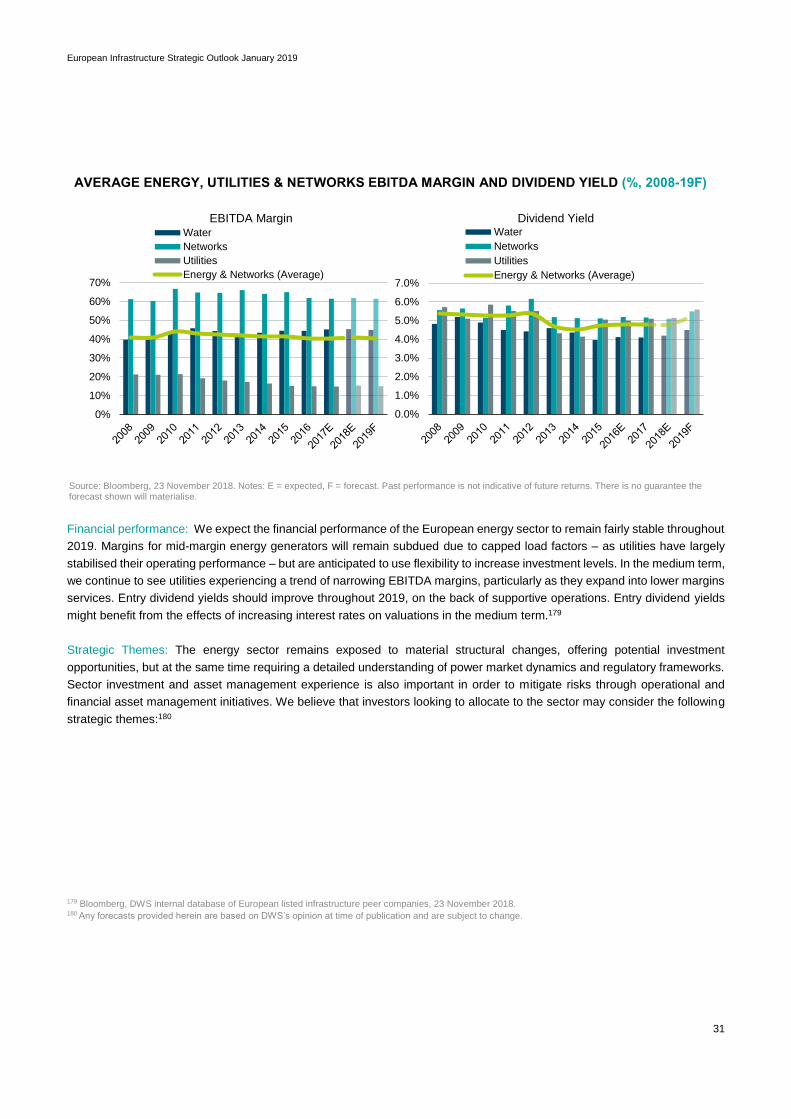
European Infrastructure Strategic Outlook January 2019
31
Financial performance: We expect the financial performance of the European energy sector to remain fairly stable throughout
2019. Margins for mid-margin energy generators will remain subdued due to capped load factors – as utilities have largely
stabilised their operating performance – but are anticipated to use flexibility to increase investment levels. In the medium term,
we continue to see utilities experiencing a trend of narrowing EBITDA margins, particularly as they expand into lower margins
services. Entry dividend yields should improve throughout 2019, on the back of supportive operations. Entry dividend yields
might benefit from the effects of increasing interest rates on valuations in the medium term.179
Strategic Themes: The energy sector remains exposed to material structural changes, offering potential investment
opportunities, but at the same time requiring a detailed understanding of power market dynamics and regulatory frameworks.
Sector investment and asset management experience is also important in order to mitigate risks through operational and
financial asset management initiatives. We believe that investors looking to allocate to the sector may consider the following
strategic themes:180
179 Bloomberg, DWS internal database of European listed infrastructure peer companies, 23 November 2018. 180 Any forecasts provided herein are based on DWS’s opinion at time of publication and are subject to change.
AVERAGE ENERGY, UTILITIES & NETWORKS EBITDA MARGIN AND DIVIDEND YIELD (%, 2008-19F)
Source: Bloomberg, 23 November 2018. Notes: E = expected, F = forecast. Past performance is not indicative of future returns. There is no guarantee the forecast shown will materialise.
0%
10%
20%
30%
40%
50%
60%
70%
EBITDA MarginWater
Networks
Utilities
Energy & Networks (Average)
0.0%
1.0%
2.0%
3.0%
4.0%
5.0%
6.0%
7.0%
Dividend YieldWater
Networks
Utilities
Energy & Networks (Average)
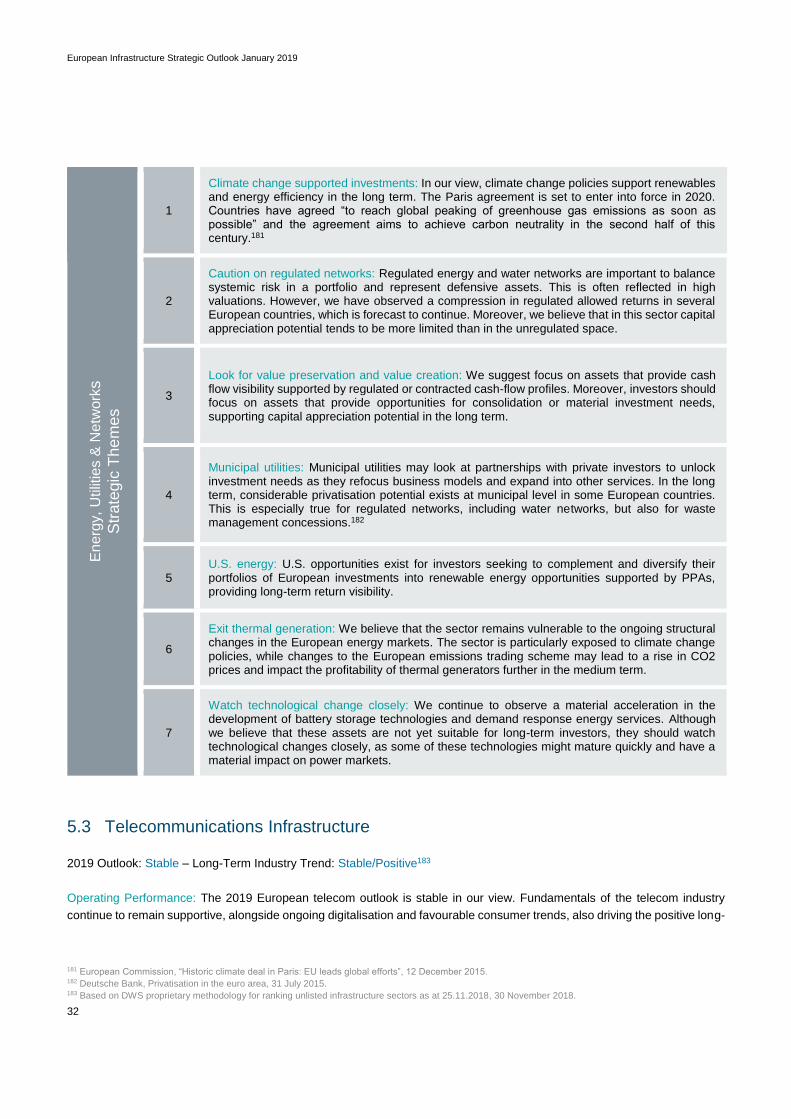
European Infrastructure Strategic Outlook January 2019
32
En
erg
y, U
tilit
ies &
Ne
twork
s
Str
ate
gic
Th
em
es
1
Climate change supported investments: In our view, climate change policies support renewables and energy efficiency in the long term. The Paris agreement is set to enter into force in 2020. Countries have agreed “to reach global peaking of greenhouse gas emissions as soon as possible” and the agreement aims to achieve carbon neutrality in the second half of this century.181
2
Caution on regulated networks: Regulated energy and water networks are important to balance systemic risk in a portfolio and represent defensive assets. This is often reflected in high valuations. However, we have observed a compression in regulated allowed returns in several European countries, which is forecast to continue. Moreover, we believe that in this sector capital appreciation potential tends to be more limited than in the unregulated space.
3
Look for value preservation and value creation: We suggest focus on assets that provide cash flow visibility supported by regulated or contracted cash-flow profiles. Moreover, investors should focus on assets that provide opportunities for consolidation or material investment needs, supporting capital appreciation potential in the long term.
4
Municipal utilities: Municipal utilities may look at partnerships with private investors to unlock investment needs as they refocus business models and expand into other services. In the long term, considerable privatisation potential exists at municipal level in some European countries. This is especially true for regulated networks, including water networks, but also for waste management concessions.182
5 U.S. energy: U.S. opportunities exist for investors seeking to complement and diversify their portfolios of European investments into renewable energy opportunities supported by PPAs, providing long-term return visibility.
6
Exit thermal generation: We believe that the sector remains vulnerable to the ongoing structural changes in the European energy markets. The sector is particularly exposed to climate change policies, while changes to the European emissions trading scheme may lead to a rise in CO2 prices and impact the profitability of thermal generators further in the medium term.
7
Watch technological change closely: We continue to observe a material acceleration in the development of battery storage technologies and demand response energy services. Although we believe that these assets are not yet suitable for long-term investors, they should watch technological changes closely, as some of these technologies might mature quickly and have a material impact on power markets.
5.3 Telecommunications Infrastructure
2019 Outlook: Stable – Long-Term Industry Trend: Stable/Positive183
Operating Performance: The 2019 European telecom outlook is stable in our view. Fundamentals of the telecom industry
continue to remain supportive, alongside ongoing digitalisation and favourable consumer trends, also driving the positive long-
181 European Commission, “Historic climate deal in Paris: EU leads global efforts”, 12 December 2015. 182 Deutsche Bank, Privatisation in the euro area, 31 July 2015. 183 Based on DWS proprietary methodology for ranking unlisted infrastructure sectors as at 25.11.2018, 30 November 2018.
European Infrastructure Strategic Outlook January 2019
33
term industry trend. However, the supportive demand dynamic is somewhat offset by increased competition in the sector,
capping revenue growth at about 1% a year for 2019, due to slower GDP growth in Europe compared with 2018.
Although we continue to observe exponential growth in data usage, the ability of telecom operators to monetise demand
remains capped by heavy competition.184 The elimination of mobile-roaming charges in the EU from 2017 continues to
represent a negative short-term factor for industry profitability, but may lead to greater roaming usage and support mobile-
data consumption patterns in the medium term. The most competitive markets for telecom operators in Europe are the United
Kingdom, the Netherlands, Spain, France and Italy, where over 70% of revenue is driven by the residential sector, while the
business segment accounts for about 30%.185
— Telecom Infrastructure: Although competition remains high for telecommunication operators, the need for
telecommunication infrastructure continues to increase. Robust demand for data and connectivity supports the case for
future transaction opportunities across fibre optics and telecom towers. An increase in the number of broadband users
continues to help support growth for cable companies and there remains scope for material investment in fibre optics,
due to growth in broadband penetration, particularly high-speed broadband, as many European countries still lag behind
EU’s objectives. 186
In 2018, we have observed a number of brownfield and greenfield transactions across both fibre networks and telecom
towers. Investment in the sector is likely to be strong in the medium term, as companies will carry on upgrading networks
to higher-capacity and higher-speed systems to support growing service and data demand. 187 Moreover, some
investment opportunities might emerge as a result of increased M&A activity in the space and as telecom operators might
dispose of non-core assets, including towers and masts, as well as wireless and fibre optics networks.
Telecom infrastructure opportunities have the potential to offer adequate medium-term cash flow visibility and diversified
contract profiles supporting income return, but can also provide a strong platform for growth through asset acquisition
and consolidation supporting capital appreciation in the medium term. Capital spending should remain high in the industry,
as regulators are increasingly encouraging investment through transparent regulatory frameworks and predictable
investment returns.188
— Risks: We are also observing more transactions in the data centre space. In our view, this remains a sector exposed to
material technological risk and limited revenue visibility, although we acknowledge that opportunities in specific locations
and with strong counterparties providing long-term cash-flow visibility may prove more predictable in the long term.
Over time, the proliferation of smartphones may partially cap broadband penetration. Smartphones may be used as the
primary internet connection, especially in peripheral markets due to high investment costs and high costs for lower-income
households. Penetration of 4G still has growth potential in Europe189, while the adoption of 5G technology from 2020
onwards will support increased data demand. However, the 5G technology may also create the need to replace wires in
the last mile, increasing competition among cable and telecommunications companies.190
— Industry Convergence & Long-Term Trends: Telecommunications is a rapidly changing industry and the boundaries
between telecom service and cable television are being eroded across Europe. The dynamics of convergence and
competition differ by country, but the services provided by cable and telecom companies continue to converge to include
television, broadband, mobile, and fixed telephony. Moreover, the sector is undergoing structural changes as it moves
from vertical integration towards a more decentralised model. 184 Based on a number of sources, including Oxford Economics, Bloomberg, Fitch Ratings, Moody’s Investors Service data, as at November 2018. 185 Bloomberg, November 2018. 186 Bloomberg, November 2018. 187 Based on a number of sources, including Bloomberg, Fitch Ratings, Moody’s Investor Service data, as at November 2018. 188 Based on number of sources, including Oxford Economics, Bloomberg, Fitch Ratings, Moody’s Investors Service data, as at November 2018. 189 Based on a number of sources, including Oxford Economics, Bloomberg, Fitch Ratings, Moody’s Investors Service data, as at November 2018. 190 Moody’s Investors Service, November 2018.
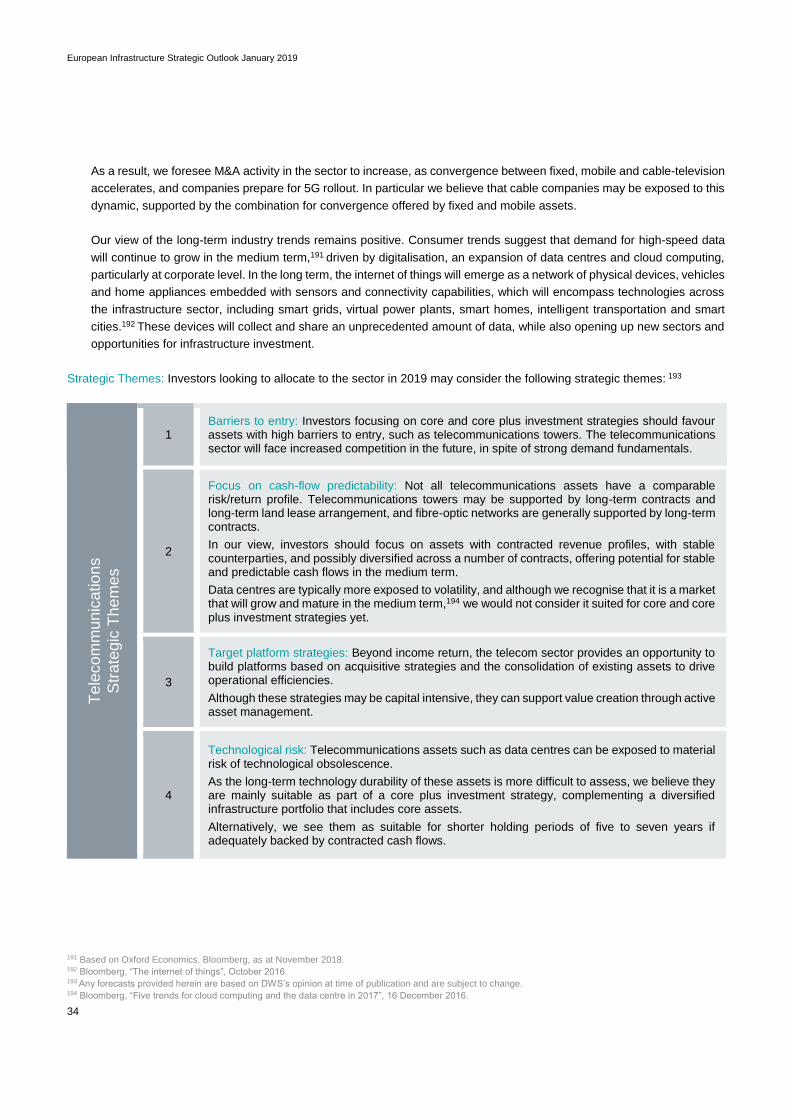
European Infrastructure Strategic Outlook January 2019
34
As a result, we foresee M&A activity in the sector to increase, as convergence between fixed, mobile and cable-television
accelerates, and companies prepare for 5G rollout. In particular we believe that cable companies may be exposed to this
dynamic, supported by the combination for convergence offered by fixed and mobile assets.
Our view of the long-term industry trends remains positive. Consumer trends suggest that demand for high-speed data
will continue to grow in the medium term,191 driven by digitalisation, an expansion of data centres and cloud computing,
particularly at corporate level. In the long term, the internet of things will emerge as a network of physical devices, vehicles
and home appliances embedded with sensors and connectivity capabilities, which will encompass technologies across
the infrastructure sector, including smart grids, virtual power plants, smart homes, intelligent transportation and smart
cities.192 These devices will collect and share an unprecedented amount of data, while also opening up new sectors and
opportunities for infrastructure investment.
Strategic Themes: Investors looking to allocate to the sector in 2019 may consider the following strategic themes: 193
Te
leco
mm
un
icatio
ns
Str
ate
gic
Th
em
es
1 Barriers to entry: Investors focusing on core and core plus investment strategies should favour assets with high barriers to entry, such as telecommunications towers. The telecommunications sector will face increased competition in the future, in spite of strong demand fundamentals.
2
Focus on cash-flow predictability: Not all telecommunications assets have a comparable risk/return profile. Telecommunications towers may be supported by long-term contracts and long-term land lease arrangement, and fibre-optic networks are generally supported by long-term contracts.
In our view, investors should focus on assets with contracted revenue profiles, with stable counterparties, and possibly diversified across a number of contracts, offering potential for stable and predictable cash flows in the medium term.
Data centres are typically more exposed to volatility, and although we recognise that it is a market that will grow and mature in the medium term,194 we would not consider it suited for core and core plus investment strategies yet.
3
Target platform strategies: Beyond income return, the telecom sector provides an opportunity to build platforms based on acquisitive strategies and the consolidation of existing assets to drive operational efficiencies.
Although these strategies may be capital intensive, they can support value creation through active asset management.
4
Technological risk: Telecommunications assets such as data centres can be exposed to material risk of technological obsolescence.
As the long-term technology durability of these assets is more difficult to assess, we believe they are mainly suitable as part of a core plus investment strategy, complementing a diversified infrastructure portfolio that includes core assets.
Alternatively, we see them as suitable for shorter holding periods of five to seven years if adequately backed by contracted cash flows.
191 Based on Oxford Economics, Bloomberg, as at November 2018. 192 Bloomberg, “The internet of things”, October 2016. 193 Any forecasts provided herein are based on DWS’s opinion at time of publication and are subject to change.
194 Bloomberg, “Five trends for cloud computing and the data centre in 2017”, 16 December 2016.
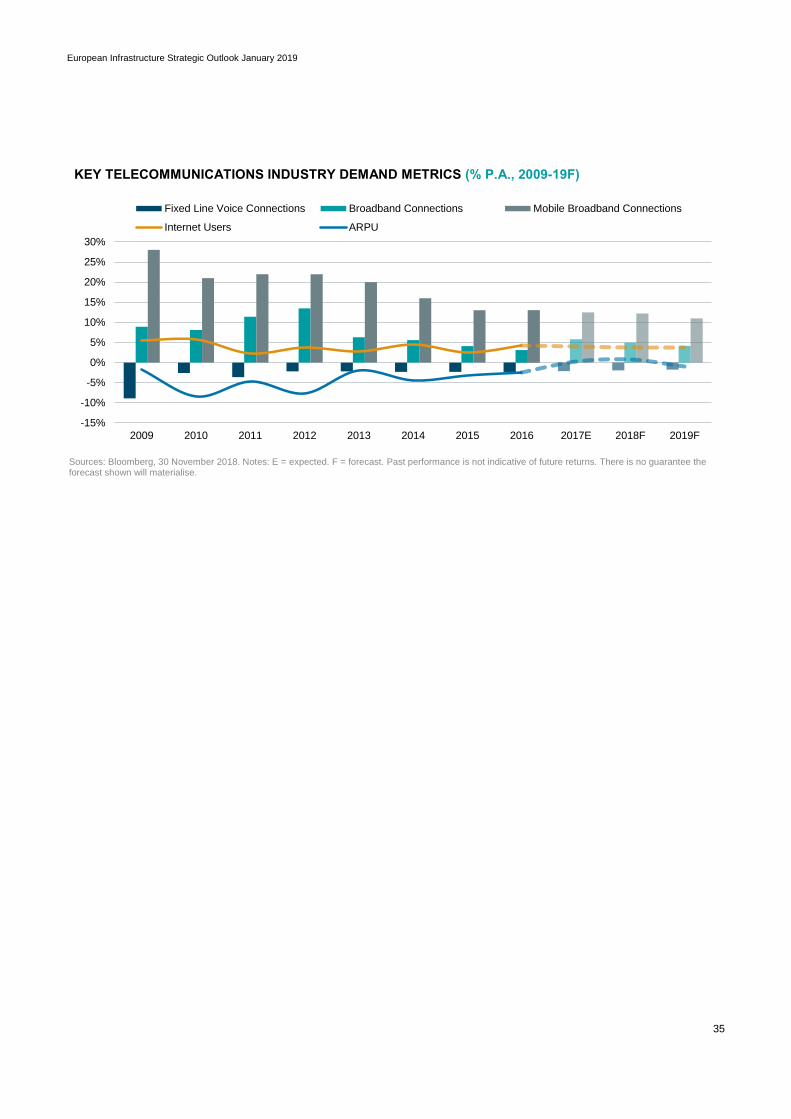
European Infrastructure Strategic Outlook January 2019
35
KEY TELECOMMUNICATIONS INDUSTRY DEMAND METRICS (% P.A., 2009-19F)
Sources: Bloomberg, 30 November 2018. Notes: E = expected. F = forecast. Past performance is not indicative of future returns. There is no guarantee the forecast shown will materialise.
-15%
-10%
-5%
0%
5%
10%
15%
20%
25%
30%
2009 2010 2011 2012 2013 2014 2015 2016 2017E 2018F 2019F
Fixed Line Voice Connections Broadband Connections Mobile Broadband Connections
Internet Users ARPU

European Infrastructure Strategic Outlook January 2019
36

European Infrastructure Strategic Outlook January 2019
37
Important Information
The brand DWS represents DWS Group GmbH & Co. KGaA and any of its subsidiaries, such as DWS Distributors, Inc., which offers investment products, or DWS Investment Management Americas, Inc. and RREEF America L.L.C., which offer advisory services.
DWS represents the asset management activities conducted by DWS Group GmbH & Co. KGaA or any of its subsidiaries. In the U.S., DWS relates to the asset management activities of RREEF America L.L.C.; in Germany: DWS Grundbesitz GmbH, DWS Real Estate GmbH, and DWS Alternatives GmbH; in Australia: Deutsche Investments Australia Limited (ABN 52 074 599 401) an Australian financial services incense holder; in Japan: Deutsche Securities Inc. (For DSI, financial advisory (not investment advisory) and distribution services only); in Hong Kong: Deutsche Bank Aktiengesellschaft, Hong Kong Branch (for direct real estate business), and Deutsche Asset Management (Hong Kong) Limited (for real estate securities business); in Singapore: Deutsche Asset Management (Asia) Limited (Company Reg. No. 198701485N); in the United Kingdom: Deutsche Alternative Asset Management (UK) Limited, Deutsche Alternative Asset Management (Global) Limited and Deutsche Asset Management (UK) Limited; and in Denmark, Finland, Norway and Sweden: Deutsche Alternative Asset Management (UK) Limited and Deutsche Alternative Asset Management (Global) Limited; in addition to other regional entities in the Deutsche Bank Group. Key DWS research personnel are voting members of various investment committees. Members of the investment committees vote with respect to underlying investments and/or transactions and certain other matters subjected to a vote of such investment committee. The views expressed in this document have been approved by the responsible portfolio management team and Infrastructure investment committee and may not necessarily be the views of any other division within DWS. This material was prepared without regard to the specific objectives, financial situation or needs of any particular person who may receive it. It is intended for informational purposes only. It does not constitute investment advice, a recommendation, an offer, solicitation, the basis for any contract to purchase or sell any security or other instrument, or for DWS or its affil iates to enter into or arrange any type of transaction as a consequence of any information contained herein. Neither DWS nor any of its affiliates gives any warranty as to the accuracy, reliability or completeness of information which is contained in this document. Except insofar as liability under any statute cannot be excluded, no member of the DWS, the Issuer or any office, employee or associate of them accepts any liability (whether arising in contract, in tort or negligence or otherwise) for any error or omission in this document or for any resulting loss or damage whether direct, indirect, consequential or otherwise suffered by the recipient of this document or any other person. The views expressed in this document constitute DWS Group’s judgment at the time of issue and are subject to change. This document is only for professional investors. This document was prepared without regard to the specific objectives, financial situation or needs of any particular person who may receive it. No further distribution is allowed without prior written consent of the Issuer. Investments are subject to risk, including market fluctuations, regulatory change, possible delays in repayment and loss of income and principal invested. The value of investments can fall as well as rise and you might not get back the amount originally invested at any point in time. An investment in infrastructure involves a high degree of risk, including possible loss of principal amount invested, and is suitable only for sophisticated investors who can bear such losses. The value of shares/ units and their derived income may fall or rise. Any forecasts provided herein are based upon DWS’s opinion of the market at this date and are subject to change dependent on the market. Past performance or any prediction, projection or forecast on the economy or markets is not indicative of future performance.

European Infrastructure Strategic Outlook January 2019
38
In Australia: Issued by Deutsche Investments Australia Limited (ABN 52 074 599 401), holder of an Australian Financial Services License (AFSL 499 640). This information is only available to persons who are professional, sophisticated, or wholesale investors as defined under section 761 G of the Corporations Act 2001 (Cth). The information provided is not to be construed as investment, legal or tax advice and any recipient should take their own investment, legal and tax advice before investing. Deutsche Investments Australia Limited is an asset management subsidiary of DWS Group GmbH & CO. KGaA (“DWS Group”). The capital value of and performance of an investment is not in any way guaranteed by DWS Group, Deutsche Investments Australia Limited or any other member of the DWS Group. Any forecasts provided herein are based upon our opinion of the market as at this date and are subject to change, dependent on future changes in the market. Any prediction, projection or forecast on the economy, stock market, bond market or the economic trends of the markets is not necessarily indicative of the future or likely performance. Investments are subject to investment risk, including possible delays in repayment and loss of income and principal invested. Deutsche Investments Australia Limited is not an Authorised Deposit-taking Institution under the Banking Act 1959 nor regulated by APRA. Notice to prospective Investors in Japan: This document is distributed in Japan by DeAMJ. Please contact the responsible employee of DeAMJ in case you have any question on this document because DeAMJ serves as contacts for the product or service described in this document. This document is for distribution to Professional Investors only under the Financial Instruments and Exchange Law. Dubai International Financial Centre: Deutsche Bank AG in the Dubai International Financial Centre (registered no. 00045) is regulated by the Dubai Financial Services Authority. Deutsche Bank AG - DIFC Branch may only undertake the financial services activities that fall within the scope of its existing DFSA license. Principal place of business in the DIFC: Dubai International Financial Centre, The Gate Village, Building 5, PO Box 504902, Dubai, U.A.E. This information has been distributed by Deutsche Bank AG. Related financial products or services are only available to Professional Clients, as defined by the Dubai Financial Services Authority. Kingdom of Saudi Arabia: Deutsche Securities Saudi Arabia LLC Company, (registered no. 07073-37) is regulated by the Capital Market Authority. Deutsche Securities Saudi Arabia may only undertake the financial services activities that fall within the scope of its existing CMA license. Principal place of business in Saudi Arabia: King Fahad Road, Al Olaya District, P.O. Box 301809, Faisaliah Tower - 17th Floor, 11372 Riyadh, Saudi Arabia. For Investors in Switzerland: This material is intended for information purposes only and does not constitute investment advice or a personal recommendation. This document should not be construed as an offer to sell any investment or service. Furthermore, this document does not constitute the solicitation of an offer to purchase or subscribe for any investment or service in any jurisdiction where, or from any person in respect of whom, such a solicitation of an offer is unlawful. Neither Deutsche Bank AG nor any of its affiliates, gives any warranty as to the accuracy, reliability or completeness of information which is contained in this document. Past performance or any prediction or forecast is not indicative of future results. The views expressed in this document constitute DWS Group’s judgment at the time of issue and are subject to change. DWS Group has no obligation to update, modify or amend this letter or to otherwise notify a reader thereof in the event that any matter stated herein, or any opinion, projection, forecast or estimate set forth herein, changes or subsequently becomes inaccurate, or if research on the subject company is withdrawn. Prices and availability of financial instruments also are subject to change without notice. The information provided in this document is addressed solely to Qualified Investors pursuant to Article 10 paragraph 3 of the Swiss Federal Act on Collective Investment Schemes (CISA) and Article 6 of the Ordinance on Collective Investment Schemes. This document is not a prospectus within the meaning of Articles 1156 and 652a of the Swiss Code of Obligations and may not comply with the information standards required thereunder. This document may not be copied, reproduced, distributed or passed on to others without the prior written consent of DWS CH AG or its affiliates. For investors in the United Kingdom: FOR PROFESSIONAL CLIENTS ONLY Issued and approved by DWS Alternatives Global Limited of Winchester House, 1 Great Winchester Street, London, EC2N 2DB, authorised and regulated by the Financial Conduct Authority (“FCA”). DWS Alternatives Global Limited is also registered with the U.S. Securities and Exchange Commission under the Investment Advisers Act 1940 (the “Advisers Act”), however it complies with the Advisers Act only with respect to US clients. This document is a “non-retail communication” within the meaning of the FCA's Rules and is directed only at persons satisfying the FCA’s client categorisation criteria for an eligible counterparty or a professional client. This document is not intended for and should not be relied upon by a retail client. This document may not be reproduced or circulated without written consent of the issuer.

European Infrastructure Strategic Outlook January 2019
39
This document is intended for discussion purposes only and does not create any legally binding obligations on the part of DWS Group GmbH & Co. KGaA and/or its affiliates (“DWS”). Without limitation, this document does not constitute investment advice or a recommendation or an offer or solicitation and is not the basis for any contract to purchase or sell any security or other instrument, or for DWS to enter into or arrange any type of transaction as a consequence of any information contained herein. The information contained in this document is based on material we believe to be reliable; however, we do not represent that it is accurate, current, complete, or error free. Assumptions, estimates and opinions contained in this document constitute our judgment as of the date of the document and are subject to change without notice. Past performance is not a guarantee of future results. Any forecasts provided herein are based upon our opinion of the market as at this date and are subject to change, dependent on future changes in the market. Any prediction, projection or forecast on the economy, stock market, bond market or the economic trends of the markets is not necessarily indicative of the future or likely performance. Investments are subject to risks, including possible loss of principal amount invested. When making an investment decision, potential investors should rely solely on the final documentation relating to the investment or service and not the information contained herein. The investments or services mentioned herein may not be appropriate for all investors and before entering into any transaction you should take steps to ensure that you fully understand the transaction and have made an independent assessment of the appropriateness of the transaction in the light of your own objectives and circumstances, including the possible risks and benefits of entering into such transaction. For general information regarding the nature and risks of the proposed transaction and types of financial instruments please go to https://www.db.com/company/en/risk-disclosures.htm. You should also consider seeking advice from your own advisers in making this assessment. If you decide to enter into a transaction with us you do so in reliance on your own judgment. Any opinions expressed herein may differ from the opinions expressed by Deutsche Bank AG and/or its affiliates (“DB”). DB may engage in transactions in a manner inconsistent with the views discussed herein. DB trades or may trade as principal in the instruments (or related derivatives), and may have proprietary positions in the instruments (or related derivatives) discussed herein. DB may make a market in the instruments (or related derivatives) discussed herein. You may not distribute this document, in whole or in part, without our express written permission. DWS SPECIFICALLY DISCLAIMS ALL LIABILITY FOR ANY DIRECT, INDIRECT, CONSEQUENTIAL OR OTHER LOSSES OR DAMAGES INCLUDING LOSS OF PROFITS INCURRED BY YOU OR ANY THIRD PARTY THAT MAY ARISE FROM ANY RELIANCE ON THIS DOCUMENT OR FOR THE RELIABILITY, ACCURACY, COMPLETENESS OR TIMELINESS THEREOF. Any reference to “DWS”, “Deutsche Asset Management” or “Deutsche AM” shall, unless otherwise required by the context, be understood as a reference to asset management activities conducted by DWS Group GmbH & Co. KGaA and/or any of its affiliates. Clients will be provided DWS products or services by one or more legal entities that will be identified to clients pursuant to the contracts, agreements, offering materials or other documentation relevant to such products or services. DWS’s infrastructure investment business is part of the Alternatives platform. In the U.S., DWS relates to the asset management activities of RREEF America L.L.C.; in Germany: DWS Grundbesitz GmbH, DWS Real Estate GmbH, and DWS Alternatives GmbH; in Japan: Deutsche Securities Inc. (For DSI, financial advisory (not investment advisory) and distribution services only); in Hong Kong: Deutsche Bank Aktiengesellschaft, Hong Kong Branch (for direct real estate business), and DWS investments Hong Kong Limited (for real estate securities business); in Singapore: DWS Investments Singapore Limited (Company Reg. No. 198701485N); in the United Kingdom: Deutsche Alternative Asset Management (UK) Limited, DWS Alternatives Global Limited and DWS Investments UK Limited; and in Denmark, Finland, Norway and Sweden: Deutsche Bank AG; in Australia: DWS Investments Australia Limited (ABN 52 074 599 401) an Australian financial services license holder. © 2018. All rights reserved. For investors in Nordics: Deutsche Bank AG is authorized under German banking law (competent authority: European Central Bank and the BaFin, Germany’s Federal Financial Supervisory Authority. Deutsche Bank Branches operates within the EEA on the back of the legal entity (Deutsche Bank AG) EU Passports within the European Economic Area (“EEA”). Reference is made to European Union Regulatory Background and Corporate and Regulatory Disclosures at https://www.db.com/company/en/risk-disclosures.htm. Details about the extent of our authorisation and regulation by BaFin are available from us on request." DBS is acting for and behalf of Deutsche Asset Management (UK) Ltd and if you decide to enter into a transaction with Deutsche Bank AG or one of its affiliates (“the principal”) will any and all contractual and commercial agreements be as entered into with that principal. This presentation is for information purposes only and is not intended to be an offer or an advice or recommendation or solicitation, or the basis for any contract to purchase or sell any security, or other instrument, or for Deutsche Bank to enter into or arrange any type of transaction as a consequence of any information contained herein. It has been prepared without consideration of the investment needs, objectives or financial circumstances of any investor. This document is not intended for and should not be relied upon by a retail client. This material has been deemed falling under the MIFID definition of marketing material as not presented as an objective or independent piece of research in accordance with Article 24 section 1.a (Article 19.2 in directive 2014/65/EU) of implementation directive

European Infrastructure Strategic Outlook January 2019
40
2014/65/EU as enacted into Swedish laws and regulations, inter alia Värdepappersmarknadslagen (2007:528), Lagen (1991:980) om handel med finansiella instrument and Chapter 11, Sections 8-9, of regulation FFFS 2007:16, as amended. The views set out in this presentation are those of the author and may not necessarily reflect the views of any other persons or division within Deutsche Bank, including the Sales and Trading functions of the Corporate and Investment Bank: services provided by the Sales and Trading functions of the Corporate and Investment Bank are purely on a non-advised, execution-only basis. For Investors in Belgium: The information contained herein is only intended for and must only be distributed to institutional and/or professional investors (as defined in the Belgian law of 2 August 2002 on the supervision of the financial sector and the financial services). In reviewing this presentation you confirm that you are such an institutional or professional investor. When making an investment decision, potential investors should rely solely on the final documentation (including the prospectus) relating to the investment or service and not the information contained herein. The investments or services mentioned herein may not be adequate or appropriate for all investors and before entering into any transaction you should take steps to ensure that you fully understand the transaction and have made an independent assessment of the suitability or appropriateness of the transaction in the light of your own objectives and circumstances, including the possible risks and benefits of entering into such transaction. You should also consider seeking advice from your own advisers in making this assessment. If you decide to enter into a transaction with us you do so in reliance on your own judgment. For investors in Bermuda: This is not an offering of securities or interests in any product. Such securities may be offered or sold in Bermuda only in compliance with the provisions of the Investment Business Act of 2003 of Bermuda which regulates the sale of securities in Bermuda. Additionally, non-Bermudian persons (including companies) may not carry on or engage in any trade or business in Bermuda unless such persons are permitted to do so under applicable Bermuda legislation.
© 2018 DWS Group GmbH & Co. KGaA. All rights reserved. I-063282_1.0 (01/2019)

European Infrastructure Strategic Outlook January 2019
41
Research & Strategy—Alternatives
OFFICE LOCATIONS: TEAM:
Chicago 222 South Riverside Plaza 26th Floor Chicago IL 60606-1901 United States Tel: +1 312 537 7000 Frankfurt Taunusanlage 12 60325 Frankfurt am Main Germany Tel: +49 69 71909 0 London Winchester House 1 Great Winchester Street London EC2N 2DB United Kingdom Tel: +44 20 754 58000 New York 345 Park Avenue 26th Floor New York NY 10154-0102 United States Tel: +1 212 454 6260 San Francisco 101 California Street 24th Floor San Francisco CA 94111 United States Tel: +1 415 781 3300 Singapore One Raffles Quay South Tower 20th Floor Singapore 048583 Tel: +65 6538 7011 Tokyo Sanno Park Tower 2-11-1 Nagata-cho Chiyoda-Ku 18th Floor Tokyo Japan Tel: +81 3 5156 6000
Global
Mark Roberts Head of Research & Strategy [email protected]
Jessica Elengical Head of ESG Strategy [email protected]
Gianluca Minella Infrastructure Research [email protected]
Yasmine Kamaruddin Global Strategy [email protected]
Americas
Kevin White Head of Strategy, Americas [email protected] Ross Adams Industrial Research [email protected] Ana Leon Retail Research [email protected] Ryan DeFeo Property Market Research [email protected]
Brooks Wells Head of Research, Americas [email protected] Liliana Diaconu Office Research [email protected] Michael Kodesch Capital Markets Research [email protected] Joseph Pecora Apartment Research [email protected]
Europe
Matthias Naumann Head of Strategy, Europe [email protected] Tom Francis Property Market Research [email protected] Farhaz Miah Property Market Research [email protected]
Simon Wallace Head of Research, Europe [email protected] Martin Lippmann Property Market Research [email protected] Aizhan Meldebek Infrastructure Research [email protected]
Asia Pacific
Koichiro Obu Head of Research & Strategy, Asia Pacific [email protected] Seng-Hong Teng Property Market Research [email protected]
Natasha Lee Property Market Research [email protected] Hyunwoo Kim Property Market Research [email protected]

The brand DWS represents DWS Group GmbH & Co. KGaA and any of its subsidiaries, such as DWS
Distributors, Inc., which offers investment products, or Deutsche Investment Management Americas Inc.
and RREEF America L.L.C., which offer advisory services.
DWS Distributors, Inc.
222 South Riverside Plaza Chicago, IL 60606-5808
www.dws.com [email protected]
Tel (800) 621-1148
© 2018 DWS Group GmbH & Co. KGaA. All rights reserved. PM16XXXX (00/16) R-XXXXX-X CODE